NASA Technical Memorandum 107292
/ic, -_ 5
Test Procedures for Characterizing, Evaluating,and Managing Separator Materials Used in
Secondary Alkaline Batteries
Edwin Guasp
NYMA, Inc.
Brook Park, Ohio
and
Michelle A. Manzo
Lewis Research Center
Cleveland, Ohio
May 1997
National Aeronautics and
Space Administration
https://ntrs.nasa.gov/search.jsp?R=19970024869 2018-06-16T06:56:32+00:00Z

Trade names or manufacturers' names are used in this report for identification
only. This usage does not constitute an official endorsement, either expressed
or implied, by the National Aeronautics and Space Administration.

PREFACE
Secondary alkaline battery technologies, such as nickel-cadmium (Ni/Cd), nickel-hydrogen (Ni/I-12), and silver-
zinc (Ag/Zn), are vital to aerospace applications. The separators used in these battery technologies play an important
role in the cycle life of the cells and in their performance. Separators must be good electrical insulators and efficient
electrolyte reservoirs. This manual presents a series of test procedures that can be used to evaluate and select separa-
tor materials for these battery technologies.
In the early 1970' s, NASA selected General Electric (GE)* as the only producer of the NASA standard Ni/Cd
cell. The separator material used in the NASA standard Ni/Cd cell was a nonwoven nylon material known as Pelion2505. This material is 100% nylon 6, has an area weight of 60 g/m 2, and is treated with zinc chloride (ZnC12) to
bond the fibers. In the mid-1970's, the U.S. Environmental Protection Agency (EPA) began to regulate the release
of ZnC12 into the environment. In 1976, Freudenberg Nonwovens Inc., formally Pelion Corp., ceased production ofPelion 2505 for economic reasons resulting from the EPA regulations. As a result, the battery community was com-
pelled to find a replacement. The recommended replacement for Pelion 2505 was Pelion 2536, also known asFS 2536. This material is 33% nylon 6 and 67% nylon 66 with an area weight of 80 g/m 2. FS 2536 uses no ZnC12
but is heat treated to bond the fibers.
In the mid-1980' s, cells produced by Gates Aerospace Batteries, at the former GE facility in Gainesville,
Florida, exhibited problems attributed to the quality of the plates and separator materials. In 1988, a Gates Ni/Cd cell
mini-workshop was held at the Marshall Space Flight Center in Huntsville, Alabama, to address these problems. At
that workshop, a series of task force groups were formed to address the issues facing the aerospace battery industry.
The task force group on Ni/Cd separator acceptance and criteria recommended that standard procedures be estab-
lished for separator testing to ensure quality and consistency. A task was then funded as part of the NASA Aero-
space Flight Battery Systems Program, sponsored by NASA Headquarters Code Q, to design and develop test
procedures for characterizing, evaluating, and managing separator materials and to establish limits and criteria
for separator characteristics. The task was assigned to the NASA Lewis Research Center in Cleveland, Ohio. This
publication is the result of that effort.
ACKNOWLEDGMENTS
The screening methods outlined in references 1 and 2 served as guidelines for formulating the test procedures
included in this manual. We extend our appreciation to Gates Aerospace Batteries, Eagle Picher, The Aerospace
Corporation, Freudenberg Nonwovens Inc., and COMSAT for sharing their work, procedures, and experience in the
separator testing area. We recognize and thank NASA personnel involved in the enhancement of battery technologyfor their evaluations, comments, and feedback. Finally, we especially acknowledge the personnel of the Electro-
chemical Technology Branch of the Power Technology Division at the NASA Lewis Research Center in Cleveland,
Ohio, for sharing their expertise.
*In the early 1980's, Gates Energy Products purchased the GE battery facility in Gainesville, Florida. Then, in January1994, SAFTpurchased the aerospace portion of that operation, Gates Aerospace Batteries.
NASA TM-107292 iii

CONTENTS
Page
ListofIllustrations................................................................................................................................................vi
Introduction............................................................................................................................................................1
GuidelinesforStoring,Sampling,Handling,andDisposingofSeparatorMaterials............................................2
GeneralGuidelinesforAll Separators.....................................................................................................2
SpecificGuidelinesforHazardousMaterials..........................................................................................3
STP1---ThicknessandAreaWeightMeasurementProcedure..............................................................................4
STP2--ElectrolyteFill ProcedureforSeparatorMaterials...................................................................................6
STP3--DimensionalStabilityTestProcedure......................................................................................................8
STP4--ElectrolyteRetentionProcedures...........................................................................................................10
STP4A--ElectrolyteRetentioninUncompressedStatebyUsingStandardMethod...........................11
STP4B---ElectrolyteRetentioninCompressedStatebyUsingCompressionMachine......................13
STP5----Direct-CurrentResistivityTestProcedure.............................................................................................17
STP6--BubblePressureTestProcedure.............................................................................................................21
STP7--ProcedureforEvaluatingSeparatorMaterialsbyUsingScanningElectronMicroscopy.....................25
STP8--ProcedureforDeterminingSusceptibilityofSeparatorMaterialstoHydrolysis...................................27
STP9--ElectrochemicalOxidationTestProcedure............................................................................................30
STP10---ChemicalAnalysisTestProcedures.....................................................................................................34
STP10A InorganicChemicalAnalysis:AshandMetalContent.......................................................36
STP10B--InorganicChemicalAnalysis:AnionContent.....................................................................38
STP10C--OrganicChemicalAnalysis:InfraredTestToDetectOrganicContaminants....................42
STP10D---OrganicChemicalAnalysis:UltravioletLightTestToDetectContaminantFibers..........45
STP11--TensileStrengthTestProcedure...........................................................................................................47
STP12--MercuryPorosimetry/PoreSizeDistributionTest...............................................................................49
NASATM-107292 iv

Page
AppendixA---EvaluationFormforSeparatorMaterials.....................................................................................52
AppendixB---CharacterizationResultsforSelectedSeparatorMaterials...........................................................53
AppendixC--AdditionalTestProcedures...........................................................................................................55
STPC1--ElectrolyteRetentioninUncompressedStatebyUsingKubelkaJar...................................55
STPC2--ElectrolyteDistributionTestProcedure................................................................................57
AppendixD--Symbols........................................................................................................................................63
References............................................................................................................................................................66
NASATM-107292 v

LISTOFILLUSTRATIONS
Figure Page
1 Analyticalbalanceandthicknessmeasurementinstrument............................................................................4
2 Electrolytefill systemforcellcomponents....................................................................................................6
3 Cellfixtureformeasuringelectrolyteretentionincompressedstate...........................................................13
4 Compressionmachineandcellassemblyformeasuringelectrolyteretentionincompressedstate.............14
5 Direct-currentresistivitycelldiagramandwiring.........................................................................................18
6 Bubble pressure apparatus .............................................................................................................................. 21
7 Bubble pressure fixture ................................................................................................................................... 22
8 Scanning electron micrographs of Pellon 2505 .............................................................................................. 25
9 Effect of hydrolysis conditions on FS 2536 separator exposed to 31% KOH at 80 °C ................................. 28
10 Electrochemical oxidation test assembly ........................................................................................................ 31
11 Chemical analysis performed on separator materials ..................................................................................... 34
12 Ion-specific electrode setup ............................................................................................................................ 35
13 Ion-specific electrode calibration curves for CI-, NO3-, and CO3 -2 anions .................................................. 40
14 Representative infrared spectrum for FS 2538 separator ............................................................................... 43
15 Ultraviolet light test setup .............................................................................................................................. 45
16 Tensile strength test results ............................................................................................................................ 47
17 Schematic diagram of mercury porosimetry penetration instrument ............................................................. 49
18 Sample cell ..................................................................................................................................................... 50
19 Effect of pore diameter on incremental intrusion volume for Zircar separator material ................................ 51
20 Effect of pore diameter on incremental intrusion volume for selected separator materials ........................... 54
21 Kubelka jar ..................................................................................................................................................... 55
22 Cell assembly for determining electrolyte distribution .................................................................................. 58
23 Electrolyte distribution and percent saturation plots for three-component Ni/Cd cell with FS 2538
separator material .................................................... _..................................................................................... 61
NASA TM-107292 vi

TEST PROCEDURES FOR CHARACTERIZING, EVALUATING, AND MANAGING SEPARATORMATERIALS USED IN SECONDARY ALKALINE BATTERIES
Edwin GuaspNYMA, Inc.
Brook Park, Ohio
and
Michelle A. Manzo
National Aeronautics and Space AdministrationLewis Research Center
Cleveland, Ohio
INTRODUCTION
The separator test procedures (STP) presented in this manual result from a comprehensive gathering of informa-
tion, data, and test procedures acquired from throughout the aerospace battery industry. They can be used to evaluate
the suitability of new materials and to ensure the uniformity, consistency, and reproducibility of standard materials.
As a starting point, tests specified in references 1 and 2 were evaluated. Some of the tests served as a foundation for
the procedures included in this text. Others were not incorporated because of limited applicability.
The test procedures have been written to be generally applicable to materials used in alkaline cells. Procedures
specific to silver-zinc batteries are covered in reference 2. This manual presents the test procedures in a logical
sequence to facilitate the characterization of new materials and the evaluation of already established separators.Following the STP sequence can simplify the qualification process. The STP order was designed to allow earlyelimination of materials whose characteristics do not meet the requirements. General guidelines are provided to
ensure the proper handling and storage of materials. Each STP suggests a particular sampling frequency and sample
size; however, it is recommended that a specific sampling plan be designed to accommodate sample availability in
order to ensure that samples are representative of the source material.
Separator characteristics required for a specific cell design must first be identified. The testing and measurementof the characteristics then follows. A baseline must be established for materials to be incorporated into flight cells.
When establishing a baseline for a separator, multiple runs of the same material should be evaluated to ensure that
the material can be manufactured consistently. The determination of baseline characteristics should be supported
statistically. Separator characteristics should be within the ranges and limits established to ensure consistency and
quality.In order to have an approximate representation of cell conditions, the characterization tests should be performed
on samples filled with the same electrolyte composition and concentration used in the cell. For comparability, sepa-rator materials should be tested with a standard concentration of electrolyte. Some tests were designed to measure
characteristics in representative cell conditions. Where this was not possible, test results still provide consistent and
reliable information for evaluating the chemical and physical characteristics of the separators.
The test procedures examine such characteristics as uniformity, dimensional stability, electrolyte retention, area
resistivity, permeability to gases, resistance to chemical degradation (hydrolysis and/or electrochemical oxidation),
chemical purity, tensile strength, and pore size distribution. Completing these characterization tests is important to
identifying separator materials that have the desired properties necessary for long life and good performance in sec-
ondary alkaline cells.All test procedures are presented in a similar format. In the beginning of each procedure, a short introduction
covers the background, methodology, and relevance of the test. The introductory segment is followed by a reagents
and equipment section. Then, step-by-step instructions describe the test performance and technique. In general, acalculations section appears after the procedure. Calculations are followed by recommendations and/or criteria. In
some cases, specific criteria (ranges and limits) are given. Diagrams and/or graphs relating to the particular STP are
included in each procedure.
NASA TM-107292 1

Guidelines
Four appendixes are presented at the end of the manual. Appendix A contains an evaluation form used to sum-
marize test results and to compare experimental results with the baseline characteristics of the material. Appendix B
presents a table with characterization results for some of the materials commonly used in aerospace cells. Character-
ization results for separator materials FS 2536, FS 2538, Pelion 2505 from Freudenberg Nonwovens Inc., and
ZYK15 from Zircar Products are presented. Appendix C contains two additional test procedures that complement
the procedures presented in the manual. The first, electrolyte retention in uncompressed state using a Kubelka jar, is
an alternative procedure for determining electrolyte retention that is commonly used by Freudenberg Nonwovens.
The second is the electrolyte distribution test. This procedure evaluates the competition and distribution of electro-
lyte between cell components at different percent fill levels. It is a versatile test that provides information on area
density, thickness, and compressed and uncompressed electrolyte retention as well as information on the competi-
tion for electrolyte between cell components. Finally, appendix D lists and defines the symbols used in the manual
according to STP.
The tests presented in this manual are specific to the NASA Lewis Research Center and reflect equipment and
safety practices required. It is not the intention of this manual to regulate or to impose a certain technique, sample
size, and/or equipment for obtaining data on a particular separator property. This manual has been compiled to offer
interested battery scientists and technicians consistent, uniform, and reliable test procedures for characterizing and
evaluating candidate separator materials for a particular technology and application.
GUIDELINES FOR STORING, SAMPLING, HANDLING, AND DISPOSING OFSEPARATOR MATERIALS
Separator materials used in secondary alkaline batteries must be kept free from contaminants and kept out of an
environment that could initiate their decomposition. Different types of separator materials may require unique stor-
age and handling conditions and specific sampling and disposal methods. A storage and sampling plan is essential to
maintaining and monitoring the integrity of the materials. Sampling from various locations throughout the material
source is recommended to guarantee proper characterization.
The following guidelines address some of the most important issues to be considered when working with
separator materials. The proper storage, sampling, handling, and disposal of these materials are critical.Asbestos has been commonly used as a separator in secondary alkaline batteries. This class of material, with
inhalant fibers longer than 5.0 jam and a 3:1 aspect ratio, is considered hazardous. The proper handling of hazardous
materials is essential for health and safety. The use of asbestos is regulated by the U.S. Environmental Protection
Agency (EPA) and the U.S. Occupational Safety and Health Administration (OSHA). Because this material is
still used in aerospace battery technology, its use requires specific handling and disposal guidelines. Specific
instructions particular to storing, handling, and disposing of hazardous materials are also included in the
following guidelines.
General Guidelines for All Separators
1. Keep all equipment used to handle and test separator materials clean, properly labeled, and where applicable,
stored in sealed plastic bags.
2. Store separator materials in a controlled environment, at low temperature or room temperature, with low
humidity, in properly labeled and sealed polyethylene or polypropylene plastic bags unless otherwise specified bythe vendor.
3. Always avoid contact with hands by using disposable gloves or finger cots. Avoid stressing or elongating thematerial.
NASA TM-107292 2

Guidelines
4. Establish a consistent size and sampling pattern that addresses the material source available for testing. Pre-
pare samples by cutting to the desired size, preferably with an appropriate rule die. Once cut, always keep samples
in a clean, properly labeled, covered container.
5. Minimize exposure to air of samples wet with electrolyte by keeping them submerged in their respective cov-
ered containers.
6. Dispose of samples exposed to electrolyte properly, in labeled plastic bags placed in a trash container, unless
otherwise specified by OSHA regulations.
Specific Guidelines for Hazardous Materials
1. EPA and OSHA regulations for storing, handling, and disposing of hazardous materials must be followed.
For advice, refer to your local environmental, health, and safety personnel. (At the NASA Lewis Research Center,
guidelines and requirements for storing, handling, and disposing of hazardous materials are set by the Office of
Environmental Programs.)
2. NASA Lewis Research Center standard operational procedures state that anyone working with hazardous
materials must be properly trained and certified. A certified operators list must be posted and renewed with the
safety permit. Operators are required to become familiar with the particular material safety data sheet (MSDS)
concerning the material.
3. The following sign must be posted whenever any hazardous material is in use: DO NOT ENTER WITHOUTPROPER RESPIRATORY PROTECTION: HAZARDOUS MATERIAL IN USE.
4. Where practicable, all cutting operations should be performed under an exhaust hood.
5. The qualified operator must use proper protective equipment, such as a disposable laboratory coat, safety
glasses, disposable gloves, and a hood mask or respirator.
6. Any materials removed from the hood must be wet with electrolyte or water or placed in sealed containers to
avoid the spread of airborne fibers in the laboratory.
7. All utensils and equipment exposed to hazardous materials should be cleaned with a damp cloth or paper
towel. Include mask hood and safety glasses in the cleaning process.
8. All hazardous materials, scraps, gloves, damp cloths or paper towels, or any other materials contaminated
with a hazardous material must be placed in sealed plastic bags under the hood and then disposed of in a properly
labeled and sealed container.
9. The room and all personnel must be regularly monitored for the presence of airborne hazardous fibers.
NASA TM-107292 3

STP 1
STP 1--THICKNESS AND AREA WEIGHT MEASUREMENT PROCEDURE
Thickness and area weight measurements provide a means of evaluating the uniformity and consistency of sepa-
rator materials. These measurements are performed in almost every procedure presented in this text. Area weight is
the ratio of the sample weight to the sample area. Thickness measurements are specific to the type of instrument
used. An instrument with a constant and uniform load is required for reliable and reproducible measurements.
Thickness measurements are commonly obtained and reported in the dry state because readings taken in the wetstate can be unreliable as some materials tend to swell when wet.
I. Equipment:
1. TMI Electronic Micrometer Model 49-70 (fig. 1)--a precision thickness-measuring instrument with digital
readout, wide flexibility, and a motor suitable for continuous operation. Maximum thickness capability is 1.27 mm
(50.0 mils).
2. Ohaus Analytical Balance Model GAll0 (fig. 1) with a sensitivity of 0.0001 g.
Figure 1.mAnalytical balance and thickness measurement instrument.
NASA TM-107292 4

STP 1
II. Procedure:
1. Warm up and calibrate instruments.
2. Draw a piece of nonabrasive paper or cloth through the TMI anvils. This will ordinarily pick up and remove
any foreign matter.
3. Cut samples to the appropriate size for the particular separator test procedure to be performed. For area
weight and thickness measurements, cut two samples, 10 cm by 10 cm (4 in. by 4 in.).
4. Weigh each sample and record data.
5. Measure sample thickness with the TMI. Take between 6 and 10 thickness readings at different locations.
Repeat step 2 if necessary.
III. Calculations:
1. Average the thickness readings to obtain an accurate thickness measurement T in millimeters.
2. In order to calculate area weight AW, divide each sample dry weight W d by its area as follows:
where
T
AW
waA
AW = WdlA
average sample thickness, mm
area weight, g/m 2
dry weight of sample, g
sample area, m 2
NASA TM-107292
-,. ;- , ;' - . 7

STP 2
STP 2---ELECTROLYTE FILL PROCEDURE FOR SEPARATOR MATERIALS
Cell performance depends on the properties that the separator materials have when wet with electrolyte. Most
test procedures included in this manual require wet samples. It is essential that separators be filled with electrolyte
solution to a 100% fill level, the saturation point when all pores are filled with electrolyte, to ensure consistent
evaluation of their properties. In order to achieve 100% fill, samples are evacuated and back_filled with electrolyte.
This procedure outlines a standard technique of ensuring 100% fill of separator materials and/or cell components.
Handling materials once 100% fill is achieved is discussed as part of the subsequent STP' s.
I. Equipment and reagents:
1. 100 to 200 ml of electrolyte solution
2. Electrolyte fill system (fig. 2)
a. Vacuum pump (minimum absolute pressure of 1.9 bars)b. 250-ml beaker for electrolyte reservoir
c. Vacuum trapd. 250-ml, wide-mouth flask fitted with stopper and tubing
e. Three-way stopcock valve
f. Tubing to make the necessary connections
3. Vertical sample holder (fig. 2)
Tovacuum
trap
,
.............ii............Wide-mouthflask
EleRcetrSoe lytrv eOir _-_
Figure 2.mElectrolyte fill system for cell components.
_- Vertical sampleholder
To_- vacuum
pump
NASA TM-107292

STP 2
II. Procedure:
1. Assemble electrolyte fill system according to figure 2.
2. Place cell component (or components) in the vertical sample holder inside the wide-mouth flask. Close the
wide-mouth flask with its corresponding stopper.
3. Pour sufficient electrolyte to cover the components into the beaker serving as the electrolyte reservoir.
4. Evacuate the wide-mouth flask containing the samples for 3 to 5 min.
5. Slowly position the three-way stopcock valve to allow electrolyte to flow from the reservoir into the wide-mouth flask.
6. Reposition the stopcock valve and evacuate the wide-mouth flask for 10 to 15 min. The electrolyte will boil
as the pressure is reduced.
7. Vent the wide-mouth flask to atmospheric pressure and proceed with the corresponding test procedure.
NASA TM-107292 7

STP 3
STP 3.---DIMENSIONAL STABILITY TEST PROCEDURE
Dimensional stability in separator materials is required for good cell performance. Changes in the separator
dimensions, as a result of exposure to the electrolyte, can result in various cell failure mechanisms. A separator that
swells when exposed to electrolyte can cause increased pressure within the cell pack. A separator that shrinks is
likely to tear and/or crack and expose the plates to the possibility of a short circuit.A dimensional stability test is one of the oldest and simplest tests for evaluating separators. This procedure
employs the direct measurement of the length and width of a sample in the dry state and then in the wet state to
determine dimensional changes. Measurements are taken after 10 days of exposure.
I. Equipment and reagents:
1. Analytical balance2. TMI Electronic Micrometer Model 49-70
3. Plastic ruler
4. 30-ml-capacity, wide-mouth Teflon vial with lid
5. Electrolyte solution
II. Procedure:
1. Cut three samples, approximately 9 cm 2 (1.4 in.2), and label them.
2. Measure the dimensions, length and width, of the samples (l d and Wd).
3. Weigh all samples and measure their thickness (refer to STP 1).
**NOTE**
Dry weight and thickness measurements are taken for information only.
4. Place the three samples and 25 ml of electrolyte in the vial, cap it, and store it at room temperature.
5. Retrieve the samples after 10 days. Measure and record the dimensions of each wet sample (1w and Ww).
III. Calculations:
1. Determine the percentage of dimensional change (D l and Dw) in the length and width of each sample by us-
ing the following equations:
D l = 100 × lw - Idld
ww -- WdD w = IOOx--
Wd
NASA TM-107292 8

STP 3
where
D l change in length, percent
1w length of sample in wet state, cm
ld length of sample in dry state, cm
D w change in width, percent
w w width of sample in wet state, cm
w d width of sample in dry state, cm
2. Average and report the percentage of dimensional change (D l and Dw) for the sample materials.
IV. Recommendation:
Typically, dimensional changes should not exceed 1% per sample material.
NASA TM-107292 9

STP 4
STP 4---ELECTROLYTE RETENTION PROCEDURES
Electrolyte retention is a valuable parameter for evaluating separator materials used in secondary alkaline sys-
tems. Electrolyte retention is defined as the amount of electrolyte retained as a percentage of the dry weight of the
sample. The separator must retain enough electrolyte to sustain the electrochemical reactions in the cell under a vari-
ety of conditions.Three procedures are presented for determining electrolyte retention. One procedure is used to measure electro-
lyte retention in the uncompressed state, and two are used to measure electrolyte retention in the compressed state.
The most widely used procedure, for electrolyte retention in the uncompressed state, involves evacuating air from
dry samples, backfilling them with electrolyte, and determining the amount of electrolyte retained.
Although electrolyte retention is most commonly measured in the uncompressed state, measurements made in
the compressed state are more representative of cell conditions and thus provide a more realistic measurement of
this property. Two procedures for measuring electrolyte retention in the compressed state are presented. In both
approaches, samples filled to the 100% fill level are compressed to a predetermined thickness. The thickness of the
compressed sample is controlled by incorporating shims of a specified thickness, generally representing the inter-
electrode spacing. The first procedure uses a fixture designed for determining electrolyte retention in the compressed
state. In the second procedure, the separator is compressed between nickel and cadmium plates representing an
actual cell assembly.
NASA TM-107292 10

STP 4AmElectrolyte Retention in Uncompressed State
by Using Standard Method
STP4A
I. Equipment and reagents:
1. Electrolyte fill system (fig. 2)
2. Analytical balance3. Tweezers
4. Filter paper
5. Electrolyte solution6. TMI electronic micrometer
II. Procedure:
1. Cut four samples, 2.9 cm by 2.9 cm (1.2 in. by 1.2 in.), and label them.
2. Determine the dry weight W d and thickness of the samples according to STP 1.
**NOTE**
Thickness measurements are taken for information only.
3. Fill separator samples with electrolyte as described in STP 2.
4. Remove each sample from electrolyte and suspend it vertically for 1 min. Touch the tip of the sample to the
surface of a piece of filter paper five times to remove excess electrolyte.
5. Weigh the wet sample (Ww) and record data.
III. Calculations:
Determine electrolyte retention in the uncompressed state by using the following equations:
ER = 100 x Ww - WdWd
(Ww-Wd)/pER A -
A
where
ER
WwWdER APA
electrolyte retention in uncompressed state, percent
wet weight of sample, g
dry weight of sample, gelectrolyte retention per sample area in uncompressed state, cm3/cm 2
electrolyte density, g/cm 3
sample area, cm 2
NASA TM-107292 11
STP4A
IV. Recommendations:
1. Electrolyte retention in the uncompressed state can be used to evaluate consistency between separators. It
provides a measurement of the affinity of a material for the electrolyte. Generally, the higher the electrolyte reten-tion, the better the separator. This procedure measures electrolyte retention for materials in the free state; therefore,
it does not reflect cell conditions. Electrolyte retention rankings between materials can change when measurements
are taken in the compressed state.
2. Electrolyte retention results are reported as a percentage of the dry weight and as the amount of electrolyte
retained per unit area of the material ER A. The latter is a more useful value when comparing materials because it
gives a direct measurement of the amount of electrolyte retained in the sample.
NASA TM-107292 12

STP 4B--Electrolyte Retention in Compressed State
by Using Compression Machine
STP 4B
I. Equipment and reagents:
1. Electrolyte fill system (fig. 2)2. Cell fixture for measuring electrolyte retention in the compressed state (fig. 3)
3. Analytical balance4. Tweezers
5. Filter paper6. Compression machine (fig. 4) or alternative fixture for compressing cell assembly
7. Feeler gauge
8. Electrolyte solution9. TMI electronic micrometer
Shim
'T"III...3
I-7IIII
_./_
(a)
2.9_cm --_,]_
(b)
(c) p_::_::_ _::= Separator
Shim
Figure 3.--Cell fixture for measuring electrolyte retention in compressed state. (a) Stainless steel plate.
(b) Cell assembly. (e) Shim.
NASA TM-107292 13

STP 4B
Figure 4.mCompression machine and cell assembly formeasuring electrolyte retention in compressed state.
II. Procedure:
1. Cut four samples, 2.9 cm by 2.9 cm (1.2 in. by 1.2 in.), and label them. The sample size corresponds to the
area compressed by the cell fixture.
2. Determine the dry weight W d and thickness of the samples according to STP 1.
**NOTE**
Thickness measurements are taken for information only.
NASA TM-107292 14

STP 4B
3. Fill separator samples with electrolyte as described in STP 2.
4. Remove each sample from electrolyte and suspend it vertically for I min. Touch the tip of the sample to the
surface of a piece of filter paper five times to remove excess electrolyte.
**NOTE**
Weighing the samples at this point will enable the determination of electrolyte retention in the
uncompressed state.
5. Center the sample on the bottom plate of the fixture (fig. 3). Select a shim of appropriate thickness, generally
representative of the interelectrode spacing, and place it around the sample. The standard procedure is to use 0.25-,
0.19-, and 0.15-mm (10.0-, 7.5-, and 6.0-mil) shims successively. Always go from the thickest to the thinnest shim
when testing at different shim sizes.
6. Compress the wet sample to the desired thickness. Use a feeler gauge to verify the sample thickness.
7. Keep material compressed for 5 min.
8. Decompress sample as quickly as possible. Remove the sample from the cell fixture, reweigh (Wth), and
record data.
9. Wipe excess electrolyte from the cell fixture. Change to the next smaller shim size and repeat steps 4 to 9.
III. Calculations:
Determine electrolyte retention for the material compressed to a specific thickness ERth and electrolyte reten-
tion for the material compressed at a specific thickness per sample area ERth, A by using the following equations:
w -waERth = 100 x --
wd
ERth,A = 100 × (Wth - Wd ) / PA
where
ERth
WdERth, APA
electrolyte retention at specified thickness, percent
wet weight of sample at specified thickness, g
dry weight of sample, gelectrolyte retention at specified thickness per sample area, cm3/cm 2
electrolyte density, g/cm 3
sample area, cm 2
NASA TM-107292 15

STP 4B
TABLE L--ELECTROLYTE RETENTION IN
COMPRESSED STATE
Separator
FS2536, lot 13A
FS2438, lot 2C
Pelion 2505 (Gates)
ZYK15, lot W631
ERth, A_
cm3/cm 2
0.014
0.014
0.017
0.020
ER_,
percent
240
260
360
120
IV. Recommendations and criteria:
1. Electrolyte retention in the compressed state offers a more reliable measurement of the amount of electrolyte
retained when a separator material is compressed to a representative interelectrode spacing. Generally, the higher
the amount of electrolyte a separator can hold, the lower the probability of going dry during cycling. Give special
attention to electrolyte retention values in the compressed state.
2. Typically, separator materials retain a minimum of 0.012 cm 3 of electrolyte per square centimeter of sample
when compressed to 7.5 mils.
3. Results are reported as the electrolyte volume retained at a specified thickness per unit area of the material
ERth,t and as the percentage of the dry weight or electrolyte retention at a specified thickness ERth. When compar-
ing materials, ERth¢_ is a more functional value because it is a direct measurement of the amount of electrolyte re-
tained in the samples. As shown in table I, Zircar ZYK15 has an ERth value half that for the nylon materials; yet it
has a higher ERth :, indicating the presence of more electrolyte in the Zircar than in the nylon materials.
NASA TM-107292 16

STP 5
STP 5--DIRECT-CURRENT RESISTIVITY TEST PROCEDURE
Separators have two basic functions: to isolate the electrodes, and thus prevent electrical shorts, and to provide
an electrolyte reservoir for ionic conductivity between the electrodes. It is this last function that involves the resis-
tivity of the wet separator. Because of their porosity and ability to be permeated by the electrolyte, separators pro-
vide ionic conductivity in the same way as the electrolyte.
Resistivity measurements in wet separators are valuable indicators of the performance of separators in func-
tional cells. They provide a means for determining the expected voltage drop, or IR, associated with a separator
material. This test procedure employs a direct-current (DC) method to measure the ionic resistivity of the separator
in the fully flooded, uncompressed state. A 50-mA current is passed through the separator and the voltage drop
across the sample is measured with two reference electrodes. The lower the voltage drop across the sample, the
lower the resistivity and the better the voltage performance of the cell.
I. Equipment and reagents:
1. DC power supply
2. Two voltmeters (one must be high impedance)
3. Resistivity cell (fig. 5)
4. Two reference electrodes (Ag/AgC1) Prepare reference electrodes by submerging two 7.6-cm-long
(3.0-in.-long) silver (Ag) wires in aqua regia solution for 1 min. (Other reference electrodes can be used.)
5. Two partially charged NiOOH/Ni(OH) 2 working electrodes--Partial charge is needed to avoid gasevolution.
6. Aqua regia--three parts concentrated HC1 to one part concentrated HNO 3
7. TMI electronic micrometer
8. Electrolyte fill system (fig. 2)
9. Electrolyte solution
10. One 100-f_ resistor
II. Procedure:
1. Cut two samples, 2.5 cm by 2.5 cm (1.0 in. by 1.0 in.).
2. Measure and record thickness according to STP 1.
3. Fill separator samples with electrolyte as described in STP 2.
4. Insert reference electrode wires through the wells in the top of the cell fixture and into the electrolyte capri-
lary channels. Connect the wire ends to the stainless steel bolts located on the top of the resistivity Cell (fig. 5).
NASA TM-107292 17

STP 5
(a)
Separator
r" ii
r
!i]i]iTiiiiii
il;iiiiiii;ii
Capillarychannel
+ll-DC power supply
Reference electrode
Reference electrode
stainless steel bolt
100-ohm
resistor
Stainless steel bolt
with wing nut
Working electrode
I"1'
O_-'1IIIIIIII
0 I
(b)
_ m -./_ _.-m O
Figure 5.reDirect-current resistivity cell diagram and wiring. (a) Cell front view. (b) Cell endview.
NASA TM-107292 18

STP 5
5. Assemble the resistivity cell without a separator sample to obtain a blank reading. Make sure that the center
holes are lined up.
6. Fill resistivity cell chambers with electrolyte and avoid air bubbles inside the cross channel and the
capillaries.
7. Connect the leads from the DC power supply to the working electrodes, and connect the leads from the
high-impedance voltmeter to the reference electrodes.
8. Connect the voltmeter across the 100-f_ resistor placed in series with the power supply. Adjust the power
supply so that the current through the circuit is 0.05 A. A 5.0-V reading on the voltmeter means that a 0.05-A cur-
rent is flowing in the cell.
9. Record the voltage drop reading. Obtain three additional readings as follows: (1) reverse the current flow,
(2) reverse the polarity to the reference electrodes, and (3) reverse the current flow again. (Typical values are 60 to
100 mV for the blank (Eb). Unstable voltage readings may indicate the need to recondition the reference electrodesor to partially charge the working electrodes.)
10. Disconnect the wires. Remove the electrolyte from the resistivity cell, and save it for use with the samples
to be tested.
11. Disassemble the cell and place the wet sample in the center of the resistivity cell so that it is centered over
the cross-channel opening (fig. 5).
12. Assemble the cell fixture and repeat steps 6 to 11.
13. Repeat the blank measurements after all samples have been tested.
III. Calculations:
1. Calculate the average voltage drop for the blank E b by using measurements from before and after sample
testing.
2. Average the experimental voltage drop readings for each sample E e.
3. Calculate the voltage drop across the sample E s by subtracting the voltage drop for the blank using
E s =Ee-E b
where
eevoltage drop across sample, V
average experimental voltage drop with separator sample, V
average voltage drop for blank, V
4. Determine the resistance R and the area resistivity AR for the sample by using the following equations:
R= es/0.05a
AR = RA e
NASA TM-107292 19

STP 5
where
R
E
A
A e
resistance across separator sample,
voltage drop across sample, Varea resistivity, f_-cm 2
area of separator exposed (0.95 cm 2 depending upon fixture design), cm 2
IV. Criteria:
Area resistivity values should be less than 0.1 _-cm 2.
NASA TM-107292 20
, :7, "¸

STP 6
STP 6--BUBBLE PRESSURE TEST PROCEDURE
Gases are routinely generated during normal operation of alkaline electrochemical cells. For cells to have long
life and efficient operation, cell design and separator selection must accommodate the gases produced during
cycling. At the end of charge and during overcharge of Ni/Cd cells, oxygen is normally evolved at the nickel elec-trode. In order to accommodate the oxygen generated, some cell designs require that the separator be sufficiently
permeable to gas to allow oxygen to migrate to, and recombine at, the negative plate. The bubble pressure test indi-
cates how permeable separator materials are to gases.
The apparatus used to determine bubble pressure consists of a gas regulator valve, a pressure gauge, and a fix-
ture that distributes the gas evenly across the face of the sample (fig. 6). Air is introduced into the bottom plate of
the fixture and pressure is gradually increased until a continuous flow of bubbles is observed through the separator
into the water chamber (fig. 7). Bubble pressure is defined as the differential pressure required to generate a constant
air bubble flux across the separator. The test is designed to identify the largest pore in a sample. Low bubble pres-
sure indicates the presence of large pores (high permeability); high bubble pressure indicates the absence of large
pores (low permeability). Because separator materials are susceptible to defects, the testing of multiple samples isrecommended to ensure that experimental measurements are not the result of flaws or damaged samples.
Figure 6.--Bubble pressure apparatus.
NASA TM-107292 21

STP 6
I
i!iiiiiiii i _i_i i] i!ii_!i_iii!i iii_!ii iii_i !
i ! i
_ --_._/f_,_ .................
(a)
v
Airflow
Porous Ni plaque
Stainless steel
Plexiglas
O-ring seal
Water chamber
Airflow perforations
Separator sample
Screen
(b)
(c) (d)
Figure 7.mBubble pressure fixture. (a) Cross-section view. (b) Bottom plate. (c) Top view ofupper plate. (d) Bottom view of upper plate.
NASA TM-107292 22
STP 6
I. Equipment and reagents:
1. Analytical balance2. TMI electronic micrometer
3. Bubble pressure apparatus (figs. 6 and 7)
4. Electrolyte solution
5. Deionized H20
II. Procedure:
1. Cut four separator samples 6.4 cm by 6.4 cm (2.5 in. by 2.5 in.).
2. Measure and record the thickness of the samples as in STP 1.
3. Weigh and record the dry weight for each sample Wd.
**NOTE**
Dry weight and thickness measurements are taken only for information.
4. Fill the separator samples with electrolyte as described in STP 2.
5. Make sure the air regulator valve on the test fixture is closed. Place the wet sample on top of the porous
nickel plaque on the stainless steel bottom plate. Assemble the apparatus as in figure 6.
6. Fill the recessed cavity with deionized water.
7. Record the initial pressure Pi"
8. Slowly open the air regulator valve and increase the air pressure on the sample until a steady flux of bubbles
is observed. The pressure at which a steady flux of bubbles is observed is called the final pressure.
9. Record the final pressure Pf.
10. In order to verify that the previous recording is representative, and not the result of a flaw in the sample,
slowly increase the air pressure to confirm that a uniform flux of bubbles is observed over the area of the sample
with a minimum increase in pressure.
11. Close the valve, disassemble the fixture, and repeat steps 5 to 9 with the next sample.
III. Calculations:
1. Determine the bubble pressure P on the samples by using the following equation:
where
P bubble pressure, psi
Pf final pressure, psiei initial pressure, psi
P=Pf-Pi
NASA TM-107292 23

STP 6
2. Calculate the average of P values for the four samples.
IV. Recommendations and criteria:
Cell design dictates the degree of permeability to gases needed in a separator. For example, some Ni/Cd cell
designs require separators with high permeability to gases. Typical bubble pressure values of separators used in such
Ni/Cd cells are under 2.0 psi. In contrast, some Ni/I-I 2 cell designs require separators with low permeability to gases.
The asbestos separator material used in such Ni/H 2 cell designs has a bubble pressure higher than 30 psi.
NASA TM-107292 24

STP 7
STP 7--PROCEDURE FOR EVALUATING SEPARATOR MATERIALS BY USING
SCANNING ELECTRON MICROSCOPY
Scanning electron microscopy (SEM) is used to investigate the morphology of separator materials. It is routinelyused to establish the baseline characteristics of separators and then to screen subsequent samples of the same mate-
rial for consistency and uniformity. For example, the baseline characteristics established for nylon separators includesolid fiber clusters and smooth fiber surfaces with solid bonds between the fibers. Cracks, holes, irregularities in the
structure, and detachment at the bond sites are unwanted characteristics, not exhibited by the baseline (fig. 8).
Two types of micrographs, surface and cross section, are taken to characterize separator materials and to screen
for consistency and uniformity. Micrographs are taken at specific magnifications to allow for direct comparison of
the sample with the baseline. SEM surface micrographs at low magnifications, 20X to 100X, are used to evaluate the
structure and overall uniformity of the sample. Micrographs at high magnifications, 200X to 5000X, are used to
investigate irregularities observed at lower magnifications and to screen for the quality of the material's constituents
and for the presence of contaminants. Cross-section micrographs, taken at a magnification of 500X, are used to inves-
tigate the size and shape of the constituents and to evaluate for consistency and uniformity.
Figure 8._Scanning electron micrographs of Pelion 2505. Surface micrographs (a) and (b) at low and highmagnifications representing baseline for Pelion 2505; (c) and (d) undesirable characteristics of Pelion 2505.
NASA TM-107292 25

STP7
I. Equipment and reagents:
1. Cambridge Scanning Electron Microscope Model 200
2. Nikon Epiphot Microscope with Sony UP 300 Photoprinter
3. Polaron Sputter Coater/SEM Unit E5100 with metal coating rings or equivalent
II. Procedure:
1. Cut and label the samples, according to your sampling plan, to fit the SEM mount for surface micrographs
and the epoxy mount for cross-section micrographs.
2. For the surface micrographs, coat the samples with a metal layer by using the sputter coater.
3. Take surface micrographs with the SEM at the following magnifications: 20X, 50X, 100X, 200X, 500X,
1000X, 2000X, and 5000X.
4. For cross-section micrographs, mount the samples vertically in epoxy. Allow the epoxy to cure and polishthe surface.
5. Coat the polished surface of the epoxy mount with a metal layer by using the sputter coater.
6. Take cross-section micrographs with the SEM at 500X. If difficulties are experienced in focusing the SEM,
remove the metal coating and use a Nikon Epiphot Microscope at 500X magnification to take the cross-section
micrographs.
7. Compare the micrographs and record any inconsistencies and/or variations between the baseline sample and
the sample under investigation.
IlL Recommendations and criteria:
1. Low magnifications (20X to 100X) are used to establish the general characteristics of the material. Uni-
formity and homogeneity are always desirable characteristics. Wherever possible, the sample should be comparedwith a baseline. The presence of any characteristics not exhibited by the baseline is cause for further investigation.
At low magnifications, the fiber matrix of nonwoven nylon separators should look packed and solid. Signs of loose-
ness and noncompacted fibers can indicate manufacturing irregularities and/or chemical degradation.
2. High magnifications (200X to 2000X) are used to establish the physical characteristics of the constituents.
Wherever possible, the sample should be compared with a baseline. The presence of any characteristics not exhib-
ited by the baseline is cause for further investigation. At high magnifications, nonwoven nylon materials shouldshow fibers that look smooth, uniform, and solid. Similarly, the joints and bonds between fibers should look solid,
withotit cracks or holes. The presence of cracks, holes, and/or irregularities on the surface and/or joints of nylon
fibers can indicate chemical degradation.
NASA TM-107292 26

STP 8
STP 8---PROCEDURE FOR DETERMINING SUSCEPTIBILITY OFSEPARATOR MATERIALS TO HYDROLYSIS
Stability in alkaline environments is a desirable property for separator materials used in alkaline cells. However,
under certain conditions, the nylon materials commonly used in Ni/Cd cells are susceptible to hydrolysis and decom-
position. Studies on the susceptibility of nylon to hydrolysis have shown that degradation occurs during cell storage
and cycling and that temperature and oxygen generation play important roles in the degradation (ref. 3). Reaction
products from hydrolysis undergo oxidation, which ultimately results in carbonate formation. As carbonate forms,
electrolyte concentration and cell voltage decrease, cadmium migration increases, and the overcharge protection is
reduced. Consequently, cell performance decreases, possibly producing cell failure.
This test procedure uses weight loss and examination with scanning electron microscopy (SEM) to evaluate the
susceptibility of separator samples to hydrolysis. Samples are exposed to the electrolyte solution for 20 days at
80 °C with sampling at 5-day intervals. Weight loss data and SEM micrographs are taken and compared with thebaseline established for the material. At low magnifications, 20X through 100X, SEM micrographs of the samples
that have undergone degradation typically show less integrity. Micrographs of these same samples, taken at high
magnifications, 200X through 5000X, show degradation signs at the fiber level that are evident as cracks and the
rippling of the fiber surface (fig. 9).
I. Equipment and reagents:
1. Oven
2. Twelve wide-mouth Teflon vials with 30-ml capacity
3. Analytical balance4. TMI electronic micrometer
5. pH paper (0-14)6. Desiccator
7. Electrolyte solution
8. 50-ml graduated cylinder
9. Deionized H20
II. Procedure:
1. Establish the baseline characteristics of the material by using SEM according to STP 7.
2. Cut and label 12 samples per material (3.0 cm by 3.0 cm; 1.2 in. by 1.2 in.).
3. Measure and record the thickness and dry weight Wd of each sample according to STP 1.
**NOTE**
Thickness measurements are taken only for information.
4. Place each sample in a properly labeled, 30-ml-capacity, wide-mouth Teflon vial with 25 ml of electrolyte
solution. Cap vials tightly and place them in an oven at 80 °C.
Perform steps 5 to 9 at 5-day intervals over a 20-day period.
NASA TM-107292 27

STP 8
Figure 9.--Effect of hydrolysis conditions on FS 2536 separator exposed to 31% KOH at 80 °C. These micro-graphs illustrate the progressiveness of the degradation process in nylon 2536 as a function of exposure time.(a) No exposure. (b) After 5 days. (c) After 10 days. (d) After 15 days. (e) After 20 days.
5. Remove three vials from the oven. Wash and dry each sample as follows:
a. Rinse with 70 °C electrolyte solution.
b. Rinse with deionized H20 until the pH is 7.0 or below.c. Place in a 40 °C oven for 3 hr.
d. Remove from the oven and place in a desiccator overnight.
6. Weigh (Wx) and record data for each sample.
NASA TM-107292 28

STP 8
7. Record any physical differences from initial conditions.
8. Select the sample showing the greatest degradation (i.e., the highest weight loss) and characterize with SEM
according to STP 7.
9. Compare SEM micrographs with those of the baseline for the sample and note any differences.
III. Calculations:
1. Calculate the percent weight loss due to hydrolysis r_/L H for each sample after 5, 10, 15, and 20 days of
electrolyte exposure by using the following equation:
'WE H = 100 x(w.-Wx)
Wdwhere
Wg H weight loss due to hydrolysis, percent
dry weight of sample, g
hydrolysis weight of sample, g
2. Average the _VL H values for the three samples at each five-day interval.
IV. Recommendations and criteria:
1. Exposure for 10 days is generally sufficient to determine if a material is sensitive to hydrolysis. Exposure for
15 or 20 days can indicate how progressive and/or severe decomposition can be.
2. Nylon materials have the highest susceptibility to degradation by hydrolysis among presently used separa-
tors. The V_L n values for nylons should not exceed the following recommended percentages (table II), which are
representative for nylon materials commonly used in aerospace applications.
Typically, non-nylon separators exhibit much lower weight loss due to hydrolysis _'L H than those presented in
table II.
TABLE II.--RECOMMENDED MAXIMUM WEIGHT
LOSS VALUES FOR NYLON MATERIALS
Length of
hydrolysis,
days
5
10
15
20
Weight loss due to hydrolysis,
WL n,
percent
2
4
8
16
3. Materials showing excessive weight loss after 10 days of exposure to hydrolysis conditions should not be
considered for use in cells.
4. Analysis of the electrolyte solution to which the samples were exposed can demonstrate the presence of
hydrolysis reaction byproducts and additional information concerning the degradation process.
NASA TM-107292 29

STP 9
STP 9--ELECTROCHEMICAL OXIDATION TEST PROCEDURE
Separator degradation in secondary alkaline cells can occur in a number of ways. A common degradation pro-cess is the chemical and electrochemical oxidation of materials as a result of oxygen generated at the end of charge
and during overcharge. Materials with minimal susceptibility to electrochemical oxidation are desirable for good cell
performance.Even without direct oxidation of the separator fibers, oxidation of the hydrolysis reaction products may occur.
Hydrolysis and direct oxidation of the separator lead to deterioration of the material. Furthermore, oxidation of the
hydrolysis reaction products leads to the production of undesirable byproducts. As a result, cell performance may bediminished, leading to premature cell failure. For example, nylon separators undergoing oxidation in Ni/Cd cells
lose their integrity, and their oxidation reaction products increase the carbonate concentration in the electrolyte. An
increase of carbonate concentration in the electrolyte results in higher electrolyte resistance, which is detrimental to
good cell performance. Oxidation reaction products also reduce the cadmium hydroxide in the cadmium electrode.
The reduction of the cadmium hydroxide to cadmium metal results in loss of overcharge protection, which leads to
higher internal pressure during cell overcharge. This loss can result in premature cell failure (ref. 4).
This test procedure evaluates the susceptibility of separators to electrochemical oxidation. It exposes samples to
oxygen generated during electrolysis, in flooded conditions, at 70 °C. The test runs for five days. Samples are tested
at a current density of 5.0 mA/cm 2. Three control samples are also exposed to 70 °C electrolyte to determine percent
weight loss due to hydrolysis.
I. Equipment and reagents:
1. Analytical balance
2. DC power supply3. Voltmeter
4. Two pairs of cables with alligator clips
5. Cell components (fig. 10):a. Polysulfone cell case with cap (cap must have holes for the nickel sheet tabs)
b. Four nickel sheets (11.0 cm by 7.5 cm; 4.3 in. by 3.0 in.), two of them with tabs
c. Five pieces of separator sample (same size as nickel sheet)
d. Four polypropylene screens (same size as nickel sheet)
e. Plexiglas shims
f. Electrolyte solution
6. Vacuum pump with bell jar assembly
7. Temperature-controlled water bath
8. Thermometer (in degrees Centigrade)
9. Styrofoam sheets and/or pellets10. 30-ml, wide-mouth Teflon vial with lid
11. Three 9-cm 2 samples
II. Procedure:
1. Fill the water bath container and set the temperature to 70 °C. Use the thermometer to check water
temperature.
2. Cut and label five separator samples the same size as the nickel sheets and the screens.
3. Cut and label three 9-cm 2 (1.4-in. 2) separator samples to serve as controls for hydrolysis.
NASA TM-107292 30

STP 9
Figure lO.mElectrochemical oxidation test assembly.
4. Weigh all the samples (Wd) and record the data.
5. Assemble the cell as follows:
(+)P- Ni- Sc- SM- Ni t
1
(-)- SM- Sc- SM- SC- SM- Ni t
2 3 4
- SM- Sc- Ni- P5
NASA TM-107292 31

STP 9
where
P Plexiglas shimNi nickel sheet
Ni t nickel sheet with tabSc screen
SM separator material
6. Pour the electrolyte solution into the cell case until the electrolyte level is approximately 2 cm (0.8 in.) over
the cell assembly. Mark the electrolyte level on the cell case. Place the cell case in the bell jar and evacuate for
5 min. Adjust the electrolyte level to the mark.
7. Cap the cell case, fitting the nickel sheet tabs through the cap holes (see fig. 10).
8. Place the three control samples (9 cm2; 1.4 in. 2) with 25 ml of electrolyte inside a Teflon vial. Cap the vial
and place it in the 70 °C water bath.
9. Place the cell case in the 70 °C water bath. Mark the water level in the bath.
10. Connect the power supply and voltmeter to the nickel sheet tabs. The voltmeter is used to monitor the volt-
age reading. Set power supply to maintain a current density of 5.0 mA/cm 2 (approximately 0.4 A). Typical voltage
readings are about 2.0 V.
11. Cover water surface with Styrofoam sheets or pellets to minimize water evaporation.
12. Twice a day, for 5 days, check the current, water level, and temperature in the bath and the electrolyte level
in the cell case. Adjust the water level in the bath and the electrolyte level in the cell case by adding 70 °C deionized
H20. This addition compensates for the water lost due to evaporation and the electrolysis reaction.
13. After 120 hr, disassemble the cell. Remove the control samples from the Teflon vial. Rinse all separator
samples with fresh 70 °C electrolyte solution and then with deionized H20 until the pH is neutral.
14. Dry the samples in a 40 °C oven for 3 hr and place them in a desiccator overnight.
15. Weigh the samples exposed to electrochemical oxidation (Wo).
16. Weigh the three control samples (Wc).
III. Calculations:
1. Determine the total percent weight loss (hydrolysis plus oxidation, WLT) in the samples exposed to electro-
chemical oxidation by using the following equation:
WE T = 100 × --wa-Wo
%
where
WL T
%Wo
total (hydrolysis plus oxidation) weight loss, percent
dry weight of sample, g
weight of sample after exposure to oxidation, g
NASA TM-107292 32

STP 9
2. Determine the percent weight loss due to hydrolysis WE H in the control samples by using the following
equation:
WL H =100× Wd -Wcwa
where
WE H
%%
weight loss due to hydrolysis, percent
dry weight of sample, gweight of control samples after exposure to hydrolysis, g
3. Average the WL T values for the five large separators.
4. Average the WE H values for the three 9-cm 2 (1.4-in. 2) control samples.
5. Calculate the percent weight loss due to electrochemical oxidation WL 0 by subtracting the average percent
weight loss due to hydrolysis WL H from the average total percent weight loss WL 7,
WLo = WET-WEH
IV. Recommendation:
Nonwoven nylon separators used in cells should exhibit less than 3 wt % loss due to electrochemical oxidation.
NASA TM-107292 33

STP 10
STP 10mCHEMICAL ANALYSIS TEST PROCEDURES
Separator composition is routinely monitored to evaluate the consistency of the material and to detect possible
impurities that can affect cell performance. Chemical analysis test procedures are divided into two categories: inor-
ganic, to determine metal and anionic composition; and organic, to identify carbon-containing compounds (fig. 11).
The first portion of the inorganic content analysis involves determining the metal composition of an ashed
sample. In this procedure, inductively coupled plasma atomic emission vacuum spectrometry (ICP) and atomic ab-
sorption spectrophotometry (AAS) are used to determine metal content. The ICP uses a high-temperature excitation
source for atomic emission analysis of chemical elements. ICP can detect the following elements: A1, B, Ba, Be, Bi,
Ca, Co, Cr, Cu, Fe, Hf, Hg, K, La, Mg, Mn, Mo, Na, Nb, Ni, P, Pb, Sb, Si, Sn, Ta, Th, Ti, V, W, Y, Zn, and Zr.
Because the ICP has low sensitivity to potassium and nickel and because cadmium emission fines overlap (interfere)
with other metal emission fines, AAS is used to analyze for their presence. AAS detects the amount of radiation
absorbed by an element, which is proportional to its concentration in the sample solution (ref. 5).
The inorganic content analysis is completed with the determination of anion concentrations in the sample.
Anionic content analysis for chloride (C1-), nitrate (NO3-), and carbonate (CO3 -2) are performed with the ion-
specific electrodes (ISE) shown in figure 12. These electrodes measure the concentration of a specific anion in
water leachants obtained from a separator sample.
The organic content analysis involves an infrared (IR) spectra analysis and an ultraviolet (UV) light screening
test. The infrared spectra analysis consists of a spectrophotometric evaluation of a pellet made from methanol
leachables. The IR spectra of the residue is compared with a baseline to identify the functional groups present in the
sample. The UV fight screening test is performed on samples to detect fibers that absorb and fluoresce against UV
light. Separators used in secondary alkaline cells generally do not contain fibers that fluoresce under UV light.
I Separator sample I
Inorganic analysis
1 II II
Organic analysis
UV light IR spectra
Figure 11 .mChemical analysis performed on separator materials.
NASA TM-107292 34

STP10
Figure 12.talon-specific electrode setup.
NASA TM-107292 35
i, _ _"_'

STP IOA
STP lOA--Inorganic Chemical Analysis: Ash and Metal Content
I. Equipment and reagents:
1. Analytical balance
2. Platinum dish with a platinum lid3. Muffle furnace with a range of 400 °C to 800 °C
4. Desiccator
5. Inductively coupled plasma atomic emission vacuum spectrometer (ICP)
6. Atomic absorption spectrophotometer (AAS)
7. Deionized H208. Concentrated HF (hydrofluoric acid)
9. 8 M HC104 (perchloric acid)10. 25-ml plastic volumetric flask11. Gloves
II. Preparation of material:
1. Weigh 5 g of separator material to the nearest 0.1 g (Wd).
2. Touch the sample material to a grounded strip to drain away as much static electricity as possible.
3. Cut the material into approximately 5-cm 2 (0.8-in. 2) pieces and place them into a tared, 7.5-cm-diameter
(3-in.-diameter), platinum dish (Wp) with a platinum lid.
4. Ash the material in a muffle furnace as follows: place the platinum dish with sample in the furnace and set
the temperature to 500 °C for 1 hr; then increase the temperature to 750 °C and heat for an additional hour.
5. Remove the dish from the furnace and place it in a desiccator to cool.
6. Weigh the remaining sample ash with the dish (Wsp). Repeat exposure at 750 °C for 30 min, cool, andreweigh.
7. Repeat this cycle as necessary until a constant weight (Wsp) is achieved.
III. Procedure:
1. Prepare the sample solutions as follows:
a. Dissolve the sample ash in the platinum dish by first adding 5 ml of deionized water, then add 2 to 3 ml
of concentrated HF and heat gently. After most of the sample ash is dissolved and the reaction subsides, add 1 ml of
8 M HC104 with gentle heating. Transfer the solution to a 25-ml plastic volumetric flask and dilute to the mark withdistilled water.
b. Prepare a blank solution containing the added reagents (2 to 3 ml of HF and 1 ml of 8 M HC104, diluted
to 25 ml with deionized H20 ). Also prepare standard solutions containing 1.0 ppm and 5.0 ppm of the metals ofinterest. Standard solutions must include the same proportion of acid solutions used to dissolve the sample ash.
NASA TM-107292 36
" ? , ' . 'i " '

STP IOA
2. Using the ICP element analysis software, enter the weight of the ash sample, the volume the sample was
diluted to (25 ml), and the concentrations of the standards used (1.0 ppm and 5.0 ppm).
3. Run the standard solutions and the blank through the ICP.
4. Run the sample solutions through the ICP. Output results are expressed as percent weight of metal (WM) in
the sample ash. Run each sample three times to ensure reproducibility.
5. Using the AAS computer program, enter the same information logged in step 2. Run blanks and standard
solutions through the AAS.
6. Run the sample solution through the AAS to detect elements showing low sensitivity and emission line inter-ference with other elements in the ICP. Output results are expressed as percent weight of metal (WM) in the sample
ash. Run each sample three times to ensure reproducibility.
IV. Calculations:
1. Calculate the weight of the sample ash Ws, the percent weight of ash in the sample WA, the weight of metal
in the sample ash W m, and the percent weight of metal in the separator sample WS by using the following equations:
Ws= Wsp-%
WA = Ws x 100wa
Ws × WMWm 100
WS = Wm × 100wd
where
%Wsp%WA
wdWmWM
WS
weight of sample ash, g
weight of platinum dish, lid, and sample ash, g
weight of platinum dish with lid, g
weight of ash, percent
dry weight of sample, g
weight of metal in sample ash, g
weight of metal in sample ash, percent
weight of metal in separator sample, percent
V. Recommendations and criteria:
1. Establish the expected composition of the material to facilitate the interpretation of results.
2. Note that inorganic content varies according to the type of material. For example, nonwoven nylon materials
have an average ash content of less than 0.5 wt %. In contrast, Zircar separators have an average ash content of99.9 wt %.
3. Always consider the effects of the metal traces on the electrochemistry and performance of the cell.
NASA TM-107292 37
STP lOB
STP lOBmInorganic Chemical Analysis: Anion Content
I. Equipment and reagents:
1. Analytical balance
2. Boiled deionized H20 (used at room temperature)3. Shaker or means to agitate sample in solution
4. Chloride (C1-), nitrate (NO3-), and carbonate (CO3-2) ion-specific electrodes (ISE)5. Two reference electrodes: one for the C1- and one for the NO 3- ISE
6. pH/ISE meter7. Three small stir bars
8. Semilogarithmic graph paper
9. Filling solutions for CI-, NO3-, and CO3 -2 electrodes
10. Carbon dioxide (CO2) buffer11. Ionic strength adjustor solution (ISA)
12. 1 M boric acid solution (preservative solution)
13. 100 ml of 1000-ppm CaCO 3 standard solution14. 100 ml of 1000-ppm NaCI standard solution
15. 100 ml of 1000-ppm NaNO 3 standard solution16. Twelve 100-ml volumetric flasks with stoppers
17. Five 100-ml beakers for the CO3-2 standards and sample
18. Ten 150-ml beakers for the C1- and NO 3- standards and samples
19. Parafilm paper20. One 500- to 1000-ml container with cap
II. Procedure:
1. Standards and sample preparations are time consuming. Because the shelf life of the standard solutions is 2
weeks, they can be prepared ahead of time as follows:
a. Weigh 5 g of sample to the nearest 0.1 g, cut it into small pieces, and place it in a clean 500- to 1000-ml
container with 500 ml of boiled deionized H20.
**NOTE**
In order to reduce CO 2 content, all deionized H20 used in this procedure must be boiled, covered, and
cooled to room temperature before use.
b. Cap container, place it in shaker, and agitate at low speed for 24 hr.
c. Prepare the standard sample solutions by diluting in series the corresponding 1000-ppm anion standard
solution. Make 100-ml standard solutions of 10, 100, 500, and 1000 ppm by first adding 2 ml of ISA solution in the
C1- and NO 3- volumetric flasks and 10 ml of CO 2 buffer in the CO3-2 flasks. Also, add 1 ml of preservative solutionin all standard solution flasks. Perform corresponding serial dilutions. Wrap the stoppers with Parafilm paper; cap
the flasks, shake them, and store them at room temperature.
2. Assemble ion-specific electrodes and reference electrodes with their respective filling solutions. Calibrate all
the electrodes and have the pH/ISE meter primed.
3. Starting with a 1000-ppm standard, pour 50 to 75 ml of solution into a beaker. Stir gently, without heating,
and take three voltage readings (millivolts) with the respective ISE and reference electrode. Record the data. Before
switching to the next concentration, rinse the electrodes with deionized 1-120 and blot them dry. Always take voltage
NASA TM-107292 38

STP lOB
readings from high to low concentration. Measure and record the potentials on the other two sets of anion standardsolutions.
4. For the C1- and NO 3- sample measurements, dispense 100 ml of leachate into a 150-ml beaker and add 2 ml
of ISA. Stir gently and obtain three voltage readings for each anion.
5. For the CO3 -2 sample measurements, dispense 50 ml of leachate into a 100-ml beaker. Add 5.0 ml of CO 2buffer and stir gently. Obtain three voltage readings.
III. Calculations:
1. Average the potential readings (millivolts) for each anion concentration standard solution. Prepare the cali-
bration curves on semilogarithmic paper for each standard anion. Plot the average voltage readings on the linear axis
(y axis) and the standard concentration values on the logarithmic axis (x axis).
2. Perform regressions and determine the respective linear equations for each species calibration curve. Typical
calibration curves for the anions of interest are shown in figure 13.
3. Average the voltage readings from the sample anions and plot the average voltage (millivolts) on the corre-
sponding standard curve to determine the anion species concentration in the leachate Cl. Use corresponding linear
equations to determine C l outside the measured range.
4. Determine the anion concentration in the separator sample Cs as follows:
C 1 x 500 mlC s -
5.0 g
where
Cs anion concentration in separator sample, ppm in [xg/g
anion concentration in leachate, ppm in _tg/ml
IV. Recommendations and criteria:
1. Establish the expected composition of the material to facilitate the interpretation of results.
2. Temperature fluctuations, drift, and noise limit the reproducibility when using ISE's (ref. 6). Work in a tem-
perature-controlled area, free from noise.
3. Prepare the standard curves every time you are testing.
NASA TM-107292 39

STP 10B
>E
t_
¢-
O.
"0
2
IJ.I
100
200 m
3OO10-6
lO-fold c;ange
1 10 100
I I II I ppm as CI- I I (a)I
lO-5 lO-4 lO-3 lO-2 lO-1
Molarity
150
100
_ so
m o
-5o
m
o n__ge.JJ-56mvl
1
1 10 100
ppm as Ca2CO 3
I I I I1 10 1 O0 1000
ppm as CO 2
I I I I I I10 -6 10 -5 10 -4 10 -3 10 -2 10 "1
Molarity
(b>I1000
Figure 13.--Ion-specific electrode calibration curves for CI -, NO3-, and C03-2 anions. (a) Typi-cal chloride electrode calibration curve. (b) Typical response of carbon dioxide electrode.
(c) Typical nitrate electrode calibration curve.
NASA TM-107292 40

STP 10B
E
¢=
"O
2
lO
30
50
70
90
110
130
150
170
190
210
230
250
10-fold change
m_m
-56 mV ]
III
I I I0.1 1 10 100 1000
ppm nitrate as N
I I I I I I0.1 1 10 100 1000 10 000
ppm nitrate as NO 3
I I I I I I10-6 10-5 10-4 10-3 10-2 10-1
Molarity
(c)I10 000
Figure 13.---Concluded. (c) Typical nitrate electrode calibration curve.
NASA TM-107292 41

STP 10C
STP lOCmOrganic Chemical Analysis: Infrared Test
To Detect Organic Contaminants
I. Equipment and reagents:
1. Reagent-grade methanol
2. Analytical balance3. Shaker or means to agitate the sample in solution
4. Rotary evaporator system with a rotary flask (500-ml capacity)
5. Mortar and pestle
6. Dry potassium bromide (KBr)
7. Pellet press
8. Spatula9. Infrared spectrophotometer with multiple internal reflectance (MIR) attached (if available)
10. Oven
11. Small stirring bar
II. Procedure:
1. Weigh 5 g of sample material to the nearest 0.1 g (Wd)-
2. Preweigh the rotary flask (Wf) and place the sample inside. Add 500 ml of methanol (100 ml for every gramof sample).
**NOTE**
The ratio of methanol to sample can be modified to maximize leaching or to minimize methanol use. A
ratio of 50:1 volume to weight is the recommended minimum.
3. Insert a small stirring bar in the rotary flask to ensure proper agitation. Seal the flask and place it in the
shaker; agitate at low speed.
4. Remove the sample from the methanol leachate after 24 hr of agitation. Dry the sample in an oven at 40 °C
for 15 min. Weigh the dry sample and report the weight after extraction W e.
5. Evaporate the leachate with the rotary evaporator system, under vacuum. Do not apply heat.
**NOTE**
There is a possibility that no residue will be recovered. If this occurs, repeat the extraction with a larger
sample.
6. Make sure no methanol remains in the rotary flask. After the methanol has evaporated, weigh the rotary flask
with the residue and record the weight (Wf, r).
7. Remove the residue from the rotary flask with a spatula and place it in a mortar. Mix the residue with KBr
and make a pellet. (A 1 to 5% mix of sample in KBr by weight is usually used.)
8. Run an infrared spectrum on the KBr sample pellet.
9. Run an infrared spectrum on a piece of sample by using the MIR attachment. The sample can be ground with
KBr and pressed into a pellet if an MIR is not available.
NASA TM-107292 42

STP IOC
III. Calculations:
1. Obtain an infrared baseline spectrum for the material (fig. 14).
2. Compare the residue and the sample spectra with the baseline spectrum. Note any additional or missing
absorbance peaks. Identify impurities, if any, based on this information. Keep in mind that the residue can contain
portions of the material being studied.
3. Calculate percent weight loss on sample WL and residue weight W r as follows:
WL = 100× Wd-We%
wr--w ,r- w/
105 -
O
POen
O
_0
E(Dt-
t-
100
95
90
85
80
75
7O
r- 64.1/
/65 /
4000
N-H
S- /
100.6 s
CN3-CH
O = C-NHCOOH-
3500 3000 2500 2000 1500Wavenumber, cm -1
Figure 14.--Representative infrared spectrum for FS 2538 separator.
1000 500
NASA TM-107292 43

STP 10C
where
WL
WeWr
wf
weight loss in sample, percent
dry weight of sample, g
weight of sample after extraction, g
weight of residue, g
weight of rotary flask and residue, g
weight of rotary flask, g
IV. Recommendations and criteria:
1. Establish the expected composition of the material to facilitate the interpretation of results.
2. Because the baseline and sample material spectra should show identical peak locations and relative intensi-
fies, place attention on the identification of extraneous peaks.
NASA TM-107292 44
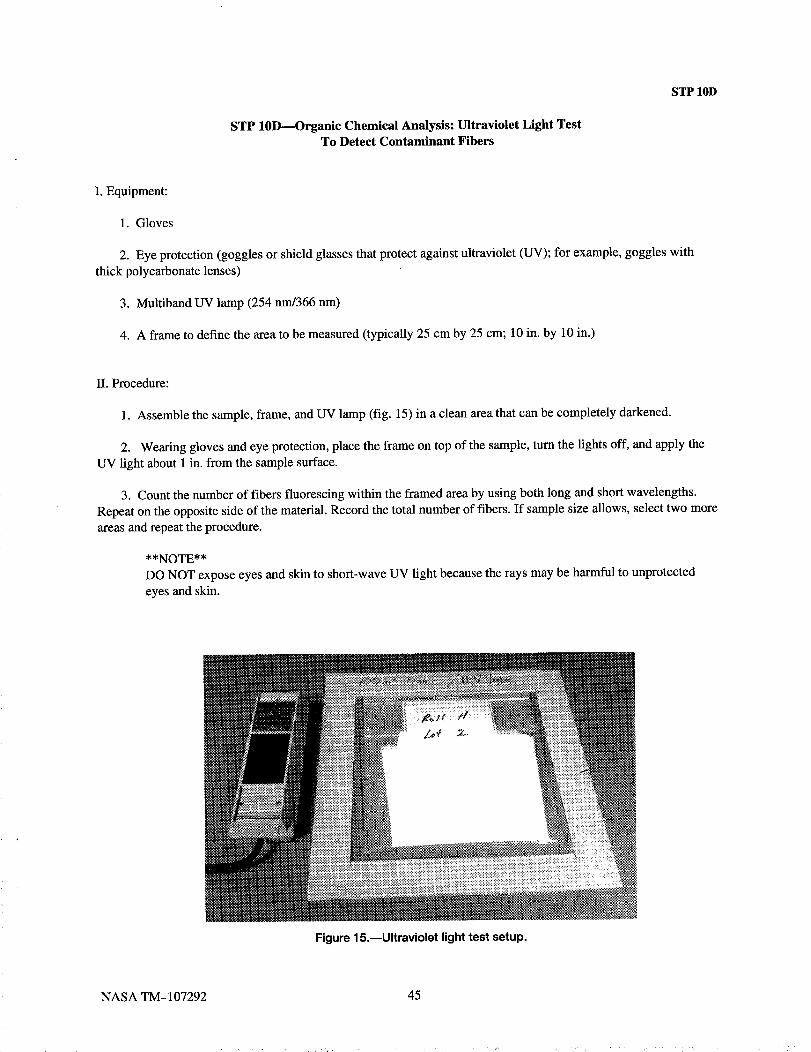
STP IOD
STP 10DmOrganic Chemical Analysis: Ultraviolet Light TestTo Detect Contaminant Fibers
I. Equipment:
1. Gloves
2. Eye protection (goggles or shield glasses that protect against ultraviolet (UV); for example, goggles with
thick polycarbonate lenses)
3. Multiband UV lamp (254 nm/366 nm)
4. A frame to define the area to be measured (typically 25 cm by 25 cm; 10 in. by 10 in.)
II. Procedure:
1. Assemble the sample, frame, and UV lamp (fig. 15) in a clean area that can be completely darkened.
2. Wearing gloves and eye protection, place the frame on top of the sample, turn the lights off, and apply the
UV light about 1 in. from the sample surface.
3. Count the number of fibers fluorescing within the framed area by using both long and short wavelengths.
Repeat on the opposite side of the material. Record the total number of fibers. If sample size allows, select two more
areas and repeat the procedure.
**NOTE**
DO NOT expose eyes and skin to short-wave UV light because the rays may be harmful to unprotected
eyes and skin.
Figure 15.mUItraviolet light test setup.
NASA TM-107292 45

STP IOD
III. Calculations:
Average the number of fibers fluorescing within the framed areas N and determine the number of fluorescent
fibers per sample area F.
where
NF=m
A
F number of fluorescent fibers per square centimeter
N average number of fibers within framed areaA area of frame, cm 2
IV. Recommendations and criteria:
1. Establish the expected composition Of the material to facilitate the interpretation of results.
2. None of the fibers in separators used in secondary alkaline cells fluoresce against ultraviolet light. Screening
with UV light helps to identify the presence of foreign fibers. For example, some nonwoven nylon materials havebeen found to be contaminated with Dacron fibers by using this screening test. The source of the Dacron was fibers
remaining from previous runs in the mixing chambers used to blend the nylon fibers before manufacturing. Typical
values for nylon materials are less than one fluorescent fiber per 6.4 cm 2 of material.
NASA TM-107292 46

STP 11
STP llmTENSILE STRENGTH TEST PROCEDURE
Separator materials used in secondary alkaline cells require sufficient strength to withstand handling during
cell assembly. They must also retain their integrity and withstand the effects of vibration and shock under service
requirements. Tensile strength measurements provide a means of evaluating the strength and integrity of a material.
The tensile strength test measures elongation as a function of load when the load is applied in tension. Tensile
strength is defined as the peak load, in pounds, per sample cross-sectional area measured in square inches (fig. 16).
Although tensile strength is used to evaluate the integrity of a material, a minimum tensile strength is not a pre-
requisite for separator selection. For example, Zircar separators, which have extremely low tensile strength when
measured with this method, perform well in Ni/Cd and Ni/H 2 cells. Tensile strength measurements are also used to
evaluate the quality and uniformity of separators. The measurements can also indicate changes in the molecular
structure resulting from degradation of the material. For instance, when nylon fibers hydrolyze and degrade, the
tensile strength decreases.Tensile strength measurements are highly dependent on test conditions, which must be consistent and controlled
to obtain reproducible and comparable results. Some materials exhibit directional characteristics that result in variations
of tensile strength as a function of manufacturing direction. For such materials, measurements are taken from samples
cut parallel to and perpendicular to the machine direction. Testing is performed on the material in the dry state.
I. Equipment and reagents:
1. Analytical balance2. TMI electronic micrometer
3. Rule die (10.2 cm long by 6.4 cm wide; 4 in. long by 2.5 in. wide)4. Tensile strength machine (Satec Systems Model 50 UD with tensile test system software) with load cell of
6000 lb.
60 F-"/ [] Peak load (57.2 Ib)/
[ X Breaking I°ad (4"6 IbZ
40
20
o / I I I I I I0 0.2 0.4 0.6 0.8 1.0 1.2
Position, in.
Figure 16.mTensile strength test results. Test identifier, FS 2536; rate, 0.3 in./min;filament direction, parallel; exposed sample area; 2.5 in. by 3 in.; tensile strength,
2280 psi.
NASA TM-107292 47

STP 11
II. Procedure:
1. Cut three samples with the rule die. For materials that exhibit directional characteristics as a result of manu-
facturing, cut three samples along the machine direction (MD) and three across the MD. Position the rule die with
the long side parallel to the direction to be evaluated.
2. Label and measure the thickness of each sample (refer to STP 1).
3. Insert a sample between the tensile strength machine holders. Keep the area exposed between tensile strength
machine holders constant. Typically, the area exposed between the holders is 7.6 cm long by 6.4 cm wide (3.0 in.
long by 2.5 in. wide).
4. Enter the identification, thickness, and width of the sample in the computer program. The cross-sectional
area used by the software is the product of the sample thickness and width. Run the test at a constant rate of
0.75 cm/min (0.30 in./min).
5. Repeat step 4 with all samples. The output is presented as tensile strength plots showing minimum and maxi-
mum elasticity points and the breaking point, tensile strength TS, in pounds per square inch (psi).
III. Calculations:
1. Obtain the tensile strength values TS for each sample from the output plot (fig. 16).
2. Report averaged TS values along MD and across MD for every material.
NASA TM-107292 48

STP 12
STP 12--MERCURY POROSIMETRY/PORE SIZE DISTRIBUTION TEST
Mercury porosimetry is one of the most common methods used for determining pore size distribution and void
volume in porous materials. The test provides valuable information concerning separator characteristics and helps to
evaluate for consistency among separator lots. The test measures the amount of mercury taken up by the sample as a
function of pressure.The mercury porosimetry technique employs a penetration instrument (fig. 17) that includes a pressure source
and a detector to determine the amount of mercury introduced into the pores as pressure is increased. From the vol-
ume of mercury penetrating the pores as a function of pressure, properties such as specific surface area, density,
percent porosity, average pore size, and pore distribution can be obtained (ref. 7).The results are calculated by assuming that sample materials are noncompressible, have cylindrical pores, and
are nonreactive to mercury. However, separator materials are generally compressible and contain noncylindrical
pores. These characteristics will affect the actual porosity and pore size distribution values for the sample. Because
testing is performed on the material in the dry state, results are not representative of cell conditions.
The mercury porosimetry test is performed by an outside contractor. Typical mercury porosimetry reports in-clude tabulated data and plots. Tabulated data contain information calculated from the amount of mercury intro-
duced into the pores of the sample as a function of pressure. Tabulated data include the following information:
1. Total intrusion volume: maximum volume of mercury introduced into the sample pores
2. Total pore area: surface area within the pores, assuming cylindrical geometry (fig. 18)
3. Median pore diameter (volume or area): diameter value obtained from the area or volume distribution curves
4. Average pore diameter: four times the pore volume divided by the pore area, assuming cylindrical geometry
Pressure gauges (psia)0-50.0000-30.0000-10.000
•1000
Vacuum gauge
Penetration volumeindicator
RecSampleholder
Pur
Pressurerelease
Pressuregenerator
Mercury
Mercuryreservoir
Figure 17.--Schematic diagram of mercury porosimetry penetrationinstrument.
NASA TM-107292 49

STP 12
A
Platinum /_feedthrough --_
Sample _
space
Matchingground joints
I
Precision
bore tube -_
B
Figure 18.mSample cell. (The central part can be obtainedoff-center to facilitate the analysis of large pieces.)
5. Bulk density: actual density of the sample, calculated from the sample weight and volume
6. Skeletal density: density of the material, calculated from the total intrusion volume and the bulk density
7. Porosity: percent volume of pores in the sample, calculated from the total intrusion volume and the actual
sample volume
8. Experimental raw data: pressure, pore diameter, incremental volume, cumulative volume, cumulative pore
area, and incremental pore area
Mercury porosimetry plots display the raw data organized in five different graphs. The graphs show relation-
ships of cumulative, incremental, and differential intrusions and cumulative and incremental pore areas versus pore
diameters found in the sample. Figure 19 is a plot of pore size distribution or incremental intrusion versus pore
diameter for Zircar separator material.
NASA TM-107292 50

Z>
>
LC_
t_
t_ "11
o" I
"00
O.
m.5
.o2 -=0-I
o_e-
N
o
RP0
o
Incremental intrusion, ml/g
o o p o o o o o p o0 tO ._ _ ¢0 0 I'O ._ O'J O_ 0
I I_..---1-.....L I .L L-____J..... [.... -J
?
t_

APPENDIX A
EVALUATION FORM FOR SEPARATOR MATERIALS
Date:
Separator ID:
Electrolyte concentration:
Characteristic STP
number
Area weight, AW, g/m 2 STP 1
Thickness, T, mm STP 1
STP 3Dimensional stability, D I and D w, after 10 days, percent
Electrolyte retention:
Uncompressed, ER, percent
ERA, cm3/cm z
Compressed, ERth, percent
ERlh, _, cm3/cm 2
Area resistivity, AR, f_-cm 2
Bubble pressure, P, psi
SEM screening (observations)
Hydrolysis, WLn, percent:
5 days
10 days
15 days
20 days
Electrochemical oxidation, WL 0, percent
Inorganic chemical analysis:
Ash, WA, percent
Metals found in ash, WM, percent
C1- concentration, ppm
NO 3- concentration, ppm
CO,3 -2 concentration, ppm
Organic chemical analysis:
Infrared spectra functional group, cm -1
Methanol extraction, WL
Ultraviolet screening, F, fibers/cm 2
Tensile strength, TS, psi:
Along machine direction
Across machine direction
Mercury porosimetry:
Total intrusion volume, ml/g
Total pore area, m2/g
Median pore diameter by volume, Ixm
Median pore diameter by area, txm
Average pore diameter, 4VIA, Ixm
Bulk density, g/ml
Apparent (skeletal) density, g/ml
Porosity, percent
STP 4
STP 5
STP 6
STP 7
STP 8
STP 9
STP 10
STP 10
STP 11
STP 12
Baseline value Experimental value
NASA TM-107292 52

APPENDIX B
CHARACTERIZATION RESULTS FOR SELECTED SEPARATOR MATERIALS
[Materials included are FS 2536, lot 13A; FS 2538, lot 2C; Pellon 2505 (Gates); and Zircar ZYK15, lot W-631. These test results
are specific for the sample lots identified. They do not represent a baseline and/orCharacteristic FS 2536, FS 2538,
Area weight, AW, g/m 2
Thickness, T, mm
Dimensional stability
after 10 days, percent:
Dt
Dw
Electrolyte retention:
Uncompressed, ER, percent
ERA, cm3/cm 2
Compressed, ERth, percent
ER_h,A, cm3/cm 2
Area resistivity, AR, _-cm 2
lot 13A
88.1
0.340
474
0.032
252
0.016
lot 2C
61.7
0.291
772
0.036
303
0.017
ecification for a particular material.]Pelion 2505
(Gates)
57.0
0.372
713
0.028
400
0.018
Zircar ZYK15,lot W-631
215.8
0.312
164
0.028
122
0.020
0.07 0.06 0.09 0.05
Bubble pressure, P, psi 1.8 1.4 1.4 1.0
SEM screening (observations) Packed matrix with
smooth and solid fibers
(no cracks, no holes)
Loose matrix and
junctions with irregular
shaped fibers (cracks
and holes)
Packed uniform
matrix with
smooth and
solid fibers (no
Packed matrix with
smooth and solid
fibers (no cracks, noholes)
cracks, no
holes)
7.4 (a)16.2
23.7
32.1
5.0 (a)
Hydrolysis, WL n, percent:
5 days 0.5 0.4
10 days 1.3 22
15 days 2.6 52
20 da),s 4.6 7.9
Electrochemical oxidation,
WL o, percent 1.8 1.4
Inorganic chemical analysis:
Ash, WA, percentMetals found in ash, WM,
percent
0.35
Na (6.6), K (5), P (3),
Ti (39), other traces
(<1)
5.5
7.7
288
(b)
0.31
Na (5.8), K (4), P(2),
Ti (40), other traces
(<I)
3.6
4.1
310
(b)
0.35
Na (10), K (4),
Zn (12), P (3),Ti(41),
other traces (<1)
28.1
15.2
680
(b)
99.8
Hf (1.2), Si (4),
Ti (0.13), othertraces (<1)
C1- concentration, ppm
NO s- concentration, ppm
CO3-2 concentration, ppm
Organic chemical analysis:
Infrared spectra functional
group, cm-'
Methanol extraction, WL
Ultraviolet screening, F,fibers/cm 2
Tensile strength, TS, psi:
Along machine directionAcross machine direction
NH (3.3K),
CH 3_2H (3.1K-2.9K),O = C-NH,
COOH (1.6K-1.5K),C-N, C-H,
C_ (1.4K-1.0K)
1.17
2470
690
3.12
78.79
42.23
0.0055
0.1582
0.2594
1.3527
80.82
NH (3.3K),
CH3-CH (3.1K 2.9K),O = C-NH,
COOH (1.6K-1.5K),
C-N, C-H,
C-C (1.4K-1.0K)
0.84
0.6
1630370
4.20
56.51
56.71
0.0055
0.2975
0.2013
1.3080
84.61
NH (3.3K),
CH3_H (3.1K-2.9K),O = C-NH,
COOH (1.6K-1.5K),C-N, C-H,
C_C (1.4K-1.0K)
1.17
1474
317
6.01
109.80
49.29
0.0058
0.2191
0.1476
1.3104
88.74
Mercury porosimetry d:
Total intrusion volume, ml/g
Total pore area, m2/g
Median pore diameterby volume, _tm
Median pore diameter by area, gm
Average pore diameter, 4VIA, gmBulk density, g/mlApparent (skeletal) density, g/mlPorosity, percent
aWeight loss from hydrolysis and/or chemical oxidation in Zircar materials is minimal. Typically, weight loss is due
bFigure 14 is a representative spectrum for nylon materials.
CNot applicable.
92
8.9
474
(c)
(c)
0
(d)(d)
122
42.28
23.31
0.0057
0.1157
0.7213
6.1336
88.24
to material handling.
NASA TM-107292 53

O4
Eo
E
0
e-
.o
E
0CI
1.2xl 02
1.0 -
0.8
0.6
0.4
0.2
0
1
t
!J_ X-
_z
n j :_iiii:
f
:4 I I I I I I
100
FS 2538, lot 2C
Pelion 2505 (Gates)
FS 2536, lot 13A
Zircar ZYK15,lot W-631
10 1
Diameter, _m
I I I ,i.........
0.1 0.01
Figure 20.--Effect of pore diameter on incremental intrusion volume for selected separator materials.
NASA TM-107292 54

STP C1
APPENDIX C
ADDITIONAL TEST PROCEDURES
STP ClmElectrolyte Retention in Uncompressed State by Using Kubelka Jar
Electrolyte retention using a Kubelka jar is an alternative procedure for measuring electrolyte retention in the
uncompressed state. It is commonly used by Freudenberg Nonwovens Inc., a manufacturer of nonwoven nylon sepa-
rators. This procedure involves the use of a Kubelka jar, which consists of a glass reservoir attached to a graduated
cylinder. Electrolyte retention is determined by difference, by knowing the amount of electrolyte originally placed in
the reservoir and then measuring the amount returned to the graduated cylinder after soaking and draining the
samples.
I. Equipment and reagents:
1. Analytical balance2. TMI electronic micrometer
3. Kubelkajar (fig. 21)4. Tweezers
5. Electrolyte solution
0 2 4 6 8 10 12
Figure 21 .--Kubelka jar.
II. Procedure:
1. Cut and label three samples of equal area, 5 cm by 5 cm (2 in. by 2 in.).
2. Weigh the samples (Wd) and measure the thickness according to STP 1.
3. Fill the calibrated cylinder in the Kubelka jar with electrolyte and note the level (V1). Tip the Kubelka jar
slowly, causing the electrolyte solution to accumulate in the reservoir.
4. Immerse all samples in the electrolyte solution for a minimum of 1 hr (4 hr for nonwoven nylon separators)
or until there are no visible dry spots on the sample.
5. Carefully turn the jar upright, allowing the excess electrolyte to flow back into the calibrated cylinder. Allow
sample to drain for 1 min.
6. Record the electrolyte volume in the graduated cylinder (V2).
NASA TM-107292 55

STP C1
III. Calculations:
1. Sum all three Wet to obtain the total dry weight for the samples (_Wd).
2. Calculate the electrolyte retention in the uncompressed state ER and the electrolyte volume retained Vby
using the following equations:
V= V1-V 2
ER = lOOx Vp£wd
where
V
V1
V2ER
P
electrolyte volume retained, cm 3
initial electrolyte volume from calibrated cylinder, cm 3
final electrolyte volume from calibrated cylinder, cm 3
electrolyte retention in uncompressed state, percent
electrolyte density, g/cm 3
total sum of dry weights, g
NASA TM-107292 56

STP C2
STP C2--Electrolyte Distribution Test Procedure
This electrolyte distribution test procedure was designed to study the electrolyte competition between cell com-
ponents. The test also provides a variety of information on separator characteristics. Measurements of area density,thickness, and electrolyte retention in the uncompressed and compressed states and information on the affinity of
the cell components for the electrolyte at less than a 100% fill level can be obtained. This STP was designed specifi-
cally for Ni/Cd cell components, but it can be modified for other chemistries by using representative cell compo-
nents and by evaluating and changing the cell fill procedure as necessary.
I. Equipment and reagents:
1. Electrolyte fill system (fig. 2)
2. Electrolyte distribution cell assembly (fig. 22)
3. Analytical balance4. Oven
5. Tweezers
6. Clock
7. Feeler gauge
8. Filter paper9. 1.0-ml graduated pipette
10. Electrolyte solution11. One nickel and one cadmium plate, 5 cm by 5 cm (2 in. by 2 in.)12. TMI electronic micrometer
II. Procedure to determine 100% fill level in cell components at a specified shim thickness:
1. Start with clean and dry nickel and cadmium plates and a 5-cm by 5-cm (2-in. by 2-in.) separator sample.
Measure and record the thickness and weight of each component (Wd,x).
2. Fill the cell components to 100% fill level as described in STP 2.
3. Determine the appropriate shim thickness by adding the thicknesses of the electrodes (nickel and cadmium
plates) and the desired interelectrode spacing (fig. 22).
4. Remove the cell components from the electrolyte, suspend each one vertically for 1 min, and touch the tip of
the sample to the surface of a piece of filter paper five times to remove excess electrolyte.
**NOTE**
Weighing the separator sample at this point will enable the determination of electrolyte retention in the
uncompressed state.
5. Assemble the cell components as shown in figure 22. Adjust the nuts and screws tightly. Verify the stack
compression by measuring the gap between the retaining plates with a feeler gauge. Adjust the gap by adding or
eliminating shims to achieve the desired thickness. Repeat check with feeler gauge.
6. Stand the cell assembly vertically for 4 hr to drain the excess electrolyte. Disassemble the cell, weigh the
cell components, and record the weights (Wx,th,100).
7. Wash the nickel and cadmium plates by rinsing and vacuum filling with deionized H20 until pH is 7.0 or
below. Dry the plates in a 40 °C oven for at least 2 hr, and store them in a desiccator.
NASA TM-107292 57

STP C2
| | Steel plate
IIIlllllll111111 Retaining plates
Shim
Ni electrode
I_ii_ii!_iii_| Separator
L\\\\\\/ Cd electrode
I IIIIIlllllllllllllllllilllllllL[[lllllllllllllllllllllllllllll
i__×_×_.
Ill;llllllllllltlllllllllllllllt_tttttttttivtttttt_tttttttttl
I I(al
0 0 0
0
0
0
0Access for
feeler gauge
(b) (c)
Figure 22.--Cell assembly for determining electrolyte distribution. (a) Three-component cell assembly.
(b) Steel plate and retaining plate, 3.5 in. by 3.5 in. (c) Shim.
III. Calculations:
1. Determine the assembled 100% fill electrolyte volume Vx,th, lO0 for each component, the total electrolyte
volume in the cell stack VT, th, lO0, and the electrolyte distribution for each component at 100% fill Dx,th,lO0 by using
the following equations:
WEx, th, lO0 = (Wx,th,ÂO0 - Wd, x)
Vx,th, lO0 = W-Ex,th,100/p
VT, th,100 = _Vx,th,100
Ox,th,lO0 = 100 x Vx'th'lO0VT,th,lO0
NASA TM-107292 58

STP C2
where
_¢VEx,th,100
Wx,th, lO0
W d,x
Vx,th,100
P
VT,th,100EVx,th,100
Dx,th,100
Subscripts:
X
th
weight of electrolyte in component at specified interelectrode spacing at 100% fill, g
weight of component at specified interelectrode spacing at 100% fill, g
dry weight of component, g
electrolyte volume in component at specified interelectrode spacing at 100% fill, ml
electrolyte density, g/ml
total volume of electrolyte at specified interelectrode spacing in cell stack at 100% fill, ml
sum of electrolyte volume of all components at specified interelectrode spacing at 100%
fill, ml
proportion of total electrolyte for each component at specified interelectrode spacing at
100% fill, percent
component (Ni, Cd, Sm)
interelectrode spacing, mils
2. Determine the corresponding electrolyte volumes for fill
VT,th,lO0 X %Vth'% - 100
where
V_,%
VT,th,100%
electrolyte volume at specified interelectrode spacing at percent fill level, mltotal electrolyte volume in cell stack at specified interelectrode spacing at 100% fill, ml
percent fill (20 to 90)
IV. Procedure to determine the electrolyte distribution and percent saturation at different percent fill levels for a
specified thickness (typically the distribution is evaluated at 20, 40, 60, 70, 80, and 100%):
1. Start with clean and dry electrodes (nickel and cadmium plates) and a 5-cm by 5-cm (2-in. by 2-in.) separa-
tor sample. Measure and record the thickness and dry weight of all components Wd,x.
2. Start with the lowest percent fill level (20%) and, using a 1.0-ml graduated pipette, dispense the appropriate
volume of electrolyte (as calculated in section IV) for the desired fill level into the components. Equally distribute
the electrolyte volume between the three components. The exact distribution of the electrolyte among cell compo-
nents is not critical as long as sufficient time is allowed for equilibration.
3. Employing the same shim size used in section II, assemble the cell fixture (fig. 22). For the 20% fill level,
allow the electrolyte to be absorbed into the components for 30 min before tightening the bolts.
4. Tighten the bolts and stand the cell fixture vertical for 1 hr.
5. Quickly disassemble the cell. Weigh and record the weights of the components Wx,th,%.
6. Add an additional increment of electrolyte in each component for the next percent fill level and quickly reas-
semble the cell.
NASA TM-107292 59
• _( ..... : r '¸¸

STP C2
7. Repeat steps 4, 5, and 6 until the distribution at the 100% fill level has been evaluated.
8. Wash the nickel and cadmium plates by rinsing and vacuum filling with deionized H20 until pH is 7.0 or
below. Dry electrodes in a 40 °C oven for at least 2 hr and store them in a desiccator.
V. Calculations:
1. The percent saturation of electrolyte for a particular component represents its fill level as a function of its100% fill level, which is defined as the saturation point. Determine the weight of electrolyte in each component
WEx,th,% and the percent saturation of individual components Sx,th,% at a specified thickness at each percent fill levelby using the following equations:
WEx,th,% = Wx,th,% - Wd, x
Sx,th,% = 100 ×WEx,th,%
WEx,th,100
where
WEx,th,%
%
Wx, th,%
Wd,x
Sx,th,%
WEx,th,100
Subscripts:X
th
weight of electrolyte in component at specified interelectrode spacing at percent fill level, g
percent fill (20 to 90)
weight of component at specified interelectrode spacing at percent fill level, g
dry weight of components, g
saturation level of cell component at specified interelectrode spacing at percent fill level, percent
weight of electrolyte in component at specified interelectrode spacing at 100% fill level
(from section IV, step 1), g
component (Ni, Cd, or Sm)
interelectrode spacing, mils
2. Graph the results, percent fill level on the x axis versus percent saturation for each individual component on
the y axis (see fig. 23).
3. Determine the electrolyte distribution Dx,th,% for the individual components at a specified thickness at each
percent fill level by using the following equations:
WET,th,% = _WEx,th,%
Dx,th,% = 100 xWEx,th,%
WET, th,%
where
WET, th,%
%
_WEx,th,%
total weight of electrolyte in cell stack at specified interelectrode spacing at percent fill level, g
percent fill (20 to 90)sum of electrolyte weight for each component at specified interelectrode spacing at percent fill
level, g
NASA TM-107292 60

STP C2
100 _" [] Ni plate
1 (_ FS 2538 separator
80 1 /_ Cd plate
60==.Q
40
00 20 40 60 80 1 O0
Fill level, percent
100 --
== 80-
_ 60 _
" 40_g
m 20
ot0 20 40 60 80 1O0
Fill level, percent
Figure 23.--Electrolyte distribution and percent saturation plots
for three-component Ni/Cd cell with FS 2538 separator material.
(Plots show how cell components compete for the electrolyteand how the saturation states vary at different percent fill levels.
The separator begins to compete for electrolyte after cell is 40%filled. (a) Electrolyte distribution. (b) Saturation of individual com-
ponents.
NASA TM-107292 61

STP C2
Dx,th,%
WE x,th,%
Subscripts:X
th
proportion of total electrolyte in cell component at specified interelectrode spacing at percent fill
level, percentweight of electrolyte in component at specified interelectrode spacing at percent fill level, g
component (Ni, Cd, Sm)
interelectrode spacing, mils
**NOTE**
_WEx,th,% is the summation of the experimental values and not the calculated values in section IV, step 2.Also, the saturation level and the electrolyte distribution values can be calculated by using the volume of
electrolyte in the components at the particular percent fill level.
4. Graph the results, percent fill level on the x axis versus percent electrolyte distribution of individual compo-
nents on the y axis (see fig. 23).
VI. Recommendations and criteria:
Recommendations and criteria from STP' s 4A and 4B similarly apply in this procedure.
NASA TM-107292 62

APPENDIX D
SYMBOLS
Symbols
A
AW
T
wd
sample area, m2
area weight, g/m 2
average sample thickness, mm
dry weight of sample, g
STP 1
D W
Dl
ld
w d
W w
STP 3
change in sample width, percent
change in sample length, percent
length of sample in dry state, cm
length of sample in wet state, cm
width of sample in dry state, cm
.width of sample in wet state, cm
A
ER
ERA
ERth,Awd
WwP
STP's 4A and 4B
sample area, cm 2
electrolyte retention in uncompressed state, percent
electrolyte retention per sample area in uncompressed state, cm3/cm 2
electrolyte retention at specified thickness, percent
electrolyte retention at specified thickness per sample area, cm3/cm 2
dry weight of sample, g
wet weight of sample at specified thickness, g
wet weight of sample, gelectrolyte density, g/cm 3
A e
AR
ee
R
STP 5
area of separator exposed, cm 2
area resistivity, f_-cm 2
average voltage drop for blank, Vaverage experimental voltage drop with separator sample, V
voltage drop across sample, Vresistance for separator sample,
P
Pi
bubble pressure, psi
final pressure, psi
initial pressure, psi
STP 6
NASA TM-107292 63

Symbols
wdWL n
Wx
STP 8
dry weight of sample, gweight loss due to hydrolysis, percent
hydrolysis weight of sample, g
WcW_WL n
WL o
WL T
Wo
STP 9
weight of control samples after exposure to hydrolysis, g
dry weight of sample, g
weight loss due to hydrolysis, percent
weight loss due to electrochemical oxidation, percent
total (hydrolysis plus oxidation) weight of sample, g
weight of sample after exposure to oxidation, g
A
CsC/F
N
TS
WA
WaWeW:W:rWL
WM
Wmw,w,.WS
WsWsp
STP's 10A, 10B, 10C, and 10D
area of frame, cm 2
anion concentration in separator sample, ppm in pg/g
anion concentration in leachate, ppm in ]xg/mlnumber of fluorescent fibers per square centimeter, fibers/cm 2
average number of fibers within framed area
tensile strength, psi
weight of ash, percent
dry weight of sample, gweight of sample after extraction, g
weight of rotary flask, gweight of rotary flask and residue, g
weight loss in sample, percent
welght of metal in sample ash, percent
weight of metal in sample ash, g
weight of platinum dish with lid, g
weight of residue, g
weight of metal in separator sample, percent
weight of sample ash, g
weight of platinum dish, lid, and sample ash, g
ER
V
Vlv:P
2Wd
STP C1
electrolyte retention in uncompressed state, percentelectrolyte volume retained, cm 3
initial electrolyte volume from calibrated cylinder, cm 3
final electrolyte volume from calibrated cylinder, cm 3
electrolyte density, g/cm 3
total sum of dry weights, g
NASA TM-107292 64

Dx,th, lO0
Ox,th,%
Sx,th,%
VT, th, 100
Vth,%
Vx,th, lO0
EVx,th,100
Wd, x
Wx,th,100
Wx,th, %
WET, th,%
VV-Ex,th, 1 O0
WEx,th,%
EWEx,th,%
P%
Subscripts:
x
th
Symbols
STP C2
proportion of total electrolyte for each component at specified interelectrode spacing at
100% fill, percent
proportion of total electrolyte in cell component at specified interelectrode spacing at
percent fill level, percentsaturation level of cell component at specified interelectrode spacing at percent fill level,
percenttotal volume of electrolyte at specified interelectrode spacing in cell stack at 100%
fill, ml
electrolyte volume at specified interelectrode spacing at percent fill level, ml
electrolyte volume in component at specified interelectrode spacing at 100% fill, ml
sum of electrolyte volume of all components at specified interelectrode spacing at 100%
fill, ml
dry weight of components, gweight of component at specified interelectrode spacing at 100% fill, g
weight of component at specified interelectrode spacing at percent fill level, g
total weight of electrolyte in cell stack at specified interelectrode spacing at percent fill
level, gweight of electrolyte in component at specified interelectrode spacing at 100%
fill, gweight of electrolyte in component at specified interelectrode spacing at percent fill level, g
sum of electrolyte weight for each component at specified interelectrode spacing at
percent fill level, g
electrolyte density, g/ml
percent fill (20 to 90)
component (Ni, Cd, Sm)
interelectrode spacing, mils
NASA TM-107292 65

References
REFERENCES
1. Manufacturing Control Document No. 232A2222AA-87, Rev. 0 to Rev. 1, Specific Instruction and Quality
Inspection Plan for NASAJGSFC Standard Nickel-Cadmium Cell, 1988.
2. Cooper, J.E.; and Fleischer, A.: Characteristics of Separators for Alkaline Silver Oxide Zinc Secondary
Batteries--Screening Methods. Air Force Aeropropulsion Laboratory, 1965.
3. Lim, H.S.; Margerum, J.D.; Verzwyvelt, S.A.; and Lackner, A.M.: Studies on the Stability of Nylon
Separator Material. Proceedings of 27th Power Sources Conference, Atlantic City, NJ, June 21-24, 1976.
4. Barrera, T.P.; and Zimmerman, A.H.: The Effects of an Electrochemical Environment on the Mechanical
Strength of Ni/Cd Cell Nylon Separator Material. ATM 90(5945-01)-9, Jan. 1990, p. 1.
5. Johnson, D.; Halloran, J.; Archer, F.; and Crandall, K.: Inductively Coupled Plasma Atomic Emission
Vacuum Spectrometer. Materials Division Chemical Characterization Facilities and Capabilities, NASA
Lewis Research Center, 1990, pp. 14-15.
6. Orion Research Inc., Laboratory Products Group: Reproducibility, Ion Specific Electrode Manual. The
Schrafft Center, Boston, 1991.
7. Orr, C., Jr.: Application of Mercury Penetration to Materials Analysis. Powder Technology, Vol. 3, 1969-70,
pp. 117-123.
NASA TM-107292 66


Form Approved
REPORT DOCUMENTATION PAGE OMB No. 0704-0188
Public reporting burden for this collectionof informationis estimated to average 1 hour per response, including the time for reviewing instructions, searching existingdata sources,gathering and maintainingthe data needed, and completing and reviewingthe collection of information. Send comments regardingthis burden estimate or anyother aspect of thiscollection of Information, including suggestionsfor reducing this burden, to Washington Headquarters Services,Directorate for Information Operations and Reports, 1215 JeffersonDavis Highway, Suite 1204, Arlington, VA 22202-4302, and to the Office of Management and Budget, Paperwork Reduction Project (0704-0188), Washington, DC 20503.
1. AGENCY USE ONLY (Leave blank) 2. REPORT DATE 3. REPORT TYPE AND DATES COVERED
May 1997 Technical Memorandum
5. FUNDING NUMBERS4. TITLE AND SUBTITLE
Test Procedures for Characterizing, Evaluating, and Managing
Separator Materials Used in Secondary Alkaline Batteries
6. AUTHOR(S)
Edwin Guasp and Michelle A. Manzo
7. PERFORMING ORGANIZATION NAME(S) AND ADDRESS(ES)
National Aeronautics and Space Administration
Lewis Research Center
Cleveland, Ohio 44135-3191
9. SPONSORING/MONITORING AGENCY NAME(S) AND ADDRESS(ES)
National Aeronautics and Space Administration
Washington, DC 20546-0001
WU-297-55-00
8. PERFORMING ORGANIZATIONREPORT NUMBER
E-10368
10. SPONSORING/MONITORINGAGENCY REPORT NUMBER
NASA TM- 107292
11. SUPPLEMENTARY NOTES
Edwin Guasp, NYMA, Inc., 2001 Aerospace Parkway, Brook Park, Ohio 44142 (work performed under NASA Contract
NAS3-27186), and Michelle A. Manzo, NASA Lewis Research Center. Responsible person, Michelle A. Manzo,
organization code 5420, (216) 433-5261.
12a. DISTRIBUTION/AVAILABILITY STATEMENT
Unclassified- Unlimited
Subject Categories 23, 27, and 38
This publication is available from the NASA Center for AeroSpace Information, (301) 621--0390.
12b. DISTRIBUTION CODE
13. ABSTRACT (Maximum 200 words)
Secondary alkaline batteries, such as nickel-cadmium and silver-zinc, are commonly used for aerospace applications.
The uniform evaluation and comparison of separator properties for these systems is dependent upon the measurement
techniques. This manual presents a series of standard test procedures that can be used to evaluate, compare, and select
separator materials for use in alkaline batteries. Detailed test procedures evaluating the following characteristics are
included in this manual: physical measurements of thickness and area weight, dimensional stability measurements,
electrolyte retention, resistivity, permeability as measured via bubble pressure, surface evaluation via SEM, chemical
stability, and tensile strength.
14. SUBJECT TERMS
Alkaline batteries; Separators
17. SECURITY CLASSIFICATION 18. SECURITY CLASSIFICATIONOF REPORT OF THIS PAGE
Unclassified Unclassified
NSN 7540-01-280-5500
19. SECURITY CLASSIFICATION
OF ABSTRACT
Unclassified
15. NUMBER OF PAGES
73
16. PRICE CODE
A04
20. LIMITATION OF ABSTRACT
Standard Form 298 (Rev. 2-89)
Prescdbed by ANSI Std. Z39-18298-102


