Download - Teleconferencia 3 q12

3Q 2012 Results
November 08th, 2012
SCHEDULE
HIGHLIGHTS
RESULTS
OUTLOOK
2
Providência USA
Providência USA
HIGHLIGHTS 3Q 2012
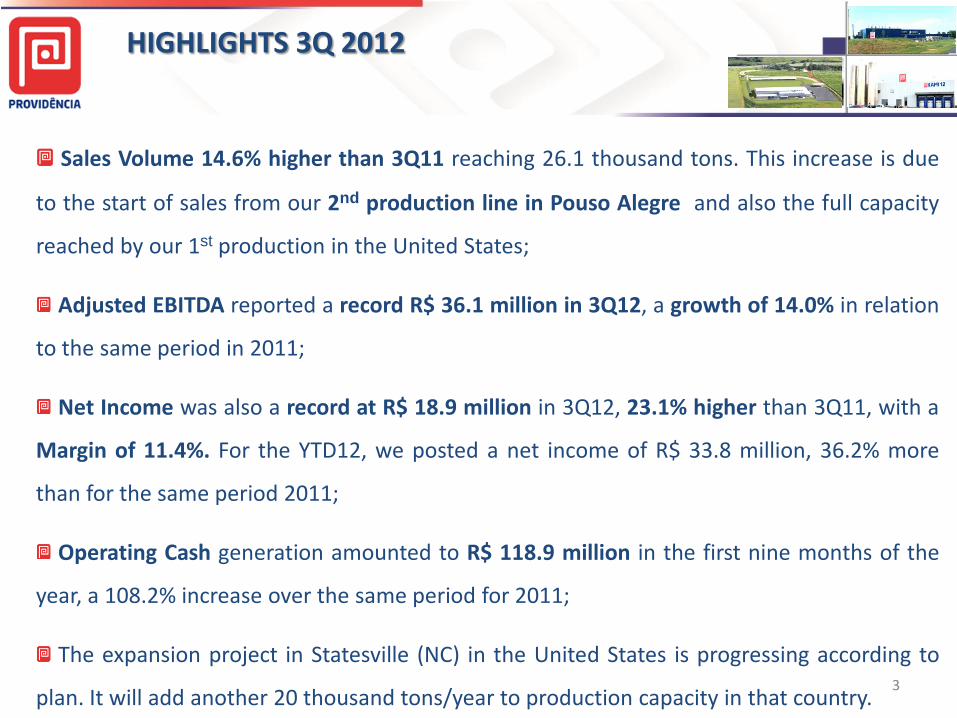
Sales Volume 14.6% higher than 3Q11 reaching 26.1 thousand tons. This increase is due
to the start of sales from our 2nd production line in Pouso Alegre and also the full capacity
reached by our 1st production in the United States;
Adjusted EBITDA reported a record R$ 36.1 million in 3Q12, a growth of 14.0% in relation
to the same period in 2011;
Net Income was also a record at R$ 18.9 million in 3Q12, 23.1% higher than 3Q11, with a
Margin of 11.4%. For the YTD12, we posted a net income of R$ 33.8 million, 36.2% more
than for the same period 2011;
Operating Cash generation amounted to R$ 118.9 million in the first nine months of the
year, a 108.2% increase over the same period for 2011;
The expansion project in Statesville (NC) in the United States is progressing according to
plan. It will add another 20 thousand tons/year to production capacity in that country. 3
SCHEDULE
HIGHLIGHTS
RESULTS
OUTLOOK
4
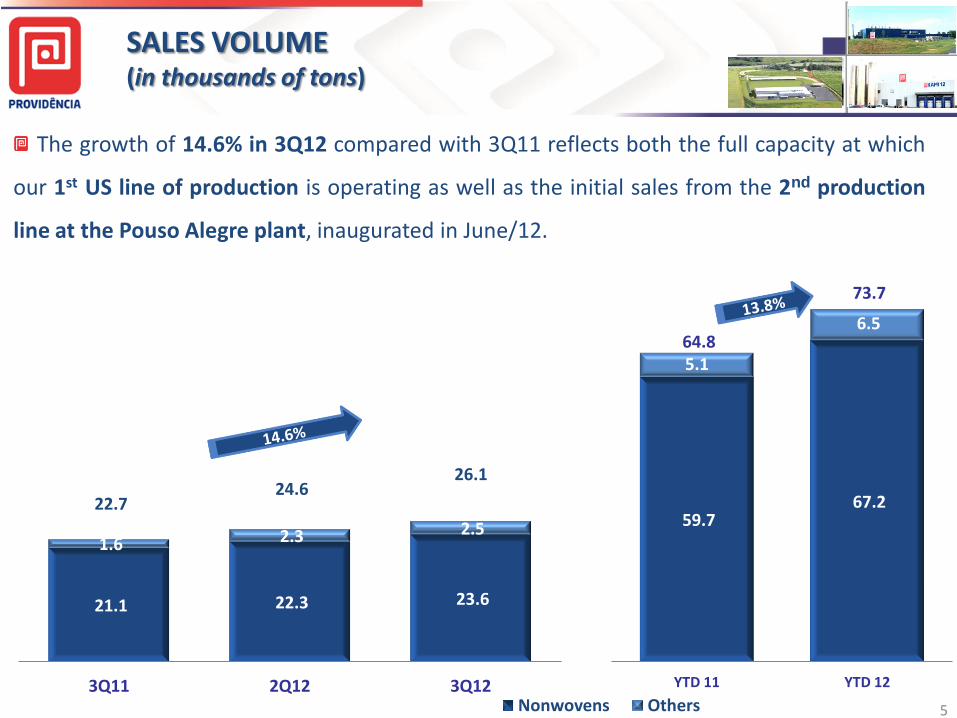
The growth of 14.6% in 3Q12 compared with 3Q11 reflects both the full capacity at which
our 1st US line of production is operating as well as the initial sales from the 2nd production
line at the Pouso Alegre plant, inaugurated in June/12.
59.7 67.2
5.1
6.5 64.8
73.7
YTD 11 YTD 12
21.1 22.3 23.6
1.6 2.3 2.5
22.7 24.6
26.1
3Q11 2Q12 3Q12 Nonwovens Others
SALES VOLUME (in thousands of tons)
5
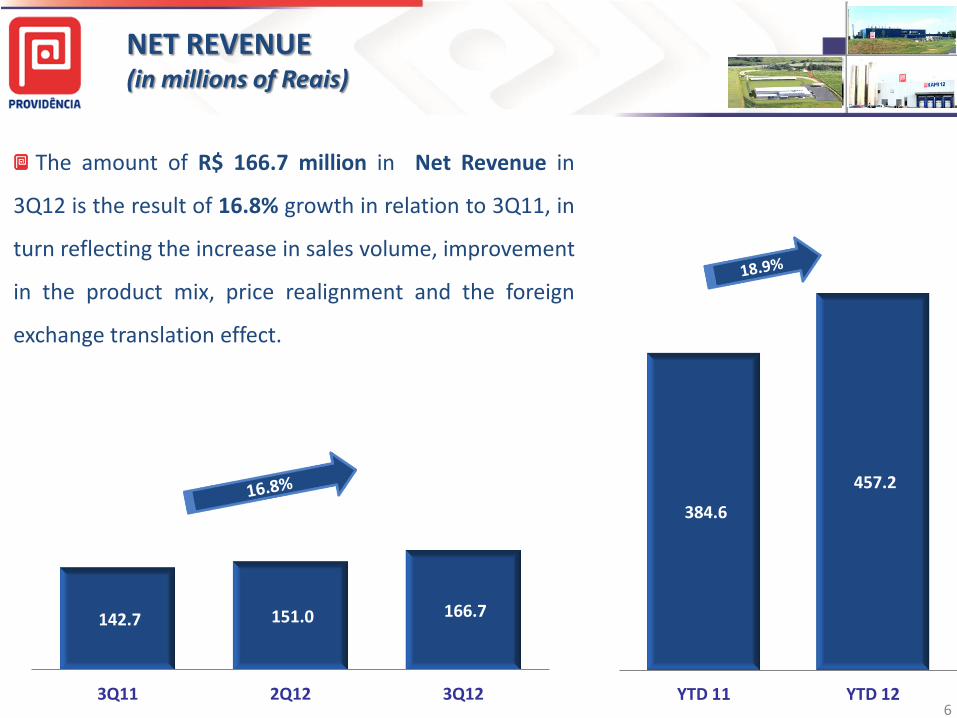
384.6
457.2
- 20,0 40,0 60,0 80,0
100,0 120,0 140,0 160,0 180,0 200,0 220,0 240,0 260,0 280,0 300,0 320,0 340,0 360,0 380,0 400,0 420,0 440,0 460,0
YTD 11 YTD 12
NET REVENUE (in millions of Reais)
6
142.7 151.0 166.7
3Q11 2Q12 3Q12
The amount of R$ 166.7 million in Net Revenue in
3Q12 is the result of 16.8% growth in relation to 3Q11, in
turn reflecting the increase in sales volume, improvement
in the product mix, price realignment and the foreign
exchange translation effect.
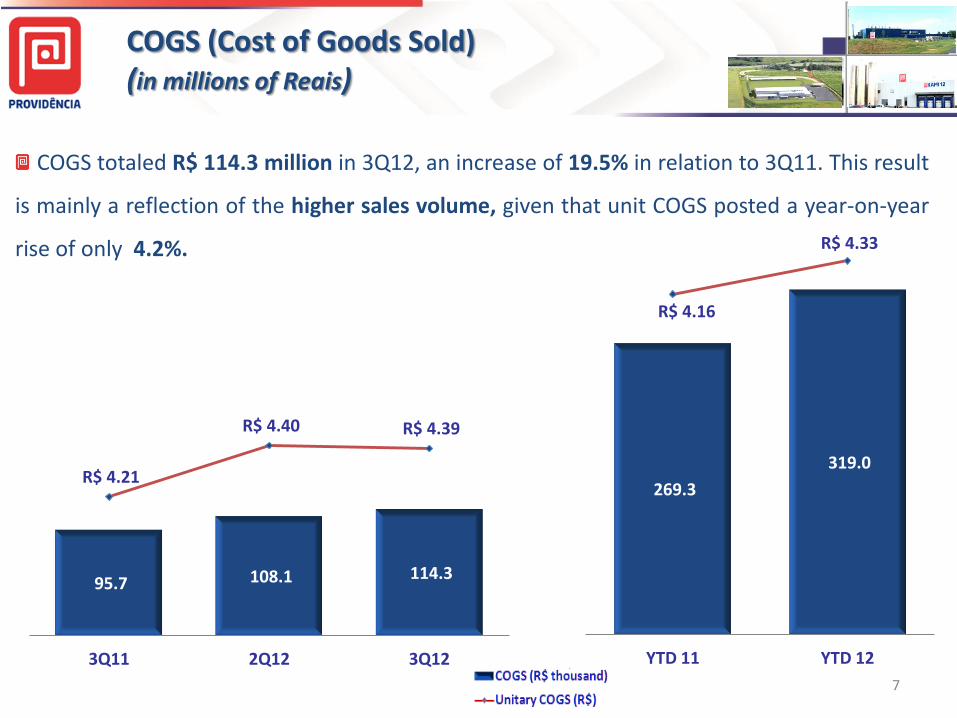
COGS totaled R$ 114.3 million in 3Q12, an increase of 19.5% in relation to 3Q11. This result
is mainly a reflection of the higher sales volume, given that unit COGS posted a year-on-year
rise of only 4.2%.
COGS (Cost of Goods Sold) (in millions of Reais)
7
95.7 108.1 114.3
R$ 4.21
R$ 4.40 R$ 4.39
R$3,70 -
20,0
40,0
60,0
80,0
100,0
120,0
140,0
160,0
180,0
200,0
220,0
240,0
260,0
280,0
300,0
320,0
3Q11 2Q12 3Q12
269.3
319.0
R$ 4.16
R$ 4.33
R$2,50
R$3,50
-
20,0
40,0
60,0
80,0
100,0
120,0
140,0
160,0
180,0
200,0
220,0
240,0
260,0
280,0
300,0
320,0
340,0
360,0
YTD 11 YTD 12
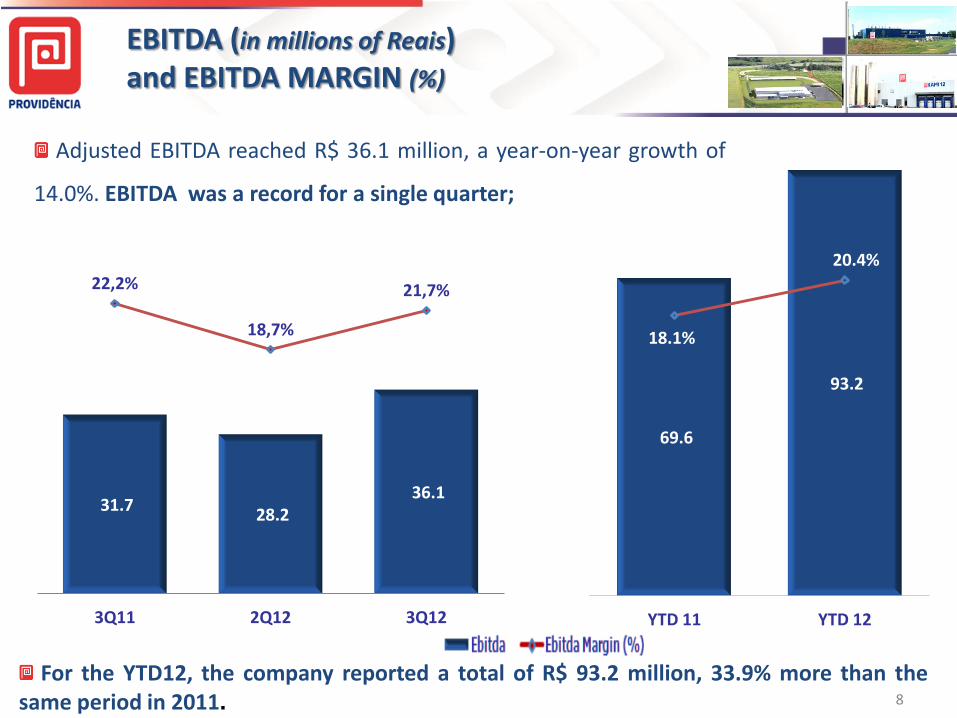
Adjusted EBITDA reached R$ 36.1 million, a year-on-year growth of
14.0%. EBITDA was a record for a single quarter;
31.7 28.2
36.1
22,2%
18,7%
21,7%
0,0% -
20,0
40,0
60,0
3Q11 2Q12 3Q12
69.6
93.2
18.1%
20.4%
0 -
20,0
40,0
60,0
80,0
YTD 11 YTD 12
EBITDA (in millions of Reais) and EBITDA MARGIN (%)
8
For the YTD12, the company reported a total of R$ 93.2 million, 33.9% more than the same period in 2011.
9
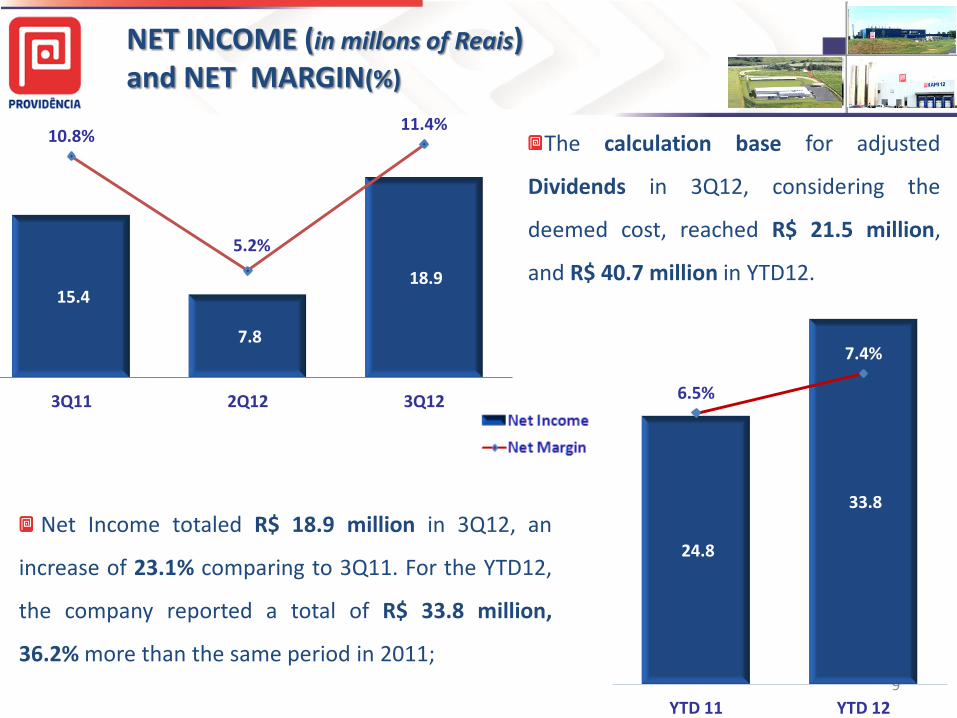
24.8
33.8
6.5%
7.4%
0,0% -
20,0
YTD 11 YTD 12
NET INCOME (in millons of Reais) and NET MARGIN(%)
25,0
The calculation base for adjusted
Dividends in 3Q12, considering the
deemed cost, reached R$ 21.5 million,
and R$ 40.7 million in YTD12. 15.4
7.8
18.9
10.8%
5.2%
11.4%
0,0%
3Q11 2Q12 3Q12
Net Income totaled R$ 18.9 million in 3Q12, an
increase of 23.1% comparing to 3Q11. For the YTD12,
the company reported a total of R$ 33.8 million,
36.2% more than the same period in 2011;
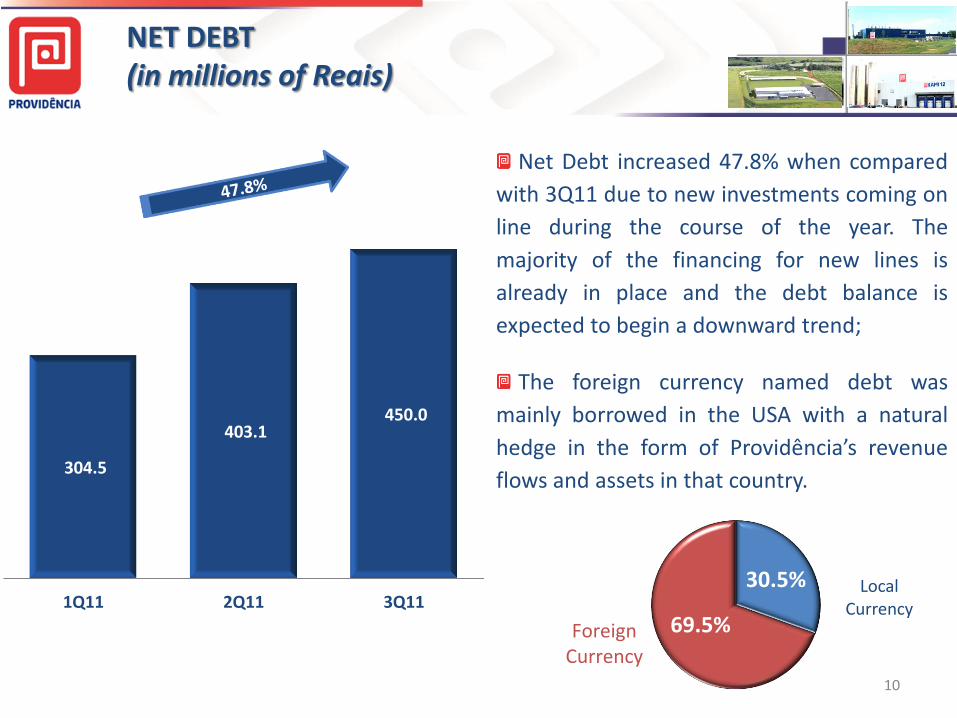
Local Currency
30.5%
69.5% Foreign Currency
NET DEBT (in millions of Reais)
Net Debt increased 47.8% when compared
with 3Q11 due to new investments coming on
line during the course of the year. The
majority of the financing for new lines is
already in place and the debt balance is
expected to begin a downward trend;
The foreign currency named debt was
mainly borrowed in the USA with a natural
hedge in the form of Providência’s revenue
flows and assets in that country.
10
304.5
403.1 450.0
1Q11 2Q11 3Q11
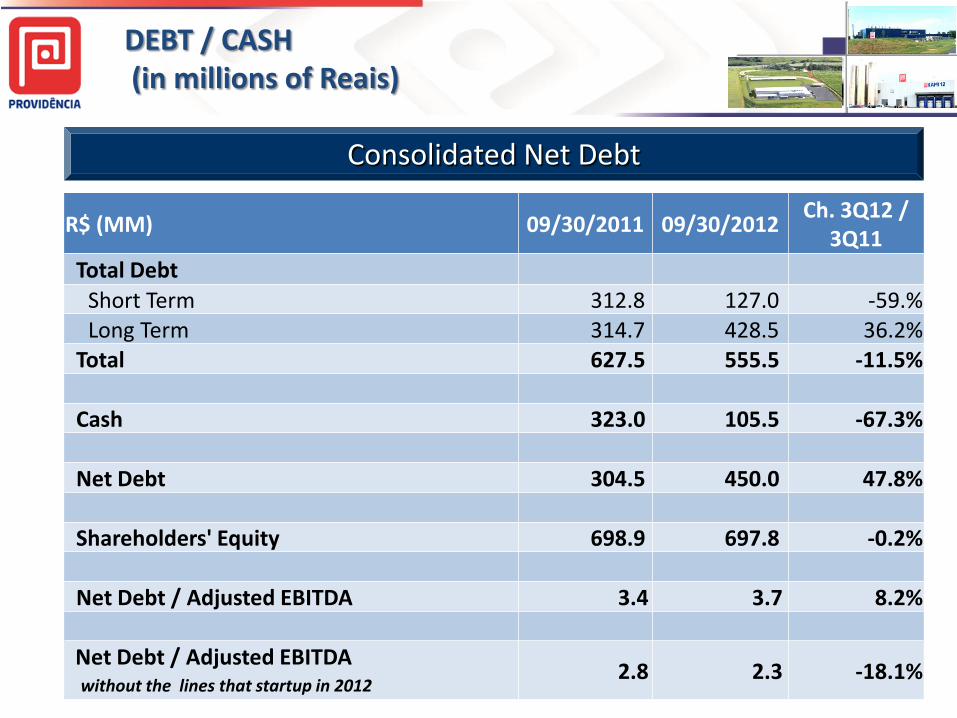
DEBT / CASH (in millions of Reais)
Consolidated Net Debt
11
R$ (MM) 09/30/2011 09/30/2012 Ch. 3Q12 /
3Q11
Total Debt
Short Term 312.8 127.0 -59.% Long Term 314.7 428.5 36.2%
Total 627.5 555.5 -11.5%
Cash 323.0 105.5 -67.3%
Net Debt 304.5 450.0 47.8%
Shareholders' Equity 698.9 697.8 -0.2% Net Debt / Adjusted EBITDA 3.4 3.7 8.2% Net Debt / Adjusted EBITDA without the lines that startup in 2012
2.8 2.3 -18.1%
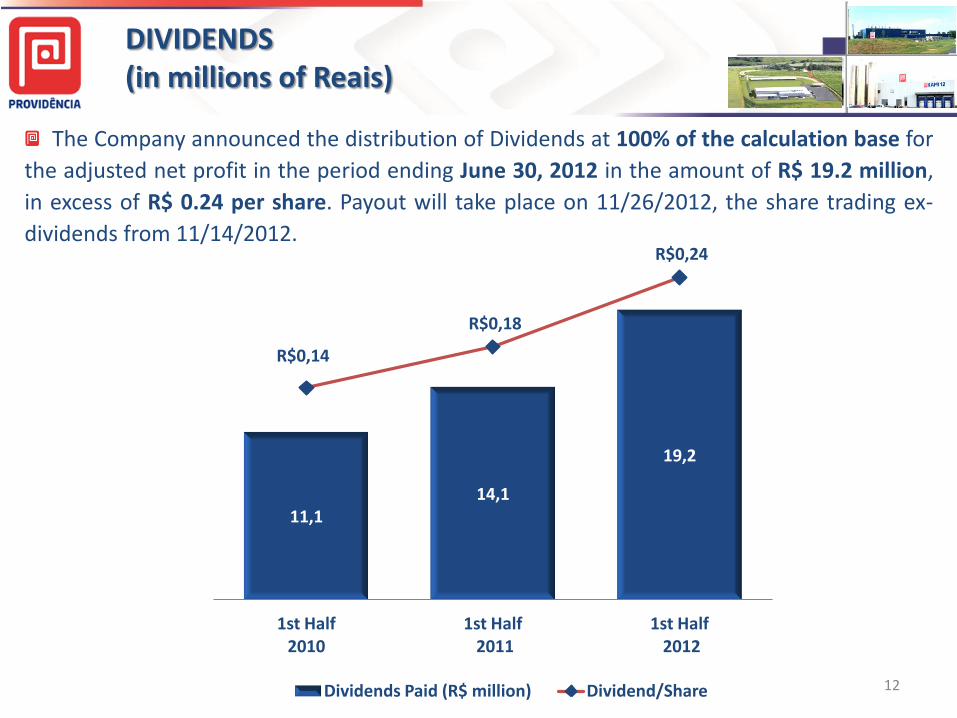
DIVIDENDS (in millions of Reais)
25,0
12
11,1 14,1
19,2
R$0,14
R$0,18
R$0,24
-0,10
-0,05
0,00
0,05
0,10
0,15
0,20
0,25
-3,0
2,0
7,0
12,0
17,0
22,0
1st Half 2010
1st Half 2011
1st Half 2012
Dividends Paid (R$ million) Dividend/Share
The Company announced the distribution of Dividends at 100% of the calculation base for
the adjusted net profit in the period ending June 30, 2012 in the amount of R$ 19.2 million,
in excess of R$ 0.24 per share. Payout will take place on 11/26/2012, the share trading ex-
dividends from 11/14/2012.
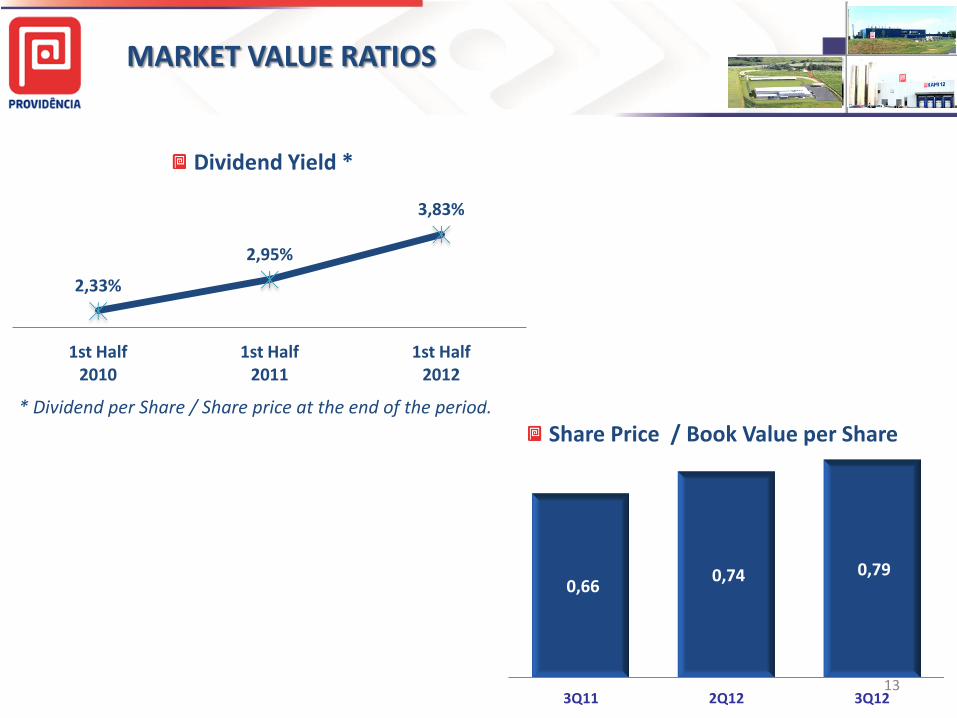
MARKET VALUE RATIOS
25,0
13
Share Price / Book Value per Share * Dividend per Share / Share price at the end of the period.
2,33%
2,95%
3,83%
1st Half 2010
1st Half 2011
1st Half 2012
Dividend Yield *
0,66 0,74 0,79
-
0,20
0,40
0,60
0,80
1,00
1,20
1,40
3Q11 2Q12 3Q12
HIGHLIGHTS
RESULTS
OUTLOOK
SCHEDULE
OUTLOOK
15
Dividend payout was 100% of the adjusted Net Income in the period ending June 30 2012,
amounting to R$ 19.2 million, in excess of R$ 0.24 per share. The value will be paid out on
November 26, 2012, the shares trading ex-dividends in November 14, 2012;
The goal is for the 2nd production line in Pouso Alegre (MG) – the Company’s 12nd –
unveiled in June/12 and with 20 thousand tons/year of capacity, to reach full capacity by the
end of this year;
According to the expected schedule, we shall be concluding the 13th production line - the
second in Statesville (NC) – at the end of 2012, increasing the production capacity in the
United States from 20 to 40 thousand tons/year;
Providência will end 2012 with a capacity of 140 thousand tons/year, underscoring its
position as one of the largest and most modern players in the world nonwovens industry.

CEO: Hermínio V. S. de Freitas CFO: Eduardo Feldmann Costa IR : Gabriela Las Casas Beatriz Tokarski Tel: +55 (41) 3381-8673 Fax: +55 (41) 3283-5909 São José dos Pinhais – PR www.providencia.com.br/ir www.twitter.com/providencia_ri
The words “believe”, “anticipate”, “expect”, “estimate”, “will”, “plan”, “may”, “intend”, “foresee”, “project” and other similar expressions indicate forward-looking statements. These forward-looking statements involve uncertainties, risks and assumptions, since they include information related to our potential or assumed future operating results, business strategy, financing plans, competitive position in the market, industry environment, potential growth opportunities and the effects of future regulations and competition. In addition, forward-looking statements refer only to the date on which they were made and should not be taken as a guarantee of future performance. Providência is under no obligation to update this presentation with new information and/or future events .


