
INTERNATIONAL FOODPOLICY RESEARCH INSTITUTEsustainable solutions for ending hunger and poverty Ghana Strategy Support
Program
Targeting smallholders for agricultural growth in Ghana
Jordan Chamberlin
16 November 2007
Accra, Ghana

Page 2Ghana Strategy Support Program INTERNATIONAL FOOD POLICY RESEARCH INSTITUTE
Pro-poor agricultural growth
• Ghana’s current development objectives place a great deal of emphasis on broad-based, pro-poor agricultural growth
• Emphasis on • expansion of high-value & export-oriented cash crops• improved production of food crops
• Transformation of smallholder agriculture

Page 3Ghana Strategy Support Program INTERNATIONAL FOOD POLICY RESEARCH INSTITUTE
Who are Ghanaian smallholders?• Data on small farms & staple agriculture
• Ghana Living Standards Survey 2005/6• 8687 households• regional & ecological zone inferences
• Production data• SRID, Ministry of Agriculture: district data 1992-
2006
• Field visits to maize producers (March 2007)

Page 4Ghana Strategy Support Program INTERNATIONAL FOOD POLICY RESEARCH INSTITUTE
Smallholders dominate agriculture• Two thirds of all farms less than 3 ha
0.2
.4.6
0 5 10 15 20 0 5 10 15 20 0 5 10 15 20
coastal forest savannah
density
holding size (ha)
Coast, 2.3 ha avg
Forest, 3.1 ha avg
Savanna, 4.0 ha avg

Page 5Ghana Strategy Support Program INTERNATIONAL FOOD POLICY RESEARCH INSTITUTE
Smallholder crop portfolios• Number of crops varies with farm size
• < 2 ha: average of 3.1 crops• >=5 ha: average of 5.0 crops
• Maize & cassava most important in smaller farms• The only crops produced by 12% of households
(median holding size 0.8 ha)

Page 6Ghana Strategy Support Program INTERNATIONAL FOOD POLICY RESEARCH INSTITUTE
2.0
3.0
4.0
5.0
6.0
7.0
< 0.5 ha 0.5-1 ha 1-2 ha 2-3 ha 3-4 ha 4-5 ha > 5 ha
land holding size
me
an
nu
mb
er
of
cro
ps
Coastal
Forest
Savanna
median # crops
Page 7Ghana Strategy Support Program INTERNATIONAL FOOD POLICY RESEARCH INSTITUTE
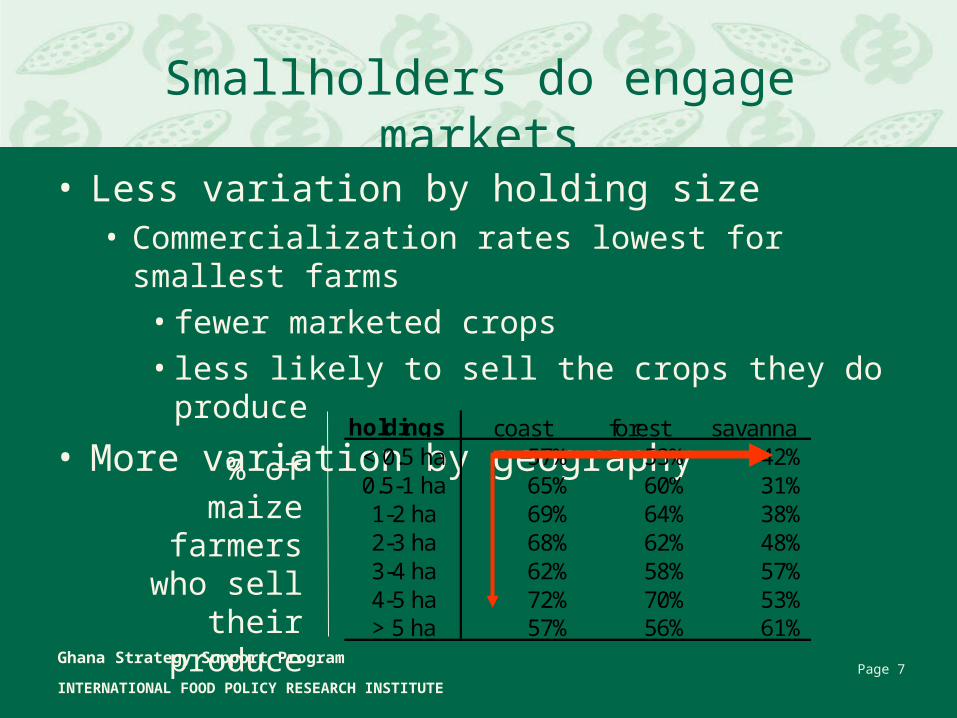
Smallholders do engage markets
• Less variation by holding size• Commercialization rates lowest for smallest farms
• fewer marketed crops • less likely to sell the crops they do produce
• More variation by geographyholdings coast forest savanna
< 0.5 ha 57% 53% 42%0.5-1 ha 65% 60% 31%1-2 ha 69% 64% 38%2-3 ha 68% 62% 48%3-4 ha 62% 58% 57%4-5 ha 72% 70% 53%> 5 ha 57% 56% 61%
% of maize farmers who
sell their produce

Northern
Volta
Brong Ahafo
Ashanti
Western
Eastern
Upper West
Central
Upper East
Greater Accra
% of producers who sell
<30%
30-4
0%
40-5
0%
50-6
0%>6
0%
Northern
Volta
Brong Ahafo
Ashanti
Western
Eastern
Upper West
Central
Upper East
Greater Accra
% of hhs who produce
< 30
%
30-4
0%
40-5
0%
50-6
0%>6
0%

• Yields are growing but still low
• Fertilizer & other input use is driven by geography
• Anecdotal evidence that fertilizers are freq. used to compensate for land degradation rather than to maximize yields
% of farmers using purchased fertilizer

Page 10Ghana Strategy Support Program INTERNATIONAL FOOD POLICY RESEARCH INSTITUTE
Farm size ≠ poverty• Relationship between
income and holdings is weak and variable across geographical space• Positive in forest/transition• Negative in coast
• Agrees with anecdotal evidence that land is not the chief limitation, but rather access to labor and other resources…
Per capita consumption & hh landholding

Page 11Ghana Strategy Support Program INTERNATIONAL FOOD POLICY RESEARCH INSTITUTE
Characterizing smallholders• Holdings are small, but size does not fully explain
farmer behavior • Incomes and income sources vary widely• Yields are low; input use is low• Market participation is variable but staple
markets are widely engaged in (esp maize)

Page 12Ghana Strategy Support Program INTERNATIONAL FOOD POLICY RESEARCH INSTITUTE
Characterizing smallholders• Geography is more important than holding size
for capturing many smallholder characteristics, including input use and many aspects of market participation
• What are the key constraints faced by smallholders and how do the conditions under which they produce modify those constraints?

Page 13Ghana Strategy Support Program INTERNATIONAL FOOD POLICY RESEARCH INSTITUTE
Constraints faced by smallholders• Production technologies are not accessible
• factor market constraints: labor, mechanized traction
• Risk of production failure (rainfall variability)• Uncertainty about market opportunities & prices• Poor returns on productivity-related costs

Page 14Ghana Strategy Support Program INTERNATIONAL FOOD POLICY RESEARCH INSTITUTE
Source: Personal communication from Natural Resources Institute, 2006, as published in World Bank 2007: 119
• For example, consider these costs along the maize chain from farm gate to Accra retail – equivalent to 80% of producer price for a producer near Techiman
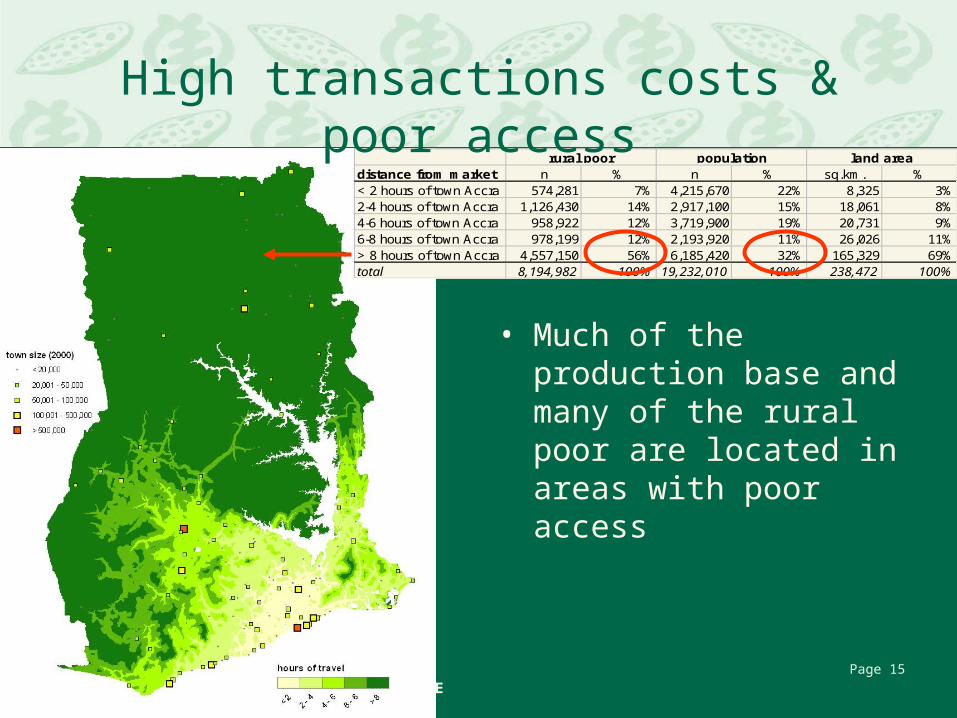
High transactions costs & poor access
Page 15Ghana Strategy Support Program INTERNATIONAL FOOD POLICY RESEARCH INSTITUTE
distance from market n % n % sq.km. %< 2 hours of town Accra 574,281 7% 4,215,670 22% 8,325 3%2-4 hours of town Accra 1,126,430 14% 2,917,100 15% 18,061 8%4-6 hours of town Accra 958,922 12% 3,719,900 19% 20,731 9%6-8 hours of town Accra 978,199 12% 2,193,920 11% 26,026 11%> 8 hours of town Accra 4,557,150 56% 6,185,420 32% 165,329 69%total 8,194,982 100% 19,232,010 100% 238,472 100%
land areapopulationrural poor
High transactions costs & poor access
• Much of the production base and many of the rural poor are located in areas with poor access

• The access story has many overlapping dimensions
road density
< 0.
10.
20.
30.
40.
5>
0.5
")")
")
") ")
")
") ") ")
")")
")
")")
") ")
")
")
")
")
")")")
")
")
")
")
")
")")
")")
")
")
") ")
")
")
")
")
")
")")
")")
")
")
")
")") ")
")")
")
")")
")")
")")")")
")")")
")
")
")
")")
")
")")
")")
")
")
")
")
")
")
")
")
")")
")
")
")")
")
")
")")
")
")")")
")")
")")
")
")
")")")")
")
")
")")
")
")
")
")
")
")
")
")")
")")
") rural banks
share of total area
0.00
0.01
0.02
0.03
0.04

Rainfall Rainfall variability
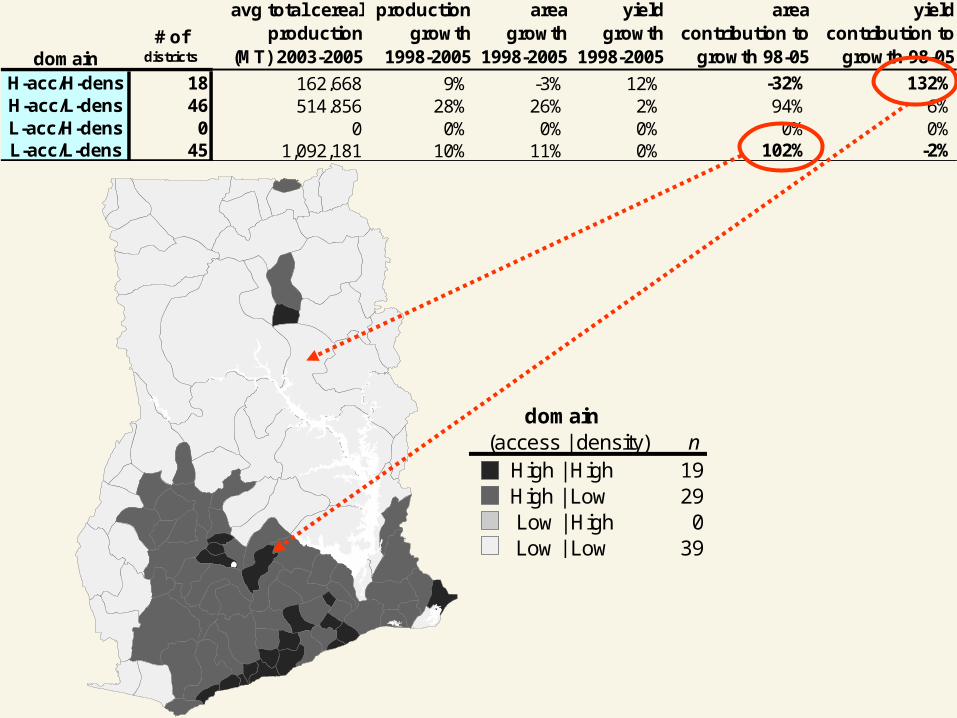
domain# of
districts
avg total cereal production
(MT) 2003-2005
production growth
1998-2005
area growth
1998-2005
yield growth
1998-2005
area contribution to
growth 98-05
yield contribution to
growth 98-05
H-acc/H-dens 18 162,668 9% -3% 12% -32% 132%H-acc/L-dens 46 514,856 28% 26% 2% 94% 6%L-acc/H-dens 0 0 0% 0% 0% 0% 0%L-acc/L-dens 45 1,092,181 10% 11% 0% 102% -2%
domain(access | density) n
High | High 19High | Low 29 Low | High 0Low | Low 39

Page 19Ghana Strategy Support Program INTERNATIONAL FOOD POLICY RESEARCH INSTITUTE
Targeting smallholders• The challenges faced by different types of farms
are heightened by production and market environments
• Much production takes place under conditions of high costs, poor information, risk• many smallholders do not perceive benefits of
productivity investments

Page 20Ghana Strategy Support Program INTERNATIONAL FOOD POLICY RESEARCH INSTITUTE
Targeting smallholders• Strengthening food markets (maize) is one of the
most important means of engaging the largest portion of smallholders, and thereby increasing productivity and income• Development of more profitable technologies• More efficient and competitive input markets• More efficient output marketing chains• Market information, weights and measures• Risk mitigation
• Continue to explore alternatives• e.g. organic production; high-value non-perishables


Page 22Ghana Strategy Support Program INTERNATIONAL FOOD POLICY RESEARCH INSTITUTE
Smallholders less likely to use some inputs
* relative to average share for producers with smallest holdings
% holders using purchased inputs

Page 23Ghana Strategy Support Program INTERNATIONAL FOOD POLICY RESEARCH INSTITUTE
Holding size may not well explain food crop marketing
Share of production sold


