
S1
Supplementary results
Targeting P-glycoprotein: Investigation of piperine analogs for
overcoming drug resistance in cancer
Safiulla Basha Syed,a,b Hemant Arya,a I-Hsuan Fu,c Teng-Kuang Yeh,c Latha Periyasamy,d
Hsing-Pang Hsieh,c,e,* and Mohane Selvaraj Coumara,*
aCentre for Bioinformatics, School of Life Sciences, Pondicherry University, Kalapet,
Puducherry- 605014, India.
bDBT-Interdisciplinary Program in Life Sciences, Pondicherry University, Kalapet, Puducherry-
605014, India
cInstitute of Biotechnology and Pharmaceutical Research, National Health Research Institutes,
35 Keyan Road, Zhunan, Miaoli County 350, Taiwan, ROC.
dDepartment of Biochemistry & Molecular Biology, School of Life Sciences, Pondicherry
University, Kalapet, Puducherry- 605014, India.
eDepartment of Chemistry, National Tsing Hua University, Hsinchu, Taiwan, ROC.
*Corresponding authors: H.P. Hsieh, email: [email protected]; M.S. Coumar, email:
S2
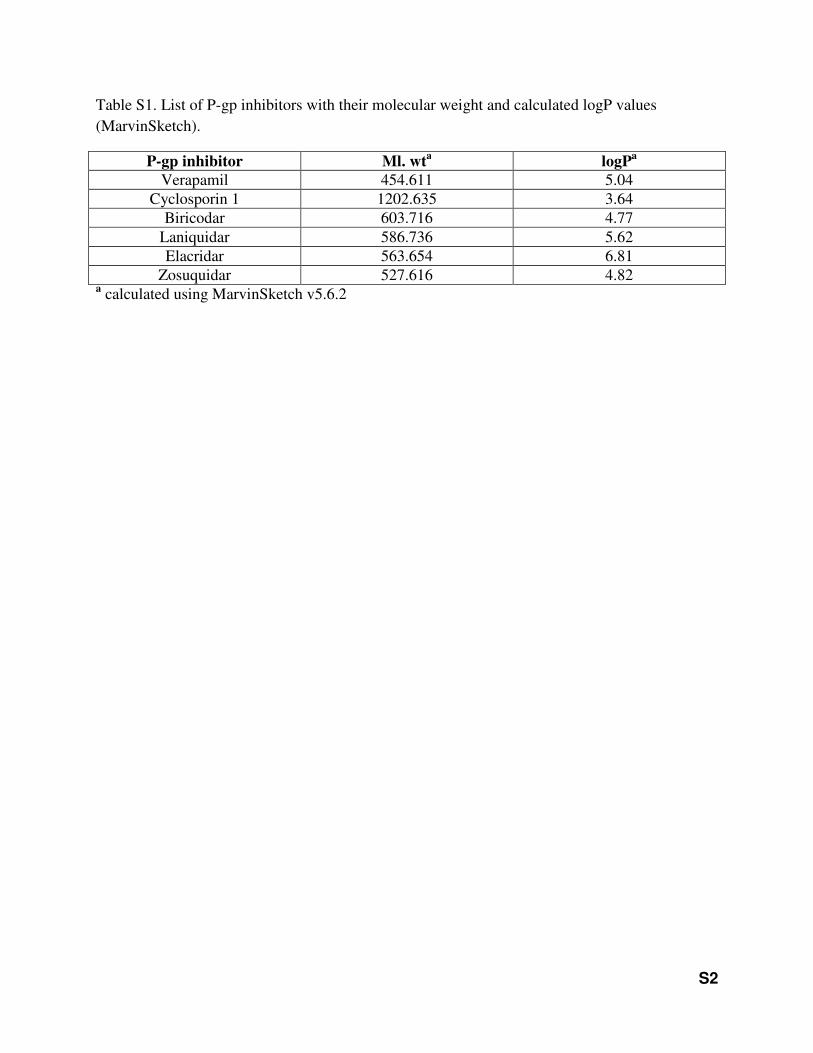
Table S1. List of P-gp inhibitors with their molecular weight and calculated logP values (MarvinSketch).
P-gp inhibitor Ml. wta logP
a
Verapamil 454.611 5.04 Cyclosporin 1 1202.635 3.64
Biricodar 603.716 4.77 Laniquidar 586.736 5.62 Elacridar 563.654 6.81
Zosuquidar 527.616 4.82 a calculated using MarvinSketch v5.6.2

S3
Table S2. RMSF values (Å) of the binding site residues of P-gp with and without inhibitors
during 50 ns MD simulation.
Sl. No Residue RMSF (Å) Apo form of
P-gp or Protein
alone
Verapamil bound P-gp
Piperine bound P-gp
Pip1 bound P-gp
Pip2 bound P-gp
1. Met69 2.19 1.14 1.02 1.29 1.49 2. Phe72 1.48 1.38 1.20 1.51 1.51 3. Tyr307 1.47 1.27 1.13 1.55 0.99 4. Phe336 1.70 1.12 1.26 1.27 1.37 5. Leu339 1.33 1.14 1.45 1.45 1.42 6. Ile340 1.28 1.33 1.11 1.18 1.52 7. Phe343 1.45 1.28 1.27 1.77 1.68 8. Phe728 1.65 1.51 1.00 1.72 1.38 9. Ile868 1.34 1.67 1.60 1.52 1.29 10. Tyr953 1.51 1.18 1.25 1.29 1.83 11. Phe957 1.31 1.54 1.44 1.40 1.76 12. Phe978 1.42 1.33 1.72 1.54 1.82 13. Val981 1.25 1.06 1.19 1.57 2.21 14. Val982 1.44 1.19 1.11 1.46 2.14 15. Phe983 2.10 1.37 1.23 1.87 1.84 16. Ala985 1.48 1.19 1.00 1.78 1.57 17. Met986 1.90 1.80 1.68 2.27 1.62

S4
Table S3. Interaction analysis of initial pose (docked) and final pose (after 50ns MD simulation) of ligands in P-gp.
Note: Residues in black color- interactions were maintained in docked and after 50 ns MD simulation Residues in blue color- Interactions were lost during MD simulation Residues in red color- Interactions were not seen in docked but formed during MD simulation
S. No Compound Interacting residues
(Docked pose)
Interacting residues
(After MD simulation)
1 Verapamil Phe336 (π-π interaction); Met69,
Phe72, Phe336, Leu339, Ile340,
Phe728, Ile868, Tyr953, Phe957,
Phe978, Val981, Val982, Phe983,
Ala985 and Met986 (hydrophobic
interaction)
Met69, Phe72, Phe336, Leu339, Ile340, Phe343,
Phe728, Ile868, Tyr953, Val981, Val982,
Phe983, Ala985 and Met986 (hydrophobic
interaction)
2 Piperine Tyr307 (Hydrogen bond); Met69,
Phe72, Phe336, Leu339, Phe728,
Tyr953, Val982, Phe983 and
Met986 (hydrophobic interaction)
Met69, Phe336, Leu339, Ile340, Phe343,
Phe728, Phe983 and Met986 (hydrophobic
interaction)
3 Pip1 Phe72 and Phe983 (π-π
interaction); Met69, Phe336,
Leu339, Phe728, Tyr953, Phe978,
Val982, Phe983 and Met986
(hydrophobic interaction)
Phe72, Met69, Phe336, Leu339, Ile340, Phe343,
Phe728, Ile868, Tyr953, Val982, Phe983,
Ala985 and Met986 (hydrophobic interaction)
4 Pip2 Met69, Phe336, Leu339, Phe728,
Ile868, Tyr953, Phe957, Phe978,
Val981, Val982, Phe983, Ala985
and Met986 (hydrophobic
interaction)
Met69, Tyr307, Leu339, Ile340, Phe343,
Phe728, Tyr953, Val982 and Phe983
(hydrophobic interaction)

S5
Figure S1: Sequence alignment of C. elegans (PDB ID: 4F4C) and human P-gp used to generate the 3D models of P-gp.

S6
Figure S2: Ramachandran plot of human P-gp homology model
Ramchandran Plot
Human P-gp model
S7
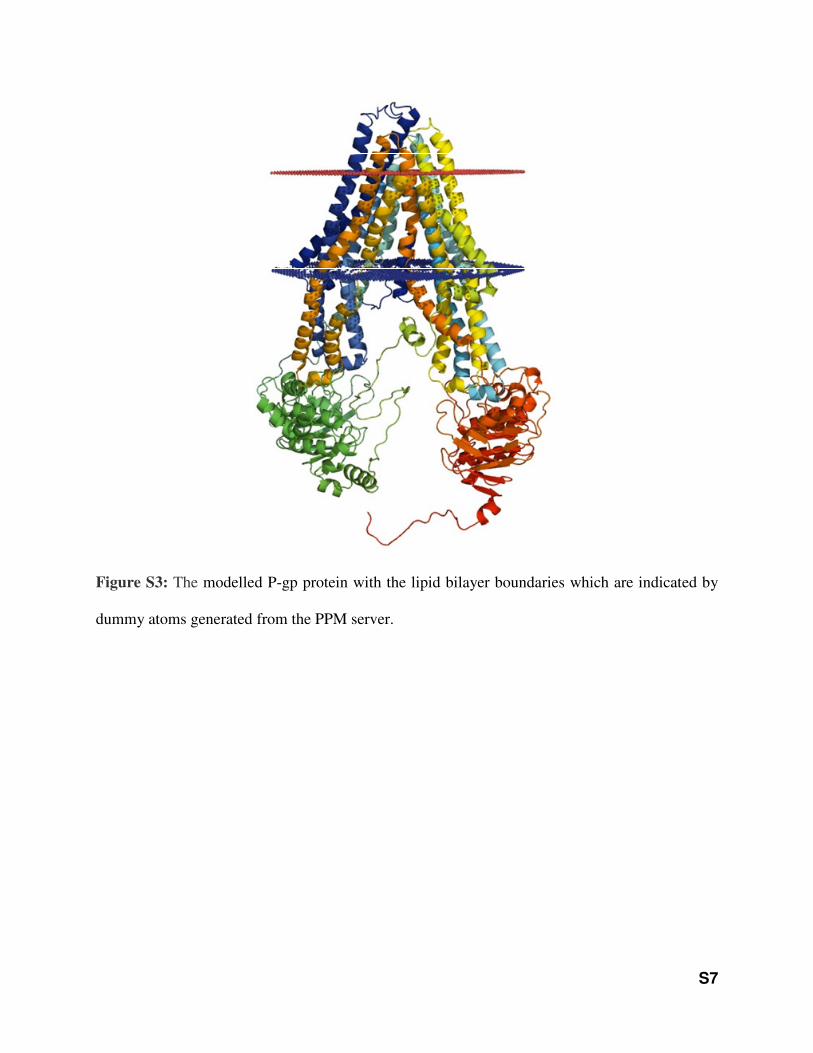
Figure S3: The modelled P-gp protein with the lipid bilayer boundaries which are indicated by
dummy atoms generated from the PPM server.
S8
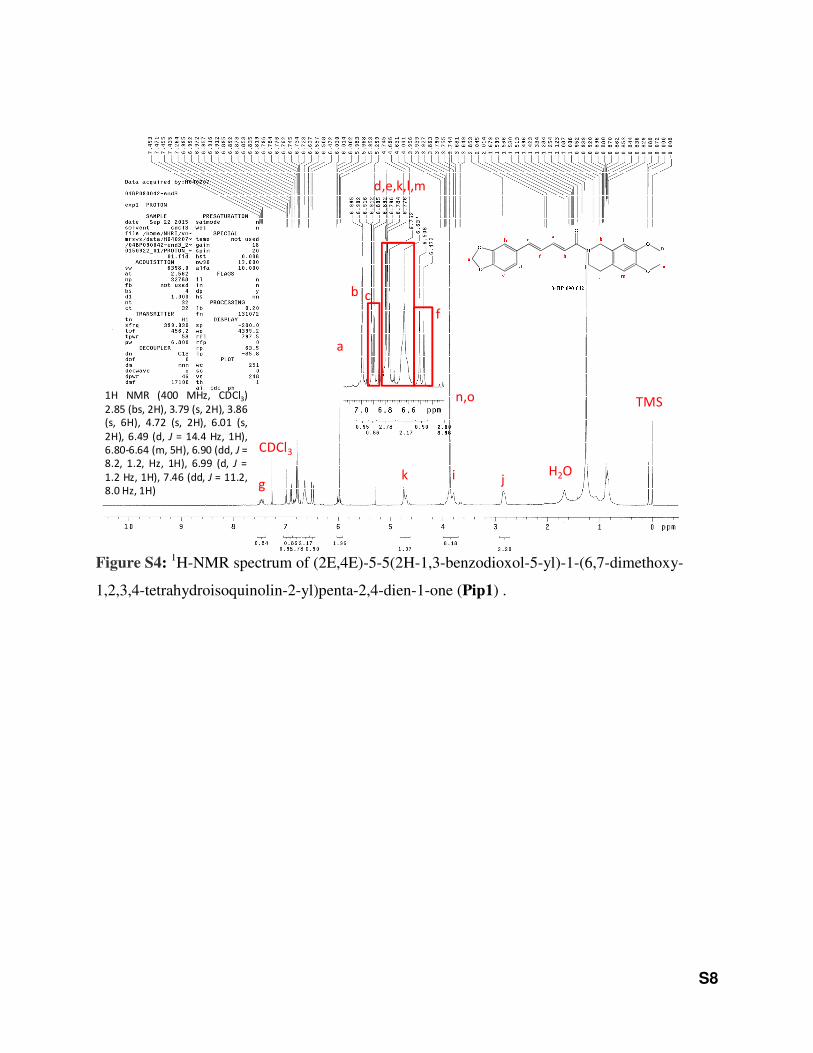
Figure S4: 1H-NMR spectrum of (2E,4E)-5-5(2H-1,3-benzodioxol-5-yl)-1-(6,7-dimethoxy-
1,2,3,4-tetrahydroisoquinolin-2-yl)penta-2,4-dien-1-one (Pip1) .
a
gi jk
n,o1H NMR (400 MHz, CDCl3)
2.85 (bs, 2H), 3.79 (s, 2H), 3.86
(s, 6H), 4.72 (s, 2H), 6.01 (s,
2H), 6.49 (d, J = 14.4 Hz, 1H),
6.80-6.64 (m, 5H), 6.90 (dd, J =
8.2, 1.2, Hz, 1H), 6.99 (d, J =
1.2 Hz, 1H), 7.46 (dd, J = 11.2,
8.0 Hz, 1H)
CDCl3
TMS
H2O
c
f
d,e,k,l,m
b
S9
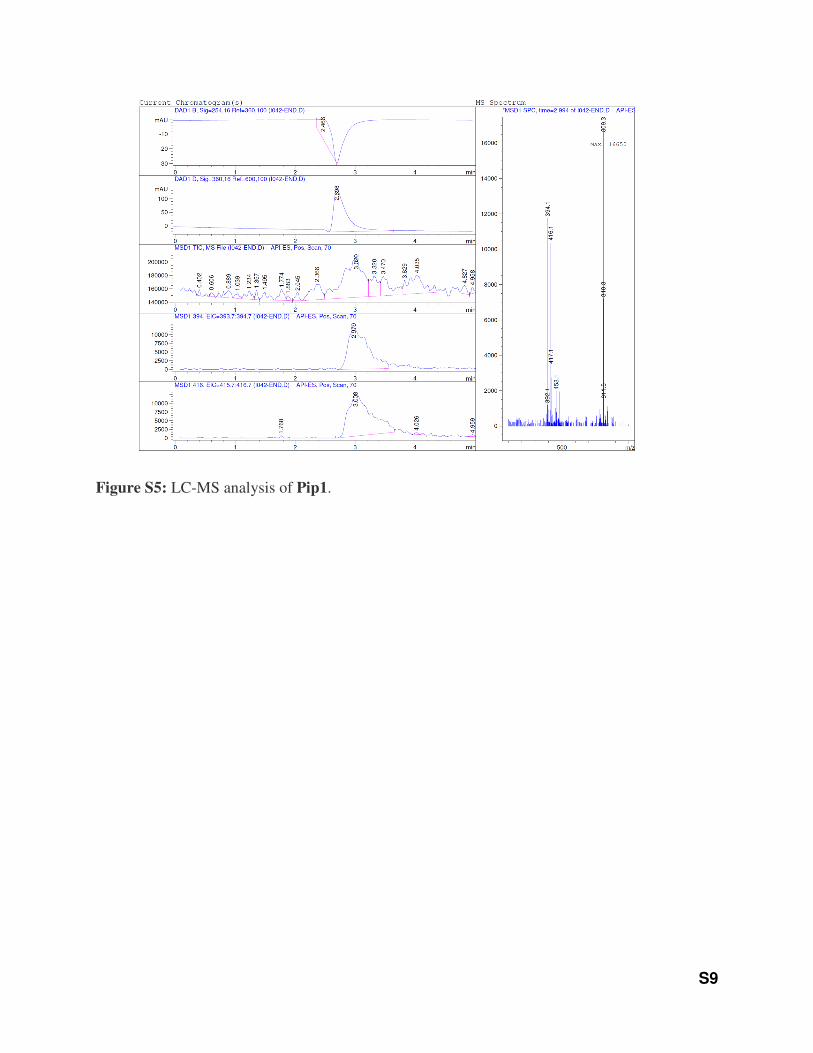
Figure S5: LC-MS analysis of Pip1.
S10
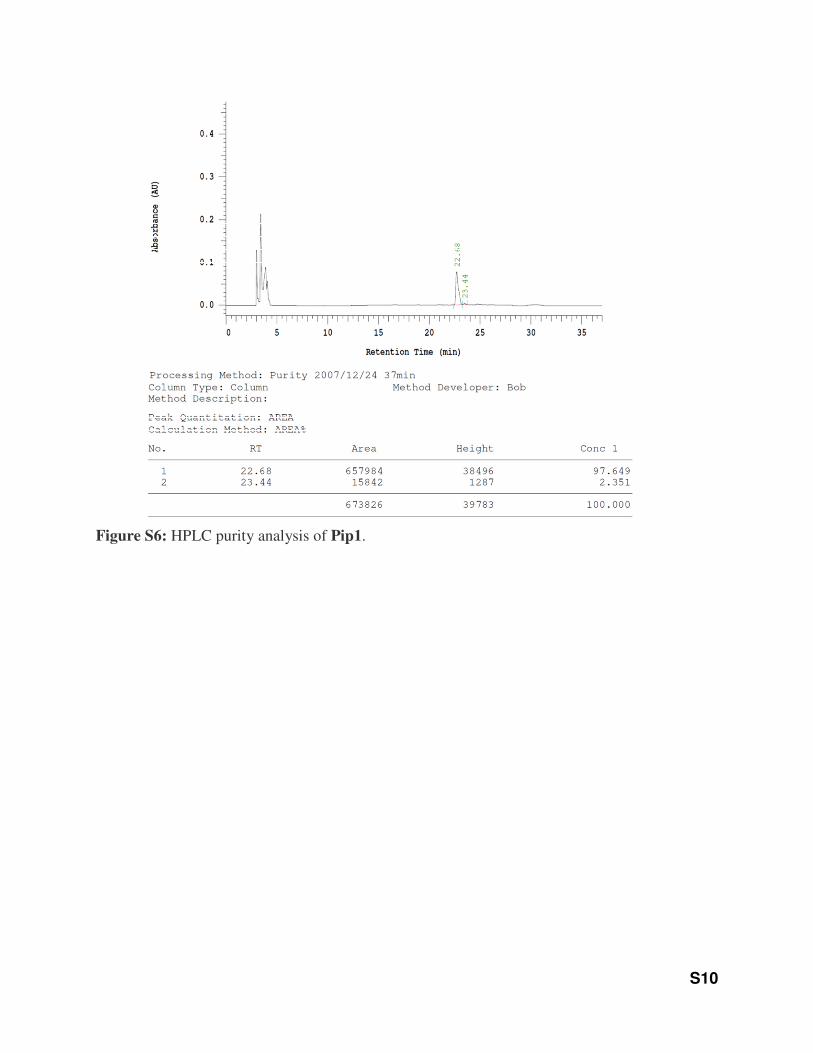
Figure S6: HPLC purity analysis of Pip1.

S11
Figure S7: 1H-NMR spectrum of (2E,4E)-5-(2H-1,3-benzodioxol-5-yl)-N-[2-(3,4-
dimethoxyphenyl)ethyl]penta-2,4-dien-amide (Pip2).
a
c
b
f
gh i j
b,e,k,l,m
n, oNH
1H NMR (400 MHz, CDCl3) 2.82 (t, J =
6.8 Hz, 2H), 3.60 (td, J = 6.8, 6.4 Hz,
2H), 3.87 (s, 6H), 5.48 (br t, 1H NH),
5.84 (d, J = 14.8 Hz, 1H), 5.98 (s, 2H),
6.65 (dd, J = 15.6, 10.8 Hz, 1H), 6.83-
6.74 (m, 5H), 6.89 (d, J = 8 Hz, 1H),
6.97 (s, 1H), 7.53 (dd, J = 14.8, 10.8 Hz,
1H)
CDCl3
TMS
H2O

S12
Figure S8: LC-MS analysis of Pip2.

S13
Figure S9: HPLC purity analysis of Pip2.

S14
Figure S10: IC50 value of (a) vincristine (VCR), (b) colchicine (COL) and (c) paclitaxel (PTX)
alone and in combination with 2 µM each of piperine (Pip), verapamil (Ver), Pip1 or Pip2 in KB
ChR 8-5 cell lines. Error bars represent the mean ± SEM of two or three independent
experiments, each done in triplicates. * p< 0.05, ** p< 0.005 versus control (i.e. VCR/COL/PTX
alone).
a
b c

S15
Figure S11: Percentage cell viability of SW480 (parental) and SW480-VCR (resistant) cells. (a)
cells were treated with vincristine, (b) cells were treated with paclitaxel, and (c) cells were
treated with colchicine. Error bars represent standard error of mean (SEM) of two independent
experiments, each done in triplicates. * p< 0.05, ** p< 0.005, *** p< 0.0005 and **** p <
0.0001.
S16
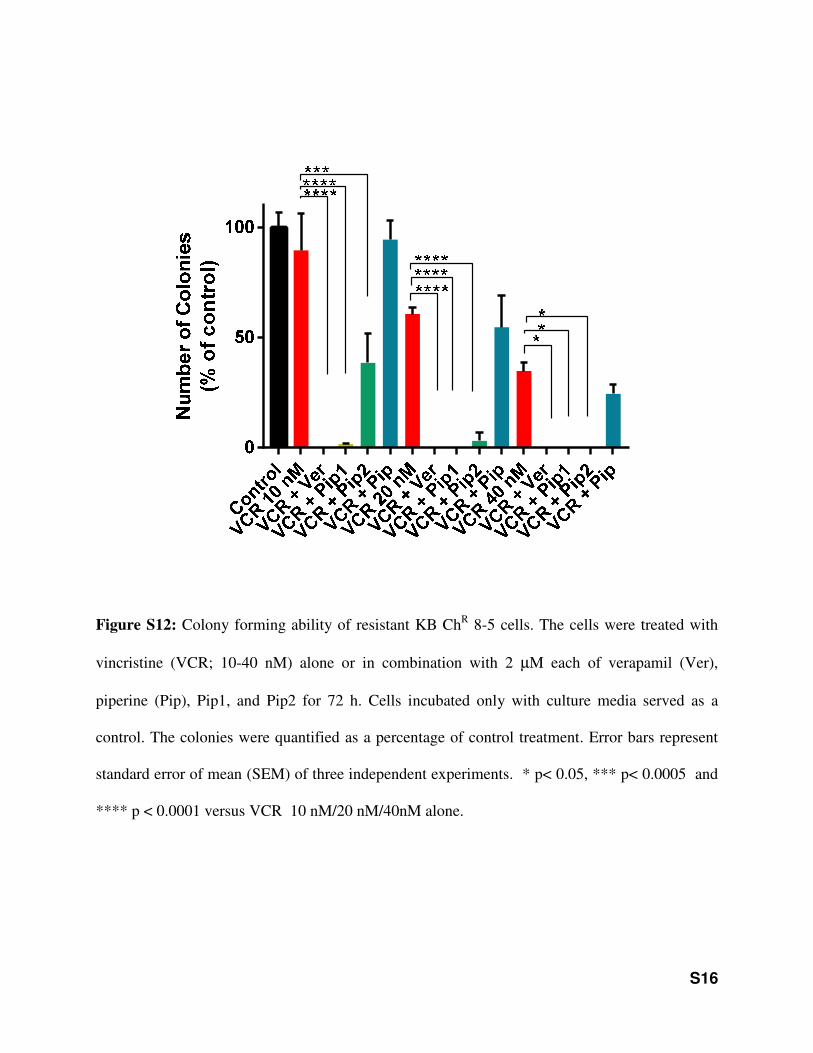
Figure S12: Colony forming ability of resistant KB ChR 8-5 cells. The cells were treated with
vincristine (VCR; 10-40 nM) alone or in combination with 2 µM each of verapamil (Ver),
piperine (Pip), Pip1, and Pip2 for 72 h. Cells incubated only with culture media served as a
control. The colonies were quantified as a percentage of control treatment. Error bars represent
standard error of mean (SEM) of three independent experiments. * p< 0.05, *** p< 0.0005 and
**** p < 0.0001 versus VCR 10 nM/20 nM/40nM alone.

S17
Figure S13: Western blot analysis of P-gp protein in (a) KB 3-1 (parental) and KB ChR8-5
(resistant) cells and (b) SW480 (parental) and SW480-VCR (resistant) cells. The double band of
P-gp in KB ChR 8-5 cells reflects the glycosylation status of the protein. The upper 180 kDa band
corresponds with the mature/fully glycosylated P-gp, whereas the lower 140 kDa band represents
the immature/partially glycosylated P-gp 1.
Gray scale of the original blots of (c) KB parental (KB 3-1), resistant (KB ChR 8-5) and (d)
SW480 parental, resistant (SW480-VCR). Original scanned blots of (e) KB parental (KB 3-1),
resistant (KB ChR 8-5) and (f) SW480 parental, resistant (SW480-VCR).
S18
*Note: Two different gels were run and the proteins were transferred onto two different
membranes. (c) Gray scale of the membrane having KB 3-1 and KB ChR 8-5 proteins and (d)
Gray scale of the membrane having SW480 and SW480-VCR proteins. After the protein was
transferred onto the nitrocellulose membrane, the membrane was cut based on the molecular
weight of the protein ladder (Himedia-MBT092 or precision plus protein-1610374) and
incubated with the corresponding primary antibodies. Later, the membrane was incubated with
the HRP-conjugated secondary antibody. Finally, the bands were visualized with HRP substrate,
3,3’,5,5’-tetramethylbenzidine (TMB)/H2O2. The membranes were scanned and saved as an
image (e and f). The images were converted to gray scale and cropped to show the desired
proteins, P-gp and tubulin of both, KB parental and resistant (Lane 5 and Lane 6) are displayed
in Fig. S13 (a) and P-gp and tubulin of both SW480 parental and resistant (Lane 3 and Lane 4)
are displayed in Fig. S13 (b).

S19
Figure S14: Quantification of Rho123 fluorescence in (a) parental KB 3-1 and resistant KB ChR
8-5 cells and (b) parental SW480 and resistant SW480-VCR cells using ImageJ. The corrected
total cell fluorescence (CTCF) was calculated using the formula: integrated density − (area of
selected cell × mean fluorescence of background readings). The analysis was performed on at
least 25 cells, n = 2.
0
5000
10000
15000
20000
25000
30000
35000
wild (KB 3-1)
KB ChR 8-5 (Control)
Verapamil Pip1 Pip2 Piperine
CT
CF
0
5000
10000
15000
20000
25000
30000
35000
wild (SW480)
SW480-VCR (Control)
Verapamil Pip1 Pip2 Piperine
CT
CF
a ba b

S20
Figure S15: Cytotoxicity of Pip1, Pip2, piperine, and verapamil on non-cancer human
embryonic kidney cells (HEK 293) at 4 µM concentration. Error bars represent the mean ± SEM
of three independent experiments, each done in triplicates.
References
1 Loo, T. W. & Clarke, D. M. Superfolding of the partially unfolded core-
glycosylatedintermediate of human P-glycoprotein into the mature enzyme is promoted
by substrate-induced transmembrane domain interactions. J Biol Chem 273, 14671-14674
(1998).
0
20
40
60
80
100
Control Pip1 Pip2 Piperine Verapamil
% C
ell V
iab
ility


