TAGGING AT MARY RIVER
AND TINANA CREEK BARRAGES 1989-‐2013

2
TAGGING AT MARY RIVER AND TINANA CREEK BARRAGES 1989-‐2013 REPORT This report has been prepared by Infofish Australia for the Maryborough Sportfishing Club – March 2014. SCOPE This report examines data available for tagging at the Mary River and Tinana Creek barrages from 1989-‐2013:
! Tagging and recaptures of fish tagged at the barrages ! Tagging effort ! Movement of fish tagged
DATA SOURCE Tagging and recapture records from 1989-‐2013 maintained in the Suntag database at http://qld.info-‐fish.net. Access to the database is limited to authorised users. AREA MONITORED Locations of the barrages where fish were tagged are shown using grids on Suntag grid map as shown in figure 1:
! Mary River (MRM)
Figure 1: Suntag grid map covering Mary River (Mary barrage red at grid C24 and Tinana barrage
purple at grid M22)

3
BACKGROUND The Maryborough Sportfishing Club has had a Fisheries Permit to tag fish at the Mary River and Tinana Creek barrages since 1989. The current permit expired at the end of 2013. Infofish Services (now Infofish Australia) produced a report titled “Tagging at Mary River and Tinana Creek Barrages” in 2000.1 This report provides an update on the tagging since then. SOME OBSERVATIONS Based on the data collected on tagging at the Mary and Tinana barrages from 1989-‐2013 the following observations are made:
! From 1989-‐2013 there were 4,520 fish tagged at the barrages for 418 (9.2%) recaptures. Of those 85.6% were tagged at the Mary barrage and 14.4% at the Tinana barrage.
! Barramundi was the most tagged species with 2,445 fish tagged and 321 (13.1%) recaptured.
! Australian Bass was the second most tagged species with 1,291 fish tagged and 69 (5.4%) recaptured.
! There were 4 other key species tagged being Dusky Flathead, Yellowfin Bream, King Threadfin ad Mangrove Jack.
! Both fish tagged and Barramundi tagged per tagger per day have fluctuated but mostly increased each 5 year period and peaked from 2005-‐2010 at 5.0 fish and 3.8 Barramundi per fisher per day.
! Most Barramundi tagged were in the size range 300-‐800mm while most Bass were from 250-‐450mm.
! Of 303 Barramundi recaptured where distance moved could be calculated 4 (1.3%) were recaptured outside the river system to the north in Sandy Straits and Hervey Bay with no fish being recaptured above the barrages.
! Of 47 Bass tagged at the Mary Barrage and recaptured where distance moved could be calculated 5 fish tagged were recaptured upstream as far as Yabba Creek at Imbil 180km upstream.
! Of 22 Bass tagged at the Tinana barrage there were 20 (90.9%) recaptured upstream from the Barrage as far as Teddington Weir 14km upstream. Many of the Bass released at the Tinana barrage were released on the upstream side of the barrage.
! Of the Bass tagged at Mary barrage 13 were recaptured downstream with 9 fish recaptured at the Tinana barrage.
! Of the other species tagged there were 15 (4.7%) Dusky Flathead recaptured, 1 Yellowfin Bream (0.8%), 9 King Threadfin (3.9%) and 2 Mangrove Jack (6.5%) recaptured.
! Of the other species recaptured 1 Flathead (Dayman Point), 1 Yellowfin Bream (Boonooroo Point) and 1 Mangrove Jack (Rooney Point) were recaptured outside the river system.
1 Report available from www.info-‐fish.net
4
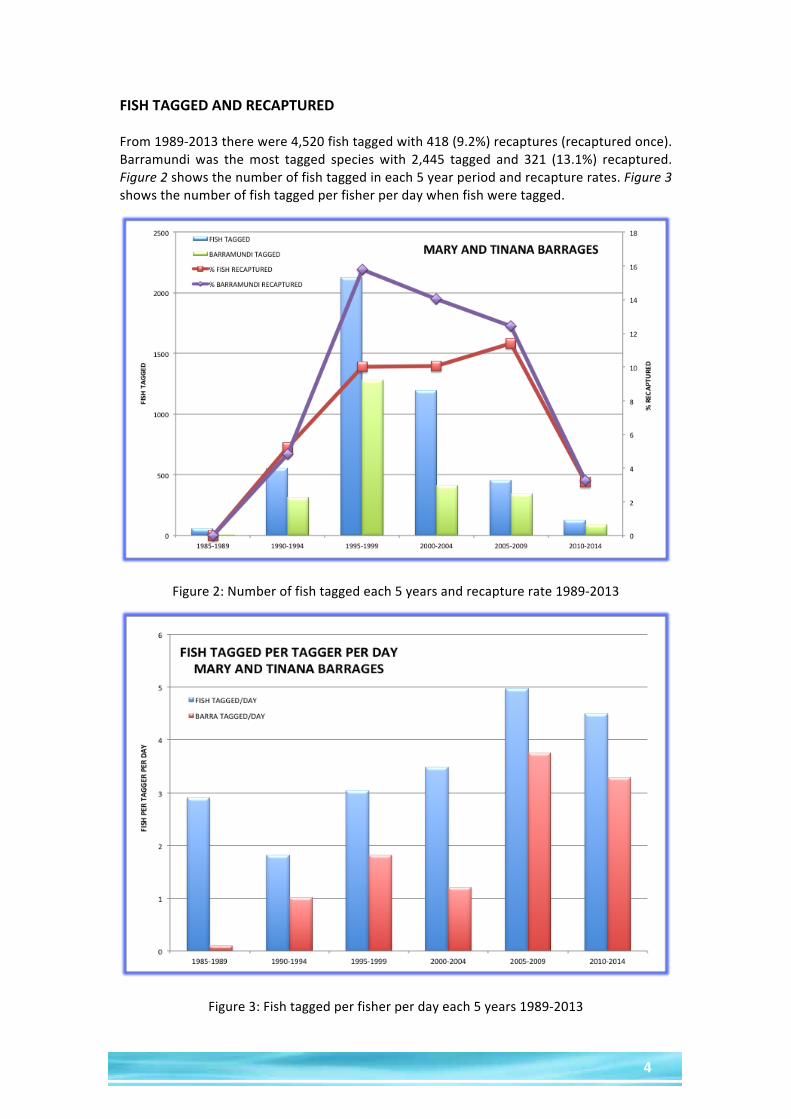
FISH TAGGED AND RECAPTURED From 1989-‐2013 there were 4,520 fish tagged with 418 (9.2%) recaptures (recaptured once). Barramundi was the most tagged species with 2,445 tagged and 321 (13.1%) recaptured. Figure 2 shows the number of fish tagged in each 5 year period and recapture rates. Figure 3 shows the number of fish tagged per fisher per day when fish were tagged.
Figure 2: Number of fish tagged each 5 years and recapture rate 1989-‐2013
Figure 3: Fish tagged per fisher per day each 5 years 1989-‐2013

5
SPECIES TAGGED AND RECAPTURED Figure 4 shows the number of each species tagged from 1989-‐2013 at the barrages and the recapture rates. Barramundi were the most tagged species with 2,445 (54.1%) and Bass were the second most tagged species with 1,291 (28.6%). These 2 species accounted for 82.7% of the fish tagged. A total of 85.6% of fish were tagged at the Mary barrage and 14.4% at the Tinana barrage. Figure 5 shows the numbers of fish tagged at each barrage.
Figure 4: Species tagged and recapture rates 1989-‐2013
Figure 5: Species tagged at each barrage 1989-‐2013

6
BARRAMUNDI AND AUSTRALIAN BASS Figures 6 shows the length of all Barramundi and Bass tagged over time from 1990-‐2013. The peak tagging activity was from 1995-‐2004. Most Barramundi tagged were in the size range 300-‐800mm while most Bass were from 250-‐450mm.
Figure 6: Timeline of lengths of Barramundi and Bass tagged 1990-‐2013
BARRAMUNDI MOVEMENT
Figure 7: Movement of Barramundi tagged at Mary and Tinana barrages 1989-‐2013

7
There were 321 recaptures of Barramundi tagged at the barrages up to 7 years after tagging. Of these there were 303 recaptures where the distance moved between tagging and recapture could be calculated. Figure 7 shows the distance moved for Barramundi tagged at the Mary and Tinana barrages and the time between tagging and recapture. All fish were recaptured below the barrages in the river and beyond. Figure 8 shows the locations where Barramundi were recaptured. There were 4 (1.3%) recaptures outside the river system. These fish were all caught to the north in Sandy Straits and Hervey Bay. The furthest distance moved was for a fish recaptured at Moon Point, 85km from the Mary barrage.
Figure 8: Locations where Barramundi recaptured 1989-‐2013
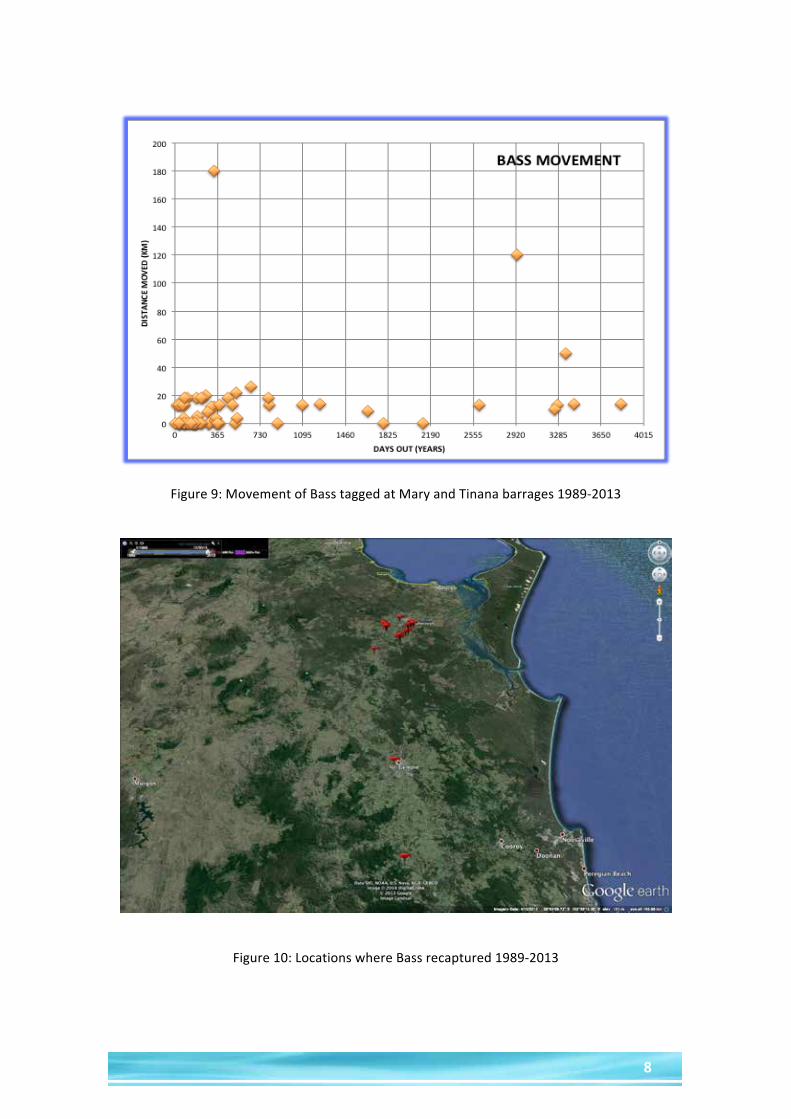
BASS MOVEMENT There were 69 recaptures of Barramundi tagged at the barrages up to 10 years after tagging. Of these there were 69 recaptures where the distance moved between tagging and recapture could be calculated. Of those 47 recaptures were for fish tagged at the Mary barrage and 22 at the Tinana barrage. Figure 9 shows the distance moved for Bass tagged at the barrages. Figure 10 shows the locations where Bass were recaptured. For Bass tagged at the Mary barrage there were 5 fish recaptured in the river system above the Barrage. The furthest distance upstream was 180km for a fish recaptured in Yabba Creek at Imbil. There were also 9 fish tagged at the Mary barrage that were recaptured at the Tinana barrage and 1 fish recaptured upstream from the Tinana barrage. For Bass tagged at the Tinana barrage there were 20 recaptures of fish in Tinana Creek as far upstream as Teddington Weir (14km). Many of the Bass tagged at the Tinana Barrage were released above the barrage.
8
Figure 9: Movement of Bass tagged at Mary and Tinana barrages 1989-‐2013
Figure 10: Locations where Bass recaptured 1989-‐2013

9
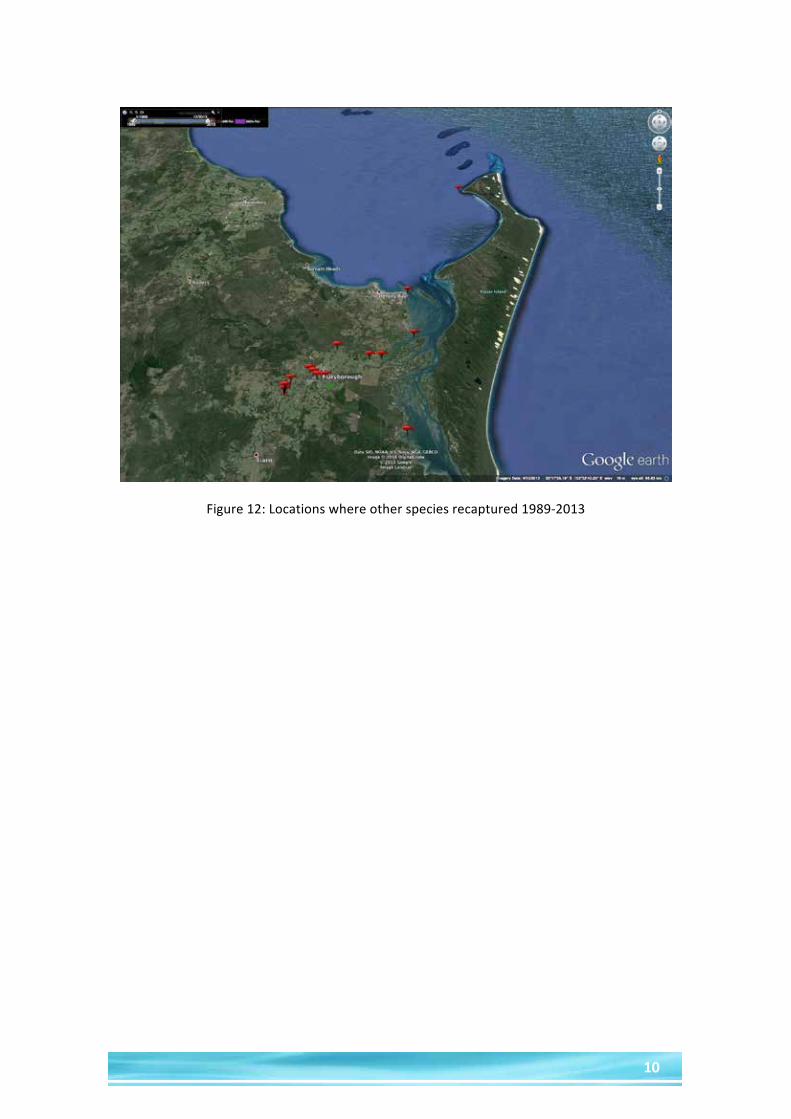
OTHER SPECIES MOVEMENT There were 4 other species tagged at the Mary barrage where fish have been recaptured elsewhere within 4 years of being tagged. There were no other species tagged at Tinana barrage that were recaptured. These were Dusky Flathead, Yellowfin Bream, King Threadfin and Mangrove jack. Figure 11 shows the movement of these fish away from where tagged. Figure 12 shows the locations where other species were recaptured. Of the 15 Dusky Flathead recaptures (4.7%) only 1 was recaptured outside the river system, this being a fish recaptured at Dayman Point at Hervey Bay, 75km from where tagged at the Mary barrage. Of the Yellowfin Bream tagged there was only 1 recapture (0.8%) and that was a fish recaptured at Boonooroo Point in Sandy Straits having travelled 95km down river then south. Of the King Threadfin tagged there were 9 recaptures (3.9%) with all fish being recaptured in the river system. Of the Mangrove jack tagged there were 2 recaptures (6.5%). One was in the river system and the other was at Rooney Point on Fraser Island 180km from where tagged at the Mary barrage.
Figure 11: Movement of other species tagged at Mary barrage 1989-‐2013
10
Figure 12: Locations where other species recaptured 1989-‐2013


