
Cenovus Energy Inc. - i - Supplemental Information Request Pelican Lake Grand Rapids Project February 2013
TABLE OF CONTENTS
1 PREAMBLE TO PELICAN LAKE GRAND RAPIDS PROJECT ROUND 1 SIRS...................... 1 1.1 PURPOSE OF SUBSURFACE PREAMBLE ................................................................... 1 1.2 EARTH MODEL ............................................................................................................... 2 1.3 GRAND RAPIDS ‘A’ AQUIFER SIMULATION MODEL ................................................ 12
1.3.1 Lean Zone Water Production and Air Displacement at Start-up (2 years) ............................................................................................................. 18
1.3.2 SAGD Operation (2 to 13 years) .................................................................... 22 1.3.3 Air Injection at Abandonment ......................................................................... 24
1.4 SAGD STRATEGY AND PERFORMANCE IN THE GRAND RAPIDS ‘A’ .................... 29 1.4.1 SAGD Models ................................................................................................ 29 1.4.2 SAGD Operations and Typical SAGD Performance ...................................... 33 1.4.3 SAGD Simulation Results .............................................................................. 45
1.5 UPDATE TO THE ENVIRONMENTAL IMPACT ASSESSMENT ................................. 51 1.5.1 Air Emissions Effects ..................................................................................... 51 1.5.2 Hydrology ....................................................................................................... 52 1.5.3 Terrain and Soils ............................................................................................ 53 1.5.4 Terrestrial Vegetation, Wetlands and Forest Resources ............................... 55 1.5.5 Wildlife ............................................................................................................ 59 1.5.6 Biodiversity ..................................................................................................... 63 1.5.7 Conservation and Reclamation ...................................................................... 69
1.6 REFERENCES .............................................................................................................. 70
LIST OF TABLES
Preamble Table 1 SAGD Performance Predictions With and Without Lean Zone Water Displacement ................................................................................................ 45
Preamble Table 2 Estimated Changes in the Area of Surface Disturbance within the Sub-basins .................................................................................................... 52
Preamble Table 3 Terrain Unit Comparison Between the 2011 EIA Footprint and the 2013 Revised Footprint ................................................................................. 54
Preamble Table 4 Soil Map Unit Comparison Between the 2011 EIA Footprint and the 2013 Revised Footprint ................................................................................. 55
Preamble Table 5 Differences in Vegetation Type Areas Between the 2011 EIA Footprint and the 2013 Revised Footprint .................................................... 56
Preamble Table 6 Differences in Area of Old Growth Between the 2011 EIA Footprint and the 2013 Revised Footprint .................................................................... 59
Preamble Table 7 Changes in Woodland Caribou High Value Habitat Suitability Index (HSI) at the Local Study Area Scale ............................................................. 60
Preamble Table 8 Changes in Canada Warbler High Value Habitat Suitability Index (HSI) at the Local Study Area Scale ............................................................. 60
Preamble Table 9 Changes in Rusty Blackbird High Value Habitat Suitability Index (HSI) at the Local Study Area Scale ............................................................. 61
Preamble Table 10 Changes in Western Toad High Value Habitat Suitability Index (HSI) at the Local Study Area Scale ....................................................................... 62
Preamble Table 11 Changes in Yellow Rail High Value Habitat Suitability Index (HSI) at the Local Study Area Scale ........................................................................... 62
Preamble Table 12 Fisher/Marten and Moose Habitat Variables Included in Local Study Area Scale Resource Selection Function ..................................................... 63
Preamble Table 13 Fisher/Marten and Moose Habitat Variables Included in Regional Study Area Scale Resource Selection Function ........................................... 63
Cenovus Energy Inc. - ii - Supplemental Information Request Pelican Lake Grand Rapids Project February 2013 Preamble Table 14 Comparison of Change in Biodiversity Potential Categories in the
Local Study Area Between Original and Revised Project Footprint ............. 65 Preamble Table 15 Comparison of Change in High Biodiversity Potential Old Growth in
the Local Study Area Between Original and Revised Project Footprint ........................................................................................................ 67
Preamble Table 16 Comparison of Change in Cover Categories in the Local Study Area Between Original and Revised Project Footprint .......................................... 68
Preamble Table 17 Comparison of Change in Natural, Disturbed, Forested and Non-Forested Areas in the Local Study Area Between Original and Revised Project Footprint .............................................................................. 68
Preamble Table 18 Project Components and Disturbance Areas: 2011 Application and Revised Footprint .......................................................................................... 69
LIST OF FIGURES
Preamble Figure 1 SAGD Pay ....................................................................................................... 3 Preamble Figure 2 Lean Zone Isopach Map ................................................................................. 4 Preamble Figure 3 Grand Rapids ‘A’ Regional X-Section ............................................................. 5 Preamble Figure 4 Grand Rapids ‘A’ Regional X-Section ............................................................. 6 Preamble Figure 5 Grand Rapids ‘A’ Regional Schematic ............................................................ 7 Preamble Figure 6 5-11-82-23W4 Core Data ................................................................................ 8 Preamble Figure 7 SAGD Pay Isopach & Earth Model Boundary ................................................. 9 Preamble Figure 8 Earth Model PHI*H*So Map .......................................................................... 11 Preamble Figure 9 Grand Rapids ‘A’ Aquifer Simulation Model .................................................. 13 Preamble Figure 10 Grand Rapids ‘A’ Aquifer Model Initial Pressure ........................................... 14 Preamble Figure 11 Grand Rapids ‘A’ Aquifer West-East Slice Initial Oil Saturation ................... 15 Preamble Figure 12 Grand Rapids ‘A’ Aquifer North-South Slice Initial Oil Saturation ................. 16 Preamble Figure 13 Aquifer Model IDA Lean Zone Air Injection and Water Producers ............... 17 Preamble Figure 14 Aquifer Model Gas Saturation - 2 Years after Startup .................................. 19 Preamble Figure 15 Aquifer Model Pressure - 2 Years after Startup ............................................ 20 Preamble Figure 16 Aquifer Model Change in Pressure 2 Years after Startup ............................ 21 Preamble Figure 17 Aquifer Model Change in Pressure after SAGD Operations Cease ............. 23 Preamble Figure 18 Aquifer Model West-East Slice Temperature after SAGD ............................ 25 Preamble Figure 19 Aquifer Model Pressure Change without Air Injection after SAGD ............... 26 Preamble Figure 20 Aquifer Model Pressure Change With Air Injection after SAGD ................... 27 Preamble Figure 21 Aquifer Model Average Reservoir Pressure and Injected Gas
Volumes ........................................................................................................ 28 Preamble Figure 22 Earth Model PHI*H*So with SAGD Models .................................................. 31 Preamble Figure 23 Grand Rapids ‘A’ Earth Model Equivalent Net Pay ....................................... 32 Preamble Figure 24 Typical SAGD Operations Startup and SAGD Mode .................................... 35 Preamble Figure 25 Pad#29A North-South along Wellpair Permeability ...................................... 36 Preamble Figure 26 Typical SAGD Well Pair Operations Pad#29A ............................................. 37 Preamble Figure 27 Typical SAGD Well Pair Operations Pad#29A ............................................. 38 Preamble Figure 28 SAGD Model Pad#29A Initial Oil Saturation ................................................. 39 Preamble Figure 29 SAGD Model Pad#12 Initial Oil Saturation - Row 16 .................................... 40 Preamble Figure 30 SAGD Model Pad#29A Oil Saturation after 3 months - Row 16 ................... 41 Preamble Figure 31 SAGD Model Pad #29A Temperature - Lean Zone Breakthrough
After Circulation............................................................................................. 42 Preamble Figure 32 SAGD Model Pad#29A Temperature - After 10 Months ............................... 43 Preamble Figure 33 SAGD Model Pad#29A Temperature - After 22 Months ............................... 44 Preamble Figure 34 Simulation Type Curves Oil Rate .................................................................. 46 Preamble Figure 35 Simulation Type Curves Steam Rate ............................................................ 47

Cenovus Energy Inc. - iii - Supplemental Information Request Pelican Lake Grand Rapids Project February 2013 Preamble Figure 36 CSOR ............................................................................................................ 48 Preamble Figure 37 Peak Oil - 3 Month Ave (m3/d) ...................................................................... 49 Preamble Figure 38 3 Year SAGD Oil Rate (m3/d) ....................................................................... 50
Cenovus Energy Inc. - 1 - Supplemental Information Request Pelican Lake Grand Rapids Project February 2013
1 PREAMBLE TO PELICAN LAKE GRAND RAPIDS PROJECT ROUND 1 SIRS
1.1 PURPOSE OF SUBSURFACE PREAMBLE
The Subsurface Preamble provides background information, as it relates to changes in strategy since the original application and to assist in review of the Supplemental Information Request (SIR) responses. Two key areas of the Subsurface Preamble are the revised lean zone displacement strategy and Steam-Assisted Gravity Drainage (SAGD) operation, which are discussed below.
Impact of SAGD operations on the Grand Rapids ‘A’ Aquifer
Cenovus has refined its lean zone displacement strategy. In the original application, four water production wells supported by two steam injection wells were proposed to provide water for startup operations and to displace lean zone water. Three lean zone producers and two lean zone air injectors are now proposed. By using air rather than steam, less water is required with similar SAGD performance.
SIR questions which reference the four lean zone water production wells are SIR 67, SIR 84, SIR 87 and SIR 193; the change in strategy is reflected in these responses. It was not necessary to rerun the hydrogeological model for the revised lean zone displacement strategy since the model simulations were already conservative for the following reasons:
• the model does not account for air injection which will maintain the original lean zone pressure; and
• the estimated water withdrawal rates for the revised lean zone displacement strategy are 3,000 m3/day for 2 years - in the model the water withdrawal rate was assumed to be 2,400 m3/day for 4 years.
SAGD Strategy and Performance in the Grand Rapids ‘A’
Thickness and saturations in the lean, transition and rich pay zones within the Grand Rapids ‘A’ control the variability in SAGD performance. At a macroscopic scale (field and pad), the porosity, permeability and average oil saturations are very predictable. At the well pair scale, variations in oil saturations are predictable but difficult to position within the rich pay and transition intervals.
Cenovus Energy Inc. - 2 - Supplemental Information Request Pelican Lake Grand Rapids Project February 2013
1.2 EARTH MODEL
The Grand Rapids ‘A’ oilsands deposit in Pelican Lake is best described as a bitumen plug within the Grand Rapids ‘A’ Aquifer (Preamble Figure 1). The distribution of the lean zone is illustrated in Preamble Figure 2. The lean zone is present throughout the area and varies in thickness between 1 m and 5 m. Two regional cross sections are provided in Preamble Figures 3 and 4 where it is evident that the lean zone coalesces with the bottom water.
The schematic of the regional Grand Rapids ‘A’ (Preamble Figure 5) illustrates the variability in the Grand Rapids:
• The area defined as thick SAGD pay in the schematic (panel 3), is characterized by a lean zone thickness varying between 1 m and 5 m. The lean zone is defined as that interval between the top of the Grand Rapids ‘A’ and the first consistent occurrence of oil saturations that exceed 40%. Immediately below the lean zone is the transition zone. This typically varies in thickness between 0 and 8 m; it is defined as that interval from the base of the lean zone to the first consistent occurrence of oil saturations that exceed 50%. The rich pay zone is defined as that interval from the base of the transition zone to the base of the SAGD. The base of SAGD is defined by the loss of reservoir (porosity <30%) or by the introduction of bottom water (So <40%). The rich pay zone varies between 10 m and 20 m thickness. The lean zone, transition zone and rich pay zone are highlighted by core data from 5-11-82-23 W4M and illustrated in Preamble Figure 6.
• The area defined as thin SAGD pay with bottom water in the schematic (panel 2 and 4) is characterized by reduced pay thickness and the presence of bottom water. SIR 36 provides the list of the 124 scheduled pads; of these, 10 are thin SAGD pay with bottom water. The majority of the remaining 74 pads identified within the Project Area are thin SAGD pay with bottom water, as they are on the flanks of the structural crest.
• Off the crest, the Grand Rapids ‘A’ is saturated with water.
The earth model for the Grand Rapids ‘A’ member is constructed over an area of approximately 580 km2 and outlined in purple in Preamble Figure 7.
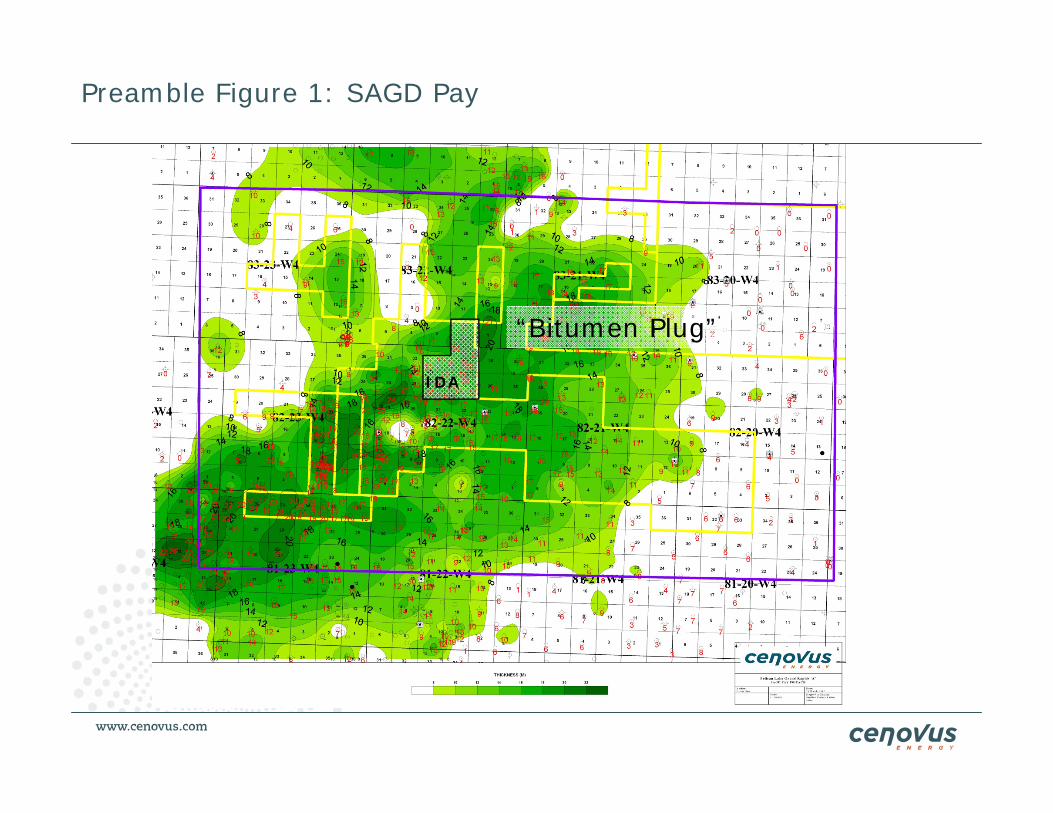
Preamble Figure 1: SAGD Pay
IDA
“Bitumen Plug”
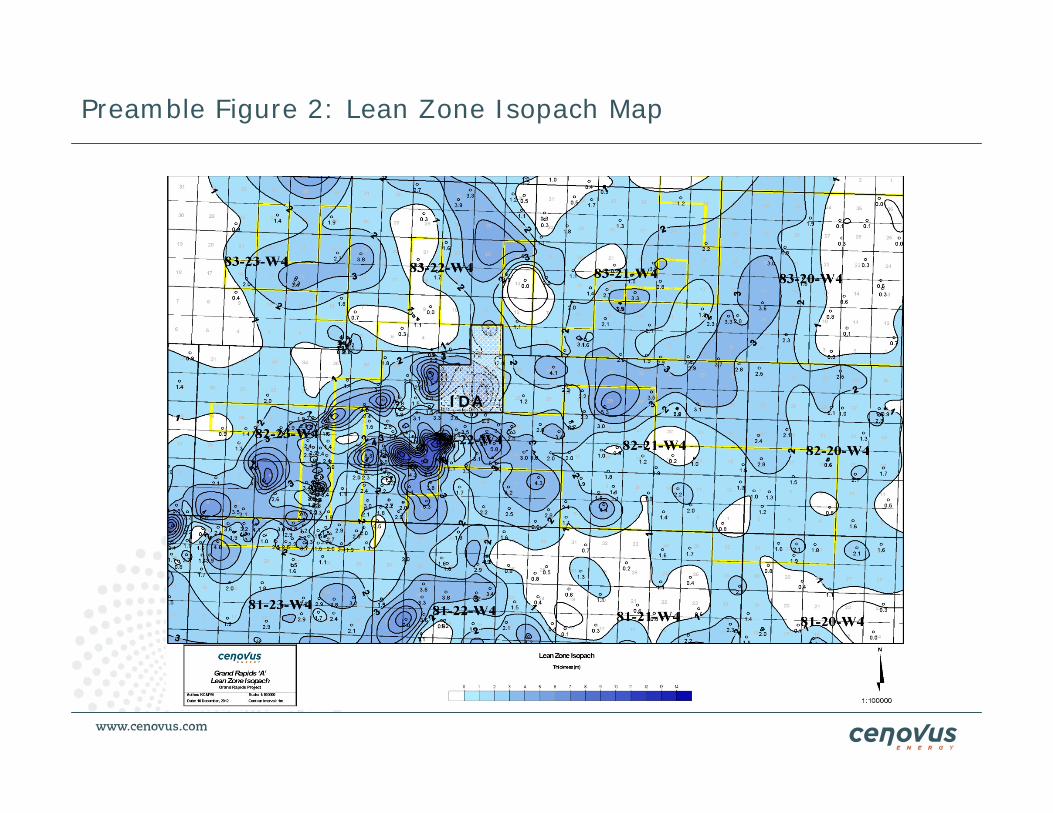
Preamble Figure 2: Lean Zone Isopach Map
IDA
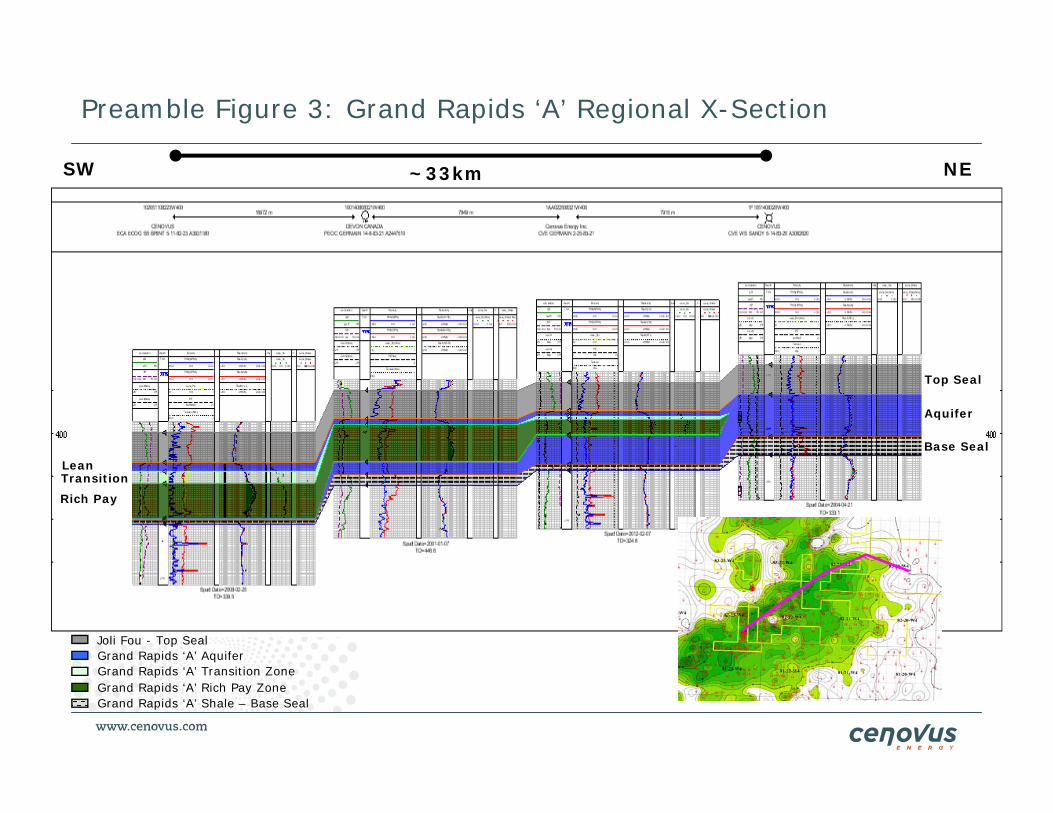
Preamble Figure 3: Grand Rapids ‘A’ Regional X-Section
SW NE
Top Seal
Base Seal
Joli Fou - Top SealGrand Rapids ‘A’ AquiferGrand Rapids ‘A’ Transition ZoneGrand Rapids ‘A’ Rich Pay ZoneGrand Rapids ‘A’ Shale – Base Seal
Aquifer
Rich PayTransition
~33km
Lean
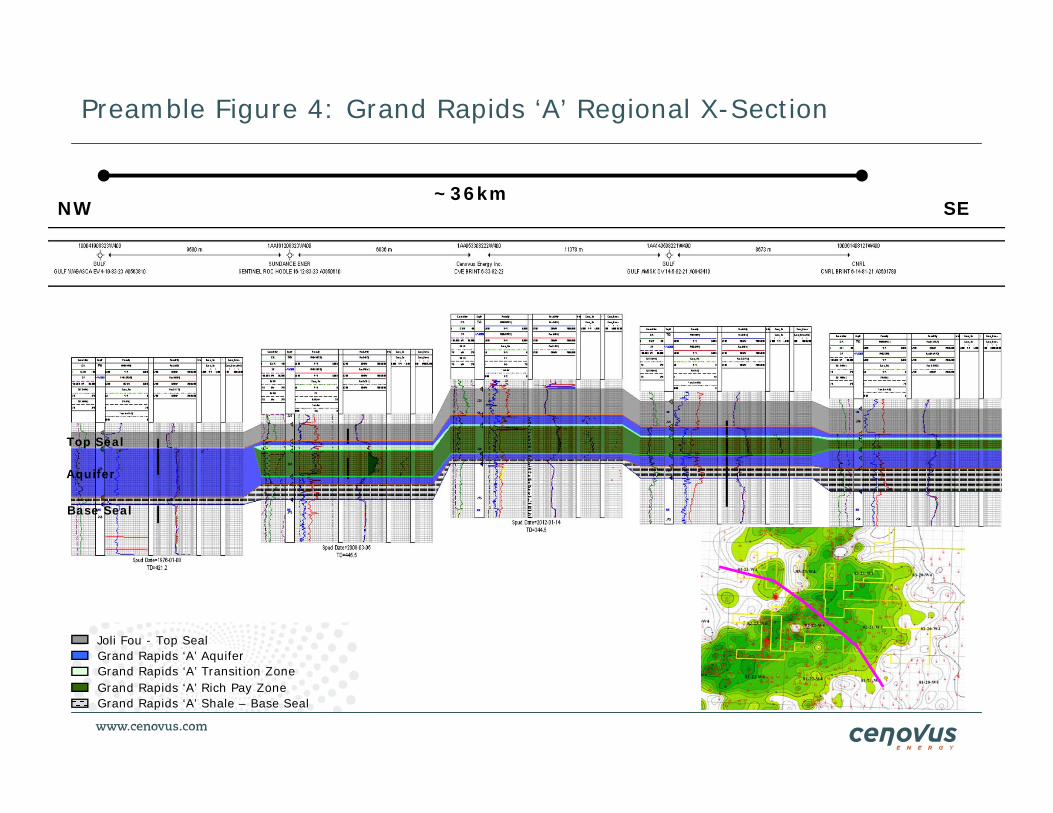
Preamble Figure 4: Grand Rapids ‘A’ Regional X-Section
NW SE
Top Seal
Base Seal
Joli Fou - Top SealGrand Rapids ‘A’ AquiferGrand Rapids ‘A’ Transition ZoneGrand Rapids ‘A’ Rich Pay ZoneGrand Rapids ‘A’ Shale – Base Seal
Aquifer
~36km

Preamble Figure 5: Grand Rapids ‘A’ Regional Schematic
THICK SAGD PAY
THIN SAGD PAY WITH BOTTOM
WATERWATER
SATURATED
RICH PAY
LEAN ZONE
TRANSITION ZONE
Pebble Facies
BOTTOM WATER
JOLI FOU SHALE
GDPD ‘A’ SHALE

Preamble Figure 6: 5-11-82-23W4 Core Data
220
225
230
235
240
245
250
0.0 0.1 0.2 0.3 0.4 0.5 0.6 0.7 0.8 0.9 1.0Porosity & Oil Saturation
Dep
th
Soil Porosity
Lean
Transition
Rich
Base SAGD
GDPD A
SA
GD

Preamble Figure 7: SAGD Pay Isopach & Earth Model Boundary
IDA 12 Pads
3-LZ Prd
2-LZ Air Inj

Cenovus Energy Inc. - 10 - Supplemental Information Request Pelican Lake Grand Rapids Project February 2013
The Grand Rapids ‘A’ earth model was generated in Schlumberger’s PetrelTM software (Petrel). It uses 50 m by 50 m by 1 m cells resulting in approximately 11.5 million cells in the model. Litho-facies have not yet been modelled; however, shoreface and estuarine environments boundaries were used to model the different reservoir properties for these environments.
Five distinct saturation zones were modelled to capture the variability in saturations: lean, transition, rich SAGD, below SAGD and bottom water.
The model was populated with porosity, water saturation and permeability based on data from over 200 cored wells and 500 well logs. The PHI*H*So map (Preamble Figure 8) illustrates the variability throughout the model.
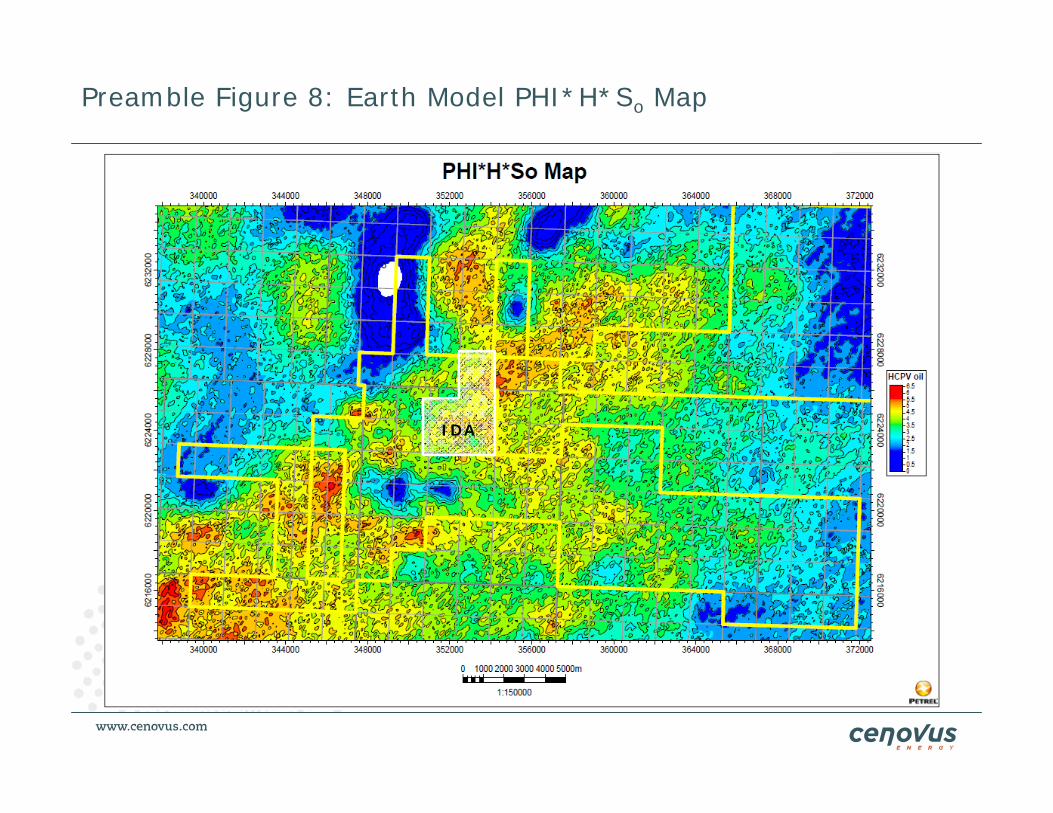
Preamble Figure 8: Earth Model PHI*H*So Map
IDA

Cenovus Energy Inc. - 12 - Supplemental Information Request Pelican Lake Grand Rapids Project February 2013
1.3 GRAND RAPIDS ‘A’ AQUIFER SIMULATION MODEL
A three-dimensional (3D) aquifer simulation model was built in STARS (Computer Modelling Group Ltd.’s STARSTM thermal simulation software); the earth model was up-scaled to 200 m by 200 m cells horizontally; vertical up-scaling was not done. The dimensions of the model are 156 by 93 by 31 cells; 449,748 cells.
The Grand Rapids ‘A’ structural top layer is illustrated in Preamble Figure 9. The estimated initial pressure in the top layer is provided in Preamble Figure 10. The model was history matched by approximating aquifer flow to match pressure data from 103/06-14-082-23 W4M and 1F1/13-11-083-20 W4M. The Downdip Injector represents the water volumes flowing into the aquifer; the Updip Producer on the east boundary represents water flowing updip out of the model. The model required 300 simulation years to reach steady state conditions.
West-East and North-South model slices are provided in Preamble Figures 11 and 12, respectively. The West-East slice illustrates how the bitumen plug pinches out to the east, and the lean zone and bottom water zones coalesce. The North-South slice provides an example of bottom water in the pebble facies.
Model size, calculation complexity and limitation of simulation software and hardware made it necessary to develop simplifying assumptions to model the thermal processes. It must be emphasized that the results are directionally representative.
These key assumptions are:
• Start-up of lean zone air injection, lean zone water production, SAGD steam injection and SAGD production at the same time.
• The initial pads in the Initial Development Area (IDA) were combined and modelled as one injection and one production well. SAGD production and injection was modeled for 13 years. The key objectives were to model the estimated cumulative oil production from the 12 pads and ensure that the pressure, temperature and steam saturation at the end of SAGD are reasonable. Heaters were used in the model to help with the matching process.
• Air chemical reactions in the reservoir have not been modelled.
The location of the lean zone water producers and air injectors in relation to the initial 12 pads slated for development in the IDA are provided in Preamble Figure 13.

Preamble Figure 9: Grand Rapids ‘A’ Aquifer Simulation Model
156(200m) X93(200m) X 31(1m): 31.2km long, 18.6 km wide, 31m thick
IDA
Depth below
sea level (mSS)
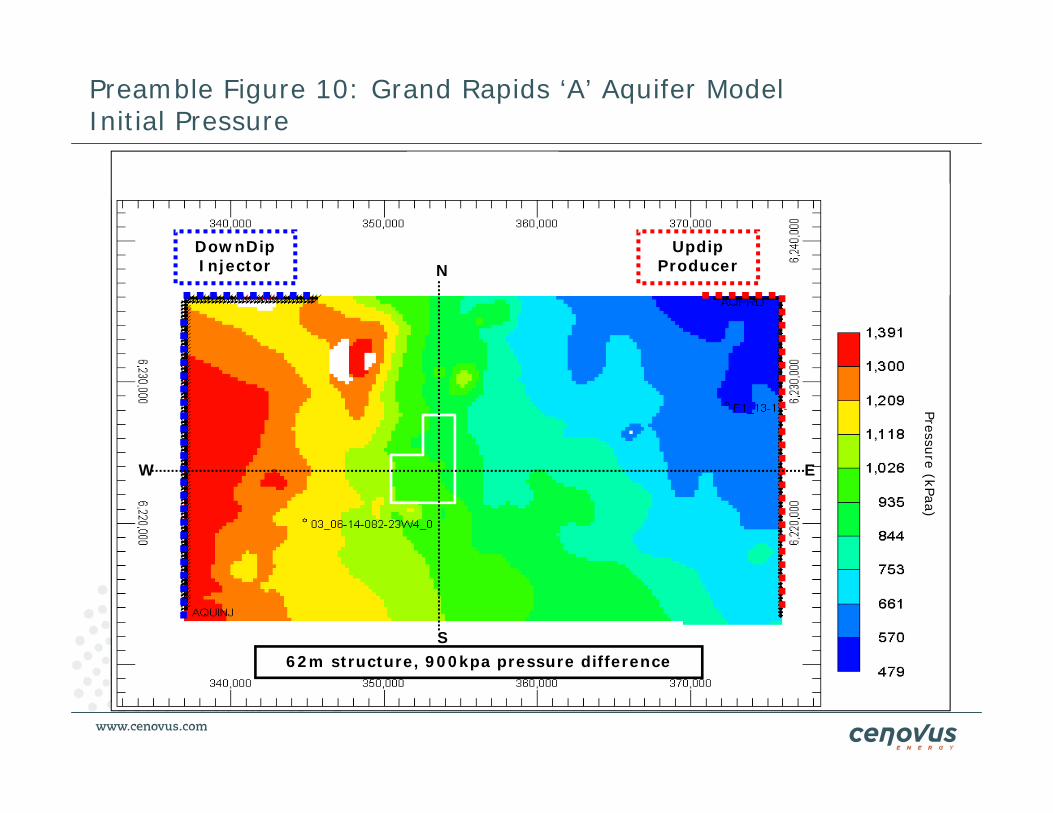
Preamble Figure 10: Grand Rapids ‘A’ Aquifer ModelInitial Pressure
DownDip Injector
Updip Producer
62m structure, 900kpa pressure difference
W E
N
S
Pressure (kPaa)

Preamble Figure 11: Grand Rapids ‘A’ Aquifer West-East Slice Initial Oil Saturation
IDA
Bottom Water coalesces with Top Water (Lean Zone)
Lean Zone
Bottom Water
Oil S
aturation (fraction)
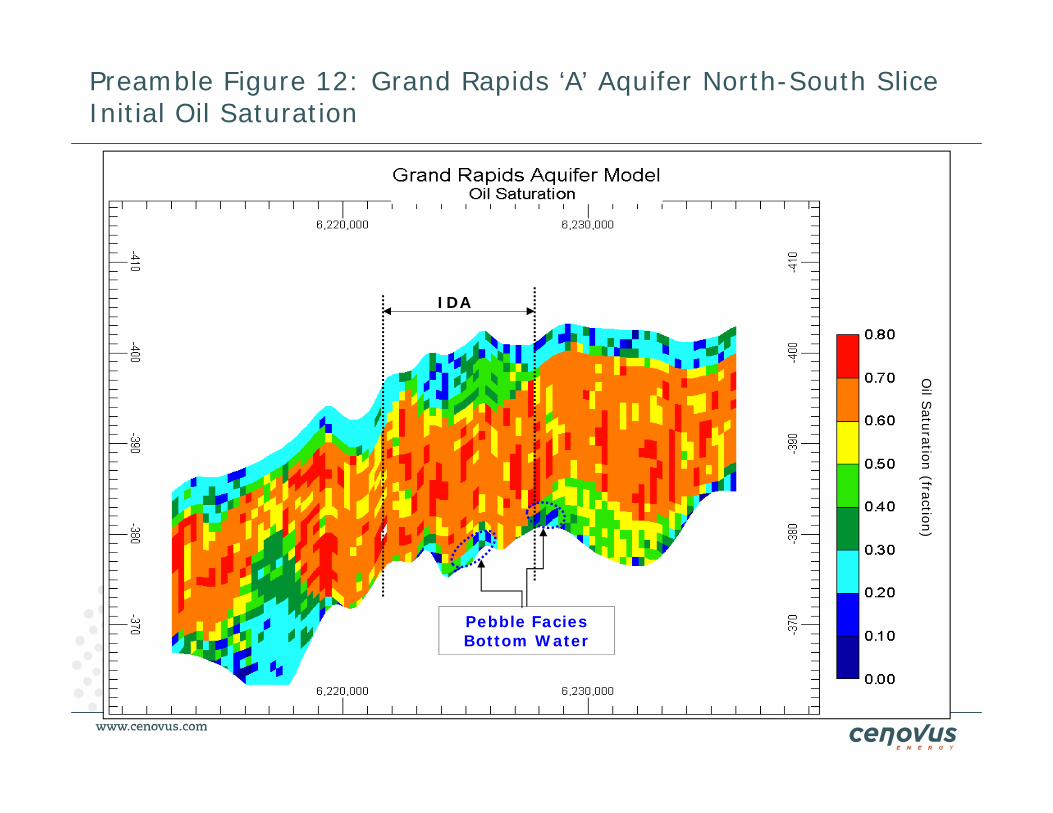
Preamble Figure 12: Grand Rapids ‘A’ Aquifer North-South Slice Initial Oil Saturation
IDA
Pebble Facies Bottom Water
Oil S
aturation (fraction)

Preamble Figure 13: Aquifer Model IDA Lean Zone Air Injection and Water Producers
IDA Pad pattern areas

Cenovus Energy Inc. - 18 - Supplemental Information Request Pelican Lake Grand Rapids Project February 2013
1.3.1 Lean Zone Water Production and Air Displacement at Start-up (2 years)
During the first two years of operation, the lean zone producers provide water for steam generation; the estimated rate is 3000 m3/d. After two years, it is estimated that the produced water from the SAGD wells will exceed steam requirements and the lean zone water production wells will no longer be required for that purpose.
To maintain reservoir pressure during this period, a constant air injection rate of 40,000 m3/d has been assumed. The air also displaces water away from the SAGD producers, reducing water produced through the SAGD wellpairs and lower Steam-Oil Ratios (SORs). A key operating strategy for the Project to produce as much mobile water as is practical without heating it, thereby minimizing SOR. Preamble Figure 14 illustrates air saturation in the top layer of the model two years after start-up and is indicative of the approximate volumes of water that have been displaced.
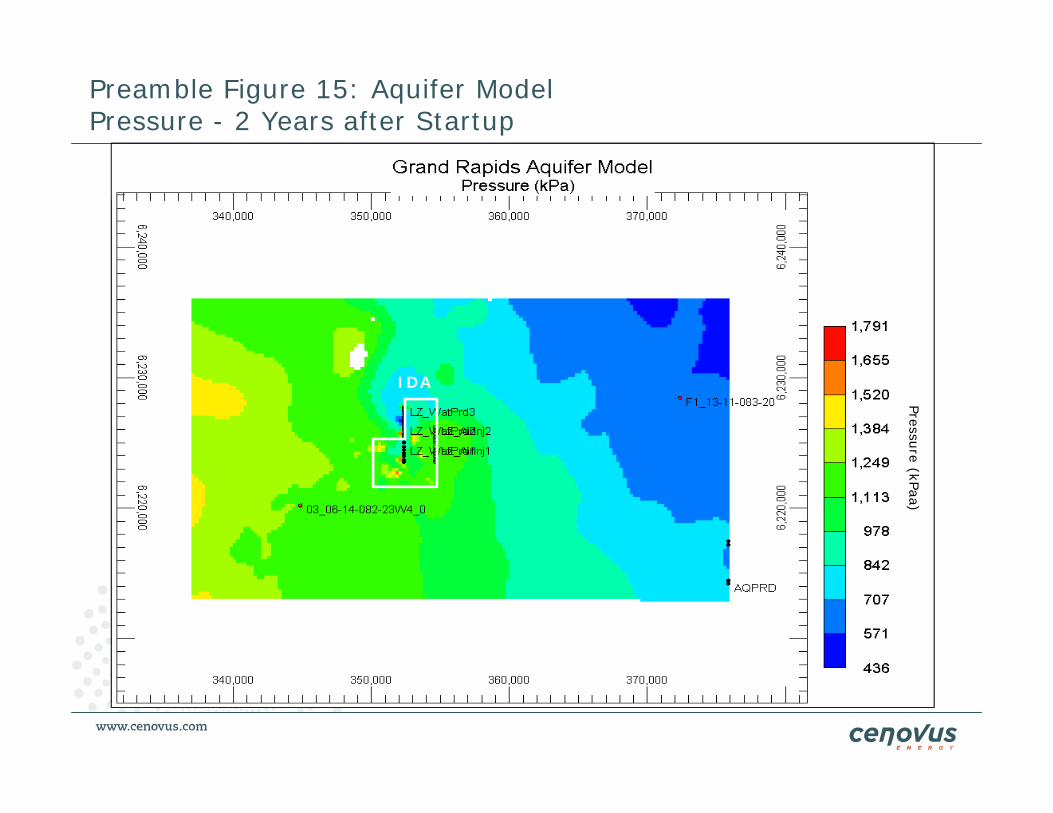
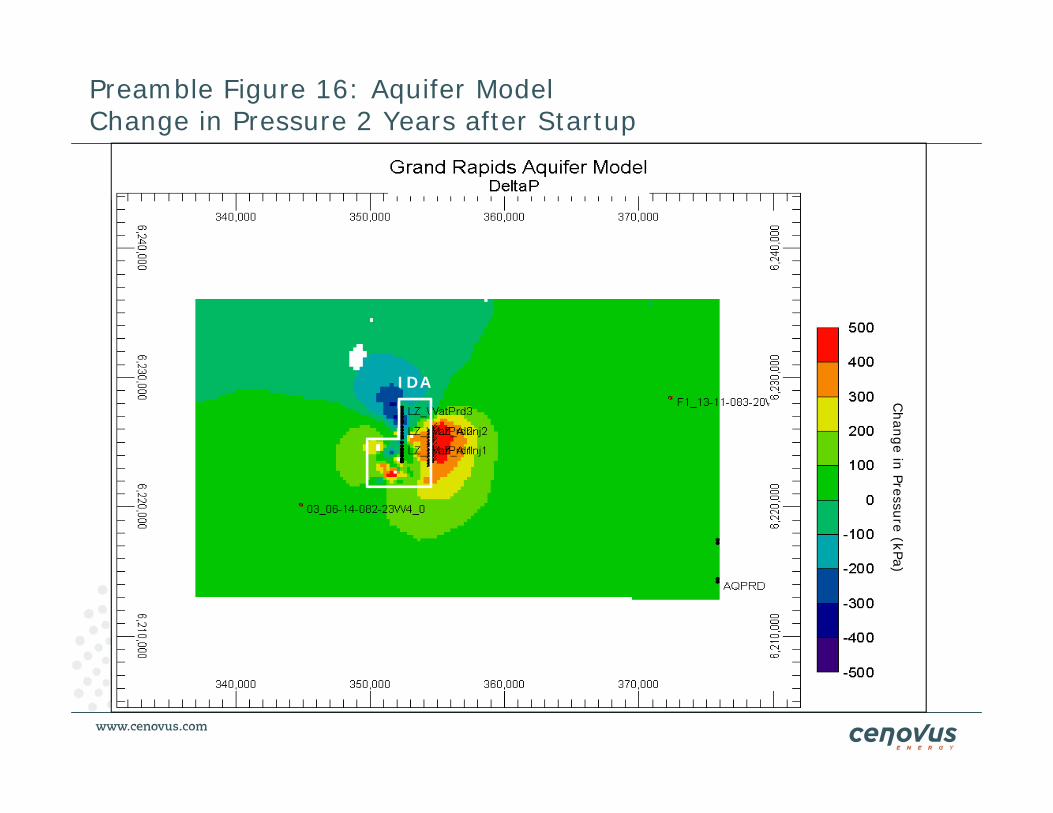
The pressure after start-up period is provided in Preamble Figure 15. The change in pressure (DeltaP) is provided in Preamble Figure 16; it shows pressure changes of +/-500kpa close to the lean zone wells but minimal impact on overall aquifer pressure.

Preamble Figure 14: Aquifer ModelGas Saturation - 2 Years after Startup
IDA
Gas Saturation
Gas S
aturation (fraction)
Preamble Figure 15: Aquifer ModelPressure - 2 Years after Startup
IDA
Pressure (kPaa)
Preamble Figure 16: Aquifer ModelChange in Pressure 2 Years after Startup
IDA
Change in Pressure (kPa)

Cenovus Energy Inc. - 22 - Supplemental Information Request Pelican Lake Grand Rapids Project February 2013
1.3.2 SAGD Operation (2 to 13 years)
It has been assumed that after two years, the steam chambers connected to the lean zone will offset the need for air and the lean zone air injection wells will be shut-in. SAGD wells in contact with the lean zone will be operated within 300 kPa of the original lean zone pressure to minimize heat losses into the lean zone and overburden.
The lean zone water producers will continue to operate at a rate of 3,000 m3/d to displace lean zone water away from the SAGD wells. This water will not be required for steam generation but will be used to provide quench for production well operations. The excess water above quench requirements will support Wabiskaw operations or be re-injected back into the Grand Rapids ‘A’.
It has been assumed for this model that SAGD operations cease after 13 years. The change in pressure from original conditions (DeltaP) at the end of SAGD operations is provided in Preamble Figure 17; it shows localized changes in pressure of plus or minus 300 kPa, and minimal changes beyond the IDA.

Preamble Figure 17: Aquifer Model Change in Pressure after SAGD Operations Cease
IDA
Change in Pressure (kPa)

Cenovus Energy Inc. - 24 - Supplemental Information Request Pelican Lake Grand Rapids Project February 2013
1.3.3 Air Injection at Abandonment
Preamble Figure 18 is a West-East slice illustrating the temperature in the IDA at the end of SAGD operations. As the reservoir cools, steam in the reservoir will condense resulting in a significant drop in pressure if air is not injected. The change in reservoir pressure from initial conditions for the same slice is provided in Preamble Figure 19, and is greater than 600 kPa which would negatively impact SAGD operations in offsetting pads.
To maintain reservoir pressure after SAGD, approximately 8 BCF of air is required. It was assumed that this occurs over an 18 year period. Increasing air injection rates would reduce this period.
The change in reservoir pressure from initial conditions for the same slice with air injection is provided in Preamble Figure 20; the pressure change is relatively small and would not negatively impact SAGD operations in offsetting pads.
The average model pressures (with and without air injection) from start-up to 18 years after SAGD operations cease are illustrated in Preamble Figure 21; cumulative air injection volumes are also provided. It shows the additional 8 BCF that was injected in the IDA to maintain pressure after SAGD ceased (approximately 1 BCF was injected during the two year start-up period).
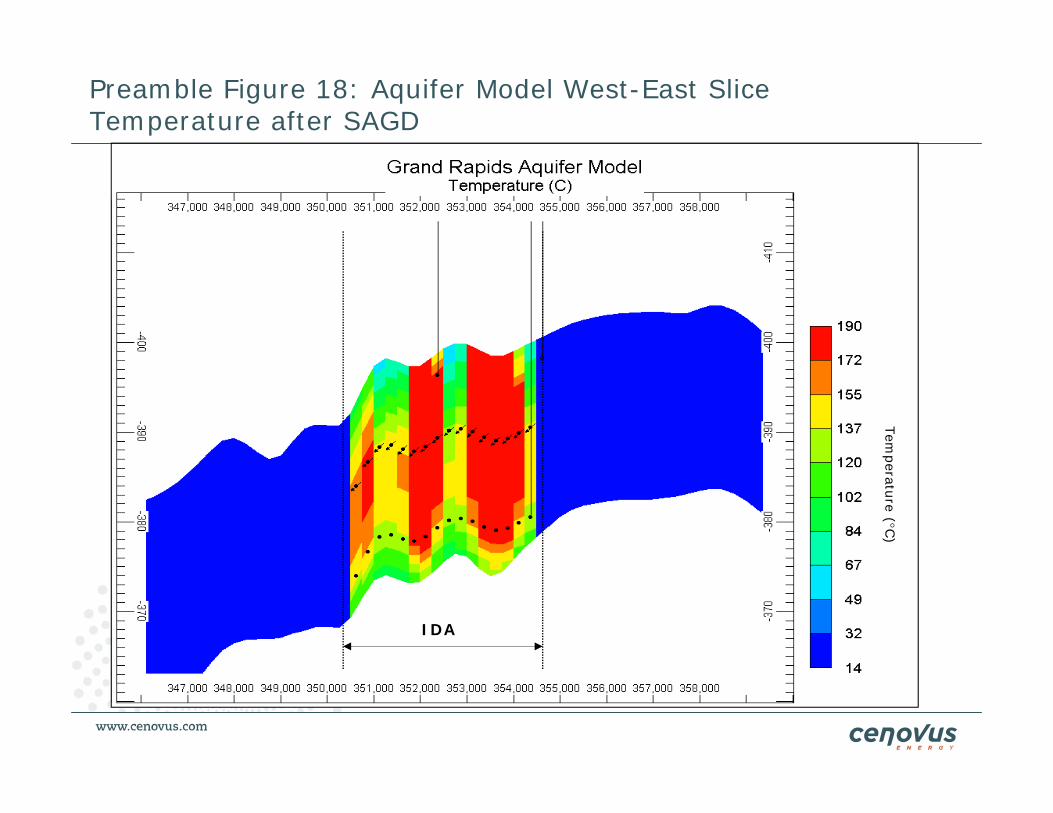
Preamble Figure 18: Aquifer Model West-East Slice Temperature after SAGD
IDA
Temperature (C
)

Preamble Figure 19: Aquifer Model Pressure Change without Air Injection after SAGD
IDA
Change in Pressure (kPa)

Preamble Figure 20: Aquifer Model Pressure Change With Air Injection after SAGD
IDA
Change in Pressure (kPa)

Preamble Figure 21: Aquifer ModelAverage Reservoir Pressure and Injected Gas Volumes
IDA
SAGD Operations End
SAGD Start
2018 2046204220382034203020262022 2050
Cenovus Energy Inc. - 29 - Supplemental Information Request Pelican Lake Grand Rapids Project February 2013
1.4 SAGD STRATEGY AND PERFORMANCE IN THE GRAND RAPIDS ‘A’
1.4.1 SAGD Models
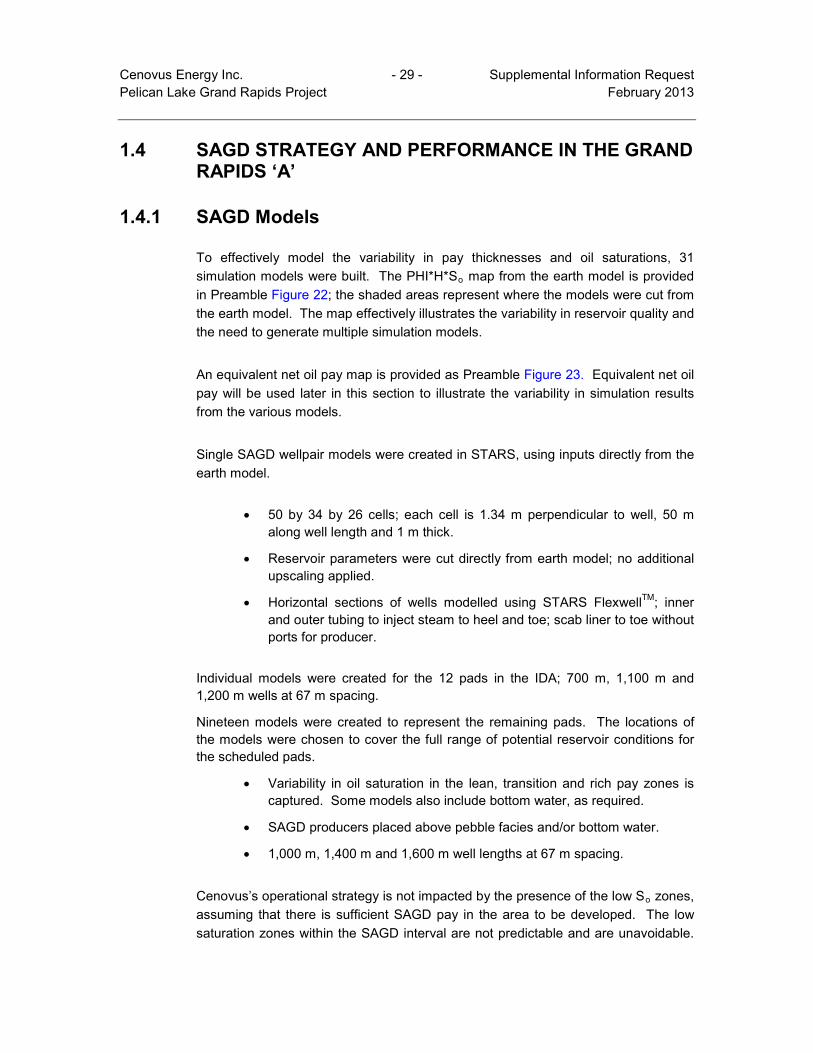
To effectively model the variability in pay thicknesses and oil saturations, 31 simulation models were built. The PHI*H*So map from the earth model is provided in Preamble Figure 22; the shaded areas represent where the models were cut from the earth model. The map effectively illustrates the variability in reservoir quality and the need to generate multiple simulation models.
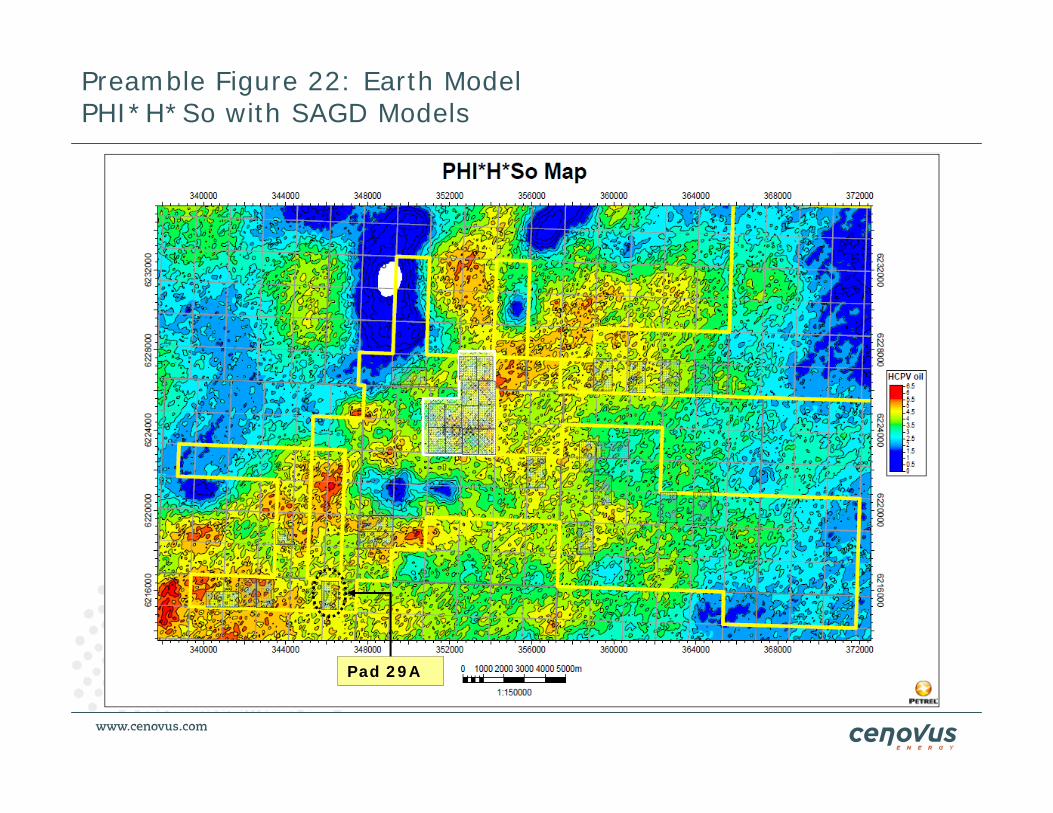
An equivalent net oil pay map is provided as Preamble Figure 23. Equivalent net oil pay will be used later in this section to illustrate the variability in simulation results from the various models.
Single SAGD wellpair models were created in STARS, using inputs directly from the earth model.
• 50 by 34 by 26 cells; each cell is 1.34 m perpendicular to well, 50 m along well length and 1 m thick.
• Reservoir parameters were cut directly from earth model; no additional upscaling applied.
• Horizontal sections of wells modelled using STARS FlexwellTM; inner and outer tubing to inject steam to heel and toe; scab liner to toe without ports for producer.
Individual models were created for the 12 pads in the IDA; 700 m, 1,100 m and 1,200 m wells at 67 m spacing.
Nineteen models were created to represent the remaining pads. The locations of the models were chosen to cover the full range of potential reservoir conditions for the scheduled pads.
• Variability in oil saturation in the lean, transition and rich pay zones is captured. Some models also include bottom water, as required.
• SAGD producers placed above pebble facies and/or bottom water.
• 1,000 m, 1,400 m and 1,600 m well lengths at 67 m spacing.
Cenovus’s operational strategy is not impacted by the presence of the low So zones, assuming that there is sufficient SAGD pay in the area to be developed. The low saturation zones within the SAGD interval are not predictable and are unavoidable.

Cenovus Energy Inc. - 30 - Supplemental Information Request Pelican Lake Grand Rapids Project February 2013
The SAGD simulations include these low saturation zones, and therefore, have been incorporated into SAGD performance predictions. Potential impacts of the lower So regions are premature steam chamber contact with the lean zone and higher Cumulative Steam-Oil Ratios (CSORs) over the Project life.
Preamble Figure 22: Earth Model PHI*H*So with SAGD Models
IDA
Pad 29A
Preamble Figure 23: Grand Rapids ‘A’ Earth ModelEquivalent Net Pay
IDA
Pad 29A
Cenovus Energy Inc. - 33 - Supplemental Information Request Pelican Lake Grand Rapids Project February 2013
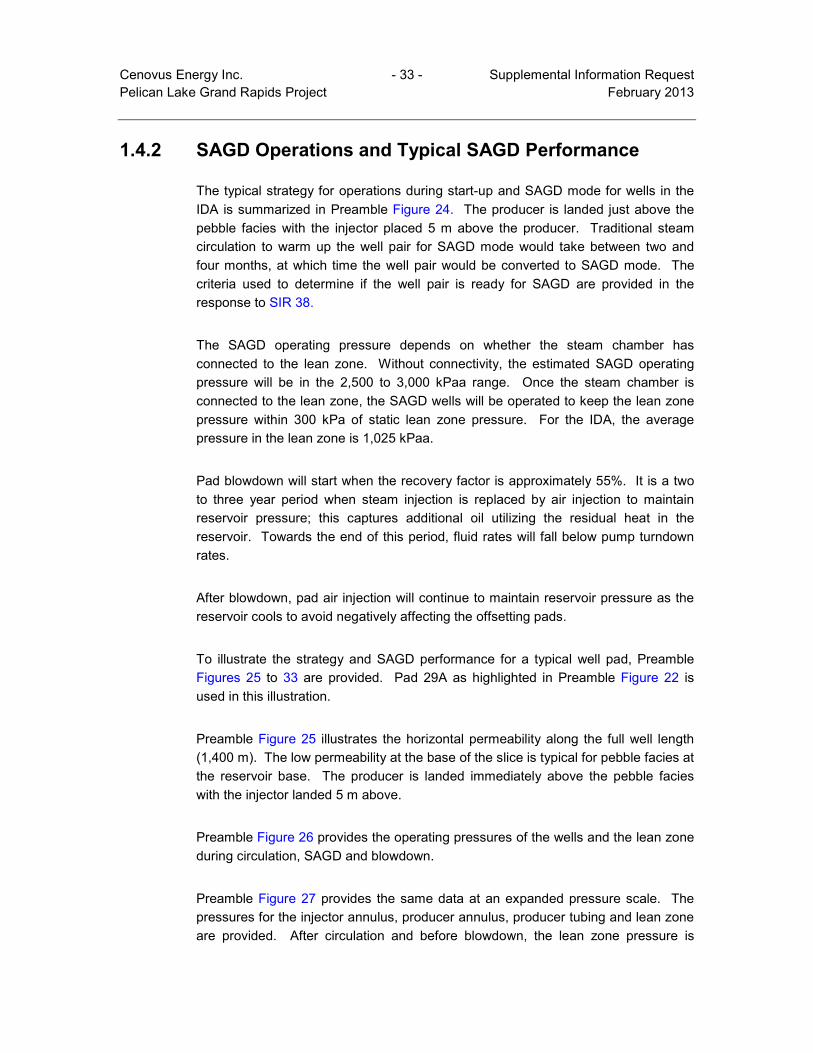
1.4.2 SAGD Operations and Typical SAGD Performance
The typical strategy for operations during start-up and SAGD mode for wells in the IDA is summarized in Preamble Figure 24. The producer is landed just above the pebble facies with the injector placed 5 m above the producer. Traditional steam circulation to warm up the well pair for SAGD mode would take between two and four months, at which time the well pair would be converted to SAGD mode. The criteria used to determine if the well pair is ready for SAGD are provided in the response to SIR 38.
The SAGD operating pressure depends on whether the steam chamber has connected to the lean zone. Without connectivity, the estimated SAGD operating pressure will be in the 2,500 to 3,000 kPaa range. Once the steam chamber is connected to the lean zone, the SAGD wells will be operated to keep the lean zone pressure within 300 kPa of static lean zone pressure. For the IDA, the average pressure in the lean zone is 1,025 kPaa.
Pad blowdown will start when the recovery factor is approximately 55%. It is a two to three year period when steam injection is replaced by air injection to maintain reservoir pressure; this captures additional oil utilizing the residual heat in the reservoir. Towards the end of this period, fluid rates will fall below pump turndown rates.
After blowdown, pad air injection will continue to maintain reservoir pressure as the reservoir cools to avoid negatively affecting the offsetting pads.
To illustrate the strategy and SAGD performance for a typical well pad, Preamble Figures 25 to 33 are provided. Pad 29A as highlighted in Preamble Figure 22 is used in this illustration.
Preamble Figure 25 illustrates the horizontal permeability along the full well length (1,400 m). The low permeability at the base of the slice is typical for pebble facies at the reservoir base. The producer is landed immediately above the pebble facies with the injector landed 5 m above.
Preamble Figure 26 provides the operating pressures of the wells and the lean zone during circulation, SAGD and blowdown.
Preamble Figure 27 provides the same data at an expanded pressure scale. The pressures for the injector annulus, producer annulus, producer tubing and lean zone are provided. After circulation and before blowdown, the lean zone pressure is

Cenovus Energy Inc. - 34 - Supplemental Information Request Pelican Lake Grand Rapids Project February 2013
within 100 kPa of the original pressure. The pressure in the production tubing is significantly lower than the production annulus for this completion. The large pressure differential is a result of operating at a low subcool and high pressure drop in the tubing due to steam flashing. The water entering the Electric Submersible Pump (ESP) flashes through the pump inlet resulting in lower ESP efficiency. Quench water injected upstream of the ESP will cool the emulsion entering the ESP below the flashpoint and reduce steam flashing and increase ESP efficiency.
Preamble Figure 28 highlights the variability in the initial oil saturation in the model (the AQPresContW and AQPresContE are placed in the model to approximate flow and allow for displacement of lean zone water).
Preamble Figure 29 highlights the variability in initial oil saturation in Row 16 of the model; the low oil saturations in the rich pay and transition zone close to the wellbore in Row 16 are highlighted to demonstrate the impact that they have on SAGD performance. It is critical to note that the simulation model was cut directly from the earth model for one geostatistical representation. A different geostatistical representation would yield a similar variability in oil saturations, but the location of the high water saturation intervals would be completely different, resulting in different SAGD performance.
Preamble Figure 30 provides the oil saturation in Row 16 of the model after circulation. It shows that a direct connection from the injector to the lean zone has been established.
Preamble Figure 31 provides the 3D perspective illustrating the increase in temperature in the lean zone due to the steam connection. Preamble Figure 32 provides the same 3D perspective illustrating the hot spot in the lean zone 10 months after start-up. Preamble Figure 33 illustrates that after 22 months of operation, despite the early breakthrough into the lean zone, that the steam chamber is well developed along more than 75% of the wellbore.

Preamble Figure 24: Typical SAGD Operations Startup and SAGD Mode
SAGD INTERVAL
RICH PAY
LEAN ZONE
TRANSITION ZONE
PEBBLE FACIES
Land producer just above pebble facies. Place injector 5 m above producer.
Circulation for 2 to 4 months; producer maximum circulation pressure 3,000 kPaa, injector maximum circulation pressure 2,800 kPaa
Convert to SAGD mode after circulation. Targeted SAGD pressures will vary depending on lean zone pressure and if good connectivity to the lean zone has been established. Estimate timing to connect 2 to 6 months based on thickness of rich pay, transition and lean zones.• No connectivity: 2,500-3,000 kPaa• Connectivity: within 300 kPa
above lean zone pressure to displace lean zone water away from SAGD well pair
For the IDA the average pressure in the lean zone is estimated to be 1025 kPaa.
Limited producer steam rate to 5 m3/d and producer BHP to 500 kPaa
Injector
Producer

Preamble Figure 25: Pad#29A North-South along Wellpair Permeability
Inj_AnnInj_ITub_1Inj_OTub_1Inj_Tub_CircPrd_Ann_1Prd_Inj_Tub_CPrd_Tub
0 100 200 300 400 500 600 700 800 900 1,000 1,100 1,200 1,300 1,400 1,500
0 100 200 300 400 500 600 700 800 900 1,000 1,100 1,200 1,300 1,400 1,500
230240
250260
270
220
230
240
250
260
270
280
0.0
1,000.0
2,000.0
3,000.0
4,000.0
5,000.0
6,000.0
10,000.0
Pad #29APermeability I (md)
Low permeability at the reservoir base in pebble facies; SAGD producer landed just above
Permeability (m
D)

Preamble Figure 26: Typical SAGD Well Pair OperationsPad#29A
SAGD
BLOWDOWN
CIRCULATION
Producer Circulation at 2600kPaa, Injector at 2400kPaa

Preamble Figure 27: Typical SAGD Well Pair OperationsPad#29A
Producer Tubing (Heel)
Lean Zone
Injector Annulus
Producer Annulus
Limit operating pressures to ~ 100kPa above original lean zone pressure
Minimum producer BHP set at 500kPaa
Produce without much subcool; max steam rate 5m3/d CWE

Preamble Figure 28: SAGD Model Pad#29AInitial Oil Saturation
AqPresContW and AqPresContE are not wells. They are used to control lean zone pressure and allow steam to displace water away from the SAGD well pair in the simulator
Oil S
aturation (fraction)
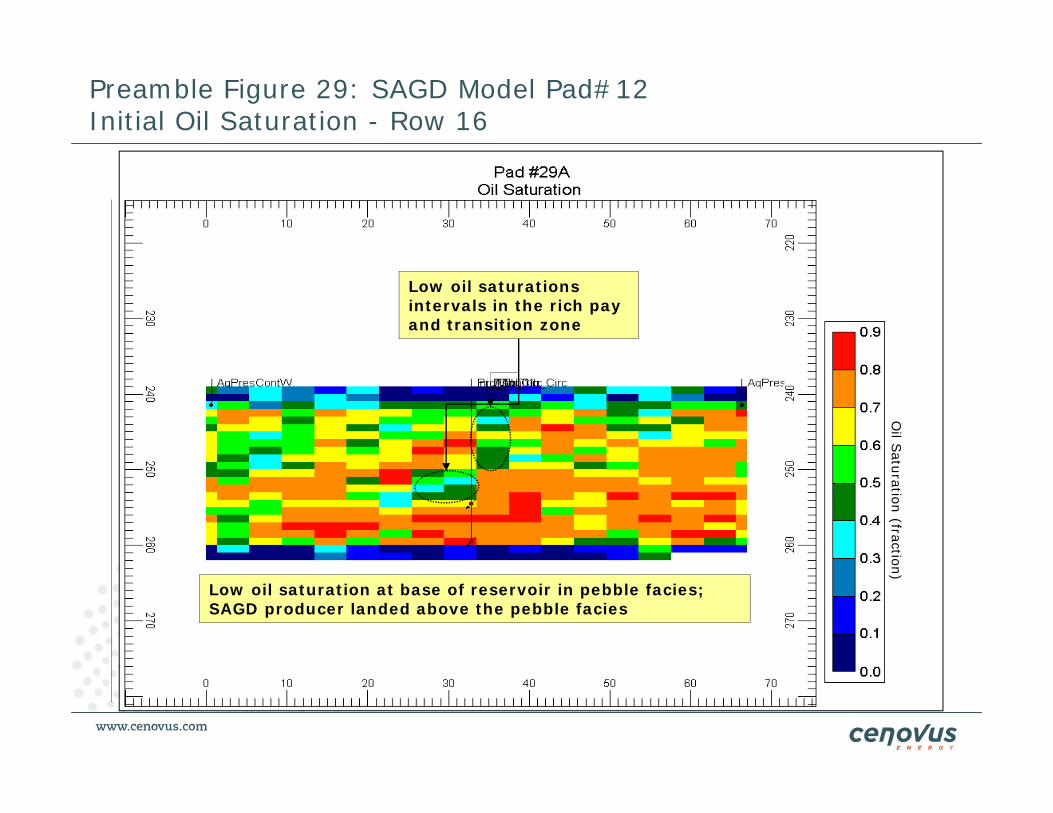
Preamble Figure 29: SAGD Model Pad#12Initial Oil Saturation - Row 16
Low oil saturation at base of reservoir in pebble facies; SAGD producer landed above the pebble facies
Low oil saturations intervals in the rich pay and transition zone
Oil S
aturation (fraction)

Preamble Figure 30: SAGD Model Pad#29AOil Saturation after 3 months - Row 16
Low oil saturation region illustrates lean zone breakthrough after 3 months
Oil S
aturation (fraction)

Preamble Figure 31: SAGD Model Pad #29A Temperature - Lean Zone Breakthrough After Circulation
Lean zone breakthrough on row 16
Temperature (C
)

Preamble Figure 32: SAGD Model Pad#29ATemperature - After 10 Months
Temperature (C
)
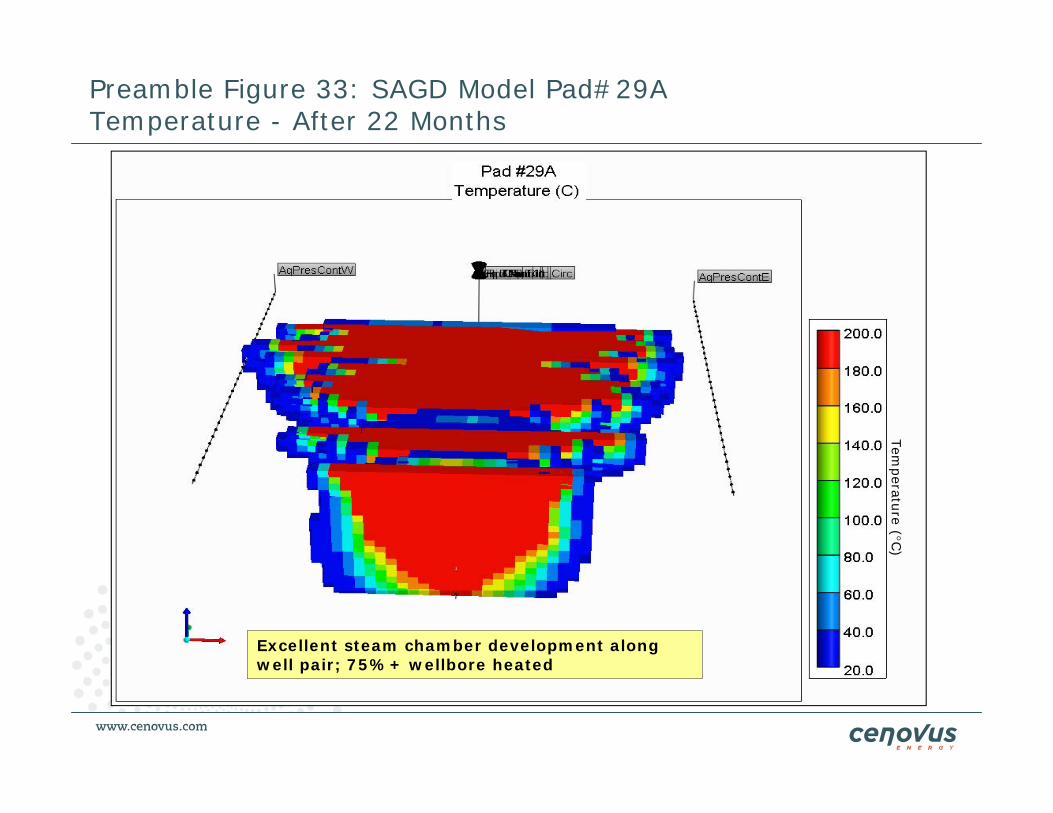
Preamble Figure 33: SAGD Model Pad#29ATemperature - After 22 Months
Excellent steam chamber development along well pair; 75%+ wellbore heated
Temperature (C
)
Cenovus Energy Inc. - 45 - Supplemental Information Request Pelican Lake Grand Rapids Project February 2013
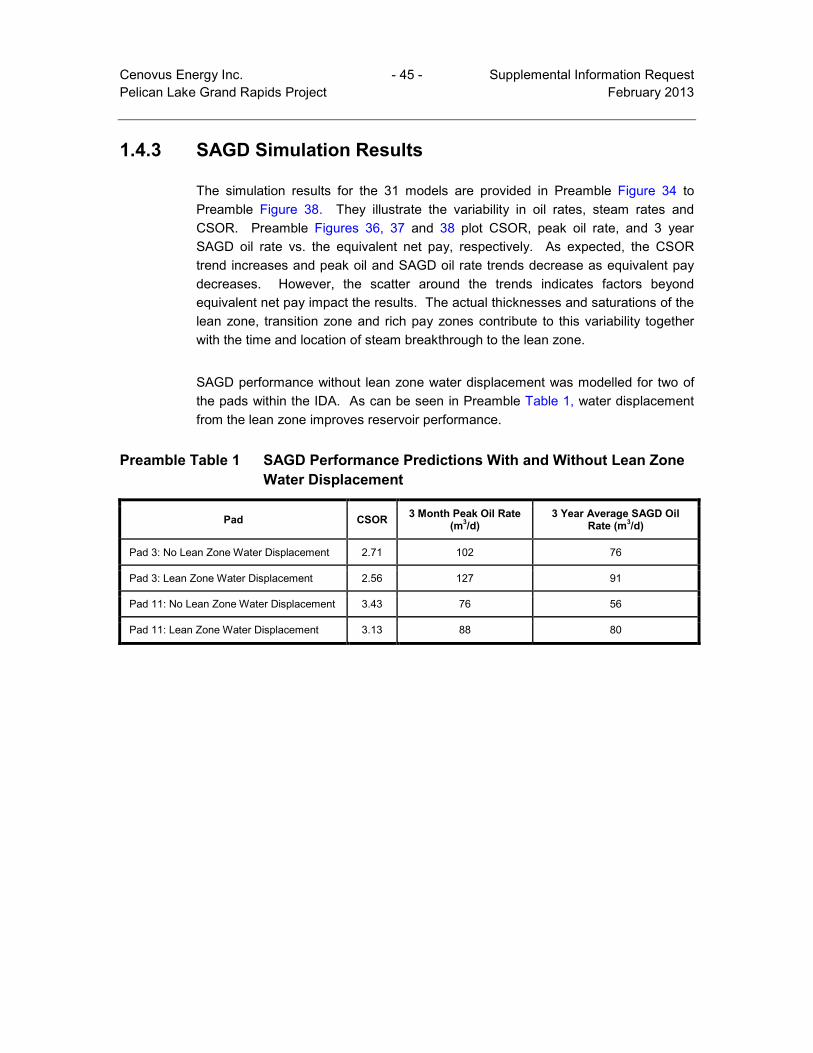
1.4.3 SAGD Simulation Results
The simulation results for the 31 models are provided in Preamble Figure 34 to Preamble Figure 38. They illustrate the variability in oil rates, steam rates and CSOR. Preamble Figures 36, 37 and 38 plot CSOR, peak oil rate, and 3 year SAGD oil rate vs. the equivalent net pay, respectively. As expected, the CSOR trend increases and peak oil and SAGD oil rate trends decrease as equivalent pay decreases. However, the scatter around the trends indicates factors beyond equivalent net pay impact the results. The actual thicknesses and saturations of the lean zone, transition zone and rich pay zones contribute to this variability together with the time and location of steam breakthrough to the lean zone.
SAGD performance without lean zone water displacement was modelled for two of the pads within the IDA. As can be seen in Preamble Table 1, water displacement from the lean zone improves reservoir performance.
Preamble Table 1 SAGD Performance Predictions With and Without Lean Zone Water Displacement
Pad CSOR 3 Month Peak Oil Rate (m3/d)
3 Year Average SAGD Oil Rate (m3/d)
Pad 3: No Lean Zone Water Displacement 2.71 102 76
Pad 3: Lean Zone Water Displacement 2.56 127 91
Pad 11: No Lean Zone Water Displacement 3.43 76 56
Pad 11: Lean Zone Water Displacement 3.13 88 80

Preamble Figure 34: Simulation Type CurvesOil Rate
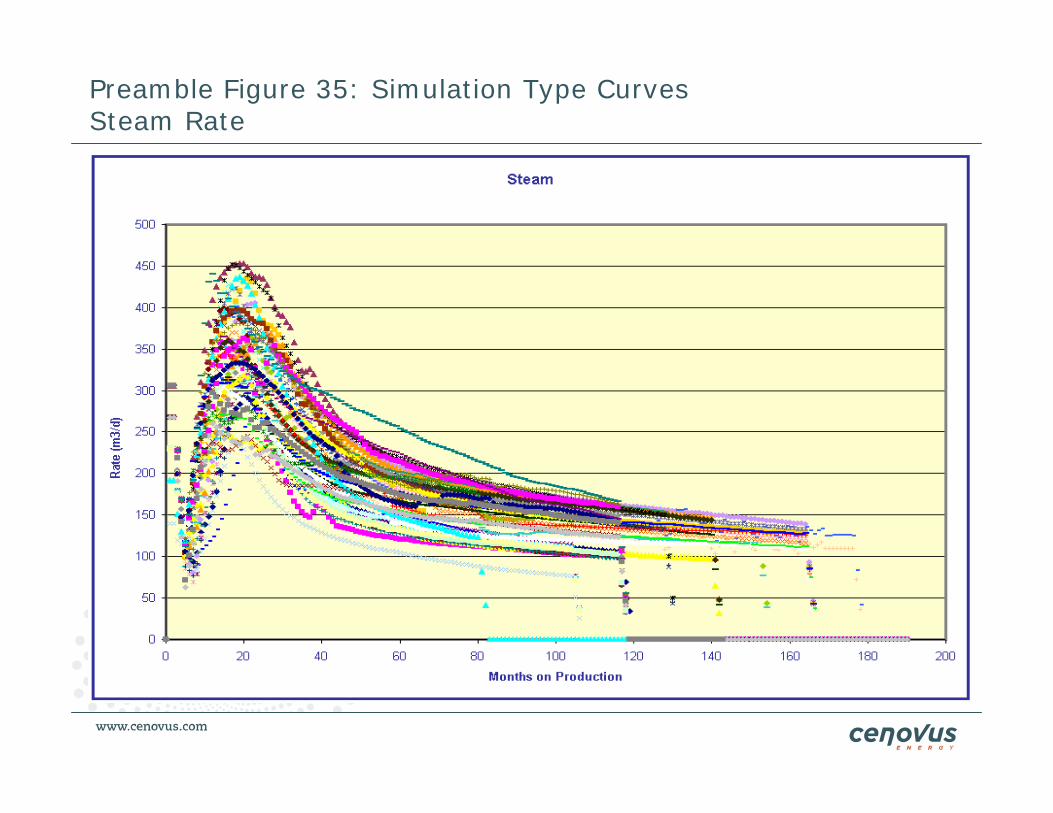
Preamble Figure 35: Simulation Type CurvesSteam Rate

Preamble Figure 36: CSOR
Equivalent Net Pay (m)

Preamble Figure 37: Peak Oil - 3 Month Ave (m3/d)
Equivalent Net Pay (m)
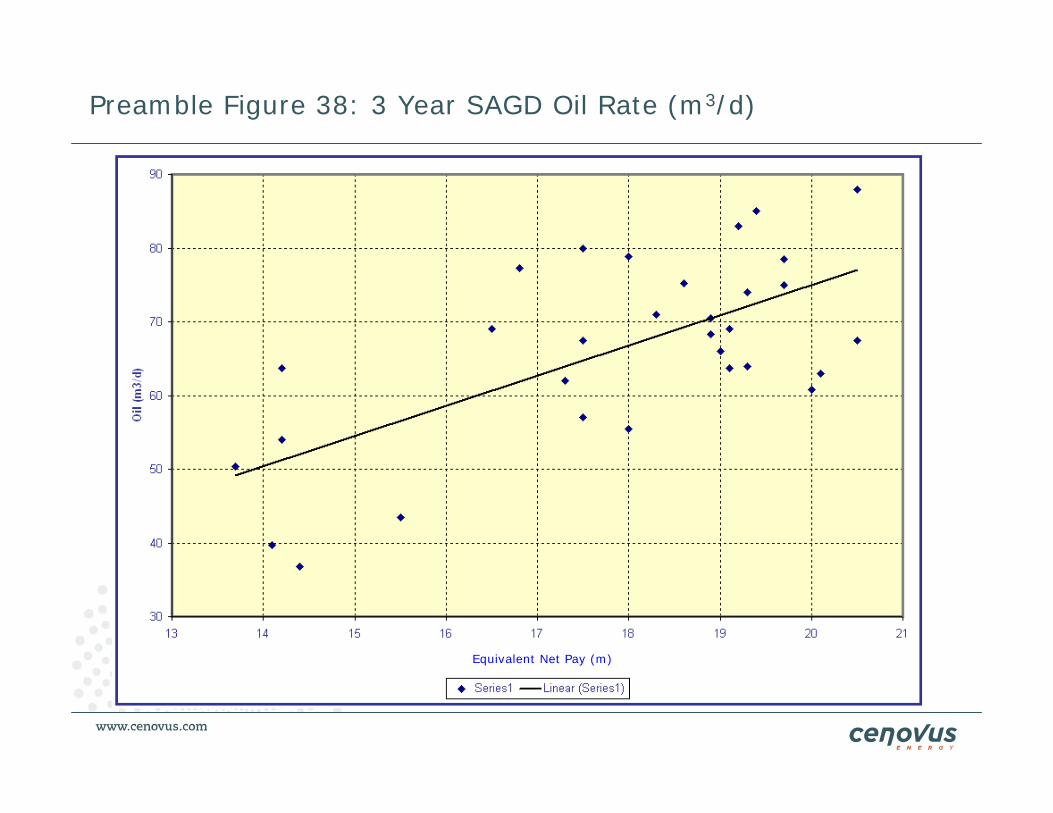
Preamble Figure 38: 3 Year SAGD Oil Rate (m3/d)
Equivalent Net Pay (m)
Cenovus Energy Inc. - 51 - Supplemental Information Request Pelican Lake Grand Rapids Project February 2013
1.5 UPDATE TO THE ENVIRONMENTAL IMPACT ASSESSMENT
As described in Section 1.5, the modification to the pad layout within the IDA will create a small change to the overall Project footprint and the area of surface disturbance. This change was evaluated by key components to determine whether the change would affect the conclusions of the Environmental Impact Assessment (EIA; Cenovus 2011). The key components are those that are directly affected by the change in the surface disturbance, and include:
• Air Emissions Effects;
• Hydrology;
• Terrain and Soils;
• Terrestrial Vegetation, Wetlands and Forest Resources;
• Wildlife; and
• Biodiversity.
As described in the sections below, the change to the footprint would not change the conclusions from these key components and, as a result, no further detailed analyses are required.
1.5.1 Air Emissions Effects
The air emissions effects section of the EIA considered the potential impact of acid deposition to aquatic receptors and soils, total nitrogen deposition to vegetation, and the fumigation of vegetation by nitrogen oxides and sulphur dioxide due to Project activities. The 2013 revision to the footprint does not change the rate or distribution of emissions.
Based on the 2013 revised footprint, there will be a 7 ha decrease in the area of soils where the 0.17 keq H+/ha/yr monitoring load for acidification (AENV 2008) is exceeded under the Planned Development Case (PDC). The decrease in area above the monitoring load (less than 1% of the Terrestrial Resources Regional Study Area [RSA]) is due to an increase in disturbed area; disturbed areas are excluded from the soils assessment.

Cenovus Energy Inc. - 52 - Supplemental Information Request Pelican Lake Grand Rapids Project February 2013
The 2013 footprint changes do not affect the results of the following analyses:
• chronic acidification of surface waters;
• acute (episodic) acidification of surface waters;
• chronic acidification of soils in the Baseline or Application Case;
• eutrophication of vegetation; and
• fumigation of vegetation by nitrogen oxides and sulphur dioxide.
Based on these results, the overall conclusions of the air emissions effects assessment will remain the same as presented in the original EIA.
1.5.2 Hydrology
Based on the revised footprint, changes in the disturbed areas of sub-basins in the Project Aquatic Resources Local Study Area (LSA) were re-evaluated. The sub-basins in the LSA that will be affected by the change in the footprint, and the corresponding changes to the disturbed area at the hydrology assessment nodes in the sub-basins, are shown in Preamble Table 2.
Preamble Table 2 Estimated Changes in the Area of Surface Disturbance within the Sub-basins
Sub-Basin Name Assessment Node Name
Total Drainage Area
Application Case Disturbed Area 2011 Application
Disturbance 2013 Updated Disturbance
Change in Disturbance
[km2] [km2] [km2] [km2] [%]
Wood Buffalo River Sub-Basin
WB-1 122 8.85 8.85 0.00 0.0 WB-2 905 30.5 30.5 0.00 0.0
Unnamed Watercourse 1 Sub-Basin UN1-1 319 6.70 6.37 -0.33 -0.1
Unnamed Watercourse 2 Sub-Basin
HY1 30.3 6.01 5.55 -0.46 -1.5 UN2-1 243 35.5 35.1 -0.46 -0.2 HY2 335 37.9 37.4 -0.46 -0.1 UN2-3 403 42.0 41.4 -0.56 -0.1
Loon Creek Sub-Basin HY5 140 9.40 9.34 -0.06 0.0 LC-1 628 83.6 83.5 -0.06 0.0
Pelican River Sub-Basin HY4 144 12.9 12.1 -0.79 -0.5 PR-1 528 31.0 29.5 -1.54 -0.3 PR-2 1,484 54.8 53.2 -1.63 -0.1

Cenovus Energy Inc. - 53 - Supplemental Information Request Pelican Lake Grand Rapids Project February 2013
The disturbance area will not change in Wood Buffalo River Sub-Basin and will decrease in the other sub-basins and at assessment nodes in the sub-basins (Preamble Table 2). Thus, there will be no changes or very small decreases/increases to the hydrologic parameters at the assessment nodes due to the change in the disturbance areas. Therefore, the footprint change does not affect the overall conclusions of the hydrology assessment in the EIA.
1.5.3 Terrain and Soils
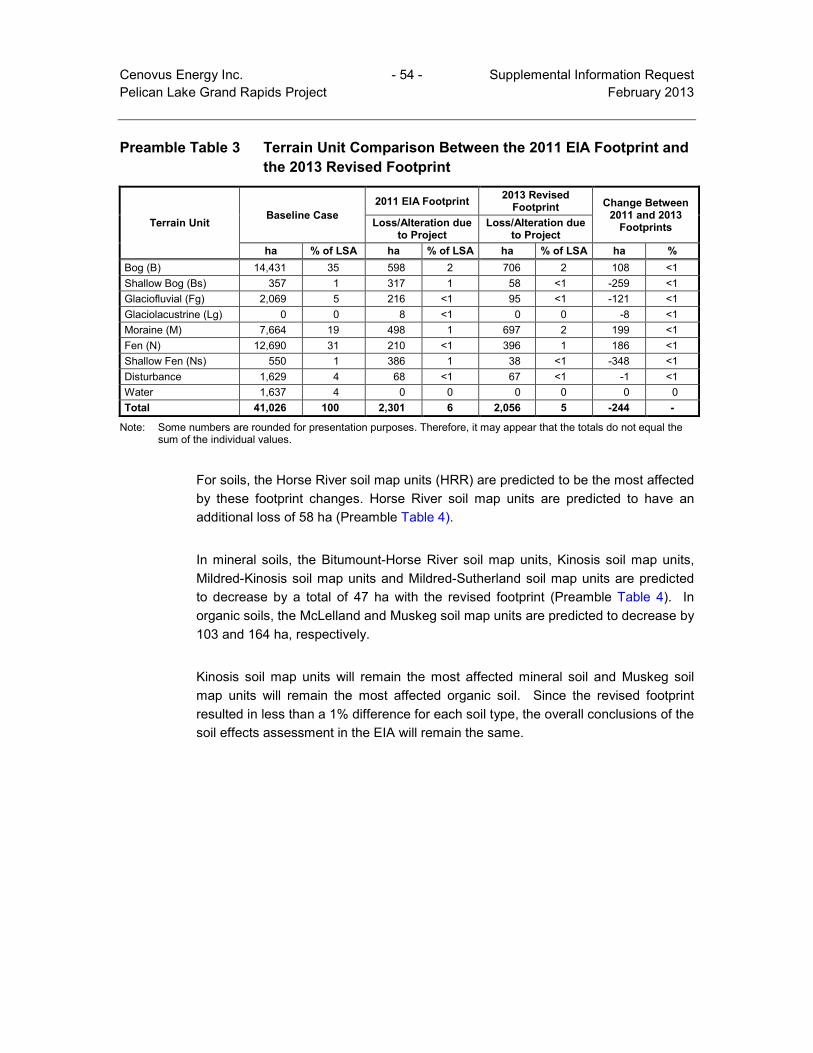
Based on the revised footprint, there will be a net 244 ha (0.5%) decrease in the total disturbance area of the Project (2,056 ha total). This will result in a net decrease of 244 ha of terrain and soil lost compared to the footprint presented in the EIA (Preamble Tables 3 and 4). The distribution of disturbance will change as outlined below.
The following terrain units will have increases in disturbance:
• bog terrain units (B), which will have an additional loss of 108 ha;
• moraine terrain units (M), which will have an additional loss of 199 ha; and
• fen terrain units (N), which will have an additional loss of 186 ha.
The loss of shallow bog (Bs), glaciofluvial (Fg), glaciolacustrine (Lg), and shallow fen (Ns) terrain units are predicted to decrease by a total of 736 ha with the revised footprint (Preamble Table 3). Since the revised footprint changes result in less than a 1% difference in overall disturbance (Preamble Table 3) for each terrain type and no terrain type is disproportionately affected relative to its distribution in the LSA, the overall effects assessment conclusions for terrain in the EIA will remain the same.
Cenovus Energy Inc. - 54 - Supplemental Information Request Pelican Lake Grand Rapids Project February 2013 Preamble Table 3 Terrain Unit Comparison Between the 2011 EIA Footprint and
the 2013 Revised Footprint
Terrain Unit Baseline Case
2011 EIA Footprint 2013 Revised Footprint Change Between
2011 and 2013 Footprints Loss/Alteration due
to Project Loss/Alteration due
to Project ha % of LSA ha % of LSA ha % of LSA ha %
Bog (B) 14,431 35 598 2 706 2 108 <1 Shallow Bog (Bs) 357 1 317 1 58 <1 -259 <1 Glaciofluvial (Fg) 2,069 5 216 <1 95 <1 -121 <1 Glaciolacustrine (Lg) 0 0 8 <1 0 0 -8 <1 Moraine (M) 7,664 19 498 1 697 2 199 <1 Fen (N) 12,690 31 210 <1 396 1 186 <1 Shallow Fen (Ns) 550 1 386 1 38 <1 -348 <1 Disturbance 1,629 4 68 <1 67 <1 -1 <1 Water 1,637 4 0 0 0 0 0 0 Total 41,026 100 2,301 6 2,056 5 -244 -
Note: Some numbers are rounded for presentation purposes. Therefore, it may appear that the totals do not equal the sum of the individual values.
For soils, the Horse River soil map units (HRR) are predicted to be the most affected by these footprint changes. Horse River soil map units are predicted to have an additional loss of 58 ha (Preamble Table 4).
In mineral soils, the Bitumount-Horse River soil map units, Kinosis soil map units, Mildred-Kinosis soil map units and Mildred-Sutherland soil map units are predicted to decrease by a total of 47 ha with the revised footprint (Preamble Table 4). In organic soils, the McLelland and Muskeg soil map units are predicted to decrease by 103 and 164 ha, respectively.
Kinosis soil map units will remain the most affected mineral soil and Muskeg soil map units will remain the most affected organic soil. Since the revised footprint resulted in less than a 1% difference for each soil type, the overall conclusions of the soil effects assessment in the EIA will remain the same.
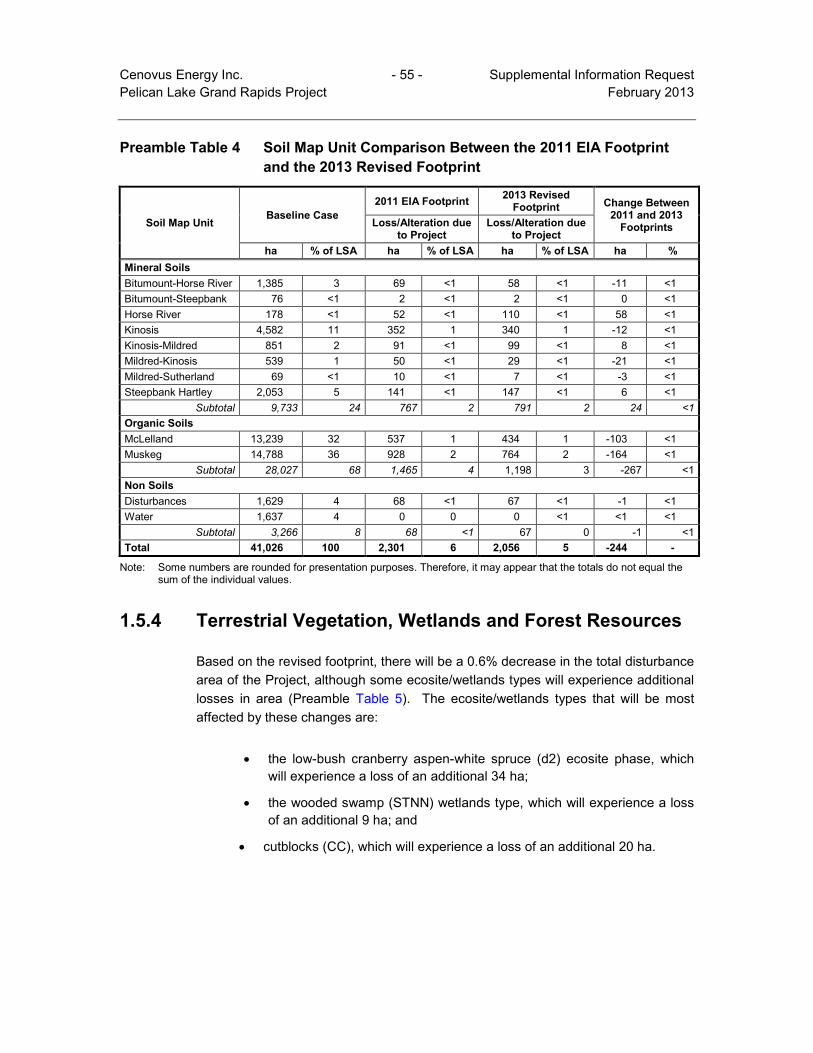
Cenovus Energy Inc. - 55 - Supplemental Information Request Pelican Lake Grand Rapids Project February 2013 Preamble Table 4 Soil Map Unit Comparison Between the 2011 EIA Footprint
and the 2013 Revised Footprint
Soil Map Unit Baseline Case
2011 EIA Footprint 2013 Revised Footprint Change Between
2011 and 2013 Footprints Loss/Alteration due
to Project Loss/Alteration due
to Project ha % of LSA ha % of LSA ha % of LSA ha %
Mineral Soils Bitumount-Horse River 1,385 3 69 <1 58 <1 -11 <1 Bitumount-Steepbank 76 <1 2 <1 2 <1 0 <1 Horse River 178 <1 52 <1 110 <1 58 <1 Kinosis 4,582 11 352 1 340 1 -12 <1 Kinosis-Mildred 851 2 91 <1 99 <1 8 <1 Mildred-Kinosis 539 1 50 <1 29 <1 -21 <1 Mildred-Sutherland 69 <1 10 <1 7 <1 -3 <1 Steepbank Hartley 2,053 5 141 <1 147 <1 6 <1
Subtotal 9,733 24 767 2 791 2 24 <1 Organic Soils McLelland 13,239 32 537 1 434 1 -103 <1 Muskeg 14,788 36 928 2 764 2 -164 <1
Subtotal 28,027 68 1,465 4 1,198 3 -267 <1 Non Soils Disturbances 1,629 4 68 <1 67 <1 -1 <1 Water 1,637 4 0 0 0 <1 <1 <1
Subtotal 3,266 8 68 <1 67 0 -1 <1 Total 41,026 100 2,301 6 2,056 5 -244 -
Note: Some numbers are rounded for presentation purposes. Therefore, it may appear that the totals do not equal the sum of the individual values.
1.5.4 Terrestrial Vegetation, Wetlands and Forest Resources
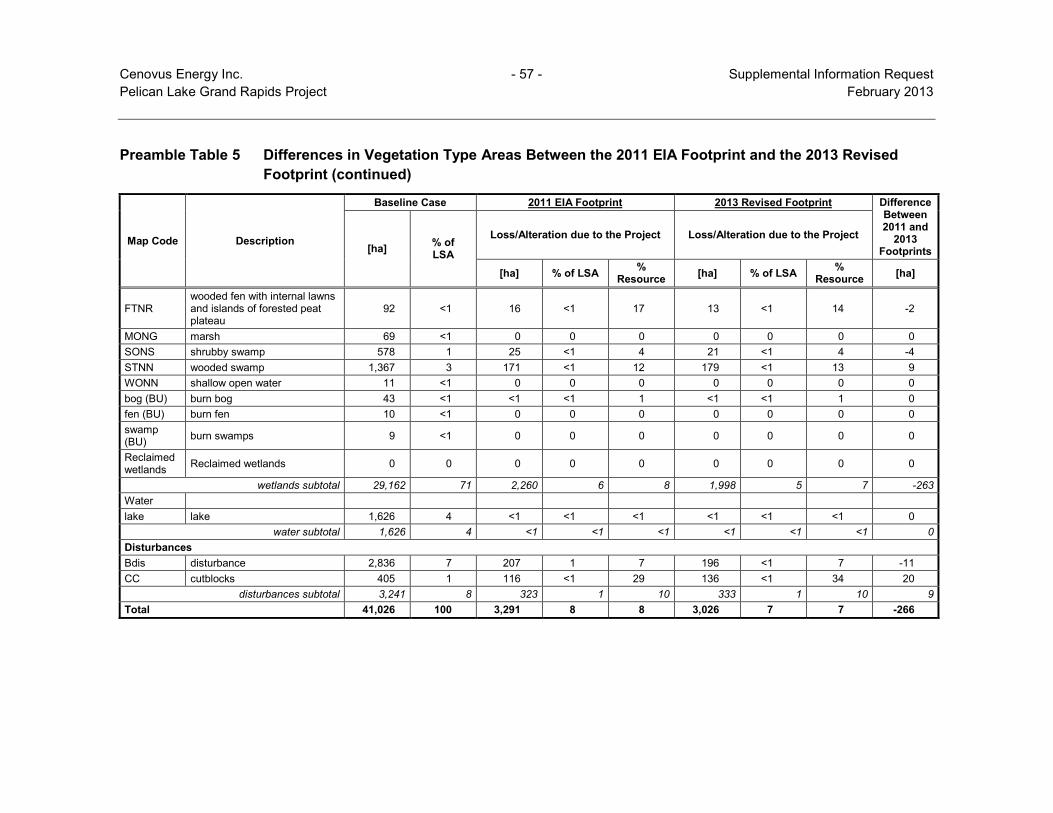
Based on the revised footprint, there will be a 0.6% decrease in the total disturbance area of the Project, although some ecosite/wetlands types will experience additional losses in area (Preamble Table 5). The ecosite/wetlands types that will be most affected by these changes are:
• the low-bush cranberry aspen-white spruce (d2) ecosite phase, which will experience a loss of an additional 34 ha;
• the wooded swamp (STNN) wetlands type, which will experience a loss of an additional 9 ha; and
• cutblocks (CC), which will experience a loss of an additional 20 ha.

Cenovus Energy Inc. - 56 - Supplemental Information Request Pelican Lake Grand Rapids Project February 2013
Preamble Table 5 Differences in Vegetation Type Areas Between the 2011 EIA Footprint and the 2013 Revised Footprint
Map Code Description
Baseline Case 2011 EIA Footprint 2013 Revised Footprint Difference Between 2011 and
2013 Footprints [ha] % of
LSA
Loss/Alteration due to the Project Loss/Alteration due to the Project
[ha] % of LSA % Resource [ha] % of LSA %
Resource [ha]
Terrestrial Ecosite Phases a1 lichen jack pine 63 <1 11 <1 17 7 <1 12 -3 b1 blueberry jack pine-aspen 458 1 61 <1 13 62 <1 13 1 b3 blueberry aspen–white spruce 15 <1 <1 <1 <1 <1 <1 <1 0
b4 blueberry white spruce-jack pine 43 <1 2 <1 5 1 <1 3 -1
c1 Labrador tea–mesic jack pine-black spruce 728 2 86 <1 12 74 <1 10 -12
d1 low-bush cranberry aspen 1,865 5 216 1 12 203 <1 11 -14
d2 low-bush cranberry aspen-white spruce 2,040 5 187 <1 9 222 1 11 34
d3 low-bush cranberry white spruce 333 1 36 <1 11 27 <1 8 -9
e1 dogwood balsam poplar–aspen 45 <1 2 <1 4 3 <1 7 1
e2 dogwood balsam poplar–white spruce 1 <1 1 <1 97 1 <1 97 0
g1 Labrador tea–subhygric black spruce–jack pine 1,406 3 104 <1 7 95 <1 7 -10
terrestrial ecosite phases subtotal 6,998 17 707 2 10 695 2 10 -12 Wetlands BFNN forested bog 31 <1 7 <1 23 7 <1 22 0 BTNI wooded bog with internal lawns 2,200 5 188 <1 9 153 <1 7 -35 BTNN wooded bog 11,955 29 1,062 3 9 935 2 8 -127 FONG graminoid fen 449 1 12 <1 3 10 <1 2 -1 FONS shrubby fen 3,830 9 224 1 6 196 <1 5 -29 FTNI wooded fen with internal lawns 778 2 37 <1 5 29 <1 4 -9 FTNN wooded fen 7,742 19 518 1 7 455 1 6 -63
Cenovus Energy Inc. - 57 - Supplemental Information Request Pelican Lake Grand Rapids Project February 2013
Preamble Table 5 Differences in Vegetation Type Areas Between the 2011 EIA Footprint and the 2013 Revised Footprint (continued)
Map Code Description
Baseline Case 2011 EIA Footprint 2013 Revised Footprint Difference Between 2011 and
2013 Footprints [ha] % of
LSA
Loss/Alteration due to the Project Loss/Alteration due to the Project
[ha] % of LSA % Resource [ha] % of LSA %
Resource [ha]
FTNR wooded fen with internal lawns and islands of forested peat plateau
92 <1 16 <1 17 13 <1 14 -2
MONG marsh 69 <1 0 0 0 0 0 0 0 SONS shrubby swamp 578 1 25 <1 4 21 <1 4 -4 STNN wooded swamp 1,367 3 171 <1 12 179 <1 13 9 WONN shallow open water 11 <1 0 0 0 0 0 0 0 bog (BU) burn bog 43 <1 <1 <1 1 <1 <1 1 0 fen (BU) burn fen 10 <1 0 0 0 0 0 0 0 swamp (BU) burn swamps 9 <1 0 0 0 0 0 0 0
Reclaimed wetlands Reclaimed wetlands 0 0 0 0 0 0 0 0 0
wetlands subtotal 29,162 71 2,260 6 8 1,998 5 7 -263 Water lake lake 1,626 4 <1 <1 <1 <1 <1 <1 0
water subtotal 1,626 4 <1 <1 <1 <1 <1 <1 0 Disturbances Bdis disturbance 2,836 7 207 1 7 196 <1 7 -11 CC cutblocks 405 1 116 <1 29 136 <1 34 20
disturbances subtotal 3,241 8 323 1 10 333 1 10 9 Total 41,026 100 3,291 8 8 3,026 7 7 -266

Cenovus Energy Inc. - 58 - Supplemental Information Request Pelican Lake Grand Rapids Project February 2013
These footprint changes will not result in appreciable changes to the results of the Key Indicator Resources (KIR) effects analysis for:
• lichen jack pine (a1) communities;
• riparian communities;
• old growth forests;
• peatlands (bogs and fens);
• patterned fens;
• tracked ecological and special plant communities;
• productive forests;
• rare plants; and
• traditional use plants.
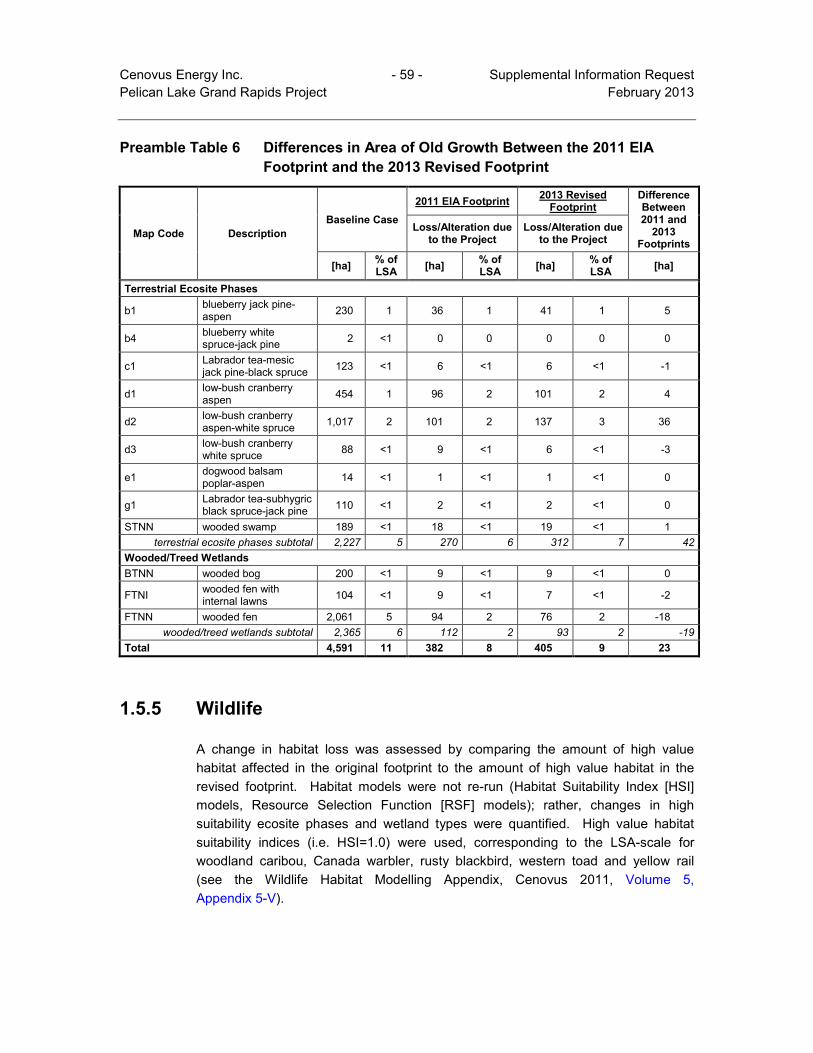
Impacts to old-growth forests will increase by 23 ha, with the low-bush cranberry aspen-white spruce (d2) ecosite phase, experiencing the majority of the additional losses to old growth forest at 36 ha (Preamble Table 6). Additionally, there should be no changes to the number of listed plant species affected by the Project. Thus, based on these results, the overall conclusions of the effects assessment for vegetation and wetlands in the EIA will remain the same.
Cenovus Energy Inc. - 59 - Supplemental Information Request Pelican Lake Grand Rapids Project February 2013
Preamble Table 6 Differences in Area of Old Growth Between the 2011 EIA Footprint and the 2013 Revised Footprint
Map Code Description Baseline Case
2011 EIA Footprint 2013 Revised Footprint
Difference Between 2011 and
2013 Footprints
Loss/Alteration due to the Project
Loss/Alteration due to the Project
[ha] % of LSA [ha] % of
LSA [ha] % of LSA [ha]
Terrestrial Ecosite Phases
b1 blueberry jack pine-aspen 230 1 36 1 41 1 5
b4 blueberry white spruce-jack pine 2 <1 0 0 0 0 0
c1 Labrador tea-mesic jack pine-black spruce 123 <1 6 <1 6 <1 -1
d1 low-bush cranberry aspen 454 1 96 2 101 2 4
d2 low-bush cranberry aspen-white spruce 1,017 2 101 2 137 3 36
d3 low-bush cranberry white spruce 88 <1 9 <1 6 <1 -3
e1 dogwood balsam poplar-aspen 14 <1 1 <1 1 <1 0
g1 Labrador tea-subhygric black spruce-jack pine 110 <1 2 <1 2 <1 0
STNN wooded swamp 189 <1 18 <1 19 <1 1 terrestrial ecosite phases subtotal 2,227 5 270 6 312 7 42
Wooded/Treed Wetlands BTNN wooded bog 200 <1 9 <1 9 <1 0
FTNI wooded fen with internal lawns 104 <1 9 <1 7 <1 -2
FTNN wooded fen 2,061 5 94 2 76 2 -18 wooded/treed wetlands subtotal 2,365 6 112 2 93 2 -19
Total 4,591 11 382 8 405 9 23
1.5.5 Wildlife
A change in habitat loss was assessed by comparing the amount of high value habitat affected in the original footprint to the amount of high value habitat in the revised footprint. Habitat models were not re-run (Habitat Suitability Index [HSI] models, Resource Selection Function [RSF] models); rather, changes in high suitability ecosite phases and wetland types were quantified. High value habitat suitability indices (i.e. HSI=1.0) were used, corresponding to the LSA-scale for woodland caribou, Canada warbler, rusty blackbird, western toad and yellow rail (see the Wildlife Habitat Modelling Appendix, Cenovus 2011, Volume 5, Appendix 5-V).

Cenovus Energy Inc. - 60 - Supplemental Information Request Pelican Lake Grand Rapids Project February 2013
The direct change in habitat loss for woodland caribou is less than 0.1% (Preamble Table 7), which will not change the magnitude of effect for effects due to direct habitat loss (i.e., site clearing). Local and regional Environmental Consequence will remain unchanged.
The indirect effects (i.e., sensory disturbance, surface water hydrology and fragmentation) for woodland caribou were already assessed as having a high magnitude. Local and regional Environmental Consequence will remain unchanged.
Preamble Table 7 Changes in Woodland Caribou High Value Habitat Suitability Index (HSI) at the Local Study Area Scale
Species High HSI (1.0)
Available [ha]
2011 EIA Footprint
[ha]
2013 Revised Footprint
[ha] Difference
[ha] % Change
Woodland Caribou
a1 63 11 7 -4 -0.063 b3 15 <1 <0.1 <1 <0.100 BFNN 30 7 7 0 0.000 BTNI 2,200 188 153 -35 -0.016 BTNN 11,955 1,062 935 -127 -0.011 c1 728 86 74 -12 -0.016 g1 1,406 104 95 -9 -0.006
Total 16,397 1,458 1,271 -187 -0.011
Note: A negative value indicates a reduction in footprint.
The direct change in habitat loss for Canada warbler is less than 0.1% (Preamble Table 8), which will not change the magnitude of effect for effects due to direct habitat loss (i.e., site clearing). Local and regional Environmental Consequence will remain unchanged.
The indirect effects (i.e., sensory disturbance, surface water hydrology and fragmentation) for Canada Warbler were already assessed as having a high magnitude. Local and regional Environmental Consequence will remain unchanged.
Preamble Table 8 Changes in Canada Warbler High Value Habitat Suitability Index (HSI) at the Local Study Area Scale
Species High HSI (1.0)
Available [ha]
2011 EIA Footprint
[ha]
2013 Revised Footprint
[ha] Difference
[ha] % Change
Canada Warbler
b2 0 0 - - - d1 1,864 216 203 -13 -0.007 e1 45 2 1 -1 -0.022 f1 0 0 - - -
Total 1,909 218 204 -14 -0.007
Note: A negative value indicates a reduction in footprint.

Cenovus Energy Inc. - 61 - Supplemental Information Request Pelican Lake Grand Rapids Project February 2013
The direct change in habitat loss for rusty blackbird is less than 0.1% (Preamble Table 9), which will not change the magnitude of effect for effects due to direct habitat loss (i.e., site clearing). Local and regional Environmental Consequence will remain unchanged.
The indirect effects (i.e., sensory disturbance, surface water hydrology and fragmentation) for rusty blackbird were already assessed as having a high magnitude. Local and regional Environmental Consequence will remain unchanged.
Preamble Table 9 Changes in Rusty Blackbird High Value Habitat Suitability Index (HSI) at the Local Study Area Scale
Species High HSI (1.0) Available
2011 EIA Footprint
[ha]
2013 Revised Footprint
[ha] Difference % Change
Rusty Blackbird
FONS 3,830 224 196 -28 -0.007 FTNI 778 37 29 -8 -0.010 FTNN 7,742 518 455 -63 -0.008 FTNR 92 16 13 -3 -0.033 FTPN 0 0 0 - - SONS 578 25 21 -4 -0.007 STNN 1,367 171 179 8 0.006 Sh 0 0 0 - -
Total 14,387 991 893 -98 -0.007
Note: A negative value indicates a reduction in footprint.
The direct change in habitat loss for western toad is less than 0.1% (Preamble Table 10), which will not change the magnitude of effect for effects due to direct habitat loss (i.e., site clearing). Local and regional Environmental Consequence will remain unchanged.
The indirect effects (i.e., sensory disturbance, surface water hydrology and fragmentation) for western toad were already assessed as having a high magnitude. Local and regional Environmental Consequence will remain unchanged.

Cenovus Energy Inc. - 62 - Supplemental Information Request Pelican Lake Grand Rapids Project February 2013
Preamble Table 10 Changes in Western Toad High Value Habitat Suitability Index (HSI) at the Local Study Area Scale
Species High HSI (1.0) Available
2011 EIA Footprint
[ha]
2013 Revised Footprint
[ha] Difference % Change
Western Toad
FONG 449 12 10 -2 -0.004 FONS 3,830 224 196 -28 -0.007 FOPN 0 0 0 - - FTNI 778 37 29 -8 -0.010 FTPN 0 0 0 - - MONG 455 0 0 - - WONN 11 <1 0 <1 <0.100 NWL 0 0 0 0 -
Total 5,523 273 235 -38 -0.007
Note: A negative value indicates a reduction in footprint.
The direct change in habitat loss for yellow rail is less than 0.1% (Preamble Table 11), which will not change the magnitude of effect for effects due to direct habitat loss (i.e., site clearing). Local and regional Environmental Consequence will remain unchanged.
The indirect effects (i.e., sensory disturbance, surface water hydrology and fragmentation) for yellow rail were already assessed as having a high magnitude. Local and regional Environmental Consequence will remain unchanged.
Preamble Table 11 Changes in Yellow Rail High Value Habitat Suitability Index (HSI) at the Local Study Area Scale
Species High HSI (1.0) Available
2011 EIA Footprint
[ha]
2013 Revised Footprint
[ha] Difference % Change
Yellow Rail FONG 449 12 10 -2 -0.004 FONS 3830 224 196 -28 -0.007 MONG 70 0 0 - -
Total 4,345 236 239 3 0.001
Note: A negative value indicates a reduction in footprint.
Habitat variables predicting moose and fisher/marten probability of occurrence at the LSA scale are not linked to direct habitat features affected by the project, but rather are more related to landscape features (i.e., slope) and patterns (i.e., distance to road, distance to line feature, distance to edge) (Preamble Table 12). Magnitude of direct habitat loss should not change, which means that Local and regional Environmental Consequence will remain unchanged. No changes in indirect effects are anticipated.

Cenovus Energy Inc. - 63 - Supplemental Information Request Pelican Lake Grand Rapids Project February 2013
Preamble Table 12 Fisher/Marten and Moose Habitat Variables Included in Local Study Area Scale Resource Selection Function
Species RSF Habitat Variables
Negative Correlation Positive Correlation
Fisher/ Marten stand age distance to nearest edge C elevation
n/a
Moose stand age distance to nearest road
distance to nearest edge C distance to nearest linear feature slope
Habitat variables predicting moose and fisher/marten probability of occurrence at the RSA scale are not linked to direct habitat features affected by the Project, but are related to landscape features (i.e., elevation, slope) and patterns (i.e., distance to stream, distance to wetland, stream density) (Preamble Table 13). Magnitude of direct habitat loss should not change, which means that Local and regional Environmental Consequence will remain unchanged.
Preamble Table 13 Fisher/Marten and Moose Habitat Variables Included in Regional Study Area Scale Resource Selection Function
Species RSF Habitat Variables
Negative Correlation Positive Correlation
Fisher/ Marten elevation stream density distance to nearest wetlands
slope
Moose elevation stream density distance to stream
elevation/stream density interaction
1.5.6 Biodiversity
Introduction
The Project EIA reported residual effects in the LSA that resulted in a low environmental consequence at the species-level and a moderate environmental consequence at both the ecosystem and landscape levels of biodiversity (Volume 5, Section 6.4.3; Cenovus 2011). The biodiversity effects analysis in the Project EIA was based on a 3,291 ha disturbance footprint. The effects of revising the Project’s disturbance footprint to 3,026 ha are evaluated below by considering changes to the three levels of biodiversity relative to the EIA footprint extent.
Cenovus Energy Inc. - 64 - Supplemental Information Request Pelican Lake Grand Rapids Project February 2013
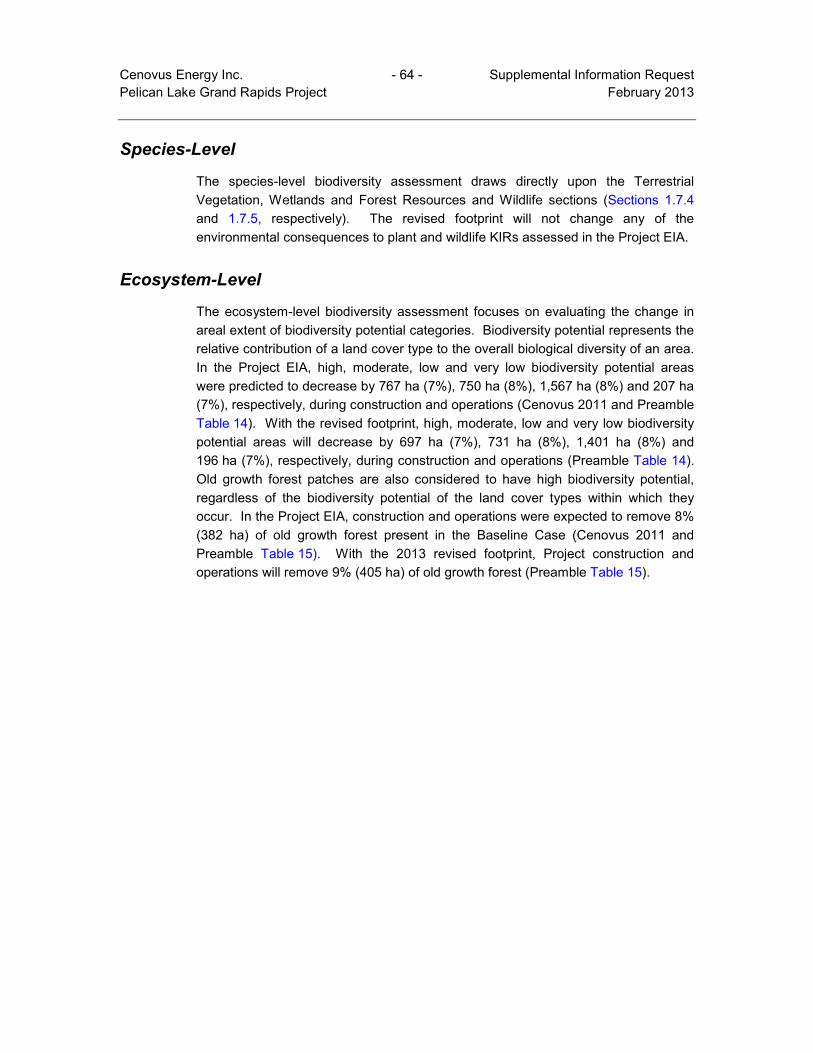
Species-Level
The species-level biodiversity assessment draws directly upon the Terrestrial Vegetation, Wetlands and Forest Resources and Wildlife sections (Sections 1.7.4 and 1.7.5, respectively). The revised footprint will not change any of the environmental consequences to plant and wildlife KIRs assessed in the Project EIA.
Ecosystem-Level
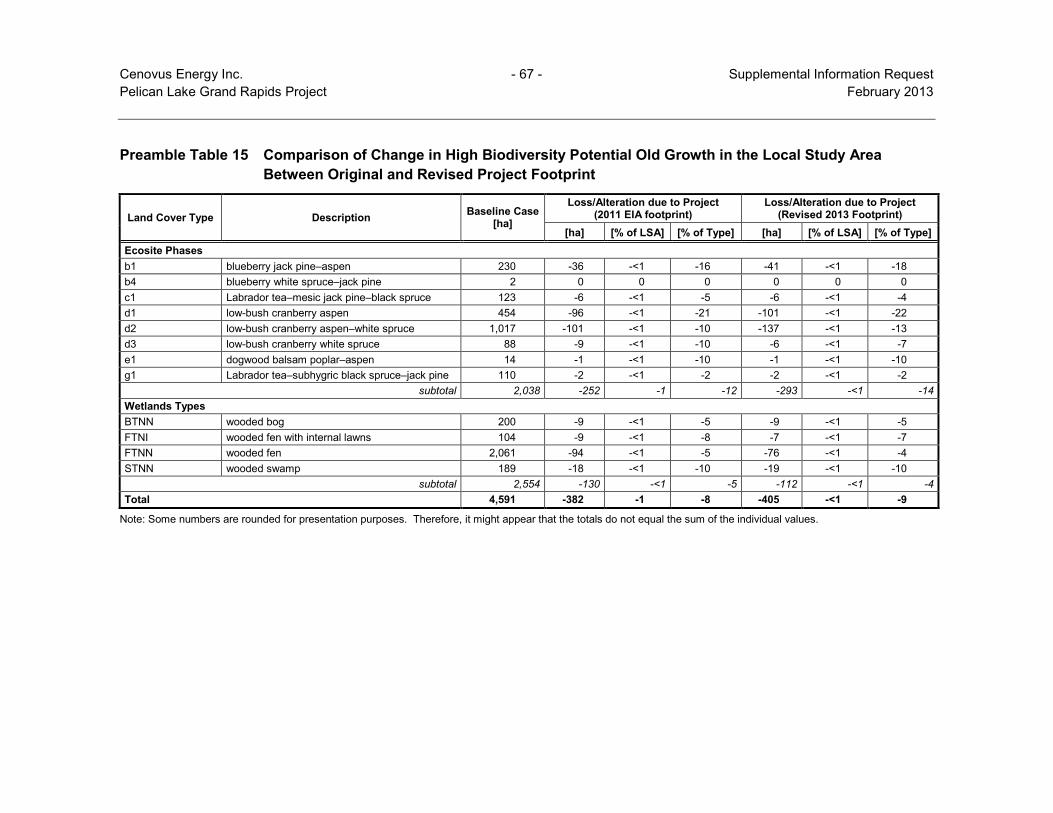
The ecosystem-level biodiversity assessment focuses on evaluating the change in areal extent of biodiversity potential categories. Biodiversity potential represents the relative contribution of a land cover type to the overall biological diversity of an area. In the Project EIA, high, moderate, low and very low biodiversity potential areas were predicted to decrease by 767 ha (7%), 750 ha (8%), 1,567 ha (8%) and 207 ha (7%), respectively, during construction and operations (Cenovus 2011 and Preamble Table 14). With the revised footprint, high, moderate, low and very low biodiversity potential areas will decrease by 697 ha (7%), 731 ha (8%), 1,401 ha (8%) and 196 ha (7%), respectively, during construction and operations (Preamble Table 14). Old growth forest patches are also considered to have high biodiversity potential, regardless of the biodiversity potential of the land cover types within which they occur. In the Project EIA, construction and operations were expected to remove 8% (382 ha) of old growth forest present in the Baseline Case (Cenovus 2011 and Preamble Table 15). With the 2013 revised footprint, Project construction and operations will remove 9% (405 ha) of old growth forest (Preamble Table 15).

Cenovus Energy Inc. - 65 - Supplemental Information Request Pelican Lake Grand Rapids Project February 2013 Preamble Table 14 Comparison of Change in Biodiversity Potential Categories in the Local Study Area Between
Original and Revised Project Footprint
Land Cover Type Baseline Case [ha]
Loss/Alteration due to Project (2011 EIA Footprint)
Loss/Alteration due to Project (Revised 2013Footprint)
[ha] [% of LSA] [% of Type] [ha] [% of LSA] [% of Type] High Biodiversity Potential b3 blueberry aspen–white spruce 15 -<1 -<1 -<1 -<1 -<1 -<1 FTNI wooded fen with internal lawns 778 -37 -<1 -5 -29 -<1 -4 FTNN wooded fen 7,742 -518 -1 -7 -455 -1 -6
FTNR wooded fen with islands of forested peat plateau and internal lawns 92 -16 -<1 -17 -13 -<1 -14
SONS shrubby swamp 578 -25 -<1 -4 -21 -<1 -4 STNN wooded swamp 1,367 -171 -<1 -12 -179 -<1 -13
subtotal 10,571 -767 -2 -7 -697 -2 -7 Moderate Biodiversity Potential a1 lichen jack pine 63 -11 -<1 -17 -7 -<1 -12 b1 blueberry jack pine–aspen 458 -61 -<1 -13 -62 -<1 -13 d1 low-bush cranberry aspen 1,865 -216 -<1 -12 -203 -<1 -11 d2 low-bush cranberry aspen–white spruce 2,040 -187 -<1 -9 -222 -<1 -11 d3 low-bush cranberry white spruce 333 -36 -<1 -11 -27 -<1 -8 e1 dogwood balsam poplar–aspen 45 -2 -<1 -4 -3 -<1 -7 e2 dogwood balsam poplar–white spruce 1 -1 -<1 -97 -1 -<1 -97 FONG graminoid fen 449 -12 -<1 -3 -10 -<1 -2 FONS shrubby fen 3,830 -224 -<1 -6 -196 -<1 -5 MONG graminoid marsh 69 0 0 0 0 0 0 WONN shallow open water 11 0 0 0 0 0 0
subtotal 9,163 -750 -2 -8 -731 -2 -8

Cenovus Energy Inc. - 66 - Supplemental Information Request Pelican Lake Grand Rapids Project February 2013
Preamble Table 14 Comparison of Change in Biodiversity Potential Categories in the Local Study Area Between Original and Revised Project Footprint (continued)
Land Cover Type Baseline Case [ha]
Loss/Alteration due to Project (2011 EIA Footprint)
Loss/Alteration due to Project (Revised 2013Footprint)
[ha] [% of LSA] [% of Type] [ha] [% of LSA] [% of Type] Low Biodiversity Potential b4 blueberry white spruce–jack pine 43 -2 -<1 -5 -1 -<1 -3 BFNN forested bog 31 -7 -<1 -23 -7 -<1 -22 BTNI wooded bog with internal lawns 2,200 -188 -<1 -9 -153 -<1 -7 BTNN wooded bog 11,955 -1,062 -3 -9 -935 -2 -8 BUw burned wetlands 62 -<1 -<1 -<1 -<1 -<1 -<1 c1 Labrador tea–mesic jack pine–black spruce 728 -86 -<1 -12 -74 -<1 -10 CC cutblock 405 -116 -<1 -29 -136 -<1 -34 g1 Labrador tea–subhygric black spruce–jack pine 1,406 -104 -<1 -7 -95 -<1 -7 lake lake 1,626 -<1 -<1 -<1 -<1 -<1 -<1
subtotal 18,456 -1,567 -4 -8 -1,401 -3 -8 Very Low Biodiversity Potential DIS disturbance(a) 2,836 -207(b) -<1 -7 -196(b) -<1 -7 Total 41,026 -3,291 -8 - -3,026 -7 -
(a) Includes urban, industrial and other human disturbances within the LSA. (b) This is the total amount of previously disturbed areas that fall within the Project footprint. - = No value. Note: Some numbers are rounded for presentation purposes. Therefore, it might appear that the totals do not equal the sum of the individual values.
Cenovus Energy Inc. - 67 - Supplemental Information Request Pelican Lake Grand Rapids Project February 2013
Preamble Table 15 Comparison of Change in High Biodiversity Potential Old Growth in the Local Study Area Between Original and Revised Project Footprint
Land Cover Type Description Baseline Case [ha]
Loss/Alteration due to Project (2011 EIA footprint)
Loss/Alteration due to Project (Revised 2013 Footprint)
[ha] [% of LSA] [% of Type] [ha] [% of LSA] [% of Type] Ecosite Phases b1 blueberry jack pine–aspen 230 -36 -<1 -16 -41 -<1 -18 b4 blueberry white spruce–jack pine 2 0 0 0 0 0 0 c1 Labrador tea–mesic jack pine–black spruce 123 -6 -<1 -5 -6 -<1 -4 d1 low-bush cranberry aspen 454 -96 -<1 -21 -101 -<1 -22 d2 low-bush cranberry aspen–white spruce 1,017 -101 -<1 -10 -137 -<1 -13 d3 low-bush cranberry white spruce 88 -9 -<1 -10 -6 -<1 -7 e1 dogwood balsam poplar–aspen 14 -1 -<1 -10 -1 -<1 -10 g1 Labrador tea–subhygric black spruce–jack pine 110 -2 -<1 -2 -2 -<1 -2
subtotal 2,038 -252 -1 -12 -293 -<1 -14 Wetlands Types BTNN wooded bog 200 -9 -<1 -5 -9 -<1 -5 FTNI wooded fen with internal lawns 104 -9 -<1 -8 -7 -<1 -7 FTNN wooded fen 2,061 -94 -<1 -5 -76 -<1 -4 STNN wooded swamp 189 -18 -<1 -10 -19 -<1 -10
subtotal 2,554 -130 -<1 -5 -112 -<1 -4 Total 4,591 -382 -1 -8 -405 -<1 -9
Note: Some numbers are rounded for presentation purposes. Therefore, it might appear that the totals do not equal the sum of the individual values.

Cenovus Energy Inc. - 68 - Supplemental Information Request Pelican Lake Grand Rapids Project February 2013
Landscape-Level
The landscape-level biodiversity assessment considers changes to the areal extent of land cover categories (e.g., terrestrial, wetlands, natural, forested). These changes illustrate the effects of the Project on general landscape patterns. In the Project EIA, the changes in area of land cover categories due to construction and operations ranged from less than 1% of Baseline Case to 10% (Cenovus 2011 and Preamble Tables 16 and 17). With the revised 2013 footprint, Project construction and operations will still cause changes in area of land cover categories within the range of less than 1% to 10% (Preamble Tables 16 and 17).
Preamble Table 16 Comparison of Change in Cover Categories in the Local Study Area Between Original and Revised Project Footprint
Cover Category
Baseline Case [ha]
Loss/Alteration due to Project (2011 EIA Footprint)
Loss/Alteration due to Project (Revised 2013 Footprint)
[ha] [% of LSA] [% of Type] [ha] [% of LSA] [% of Type] burn 62 -<1 -<1 -<1 -<1 -<1 -<1 disturbed(a) 3,242 -323(b) -<1 -10 -333(b) -<1 -10 terrestrial 6,998 -708 -2 -10 -695 -2 -10 water 1,626 -<1 -<1 -<1 -<1 -<1 -<1 wetlands 29,098 -2,260 -6 -8 -1,997 -5 -7 Total 41,026 -3,292 -8 -8 -3,026 -7 -7
(a) Includes cutblocks, urban, industrial and other human disturbances within the LSA. (b) This is the total amount of previously disturbed areas that fall within the Project footprint. Note: Some numbers are rounded for presentation purposes. Therefore, it might appear that the totals do not equal the
sum of the individual values.
Preamble Table 17 Comparison of Change in Natural, Disturbed, Forested and Non-Forested Areas in the Local Study Area Between Original and Revised Project Footprint
Cover Category
Baseline Case [ha]
Loss/Alteration due to Project (2011 EIA Footprint)
Loss/Alteration due to Project (Revised 2013 Footprint)
[ha] [% of LSA] [% of Type] [ha] [% of LSA] [% of Type] natural 37,785 -2,969 -7 -8 -2,693 -7 -7 disturbed(a) 3,241 -323(b) -<1 -10 -333(b) -<1 -10 forested 31,161 -2,707 -7 -9 -2,465 -6 -8 non-forested 6,624 -262 -<1 -4 -228 -<1 -3
(a) Includes cutblocks, urban, industrial and other human disturbances within the LSA. (b) This is the total amount of previously disturbed areas that fall within the Project footprint.

Cenovus Energy Inc. - 69 - Supplemental Information Request Pelican Lake Grand Rapids Project February 2013
Effect of Revised Footprint
Revising the Project’s disturbance footprint will not change the residual effects to biodiversity potential or any of the landscape- and species-level indicators. Therefore, the revised footprint will not change the overall environmental consequences assessed in the Project EIA for any of the three levels of biodiversity.
1.5.7 Conservation and Reclamation
Cenovus’s proposed update to Project footprint will result in a 8% decrease in terrestrial disturbance as compared to what was proposed in the December 2011 Application (Cenovus 2011). Preamble Table 18 shows the areas of soil and vegetation disturbance for the 2011 Application and the revised footprint.
Preamble Table 18 Project Components and Disturbance Areas: 2011 Application and Revised Footprint
Project Component Soil Disturbed
2011 EIA [ha]
Soils Disturbed Revised 2013
Footprint [ha]
Vegetation Disturbed 2011 EIA
[ha]
Vegetation Disturbed Revised
2013 Footprint [ha]
Plant Site 151 151 151 151 Central Plant Facility Infrastructure(a) 6 261 6 261
Well Pads 1,617 1,120 1,617 1,120 Camp 12 19 12 19 Access Roads 254 249 254 249 Borrow Areas 256 252 256 252 Associated Components/Infrastructure(b) 4 3 994 971
Total 2,301 2,056 3,291 3,026 (a) Central Plant Facility Infrastructure includes plant access road, soil storage area, laydowns, offices, security gate,
medic sites, substation, effluent field, emergency services, orientation site, recreation area, administration and maintenance.
(b) Associated components and infrastructure includes pipelines, power lines, ROW and cleared areas.
The approach to conservation and reclamation will remain the same as previously submitted including the following:
• timber salvage;
• woody debris management;
• soil salvage parameters;
• soil stockpiling;
• soil placement parameters;
• component-specific reclamation strategies;

Cenovus Energy Inc. - 70 - Supplemental Information Request Pelican Lake Grand Rapids Project February 2013
• revegetation plans; and
• monitoring plans.
The numbers showing land capability, reclamation suitability and soil salvage and placement volumes will be slightly different, but changes will be negligible in the context of the whole Project. The numbers are currently conceptual and detailed assessments of these characteristics will be completed for each facility at the Pre-Disturbance Assessment phase including detailed soil and vegetation surveys on all development areas.
1.6 REFERENCES
AENV (Alberta Environment). 2008. Alberta Acid Deposition Management Framework. Air Policy Branch, Alberta Environment. Edmonton, AB.
Cenovus (Cenovus Energy Inc.). 2011. Application for Approval of the Pelican Lake Grand Rapids Project. Submitted to the Energy Resources Conservation Board and Alberta Environment and Water. December 2011. Calgary, AB.


