
Synopsis Report – Environmental Oil Spill Risk Assessment for the South Coast of Newfoundland EDITION 1 September 2007
TP 14740E(revised 11/2007)
TC-1002395
*TC-1002395*

Director Operations and Environmental Programs Marine Safety
Responsible Authority Approval The Director Operations and Environmental Programs is responsible for this document, including any change, correction, or update.
Original Date Issued: September 5, 2007 Date Revised: November 6, 2007
Prepared by: S.L. Ross Environmental Research Limited 717 Belfast Road Ottawa, ON K1G 0Z4 (613) 232-1564
© Her Majesty the Queen in Right of Canada, as represented by the Minister of Transport, 2007.
Permission is granted, by Transport Canada, to copy this TP 14740E as required. While use of this material has been authorized, Transport Canada shall not be responsible for the manner in which the information is presented, nor for any interpretations thereof. This TP 14740E may not be updated to reflect amendments made to the original content. For up-to-date information, contact Transport Canada.
TP 14740E (09/2007)
TC-1002395

i
DOCUMENT INFORMATION Title Synopsis Report - Environmental Oil Spill Risk for the South Coast of Newfoundland
TP No. 14740E Edition 1
Catalogue No. T29-23/2007E ISBN/ISSN 978-0-662-46925-4
Originator Program & Technical Training Services (AMSB)
Telephone
Tower C, Place de Ville Fax
330 Sparks Street, 11th Floor E-mail [email protected]
Ottawa, Ontario K1A 0N8 URL http://www.tc.gc.ca/MarineSafety
REVISIONS Last Review
Next Review
Revision No.
Date of Issue
Affected Pages
Author(s) Brief Description of Change

ii
TABLE OF CONTENTS
Executive Summary.......................................................................................................................1
1.0 Introduction...........................................................................................................................2
2.0 Stakeholder Consultation.....................................................................................................3
3.0 Area of Interest .....................................................................................................................4
4.0 Marine Traffic in the AOI....................................................................................................8
5.0 Oil Spill Frequency .............................................................................................................12
6.0 Representative Oil Spill Scenarios ....................................................................................21
7.0 Environmental Impact Assessment ...................................................................................22
8.0 Economic Impact Assessment............................................................................................24
9.0 Risk Results and Conclusion..............................................................................................31
10.0 Area Specific Factors and Future Trends ........................................................................34
11.0 Conclusions..........................................................................................................................37

iii
List of Figures Figure 1: Area of interest (AOI) for study...............................................................................4 Figure 2: General indication of traffic density from DND data ..............................................9 Figure 3: Placentia Bay tanker routes....................................................................................11 Figure 4: Hazard zones identified for the spill frequency analysis .......................................12
List of Tables Table 1: Summary of key hazards in study area ....................................................................6 Table 2: Vessel Transits for Port aux Basques (April 2004 to March 2005).........................9 Table 3: Vessel Movements, Placentia Bay and St. John’s VTS Zones
(April 04 to March 05)...........................................................................................10 Table 4: Transits and cargo volumes for locations in Placentia Bay ...................................10 Table 5: Volume transported through the AOI, Mbbls/yr....................................................11 Table 6: Hazard zones identified for spill frequency analysis .............................................13 Table 7: Fuel oil spill frequencies by vessel type and size (1985 to 2005) .........................14 Table 8: Predicted spill frequencies by size and hazard zone..............................................14 Table 9: Historical tanker spill rates for crude and refined product ....................................15 Table 10: Predicted annual spill frequencies for Placentia Bay.............................................15 Table 11: Predicted spill frequencies for Placentia Bay (years between spill events)...........16 Table 12: Cumulative spill frequency for Hazard Zone 1......................................................16 Table 13: Cumulative spill frequency for Hazard Zone 2......................................................17 Table 14: Cumulative spill frequency for Hazard Zone 3......................................................17 Table 15: Cumulative spill frequency for Hazard Zone 4......................................................17 Table 16: Cumulative spill frequency for Hazard Zone 5......................................................18 Table 17: Cumulative spill frequency for Hazard Zone 1 (years per spill event).................18 Table 18: Cumulative spill frequency for Hazard Zone 2 (years per spill event).................18 Table 19: Cumulative spill frequency for Hazard Zone 3 (years per spill event).................19 Table 20: Cumulative spill frequency for Hazard Zone 4 (years per spill event).................19 Table 21: Cumulative spill frequency for Hazard Zone 5 (years per spill event).................19 Table 22: Summary of estimated mortality rates for key bird species...................................23 Table 23: Economic effect on fisheries and fish processing in Hazard Zone 1,
medium persistence oil ..........................................................................................24 Table 24: Economic effect on fisheries and fish processing in Hazard Zone 1,
high-persistence oil ................................................................................................25 Table 25: Representative economic effect on fisheries,
medium-persistence oil scenarios ..........................................................................25 Table 26: Representative economic effect on fisheries,
high-persistence oil scenarios ................................................................................26 Table 27: Representative economic effect on aquaculture,
medium-persistence oil scenarios ..........................................................................26 Table 28: Representative economic effect on aquaculture,
high-persistence oil scenarios ................................................................................27 Table 29: Representative economic effect on tourism,
medium-persistence oil scenarios ..........................................................................27 Table 30: Representative economic effect on tourism,
high-persistence oil scenarios ................................................................................28

iv
Table 31: Cleanup costs for representative spill scenarios, medium-persistence oil ..........................................................................................28
Table 32: Cleanup costs for representative spill scenarios, high-persistence oil ................................................................................................29
Table 33: Total economic impact for representative spill scenarios, medium-persistence oil ..........................................................................................29
Table 34: Total economic impact for representative spill scenarios, high-persistence oil ................................................................................................29
Table 35: Total statistical loss for representative spill scenarios, vessel fuel spills .....................................................................................................31
Table 36: Total statistical loss for representative spill scenarios, tanker cargo spills ..................................................................................................31
Table 37: Summary of environmental risk, vessel fuel oil spills................................................................................................32
Table 38: Summary of environmental risk, tanker cargo oil spills .............................................................................................33
Table 39: Summary of 10-year change to economic risk, tanker cargo spills ..................................................................................................36

TP Synopsis Report – TP 14740E Environmental Oil Spill Risk Assessment for the South Coast of Newfoundland 1 of 37
EXECUTIVE SUMMARY
This report is a summary of all data, expert advice, and analysis gathered over the course of a one-year study of the oil spill risks for the south coast of Newfoundland. In order, the report describes:
• Stakeholder Consultation — Relevant organizations and the general public were consulted for their concerns on spill risks in the region.
• Area of Interest — A description of the key geographical and environmental hazards within the study area.
• Marine Traffic in AOI — A description of the marine traffic within the area;
• Oil Spill Frequency — An estimated of the frequency of oil spills within the area based on historical spill rates;
• Representative Oil Spill Scenarios — A description of several oil spill scenarios meant to represent credible events in the area;
• Environmental Impact Assessment — An estimate of the potential effect of oil spills on key species;
• Economic Impact Assessment — An estimate of the potential economic consequences of a significant oil spill;
• Risk Results and Conclusion — An estimate of the overall risk in the region, combining elements of probability and consequence; and
• Area Specific Factors and Future Trends — A description of potential changes in activity over the next 10 years that could lead to changes in the spill frequency estimations.

TP Synopsis Report – TP 14740E Environmental Oil Spill Risk Assessment for the South Coast of Newfoundland 2 of 37
1.0 INTRODUCTION
The study objective was to assess the risks of oil pollution in Canadian waters off the south coast of Newfoundland, including Placentia Bay, due to marine traffic in the area. For this study "oil" includes crude oil, fuel oil sludge, oil refuse and refined products (Oil as defined in Annex I of MARPOL 73/78, Chapter I - General, Regulation 1) carried by vessels. The study approach includes both of the key elements of risk: the probability of an oil spill occurring and the consequences of the spill should it occur.
The risk assessment was carried out in two phases. First, an initial estimate was made using existing information. Second, these initial estimates were reviewed and validated in a peer review process. This peer review included review studies by independent specialists on specific portions of the risk estimates and a consultation process involving authorities responsible for managing marine traffic in the area and local communities who could be affected by traffic and resulting spills.

TP Synopsis Report – TP 14740E Environmental Oil Spill Risk Assessment for the South Coast of Newfoundland 3 of 37
2.0 STAKEHOLDER CONSULTATION
Consultations were held with stakeholders over the period of June to September 2006. Within the context of this study, stakeholders are defined as any individual or organization that influences or could be affected by the decision-making processes regarding mitigation of risk from oil spills. A detailed record of the consultations is presented as Appendix Q of the study report. The stakeholders were categorised as:
1. The funders of the process, specifically Transport Canada and Fisheries and Oceans Canada / Canadian Coast Guard.
2. The Steering Committee of the risk assessment project, specifically Transport Canada, Canadian Coast Guard, Government of Newfoundland and Labrador Department of Environment and Conservation, and Environment Canada.
3. Agencies that report to the government on marine policy issues, e.g., Regional Advisory Council (RAC) and Standing Committee on Fisheries and Oceans (SCOFO).
4. Citizens or organizations that could be financially harmed by a spill.
These four groups were included in the first phase of the consultations. In the second phase, a series of public meetings was held in June/July 2006 in Port aux Basques, Burgeo, Marystown, Arnold’s Cove, Placentia, St. John’s, and Coast of Bays. These consultations were conducted by Transport Canada, in conjunction with Fisheries and Oceans Canada, Canadian Coast Guard, Environment Canada, and the Newfoundland Department of Environment and Conservation. A summary report is posted on Transport Canada’s internet site at http://www.tc.gc.ca/marinesafety/tp/tp14617/menu.htm.
Some of the major issues raised in the consultations include:
• Mystery spills and illegal bilge dumps in the general area (noted as not being part of this study).
• Lack of infrastructure along the south coast to support a large-scale cleanup.
• Use of local fishermen and other volunteers in the response.
• Inadequate fines for polluters.
• Several specific species are vulnerable to spills.
• Waste reception facilities at port authorities should reduce intentional waste discharges.
• Tankers and other large commercial vessels do not always use established traffic lanes.
• Limited availability of tugs to assist tankers or other large vessels in distress.
• Response equipment is centrally located in St. John’s. It does not appear to be located in areas of highest risk.
• Tourism is increasingly important and should be considered in the effects portion of the study.

TP Synopsis Report – TP 14740E Environmental Oil Spill Risk Assessment for the South Coast of Newfoundland 4 of 37
3.0 AREA OF INTEREST
For the purposes of this study, the Area of Interest (AOI) was defined as, “… the boundaries from Cape St. Francis to a point 50 nautical miles east following the coast to 50 nautical miles off Cape Race and continuing along to 50 nautical miles south of Cape Ray. The boundaries of the Placentia Bay Vessel Traffic Services (VTS) Zone, comprising all Canadian waters (International boundary, not Exclusive Economic Zone) between a line bearing 180 degrees True from Bass Point, 46 degrees, 55’05”N, 55 degrees 15’55”W: and a line bearing 180 degrees True from Cape St. Mary’s light, 46 degrees 49’22”N, 54 degrees 11’49”W.” In simple terms, the AOI is the south coast of Newfoundland, from Port aux Basques (western limit) and the southeast coast up to the entrance to Conception Bay.
Figure 1: Area of interest (AOI) for study

TP Synopsis Report – TP 14740E Environmental Oil Spill Risk Assessment for the South Coast of Newfoundland 5 of 37
AOI Hazards
Weather and sea hazards include:
Ice
• Generally only a concern along the east coast; may reach the south coast in severe winters.
• Ice occurrence along south is uncommon, and transitory when it does occur.
• Iceberg drift through eastern portion of AOI is possible throughout the year, but mainly February through June.
Vessel Icing
• Icing may occur in all parts of the AOI in winter months during strong winds, heavy seas, and low temperatures or during freezing snow or rain.
Fog
• Most prevalent between April and September.
• Annual occurrence 20 to 30 per cent of the time, peaking at 40 percent occurrence in July.
Wind
• Yearly average wind speed of 27 km/h (15 knots); averaging 33 km/h (18 knots) in winter.
• Gale-force winds (> 30 knots) occur 15 per cent of the time in winter.
Tides and Currents
• While mentioned briefly, they are not a major concern as a navigational risk.
The major navigational hazards present in the AOI are summarized in Table 1.
Traffic Control, Pilotage, and Routing
Monitoring and tracking vessel activity is done from three Marine Communication and Traffic Services (MCTS) centres in the AOI: Port aux Basques, Placentia Bay, and St. John’s. Vessel Traffic Service (VTS) zones are centred on the same three bases; within these zones, ships greater than 20-metres length or 150 grt must have the capability for continuous radio communications watch. Reports must also be made of information such as intended destinations, hazardous goods on board, deficiencies to the ship or other items that may affect public safety. St. John’s and parts of Placentia Bay are compulsory areas for pilotage, while Port aux Basques is non-compulsory. There are no compulsory routing schemes within the AOI, but recommended traffic lanes are set out in Placentia Bay and in the Cabot Strait.

TP Synopsis Report – TP 14740E Environmental Oil Spill Risk Assessment for the South Coast of Newfoundland 6 of 37
TABLE 1: SUMMARY OF KEY HAZARDS IN STUDY AREA
Sub-Area Weather and Sea Conditions
General Traffic Conditions Navigational Hazards
Cape Ray to Burin Peninsula
Heavy seas common.
Generally ice-free in winter, but freezing spray is common.
Considerable passing traffic, en route to ports in the St. Lawrence River and beyond.
Ferry traffic to/from Port aux Basques.
Port aux Basques:
Narrow entrance.
Shoaling and exposed rocks.
Difficult berthing in heavy weather.
Placentia Bay Swells from south can travel well within bay.
Southerly winds can produce widespread fog.
Tankers to/from Come By Chance refinery and Whiffen Head transhipment terminal.
Rocks and shoals line defined traffic lanes.
Lanes narrow and merge to a single lane.
Cape St. Mary’s to Cape Race
Rough seas can be funnelled into St. Mary’s Bay and Trepassey Bay.
Strong tidal currents nearshore.
Concentrating effect of cape can produce local speeds up to 25 knots greater than elsewhere.
Icebergs in area March to July.
Area of traffic convergence including tankers transiting to Placentia Bay, and transatlantic routings heading for Cabot Strait.
Several marked rocks and shoals along defined traffic routes.
Cape Race to Cape St. Francis
Unlimited exposure to the east, large swells common.
Pack ice through late winter months; icebergs in spring and early summer.
Area of traffic convergence: vessels entering St. John’s crossing traffic along coast.
Considerable fishing activity in area.
Limited manoeuvrability in narrow entrance to St. John’s.

TP Synopsis Report – TP 14740E Environmental Oil Spill Risk Assessment for the South Coast of Newfoundland 7 of 37
Canada’s Prevention, Preparedness, and Response Regime
This section summarizes the measures in place to prevent marine incidents and respond to spills should they occur. They include:
• Annual inspection and certification of tankers.
• The National Aerial Surveillance program for detecting ship-source pollution.
• Phase-in of a double-hull requirement for tankers.
• Ship movement monitoring, recommended traffic schemes, and pilotages as previously described.
• Spill prevention plans for oil handling facilities.
Various funds for compensating cleanup costs are briefly described. They include:
• P&I Clubs
• The Ship-Source Ocean Pollution Fund
• The International Oil Pollution Compensation Fund / Civil Liability Convention.
TC’s management of Canada’s Marine Oil Spill Preparedness and Response Regime is described in some detail. Most significant measures are:
• The Eastern Canada Response Corporation (ECRC) is the certified Response organization (RO) for the region. It has plans, equipment, manpower, and training established for responding to marine oil spills.
• Some 60 oil-handling facilities in the AOI have their own preparedness plans.
• Tankers must have shipboard oil pollution emergency plans.
• Both facilities and tankers must have a contractual arrangement with ECRC to respond to spills.
• Primary Areas of Response designated for Come By Chance and Holyrood. Certain capability and response time standards must be planned for.

TP Synopsis Report – TP 14740E Environmental Oil Spill Risk Assessment for the South Coast of Newfoundland 8 of 37
4.0 MARINE TRAFFIC IN THE AOI
An extensive range of sources were used to compile marine traffic data within the AOI, including:
• MCTS data from the three VTS zones.
• Department of National Defence data.
• Data on movements and cargoes to specific oil handling facilities.
• CCG’s MARIS database.
From an oil spill point of view, the most significant of the marine traffic are the oil tankers, which include:
• Imports of crude oil from Europe and the Middle East to the Come By chance refinery;
• Exports of refined product from the refinery;
• Shuttle tankers that transport crude oil from Grand Banks oilfield to the Whiffen Head transhipment terminal;
• “Second leg” tankers that transport crude oil from Whiffen Head to markets in the eastern United States;
• Imports of fuel to the Holyrood thermal generating station (traffic passes through the AOI);
• Imports of refined product into St. John’s from domestic and international sources; and
• Imports of fuels to various communities within the AOI.
Numerous other vessels represent a traffic risk, and somewhat of a spill risk given their fuel. These include ferries, tugs, supply vessels for various industrial operations and offshore oilfields, bulk carriers, container ships, naval and fisheries inspection vessels, fishing vessels, and reefers.
A general indication of traffic density can be seen in Figure 2, which shows “spot” positions of ship locations from DND data. The figure is not a true measure of traffic density as it is a series of locations from where ships reported positions.

TP Synopsis Report – TP 14740E Environmental Oil Spill Risk Assessment for the South Coast of Newfoundland 9 of 37
Figure 2: General indication of traffic density from DND data
The VTS data gives a comprehensive measurement of vessel transits. Annual data of total transits is given here as a summary. Monthly tabulations and breakdowns of inbound, outbound, transit, in-zone, and out-zone are provided in the study report. The data is presented differently for Port aux Basques, with a breakdown by vessel type given only for transits through the VTS zone (Table 2), and only a total number of inbound and outbound transits.
TABLE 2: VESSEL TRANSITS FOR PORT AUX BASQUES (APRIL 2004 TO MARCH 2005)
Bulk cargo 1,342 Container 847 General cargo 689 Tanker 590 Chemical tanker 99 Other 73 Tug 66
For the same period there were 2,641 inbound and outbound movements, most of them ferries.

TP Synopsis Report – TP 14740E Environmental Oil Spill Risk Assessment for the South Coast of Newfoundland 10 of 37
TABLE 3: VESSEL MOVEMENTS, PLACENTIA BAY AND ST. JOHN’S VTS ZONES (APRIL 04 TO MARCH 05)
Placentia Bay St. John’s
Tanker <50,000 DWT 364 178 Tanker >50,000 DWT 912 12 Chemical tanker 62 2 General cargo 104 124 Bulk cargo 26 28 Container 392 357 Tug 2,046 1,227 Tug with tow 39 41 Government 231 654 Fishing 293 1,139 Passenger 8 77 Other (vessels > 20 m) 1,296 465 Other (vessels < 20 m) 1,012 2,954 Ferry 1,501 2 Total 8,286 7,260
As noted earlier, most oil spill risk is associated with tanker traffic that enters and leaves Placentia Bay, and specifically, the refinery at Come By Chance and the transshipment terminal at Whiffen Head, both located at the head of the bay. In the study report, data is given for the two locations, with breakdowns for five routes beyond the AOI and three within the AOI (Figure 3). Data is given on both transits and total volume of cargo carried. The data is combined here to summarize the transits and volumes (Table 4).
TABLE 4: TRANSITS AND CARGO VOLUMES FOR LOCATIONS IN PLACENTIA BAY
Transits, average number per year Cargo volume, Mbbls per year
Crude Refined product
In ballast
Total Crude Refined product
Total
Come by Chance 43.2 195.7 228.0 466.9 49.0 45.9 94.9 Whiffen Head 308.3 1.1 304.8 614.2 227.4 0.2 227.6
Mbbls/year: 1,000,000 barrels per year

TP Synopsis Report – TP 14740E Environmental Oil Spill Risk Assessment for the South Coast of Newfoundland 11 of 37
Figure 3: Placentia Bay tanker routes
Although breakdowns are given for the various routes into and out of Placentia Bay, two routes handle the vast majority of both transits and cargo volumes. For Come By Chance approximately 80 per cent, and for Whiffen Head approximately 99 per cent of the transits and volumes are associated with routes 2 (the East Coast of the United States and Nova Scotia) and 4 (Europe and the Middle East via the North Atlantic).
A significant but much smaller volume of cargo is handled in the port of St. John’s, some 1.5 M tonnes, of which 0.5 M tonnes is “fuels and basic chemicals”.
Finally, exposure to risk is presented by tankers passing through the AOI, but not calling on ports within the area, specifically tankers heading for ports in the St. Lawrence, Great Lakes, and the Holyrood generating station. These are summarized in Table 5.
TABLE 5: VOLUME TRANSPORTED THROUGH THE AOI, Mbbls/YR
St. Lawrence Great Lakes Holyrood Crude oil 68.1 0 0
Refined product 11.9 1.6 3.1
Total 80.0 1.6 3.1
Mbbls/year: 1,000,000 barrels per year
TP Synopsis Report – TP 14740E Environmental Oil Spill Risk Assessment for the South Coast of Newfoundland 12 of 37
5.0 OIL SPILL FREQUENCY
Historical data was used to estimate the frequency of oil spills within the AOI, including oil carried as cargo and as fuel. The main data sources were:
• Transportation Safety Board accident statistics;
• SL Ross Environmental Research Ltd. reports to CCG on the likelihood of tanker spills in Canada; and
• Worldwide data from the International Tanker Owner’s Pollution Federation (ITOPF).
For fuel (or “bunker”) spills, there have been a statistically significant number of incidents within the AOI to use this data to make future predictions. There have been very few significant accidents involving tanker cargoes, so international data is used for these predictions. This is stated to be an area of uncertainty, that conditions within the AOI may not reflect those worldwide, so Chapter 10 will deal with these potential differences.
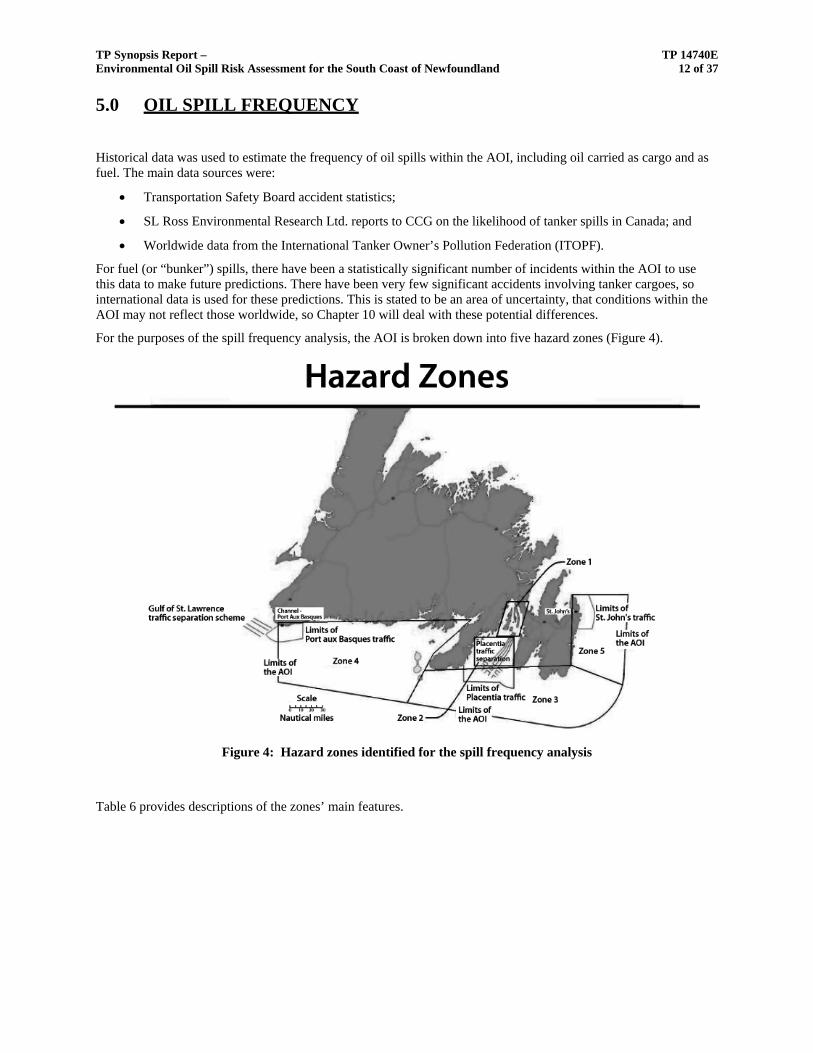
For the purposes of the spill frequency analysis, the AOI is broken down into five hazard zones (Figure 4).
Figure 4: Hazard zones identified for the spill frequency analysis
Table 6 provides descriptions of the zones’ main features.
TP Synopsis Report – TP 14740E Environmental Oil Spill Risk Assessment for the South Coast of Newfoundland 13 of 37
TABLE 6: HAZARD ZONES IDENTIFIED FOR SPILL FREQUENCY ANALYSIS
Zone Main features 1. Inner Placentia Bay Tanker traffic associated with Come By Chance and Whiffen Head terminals.
Traffic lanes close to shorelines and communities.
Potential spills associated with terminal operations, oil transfers.
2. Outer Placentia Bay Area of traffic convergence for tanker traffic associated with terminals.
Traffic lanes close to shorelines and communities.
3. Placentia Bay South Area of traffic convergence for tanker traffic associated with terminals.
Includes passing tanker and other commercial traffic.
4. Cabot Strait Passing tanker and other commercial traffic en route to St. Lawrence.
5. St. John’s Area of traffic convergence for traffic entering St. John’s.
Includes tanker and other commercial traffic.
Fuel Oil Spills
The likely frequency of fuel oil spills is estimated based on historical data, specifically the MARIS database. This record contains 1,048 accidents and 208 incidents (or close calls) over the period 1980 to 2005. The record does not explicitly state whether or not pollution resulted, so the authors infer this based on the severity of the accident as reported. It is noted that the very low number of incidents versus accidents suggests an under-reporting of incidents: it seems intuitive that there should be more incidents than accidents. Based on this, the incident statistic is not used further in the analysis.
The data show a steady trend downwards from 50 to 70 accidents per year in the 1980’s to approximately 20 accidents per year in recent years. The authors then remove pre-1985 accidents from the data set on the basis that recent years should be a more valid predictor. (Note: It would have been justified to remove even more “early year’s” data on this basis. Up to and including 1993, the number of accidents was never less than about 35 per year, and averaged about 55 per year. From 1994 onwards, the number of accidents was never greater than 35 per year, and averaged about 20 to 25 per year. The result of the approach used here is that spill frequency may be slightly overstated.)
Except for fishing vessels, there have been few accidents in the MARIS record (post 1985) that would have led to a spill. In fact, for the vessel type and size categories shown below, there has been only one accident in the 20-year record, for an annual frequency of 0.05. The average annual frequencies in Table 7 are not only the historical record but also the assumed rate for future predictions.

TP Synopsis Report – TP 14740E Environmental Oil Spill Risk Assessment for the South Coast of Newfoundland 14 of 37
TABLE 7: FUEL OIL SPILL FREQUENCIES BY VESSEL TYPE AND SIZE (1985 TO 2005)
Type Size (gross tonnage)
Number of oil spill events
Frequency (per year)
1,000 to 10,000 1 0.05 Bulk carrier
10,000 to 100,000 1 0.05
< 10 29 1.40
10 to 100 71 3.42
100 to 1,000 10 0.48 Fishing vessel
1,000 to 10,000 1 0.05
10 to 100 1 0.05
100 to 1,000 1 0.05 General cargo
1,000 to 100,000 1 0.05
Lifeboat / Search & rescue 10 to 100 1 0.05
Tug 10 to 100 1 0.05
Research 10 to 100 1 0.05
A tabulation is also given for number of spills for each of the five identified hazard zones, based on historical statistics (Table 8).
TABLE 8: PREDICTED SPILL FREQUENCIES BY SIZE AND HAZARD ZONE
Frequency per hazard zone Size category
Volume, bbls Zone 1 Zone 2 Zone 3 Zone 4 Zone 5
Total
Small 1 to 49 0.07 0.20 0.19 0.64 0.34 1.44
Medium 50 to 999 0.19 0.58 0.55 1.83 0.98 4.14
Large 1,000 to 9,999 0.01 0.02 0.02 0.06 0.03 0.14

TP Synopsis Report – TP 14740E Environmental Oil Spill Risk Assessment for the South Coast of Newfoundland 15 of 37
Placentia Bay Tanker Spills
For spills less than 1,000 barrels, Canadian statistics are used, and for larger spills, worldwide statistics are used to produce the historical spill rates in Table 9.
TABLE 9: HISTORICAL TANKER SPILL RATES FOR CRUDE AND REFINED PRODUCT
Spill rate1, crude oil Spill rate1, refined products Spill size, bbls In port At sea Total In port At sea Total 1 to 49 6.59 8.41 15 31.61 40.39 72
50 to 999 0.83 1.06 1.89 6.80 8.70 15.5
1,000 to 9,999 0.26 0.19 0.45 1.29 1.52 2.81
10,000 to 99,999 0.06 0.19 0.25 0.049 0.164 0.213
100,000 to 199,999 0.009 0.017 0.026 0.043 0.086 0.129
>200,000 0.031 0.063 0.094 0.022 0.043 0.065 1 Spills per billion (109) barrels of oil transported.
These spill rates are then combined with the exposure variable and volume of oil transported, to produce an expected spill frequency based on these historical statistics. Note that the “in port” spills are primarily loading/unloading spills that occur in harbours or at piers, so the authors have (justifiably) reduced the spill rate for some portions of the zones by 50 per cent, to reflect the fact that an “in-port” spill could occur at either end of the tanker’s voyage, and only the Newfoundland portion is under consideration here. As well, an “at-sea” spill could occur anywhere along the tanker’s route, so only a portion of the “at sea” rate is judged to occur in any of the given hazard zones, and this is assumed to be 10 per cent. (This may appear to be arbitrary but it seems reasonable: combined it means that almost half of the at-sea risk is within Newfoundland waters. If anything, it may overstate the probability in Newfoundland waters.) Combining the historical spill rates with the current cargo volumes results in the following estimations of spill frequency for the five hazard zones in Placentia Bay (Table 10). Spill frequency can also be expressed in terms of the number of years per spill (Table 11).
TABLE 10: PREDICTED ANNUAL SPILL FREQUENCIES FOR PLACENTIA BAY
Hazard Zone 1 Hazard Zones 2 and 3 Hazard Zone 4 Hazard Zone 5 Spill size,
bbls Crude Refined product Crude Refined
product Refined product Crude Refined
product 1 to 49 9.55 x 10⁻¹ 7.44 x 10⁻¹ 2.21 x 10⁻¹ 1.83 x 10⁻¹ 9.41 x 10⁻³ 1.87 x 10⁻³ 3.64 x 10⁻⁴
50 to 999 1.20 x 10⁻¹ 1.60 x 10⁻¹ 2.79 x 10⁻² 3.95 x 10⁻² 2.03 x 10⁻³ 2.35 x 10⁻⁴ 7.83 x 10⁻⁵
1,000 to 9,999
3.77 x 10⁻² 3.04 x 10⁻² 4.99 x 10⁻³ 6.90 x 10⁻³ 3.54 x 10⁻⁴ 4.22 x 10⁻⁵ 1.37 x 10⁻⁵
10,000 to 99,999
8.69 x 10⁻³ 1.16 x 10⁻³ 4.99 x 10⁻³ 7.44 x 10⁻⁴ 3.82 x 10⁻⁵ 4.22 x 10⁻⁵ 1.48 x 10⁻⁶
100,000 to 199,999
1.30 x 10⁻³ 1.02 x 10⁻³ 4.47 x 10⁻⁴ 3.90 x 10⁻⁴ 2.00 x 10⁻⁵ 3.77 x 10⁻⁶ 7.74 x 10⁻⁷
>200,000 4.49 x 10⁻⁴ 5.18 x 10⁻⁴ 1.66 x 10⁻³ 1.95 x 10⁻⁴ 1.00 x 10⁻⁵ 1.40 x 10⁻⁵ 3.87 x 10⁻⁷
Total 1.13 9.37 x 10⁻¹ 2.61 x 10⁻¹ 2.31 x 10⁻¹ 1.19 x 10⁻² 2.21 x 10⁻³ 4.59 x 10⁻⁴

TP Synopsis Report – TP 14740E Environmental Oil Spill Risk Assessment for the South Coast of Newfoundland 16 of 37
TABLE 11: PREDICTED SPILL FREQUENCIES FOR PLACENTIA BAY (YEARS BETWEEN SPILL EVENTS)
Hazard Zone 1 Hazard Zones 2 and 3 Hazard Zone 4 Hazard Zone 5
Spill size, bbls
Crude Refined product Crude Refined
product Refined product Crude Refined
product
1 to 49 1.0 1.3 4.5 5.5 106 535 2,750
50 to 999 8.3 6.3 36 25 493 4,260 12,800
1,000 to 9,999 26 33 200 145 2,820 23,700 73,000
10,000 to 99,999 115 862 200 1,340 26,200 23,700 676,000
100,000 to 199,999 769 980 2,240 2,560 50,000 265,000 1,290,000
>200,000 2,227 1,930 602 5,130 100,000 71,400 2,580,000
Total 0.9 1.1 3.8 4.3 84 453 2,180
Looking at the bottom row of Table 11, the total spill frequency for Hazard Zone 1 is crude oil spill once per 0.9 years and a product spill every 1.1 years, so about once per year for each. Most of this frequency is related to the smaller spill size categories. The largest categories occur on the order of once per hundred or thousand years. Other zones have similar trends, but with less frequency than in Hazard Zone 1.
Similarly, for St. John’s tanker traffic, fuel shipments to the Holyrood generating station, and tankers transiting the AOI en route to the St. Lawrence, a spill frequency is ascribed to each of the hazard zones that is affected by the exposure. For example, St. John’s traffic passes through Zones 3, 4, and 5 so each of those zones receives a “portion” of the spill frequency.
TABLE 12: CUMULATIVE SPILL FREQUENCY FOR HAZARD ZONE 1
Spill size, bbls Fuel oil Crude oil Refined product
1 to 49 7.0 x 10⁻² 9.55 x 10⁻¹ 7.44 x 10⁻¹
50 to 999 1.9 x 10⁻¹ 1.20 x 10⁻¹ 1.60 x 10⁻¹
1,000 to 9,999 1.0 x 10⁻² 3.77 x 10⁻² 3.04 x 10⁻²
10,000 to 99,999 -- 8.69 x 10⁻³ 1.16 x 10⁻³
100,000 to 199,999 -- 1.30 x 10⁻³ 1.02 x 10⁻³
>200,000 -- 4.49 x 10⁻³ 5.18 x 10⁻⁴
Total 0.27 1.13 0.94

TP Synopsis Report – TP 14740E Environmental Oil Spill Risk Assessment for the South Coast of Newfoundland 17 of 37
TABLE 13: CUMULATIVE SPILL FREQUENCY FOR HAZARD ZONE 2
Spill size, bbls Fuel oil Crude oil Refined product
1 to 49 2.0 x 10⁻¹ 2.21 x 10⁻¹ 1.83 x 10⁻¹
50 to 999 5.8 x 10⁻¹ 2.79 x 10⁻² 3.95 x 10⁻²
1,000 to 9,999 2.0 x 10⁻² 4.99 x 10⁻³ 6.90 x 10⁻³
10,000 to 99,999 -- 4.99 x 10⁻³ 7.44 x 10⁻⁴
100,000 to 199,999 -- 4.47 x 10⁻⁴ 3.90 x 10⁻⁴
>200,000 -- 1.66 x 10⁻³ 1.95 x 10⁻⁴
Total 0.8 0.26 0.23
TABLE 14: CUMULATIVE SPILL FREQUENCY FOR HAZARD ZONE 3
Spill size, bbls Fuel oil Crude oil Refined product
1 to 49 1.9 x 10⁻¹ 2.78 x 10⁻¹ 2.66 x 10⁻¹
50 to 999 5.5 x 10⁻¹ 3.51 x 10⁻² 5.74 x 10⁻²
1,000 to 9,999 2.0 x 10⁻² 6.28 x 10⁻³ 1.00 x 10⁻²
10,000 to 99,999 -- 6.28 x 10⁻³ 1.08 x 10⁻³
100,000 to 199,999 -- 5.63 x 10⁻⁴ 5.83 x 10⁻⁴
>200,000 -- 2.08 x 10⁻³ 2.67 x 10⁻⁴
Total 0.76 0.33 0.34
TABLE 15: CUMULATIVE SPILL FREQUENCY FOR HAZARD ZONE 4
Spill size, bbls Fuel oil Crude oil Refined product
1 to 49 6.4 x 10⁻¹ 5.73 x 10⁻² 7.18 x 10⁻²
50 to 999 1.83 7.22 x 10⁻³ 1.55 x 10⁻²
1,000 to 9,999 6.0 x 10⁻² 1.29 x 10⁻³ 2.70 x 10⁻³
10,000 to 99,999 -- 1.29 x 10⁻³ 2.92 x 10⁻⁴
100,000 to 199,999 -- 1.16 x 10⁻⁴ 1.61 x 10⁻⁴
>200,000 -- 4.29 x 10⁻⁴ 6.82 x 10⁻⁵
Total 2.53 0.068 0.091

TP Synopsis Report – TP 14740E Environmental Oil Spill Risk Assessment for the South Coast of Newfoundland 18 of 37
TABLE 16: CUMULATIVE SPILL FREQUENCY FOR HAZARD ZONE 5
Spill size, bbls Fuel oil Crude oil Refined product
1 to 49 3.40 x 10⁻¹ 1.87 x 10⁻³ 9.10 x 10⁻²
50 to 999 9.80 x 10⁻¹ 2.35 x 10⁻⁴ 1.96 x 10⁻²
1,000 to 9,999 3.00 x 10⁻² 4.22 x 10⁻⁵ 3.62 x 10⁻³
10,000 to 99,999 -- 4.22 x 10⁻⁵ 2.13 x 10⁻⁴
100,000 to 199,999 -- 3.77 x 10⁻⁶ 2.06 x 10⁻⁴
>200,000 -- 1.40 x 10⁻⁵ 1.38 x 10⁻⁵
Total 1.35 0.00221 0.115
TABLE 17: CUMULATIVE SPILL FREQUENCY FOR HAZARD ZONE 1
(YEARS PER SPILL EVENT)
Spill size, bbls Fuel oil Crude oil Refined product
1 to 49 14 1.0 1.3
50 to 999 5.3 8.3 6.3
1,000 to 9,999 100 27 33
10,000 to 99,999 115 862
100,000 to 199,999 769 980
>200,000 223 1,930
Total 3.7 0.9 1.1
TABLE 18: CUMULATIVE SPILL FREQUENCY FOR HAZARD ZONE 2
(YEARS PER SPILL EVENT)
Spill size, bbls Fuel oil Crude oil Refined product
1 to 49 5 4.5 5.5
50 to 999 1.8 36 25
1,000 to 9,999 50 200 145
10,000 to 99,999 200 1,340
100,000 to 199,999 2,240 2,560
>200,000 602 5,130
Total 1.3 3.8 4.3

TP Synopsis Report – TP 14740E Environmental Oil Spill Risk Assessment for the South Coast of Newfoundland 19 of 37
TABLE 19: CUMULATIVE SPILL FREQUENCY FOR HAZARD ZONE 3 (YEARS PER SPILL EVENT)
Spill size, bbls Fuel oil Crude oil Refined product
1 to 49 5.3 3.6 3.8
50 to 999 1.8 28 17
1,000 to 9,999 50 159 100
10,000 to 99,999 159 926
100,000 to 199,999 1,780 1,710
>200,000 481 3,750
Total 1.3 3.1 3.0
TABLE 20: CUMULATIVE SPILL FREQUENCY FOR HAZARD ZONE 4
(YEARS PER SPILL EVENT)
Spill size, bbls Fuel oil Crude oil Refined product
1 to 49 1.6 17 14
50 to 999 0.55 139 65
1,000 to 9,999 17 775 370
10,000 to 99,999 775 3,420
100,000 to 199,999 8,620 6,210
>200,000 2,330 14,700
Total 0.4 58 11
TABLE 21: CUMULATIVE SPILL FREQUENCY FOR HAZARD ZONE 5
(YEARS PER SPILL EVENT)
Spill size, bbls Fuel oil Crude oil Refined product
1 to 49 2.9 535 11
50 to 999 1.0 4,260 51
1,000 to 9,999 33 23,700 276
10,000 to 99,999 23,700 4,690
100,000 to 199,999 265,000 4,850
>200,000 71,400 72,500
Total 0.7 453 8.7

TP Synopsis Report – TP 14740E Environmental Oil Spill Risk Assessment for the South Coast of Newfoundland 20 of 37
In each case, the general approach is to include 10 percent of the predicted at-sea frequency for each hazard zone that is transited, and 50 percent of the in-port frequency for each port that is visited. Finally, in the case of St. John’s traffic, the tankers are generally less than 200,000 barrels capacity, so spills in this size range are not credible. The predicted frequency of these extremely large spills is therefore added to the next lowest size range.
For each of the identified Hazard Zones, the estimated spill frequencies from each of the exposure sources is then summed to produce a total estimated spill frequency for crude oil and refined product for each of the spill size categories.
A summary of the results shown in these five tables follows.
• Zone 1 has the highest estimated frequency of crude oil spills and refined product spills. This is not surprising, given the tanker traffic to the two terminals in Placentia Bay. The total estimated frequency indicates the potential for about one crude oil and one refined product spill per year, largely as a result of the predicted frequency for small spills, in the range of one per year each. Spills in the size range up to 10,000 barrels are still within the realm of possibility, approximately 3 to 4 x 10⁻², or one every 27 to 33 years.
• Zone 2 has a lower predicted frequency for crude and refined product spills, about 25 percent of the Zone 1 values. The likelihood of fuel oil spills is higher than for Zone 1.
• Zone 3 has a predicted frequency comparable to Zone 2 for all three oil types.
• Zones 4 and 5 have a much lower predicted frequency of spills in the crude and refined product categories. This is expected as the main hazards here are traffic convergence rather than a concentration of tanker traffic as in Zones 1 and 2. The greater and broader marine activity does lead to an increased likelihood of fuel spills, an estimated 1.35 to 2.53 per year in these two zones.
Note that in tables 12 through 21, there is what appears to be an anomaly in the predicted frequency between the two largest categories, “100,000 to 199,999” and “>200,000”. It would be expected that the larger category would have a lesser frequency, but the data in these tables indicates otherwise. This is because the “100,000 to 199,999” category is a very narrow size range, and thus has a lower expected frequency than the broader “>200,000” category.

TP Synopsis Report – TP 14740E Environmental Oil Spill Risk Assessment for the South Coast of Newfoundland 21 of 37
6.0 REPRESENTATIVE OIL SPILL SCENARIOS
Descriptions are given for a number of oil spill scenarios meant to represent credible events in the AOI.
Oil spill behaviour is described in general terms, noting the interplay of the key processes of evaporation, dispersion, emulsification, and biodegradation. It is also noted that one of the primary candidates for spillage, in terms of volume of cargo carried, is one of the Grand Banks crude oils, some of which are known to have moderate to high wax contents. As a result, they would exhibit anomalous characteristics when spilled, tending to form clumps and blobs rather than thin sheens and would likely emulsify in wave conditions typical of the area. They would also be highly persistent in the marine environment. On the other hand, the large volumes of crude oil imported to the Come By Chance refinery are of Middle East origin, and are generally regarded as medium persistence oils with moderate pour points. The refined products leaving the refinery are a mix of light, medium, and heavy oils. The medium category constitutes about 50 per cent of the volume transported and is used to represent this group of products.
Trajectory modeling studies are referenced in which spills from representative locations in each Hazard Zone 1 are modeled. In each case, from a given spill location, a trajectory analysis was run with a typical wind and current conditions. This was done only to illustrate potential oiling locations and the potential extent of impacts. The modeling also illustrated the time period over which oiling would occur, which is of some use for planning response operations and the inherent time constraints.
Of primary importance for its later use in modeling effects and damages are the estimates of shoreline oiling, and the documentation of shoreline types in each Hazard Zone. As will be discussed later, cleanup costs and effects are assessed for a range of spill sizes and oil types, as appropriate for each Hazard Zone. The most important variables in assessing these costs and effects are:
• the amount of shoreline that is oiled;
• the extent of oiling; and
• the persistence of the oil.
Modeling of the shoreline oiling is done with a series of small, medium, large, and exceptionally large spills for each Hazard Zone. Clearly, as the spill size increases the intensity of oiling, so does the amount of shoreline oiled and the distance from the spill source that is affected. Estimates of shoreline oiling from a previously completed study on the subject are used to calculate likely lengths of shoreline that would be oiled, for later use in effects modeling.
Documentation also describes the predominant shoreline types in each zone, which is an important factor in shoreline oiling, retention rates, and degree of cleanup required. For example, approximately 75 percent of the shoreline in Placentia Bay is bedrock, either exposed or overlain by coarse sediments. Oil that reaches these shorelines will not be retained by the shoreline in large quantities and may be redistributed alongshore to other locations. In other Hazard Zones pebble/cobble beaches are more significant; so these shorelines will have a greater potential to retain oil that is beached, and will require a more intensive cleaning effort because of their porous nature.

TP Synopsis Report – TP 14740E Environmental Oil Spill Risk Assessment for the South Coast of Newfoundland 22 of 37
7.0 ENVIRONMENTAL IMPACT ASSESSMENT
The main species of interest that may be at risk from an oil spill are described, and estimates made of the potential effect of various sized spills on those species. Technical input on this subject was provided specifically for this study under subcontract to an effects specialist.
The approach used was to identify a short list of Valued Ecosystem Components (VEC’s). These are species or habitats of special significance by virtue of their particular aesthetic, cultural or economic value to a region. Within this broad definition, other factors include relative abundance of a species, its vulnerability to oil exposure, its importance within the ecosystem, and its commercial importance. For each of the VEC’s, the potential consequences were estimated for spills ranging from small to exceptionally large. In most cases a quantitative estimation was made both in terms of total numbers of a species and as a percentage of the regional and broader population. The VEC’s selected for study were:
• Fish and invertebrates • Atlantic cod • Capelin • American lobster • Atlantic herring • Lumpfish • Snow crab • Redfish • Yellowtail flounder • Sea scallop
• Sea-associated birds • Murres • Northern gannet • Greater shearwater • Cormorants • Common eider
• Black guillemot • Harlequin duck • Bald eagle • Greater yellowlegs • Purple sandpiper • Piping plover
• Marine mammals • River otter • Fin whale • Atlantic white-sided dolphin • Humpback whale • Harbour seal • Blue whale • White-beaked dolphin
• Sea turtle
Each of these species is described in some detail regarding their habitats, life stages and overall vulnerability to oil spills. The following lists some of the more significant descriptions.
Fish and invertebrates
Nearshore and shallow waters are important for spawning and early stages of several important fish species, and could be vulnerable to spilled oil depending on the timing of the spill.
Sea-associated birds
Seabirds are the VEC most vulnerable to the effects of oiling; the identified species all come into contact with the sea surface, and potentially oil from a spill. Murres and black guillemots are particularly vulnerable as they fly infrequently, spending the majority of their time on the sea surface.
Marine mammals
With the exception of seals, otters, and polar bears, marine mammals are not particularly susceptible to the harmful effects of oiling. Harbour seal pups may be susceptible to the effects of oiling. Although not classified as a marine mammal, river otters are included in the list because they spend a great deal of time in the marine environment of Hazard Zone 1.

TP Synopsis Report – TP 14740E Environmental Oil Spill Risk Assessment for the South Coast of Newfoundland 23 of 37
Sea turtles
The vulnerability of sea turtles to oiling is uncertain, as are their actual numbers within the AOI.
Effects Assessment
For each of the focal species listed, and for each of the Hazard Zones, the percent mortality is estimated for a range of spill sizes from “small” to “exceptionally large”. The estimations are based on the estimated area of oiling for each spill size, the volume of water in contact with the oil, and the percentage of the applicable stock that would be affected by each spill.
For fish and invertebrates, Atlantic cod is a focal species for each of the five Hazard Zones, and the effects results are described in detail in the study report. For “exceptionally large” spills of high persistence oil in Hazard Zone 3, a mortality rate of 3.2 per cent is estimated. For “exceptionally large” spills of medium persistence oil in Hazard Zone 4, a mortality rate of 2.5 per cent is estimated. For all other representative spill scenarios the estimated mortality rate is less than 2 per cent, and in most cases significantly less than 2 per cent. Based on this, the effects on Atlantic cod are not considered to be significant.
Mortality estimates are made for focal seabird species where sufficient data for the predictions exists. It is noted that seabird populations are subject to natural fluctuations regardless of oil spills, so a threshold of 5 per cent mortality is assumed to be “significant”, a level that would be greater than natural variations. The following table lists those species and spill sizes that could result in greater than 5 per cent population mortality.
TABLE 22: SUMMARY OF ESTIMATED MORTALITY RATES FOR KEY BIRD SPECIES
Hazard Zone Spill size
1 2 3 4 5
Small -- -- -- -- --
Medium -- -- -- -- --
Large -- -- -- -- --
Very large -- --
Extremely large Piping plover (26% of Nfld)
Exceptionally large
Thick-billed murre
(50% of Nfld)
Common Eider (6% of Nfld)
Common eider (6% of Atl Canada)
Harlequin duck (10% of ENA)
Northern gannet
(50% of Nfld)
Thick-billed murre
(50% of Nfld)
Common eider (10.8% of Atl
Canada)
Harlequin duck (10% of ENA)
Northern gannet
(50% of Nfld)
Thick-billed murre
(50% of Nfld)
Piping plover (33% of Nfld)
Northern gannet
(7.2% of Nfld)
Common murre (14.5% of
Nfld)
Thick-billed murre (30% of
Nfld)
ENA: Eastern North America
For Hazard Zones 2 and 3, Common eider mortality rates apply only to the two largest spill categories.
For Hazard Zone 5, Northern gannet mortality rates apply only to the two largest spill categories.

TP Synopsis Report – TP 14740E Environmental Oil Spill Risk Assessment for the South Coast of Newfoundland 24 of 37
8.0 ECONOMIC IMPACT ASSESSMENT
Estimates of the potential economic consequences of a significant oil spill include cleanup costs and disruptions to local industry. The information in this chapter summarizes work done under subcontract for this study by a Newfoundland consulting company with extensive experience in the socio-economic aspects of oil spills. It was not deemed practical to analyze the effects of a spill on every economic asset in the AOI, so the approach was to analyze the economic consequences on three key industries: wild fisheries and fish processing, aquaculture, and tourism. Oil spill cleanup costs are also estimated and included in the final total of economic effects.
Wild fisheries and fish processing
Atlantic cod, scallops, lobster, and snow crab represent 65 per cent of the quantity and 87 per cent of the value of the Newfoundland fishery. It is noted that the effects of a spill would vary greatly by season, with a high percentage of each key species being harvested over a few months of the year, so the analysis includes a variable for seasonality of the potential spill.
The main effect on fisheries in the event of a spill will be the closure of the fishery while a slick persists in a given area, and the closure of fish processing plants due to the interruption in supply. Other effects could include oiling of gear, and a loss of market confidence due to the possibility of tainting.
The estimation of economic loss includes several assumptions that would make the calculation conservative, that is, the losses may not actually be as great as estimated. For example, fishers are assumed to not recoup any losses during closures by attaining higher catch rates afterwards, or that they may be alternatively employed during a closure.
The study report includes a summary of the economic effects of a range of spill sizes with the following variables:
• Spill sizes: small, medium, large, very large, extremely large, and exceptionally large
• Oil types: medium persistence, and high persistence
• Duration of exclusion: four, 10, and 21 days for the medium persistence, and seven, 21, and 42 days for the high persistence oil.
Economic assessments for all of the Hazard Zones are presented in Appendix P of the report. The assessment for Hazard Zone 1 is shown in the study report as an example, and is summarized below.
TABLE 23: ECONOMIC EFFECT ON FISHERIES AND FISH PROCESSING IN HAZARD ZONE 1, MEDIUM PERSISTENCE OIL
Medium persistence oil, fall/winter Medium persistence oil, spring/summer Spill size 4-day
exclusion 7-day
exclusion 21-day
exclusion 4-day
exclusion 7-day
exclusion 21-day
exclusion
Small $635 $1,233 $2,329 $3,035 $5,845 $10,995
Medium $1,058 $2,055 $3,881 $5,059 $9,741 $18,325
Large $2,116 $4,109 $7,763 $10,118 $19,482 $36,650
Very large $6,349 $12,327 $23,288 $30,354 $58,447 $109,950
Extremely large $10,581 $20,546 $38,814 $50,590 $97,412 $183,251
Exceptionally large $105,810 $205,456 $388,140 $505,903 $974,116 $1,832,505
Economic effect is the total value lost for each case, including landed value, processing value, and gear value.

TP Synopsis Report – TP 14740E Environmental Oil Spill Risk Assessment for the South Coast of Newfoundland 25 of 37
TABLE 24: ECONOMIC EFFECT ON FISHERIES AND FISH PROCESSING IN HAZARD ZONE 1, HIGH-PERSISTENCE OIL
High persistence oil, fall/winter High persistence oil, spring/summer Spill size 7-day
exclusion 21-day
exclusion 42-day
exclusion 7-day
exclusion 21-day
exclusion 42-day
exclusion
Small $1,950 $4,275 $7,763 $9,338 $20,263 $36,650
Medium $3,900 $8,550 $15,526 $18,675 $40,525 $73,300
Large $7,800 $17,101 $31,051 $37,351 $81,051 $146,600
Very large $19,501 $42,752 $77,628 $93,377 $202,627 $366,501
Extremely large $195,012 $427,519 $776,279 $933,771 $2,026,267 $3,665,011
Exceptionally large $253,516 $555,775 $1,009,163 $1,213,903 $2,634,147 $7,764,514
Economic effect is the total value lost for each case, including landed value, processing value, and gear value.
These results are then modified to take into account that spill size has a direct effect on the duration of the exclusion period, ranging from two days for a small spill of medium persistence oil and three days for high persistence oil, and up to 21 days for medium persistence oil and 42 days for an exceptionally large spill of high persistence oil. The results for the five Hazard Zones are summarized below in two tables, one for medium persistence oil and one for high persistence oil.
TABLE 25: REPRESENTATIVE ECONOMIC EFFECT ON FISHERIES, MEDIUM-PERSISTENCE OIL SCENARIOS
Hazard Zone Spill size
1 2 3 4 5
Small $1,267 $76,964 $43,481 $6,365 $19,237
Medium $3,059 $111,299 $63,606 $9,295 $27,762
Large $11,796 $389,646 $149,177 $20,094 $80,008
Very large $35,387 $545,505 $176,903 $30,141 $280,764
Extremely large $111,033 $1,392,704 $585,411 $247,192 $1,797,341
Exceptionally large $1,110,323 $2,638,808 $2,083,044 $1,609,798 $1,797,341

TP Synopsis Report – TP 14740E Environmental Oil Spill Risk Assessment for the South Coast of Newfoundland 26 of 37
TABLE 26: REPRESENTATIVE ECONOMIC EFFECT ON FISHERIES, HIGH-PERSISTENCE OIL SCENARIOS
Hazard Zone Spill size
1 2 3 4 5
Small $3,751 $186,488 $64,084 $11,265 $34,211
Medium $11,288 $280,131 $117,151 $17,125 $51,262
Large $49,076 $1,013,133 $310,459 $50,178 $249,616
Very large $122,690 $1,418,387 $459,450 $71,086 $919,883
Extremely large $2,220,645 $3,665,011 $4,166,088 $830,774 $3,594,681
Exceptionally large $2,886,639 $5,864,017 $5,237,325 $3,411,653 $3,594,681
Aquaculture
Aquaculture operations in Newfoundland are concentrated in the area of Bay d’Espoir to Fortune Bay, with a value of $34.6 million salmonid and blue mussel production in 2007. Placentia Bay blue mussel production represents an additional valued of $1.4 million.
Aquaculture sites are located in inshore areas, so would be affected by spills that persist and reach shoreline areas. The economic assessments described in this section of the report include gear damage, lost sales of product, and lost value of primary processing. It is assumed that if harvesting is lost for part of the year it is not made up later. Other species-specific assumptions include:
• Mussels — If a site is affected by heavy oiling, a year’s production is assume lost. If oil simply passes over a site where mussels are suspended in the water, then one year’s production is considered lost during spring/summer, and four week’s production is considered lost during fall/winter.
• Salmonids — Spilled oil reaching aquaculture operations would result in a full year’s loss of inventory. Cages used to house the fish through their life cycle would have to be replaced, but mobile gear could likely be protected or rehabilitated. Seasonality is not significant, although smolt would not be in the water and thus not affected by spills in winter.
• Atlantic cod — Only exceptionally large spills are judged to have an economic effect. In the event of such a scenario, the entire harvest would be lost, as would the cages used to house them.
TABLE 27: REPRESENTATIVE ECONOMIC EFFECT ON AQUACULTURE, MEDIUM-PERSISTENCE OIL SCENARIOS
Hazard Zone Spill size
1 2 3 4 5
Small 0 0 0 0 0
Medium 0 0 0 0 0
Large 0 0 0 0 0
Very large 0 $4,532,500 0 0 $1,000,000
Extremely large 0 $4,532,500 0 0 $1,000,000
Exceptionally large $4,532,500 $4,532,500 $1,798,736 $139,656,643 $1,000,000

TP Synopsis Report – TP 14740E Environmental Oil Spill Risk Assessment for the South Coast of Newfoundland 27 of 37
TABLE 28: REPRESENTATIVE ECONOMIC EFFECT ON AQUACULTURE, HIGH-PERSISTENCE OIL SCENARIOS
Hazard Zone Spill size
1 2 3 4 5
Small 0 0 0 0 0
Medium 0 0 0 0 0
Large 0 0 0 0 $1,000,000
Very large 0 $4,532,500 0 0 $1,000,000
Extremely large $4,532,500 $4,532,500 $1,798,736 $35,935,211 $1,000,000
Exceptionally large $4,532,500 $4,532,500 $4,532,500 $139,656,643 $1,000,000
Tourism
Newfoundland’s tourism industry brings in an estimated $800 million per year industry in Newfoundland. It is noted that one of the main attractions of the province is the interaction with the natural environment, much of it marine-based. The effects of a spill on tourism may be difficult to quantify in that tourists’ perceptions of damage may reduce their travel to an area affected by a spill, although this can be mitigated somewhat by public information efforts. The approach taken here is to estimate the loss of revenue of key tourism activities in each Hazard Zone if affected by “very large” and larger spill sizes for a period of 30 days in each case. Seasonality is not varied, although it is acknowledged that spills in summer would likely have a greater effect since that is high tourist season.
TABLE 29: REPRESENTATIVE ECONOMIC EFFECT ON TOURISM, MEDIUM-PERSISTENCE OIL SCENARIOS
Hazard Zone Spill size
1 2 3 4 5
Small 0 0 0 0 0
Medium 0 0 0 0 0
Large 0 0 0 0 0
Very large 0 0 $110,483 0 $1,021,950
Extremely large $170,700 $170,700 $110,483 $75,900 $1,111,950
Exceptionally large $195,600 $195,600 $110,483 $149,880 $1,111,950

TP Synopsis Report – TP 14740E Environmental Oil Spill Risk Assessment for the South Coast of Newfoundland 28 of 37
TABLE 30: REPRESENTATIVE ECONOMIC EFFECT ON TOURISM, HIGH-PERSISTENCE OIL SCENARIOS
Hazard Zone Spill size
1 2 3 4 5
Small 0 0 0 0 0
Medium 0 0 0 0 0
Large 0 0 0 0 $1,021,950
Very large $170,700 $170,700 $110,483 0 $1,111,950
Extremely large $195,600 $173,100 $110,483 $75,900 $1,111,950
Exceptionally large $195,600 $306,083 $281,183 $149,880 $1,111,950
Oil Spill Cleanup Costs
Oil spill cleanup costs are estimated for the representative oil spill scenarios using a cost-estimation model developed from the Oil Spill Intelligence Report database, which includes data on over 8,600 spills worldwide over a 38-year period. The model estimates a cleanup cost per tonne of oil spilled, with modifiers for such factors as spill location (i.e., developed countries vs. undeveloped), degree of shoreline oiling, oil type (ranging from non-persistent to heavy crudes), main cleanup techniques employed (dispersants, mechanical recovery, or a combination), and volume scaling factors.
TABLE 31: CLEANUP COSTS FOR REPRESENTATIVE SPILL SCENARIOS, MEDIUM-PERSISTENCE OIL
Total cost per Hazard Zone, in thousands of Canadian dollars Spill size
1 2 3 4 5
Small 136 136 102 136 68
Medium 2,378 2,378 1,784 2,378 1,189
Large 16,307 16,307 12,230 16,307 8,153
Very large 135,888 135,888 101,916 135,888 67,944
Extremely large 271,776 271,776 203,832 271,776 135,888
Exceptionally large 521,810 521,810 391,357 521,810 260,905

TP Synopsis Report – TP 14740E Environmental Oil Spill Risk Assessment for the South Coast of Newfoundland 29 of 37
TABLE 32: CLEANUP COSTS FOR REPRESENTATIVE SPILL SCENARIOS, HIGH-PERSISTENCE OIL
Total cost per Hazard Zone, in thousands of Canadian dollars Spill size
1 2 3 4 5
Small 89 89 67 89 45
Medium 1,565 1,565 1,173 1,565 782
Large 10,728 10,728 8,046 10,728 5,364
Very large 89,400 89,400 67,050 89,400 44,700
Extremely large 178,800 178,800 134,100 178,800 89,400
Exceptionally large 343,296 343,296 257,472 343,296 171,648
Summary of Economic Effects
The preceding summarizes the estimated costs for the main components of fisheries and fish processing, aquaculture, tourism, and direct oil spill cleanup costs. These costs are then summed to produce the following estimations of total economic impact.
TABLE 33: TOTAL ECONOMIC IMPACT FOR REPRESENTATIVE SPILL SCENARIOS, MEDIUM-PERSISTENCE OIL
Total cost per Hazard Zone, in thousands of Canadian dollars Spill size
1 2 3 4 5
Small 90.3 166 111 95.4 64.2
Medium 1,568 1,676 1,237 1,574 810
Large 10,740 11,118 8,195 10,748 5,444
Very large 89,435 94,479 67,337 89,430 47,003
Extremely large 179,082 184,897 134,795 179,123 93,309
Exceptionally large 349,135 350,664 261,464 484,713 175,557
TABLE 34: TOTAL ECONOMIC IMPACT FOR REPRESENTATIVE SPILL SCENARIOS, HIGH-PERSISTENCE OIL
Total cost per Hazard Zone, in thousands of Canadian dollars Spill size
1 2 3 4 5
Small 140 322 166 147 102
Medium 2,389 2,658 1,901 2,395 1,240
Large 16,356 17,320 12,540 16,357 10,425
Very large 136,182 142,010 102,485 135,959 70,976
Extremely large 278,726 280,147 209,907 308,618 141,595
Exceptionally large 529,426 532,513 401,408 665,029 266,612

TP Synopsis Report – TP 14740E Environmental Oil Spill Risk Assessment for the South Coast of Newfoundland 30 of 37
For all of the representative spills, the largest component of the economic impact is the oil spill cleanup costs.
In terms of the effects on local industries, the largest component is generally on aquaculture, except in Zone 5 where effects on fisheries is greater.

TP Synopsis Report – TP 14740E Environmental Oil Spill Risk Assessment for the South Coast of Newfoundland 31 of 37
9.0 RISK RESULTS AND CONCLUSION
As noted at the outset, risk includes two main elements: probability and consequence. An overall estimation of risk must combine these two elements.
The combination of probability and consequence is termed the “statistical loss”. It is calculated by simply multiplying of the estimated economic loss if the event were to occur by the probability of the event occurring. For example, if an event were predicted to occur once in 100 years, and the economic effect of the event were $500,000, then the statistical loss would be estimated to be $500,000 x (1/100) = $5,000 per year.
From the summary (Tables 35 and 36) the following general conclusions can be seen.
• For Hazard Zones 1, 2, and 3, the risk due to tanker spills predominates because of the exposure created by the refinery and terminal at the head of Placentia Bay, and the tanker traffic originating in or passing through these zones.
• The risk associated with vessel fuel spills is much the same in the Hazard Zones with the exception of Zone 4, where it is approximately three times greater than the other four. This is due mainly to the high consequence in the event of a spill, related to the high-value aquaculture operations in Zone 4.
TABLE 35: TOTAL STATISTICAL LOSS FOR REPRESENTATIVE SPILL SCENARIOS, VESSEL FUEL SPILLS
Statistical loss per Hazard Zone, in thousands of Canadian dollars Spill size
1 2 3 4 5 Total
Small 6 25 21 61 22 135
Medium 298 938 680 2,880 794 5,590
Large 107 218 164 645 163 1,297
Very large -- -- -- -- -- 0
Extremely large -- -- -- -- -- 0
Exceptionally large -- -- -- -- -- 0
Total 411 1,181 865 3,586 979 7,022
TABLE 36: TOTAL STATISTICAL LOSS FOR REPRESENTATIVE SPILL SCENARIOS, TANKER CARGO SPILLS
Statistical loss per Hazard Zone, in thousands of Canadian dollars Spill size
1 2 3 4 5 Total
Small 192 68 75 15 6 356
Medium 519 131 137 41 18 846
Large 901 155 158 50 22 1,286
Very large 1,207 729 692 201 14 2,843
Extremely large 520 190 194 65 21 990
Exceptionally large 2,398 899 871 318 7 4,493
Total 5,737 2,172 2,127 690 88 10,814

TP Synopsis Report – TP 14740E Environmental Oil Spill Risk Assessment for the South Coast of Newfoundland 32 of 37
Environmental Risk
Environmental risk is summarized (Tables 37 and 38) by showing how often a spill for a given size category would have a significant effect on seabird population, and the recovery time for the affected species. (Note that in the earlier discussion of effects, Chapter 7, that mortality rates of less than 5 percent were assumed to be within the annual range of variability, and were therefore not considered significant.) For fuel oil spills, Zones 1 and 4 will not have any significant effects; in Zones 2, 3, and 5 only spills in the “large” category show significant effect. (Very large, extremely large and exceptionally large fuel spills are not possible.) For tanker cargo spills, it is generally only the extremely large and exceptionally large categories that result in significant effects, although there are a few instances of large and very large spills causing significant effects.
TABLE 37: SUMMARY OF ENVIRONMENTAL RISK, VESSEL FUEL OIL SPILLS
Hazard Zone Spill size Frequency (per year) Seabird Species Recovery Time
(years)
1. Inner Placentia Bay -- -- -- --
Harlequin duck 1
Northern gannet 9
2. Outer Placentia Bay Large 2.0 x 10⁻²
Thick-billed murre 11
Harlequin duck 1
Northern gannet 9
3. Placentia Bay South Large 2.0 x 10⁻²
Thick-billed murre 11
4. Cabot Strait -- -- -- --
Common murre 5 5. St. John’s Large 3.0 x 10⁻²
Thick-billed murre 8

TP Synopsis Report – TP 14740E Environmental Oil Spill Risk Assessment for the South Coast of Newfoundland 33 of 37
TABLE 38: SUMMARY OF ENVIRONMENTAL RISK, TANKER CARGO OIL SPILLS
Hazard Zone Spill size Frequency(per year)
Frequency (years
between spills) Seabird Species Recovery
Time (yrs)
7.33 x 10⁻³ 136 Thick-billed murre
11 1. Inner Placentia Bay Extremely large &
Exceptionally large
7.33 x 10⁻³ 136 Common eider 4
Extremely large &
Exceptionally large
2.69 x 10⁻³ 371 Common eider 4
2.03 x 10⁻² 49 Harlequin duck 1
2.03 x 10⁻² 49 Northern gannet 9
2. Outer Placentia Bay
Large up to
Exceptionally large
2.03 x 10⁻² 49 Thick-billed murre
11
Extremely large &
Exceptionally large
3.50 x 10⁻³ 286 Common eider 16
2.72 x 10⁻² 37 Harlequin duck 1
2.72 x 10⁻² 37 Northern gannet 9
3. Placentia Bay South
Large up to
Exceptionally large
2.72 x 10⁻² 37 Thick-billed murre
11
4. Cabot Strait Extremely large &
Exceptionally large
7.74 x 10⁻⁴ 1,290 Piping plover 2
Extremely large &
Exceptionally large
4.93 x 10⁻⁴ 2,030 Northern gannet 2
4.15 x 10⁻³ 241 Common murre 5
5. St. John’s
Large up to
Exceptionally large
4.15 x 10⁻³ 241 Thick-billed murre
8

TP Synopsis Report – TP 14740E Environmental Oil Spill Risk Assessment for the South Coast of Newfoundland 34 of 37
10.0 AREA SPECIFIC FACTORS AND FUTURE TRENDS
In previous sections, spill predictions were based on historical statistics using local data for fuel spills and Canadian and world-wide data for tanker spills. An estimate was then made of how special circumstances in the region could modify these results. As well, an estimate was made of potential changes to marine activity in the AOI over the next 10 years that would warrant revision of the frequency estimations.
Area-specific factors are considered first. The study area has many navigational hazards such as shoals and islands near shipping lanes, fog and ice incursions, and substantial marine traffic at several zones of convergence. However, while these factors may affect the likelihood of a spill, none of them are unique to Newfoundland. Many other regions of the world have similar navigational hazards, and while Placentia Bay may be among the busiest ports in Canadian terms, the vessel traffic density is low relative to other areas of the world. Based on this, the report concludes that the use of worldwide accident data is valid without modification for estimating spill frequency in the AOI.
Potential changes in spill risk over the next ten years are analysed. These include major new projects such as:
Nickel Processing Plan, Placentia Bay
Subject to technical and economic feasibility, construction is scheduled to begin in 2009 on a nickel processing plant planned for Long Harbour. Up to 60 additional vessel transits to and from the facility are estimated. Design life for the plant is 30 years.
Crush Granite Rock Quarry, Belleoram
Starting in 2007, granite will be quarried and crushed on site, then loaded onto ships for international markets. Up to 60 vessel transits per year are forecast, with a project life of 50 years.
Oil Refinery, Placentia Bay
A new refinery is proposed for the head of Placentia Bay near the existing Come By Chance refinery, with production to commence in 2011. The new refinery will have a capacity 2.6 times that of the existing refinery, so an estimated 2.6 times as many ships, approximately 400 per year, will transit Placentia Bay.
Oil Refinery, Maritime Provinces
There have been plans to establish a new refinery in the Maritimes, with Nova Scotia being one of the proposed locations. Announcement of a new refinery in Saint John has ended plans for a possible Nova Scotia location.
Bull Arm Fabrication Facility, Trinity Bay
Attempts are being made to increase activity at the fabrication facility, including drilling rig construction and refits. Given its tentative nature, and the low level of marine activity that it would involve, it is not expected to add significantly to vessel transits within the next 10 years.
Yacht Club, Glovertown
A proposed marina in Bonavista Bay would be outside the AOI, but traffic could travel through it. The increase in shipping traffic is not likely to be significant.
Liquefied Natural Gas (LNG) Transshipment Terminal, Placentia Bay
This proposed Terminal could begin operations in 2008 or 2009 with approximately 50 vessels per year, increasing to 300 vessels per year in 2011/2012.
TP Synopsis Report – TP 14740E Environmental Oil Spill Risk Assessment for the South Coast of Newfoundland 35 of 37
Newfoundland Transshipment Limited Terminal, Placentia Bay
Based on declining production from Hibernia and Terra Nova, this existing facility is expected to have a decline in traffic from its current rate of 230 ships annually — to 110 in 2012 and 50 in 2016. Expansion plans are in place and could extend the life of these fields by up to eight years, in which case the decline in ship traffic would be delayed.
Uranium Flexure Belt, Hermitage
Burgeo could be used as an operations supply port for a uranium development near the town. A total of 14 ship movements per year are estimated.
Salmon Farm, Boxey Harbour
A salmon farming operation has begun near Belleoram, in Fortune Bay. The operator plans to also build a hatchery, open a processing capability and develop a fleet of support vessels. Estimates of vessel transits were not provided.
North Atlantic Refinery, Come By Chance
Consideration has been given to expansion of the Come By Chance refinery, as well as modifications to allow the use of different crude feedstocks. No estimates were given to changes in vessel traffic.
Changes in Shipping Regulations and Practices
There has been a worldwide decline in tanker accident rates despite an increase in traffic volumes. It is thought that this is in part due to new regulations and technological advances. An example of the latter is the Automatic Identification System (AIS) which provides better vessel tracking. AIS is currently being implemented worldwide, with Placentia Bay a priority within Canada. Improved mapping technologies are also being used to better identify navigational hazards in key areas.
On the other hand, there is currently a worldwide shortage of Master Mariners, and the situation is expected to worsen. This could lead to an increased likelihood of an accident and spill.
Overall Effect of Changes
Of all of these proposed or likely changes, the only one to significantly change the spill frequency estimations is the proposed new refinery near Come By Chance. It could more than triple the amount of its current tanker traffic. However, this increased level of traffic will only be in the range of one or two tanker visits per day. As already noted, by worldwide standards, Placentia Bay is not a busy shipping region, a situation that will not change with the proposed new activities.
The earlier estimates of oil spill frequency were based on current levels of cargo volumes and tanker traffic. It was therefore possible to re-estimate those values using the new projected cargo volumes and tanker traffic. This was done for the three largest spill sizes for each of the five hazard zones.
In terms of environmental risk, the increased likelihood of spills leads to a potential increase in effects on key bird species, so their estimated recovery times were re-calculated. Estimated recovery times, in the event of a large to exceptionally large spill now range to as much as 11 years for the thick-billed murre and 16 years for the common eider, but in the range of two to nine years for all other identified bird species.
Potential changes to economic risk with increased traffic were also estimated and are summarized in Table 39.

TP Synopsis Report – TP 14740E Environmental Oil Spill Risk Assessment for the South Coast of Newfoundland 36 of 37
TABLE 39: SUMMARY OF 10-YEAR CHANGE TO ECONOMIC RISK, TANKER CARGO SPILLS
Statistical Loss (thousand CDN $ per year) Hazard Zone
Current risk Additional risk Total
1 5,737 2,802 8,539
2 2,172 895 3,067
3 2,127 673 2,800
4 690 32 722
5 88 1 89
Total 10,814 4,403 15,217

TP Synopsis Report – TP 14740E Environmental Oil Spill Risk Assessment for the South Coast of Newfoundland 37 of 37
11. 0 CONCLUSIONS
This study was performed to enable Transport Canada to understand the nature of the oil spill risk posed to the economy and ecology of the Newfoundland south coast, and to then be able to make decisions regarding the cost-effectiveness of implementing measures to reduce the risk from oil spills. The approach of the study includes estimating the two key elements of risk: the probability of an oil spill occurring and the consequences of the spill should it occur.
Stakeholder consultations were held to allow input from interested organizations and the public on their concerns regarding oil spill risk in the region. Some of the major issues raised include:
• Lack of infrastructure along the south coast to support a large-scale cleanup.
• Several specific species are vulnerable to spills.
• Response equipment is centrally located in St. John’s. It does not appear to be located in areas of highest risk.
• Tourism is increasingly important and should be considered in the effects portion of the study.
Marine traffic in the region was compiled from an extensive range of sources. In terms of oil spill risk, the most significant of the marine traffic are the oil tankers that transit Placentia Bay and call on the two terminals at the head of the bay. Predicted frequencies of spills in Hazard Zones 1, 2, and 3, which respectively encompass the head, traffic lanes, and outlying waters of Placentia Bay are in the range of three to ten times greater than the other two Hazard Zones, the waters from Placentia Bay to Port Aux Basques (Zone 4) and the waters near and south of St. John’s (Zone 5).
The economic consequences of spills were evaluated for representative scenarios in each Hazard Zone. For all of the representative spills, the largest component of the economic impact is the oil spill cleanup costs, which was roughly the same for each zone. In terms of the effects on local industries, the largest component is generally on aquaculture, except in Zone 5 where effects on fisheries are greater.
Combining spill frequency with economic effect, the greatest risk related to cargo spills is clearly in Placentia Bay because of tanker activity. The risk in Zones 1, 2, and 3 dwarf that of the other two zones. With regards to vessel fuel spills, the greatest risk is in Zone 4, which has the greatest amount of aquaculture activity.
Estimated changes to the industrial setting in the study area will only exacerbate the risks in and around Placentia Bay relative to other parts of the study area.
Placentia Bay is noted as having the greatest risk within the study region, and its waters are known to have many navigational hazards such as shoals and islands near shipping lanes, fog and ice incursions, and substantial marine traffic at several zones of convergence. It should be noted, however, that none of these factors are unique to Newfoundland. Many other regions of the world have similar navigational hazards, and while Placentia Bay may be among the busiest ports in Canadian terms, the vessel traffic density is low relative to other areas of the world.


