Swiss Re Europe S.A.2A, rue Albert BorschetteL-1246 Luxembourg
R.C.S. Luxembourg B25 242
Swiss Re Europe S.A. Solvency and Financial Condition Report For the year ended 31 December 2017


Swiss Re Europe S.A. Solvency and Financial Condition Report 1
Table of contents
Executive summary 3
Section A: Business and performance 5A1: Business 5A2: Underwriting performance 7A3: Investment performance 8A4: Performance of other activities 8A5: Any other information 8
Section B: System of governance 9B1: General information on the system of governance 9B2: Fit and proper requirements 13B3: Risk management system including the own risk and solvency assessment 14B4: Internal control system 15B5: Internal Audit function 16B6: Actuarial function 16B7: Outsourcing 17B8: Any other information 17
Section C: Risk profile 18Overview of risk exposure 18C1: Underwriting risk 19C2: Financial market risk 20C3: Credit risk 20C4: Liquidity risk 21C5: Operational risk 21C6: Other material risks 21C7: Any other information 21
Section D: Valuation for solvency purposes 22D1: Assets 22D2: Technical provisions 25 Life business 25 Non-life business 26D3: Other liabilities 28D4: Alternative methods of valuation 31D5: Any other information 31
Section E: Capital management 32E1: Own funds 32E2: Solvency Capital Requirement and Minimum Capital Requirement 34E3: Duration-based equity risk 34E4: Differences between the standard formula and the internal model 35E5: Non-compliance with the Minimum Capital Requirement and
non-compliance with the Solvency Capital Requirement 36E6: Any other information 36
Glossary 37

2 Swiss Re Europe S.A. Solvency and Financial Condition Report

Swiss Re Europe S.A. Solvency and Financial Condition Report 3
Executive summary
Business and performance
Swiss Re Europe S.A. (“the Company”) is authorised by the Luxembourg Finance Minister to conduct all types of reinsurance business and operates through a number of branches in the European Union. The main classes of business are property, liability, life and health reinsurance. Main geographical areas by location of the ceding undertakings are the United Kingdom (UK), Germany, France, Spain and Canada.
Effective 1 January 2017, the Company has entered into a novation agreement, accepting the existing and prospective non-life business ceded by the Canadian branch of Swiss Reinsurance Company Ltd (SRZ) and previously reinsured by Swiss Re Asia Pte. Ltd (formerly: European Reinsurance Company of Zurich Ltd).
The underwriting performance for 2017 was a profit of EUR 149 million (2016: EUR 775 million). The decrease in the underwriting performance is mainly driven by higher claims from natural catastrophes in 2017 (Atlantic hurricanes Harvey, Irma, Maria).
Investment income in 2017 amounted to EUR 426 million (2016: EUR 631 million) and the investment charges to EUR 124 million (2016: EUR 157 million). Investment income in 2017 included lower dividend income, mainly from participations and private equity investments and lower realised gains from investments compared to 2016. The decrease in investment charges was primarily due to lower interest charges on deposits received from reinsurers.
System of governance
The governance and organisational structure of the Company is set out in the Company’s Articles of Association, Terms of Reference and Charters of Duties. These define the responsibilities and authority of the members of the Board and Committees.
There were no significant changes to the system of governance in 2017. The Articles of Association of the Company have been amended and the Board has approved, effective 1 January 2018, the formal establishment and continuation of the existing Management Committee in accordance with the revised Articles of Association, and updated the Terms of Reference in order to, inter alia, delegate additional responsibilities and authority to the Management Committee.
The Company uses an internal model for the purposes of calculating the Solvency Capital Requirement (SCR). The Commissariat aux Assurances (CAA) approved the internal model and its associated governance framework for use in calculating the Company’s SCR under Solvency II on 17 December 2015. The Company’s internal model governance framework sets out the requirements for model development standards, the governance around changes to the internal model, validation of the internal model and data quality standards. The Company has adopted two changes to its internal model governance framework affecting the hierarchical structure required to approve administrative procedures used in the model as well as model governance documents, and ownership of the independent model validation.
The Board carries out an annual evaluation of its system of governance against relevant best practice standards. During the reviews performed in 2017, the Board concluded that the system of governance is adequate to the nature, scale and complexity of the risks inherent in its business.
Risk profile
The risk profile of the Company remains broadly unchanged. For property and casualty, the main exposures of the Company are to non-life claims inflation, European windstorm and Canadian property risks (Canadian windstorm and Earthquake Pacific Northwest) as a result of incoming intra-group retrocession (IGR) from the Canadian branch of SRZ. For life and health, the main exposures are to mortality trend and lethal pandemic risk factors. Financial market risk is driven by equity, credit spread and real estate exposures.
The Company has a significant risk concentration derived from IGR arrangements with SRZ, which maintains a strong capital position.
The Company’s exposure to the liquidity risk is driven by potential impact of extreme losses, collateral requirements and investments into illiquid assets. Recent analysis indicates that the Company’s liquidity position is sufficient to meet expected liquidity requirements after a large loss event.

4 Swiss Re Europe S.A. Solvency and Financial Condition Report
Executive summary
Valuation for solvency purposes
Invested assets Investments are valued at market value, which is determined to the extent possible by reference to observable market prices. Where observable market prices are not available, the Company follows the fair value measurement methodology. The difference between Solvency II and Company Statutory are mainly due to unrealised gains/losses in unit trusts, which are taken into account under Solvency II but not accounted for Company Statutory purposes. In addition, the accrued interest on investments is classified as receivables under Company Statutory but as investments under Solvency II.
Life technical provisionsThe total life net technical provision of EUR -50 million (2016: EUR 172 million) under Solvency II valuation is compared to the Company Statutory amount of EUR 767 million (2016: EUR 1 808 million). The main differences between the valuations are the following: Statutory margins are included in the statutory reserves, whereas Solvency II technical provisions is the best estimate
(excluding risk margin). Client balances and risk margin are included in Solvency II technical provisions and not in Statutory reserves.
Non-life technical provisionsThe total non-life net technical provision of EUR 4 061 million (2016: EUR 3 461 million) under Solvency II valuation is compared to the Company Statutory amount of EUR 4 764 million (2016: EUR 4 243 million). Solvency II being an economic valuation framework, and the Company Statutory valuation being an accounting valuation framework, the key differences are the following: In the Company Statutory figures, future cash flows are not discounted, there is no concept of risk margin and the
counterparty risk is not included in the valuation. For Solvency II purposes, an estimate of the cash flows ultimately received for the contracts in scope is recognised. For
Company Statutory, only the portion of cash flows written by the cedent and earned during the reporting period is recognized. In the Company Statutory figures there is no provision for future losses, whereas the Solvency II technical provisions contain
best estimates of future losses not yet incurred at the date of valuation.
Other assets and liabilities The differences in valuation of other assets and liabilities are mainly related to different recognition under Solvency II and Company Statutory valuation: deferred tax assets and liabilities are specific to Solvency II, whereas deferred acquisition costs and provision for currency risk are specific statutory items.
Capital management
The eligible amount of own funds to cover the Company’s SCR for 2017 is EUR 2 298 million (2016: EUR 2 679 million). As at 31 December 2017, the Company’s SCR was EUR 905 million (2016: EUR 972 million) and the Minimum Capital
Requirement (MCR) was EUR 407 million (2016: EUR 437 million). The solvency ratio expressed as eligible own funds as a percentage of the SCR as at 31 December 2017 was equal to 254%
(2016: 276%).

Swiss Re Europe S.A. Solvency and Financial Condition Report 5
Section A: Business and performance
A1: Business
Full name and legal form Swiss Re Europe S.A. (“the Company”) was incorporated on 5 December 1986 as a limited liability company (société anonyme) under the laws of the Grand-Duchy of Luxembourg, with registered office at 2A, rue Albert Borschette, L-1246 Luxembourg, registered with the Luxembourg Trade and Companies Register under number B25242. The Company’s legal entity identifier (LEI) is 549300CJ7LW6QSGIL444.
Supervisory authorityThe Company is authorised by the Luxembourg Finance Minister to conduct all types of reinsurance business and operates through a number of branches in the European Union.
Commissariat aux Assurances (CAA)7 Boulevard Joseph IIL - 1840 LuxembourgGrand-Duché de LuxembourgTelephone: +352 22 69 11 1Fax: +352 22 69 10www.commassu.lu
Ultimate parent company and group supervisorThe ultimate parent company is Swiss Re Ltd, a joint stock company, listed in accordance with the International Reporting Standard on the SIX Swiss Exchange, domiciled at Mythenquai 50/60 in 8022 Zurich, Switzerland, and organised under the laws of Switzerland. For the purposes of this report, the ultimate parent company and all its subsidiaries are referred to as Swiss Re or the Swiss Re Group. The Group supervisor is the Swiss Financial Market Supervisory Authority FINMA.
Swiss Financial Market Supervisory Authority FINMALaupenstrasse 27CH – 3003 BernSwitzerlandTelephone: +41 (0)31 327 91 00Fax: +41 (0)31 327 91 01www.finma.ch
External auditorThe external auditor appointed by the shareholder of the Company is PricewaterhouseCoopers.
PricewaterhouseCoopers Société coopérative2 rue Gerhard MercatorB.P. 1443 L-1014 LuxembourgGrand-Duché de LuxembourgTelephone: +352 49 48 48 1Fax: +352 49 48 48 29 00www.pwc.lu
Holding company The parent company of the Company is Swiss Re Europe Holdings S.A., a limited liability company (société anonyme) incorporated and existing under the laws of the Grand-Duchy of Luxembourg, with registered office at 2A, rue Albert Borschette, L-1246 Luxembourg, registered with the Luxembourg Trade and Companies Register under number B72575. Swiss Re Europe Holdings S.A owns 100% of the shares of the Company.

6 Swiss Re Europe S.A. Solvency and Financial Condition Report
Section A: Business and performance
Material related undertakingsAs of 31 December 2017, the investments in material related undertakings were as follows (by decreasing absolute amount of investment):
Simplified group structureThe Company’s parent and ultimate parent company and material related undertakings as at 31 December 2017 were as follows:
Swiss Re Germany Verwaltung GmbH&Co. KG99.99%
Other non material subsidiariesSwiss Re Germany AG 94.00%
Black Rock PEP V, L.P.29.05%
PEP SR I Umbrella L.P.20.00%
Swiss Re Germany Trust e.V.100%
Black Rock PEP IV, L.P.26.92%
Swiss Re Europe S.A. 100%
Swiss Re Europe Holdings S.A. 100%
Swiss Re Reinsurance Holding Company Ltd 100%
Swiss Reinsurance Company Ltd 100%
Swiss Re Ltd 100%
6%
Swiss Re Germany Verwaltung GmbH&Co. KG 99.99%
Other non material subsidiariesSwiss Re Germany AG 94%
Black Rock PEP V, L.P. 29% PEP SR I Umbrella L.P. 20%Black Rock PEP IV, L.P. 27%
Swiss Re Europe S.A. 100%
Swiss Re Europe Holdings S.A. 100%
Swiss Reinsurance Holding Company Ltd 100%
Swiss Reinsurance Company Ltd 100%
Swiss Re Ltd 100%
6%
Material lines of business and geographical areasMaterial countries by gross written premium The material geographic areas for the year ended 31 December 2017 were as follows (by location of the ceding undertaking, as defined in the Quantitative Reporting template (QRT) S.05.02.01 for reinsurance business): United Kingdom* Germany Spain France and Canada
* including Gibraltar
Material lines of business by net written premiumThe material Solvency II lines of business for the year ended 31 December 2017 were as follows: Motor vehicle liability proportional reinsurance Fire and other damage to property proportional reinsurance Property non-proportional reinsurance Life reinsurance and Health reinsurance
Significant business or other eventsEffective 1 January 2017, the Company has entered into a novation agreement, accepting the existing and prospective non-life business ceded by the Canadian branch of SRZ and previously reinsured by Swiss Re Asia Pte. Ltd (formerly: European Reinsurance Company of Zurich Ltd). During 2017, the Atlantic hurricanes Harvey, Irma and Maria resulted in insured losses under those treaties, as further detailed in subsection “A2: Underwriting performance” below. The Company also wrote a new life and health large transaction in Spain. No other significant business or other events that have had a material impact on the Company occurred during 2017.
Subsidiary Country Proportion of ownership interest %
Swiss Re Germany GmbH Germany 94Swiss Re Germany Verwaltung GmbH & Co. KG Germany 99.99Swss Re Germany Trust e.V. Germany 100BlackRock PEP IV, L.P. Cayman Islands 26.92BlackRock PEP V, L.P. Cayman Islands 29.05PEP SR I Umbrella L.P. Cayman Islands 20

Swiss Re Europe S.A. Solvency and Financial Condition Report 7
A2: Underwriting performance
Underwriting performanceThe underwriting performance by material Solvency II lines of business, calculated on the same basis as used in the Company’s statutory financial statements, for the reporting periods ended 31 December, was as follows:
The underwriting performance by material countries, for the reporting periods ended 31 December, was as follows:
The underwriting performance for 2017 was a profit of EUR 149 million (2016: EUR 775 million). Net earned premiums increased to EUR 2 366 million (2016: EUR 2 036 million) as a result of new business, mainly new property and casualty incoming internal retrocession arrangements and a new life and health large transaction in Spain.
The non-life technical result before allocation of administrative expenses by line of business was positive, driven by reserve releases, partly offset by higher claims from significant natural catastrophes in 2017. The non-life technical result after allocation of administrative expenses was a loss of EUR 1 million (2016: a profit of EUR 289 million).
The life technical result was a profit of EUR 150 million (2016: EUR 485 million), primarily due to positive impacts from reserving assumptions and methodology changes.
Net operating expenses in 2017 remained stable at EUR 486 million (2016: EUR 487 million) being the net increase in reinsurance commissions and profit participations, offset by the acquisition cost on the above-mentioned transaction in Spain.
EUR millions 2016 2017
Non-life reinsuranceMotor vehicle liability - proportional –1 –35Fire and other damage to property - proportional 21 –71Non-proportional property 112 58Other non-life 157 47
Total non-life 289 –1Life and health reinsurance
Health 128 –1Life 358 151
Total life 486 150Total all lines 775 149
EUR millions 2016 2017
United Kingdom* 352 –54Germany 278 84Spain 44 –51France 81 120Canada 95 –60Other –76 110Total 775 149
* including Gibraltar

8 Swiss Re Europe S.A. Solvency and Financial Condition Report
Section A: Business and performance
A3: Investment performance
Investment resultsInvestment income and expenses by investments assets category, for the reporting periods ended 31 December, were as follows:
Investment income in 2017 included lower dividend income, mainly from participations and private equity investments, and lower realised gains on investments compared to 2016. The decrease in investment charges was primarily due to lower interest charges on deposits received from reinsurers.
Gains and losses recognised directly in equityThe Company does not recognise any gains or losses directly in equity.
Investments in securitisationThe Company holds EUR 106 million of collateralised investments, mainly residential mortgage-backed securities in Europe. The investment income shown above includes EUR 2 million of interest income from these investments.
A4: Performance of other activities
Material leasing arrangementsThe Company has various agreements for the lease of office space. The expenses for the lease of office space in 2017 amounted to EUR 7 million. The Company does not have any material financial and operating leasing arrangements.
Other material income and expenses incurred during the reporting periodOther charges in 2017 amounted to EUR 27 million (2016: EUR 50 million) and mainly consisted of trademark licence fees and transactions with Group companies.
A5: Any other information
Other material informationThe UK started a process to leave the EU in March 2017. The Company is taking steps to ensure continuity of UK business operations after the UK has left the EU. The expected date for conclusion of these steps depends on the outcome of the political negotiations regarding the withdrawal agreement, the future relationship between the UK and the EU and the regulatory landscape.
EUR millions 2016 2017
Deposits with ceding undertakings 46 48Income from related undertakings 234 14Shares and private equity 97 99Debt securities and other variables 127 111Value re-adjustments on investments 10 7Gains on realisation of investments 111 141Other 6 6Total investment income 631 426Investment management charges, including interest –93 –77Value adjustments on investments –37 –34Losses on realisation of investments –27 –13Total investment charges –157 –124

Swiss Re Europe S.A. Solvency and Financial Condition Report 9
Section B: System of governance
B1: General information on the system of governance
Organisational structure and system of governance The governance and organisational structure of the Company is set out in the Company’s Articles of Association, Terms of Reference and Charters of Duties. These define the responsibilities and authority of the members of the Board and Committees.
BoardThe Board’s duty is to manage the Company in the best possible way to achieve the Company’s purpose and within the Company’s best interests. The Board is responsible for the sound and prudent management of the Company.
The members of the Board bear ultimate responsibility and liability for meeting applicable legal obligations. They therefore have the right and obligation to take all measures to fulfil their legal duties.
The members of the Board are individuals with the abilities, professional background and personal character (including honesty and financial soundness) necessary and required to ensure an independent decision-making process in a critical exchange of ideas with the executive management.
Composition of the BoardAs at 31 December 2017, the Board has ten members, of whom five are independent non-executive members and five are members of Swiss Re Group Executive Committee. The Chairman of the Board is an independent non-executive member appointed by the Board.
Delegation and retained responsibilities of the BoardThe Board has delegated certain responsibilities and authorities to the following joint Board Committees of the Luxembourg Companies: the Audit Committee the Finance and Risk Committee
The Board has further delegated certain responsibilities and authorities to: the Management committee of the Company the Material Transaction Sub-committee of the Company the Solvency II committee of the Company the General Manager of the Company the General Manager committee of the Company the Branch Managers of the Company the Key Function Holders of the Company the Key Functions committee of the Company
The Board retains ultimate responsibility, oversight and control of the delegated responsibilities and authorities.
Board Committees:Audit CommitteeThe Audit Committee assists the Board in fulfilling its oversight responsibilities as they relate to the integrity of the Company’s financial statements (including its Luxembourg statutory returns), the Company’s internal controls, compliance with legal, tax and regulatory requirements, the qualifications and independence of the external auditor, and the performance of both the Internal Audit function and the external auditor.
Finance and Risk CommitteeThe central task of the Finance and Risk Committee is to assist the Board in fulfilling its oversight responsibilities as they relate to the Company’s risk tolerance and capital adequacy, Own Risk and Solvency Assessment (ORSA), risk concentration, threats, etc. both from the Company’s statutory and economic perspective. This includes a forward-looking perspective arising from the Company’s business and capital plan and strategic transactions.

10 Swiss Re Europe S.A. Solvency and Financial Condition Report
Section B: System of governance
Other delegations:Management CommitteeThe Management Committee’s primary responsibility is to manage the day-to-day business and operations of the Company. The Management Committee as a collective body is fully accountable to the Board.
Material Transaction Sub-committeeThe Board has authorised the set-up of a sub-committee of the Management Committee. The purpose of the Material Transaction Sub-committee is to exercise specific management responsibilities and authorities with respect to some material transactions to be entered into by the Company. Solvency II CommitteeThe purpose of the Solvency II Committee is to assist the Board, the Management Committee and the General Manager of the Company with the Solvency II application. The Solvency II Committee is authorised to take Solvency II-related decisions on operational matters and to submit proposals and recommendations on Solvency II strategic matters to the Board and the Management Committee. General ManagerThe General Manager is in charge of the day-to-day management of the Company and represents the Company towards the CAA. In particular, the General Manager has authority to sign in respect of financial and treasury management, including opening and operations of bank accounts, hedging agreements and payments. He also has authority regarding employment matters and to act in the best interests of the Company’s branches. The General Manager must be resident in Luxembourg and approved by the Luxembourg Minister of Finance.
General Manager CommitteeThe purpose of the General Manager Committee is to assist the General Manager in managing and supervising operational activities of the Company and its branches to the extent that such operational activities relate to the Company and to provide a cross-functional and cross-location coordination and communication platform for matters relating to the Company.
Branch ManagersFor each branch, the Board has appointed one person as Branch Manager and legal representative of the Company in the jurisdiction of the branch, who is in charge of the day-to-day management of the branch and conducting business in the name of the Company in the jurisdiction of the branch.
Key functionsThe Board is responsible for adopting appropriate measures to implement Group guidelines or policies relating to the functions referred to as “key functions” under the Solvency II framework, ie Risk Management, Compliance, Internal Audit and Actuarial.
The roles of the key functions are as follows:
Risk Management Please refer to the Sub-section “B3: Risk management system” and paragraph “Implementation and integration of the Risk Management function” on page 14 for details of the Risk Management function.
Compliance Please refer to the sub-section “B4: Internal control system” and the paragraph “Implementation of the Compliance function” on page 16 for details of the Compliance function.
Internal Audit Please refer to the Sub-section “B5: Internal audit function” and paragraph “Implementation of the Internal Audit function” on page 16 for details of the Internal Audit function.
Actuarial Please refer to the Sub-section “B6: Actuarial function” and paragraph “Implementation of the Actuarial function” on page 16 for details of the Actuarial function.

Swiss Re Europe S.A. Solvency and Financial Condition Report 11
Key Function HoldersThe Board nominates individuals as designated representatives of the respective key functions of the Company (the “Key Function Holder”) and monitors the key functions to ensure they are adequately staffed with professionals possessing the requisite professional qualifications, knowledge and experience. Key Function Holders operate under the oversight of and report directly to the Board and Board Committees of the Company.
Key Functions CommitteeThe central task of the Key Functions Committee is to assist the Board in fulfilling its oversight responsibilities as they relate to the Company’s key functions and internal controls.
Reporting and access to informationThe Board, the Board Committees and the Management Committee have full authority to investigate any matters within their respective duties. They are authorised to obtain independent professional advice, request external advisors to undertake specific tasks or to obtain any information from any director, officer or employee acting on behalf of the Company and to secure their attendance to the relevant meetings when necessary.
The key functions have operational independence in performing their reporting functions with the exception of Internal Audit, which has complete independence in performing its reporting function. Key Function Holders report directly to the Board, Board Committees, Management Committee or Key Functions Committee any issues that could have an impact on the Company.
Material changes in the system of governanceThe Articles of Association of the Company were amended and the Board approved, effective 1 January 2018, the formal establishment and continuation of the existing Management Committee in accordance with the revised Articles of Association, and updated the Terms of Reference in order to, inter alia, delegate additional responsibilities and authority to the Management Committee.
Remuneration policy and practices The Company adopted the Swiss Re Standard on Compensation which captures Swiss Re’s compensation framework and governance, outlines the compensation processes across the Group and provides key guidelines for the execution of individual compensation actions.
Swiss Re aims for total compensation that is competitive in the market and also seeks to ensure that total compensation is well-balanced in terms of fixed versus variable compensation and in terms of short-term versus long-term incentives. This is to encourage sustainable performance and appropriate risk-taking in line with the business and risk strategy.
Swiss Re has several incentive programmes that reflect the long-term nature of the business: both the Value Alignment Incentive (VAI) as the deferred part of the Annual Performance Incentive (API) and the Leadership Performance Plan (LPP) aim to reward sustained performance rather than short-term results. These programmes support closer alignment of the interests of shareholders and employees.
Overview of the compensation componentsFixed compensationBase salary Base salary is the fixed compensation paid to employees for carrying out their role and is established based on the following factors: scope and responsibilities of the role, as well as qualifications required to perform the role market value of the role in the location in which Swiss Re competes for talent skills and expertise of the individual in the role
Benefits Swiss Re aims to provide a competitive package of employee benefits. Benefits are designed and implemented under a global framework, while appropriately reflecting local employment market conditions.
Variable compensationAnnual Performance IncentiveThe API is a performance-based, variable component of compensation. Combined with the base salary, it provides competitive total cash compensation when both business and individual performance targets are achieved. When the total API level for an employee exceeds a pre-defined amount, the award is split into two components: an immediate cash incentive payment (cash API) and a deferred API (VAI).

12 Swiss Re Europe S.A. Solvency and Financial Condition Report
Section B: System of governance
Value Alignment IncentiveThe VAI is a mandatory deferral of a portion of the API and introduces a time component to this performance-based, variable compensation. This supports the Group’s business model by aligning a portion of variable compensation with sustained long-term results.
Leadership Performance PlanThe purpose of the LPP is to provide an incentive for Swiss Re’s senior management to create sustainable company performance over the long term. The vesting and performance measurement period is three years with no additional holding requirement. For LPP awards granted to Group Executive Committee members and other key executives, the duration of the LPP is five years comprising a three-year vesting and performance measurement period and an additional two-year holding requirement.
Participation plansIncentive Share PlanThe Incentive Share Plan (ISP) provides employees with an opportunity to purchase Swiss Re Ltd shares with some or all of their immediate cash API. Shares are offered with a 10% discount on the fair market value and are subject to a one-year blocking period. Full shareholder rights apply during this blocking period. The ISP encourages alignment with shareholder interests. At the end of the one-year period, the employee assumes full ownership of the shares.
Global Share Participation PlanThe Global Share Participation Plan (GSPP) provides employees with an opportunity to directly participate in the long-term success of the Group by purchasing Swiss Re shares (up to a maximum of CHF 7 000 per year and capped at 10% of base salary). Swiss Re provides a 30% match on the number of shares held by employees at the end of the three-year plan cycle. The match is subject to forfeiture rules in case of termination of employment before the end of the plan cycle. The GSPP has the same core design in all locations.
Compensation framework for the Board Compensation structure for non-executive directorsThe non-executive members of the Board and Board Committees of the Company receive 100% of their fees in cash. Thepayments are made on a quarterly basis. The fees are determined in advance at the start of the financial year and are approved atthe Swiss Re Group level. The formal decision is taken at the General Shareholders Meeting of the Company. Any compensationpaid to non-executive directors who are also members of the Swiss Re Ltd Board of Directors (or Group Executive Committee, ifany) is subject to approval by the Annual General Meeting of Swiss Re Ltd and may only be paid after due authorisation. The feelevel for each member is reviewed annually and reflects their differing levels of responsibility and time commitment.
Compensation structure for executive directorsExecutive directors receive no additional fees for their services as members of the Board.
Performance criteriaAnnual Performance Incentive Swiss Re operates a Target API (TAPI) system along with a performance management framework that provides equal weighting to results-oriented and behaviour-related performance criteria for all employees. API is awarded for both objectives achieved and the demonstration of desired behaviours.
Value Alignment IncentiveThe performance factors of the VAI are calculated based on the three-year average of the published Economic Value Management (EVM) previous years’ business profit margin. EVM is Swiss Re’s proprietary integrated economic valuation and accounting framework for planning, pricing, reserving and steering the business. The EVM previous years’ business profit margin is the ratio of EVM previous years’ business profit to EVM capital allocated to previous years’ business in the current year.
Leadership Performance PlanAt the grant date, the award amount is split into two underlying components: Restricted Share Units (RSUs) and Performance Share Units (PSUs). A fair market value methodology executed by a third party determines the number of RSUs and PSUs granted.

Swiss Re Europe S.A. Solvency and Financial Condition Report 13
Restricted Share Units The performance condition for RSUs is return on equity (ROE) with a linear vesting line. Vesting is at 0% for an ROE at the risk- free rate and at 100% for ROE at a pre-defined premium above the risk-free rate. The premium is set at the beginning of the plan period and for LPP 2017, this premium has been set at 900 basis points above the annual risk-free rate which is determined as the average of 12 monthly rates for ten-year US Treasury bonds of the corresponding performance year. At the end of each year, the performance against the ROE condition is assessed and one third of the RSUs are locked in within a range of 0% to 100%. At the end of the three-year period, the total number of units locked in at each measurement period will vest (capped at 100%*).
Performance Share UnitsThe performance condition for PSUs is relative Total Shareholder Return (TSR) measured over three years. The PSUs vest within a range of 0% to 200%. Vesting starts at the 50th percentile of TSR relative to peers with 50% vesting and is capped at 200%* vesting at the 75th percentile relative to peers. In case of a negative TSR over three years, the Company retains the discretion to reduce the level of vesting. Swiss Re’s TSR performance is assessed relative to the TSR of a pre-defined peer group. This peer group consists of companies that are similar in scale, have a global footprint or similar business mix as Swiss Re.
Supplementary pension or early retirement schemes for key individualsThe Company does not have a policy of offering supplementary or enhanced early retirement to key individuals.
Material transactionsDuring 2017, there were no material transactions with shareholders, with persons who exercise a significant influence on the Company, or with members of the administrative, management and supervisory bodies.
B2: Fit and proper requirements
Policy framework for fit and proper requirementsThe Company’s compliance with fit and proper requirements is assured through a combination of policies and related procedures. In particular, the Board and Management follow special procedures related to appointments (nominations or changes), performance review and training. A set of tools and templates facilitates the implementation of these policies, which collectively ensure that those who effectively run the undertaking possess the requisite skills, knowledge and expertise for their roles.
Process for assessing fitness and propriety Compliance with fit and proper requirements of the Board and Board Committees is reviewed at various stages, as shown in table below.
Stage Activities
Initial assessment The Company has adopted a specific policy and standards describing the appointment process and the skill/experience approvals required. The Company screens nominees up-front (eg CV, passport, criminal records, check) and uses the Swiss Re Group approval process and fitness and propriety assessment.
Induction Newly appointed members receive an induction package covering a range of Group/Company topics such as Finance, Legal and Compliance, and Risk Management.
Training Training sessions are often integrated in the agenda of regular Board meetings, which are scheduled every three months.
Collective assessment A formal performance review of the Board is conducted annually during a private session. Board members individually prepare the review with a self-assessment questionnaire and checklist which specifically refers to fit and proper requirements. Gaps and action items (eg training needs, suggested changes to board committees) are documented for follow-up.
Ongoing and ad-hoc assessment
All individuals subject to fit and proper requirements have to complete an annual fit and proper declaration, which focuses on the validation of the propriety to cover the assigned position. Re-assessments are performed if (a) additional responsibilities are assigned to a concerned individual, (b) if a concerned individual becomes aware that he/she no longer meets the Company’s fit and proper criteria, or (c) if the performance or the behaviour of a concerned individual raises serious doubts about this person meeting the fit and proper criteria.
* Maximum vesting percentage excludes share price fluctuation until vesting.

14 Swiss Re Europe S.A. Solvency and Financial Condition Report
Section B: System of governance
B3: Risk management system including the own risk and solvency assessment
Risk management system The risk management system of the Company leverages the global framework that governs risk management practices throughout the Swiss Re Group. Risk policies, standards and guidelines established at Group and Business Unit level form a large part of the Company’s risk management system; key documents are reviewed for appropriateness by the Management Committee and the Board of the Company and subsequently adopted. Additional risk governance for the Company is established as an addendum to the respective Group or Business Unit governance where needed to address the specific circumstances of the Company.
A key objective of the Risk Management function is to support controlled risk-taking and the efficient, risk-adjusted allocation of capital. The Company’s risk management is based on four guiding principles. These apply consistently across all risk categories: Controlled risk-taking - Financial strength and sustainable value creation are central to Swiss Re’s value proposition. The
Company thus operates within a clearly defined risk policy and risk control framework. Clear accountability - Swiss Re’s operations are based on the principle of delegated and clearly defined authority. Individuals
are accountable for the risks they take on, and their incentives are aligned with Swiss Re’s overall business objectives. Independent risk controlling - Dedicated units within Risk Management control all risk-taking activities. These are supported
by Compliance and Group Internal Audit functions. Transparency - Risk transparency, knowledge sharing and responsiveness to change are integral to the risk control process.
The central goal of risk transparency is to create a culture of mutual trust, and reduce the likelihood of surprises in the source and potential magnitude of losses. Risk transparency is ensured through regular reporting of both quantitative and qualitative risk information to the Company’s Management Committee, Finance and Risk and Audit Committees as well as to the Board.
Risk identificationFor its risk identification process, the Company applies Swiss Re Group’s framework for identifying, assessing, managing and controlling risks. In addition, the emerging risk process provides a platform for raising emerging risks and reporting early warning signals; this information is complemented with external expertise, and reported to internal stakeholders.
Risk appetite framework and limitsThe Company’s risk appetite framework establishes the overall approach through which the Company practices controlled risk-taking and leverages the Group’s risk appetite framework as provided in the Group’s Risk Policy framework adopted by the Board of Directors of the Company. The Company’s risk tolerance is driven by its Legal Entity Capitalisation Policy, which defines the target capital as the minimum available capital that the Company needs to hold in relation to the risks that it assumes.
Implementation and integration of the Risk Management functionUnder the Company’s Terms of Reference, the Board assumes the oversight role for risk and capital steering supported by the Chief Financial Officer and the Chief Risk Officer. The Board has delegated certain responsibilities and authorities to the Audit Committee, the Finance and Risk Committee as well as to other committees (including the Management Committee and Solvency II Committee).
The governance bodies for the Company are described in section “B1: General information on the system of governance”, paragraph „Organisational structure and system of governance“ on page 9. The Company’s Risk Management is supported by global and business unit Risk Management functions that provide specialised risk category expertise and accumulation control, risk modelling and reporting services, regulatory relations management, central risk governance framework development and specialised risk category expertise and accumulation control.
Internal modelThe Company uses an internal model for the purposes of calculating the SCR under Solvency II. The CAA approved the internal model and its associated governance framework for use in calculating the SCR under Solvency II on 17 December 2015. The Company’s internal model governance framework sets out the requirements for model development standards, the governance around changes to the internal model, validation of the internal model and data quality standards. The internal model governance framework leverages the Swiss Re model governance framework.
The Chief Risk Officer reports the results from the internal model to the Company’s Management Committee, the Finance and Risk Committee, the Audit Committee and the Board as well as to the regulatory authorities based on regulatory reporting requirements.
Process for accepting changes to the internal modelThe Company has defined a controlled approval process for all model changes that leverages the process and definitions in the Group Risk Model Change Standards adopted by the Company. This includes a qualitative and quantitative assessment of the impact of model changes on the Company. The Board is required to approve any major changes to the model prior to

Swiss Re Europe S.A. Solvency and Financial Condition Report 15
implementation. Subsequently, major changes are submitted to the CAA for approval prior to use for external reporting purposes. Minor changes can be adopted by the Company’s Chief Risk Officer and notified to the CAA.
Material changes to the internal model governanceThe Company has adopted two changes to its internal model governance framework that change the hierarchical structure required to approve administrative procedures used in the model as well as model governance documents, and ownership of the independent model validation.
Internal model validation tools and processesThe Risk Model Validation Standards adopted by the Company require independent validation of the internal models. This is carried out by an internal model validation team. The appropriateness of the model is subject to regular review with a broad range of validation tools applied, including profit and loss attribution, stress tests, scenario analyses, reverse stress tests, sensitivity and stability analysis.
The prudent person principleIn accordance with the Prudent Person Principle under Solvency II, the management of the Company’s investments is governed by the general principle of the creation of economic value. This is done on the basis of returns relative to the liability benchmark and its replicating portfolio, the asset management policy adopted by the Company and a set of strategic asset allocation limits that are established by the Board.
Own Risk and Solvency Assessment processThe Own Risk and Solvency Assessment (ORSA) is an ongoing process, with critical risk control and reporting activities being carried out on a regular basis. Within the annual business planning exercise, it is used to assess the risks inherent in the plan and the resilience of the Company solvency and balance sheet over a three-year horizon. Anticipated significant changes in risk profiles are included in assessing the future solvency position. Scenarios are used to provide insights into the strength of the balance sheet and to assess future potential solvency positions. Where exceptionally adverse scenarios are identified, mitigating actions and control measures are proposed which would require the Board’s approval prior to action being taken.
The Chief Risk Officer maintains operational responsibility for carrying out the ORSA process and for delivering the ORSA reports to the Board for approval.
Review of ORSA The ultimate responsibility for the ORSA rests with the Board, which reviews and approves the results of the ORSA process at least annually.
Solvency assessmentBased on the planned risk profile, the internal model is used to determine capital requirements. The Company sets aside capital to cover its quantifiable risks in accordance with its capitalisation policy (see section “E1. Own funds” for more information). The risk-based capitalisation position of the Company is monitored on a frequent basis by the Company’s Chief Risk Officer and Chief Financial Officer against target capital with a number of options if risk and capital develop out of pre-defined control ranges. The ORSA process uses scenarios to stress the plan and assess the resilience of the solvency through the plan period, including identifying relevant actions that may be considered to mitigate the potential downsides.
B4: Internal control system
Internal control systemCoordinated assurance frameworkSwiss Re’s coordinated assurance framework is used by the Company to identify the principal operational risks to the organisation and the relevant key controls to manage them, as well as to demonstrate that a sufficient level of assurance is gained from the effectiveness of those controls.
Risk-taking activities are typically subject to three lines of control. The framework comprises three lines of defence: The first line comprises the day-to-day risk control activities performed by risk takers in the business as well as in other functions of the Company. Independent oversight performed by such functions as Risk Management and Compliance represents the second line of control. The third line consists of independent audits of processes and procedures carried out by Group Internal Audit or by external auditors.
Assurance function interactionsWhile all functions retain their specific mandates and areas of expertise, by working together and relying where possible on each other’s work, a holistic approach is assured under the coordinated assurance framework. Information, planning and execution of

16 Swiss Re Europe S.A. Solvency and Financial Condition Report
Section B: System of governance
assurance work are coordinated and results are shared, reducing overlap between assurance units, increasing mutual reliance and providing an increased focus on pre-emptive assurance. The integrated approach is deployed within the following activities: risk scoping and assurance planning coordination between assurance functions in business interactions issue and action management interactions monitoring across assurance functions reporting
Implementation of the Compliance functionThe Compliance Charter of the Company sets out the objective and purpose of the Company’s Compliance function, as well as the overall roles and responsibilities for compliance with all applicable legal and regulatory requirements, the highest professional and ethical standards and its stated corporate values.
To ensure that the compliance objectives are met consistently within the expectations of regulatory authorities, shareholders, clients and other stakeholders, the Board supports best compliance practices and an appropriately resourced Compliance function.
The Compliance function is responsible for: providing primary assurance oversight and assisting Management in the design of remedial actions and overseeing their
implementation overseeing compliance-related policies, guidelines and the Code of Conduct, and ensuring that these are regularly reviewed
and up to date overseeing as well as providing, appropriate compliance training to the Company’s directors, officers and employees covering
the Code of Conduct and certain related legal and regulatory compliance obligations
The Compliance function is authorised to review all areas and to have full, unrestricted access to all activities, records, property, and personnel, including, without limitation, access to employee e-mail records, subject in all cases to applicable law. In addition, the Compliance function is operationally independent with regular interaction with the independent non-executive director who chairs the Audit Committee of the Company.
B5: Internal Audit function
Implementation of the Internal Audit functionGroup Internal Audit (GIA) assists the Board to protect the assets, reputation and sustainability of the Company. GIA performs audit activities designed to assess the adequacy and effectiveness of the Company’s internal control systems, and to add value through improving the Company’s operations.
GIA provides written audit reports, identifying issues and management actions to the Audit Committee, senior management and external auditor on a regular basis. GIA monitors and verifies that management’s actions have been effectively implemented. Significant issues, and issues that have not been effectively corrected, are highlighted to the Audit Committee.
Independence of the Internal Audit function GIA performs its internal audit activities with independence and objectivity. Activities are coordinated with the other assurance functions. GIA has no direct operational responsibility or authority over any of the activities it reviews.Authority is granted for full, free and unrestricted access to any and all of the Company’s property and personnel relevant to any function under review. All employees are required to assist GIA in fulfilling their duty.
GIA staff govern themselves by adherence to The Institute of Internal Auditors’ “Code of Ethics”. The Institute of Internal Auditors’ “International Standards for the Professional Practice of Internal Auditing” constitutes the operating guidance for the department. In addition, GIA adheres to the Group’s guidelines and procedures, and GIA’s organisation and processes, manuals and guidelines.
B6: Actuarial function
Implementation of the Actuarial functionThe tasks of the Actuarial function under the Solvency II framework are allocated across various functions of the Company: technical provisions calculations are performed by qualified actuaries within the Company opinions on the underwriting policy and reinsurance adequacy are performed within Risk Management input and feedback into the risk modelling framework is provided by the Risk Management team

Swiss Re Europe S.A. Solvency and Financial Condition Report 17
B7: Outsourcing
Outsourcing policyThe Company has adopted Swiss Re’s comprehensive global outsourcing policy and has further specified the oversight framework which is approved by the Board in a separate addendum to Swiss Re’s outsourcing policy.
The policy covers two types of outsourcing arrangements: external outsourcing, where the mandate is given to an external service provider intra-group outsourcing between Swiss Re entities
The Company’s outsourcing policy introduces an approval process for critical or important outsourcing arrangements based on a pre-defined due diligence selection process and requires a set of standard terms to be included in the outsourcing agreement. Requirements for post-approval control and monitoring, documentation and reporting are described.
The Management Committee approves the appointment of Outsourcing Managers for outsourcing arrangements related to critical or important functions. The critical or important services related to Risk Management, the Actuarial function, Compliance and Internal Audit are provided to the Company by other entities in the Swiss Re Group (all located in Europe) under intra-group outsourcing arrangements.
B8: Any other information
Assessment of adequacy of the system of governanceThe Board carries out an annual evaluation of its system of governance against relevant best practice standards. During the reviews performed in 2017, the Board concluded that the system of governance is adequate to the nature, scale and complexity of the risks inherent in its business.
Other material information There is no other material information to report for 2017.

18 Swiss Re Europe S.A. Solvency and Financial Condition Report
Section C: Risk profile
Overview of risk exposure
The Company is exposed to a broad landscape of risks. These include core risks that are taken as part of insurance or asset management operations and are quantified in the Company’s internal model (please refer to section B3, paragraph “Risk management system” on page 14). As required under Solvency II, the model also quantifies operational risk. In addition to these modelled risks, the Company is exposed to further risks that arise from undertaking business, including liquidity, strategic, regulatory, political and reputational risk. The following sections (C1 to C6) provide quantitative and qualitative information on these specific risk categories.
Modelled risks Other risksUnderwriting: Property and casualty, life and health and credit
Operational risk Liquidity risk
Strategic riskRegulatory risk
Financial market risk Political riskCredit risk excl. credit underwriting Reputational risk
Emerging risks
Measures used to assess risks and material changesThe Company uses a CAA-approved integrated internal model to assess all modelled risk categories. Separate risk modules are used to model the individual risk factors. Risks not covered by the SCR (liquidity risks, strategic risks, regulatory, political risks and others) are regularly considered and assessed on a qualitative basis with various monitoring and reviews in place.
In line with the definition of Solvency II, the SCR of the Company measures the capital requirement at a 99.5% value at risk, which measures the annual loss with a recurring period of once in two hundred years.
Quantification of modelled risks by risk categoryThe table below sets out the quantification as at 31 December 2017 for the Company’s modelled risk categories over the next twelve months and the comparison to the previous year. The figures represent the loss for each risk category* that is likely to be exceeded only once in two hundred years. Due to diversification, the total risk of the Company is lower than the sum of the individual categories.
Total risk and SCR of the Company have slightly decreased compared to 2016. This is driven by lower financial market risk following the payment of the EUR 1 billion dividend in 2017.
Risk concentrationThe most significant risk concentration for the Company derives from the IGR with SRZ, which is well capitalised. For the details of the solvency position of SRZ, please refer to the Swiss Re Group website: http://www.swissre.com/investors/ratings/
The underwriting risk of the Company is dominated by natural catastrophe risks (in particular European windstorm, Canadian windstorm and Earthquake Pacific Northwest) and lethal pandemic risk.
The following subsections provide further details.
EUR millions 2016 2017
Property and casualty risk 2 351 2 357Life and health risk 1 161 1 093Financial market risk 690 603Credit risk 164 158Operational risk 145 112Diversification –1 836 –1 700Other impacts** –1 563 –1 609Pre-tax Solvency Capital Requirement 1 112 1 014Deferred tax impact –140 –109SCR 972 905
* Risk categories are gross of retrocession.** Other impacts: mainly driven by retrocession.

Swiss Re Europe S.A. Solvency and Financial Condition Report 19
C1: Underwriting risk
Risk exposureUnderwriting risk comprises exposures taken on by the Company when it writes property and casualty, life and health and credit insurance business.
Property and casualty risk Property and casualty risk arises from coverage that the Company provides for property, liability, motor and accident risks, as well as for specialty risks such as engineering, aviation and marine. The Company is also exposed to the inherent risks from the property and casualty business it underwrites, such as inflation or uncertainty in pricing and reserving. Major property and casualty risks of the Company comprise claims inflation, costing & reserving risk as well as natural catastrophe risk related to European windstorm, German flood, Canadian windstorm and Earthquake Pacific Northwest.
Life and health risk Life and health risk arises from the business the Company takes on when providing mortality (death), longevity (annuity), and morbidity (illness and disability) coverage. In addition to potential shock events, such as a severe pandemic, the Company monitors and manages underlying risks inherent in life and health contracts (such as pricing and reserving risks) that arise when mortality, morbidity, or lapse experience deviates from expectations. The investment risk that is part of some life and health business is modelled, monitored and managed as financial market risk. Life and health risk of the Company is mainly driven by lethal pandemic risk and mortality trend risk.
Credit underwriting riskCredit underwriting risk arises from liabilities taken on by the Company in the course of its credit and surety underwriting. The exposure from this line of business is small in comparison to property and casualty and life and health exposures. Due to the nature of the risk, credit underwriting risk is quantified in the credit model.
Material risk developments over the reporting period The Company’s underwriting risk remains broadly unchanged compared with 2016. Risk mitigationThe Company’s underwriting risk is largely mitigated by a combination of proportional and non-proportional internal retrocessions.
Sensitivity analysis and stress testingThe following stress scenarios have been explored for their underwriting risk impact as part of the 2017 ORSA:
1 in 10 years loss scenario The scenario identifies the magnitude and risk drivers of a loss which has a likelihood of 10% over one year.
Brexit scenario This scenario considers adverse economic implications from Brexit and the impact on the risk profile of the Company of the potential separation of UK business from the remaining portfolio.
Extreme loss scenario (reverse stress test) This scenario considers a reverse stress test scenario of financial market stresses over the plan period, with cross-impact on credit underwriting, followed by a severe Pacific Northwest earthquake hitting the coast of the US and Canada.
The application of the scenarios provided insights on the resilience of the Company and its ability to meet Solvency II requirements in extreme scenarios.
Special purpose vehiclesThe Company currently does not use special purpose vehicles.

20 Swiss Re Europe S.A. Solvency and Financial Condition Report
Section C: Risk profile
C2: Financial market risk
Risk exposureThe value of the Company’s assets or liabilities may be affected by movements in financial market prices or rates, such as equity prices, interest rates, credit spreads, foreign exchange rates or real estate prices. The Company is exposed to such financial market risk from two main sources: through its investment activities as well as through the sensitivity of the economic value of liabilities to financial market fluctuations. Three forms of financial market risk are currently material for the Company: credit spread risk, equity risk and real estate risk.
List of assetsThe Company invests in government, corporate and agency bonds, cash and cash equivalents, listed investments, securitised assets, infrastructure loans, and alternative investments (including real estate) and private equities. These investments have been made in accordance with the prudent person principle as outlined in the paragraph “The prudent person principle” on page 15.
Material risk developments over the reporting periodThe Company’s financial market risk decreased following the reduction in own funds after payment of the EUR 1 billion dividend in 2017.
Risk mitigationThe Company uses a prudent and effective asset and liability matching process to mitigate financial market risks. Regular reporting monitors the effectiveness of the asset liability matching process that is in place. The limits or ranges on asset classes are approved on an annual basis to take into account business planning and the strategic asset allocation plan; usage against approved limits is monitored regularly.
Sensitivity analysis and stress testingA number of financial market scenarios are considered to assess the resilience of the capitalisation of the Company. Two financial market risk scenarios have been explored as part of the 2017 ORSA: Short-term volatility of financial markets in the context of a Disorderly Brexit scenario Adverse financial market development under the Extreme loss scenario
The Company continues to meet all Solvency II requirements under both scenarios.
Group-wide stress testing frameworkApart from the scenarios considered above, the Company’s financial market exposures are also subject to the group-wide stress testing framework. The aggregated stress is monitored against an approved stress limit on a daily basis.
C3: Credit risk
Risk exposureCredit risk reflects the potential financial loss that may arise due to diminished creditworthiness or default of counterparties of the Company or of third parties. This risk arises directly from investment activities as well as from counterparty risk related to external and intra-group counterparties. The Company’s credit risk mainly stems from investments into corporate bonds.
Material risk developments over the reporting periodTotal credit risk has slightly decreased, driven by lower credit investment exposure.
Risk mitigationRisk Management regularly monitors corporate counterparty credit quality and exposures and compiles watch lists of cases that merit close attention. Risk Management monitors and reports credit exposure and limits on a regular basis in order to maintain exposure within approved limits. A governance framework is in place and appropriate actions will be taken when limits are near to being breached.
Sensitivity analysis and stress testingNo specific scenario is considered for credit risk.

Swiss Re Europe S.A. Solvency and Financial Condition Report 21
C4: Liquidity risk
Risk exposureLiquidity risk represents the possibility that the Company will not be able to meet expected and unexpected cash flow and collateral needs without affecting either daily operations or the Company’s financial condition. The Company’s exposure is driven by potential extreme losses as well as the amount of its investments into liquid assets.
Material risk developments over the reporting periodLiquidity risk increased over the year, mainly driven by a decrease in liquid assets and an increase in collateral requirements from new business.
Risk mitigationThe Company controls liquidity risk to ensure that it can satisfy claims payments, debt maturities, expenses, and collateral requirements. To manage liquidity risk, the Company has a range of liquidity policies and measures in place, including regular monitoring and reporting of key stress liquidity ratios to the Board.
Sensitivity analysis and stress testingThe Company assesses liquidity risk against extreme losses affecting the relevant liquidity pool using a group-wide liquidity stress scenario. The most recent analysis shows that the Company’s liquidity position is sufficient to meet the liquidity requirements resulting from such a large loss event over a one-year period.
Amount of expected profit in future premiumsThe total amount of expected profit in future premiums (EPIFP) for the Company as at 31 December 2017 is EUR 1 960 million.
C5: Operational risk
Risk exposureOperational risk represents the potential economic, reputational or compliance impact of inadequate or failed internal processes, people and systems or from external events, including legal risk and the risk of a material misstatement in financial reporting.
Material risk developments over the reporting periodOperational risk has decreased over the year. The number and severity of operational events within the existing period are within acceptable levels. No emerging themes are noticeable with the majority of events relating to processing, human and internal communication errors without any major financial or reputational impact to the Company.
Risk mitigationThe Company’s coordinated assurance framework outlined in section B4 is used to manage and mitigate operational risk.
Sensitivity analysis and stress testingThe Company relies on a regular exercise undertaken by Group Operational Risk Management to re-evaluate its exposure to operational risk. The team conducts workshops where business experts (first line risk takers) and second line of defence risk managers exchange views and outlooks of the potential for one in two hundred year operational events and the expected financial impact if these risks should materialise under various scenarios. The outcome of these discussions enables the recalibration of the Swiss Re Group Risk Model’s operational risk module and a calculation of Group Operational Risk Capital. A portion of this is assigned to the Company on a pro rata basis.
The operational risk model is designed to represent the economic loss potential due to events classified as operational risk over a one-year horizon for use in the internal risk model. The focus of interest for this purpose lies entirely on large, unexpected events that potentially jeopardize the capital adequacy of the Company.
C6: Other material risks
No other material risks have been identified, but there is a process by which the Company tracks the development of emerging risks.
C7: Any other information
Other material InformationAll material information has been disclosed above.

22 Swiss Re Europe S.A. Solvency and Financial Condition Report
Section D: Valuation for solvency purposes
D1: Assets
Methods applied for valuation of material assetsMaterial assets on a Solvency II valuation basis as at 31 December 2017 were as follows (based on QRT Balance Sheet S.02.01.02):
The following valuation bases were used to value material assets for Solvency II purposes:
Investments (other than assets held for index-linked and unit-linked funds)Solvency IIQuoted market price valuation: Investments (excluding the investments listed below) are valued at fair value, determined to the extent possible by reference to
observable market prices.
Adjusted equity valuation: Participations: Valuation of participations (subsidiaries & associates) is estimated based on readily available accounting
information. Private equity funds: The valuation is based on net asset value.
Alternative valuation: Property other than for own use has been valued by an external appraiser using the discounted cash flow method.
Company StatutoryAmortised cost: Debt securities and other fixed income transferable securities are valued at amortised cost (included as bonds or collateralised
securities under Solvency II). Loans to affiliated undertakings are valued at their amortised cost.
Nominal value: Deposits with credit institutions are valued at nominal value.
Lower of acquisition cost or market value: Shares and other variable yield transferable securities and units in unit trusts are valued at the lower of acquisition cost or
market value except for positions held to hedge liabilities in respect of certain co-reinsurance treaties of unit-linked insurance portfolios, which are carried at fair value (included as equity or investment funds under Solvency II).
Private equity funds are valued at the lower of acquisition cost or market value (included as investment funds or participations under Solvency II).
Shares in affiliated undertakings and participating interests, including investments in unit trusts solely used as investment vehicles by Swiss Re Group entities, are valued at the lower of acquisition cost or market value. Acquisition cost includes expenses related to the purchase.
Depreciated acquisition cost:Land and buildings are valued at historical acquisition or construction cost. Buildings are depreciated over their useful economic lives. The acquisition cost includes expenses related to the purchase.
EUR millions Solvency II Company Statutory Difference
Investments (other than assets held for index-linked and unit-linked funds) 6 423 6 047 376Reinsurance recoverables 5 929 9 900 –3 971Deposits to cedents 1 482 1 495 –13Total of all other assets not listed above 1 961 4 793 –2 832Total assets 15 795 22 235 –6 440
Material assetsQuoted market price valuation
Adjusted equity valuation
Alternative valuation
Investments (other than assets held for index-linked and unit-linked funds) All other investments, excluding the investments listed below XParticipations (subsidiaries and associates) XPrivate equity funds XProperty other than for own use X
Reinsurance recoverables XDeposits to cedents X

Swiss Re Europe S.A. Solvency and Financial Condition Report 23
The difference between Solvency II and Company Statutory are mainly due to unrealised gains/losses in unit trusts, which are taken into account under Solvency II but not accounted for Company Statutory purposes. In addition, the accrued interest on investments is classified as receivables under Company Statutory but as investments under Solvency II. Furthermore, in the Solvency II balance sheet, pension liabilities and pension assets are netted, consistent with IAS 19. For more details on pension assets and liabilities, refer to the paragraph “Employee benefits” on page 29.
Reinsurance recoverablesSolvency IIThe share of technical provisions for retroceded business is determined with reference to the contractual agreement and the underlying gross Solvency II best estimate liability per treaty. Furthermore, the reinsurance recoverables include the allowance for the counterparty credit risk.
Company StatutoryThe share of technical provisions for retroceded business is determined with reference to the contractual agreement and the underlying gross business data per treaty.
For life and health, the difference between Solvency II and Company Statutory are attributable to the margins included within the statutory reserving basis. For property and casualty, the difference is attributable to the discounting approach under Solvency II where the future cash flows are discounted using the Solvency II discount rates.
Refer to the section “D2. Technical provisions” for further details on reinsurance recoverables.
Deposits to cedents
Deposits with ceding undertakings are stated mostly at face value under Solvency II and the Company Statutory.
The difference between Solvency II and Company Statutory is due to the different discounting treatment for funds withheld deals under Solvency II compared to Company Statutory, where no discounting is applied to the cash deposits.
Other assets not listed above: The difference between Solvency II and the Company Statutory amounts of other assets not listed above is mainly driven by deferred acquisition costs, only recognised in the Company Statutory, and debtors arising out of reinsurance operations. A part of the latter item contains future cash flows recognized under Solvency II as a part of technical provisions.
Assumptions and judgements applied for valuation of material assetsInvestments are valued at market value, which is determined to the extent possible by reference to observable market prices. Where observable market prices are not available, the Company follows the fair value measurement methodology. There are no major sources of estimation uncertainty when using judgments to determine valuations. Since Solvency II follows fair value methodology, the securities are not carried at more than the recoverable amounts.
Changes made to recognition and valuation basis of material assets during the yearNo changes were made to the recognition and valuation basis or to estimation assumptions during 2017.
Drivers of difference between Solvency II and Company Statutory accountsThe difference between Solvency II balance sheet and the Company Statutory balance sheet are explained by the different valuation methodologies used as described in the paragraph “Methods applied for valuation of material assets” above.
Property (held for own use)The IFRS revaluation model is used as a good representation of the economic value. In determining the economic value, the valuation is supported by market evidence.
InventoriesThe Company does not hold any inventories as at 31 December 2017.
Intangible assetsThe Company does not show any intangible assets on the Solvency II balance sheet as at 31 December 2017.
Financial assetsMethods and assumptions applied in determining the economic valueQuoted prices in active markets for identical assets are used to determine the economic value for the majority of securities. Where quoted prices are not available, alternative methods are used. Most financial asset prices are sourced from Blackrock

24 Swiss Re Europe S.A. Solvency and Financial Condition Report
Section D: Valuation for solvency purposes
Solutions. The Company holds the list of vendors used by Blackrock Solutions to confirm pricing. In addition, all prices are reviewed by Swiss Re’s independent pricing verification team to ensure agreement. When Blackrock Solutions prices are not available, a market price from an alternative source is selected. These are pre-agreed vendors, brokers, dealers or calculations depending on the type of the financial assets.
As at 31 December 2017, the value of assets in scope of the QRT List of assets S.06.02 valued at quoted market prices in active markets, for the identical assets, was EUR 2 683 million (2016: EUR 2 785 million). The value of assets valued at quoted market prices in active markets, for similar assets, was EUR 2 804 million (2016: EUR 3 538 million). The value of assets using adjusted equity method is EUR 2 375 million (2016: EUR 2 535 million) and the value of assets using the alternative valuation method was EUR 786 million (2016: EUR 766 million).
Use of non-observable market dataThe Company follows the valuation methodology as per the Article 10 of the Commission Delegated Regulation (EU) 2015/35 which states that “the use of quoted market prices in active markets for the same assets or liabilities, or, where that is not possible, for similar assets and liabilities, shall be the default valuation approach.” This approach ensures that the values are not significantly higher or lower.
Significant changes to the valuation models usedThere were no significant changes to the valuation models during the year.
Lease assetsThe Company does not have any material financial and operating leasing arrangements other than various agreements for the lease of office space.
Deferred tax assetsRecognition of deferred tax assetsDeferred income tax assets of EUR 341 million have been recognised for all deductible temporary differences and for the carry forward on unused tax losses and unused tax credits, to the extent that the realisation of the related tax benefit through expected future taxable profits is probable.
Deferred tax asset recognition on tax losses is determined by reference to the tax laws enabling such recognition on the same enacted or substantively enacted basis.
Amount for which no deferred tax asset is recognisedNo amount of deferred tax asset is recognised in the Solvency II balance sheet for deductible temporary differences, unused tax losses and unused tax credits because of tax loss carry forward restrictions, other than EUR 648 million (2016: EUR 1 038 million) of Luxembourg tax losses, due to the uncertainty of future profit projections.
The expiry date, if any, for tax losses and tax credits, is dependent on the local tax law and hence varies depending on the relevant branch jurisdiction.
Temporary differences and unused tax losses are assumed to relate to the individual branch, and consistent with tax rules, there is no offsetting of deferred tax assets in one branch against deferred tax liabilities in a different branch.
Swiss Re UK Life & Health and Swiss Re UK Property & Casualty are considered as separate entities for deferred taxes computation in this regard.
Projected future taxable profitsDeferred tax assets to be recovered after more than 12 months are EUR 341 million (2016: EUR 653 million).Deferred tax assets to be recovered within 12 months are zero.
The utilisation of deferred tax assets depends on projected future taxable profits, including those arising from the reversal of existing taxable temporary differences.
Actual tax losses suffered by the CompanyActual tax losses suffered by the branches of the Company in either the existing or preceding periods, in the tax jurisdiction to which the deferred tax assets are considered as a deferred tax asset, are taken into account to the extent that future tax benefits utilising these tax losses are probable. Local tax losses carry forward restrictions are considered. In certain jurisdictions, it may be possible to either utilise tax losses against prior-year profits or against profits arising in sister subsidiaries or branches in those same jurisdictions. For balance sheet figures, the actual utilisation of tax losses in this manner is taken into account. For the purposes of computing the loss absorbing capacity of deferred taxes, such tax utilisation is assumed not to happen.
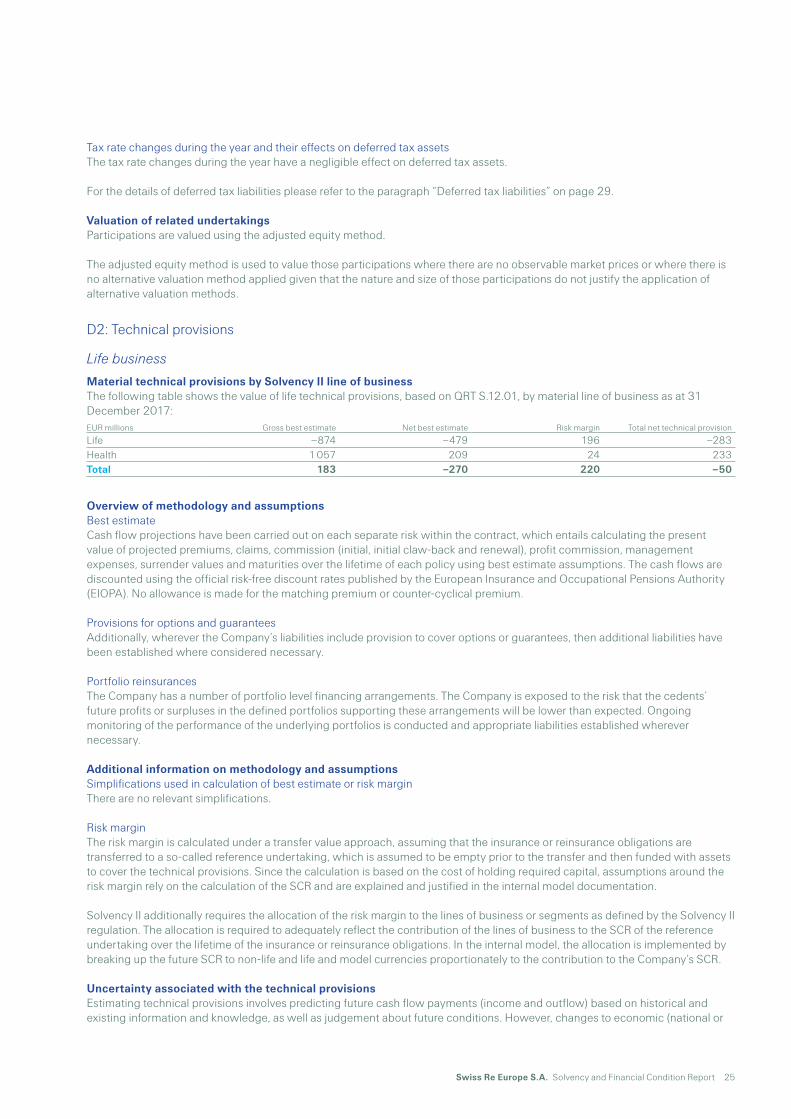
Swiss Re Europe S.A. Solvency and Financial Condition Report 25
Tax rate changes during the year and their effects on deferred tax assetsThe tax rate changes during the year have a negligible effect on deferred tax assets.
For the details of deferred tax liabilities please refer to the paragraph “Deferred tax liabilities” on page 29.
Valuation of related undertakingsParticipations are valued using the adjusted equity method.
The adjusted equity method is used to value those participations where there are no observable market prices or where there is no alternative valuation method applied given that the nature and size of those participations do not justify the application of alternative valuation methods.
D2: Technical provisions
Life business
Material technical provisions by Solvency II line of business The following table shows the value of life technical provisions, based on QRT S.12.01, by material line of business as at 31 December 2017:
Overview of methodology and assumptions Best estimateCash flow projections have been carried out on each separate risk within the contract, which entails calculating the present value of projected premiums, claims, commission (initial, initial claw-back and renewal), profit commission, management expenses, surrender values and maturities over the lifetime of each policy using best estimate assumptions. The cash flows are discounted using the official risk-free discount rates published by the European Insurance and Occupational Pensions Authority (EIOPA). No allowance is made for the matching premium or counter-cyclical premium.
Provisions for options and guaranteesAdditionally, wherever the Company’s liabilities include provision to cover options or guarantees, then additional liabilities have been established where considered necessary.
Portfolio reinsurancesThe Company has a number of portfolio level financing arrangements. The Company is exposed to the risk that the cedents’ future profits or surpluses in the defined portfolios supporting these arrangements will be lower than expected. Ongoing monitoring of the performance of the underlying portfolios is conducted and appropriate liabilities established wherever necessary.
Additional information on methodology and assumptionsSimplifications used in calculation of best estimate or risk marginThere are no relevant simplifications.
Risk marginThe risk margin is calculated under a transfer value approach, assuming that the insurance or reinsurance obligations are transferred to a so-called reference undertaking, which is assumed to be empty prior to the transfer and then funded with assets to cover the technical provisions. Since the calculation is based on the cost of holding required capital, assumptions around the risk margin rely on the calculation of the SCR and are explained and justified in the internal model documentation.
Solvency II additionally requires the allocation of the risk margin to the lines of business or segments as defined by the Solvency II regulation. The allocation is required to adequately reflect the contribution of the lines of business to the SCR of the reference undertaking over the lifetime of the insurance or reinsurance obligations. In the internal model, the allocation is implemented by breaking up the future SCR to non-life and life and model currencies proportionately to the contribution to the Company’s SCR.
Uncertainty associated with the technical provisionsEstimating technical provisions involves predicting future cash flow payments (income and outflow) based on historical and existing information and knowledge, as well as judgement about future conditions. However, changes to economic (national or
EUR millions Gross best estimate Net best estimate Risk margin Total net technical provision
Life –874 –479 196 –283Health 1 057 209 24 233Total 183 –270 220 –50

26 Swiss Re Europe S.A. Solvency and Financial Condition Report
Section D: Valuation for solvency purposes
regional) performance, medical advances (different from expected), policyholder attitudes regarding insurance policies, the social or regulatory environment or the Company’s operation and its book of business mean that actual cash flows will most likely be different to the predicted cash flows.
Material differences between Solvency II and statutory technical provisionsMaterial differences by line of business between Solvency II and statutory net life technical provisions as at 31 December 2017 were as follows:
The actuarial methods and assumptions used for the valuation of the technical provisions for Solvency II purposes are similar to those used for the preparation of the Company’s statutory accounts. Nevertheless, there are significant differences between the two accounting standards. The difference of EUR -1 817 million comprises: Statutory margins of EUR –1 657 million (EUR -1 250 million for Life and EUR –407 million for Health) included in the
statutory reserves. Statutory reserving includes prudent margins whereas Solvency II technical provisions is the best estimate (excluding risk margin).
Remaining differences relate mainly to client balances and risk margin which are within Solvency II technical provisions and not in Statutory reserves.
Recoverables due from reinsurance contractsNet technical provisions takes account of the reinsurance recoverables based on the underlying contracts. The reinsurance ceded is predominantly proportional reinsurance. Therefore, the determination of the reinsurance recoverable is a pure calculative process and does not require estimations, actuarial methods, assumptions, or other judgemental elements. In the valuation of ceded reinsurance, the counterparty risk is considered.
Material changes in assumptions made During 2017, updates were made to the mortality, morbidity and lapse assumptions. These updates were to reflect the more recent experience across the portfolios.
Matching adjustment Not applicable to the Company.
Volatility adjustmentNot applicable to the Company.
Transitional measuresNot applicable to the Company.
Non-life business
Material technical provisions by Solvency II line of business The following table shows the value of non-life technical provisions, based on QRT S.17.01, by material line of business as at 31 December 2017:
Overview of methodology and assumptionsBest estimateThe estimation of the best estimate technical provisions is based on two steps: For all contract years, the nominal values of future payments related to premium, claims and commissions (including other
contractual costs) are being estimated. For all those nominal values, the timing of such future payments is being estimated.
EUR millions Solvency II Company Statutory Difference
Life –283 1 116 –1 399Health 233 651 –418Total –50 1 767 –1 817
EUR millionsGross best
estimateNet best estimate Risk margin
Total net technical provision
Motor vehicle liability proportional reinsurance 1 388 644 14 658Fire and other damage to property proportional reinsurance 666 326 12 338General liability proportional reinsurance 724 274 15 289Casualty non-proportional reinsurance 4 659 1 824 189 2 013Property non-proportional reinsurance 1 033 437 9 446Total of other not included in above 818 307 10 317Total 9 288 3 812 249 4 061

Swiss Re Europe S.A. Solvency and Financial Condition Report 27
Combining the payment patterns and nominal values provides the expected future cash flow streams. Applicable discount rates can be applied to these future cash flow streams for Solvency II reporting. Those estimates are elaborated by a dedicated team of reserving actuaries as follows: For most contracts, they use classical actuarial methods for analysing triangular information concerning the development of
past premiums, claims and commissions. For such analysis, the contracts are grouped into segments (large or structured contracts may be analysed on a standalone basis).
For new contracts, those estimates cannot be derived with the mentioned actuarial techniques. The values of new contracts are generally based on values estimated during the process of determining the price of each contract. Over time, as new experience emerges, those initial estimates are being revisited with the classical actuarial techniques.
The estimates are reviewed and approved by a reserving committee.
Main assumptionsEstimating technical provisions is not a purely calculative process. Sometimes assumptions must be made in respect of some parameters in the calculations. If the historical development observed in data captured in a triangle does not cover the full possible development, the length and amount of future development beyond the last observed point (the tail) must be quantified based on assumptions. Another area where important assumptions are needed in reserving is the judgement on whether the future will proceed as in the recent past or whether a different future development should be expected compared to the (recent) past observed in historical data.
Risk marginPlease refer to the paragraph “Additional information on methodology and assumptions“ on page 25 within the subsection “D2: Technical provisions - Life business” for the calculation of the risk margin.
Uncertainty associated with the technical provisionsEstimating technical provisions involves predicting future loss payments based on historical and existing information and knowledge, as well as judgment about future conditions. However, changes to historical patterns and trends, changes due to, among other factors, an evolving legal or social environment, claimants’ attitudes regarding insurance claims, changes in the national or regional economic performance, or changes in company operations and its book of business, make the incidence of claims more or less likely and claims settlement values lower or higher.
The technical provisions contain no provision for the extraordinary future emergence of new classes or types of losses not sufficiently represented in the Company’s historical database or that are not yet quantifiable. Contrary to the balance sheet used for Luxembourg statutory, the technical provisions used for Solvency II purposes contain best estimates of future losses not yet incurred at the date of valuation. Such losses can result, eg from large natural catastrophes. Actual future losses and loss adjustment expenses will not develop exactly as projected and may, in fact, vary significantly from the projections.
Material differences between Solvency II and statutory technical provisionsMaterial differences by line of business between Solvency II and statutory net non-life technical provisions as at 31 December 2017 were as follows:
The actuarial methods and assumptions used for the valuation of the technical provisions for Solvency II purposes are identical to those used for the preparation of the Company’s statutory accounts. Nevertheless, there are significant differences between the two accounting standards applicable to all lines of business: In the Company Statutory figures, future cash flows are not discounted, time value of money is not recognised, there is no
concept of risk margin and the counter-party risk is not included in the valuation. For Solvency II purposes, an estimate of the cash flows ultimately received for the contracts in scope is being recognised. For
Company Statutory, the contracts in scope are the same, but on assumed proportional reinsurance treaties, only the portion of the cash flows written by the cedent during the reporting period is being recognised.
In the Company Statutory figures, there is no provision for future losses, whereas the Solvency II technical provisions contain best estimates of future losses not yet incurred at date of valuation.
EUR millions Solvency II Company Statutory Difference
Motor vehicle liability proportional reinsurance 658 797 –139Fire and other damage to property proportional reinsurance 338 528 –190General liability proportional reinsurance 289 347 –58Casualty non-proportional reinsurance 2 013 2 118 –105Property non-proportional reinsurance 446 546 –100Total of other not included in above 317 429 –112Total 4 061 4 765 –704

28 Swiss Re Europe S.A. Solvency and Financial Condition Report
Section D: Valuation for solvency purposes
Recoverables due from reinsurance contractsNet technical provisions takes account of the reinsurance recoverables based on the underlying contracts. The reinsurance ceded is predominantly proportional reinsurance. Therefore, the determination of the reinsurance recoverable is a pure calculative process and does not require estimations, actuarial methods, assumptions, or other judgemental elements. In the valuation of ceded reinsurance, the counterparty risk is considered.
Material changes in assumptions made The data, methods, processes and systems used for reserving bodily injury claims implying future regular payments are being permanently adapted and reviewed. No new reserving approaches were introduced during 2017. During 2017, the official Ogden discount rate was reduced to –0.75% by the Lord Chancellor and a further review was announced. The reduction in the Ogden discount rate is expected to result in less periodical payment claims in the future.
Transitional measuresNot applicable to the Company.
D3: Other liabilities
Other material liabilitiesMaterial other liabilities by Solvency II valuation basis, as at 31 December 2017 were as follows (based on QRT Balance Sheet S.02.01.02):
Deposits from reinsurersDeposits received from reinsurers contain cash deposits withheld from retrocessionaires and are stated mostly at face value under both Solvency II and the Company Statutory valuation.
Deferred tax liabilitiesSolvency IIDeferred tax assets and liabilities are considered based on temporary differences between the Solvency II balance sheet and the local statutory balance sheet. The analysis is performed on the basis of the local branches of the Company and the corresponding jurisdictional tax regulations are taken into account. Deferred tax assets are calculated on all balance sheet differences which are recognised as being temporary and which will have a tax reversal impact in the foreseeable future. The valuation of the deferred tax assets can be supported by projections of the future taxable profits. The projections are based on prior-year experiences considering expectations about future business. The Company is presumed not to enter into runoff after a shock loss, and credit is only given for deferred tax assets utilised within a three-year timeframe. Adjustments are made for local restrictions on tax loss.
Company StatutoryDeferred income tax assets and liabilities are calculated based on the difference between financial statement carrying amounts and the corresponding income tax bases of assets and liabilities using enacted income tax rates and laws, which are not recognised in the Company’s annual accounts under Luxembourg Generally Accepted Accounting Principles. The amount of deferred tax liabilities are disclosed as part of the notes to the accounts.
Insurance and reinsurance payablesSolvency II & Company StatutoryUnder Company Statutory, this item corresponds to creditors arising out of reinsurance operations. The difference with Solvency II is mainly explained by the future cash flows included as payables under Company Statutory, but recognized as a part of technical provisions under Solvency II. All payables are classified as payables in less than five years.
Other liabilities not listed aboveOther liabilities under both Solvency II and Company Statutory include other creditors and tax provisions, with immaterial differences between the two valuations. In addition, Company Statutory also includes the statutory-specific items, such as deferred acquisition costs and provision for currency risks. Furthermore, in the Solvency II balance sheet, pension liabilities are presented net of the assets set aside to cover these obligations, consistent with IAS 19. For more details on pension assets and liabilities, refer to the paragraph “Employee benefits” on page 29.
EUR millions Solvency II Company Statutory Difference
Deposits from reinsurers 1 212 1 214 –2Deferred tax liabilities 648 - 648Insurance and reinsurance payables 643 2 257 –1 614Total of all other liabilities not listed above 403 1 259 –856Total other liabilities 2 906 4 730 –1 824

Swiss Re Europe S.A. Solvency and Financial Condition Report 29
Other classes of liabilitiesThe Company only applies liability classes as prescribed in the Solvency II balance sheet template.
Financial liabilitiesThe Company does not have financial liabilities as at 31 December 2017.
Lease liabilitiesThe Company had no material financial or operating lease liabilities as at 31 December 2017, other than various agreements for the lease of office space.
Deferred tax liabilitiesDeferred income tax liabilities of EUR 648 million (2016: EUR 1 024 million) have been recognised for all taxable temporary differences, which will result in higher future taxable income positions.
Deferred tax liabilities are measured at the tax rates that are expected to apply to the period when the liability is settled, based on tax rates and tax laws that have been enacted by the end of the reporting period.
Deferred tax liabilities to be settled after more than 12 months are EUR 648 million (2016: EUR 1 024 million).Deferred tax liabilities to be settled within 12 months are zero.
Tax rate changes during the year and their effect on deferred tax liabilityThe following branch tax rates changed in 2017 due to legislative changes:
Whilst both the United Kingdom and France reduced their tax rates to 17% from 2020, and 25% from 2022, no benefit was recognised for these future reductions in the calculations.
Closing proceduresDuring the closing process, changes in the applicable tax rates, in expectations on future taxable profits, in tax loss carry forward time limitations and in local tax regulations in the applicable tax regimes are reviewed, documented and considered for the calculation of deferred taxes under Solvency II.
For the details of deferred tax assets, please refer to the paragraph “Deferred tax assets” on page 24.
Contingent liabilitiesThe Company does not carry contingent liabilities on its Solvency II balance sheet as at 31 December 2017.
Employee benefitsNature of the obligationsPension liabilities, German branchThe Company has defined benefit pension plans for its employees, mainly in Germany. The Company has assets set aside to cover these obligations which are handled under a Contractual Tust Agreement and liability insurance contracts – refer to the paragraph “Plan assets” on page 30.
Other pension liabilities, German branchThe Company has a long-term obligation regarding a deferred compensation plan, which is a form of company pension in Germany, in which employees waive parts of their future remuneration in return for a commitment by the company to pay a pension of equal value, calculated in accordance with financial and actuarial principles.
Long-term vacation programme, German branch (short-term obligation)The Company has put in place a long-term vacation programme where there is a legal requirement in Germany to secure obligations resulting out of these programmes. The Company has assets set aside to cover these obligations which are handled under a Contractual Trust Agreement – refer to the paragraph “Plan assets” on page 30.
Branch
National tax rate %
2016
National tax rate %
2017
Non-current tax rate
beginning of year %
Non-current tax rate
end of year % Effect on deferred tax
Slovakia 22.00 21.00 22.00 21.00 negligible
* Non-current tax rate is applied on the temporary differences to calculate the deferred tax impacts

30 Swiss Re Europe S.A. Solvency and Financial Condition Report
Section D: Valuation for solvency purposes
Early retirement programme, Germany branch (long-term obligation)The Company has put in place an early retirement programme which is designed to create an incentive for German employees within a certain age group to smooth the transition from employment into retirement before the employees’ legal retirement age. There is a legal requirement to secure obligations resulting out of this programme. The Company has assets set aside to cover these obligations which are handled under a contractual trust agreement – refer to the paragraph “Plan assets” on page 30.
Other employee benefits, all branchesIn addition, the Company has other employee benefit programmes in place for which it has the obligation to set aside reserves to meet the future obligations. As at 31 December 2017, the following programmes were in place:
Other benefit programmesPlease refer to the paragraph “Remuneration policy and practices “ on page 11 for details of the other programmes.
Plan assetsThe Company has put in place asset concepts to secure pension liabilities, long-term vacation and early retirement programmes in Germany. Two types of concepts are currently in place, namely a contractual trust agreement and liability insurance contracts. In the Solvency II balance sheet, pension liabilities are presented net of the assets set aside to cover these obligations, consistent with IAS 19.
Pension liabilitiesThe following assets as at 31 December 2017 are held to secure the pension liabilities: EUR 247 million is held under a Contractual Trust Agreement. The assets are held in an investment fund in which units are
100% owned by the Company and invested mainly in corporate and government bonds. EUR 32 million is held in liability insurance contracts with Allianz Lebensversicherungs AG.
The values as at 31 December 2017 were as follows:
Other pension liabilitiesFor the deferred compensation, separate assets in insurance contracts were set up to cover the future liabilities. These insurance contracts show total assets of EUR 5 million as at 31 December 2017.
Other employee benefitsShort-term obligations
Long-term obligations
Other post employment
Termination benefits
Annual Performance Incentive XGlobal Share Participation Plan XVacation accrual XIncentive Share Plan XItaly – Trattamento di Fine Rapporto* XItaly – healthcare and life insurance for retired employees XLeadership Performance Plan XValue Alignment Incentive XGerman branch X
*Italy - Trattamento di Fine Rapporto -this is a leaving service benefit paid to employees who leave the Company for any reason at any time.
Assets EUR millions %
Corporate debt securities 31 11Government bonds 213 76Insurance contracts 32 12Other 4 1Total 280 100

Swiss Re Europe S.A. Solvency and Financial Condition Report 31
Long-term vacation and early retirement programmesEUR 16 million is used to cover long-term vacation obligations and EUR 14 million to cover early retirement obligations held under a Contractual Trust Agreement. The assets are held in an investment fund in which units are 100% owned by the Company and invested mainly in corporate and government bonds. As at 31 December 2017 the assets were invested as follows:
Deferred recognition of actuarial gains and lossesActuarial gains and losses are not deferred under Solvency II or for the Company Statutory accounts prepared under Luxembourg Generally Accepted Accounting Principles.
Methodologies and inputs used to determine the economic valuePension liabilitiesThe pension plan provisions are based on the relevant plan regulations. The associated pension provision obligations represent the present value of accrued benefits (projected benefit obligation) which is calculated based on the projected unit credit method at the valuation date and are maintained on the Company’s balance sheet. The following actuarial assumptions were used as of 31 December 2017: discount rate 1.7%, increase in salaries 2%, inflation rate 1.75%, pension increase rate 1.75%, expected return on plan assets 3%, fluctuation 3% p.a., average age of retirement in line with RVAGAnpG 2007 (German Act Adapting the Standard Retirement Age for the Statutory Pension Insurance System), mortality table based on “Richttafel 2005G”.
Other pension liabilitiesFor the deferred compensation plan, the obligations are calculated from the insurance company in line with financial and actuarial principles.
Long-term vacation programmeFor the long-term vacation obligations, the outstanding portions of the vacation and flexitime are transferred each year to a long-term vacation account and valued with the individual daily rates. The accumulated volumes earn interest.
Early retirement programmeProvisions for the early retirement programme are calculated in accordance with financial and actuarial principles.
Other employee benefitsOther employment benefits are determined according to business principles and are based on estimated needs.
Changes during the reporting periodNo changes were made to recognition and valuation bases or on estimations of other liabilities during 2017.
Assumptions and judgementsNo assumptions or judgments contribute materially to the valuation of other liabilities.
D4: Alternative methods of valuation
The Company uses alternative methods of valuation for the real estate and loans and mortgages, as a market value for those investments cannot be readily identified. The property assets are valued by an external appraiser using a discounted cash flows method. Similarly, the loans and mortgages are valued using a discounted cash flows method. The values thus determined are considered a reasonable approximation of the market value. The difference between Solvency II and statutory values of these assets is immaterial.
D5: Any other information
Other material informationThe Company has collateral arrangements with the ceding companies on accepted reinsurance business. For the purpose of the ceding companies’ calculation of their SCR under the standard formula, the Company informs its counterparties that the part of the Company’s assets subject to collateral arrangements, based on the Assets template S.06.02, is below 60%.
All other material information regarding the valuation of assets and liabilities for Solvency II purposes have been described in the sections above.
Assets EUR millions %
Corporate debt securities 26 87Government bonds 4 13Total 30 100
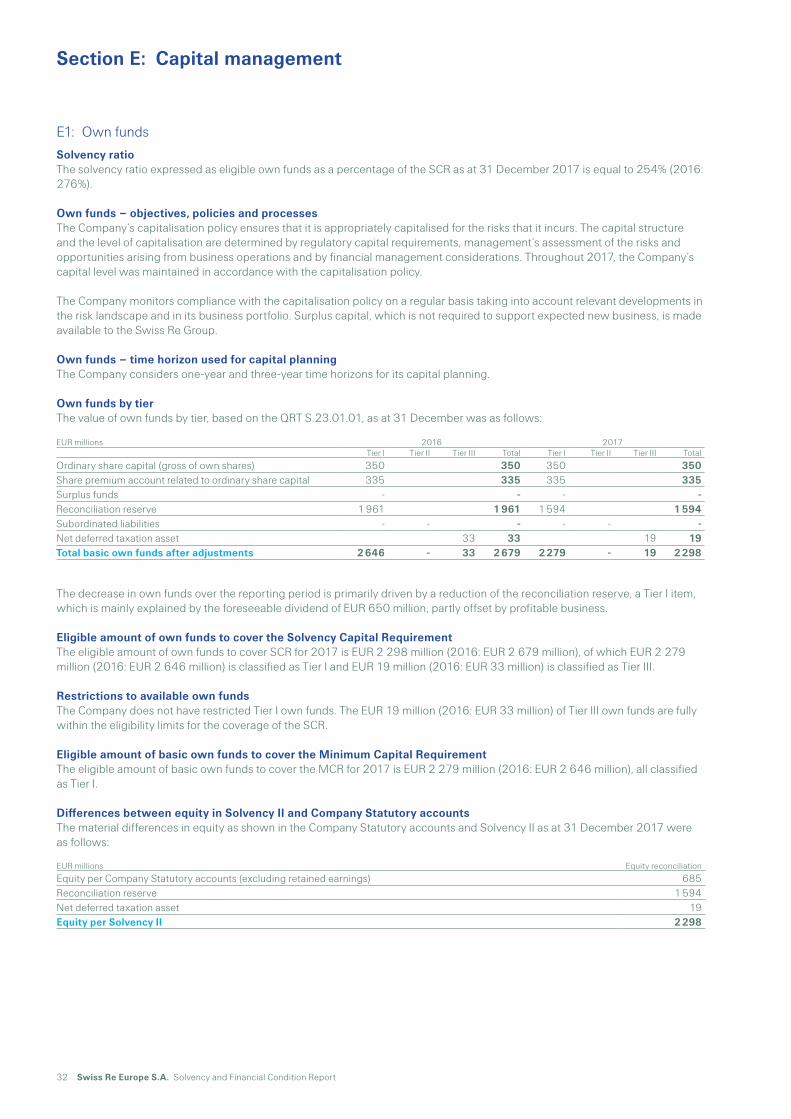
32 Swiss Re Europe S.A. Solvency and Financial Condition Report
Section E: Capital management
E1: Own funds
Solvency ratioThe solvency ratio expressed as eligible own funds as a percentage of the SCR as at 31 December 2017 is equal to 254% (2016: 276%).
Own funds – objectives, policies and processesThe Company’s capitalisation policy ensures that it is appropriately capitalised for the risks that it incurs. The capital structure and the level of capitalisation are determined by regulatory capital requirements, management’s assessment of the risks and opportunities arising from business operations and by financial management considerations. Throughout 2017, the Company’s capital level was maintained in accordance with the capitalisation policy.
The Company monitors compliance with the capitalisation policy on a regular basis taking into account relevant developments in the risk landscape and in its business portfolio. Surplus capital, which is not required to support expected new business, is made available to the Swiss Re Group.
Own funds – time horizon used for capital planningThe Company considers one-year and three-year time horizons for its capital planning.
Own funds by tierThe value of own funds by tier, based on the QRT S.23.01.01, as at 31 December was as follows:
The decrease in own funds over the reporting period is primarily driven by a reduction of the reconciliation reserve, a Tier I item, which is mainly explained by the foreseeable dividend of EUR 650 million, partly offset by profitable business.
Eligible amount of own funds to cover the Solvency Capital RequirementThe eligible amount of own funds to cover SCR for 2017 is EUR 2 298 million (2016: EUR 2 679 million), of which EUR 2 279 million (2016: EUR 2 646 million) is classified as Tier I and EUR 19 million (2016: EUR 33 million) is classified as Tier III.
Restrictions to available own fundsThe Company does not have restricted Tier I own funds. The EUR 19 million (2016: EUR 33 million) of Tier III own funds are fully within the eligibility limits for the coverage of the SCR.
Eligible amount of basic own funds to cover the Minimum Capital RequirementThe eligible amount of basic own funds to cover the MCR for 2017 is EUR 2 279 million (2016: EUR 2 646 million), all classified as Tier I.
Differences between equity in Solvency II and Company Statutory accountsThe material differences in equity as shown in the Company Statutory accounts and Solvency II as at 31 December 2017 were as follows:
EUR millions Equity reconciliation
Equity per Company Statutory accounts (excluding retained earnings) 685Reconciliation reserve 1 594Net deferred taxation asset 19Equity per Solvency II 2 298
EUR millions 2016 2017Tier I Tier II Tier III Total Tier I Tier II Tier III Total
Ordinary share capital (gross of own shares) 350 350 350 350Share premium account related to ordinary share capital 335 335 335 335Surplus funds - - - -Reconciliation reserve 1 961 1 961 1 594 1 594Subordinated liabilities - - - - - -Net deferred taxation asset 33 33 19 19Total basic own funds after adjustments 2 646 - 33 2 679 2 279 - 19 2 298

Swiss Re Europe S.A. Solvency and Financial Condition Report 33
Reconciliation reserveThe reconciliation reserve represents the differences in the valuation of assets, technical provisions or other liabilities in the adoption of the Solvency II valuation as well as retained earnings, including current year results and the legal reserve. It also includes a deduction for the foreseeable dividends.
Basic own funds subject to transitional arrangements No own funds items are subject to transitional arrangements.
Ancillary own fundsThere are no ancillary own funds in the Company.
Items deducted from own fundsThe foreseeable dividends of EUR 650 million (2016: EUR 1 000 million) have been deducted from own funds of the Company. This deduction is considered in the reconciliation reserve.
Subordinated capital instrument in issue at year-endThe Company does not have subordinated capital instruments as at 31 December 2017.
Capital instruments issued as debtsNot applicable to the Company.
Value of subordinated debtThe Company does not have subordinated capital instruments as at 31 December 2017.
Principal loss absorbency mechanismThe Company does not have a loss absorbency mechanism that qualifies as high quality own funds instruments.
Key elements of the reconciliation reserveThe reconciliation reserve based on QRT S.23.01.01 as at 31 December 2017 was as follows:
The reconciliation reserve includes an amount of the excess of assets over liabilities that corresponds to the EPIFP. Please refer to the paragraph “Amount of expected profit in future premiums” on page 21 for the details of the EPIFP.
The difference between the excess of assets over liabilities under Solvency II and the equity value shown in the Company Statutory accounts is mainly due to different valuations applied under Solvency II for assets, technical provisions and other liabilities.
Total excess of assets over liabilities within ring-fenced fundsThe Company does not have any ring-fenced funds.
EUR millions 2017
Excess of assets over liabilities 2 948Equity per the Company Statutory accounts (excluding retained earnings) –685Foreseeable dividends and distributions –650Net deferred taxation asset –19Reconciliation reserve 1 594

34 Swiss Re Europe S.A. Solvency and Financial Condition Report
Section E: Capital management
E2: Solvency Capital Requirement and Minimum Capital Requirement
Solvency Capital Requirement and Minimum Capital RequirementAs at 31 December 2017, the Company’s SCR was EUR 905 million (2016: EUR 972 million) and the MCR was EUR 407 million (2016: EUR 437 million).
Solvency Capital Requirement split by risk categoryThe Company uses an integrated internal model to measure its capital requirement using 99.5% value at risk as described in Section C. The table below quantifies the Company’s modelled risk categories* as at 31 December 2017, including a projection for the average exposure over the year as well as changes compared to the previous year.
Simplification calculationThe Company does not apply the standard formula.
Standard formula parametersThe Company does not apply the standard formula.
Non-disclosure of capital add-on during transitional period ending no later than 31 December 2020This is not applicable to the Company.
Standard formula capital add-on applied to Solvency Capital RequirementThe Company does not apply the standard formula.
Information on inputs used to calculate Minimum Capital Requirement Inputs used to calculate the MCR for non-life insurance or reinsurance obligations include premiums written during the last 12 months, split by line of business and best estimate technical provisions without a risk margin, split by line of business.
Input used to calculate the MCR for life insurance or reinsurance obligations includes best estimate technical provisions without a risk margin split by type of contract and capital at risk.
Material changes to Solvency Capital Requirement and Minimum Capital Requirement over the periodPlease refer to paragraph “Solvency Capital Requirement split by risk category” on page 34 for details of the current year and prior-year SCR. The changes are driven by the change in risk exposure as detailed in section “C: Risk Profile” on page 18.
The SCR decreased from EUR 972 million in 2016 to EUR 905 million in 2017, mainly driven by lower financial market risk following the payment of EUR 1 billion dividend in 2017.
The MCR is equal to 45% of the SCR (in 2017 as well as 2016). Thus, the MCR decreased in line with the SCR from EUR 437 million in 2016 to EUR 407 million in 2017.
E3: Duration-based equity risk
Indication that the Company is using duration-based equity risk submoduleNot applicable to the Company.
EUR millions 2016 2017
Property and casualty risk 2 351 2 357Life and health risk 1 161 1 093Financial market risk 690 603Credit risk 164 158Operational risk 145 112Diversification –1 836 –1 700Other impacts ** –1 563 –1 609Pre-tax Solvency Capital Requirement 1 112 1 014Deferred tax impact –140 –109SCR 972 905
* Risk categories before retrocession
** Other impacts: mainly driven by retrocession

Swiss Re Europe S.A. Solvency and Financial Condition Report 35
E4: Differences between the standard formula and the internal model
The Company uses its internal model, as approved by the CAA, for the purposes of calculating its capital requirements under Solvency II. This internal model aligns with the Swiss Re Group internal model. The structure of the internal modelThe internal model consists of the following building blocks: Risk factors: to model the stochastic change of the state of the world over the one-year time horizon Exposure model: to determine the change in basic own funds given a realisation of the risk factors Transaction model: to model the intra-group transactions in place as well as external retrocession Balance sheet model: to evaluate the impact of defaults of Group companies and follow-up effects
Generally speaking, risk factors are sources of risk external to the Company. Their stochastic evolution is modelled over one year, using approaches such as univariate or multivariate distributions, frequency-severity models, event set-based models and Merton-type threshold models. Dependencies between risk factors are modelled by copulas, causal dependencies and other approaches. In contrast to many models used, dependencies are taken into account at the level of the underlying risk factors and not at the level of major risk categories. This implies that dependencies are independent of the Company’s portfolio. The exposure model captures the impact of the risk factors on the economic profit and loss through the Company’s portfolio. In the exposure model, the Company’s business activities are decomposed into different exposures. The change in basic own funds of the entire portfolio resulted from aggregating the effect on the individual exposures. Each exposure is assigned attributes, such as line of business and treaty year, which enable drill-down analyses and an evaluation of the contribution to total risk.
Risk categories concerned and not concerned by internal modelRefer to subsection “C: Overview of risk exposure” for details of risk covered and not covered by the internal model.
Aggregation methodologies and diversification effectsAggregation in the standard formula is prescribed in a hierarchical bottom-up scheme, with explicit standardised, industry-wide diversification benefits between its components at each step of the aggregation. In the Company’s internal model, the diversification and interdependencies happen in the joint simulation of risk factors. Combining the realised outcomes of all the risk factors to which a specific portfolio selection is exposed yields an aggregate loss distribution. Such an aggregation takes place in a single step and contains implicit diversification between its risk module components.
Risk not covered in the standard formula but covered by the internal modelThe Company’s internal model covers the spread risk of EU government bonds, while this risk is excluded from the standard formula.
Various purposes for which the internal model is being usedThe purpose of the Company’s internal model is defined by four major areas for which the model is intended to be used: Capital adequacy assessment: is the capital base sufficient to support the risk in the book? Risk controlling and limit setting: how much risk capacity should be allocated to each risk category? Portfolio management: what measures can be taken to improve capital efficiency? Costing: what is the cost of capital to carry a specific risk?
Scope of internal model in terms of Business Units and risk categoriesThe scope of the internal model includes all material risks which impact the Solvency II balance sheet of the Company. Please refer to the subsection “C: Overview of risk exposure” on page 18 for details of the risk categories used.
Partial internal modelThe Company does not use a partial internal model.
Methods used in the internal model for the calculation of the probability distribution forecast and the Solvency Capital RequirementThe stochastic economic balance sheet is obtained by modelling the impact of joint scenarios of risk factor realisations on the economic balance sheet. For this purpose, a model design principle is to separate the modelling of joint risk factor realisations from their impact on the balance sheet positions (exposures). In the Company’s internal model, the risk which arises from a balance sheet position is defined as the unexpected change of the economic value of this balance sheet position over a one-year time horizon. A large number of Monte Carlo simulations yield a sufficiently accurate and stable empirical joint distribution of balance sheet changes; the SCR of a risk is calculated as the 99.5 percentile of the corresponding empirical distribution.

36 Swiss Re Europe S.A. Solvency and Financial Condition Report
Section E: Capital management
Risk measures and time period used in the internal modelThe internal model calculates the probability distribution of the change in basic own funds over one year. In particular, it enables the value at risk of this change to be calculated at the 99.5% quantile level.
Nature and appropriateness of the data used in the internal modelData used in the internal model is provided by different functions and comes in a variety of different formats. This input data is validated at several stages and transferred via the Risk Management Application Platform into the well-defined format of the Risk Management Data Warehouse. The Data Dictionary defines the precise structure and content of each data item that is submitted to the Risk Management Data Warehouse via the Risk Management Application Platform. Validation of the data is the responsibility of the respective data provider at each stage of the process. The process to ensure data quality is governed by the Risk Model Data Quality Standards. Validation of data quality is carried out in five steps: within the responsibility of the respective data provider at collection of data or while downloading it from a source system structural and syntactical validation at the moment a data provider uploads any data delivery to the Risk Management
Application Platform asynchronous validation of data consistency between interdependent deliveries, particularly with regard to reference data; validation of data completeness at the beginning of each internal model calculation validation of calculation results and changes over time by the data provider supported by the Risk Management team
(plausibility checks)
E5: Non-compliance with the Minimum Capital Requirement and non-compliance with the Solvency Capital Requirement
Any non-compliance with the Solvency Capital Requirement and Minimum Capital RequirementThe Company complied with the SCR and MCR during 2017.
E6: Any other information
Other material information All material information regarding the capital management has been described in the sections above.

Swiss Re Europe S.A. Solvency and Financial Condition Report 37
Glossary
Acquisition costs That portion of an insurance premium which represents the cost of obtaining the insurance business: it includes the intermediaries’ commission, the company’s sales expense and other related expenses.
Affiliated undertakings Affiliated undertakings are undertakings over which the Company exercises a direct or indirect dominant influence.
API Annual Performance Incentive
Board The Board of Directors of the Company
CAA Commissariat aux Assurances, Luxembourg
Capacity Maximum amount of risk that can be accepted in insurance. Capacity also refers to the amount of insurance coverage allocated to a particular policyholder or in the marketplace in general.
Casualty insurance Branch of insurance – mainly comprising accident and liability business – which is separate from property, engineering and life insurance.
Claim Demand by an insured for indemnity under an insurance contract.
Company Swiss Re Europe S.A.
Cover Insurance and reinsurance protection of one or more specific risk exposures based on a contractual agreement.
Credit insurance Insurance against financial losses sustained through the failure, for commercial reasons, of policyholders’ clients to pay for goods or services supplied to them.
Credit spreads Applies to derivative products. Difference in the value of two options, when the value of the one sold exceeds the value of the one bought.
Economic net worth Market-consistent value of assets less the market-consistent value of liabilities.
Economic Value Management Swiss Re’s integrated economic valuation framework for planning, pricing, reserving and steering the business. It also provides the basis for determining available capital under the Swiss Solvency Test and for Solvency II.
EIOPA European Insurance and Occupational Pensions Authority
EMEA Europe, Middle East and Africa
EPIFP Expected profit in future premiums
GIA Group Internal Audit
Group risk model The internal model developed by the Swiss Re Group and in place since 1994, used for articulating risk tolerance, assessing performance and setting targets. The internal model forms an integral part of steering reality at Swiss Re. As part of Solvency II, the implementation of “Solvency II-specific features” (eg. illiquidity premium, ultimate forward rate, treatment of deferred taxes) has been carried out. For the purpose of this report, any reference to the Group Risk Model refers to the model including the Solvency II-specific modifications.
GSPP Global Share Participation Plan
Health insurance Generic term applying to all types of insurance indemnifying or reimbursing for losses caused by bodily injury or sickness or for expenses of medical treatment necessitated by sickness or accidental bodily injury.
IBNR Incurred but not reported - Provision for claims incurred but not reported by the balance sheet date. In other words, it is anticipated that an event will affect a number of policies, although no claims have been made so far, and is therefore likely to result in liability for the insurer.
IFRS International Financial Reporting Standards
Intra-group retrocession Retrocession between subsidiaries of the same parent company or between a subsidiary and its parent. Intra-group retrocession aims to optimize capital allocation and tax efficiency for the Swiss Re Group as well as ensure adherence to regulatory solvency requirements.
Intra-group transaction This can be either in the form of a proportional (eg quota-share) or non-proportional (eg stop-loss or Cat XL) agreement.
ISP Incentive Share Plan
Key functions Risk Management, Compliance, Internal Audit and Actuarial.
Key Function Holder The Board nominates individuals as designated representatives of the respective key functions towards the Company.

38 Swiss Re Europe S.A. Solvency and Financial Condition Report
Glossary
L&H Life and Health re/insurance
Liability insurance Insurance for damages that a policyholder is obliged to pay because of bodily injury or property damage caused to another person or entity based on negligence, strict liability or contractual liability.
Life insurance Insurance that provides for the payment of a sum of money upon the death of the insured, or upon the insured surviving a given number of years, depending on the terms of the policy. In addition, life insurance can be used as a means of investment or saving.
Longevity risk The risk to which a pension fund or life insurance company could be exposed as a result of higher-than-expected payout ratios. Increasing life expectancy trends among policyholders and pensioners can result in payout levels that are higher than originally accounted for.
LPP Leadership Performance Plan
Luxembourg Companies The Company, Swiss Re International SE and Swiss Re Europe Holdings S.A.
Minimum Capital Requirement, MCR
If, despite supervisory intervention, the available resources of the insurer fall below the Minimum Capital Requirement, then “ultimate supervisory action” will be triggered. In other words, the insurer’s liabilities will be transferred to another insurer and the license of the insurer will be withdrawn or the insurer will be closed to new business and its in-force business will be liquidated.
Non-life insurance All classes of insurance business excluding life insurance.
Non-proportional reinsurance
Form of reinsurance in which coverage is not in direct proportion to the original insurer’s loss. Instead, the reinsurer is liable for a specified amount which exceeds the insurer’s retention; also known as “excess of loss reinsurance”.
Operational risk Risk arising from failure of operational processes, internal procedures and controls leading to financial loss.
ORSA Own Risk and Solvency Assessment
Own Funds Excess of assets over liabilities, including any amount that is deemed suitable to provide support for the Solvency Capital Requirement.
P&C Property and Casualty re/insurance
Participating interests Participating interests are rights contained in the capital of other undertakings which, when creating a durable link with those undertakings, are intended to contribute to the Company’s activities.
Premium The payment, or one of the periodical payments, a policyholder agrees to make for an insurance policy.
Premiums earned Premiums an insurance company has recorded as revenues during a specific accounting period.
Premiums written Premiums for all policies sold during a specific accounting period.
Property insurance Collective term for fire and business interruption insurance as well as burglary, fidelity guarantee and allied lines.
Proportional reinsurance Form of reinsurance arrangement in which the premiums earned and the claims incurred of the cedent are shared proportionally by the cedent and the reinsurer.
PSU Performance Share Unit
QRT Quantitative Reporting Template
Reinsurance Insurance which lowers the risk carried by primary insurance companies. Reinsurance includes various forms such as facultative, financial, non-proportional, proportional, quota share, surplus and treaty reinsurance.
Reserves Amount required to be carried as a liability in the financial statements of an insurer or reinsurer to provide for future commitments under outstanding policies and contracts.
Retention Amount of risk which the policyholder or insurer does not insure or reinsure but keeps for its own account.
Retrocession Amount of the risk accepted by the reinsurer which is then passed on to other reinsurance companies.
Risk Condition in which there is a possibility of injury or loss; also used by insurance practitioners to indicate the property insured or the peril insured against.

Swiss Re Europe S.A. Solvency and Financial Condition Report 39
Return on equity, ROE Net income as a percentage of time-weighted shareholders’ equity.
Risk appetite An expression of how the Company aims to deploy its risk capacity. It specifies the types of risk that the Company wishes to take and for each type the amount to be taken, while remaining within the boundaries imposed by the Company’s stated risk.
Risk management Management tool for the comprehensive identification and assessment of risks based on knowledge and experience in the fields of natural sciences, technology, economics and statistics.
Risk profile Threats to which an organisation is exposed. The risk profile will outline the type of risks and potential effect of the risks. This outline allows a business to anticipate additional costs or disruptions to operations.
Risk tolerance An expression of the extent to which the Board has authorised executive management to assume risk. It represents the amount of risk that the Company is willing to accept within the constraints imposed by its capital resources, its strategy, its risk appetite, and the regulatory and rating agency environment within which it operates.
RSU Restricted Share Unit
Securitisation Financial transactions in which future cash flows from assets (or insurable risks) are pooled, converted into tradable securities and transferred to capital market investors. The assets are commonly sold to a special-purpose entity, which purchases them with cash raised through the issuance of beneficial interests (usually debt instruments) to third-party investors.
SFCR Solvency and Financial Condition Report
Solvency Capital Requirement, SCR
Solvency Capital Requirement under Solvency II – calculated using the internal model. The Solvency Capital Requirement is based on a value at risk measure calibrated to a 99.5% confidence level over a 1-year time horizon.
Stop-loss reinsurance Form of reinsurance that protects the ceding insurer against an aggregate amount of claims over a period, in excess of either a stated amount or a specified percentage of estimated benefit costs.
Swiss Re or Swiss Re Group or Group
For the purposes of this report, the ultimate parent company and all its subsidiaries are referred to as Swiss Re or the Swiss Re Group or the Group.
Swiss Re Zurich, SRZ Swiss Reinsurance Company Ltd
Swiss Solvency Test Switzerland already introduced an economic and risk-based insurance regulation similar to the objectives of the Solvency II project in the EU. Since 2008, all insurance and reinsurance companies writing business in Switzerland have had to implement the Swiss Solvency Test, and since 1 January 2011, the Swiss Solvency Test-based target capital requirement has been in force and companies must achieve economic solvency.
TAPI, Target API Target Annual Performance Incentive
Target capital Defined by the Company’s Capitalisation Policy.
Technical result Underwriting defined as nominal premiums less nominal commissions and claims.
TSR Total Shareholder Return
Underwriting performance Premiums earned less the sum of claims paid, change in the provision for unpaid claims and claim adjustment expenses and expenses (acquisition costs and other operating costs and expenses).
US GAAP United States Generally Accepted Accounting Principles are the accounting rules, as issued by the Financial Accounting Standards Board, its predecessors and other bodies, used to prepare financial statements for publicly traded companies in the United States.
VAI Value Alignment Incentive
Value at risk Maximum possible loss in market value of an asset portfolio within a given time span and at a given confidence level. 99% value at risk measures the level of loss likely to be exceeded in only one year out of a hundred, while 99.5% value at risk measures the loss likely to be exceeded in only one year out of two hundred. 99% tail value at risk estimates the average annual loss likely to occur with a frequency of less than once in one hundred years.

40 Swiss Re Europe S.A. Solvency and Financial Condition Report


Swiss Re Europe S.A. 2A, rue Albert Borschette L-1246 Luxembourg Grand-Duchy of LuxembourgR.C.S. Luxembourg B25 242
Telephone +352 26 12 16 30 Fax +352 26 12 33 04 www.swissre.com
© 2018 Swiss Re Europe S.A. All rights reserved.

Appendix SFCR Public Disclosure Templates
Swiss Re Europe S.A.

Report: S.02.01.02
Reporting entity: Swiss Re Europe SA
Reference Date: 31.12.2017
Reporting currency: EUR thousand
Balance sheet
Solvency II value
Assets C0010
Goodwill R0010
Deferred acquisition costs R0020
Intangible assets R0030
Deferred tax assets R0040 341'307
Pension benefit surplus R0050 -
Property, plant & equipment held for own use R0060 9'388
Investments (other than assets held for index-linked and unit-linked contracts) R0070 6'422'748
Property (other than for own use) R0080 172'519
Holdings in related undertakings, including participations R0090 830'547
Equities R0100 267'082
Equities - listed R0110 265'094
Equities - unlisted R0120 1'987
Bonds R0130 3'468'631
Government Bonds R0140 1'393'906
Corporate Bonds R0150 1'969'112
Structured notes R0160
Collateralised securities R0170 105'613
Collective Investments Undertakings R0180 1'623'721
Derivatives R0190 9'996
Deposits other than cash equivalents R0200 -
Other investments R0210 50'252
Assets held for index-linked and unit-linked contracts R0220 500'888
Loans and mortgages R0230 490'226
Loans on policies R0240
Loans and mortgages to individuals R0250 1'996
Other loans and mortgages R0260 488'230
Reinsurance recoverables from: R0270 5'929'437
Non-life and health similar to non-life R0280 5'475'726
Non-life excluding health R0290 5'412'559
Health similar to non-life R0300 63'167
Life and health similar to life, excluding health and index-linked and unit-linked R0310 453'710
Health similar to life R0320 847'798
Life excluding health and index-linked and unit-linked R0330 -394'088
Life index-linked and unit-linked R0340
Deposits to cedants R0350 1'482'238
Insurance and intermediaries receivables R0360 68'159
Reinsurance receivables R0370 398'946
Receivables (trade, not insurance) R0380 87'258
Own shares (held directly) R0390
Amounts due in respect of own fund items or initial fund called up but not yet paid in R0400
Cash and cash equivalents R0410 58'389
Any other assets, not elsewhere shown R0420 5'764
Total assets R0500 15'794'747

Report: S.02.01.02
Reporting entity: Swiss Re Europe SA
Reference Date: 31.12.2017
Reporting currency: EUR thousand
Balance sheet
Solvency II value
Liabilities C0010
Technical provisions – non-life R0510 9'536'773
Technical provisions – non-life (excluding health) R0520 9'430'724
Technical provisions calculated as a whole R0530
Best Estimate R0540 9'183'922
Risk margin R0550 246'802
Technical provisions - health (similar to non-life) R0560 106'048
Technical provisions calculated as a whole R0570
Best Estimate R0580 104'225
Risk margin R0590 1'823
Technical provisions - life (excluding index-linked and unit-linked) R0600 -145'191
Technical provisions - health (similar to life) R0610 1'081'090
Technical provisions calculated as a whole R0620
Best Estimate R0630 1'057'072
Risk margin R0640 24'018
Technical provisions – life (excluding health and index-linked and unit-linked) R0650 -1'226'281
Technical provisions calculated as a whole R0660
Best Estimate R0670 -1'421'345
Risk margin R0680 195'064
Technical provisions – index-linked and unit-linked R0690 548'992
Technical provisions calculated as a whole R0700
Best Estimate R0710 547'694
Risk margin R0720 1'298
Other technical provisions R0730
Contingent liabilities R0740
Provisions other than technical provisions R0750 59'938
Pension benefit obligations R0760 82'779
Deposits from reinsurers R0770 1'211'761
Deferred tax liabilities R0780 648'263
Derivatives R0790 891
Debts owed to credit institutions R0800
Financial liabilities other than debts owed to credit institutions R0810
Insurance & intermediaries payables R0820 117'081
Reinsurance payables R0830 526'136
Payables (trade, not insurance) R0840 203'802
Subordinated liabilities R0850
Subordinated liabilities not in Basic Own Funds R0860
Subordinated liabilities in Basic Own Funds R0870
Any other liabilities, not elsewhere shown R0880 55'365
Total liabilities R0900 12'846'590
Excess of assets over liabilities R1000 2'948'157

Report: S.05.01.02
Reporting entity: Swiss Re Europe SA
Reference Date: 31.12.2017
Reporting currency: EUR thousand
C0010 C0020 C0030 C0040 C0050 C0060 C0070 C0080 C0090 C0100 C0110 C0120 C0130 C0140 C0150 C0160 C0200
Premiums written
Gross - Direct Business R0110
Gross - Proportional reinsurance accepted R0120 21'175 11 768 1'327'167 87'857 98'035 699'784 243'676 29'792 6'498 5'285 2'520'048
Gross - Non-proportional reinsurance accepted R0130 10'705 377'688 166'519 689'216 1'244'128
Reinsurers' share R0140 14'786 6 498 846'631 52'352 72'024 377'064 151'623 16'978 2'304 0 7'820 261'984 117'775 410'245 2'332'090
Net R0200 6'389 6 270 480'535 35'506 26'011 322'720 92'054 12'814 4'194 5'285 2'885 115'704 48'744 278'971 1'432'086
Premiums earned
Gross - Direct Business R0210
Gross - Proportional reinsurance accepted R0220 23'041 11 905 1'262'481 87'991 98'656 686'509 224'797 26'759 6'833 5'285 2'423'267
Gross - Non-proportional reinsurance accepted R0230 10'875 369'949 179'436 677'432 1'237'691
Reinsurers' share R0240 16'244 6 606 829'762 52'459 72'325 393'019 134'386 16'718 3'962 0 7'937 258'102 126'649 419'772 2'331'945
Net R0300 6'797 6 300 432'719 35'532 26'332 293'490 90'410 10'042 2'871 5'285 2'937 111'847 52'787 257'659 1'329'013
Claims incurred
Gross - Direct Business R0310
Gross - Proportional reinsurance accepted R0320 10'091 -450 -4'319 927'580 60'597 25'531 506'660 90'052 17'180 1'759 3'814 1'638'495
Gross - Non-proportional reinsurance accepted R0330 6'806 393'989 165'747 396'749 963'291
Reinsurers' share R0340 6'822 -226 -2'550 605'216 37'671 16'795 232'730 60'596 11'417 1'059 -32 5'124 298'320 103'833 228'567 1'605'343
Net R0400 3'268 -224 -1'769 322'364 22'926 8'736 273'930 29'456 5'763 700 3'846 1'682 95'669 61'914 168'182 996'442
Changes in other technical provisions
Gross - Direct Business R0410
Gross - Proportional reinsurance accepted R0420 -139 172 22'880 -239 2'084 5'223 -1'588 -62 - 28'331
Gross - Non-proportional reinsurance accepted R0430 15'646 27 -60'601 -44'927
Reinsurers' share R0440 -174 86 3'663 -158 1'760 53 -1'250 -33 -0 -1'906 19 -59'465 -57'406
Net R0500 35 86 19'217 -81 324 5'170 -338 -29 0 17'552 8 -1'135 40'810
Expenses incurred R0550 2'949 -2 867 136'634 10'569 6'027 91'498 41'410 5'046 1'190 1'565 81 3'879 5'763 41'496 348'972
Other expenses R1200 2'010
Total expenses R1300 350'983
TotalGeneral liability
insurance
Credit and
suretyship
insurance
Legal expenses
insuranceAssistance
Miscellaneous
financial lossHealth
Premiums, claims and expenses by line of business
Line of Business for: non-life insurance and reinsurance obligations (direct business and accepted proportional reinsurance) Line of business for: accepted non-proportional reinsurance
Medical expense
insurance
Income
protection
insurance
Workers'
compensation
insurance
Motor vehicle
liability insurance
Other motor
insurance
Marine, aviation
and transport
insurance
Fire and other
damage to
property
insurance
CasualtyMarine, aviation,
transportProperty

Report: S.05.01.02
Reporting entity: Swiss Re Europe SA
Reference Date: 31.12.2017
Reporting currency: EUR thousand
Health insuranceInsurance with profit
participation
Index-linked and unit-
linked insuranceOther life insurance
Annuities stemming
from non-life insurance
contracts and relating
to health insurance
obligations
Annuities stemming
from non-life insurance
contracts and relating
to insurance
obligations other than
health insurance
obligations
Health reinsurance Life reinsurance Total
C0210 C0220 C0230 C0240 C0250 C0260 C0270 C0280 C0300
Premiums written
Gross R1410 974'016 2'057'530 3'031'546
Reinsurers' share R1420 664'509 1'329'825 1'994'334
Net R1500 309'507 727'706 1'037'212
Premiums earned
Gross R1510 974'016 2'057'530 3'031'546
Reinsurers' share R1520 664'509 1'329'825 1'994'334
Net R1600 309'507 727'706 1'037'212
Claims incurred
Gross R1610 783'152 1'419'089 2'202'241
Reinsurers' share R1620 542'883 886'889 1'429'773
Net R1700 240'269 532'199 772'469
Changes in other technical provisions
Gross R1710 76'925 -89'936 -13'011
Reinsurers' share R1720 45'042 -67'596 -22'555
Net R1800 31'883 -22'340 9'543
Expenses incurred R1900 55'685 169'048 224'732
Other expenses R2500 236
Total expenses R2600 224'968
Premiums, claims and expenses by line of business
Line of Business for: life insurance obligations Life reinsurance obligations

Report: S.05.02.01
Reporting entity: Swiss Re Europe SA
Reference Date: 31.12.2017
Reporting currency: EUR thousand
Premiums, claims and expenses by country
Home CountryTotal Top 5 and home
country
R1400 (GB) United Kingdom (ES) Spain (IE) Ireland (DE) Germany (CA) Canada
C0220 C0280 C0230 C0230 C0230 C0230 C0230
Premiums written
Gross R1410 3'766 2'718'818 1'809'885 342'810 223'298 190'426 148'633
Reinsurers' share R1420 2'580 1'774'763 1'244'332 239'965 154'303 133'566 16
Net R1500 1'186 944'055 565'553 102'845 68'995 56'859 148'616
Premiums earned
Gross R1510 3'766 2'718'818 1'809'885 342'810 223'298 190'426 148'633
Reinsurers' share R1520 2'580 1'774'763 1'244'332 239'965 154'303 133'566 16
Net R1600 1'186 944'055 565'553 102'845 68'995 56'859 148'616
Claims incurred
Gross R1610 265 1'985'868 1'553'014 1'469 149'564 204'689 76'867
Reinsurers' share R1620 187 1'277'567 1'027'578 1'029 104'086 144'687 -
Net R1700 78 708'301 525'436 440 45'479 60'002 76'867
Changes in other technical provisions
Gross R1710 -8'831 132'121 139'005 96'001 -28'015 -69'050 3'011
Reinsurers' share R1720 -8'493 69'751 26'196 66'805 49'037 -63'811 18
Net R1800 -338 62'370 112'809 29'196 -77'051 -5'239 2'993
Expenses incurred R1900 254 213'216 60'374 99'107 5'701 14'433 33'347
Other expenses R2500 236
Total expenses R2600 213'452
Top 5 countries (by amount of gross premiums written) - life obligations

Report: S.05.02.01
Reporting entity: Swiss Re Europe SA
Reference Date: 31.12.2017
Reporting currency: EUR thousand
Premiums, claims and expenses by country
Home CountryTotal Top 5 and home
country
R0010 (GB) United Kingdom (DE) Germany (FR) France (CA) Canada (ES) Spain
C0080 C0140 C0090 C0090 C0090 C0090 C0090
Premiums written
Gross - Direct Business R0110
Gross - Proportional reinsurance accepted R0120 -37 1'909'622 907'468 465'502 225'061 136'375 175'252
Gross - Non-proportional reinsurance accepted R0130 1'759 1'019'181 345'597 241'389 215'900 160'764 53'772
Reinsurers' share R0140 753 1'841'965 795'230 515'440 320'290 32'491 177'761
Net R0200 969 1'086'837 457'836 191'451 120'672 264'647 51'263
Premiums earned
Gross - Direct Business R0210
Gross - Proportional reinsurance accepted R0220 -1 1'812'171 872'637 468'501 202'645 91'690 176'699
Gross - Non-proportional reinsurance accepted R0230 1'759 1'014'994 359'976 241'163 220'979 134'551 56'566
Reinsurers' share R0240 1'286 1'840'137 867'772 452'367 300'875 32'488 185'349
Net R0300 471 987'029 364'842 257'297 122'749 193'754 47'916
Claims incurred
Gross - Direct Business R0310
Gross - Proportional reinsurance accepted R0320 -145 1'277'704 599'480 278'572 111'813 149'954 138'030
Gross - Non-proportional reinsurance accepted R0330 1'682 767'449 391'451 105'360 33'079 122'386 113'490
Reinsurers' share R0340 112 1'281'625 692'204 251'662 116'129 35'362 186'156
Net R0400 1'425 763'527 298'727 132'270 28'762 236'977 65'365
Changes in other technical provisions
Gross - Direct Business R0410
Gross - Proportional reinsurance accepted R0420 26'508 22'304 -130 1'593 1'544 1'197
Gross - Non-proportional reinsurance accepted R0430 -51'743 -1'588 -49'869 -293 6
Reinsurers' share R0440 -61'672 1'905 -64'554 400 - 577
Net R0500 36'436 18'811 14'555 900 1'550 620
Expenses incurred R0550 183 207'797 91'095 23'802 21'433 56'754 14'532
Other expenses R1200 2'010
Total expenses R1300 209'808
Top 5 countries (by amount of gross premiums written) - non-life obligations

Report: S.12.01.02
Reporting entity: Swiss Re Europe SA
Reference Date: 31.12.2017
Reporting currency: EUR thousand
Life and Health SLT Technical Provisions
Insurance
with profit
participation
Contracts
without
options and
guarantees
Contracts
with options
or
guarantees
Contracts
without
options and
guarantees
Contracts
with options
or
guarantees
Annuities
stemming
from non-life
insurance
contracts
and relating
to insurance
obligation
other than
health
insurance
obligations
Accepted
reinsurance
Total (Life
other than
health
insurance,
incl. Unit-
Linked)
Contracts
without
options and
guarantees
Contracts
with options
or
guarantees
Annuities
stemming
from non-life
insurance
contracts
and relating
to health
insurance
obligations
Health
reinsurance
(reinsurance
accepted)
Total
(Health
similar to
life
insurance)
C0020 C0030 C0040 C0050 C0060 C0070 C0080 C0090 C0100 C0150 C0160 C0170 C0180 C0190 C0200 C0210
Technical provisions calculated as a whole R0010
Total Recoverables from reinsurance/SPV and Finite Re after the adjustment for expected
losses due to counterparty default associated to TP calculated as a wholeR0020
Technical provisions calculated as a sum of BE and RM
Best Estimate
Gross Best Estimate R0030 -873'650 -873'650 1'057'072 1'057'072
Total Recoverables from reinsurance/SPV and Finite Re after the adjustment for expected losses
due to counterparty defaultR0080 -394'088 -394'088 847'798 847'798
Best estimate minus recoverables from reinsurance/SPV and Finite Re - total R0090 -479'562 -479'562 209'274 209'274
Risk Margin R0100 196'362 196'362 24'018 24'018
Amount of the transitional on Technical Provisions
Technical Provisions calculated as a whole R0110
Best estimate R0120
Risk margin R0130
Technical provisions - total R0200 -677'288 -677'288 1'081'090 1'081'090
Index-linked and unit-linked insurance Other life insurance Health insurance (direct business)

Report: S.17.01.02
Reporting entity: Swiss Re Europe SA
Reference Date: 31.12.2017
Reporting currency: EUR thousand
Medical
expense
insurance
Income
protection
insurance
Workers'
compensation
insurance
Motor vehicle
liability
insurance
Other motor
insurance
Marine,
aviation and
transport
insurance
Fire and other
damage to
property
insurance
General
liability
insurance
Credit and
suretyship
insurance
Legal
expenses
insurance
AssistanceMiscellaneous
financial loss
Non-
proportional
health
reinsurance
Non-
proportional
casualty
reinsurance
Non-
proportional
marine, aviation
and transport
reinsurance
Non-
proportional
property
reinsurance
C0020 C0030 C0040 C0050 C0060 C0070 C0080 C0090 C0100 C0110 C0120 C0130 C0140 C0150 C0160 C0170 C0180
Technical provisions calculated as a whole R0010
Total Recoverables from reinsurance/SPV and Finite Re after the adjustment for
expected losses due to counterparty default associated to TP calculated as a wholeR0050
Technical provisions calculated as a sum of BE and RM
Best estimate
Premium provisions
Gross R0060 1'822 -34 88'707 4'900 -5'681 -6'664 15'532 1'499 -1'451 - -28 10'705 1'282 -28'755 81'833
Total recoverable from reinsurance/SPV and Finite Re after the adjustment for
expected losses due to counterparty defaultR0140 -849 16 25'984 18 64 -10'135 -4'736 1'840 -823 -18 8'923 2'794 -13'453 9'624
Net Best Estimate of Premium Provisions R0150 2'671 -50 62'723 4'882 -5'745 3'471 20'267 -341 -628 - -10 1'781 -1'511 -15'301 72'208
Claims provisions
Gross R0160 32'175 2'442 17'830 1'299'073 34'155 171'549 673'101 708'221 103'577 5'751 5'999 50'020 4'648'190 392'682 1'061'552 9'206'314
Total recoverable from reinsurance/SPV and Finite Re after the adjustment for
expected losses due to counterparty defaultR0240 22'175 1'192 10'634 717'503 24'838 108'888 350'408 454'343 40'102 3'958 102 30'018 2'826'398 266'508 609'035 5'466'102
Net Best Estimate of Claims Provisions R0250 10'000 1'250 7'195 581'570 9'317 62'660 322'692 253'878 63'474 1'793 5'897 20'002 1'821'792 126'174 452'517 3'740'212
Total Best estimate - gross R0260 33'997 2'442 17'795 1'387'780 39'055 165'867 666'437 723'752 105'076 4'300 5'999 49'991 4'658'895 393'964 1'032'797 9'288'147
Total Best estimate - net R0270 12'671 1'250 7'145 644'293 14'199 56'915 326'164 274'145 63'133 1'165 5'897 19'992 1'823'574 124'662 437'216 3'812'421
Risk margin R0280 314 4 364 14'003 365 1'121 11'831 14'704 2'773 351 118 1'141 189'345 2'976 9'216 248'625
Amount of the transitional on Technical Provisions
Technical Provisions calculated as a whole R0290
Best estimate R0300
Risk margin R0310
Technical provisions - total
Technical provisions - total R0320 34'311 2'446 18'159 1'401'782 39'420 166'988 678'268 738'456 107'849 4'651 6'117 51'132 4'848'239 396'940 1'042'014 9'536'772
Recoverable from reinsurance contract/SPV and Finite Re after the adjustment for
expected losses due to counterparty default - totalR0330 21'326 1'192 10'650 743'487 24'856 108'953 340'273 449'607 41'943 3'135 102 29'999 2'835'321 269'301 595'582 5'475'726
Technical provisions minus recoverables from reinsurance/SPV and Finite Re -
totalR0340 12'985 1'254 7'509 658'296 14'564 58'036 337'995 288'849 65'906 1'516 6'015 21'133 2'012'918 127'639 446'432 4'061'046
Non-life Technical Provisions
Direct business and accepted proportional reinsurance Accepted non-proportional reinsurance
Total Non-Life
obligation

Report: S.19.01.21
Reporting entity: Swiss Re Europe SA
Reference Date: 31.12.2017
Reporting currency: EUR thousand
Z0020(2) Underwriting
year
Development year
Year 0 1 2 3 4 5 6 7 8 9 10 & + In Current yearSum of years
(cumulative)
C0010 C0020 C0030 C0040 C0050 C0060 C0070 C0080 C0090 C0100 C0110 C0170 C0180
Prior R0100 2'620'954 R0100 2'620'954 2'620'954
N-9 R0160 206'550 762'742 301'080 194'224 98'056 70'996 79'612 45'295 23'076 20'268 R0160 20'268 1'801'899
N-8 R0170 203'828 736'410 371'301 138'327 88'083 100'904 67'408 35'888 34'787 R0170 34'787 1'776'936
N-7 R0180 121'257 598'090 252'409 129'134 139'218 119'705 35'008 31'241 R0180 31'241 1'426'061
N-6 R0190 110'294 578'682 275'703 166'130 79'586 43'245 37'603 R0190 37'603 1'291'242
N-5 R0200 336'097 1'119'522 685'126 275'952 148'062 116'072 R0200 116'072 2'680'830
N-4 R0210 178'839 779'863 347'114 128'935 97'661 R0210 97'661 1'532'412
N-3 R0220 89'160 593'220 256'801 113'078 R0220 113'078 1'052'259
N-2 R0230 85'640 558'957 416'240 R0230 416'240 1'060'837
N-1 R0240 147'162 791'212 R0240 791'212 938'374
N R0250 262'771 R0250 262'771 262'771
Total R0260 4'541'887 16'444'576
(absolute amount)
Non-life insurance claims information
Total Non-Life Business
Accident year / Underwriting year
Gross Claims Paid (non-cumulative)

Report: S.19.01.21
Reporting entity: Swiss Re Europe SA
Reference Date: 31.12.2017
Reporting currency: EUR thousand
Z0020(2) Underwriting
year
Gross undiscounted Best Estimate Claims Provisions
Development year
Year Year 0 1 2 3 4 5 6 7 8 9 10 & +
Year end
(discounted
data)
C0200 C0210 C0220 C0230 C0240 C0250 C0260 C0270 C0280 C0290 C0300 C0360
Prior R0100 4'106'992 R0100 3'454'540
N-9 R0160 537'370 478'107 420'197 343'678 285'223 220'106 R0160 191'049
N-8 R0170 640'146 549'455 483'812 408'522 348'478 310'551 R0170 276'886
N-7 R0180 672'729 575'169 485'768 351'121 274'368 224'289 R0180 200'051
N-6 R0190 1'101'467 694'024 503'335 367'704 286'846 251'438 R0190 223'361
N-5 R0200 1'137'032 1'464'748 1'062'762 825'682 679'660 534'234 R0200 478'415
N-4 R0210 916'274 877'395 383'819 243'551 433'820 R0210 394'290
N-3 R0220 703'855 690'282 479'027 474'026 R0220 425'342
N-2 R0230 904'706 1'077'734 903'305 R0230 844'550
N-1 R0240 1'033'846 1'135'858 R0240 1'061'123
N R0250 1'741'060 R0250 1'656'708
Total R0260 9'206'314
(absolute amount)
Non-life insurance claims information
Total Non-Life Business
Accident year / Underwriting year

Report: S.23.01.01
Reporting entity: Swiss Re Europe SA
Reference Date: 31.12.2017
Reporting currency: EUR thousand
Own funds
Total Tier 1 - unrestricted Tier 1 - restricted Tier 2 Tier 3
Basic own funds before deduction for participations in other financial sector as foreseen in article 68 of Delegated Regulation
2015/35C0010 C0020 C0030 C0040 C0050
Ordinary share capital (gross of own shares) R0010 350'000 350'000
Share premium account related to ordinary share capital R0030 335'278 335'278
Initial funds, members' contributions or the equivalent basic own - fund item for mutual and mutual-type undertakings R0040
Subordinated mutual member accounts R0050
Surplus funds R0070
Preference shares R0090
Share premium account related to preference shares R0110
Reconciliation reserve R0130 1'593'944 1'593'944
Subordinated liabilities R0140
An amount equal to the value of net deferred tax assets R0160 18'935 18'935
Other own fund items approved by the supervisory authority as basic own funds not specified above R0180
Own funds from the financial statements that shall not be represented by the reconciliation reserve and do not meet the
criteria to be classified as Solvency II own funds
Own funds from the financial statements that shall not be represented by the reconciliation reserve and do not meet the criteria to be
classified as Solvency II own fundsR0220
Deductions
Deductions for participations in financial and credit institutions R0230
Total basic own funds after deductions R0290 2'298'157 2'279'222 18'935
Ancillary own funds
Unpaid and uncalled ordinary share capital callable on demand R0300
Unpaid and uncalled initial funds, members' contributions or the equivalent basic own fund item for mutual and mutual - type
undertakings, callable on demandR0310
Unpaid and uncalled preference shares callable on demand R0320
A legally binding commitment to subscribe and pay for subordinated liabilities on demand R0330
Letters of credit and guarantees under Article 96(2) of the Directive 2009/138/EC R0340
Letters of credit and guarantees other than under Article 96(2) of the Directive 2009/138/EC R0350
Supplementary members calls under first subparagraph of Article 96(3) of the Directive 2009/138/EC R0360
Supplementary members calls - other than under first subparagraph of Article 96(3) of the Directive 2009/138/EC R0370
Other ancillary own funds R0390
Total ancillary own funds R0400
Available and eligible own funds
Total available own funds to meet the SCR R0500 2'298'157 2'279'222 18'935
Total available own funds to meet the MCR R0510 2'279'222 2'279'222
Total eligible own funds to meet the SCR R0540 2'298'157 2'279'222 18'935
Total eligible own funds to meet the MCR R0550 2'279'222 2'279'222
SCR R0580 905'149
MCR R0600 407'317
Ratio of Eligible own funds to SCR R0620 254%
Ratio of Eligible own funds to MCR R0640 560%

Report: S.23.01.01
Reporting entity: Swiss Re Europe SA
Reference Date: 31.12.2017
Reporting currency: EUR thousand
Reconciliation reserve C0060
Excess of assets over liabilities R0700 2'948'157
Own shares (held directly and indirectly) R0710
Foreseeable dividends, distributions and charges R0720 650'000
Other basic own fund items R0730 704'213
Adjustment for restricted own fund items in respect of matching adjustment portfolios and ring fenced funds R0740
Reconciliation reserve R0760 1'593'944
Expected profits
Expected profits included in future premiums (EPIFP) - Life business R0770 2'031'891
Expected profits included in future premiums (EPIFP) - Non-life business R0780 -72'208
Total EPIFP R0790 1'959'683
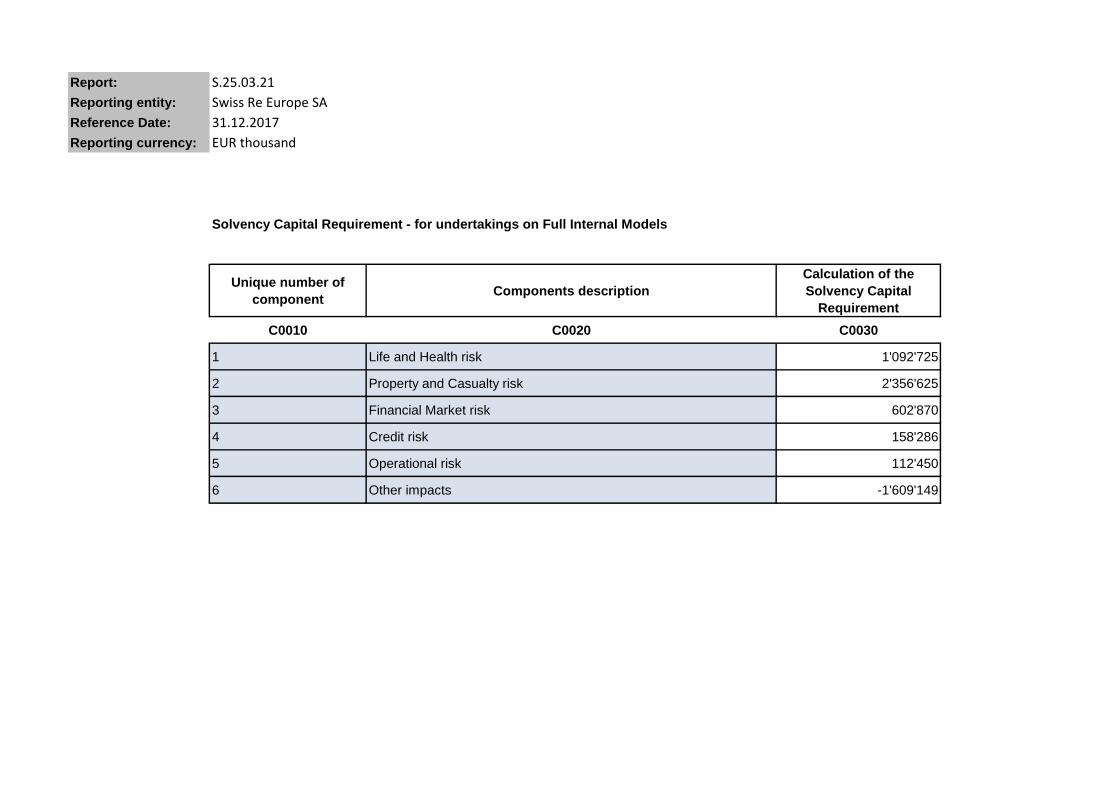
Report: S.25.03.21
Reporting entity: Swiss Re Europe SA
Reference Date: 31.12.2017
Reporting currency: EUR thousand
Unique number of
componentComponents description
Calculation of the
Solvency Capital
Requirement
C0010 C0020 C0030
1 Life and Health risk 1'092'725
2 Property and Casualty risk 2'356'625
3 Financial Market risk 602'870
4 Credit risk 158'286
5 Operational risk 112'450
6 Other impacts -1'609'149
Solvency Capital Requirement - for undertakings on Full Internal Models

Report: S.25.03.21
Reporting entity: Swiss Re Europe SA
Reference Date: 31.12.2017
Reporting currency: EUR thousand
Solvency Capital Requirement - for undertakings on Full Internal Models
C0100
Total undiversified components R0110 2'713'808
Diversification R0060 -1'699'941
Capital requirement for business operated in accordance with Art. 4 of Directive 2003/41/EC R0160 -
Solvency capital requirement, excluding capital add-on R0200 905'149
Capital add-ons already set R0210 -
Solvency capital requirement R0220 905'149
Other information on SCR
Amount/estimate of the overall loss-absorbing capacity of technical provisions R0300 -
Amount/estimate of the overall loss-absorbing capacity ot deferred taxes R0310 -108'718
Total amount of Notional Solvency Capital Requirements for remaining part R0410
Total amount of Notional Solvency Capital Requirements for ring fenced funds (other than those
related to business operated in accordance with Art. 4 of Directive 2003/41/EC (transitional))R0420 -
Total amount of Notional Solvency Capital Requirement for matching adjustment portfolios R0430
Diversification effects due to RFF nSCR aggregation for article 304 R0440
Calculation of Solvency Capital Requirement
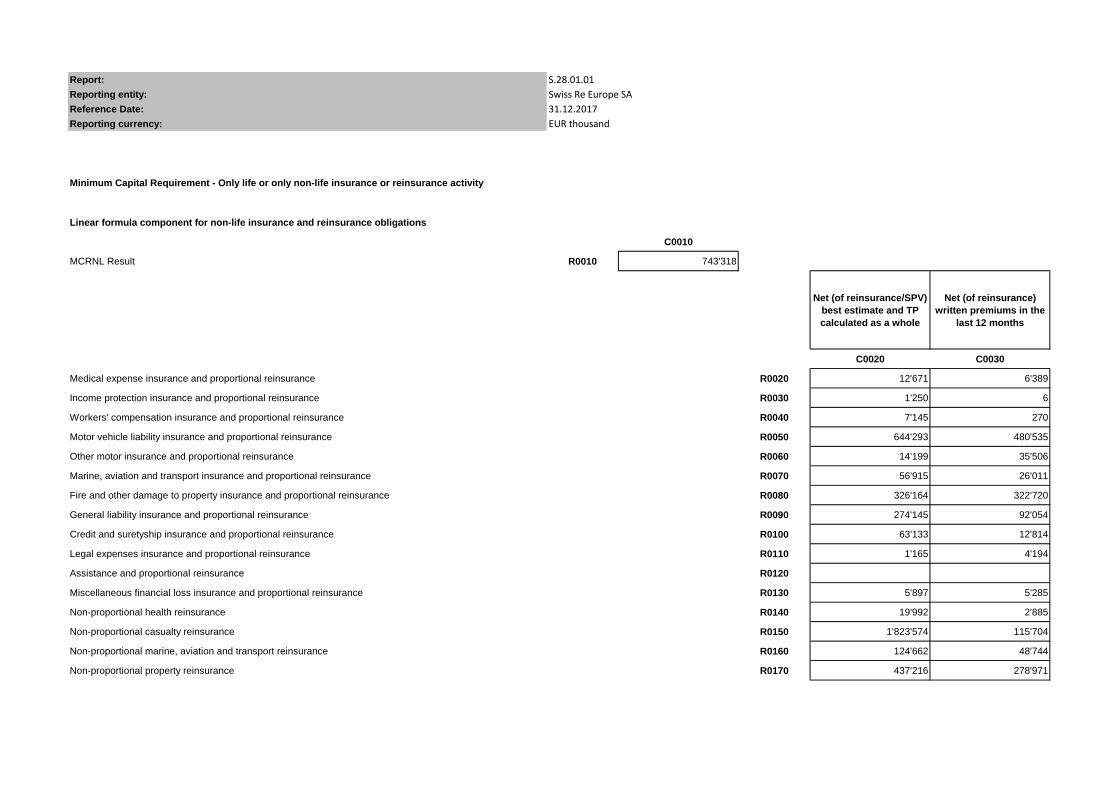
Report: S.28.01.01
Reporting entity: Swiss Re Europe SA
Reference Date: 31.12.2017
Reporting currency: EUR thousand
Linear formula component for non-life insurance and reinsurance obligations
C0010
MCRNL Result R0010 743'318
Net (of reinsurance/SPV)
best estimate and TP
calculated as a whole
Net (of reinsurance)
written premiums in the
last 12 months
C0020 C0030
Medical expense insurance and proportional reinsurance R0020 12'671 6'389
Income protection insurance and proportional reinsurance R0030 1'250 6
Workers' compensation insurance and proportional reinsurance R0040 7'145 270
Motor vehicle liability insurance and proportional reinsurance R0050 644'293 480'535
Other motor insurance and proportional reinsurance R0060 14'199 35'506
Marine, aviation and transport insurance and proportional reinsurance R0070 56'915 26'011
Fire and other damage to property insurance and proportional reinsurance R0080 326'164 322'720
General liability insurance and proportional reinsurance R0090 274'145 92'054
Credit and suretyship insurance and proportional reinsurance R0100 63'133 12'814
Legal expenses insurance and proportional reinsurance R0110 1'165 4'194
Assistance and proportional reinsurance R0120
Miscellaneous financial loss insurance and proportional reinsurance R0130 5'897 5'285
Non-proportional health reinsurance R0140 19'992 2'885
Non-proportional casualty reinsurance R0150 1'823'574 115'704
Non-proportional marine, aviation and transport reinsurance R0160 124'662 48'744
Non-proportional property reinsurance R0170 437'216 278'971
Minimum Capital Requirement - Only life or only non-life insurance or reinsurance activity
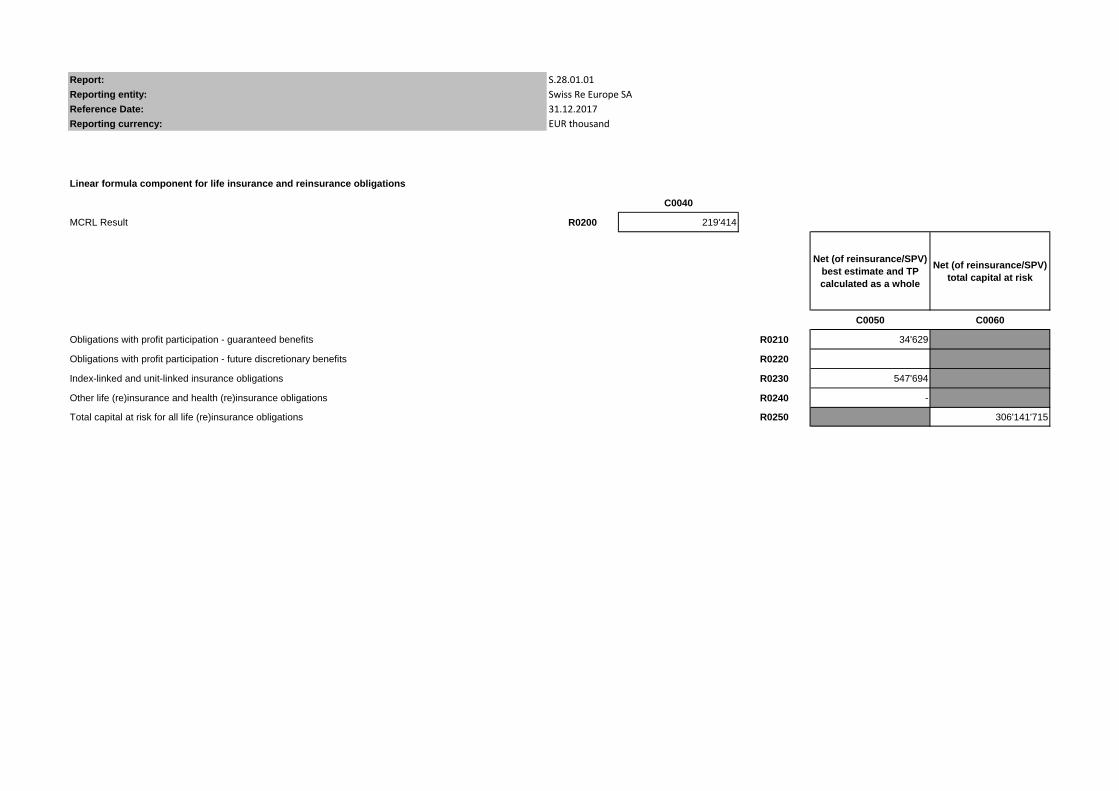
Report: S.28.01.01
Reporting entity: Swiss Re Europe SA
Reference Date: 31.12.2017
Reporting currency: EUR thousand
Linear formula component for life insurance and reinsurance obligations
C0040
MCRL Result R0200 219'414
Net (of reinsurance/SPV)
best estimate and TP
calculated as a whole
Net (of reinsurance/SPV)
total capital at risk
C0050 C0060
Obligations with profit participation - guaranteed benefits R0210 34'629
Obligations with profit participation - future discretionary benefits R0220
Index-linked and unit-linked insurance obligations R0230 547'694
Other life (re)insurance and health (re)insurance obligations R0240 -
Total capital at risk for all life (re)insurance obligations R0250 306'141'715

Report: S.28.01.01
Reporting entity: Swiss Re Europe SA
Reference Date: 31.12.2017
Reporting currency: EUR thousand
Overall MCR calculation C0070
Linear MCR R0300 962'733
SCR R0310 905'149
MCR cap R0320 407'317
MCR floor R0330 226'287
Combined MCR R0340 407'317
Absolute floor of the MCR R0350 3'700
Minimum Capital Requirement R0400 407'317


