
Sustainable Energy and Air Quality Sustainable Energy and Air Quality Planning for the Northeast USPlanning for the Northeast USApplication of a MultiApplication of a Multi--Pollutant Policy Pollutant Policy
Analysis Framework at the RegionalAnalysis Framework at the Regional--scalescale
Gary KleimanGary KleimanNESCAUM Attainment Planning CommitteeNESCAUM Attainment Planning Committee
Boston, MA Boston, MA ●● January 30, 2008January 30, 2008

Celebrating 40 Years in Support of Clean Air for the NortheastCelebrating 40 Years in Support of Clean Air for the Northeast
AcknowledgementsAcknowledgements
Contributors• Michelle Manion• Jason Rudokas• IRG, Ltd.
Sponsors• U.S. EPA• NOAA• Oak Foundation• Energy Foundation• H. W. Pierce
Charitable Trust• Member States

Celebrating 40 Years in Support of Clean Air for the NortheastCelebrating 40 Years in Support of Clean Air for the Northeast
Presentation OutlinePresentation Outline
• Environmental context for multi-p planning
• Policy context for multi-p planning• Overview of regional-scale, multi-
pollutant policy analysis framework• Examples of energy and environmental
trade-offs/interactions and their economic implications
• Putting it all together: regional wedges

Celebrating 40 Years in Support of Clean Air for the NortheastCelebrating 40 Years in Support of Clean Air for the Northeast
Rationale for thinking about Rationale for thinking about alternative energy sourcesalternative energy sources
(What are the challenges to, and opportunities for,
sustainable air quality management?)

Celebrating 40 Years in Support of Clean Air for the NortheastCelebrating 40 Years in Support of Clean Air for the Northeast
Climate Change in the NortheastClimate Change in the Northeast
Source: UCS NECIA
Alternative energypathways can makea difference in our future climate change“commitment”
Celebrating 40 Years in Support of Clean Air for the NortheastCelebrating 40 Years in Support of Clean Air for the Northeast
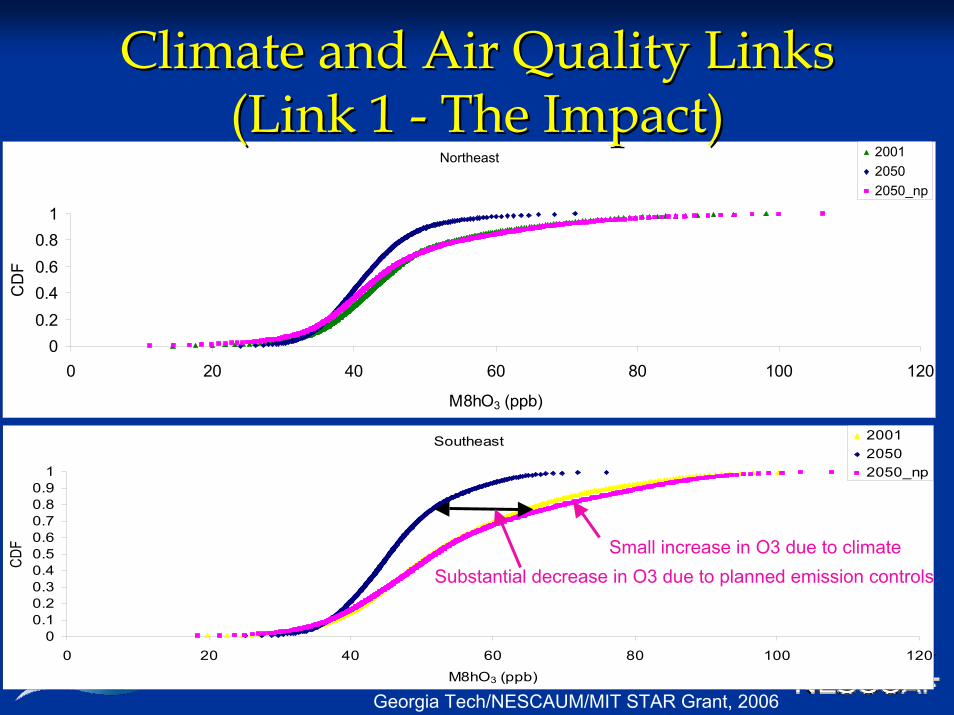
Southeast
00.10.20.30.40.50.60.70.80.9
1
0 20 40 60 80 100 120M8hO3 (ppb)
CDF
200120502050_np
Small increase in O3 due to climateSubstantial decrease in O3 due to planned emission controls
Northeast
00.20.40.60.8
1
0 20 40 60 80 100 120
M8hO3 (ppb)
CD
F
200120502050_np
Climate and Air Quality LinksClimate and Air Quality Links(Link 1 (Link 1 -- The Impact)The Impact)
Georgia Tech/NESCAUM/MIT STAR Grant, 2006

Celebrating 40 Years in Support of Clean Air for the NortheastCelebrating 40 Years in Support of Clean Air for the Northeast
Reductions in Ozone Season Power Industry NOReductions in Ozone Season Power Industry NOxxEmissions and 8Emissions and 8--Hour Ozone, 2002 versus 2004Hour Ozone, 2002 versus 2004

Celebrating 40 Years in Support of Clean Air for the NortheastCelebrating 40 Years in Support of Clean Air for the Northeast
Acid DepositionAcid Deposition
Before Title IV After Title IV
Source: NAPAP, 2005

Celebrating 40 Years in Support of Clean Air for the NortheastCelebrating 40 Years in Support of Clean Air for the Northeast
Fine Particles and HealthFine Particles and Health

Celebrating 40 Years in Support of Clean Air for the NortheastCelebrating 40 Years in Support of Clean Air for the Northeast
Fine Particles and VisibilityFine Particles and Visibility
Acadia National Park, Maine Acadia with high PM2.5 loading

Celebrating 40 Years in Support of Clean Air for the NortheastCelebrating 40 Years in Support of Clean Air for the Northeast
Mercury Emissions Contribute to Exposure to Mercury
• The primary pathway of human exposure to mercury in the U.S. is through eating contaminated fish.• Power plants emit approximately 48 tons of mercury and are the largest source of mercury emissions in the U.S.
(approximately 41%).
Wet and Dry Deposition
Emissions and
Speciation
AtmosphericTransport and
Deposition
Ecosystem Transport, Methylation, and Bioaccumulation
Consumption Patters Human Exposure
Fishing• commercial• recreational • subsistence
Mercury transforms into methylmercury in soils and water, then can bioaccumulate in fish
Atmosphericdeposition
Impacts• Best documented impacts
on the developing fetus: impaired motor and cognitive skills
• Possible cardiovascular, immune, and reproductive system impacts
Humans and wildlife affected primarily by eating contaminated fishEmissions to
the Air
Ocean
methylation
Lake
methylation

Celebrating 40 Years in Support of Clean Air for the NortheastCelebrating 40 Years in Support of Clean Air for the Northeast
Diesel/Black CarbonDiesel/Black Carbon

Celebrating 40 Years in Support of Clean Air for the NortheastCelebrating 40 Years in Support of Clean Air for the Northeast
Climate and Air Quality LinksClimate and Air Quality Links(Link 2 (Link 2 -- The Opportunity)The Opportunity)
A Low Carbon Future Could Mean…• Low NOx future• Low SO2 future• Low Hg and other toxic metals future• Low Diesel/Black Carbon future…A more sustainable Future
Multi-Pollutant Air Quality Planning

Celebrating 40 Years in Support of Clean Air for the NortheastCelebrating 40 Years in Support of Clean Air for the Northeast
Regional Policy ContextRegional Policy Context

Celebrating 40 Years in Support of Clean Air for the NortheastCelebrating 40 Years in Support of Clean Air for the Northeast
Air Quality Management IssuesAir Quality Management Issues
• Acid Deposition• Mercury Deposition• Fine Particles (Health & Visibility)• Ozone• Air Toxics• Climate Requires 10
Or more SIPs!

Celebrating 40 Years in Support of Clean Air for the NortheastCelebrating 40 Years in Support of Clean Air for the Northeast
MultiMulti--Pollutant PlanningPollutant Planning
• June 2007: the federal Clean Air Act Advisory Committee recommended that governments adopt a comprehensive statewide air quality planning process and move from a single to a multiple pollutant approach in managing air quality

Celebrating 40 Years in Support of Clean Air for the NortheastCelebrating 40 Years in Support of Clean Air for the Northeast
MultiMulti--Pollutant Policy Analysis Pollutant Policy Analysis Framework (MPAF)Framework (MPAF)

Celebrating 40 Years in Support of Clean Air for the NortheastCelebrating 40 Years in Support of Clean Air for the Northeast
Regional Integrated Regional Integrated Assessment FrameworkAssessment Framework
Policy Goal
Energy Model
Economic Model
KeyEconomic Indicators
Air Quality Modelemissi
ons
expenditures
Wet/DryDeposition
Ambient Concentrations
Health Benefits Model
Health EffectsIncidence and Cost/Benefit
Meteorology Health/ValuationFunction
Regional-ScaleClimate Model
ClimateImpacts Models
Costs,Benefits, Adaptations
due to Climate
Global ClimateModel
Celebrating 40 Years in Support of Clean Air for the NortheastCelebrating 40 Years in Support of Clean Air for the Northeast
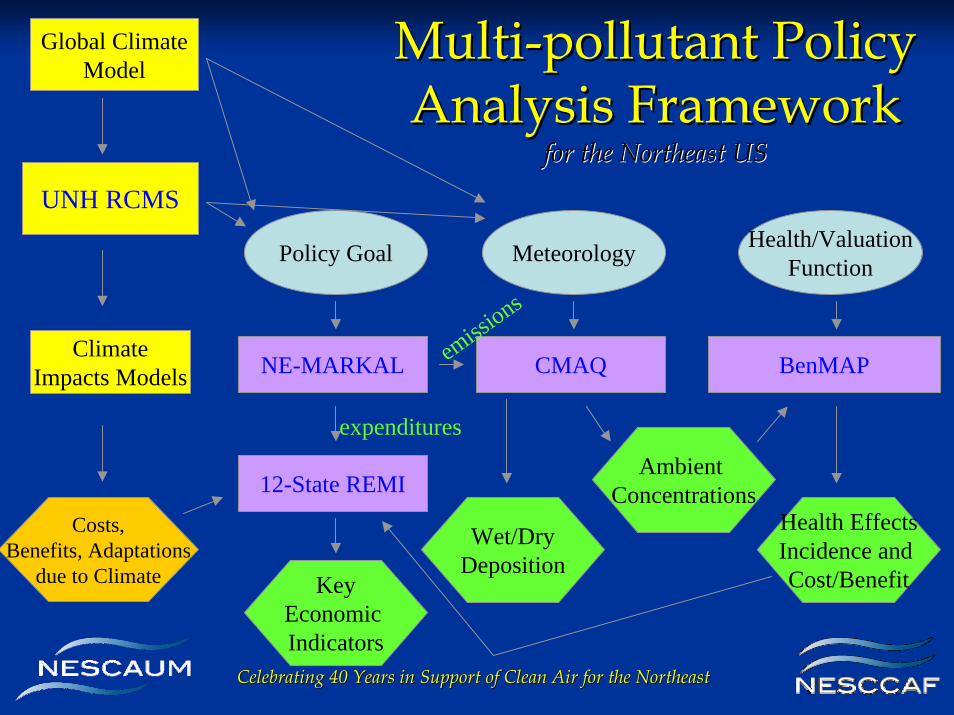
MultiMulti--pollutant Policy pollutant Policy Analysis FrameworkAnalysis Framework
for the Northeast USfor the Northeast US
Policy Goal
NE-MARKAL
12-State REMI
KeyEconomic Indicators
CMAQemissi
ons
expenditures
Wet/DryDeposition
Ambient Concentrations
BenMAP
Health EffectsIncidence and Cost/Benefit
Meteorology Health/ValuationFunction
UNH RCMS
ClimateImpacts Models
Costs,Benefits, Adaptations
due to Climate
Global ClimateModel

Celebrating 40 Years in Support of Clean Air for the NortheastCelebrating 40 Years in Support of Clean Air for the Northeast
NENE--MARKAL: Links Energy and MARKAL: Links Energy and Air QualityAir Quality
Air Pollution
Contribution to anthropogenicemissions:
NOx ~ 95%SOx ~ 89%CO ~ 95%Hg ~ 87%
Air Quality Concerns:OzonePM2.5Acid depositionToxics
Today’s Energy System
Uranium
Natural Gas
Oil
Oil
Refining
Coal
Renewables
Electricity Generation
Industry
Industry
Commercial
Residential
Automobiles
Source: EPA ORD

Celebrating 40 Years in Support of Clean Air for the NortheastCelebrating 40 Years in Support of Clean Air for the Northeast
NE9/12 NE9/12 Data Development ProcessData Development ProcessEIA surveys, NEMS, EGRID
Regional base technology characterizations and end-use
fuel shares
EIA SEDS
2002 State-level fuel consumption data
Base year state-level systemcharacterization
NEMS/DOE technology
options
AEO2006 demand
projections
State & regional policies
Reference case evolution
AEO2006 fuel price
projections

Celebrating 40 Years in Support of Clean Air for the NortheastCelebrating 40 Years in Support of Clean Air for the Northeast
NENE--9 9 DemandDemand SectorSectorss RepresentationRepresentationResidential Space Heating, Cooling, Clothes Washers,
Dish Washers, Water Heating, Cooking, Clothes Dryers, Refrigeration, Freezing, Lighting, Personal Computers, Television, Furnace Fans, Other Appliances, Secondary Heating
Commercial Space Heating, Cooling, Water Heating, Cooking, Ventilation, Refrigeration, Lighting, Office Equipment, Other
Industrial Steam, Process Heat, Machine Drive, Electro-Chemical, Other, Feedstocks, Non-Energy, and captive CHP in each ofChemicals, Durables, Glass-Cement, Metals, Paper, Other
Transportation Light and Heavy Duty Vehicles, Other(Aircraft, Marine, Rail available, but not yet implemented)

Celebrating 40 Years in Support of Clean Air for the NortheastCelebrating 40 Years in Support of Clean Air for the Northeast
NENE--9 Reference Scenario9 Reference Scenario
0
2000
4000
6000
8000
10000
12000
14000
16000
18000
20000
2002 2005 2008 2011 2014 2017 2020 2023 2026 2029
Tbtu
COM - KER COM - GSL COM - LPG COM - COA COM - BWD COM - RFO COM - DSL COM - ELC COM - NGA IND - MSW IND - HYD IND - GSL IND - LPG IND - BWD IND - RFO IND - BPL IND - DSL IND - COA IND - ASP IND - COK IND - PFS IND - OPP IND - ELC IND - NGA RES - COA RES - KER RES - LPG RES - BRW RES - ELC RES - DSL RES - NGA TRN - BDL TRN - CNG TRN - AVG TRN - ELC TRN - LUB TRN - RFO TRN - JTF TRN - DSL TRN - GSL CON - DSL CON - BWD CON - CWS CON - CIM CON - MSW CON - RFO CON - NGA CON CAP
Future projection of energy use by fuel

Celebrating 40 Years in Support of Clean Air for the NortheastCelebrating 40 Years in Support of Clean Air for the Northeast
Examples of energy and air Examples of energy and air quality interactionquality interaction

Celebrating 40 Years in Support of Clean Air for the NortheastCelebrating 40 Years in Support of Clean Air for the Northeast
Rapid Deployment of Renewable Rapid Deployment of Renewable EnergyEnergy
• Working with other energy modelers across U.S. (REMAP project)
• Examining the implications of requiring 20% renewable generation by 2025
• Looking at the viable opportunities and their costs
• We are one of the few regional models participating

Celebrating 40 Years in Support of Clean Air for the NortheastCelebrating 40 Years in Support of Clean Air for the Northeast
NE9 Regional Renewable Generation Reference Case
02468
101214
2002
2005
2008
2011
2014
2017
2020
2023
2026
2029
GW
NE9 Regional Renewable Generation Reference Case
02468
101214
2002
2005
2008
2011
2014
2017
2020
2023
2026
2029
GW
NE9 CO2 Reductions Under REMAP 20% Relative to the Reference Case
-60000-50000-40000-30000-20000-10000
010000
2002
2005
2008
2011
2014
2017
2020
2023
2026
2029
NE9 NOx Reductions Under REMAP 20% Relative to the
Reference Case
-200
-150
-100
-50
0
50
2002
2005
2008
2011
2014
2017
2020
2023
2026
2029
NE9 S02 Reductions Under REMAP 20% Relative to the
Reference Case
-600
-400
-200
0
200
2002
2005
2008
2011
2014
2017
2020
2023
2026
2029
Thousands of Tons
Renewable Energy in the NortheastRenewable Energy in the Northeast
REMAP

Celebrating 40 Years in Support of Clean Air for the NortheastCelebrating 40 Years in Support of Clean Air for the Northeast
0
1
2
3
4
5
6
7
8
9
10
2002 2005 2008 2011 2014 2017 2020 2023 2026 2029
GW
Biomass Landfill Gas Solar Wind
Renewable Generation with 20% RPSRenewable Generation with 20% RPS
Assumption:Cost and market potential for biomass?
Assumption:siting potential for wind?

Celebrating 40 Years in Support of Clean Air for the NortheastCelebrating 40 Years in Support of Clean Air for the Northeast
Examining Tradeoffs in the RESExamining Tradeoffs in the RES
Renewables• Biomass• Wind
– On/Off Shore– Classes 6-7
• Hydro• Solar
– Centralized– Commercial– Residential
Imports• Coal
– Western– Appalachian
• Natural Gas• Crude Oil• CNG• LPG
Exports• Bio-fuels (future
option)• Electricity
Fuel Processing• Oil Refining• Bio-fuel
production• Transportation
Electric Generation• Traditional fossil
fuel based• Renewable• IGCC• Carbon
sequestration• Fuel cells• Combined heat &
power
Industry• Boilers
– CHP Plants• Machines
Commercial• CFLs • Centrifugal
Chillers• Furnaces
Residential• GS Heat Pumps• Washing machines• Personal
Computers
Transportation• LD / HD Vehicles• Railway• Airplane• Ship
Industry• Steam Demand• Motor Drive
Commercial• Heating • Cooling• Lighting
Residential• Heating• Close Washing• Computing
Transportation• VMT• Take-offs
Primary EnergyConversion
TechnologiesEnd-Use Devices
End-Use Energy Demand
Attributes:•Technical Potential•Capital Cost•Associated Emissions
(including upstream)•Lifetime•Discount/hurdle rate
Celebrating 40 Years in Support of Clean Air for the NortheastCelebrating 40 Years in Support of Clean Air for the Northeast
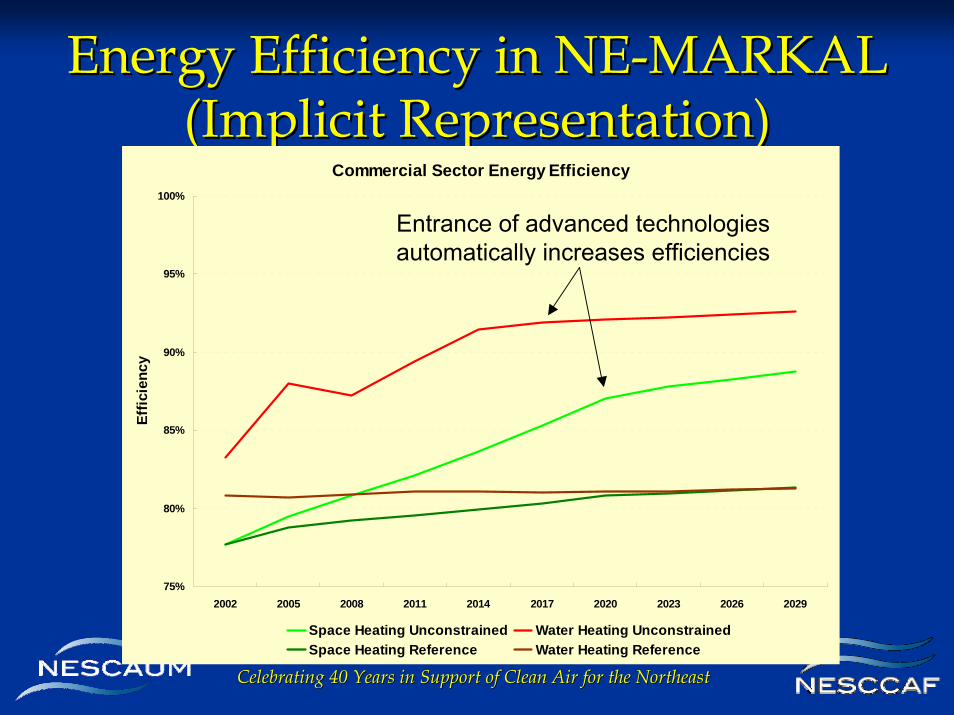
Energy Efficiency in NEEnergy Efficiency in NE--MARKALMARKAL(Implicit Representation)(Implicit Representation)
Unconstrained Commercial Sector Market Penetration
0%
10%
20%
30%
40%
50%
60%
70%
80%
90%
100%
2002 2005 2008 2011 2014 2017 2020 2023 2026 2029
% o
f Sec
tor
Dem
and
Met
By
Adv
ance
d Te
chno
logi
es
Space Heating Water Heating
Range of technologyefficiencies are
already representedin the model
Commercial Sector Energy Efficiency
75%
80%
85%
90%
95%
100%
2002 2005 2008 2011 2014 2017 2020 2023 2026 2029
Effic
ienc
y
Space Heating Unconstrained Water Heating UnconstrainedSpace Heating Reference Water Heating Reference
Entrance of advanced technologiesautomatically increases efficiencies
Celebrating 40 Years in Support of Clean Air for the NortheastCelebrating 40 Years in Support of Clean Air for the Northeast
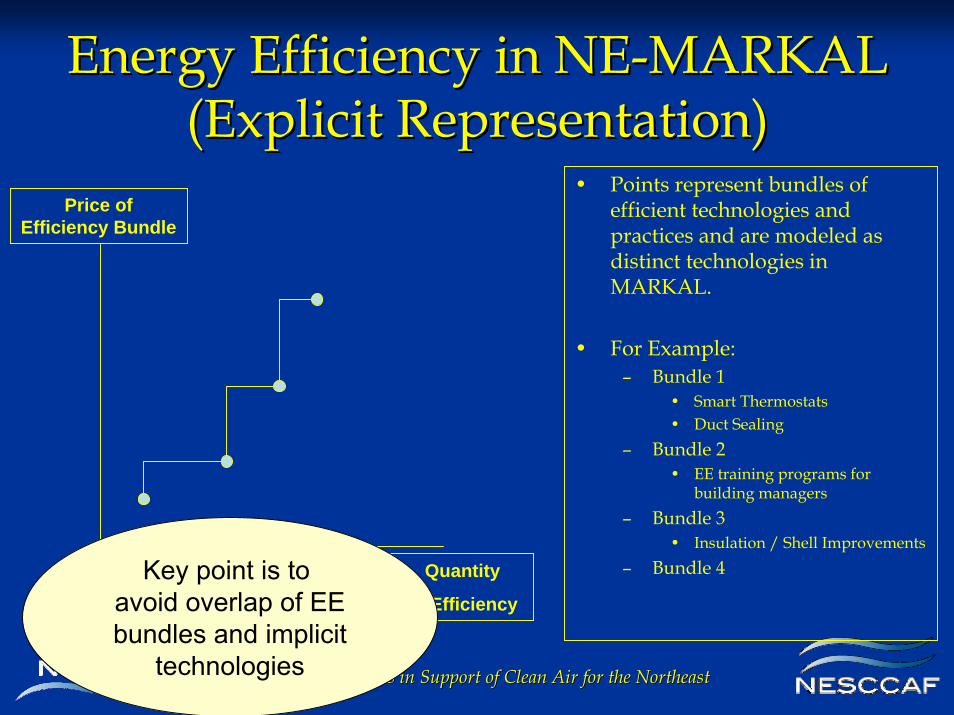
Energy Efficiency in NEEnergy Efficiency in NE--MARKALMARKAL(Explicit Representation)(Explicit Representation)
• Points represent bundles of efficient technologies and practices and are modeled as distinct technologies in MARKAL.
• For Example:– Bundle 1
• Smart Thermostats• Duct Sealing
– Bundle 2• EE training programs for
building managers– Bundle 3
• Insulation / Shell Improvements– Bundle 4Quantity
of Efficiency
Price of Efficiency Bundle
Key point is to avoid overlap of EEbundles and implicit
technologies

Celebrating 40 Years in Support of Clean Air for the NortheastCelebrating 40 Years in Support of Clean Air for the Northeast
Residential Heating: Single House Insulation EconomicsResidential Heating: Single House Insulation Economics• 2500 Square feet single
family house• Using Oil Radiator• South Central NH• 2 Stories
– Basement– Attic
• Initial base house had small amount of above ground insulation
• Insulated house upgraded to meet DOE recommended levels for NE.
• Insulation Cost $2,840• Lines represent different
interest rates assumptions for a 7 year loan program to pay for insulation.
– 52.4% implicit discount rate
Net Savings From Adding Insulation Under Different Payment Plans
-2000
0
2000
4000
6000
8000
10000
12000
14000
2008
2009
2010
2011
2012
2013
2014
2015
Net
Sav
ings
Up Front 3% 20% 50% 52.40%
Net Savings (2002 dollars) From Insulation Estimated by DOE eQUEST Simulation Tool

Celebrating 40 Years in Support of Clean Air for the NortheastCelebrating 40 Years in Support of Clean Air for the Northeast
Fuel Expenditure Reductions Relative to Reference Case
-2%
0%
2%
4%
6%
8%
10%
12%
14%
16%
2005 2008 2011 2014 2017 2020 2023 2026 2029
% E
xpen
ditu
re R
educ
tions
REF52 vs Unconstrained REF52 vs High 2 Low REF52 vs Low 2 High
In the unconstrained In the unconstrained case rapid case rapid investments in investments in insulation up to the insulation up to the technical potential technical potential cause the residential cause the residential heating sector to heating sector to rapidly become much rapidly become much more efficient.more efficient.
Residential Heating: Regional Insulation EconomicsResidential Heating: Regional Insulation Economics(Direct Savings)(Direct Savings)
Regional Reduction in Fuel Expenditure

Celebrating 40 Years in Support of Clean Air for the NortheastCelebrating 40 Years in Support of Clean Air for the Northeast
0
10
20
30
40
50
Unconstrained High to Low Low to High
Empl
oym
ent I
ncre
ase
(Tho
us)
0.0
0.5
1.0
1.5
2.0
2.5
3.0
3.5
4.0
4.5
5.0
GR
P In
crea
se (B
ill 2
000
$'s)
Residential Heating: Regional Insulation EconomicsResidential Heating: Regional Insulation Economics(Indirect Benefits: Gross Regional Product, Employment)(Indirect Benefits: Gross Regional Product, Employment)

Celebrating 40 Years in Support of Clean Air for the NortheastCelebrating 40 Years in Support of Clean Air for the Northeast
Combined Heat and PowerCombined Heat and Power• Our study examined how CHP deployment in
Massachusetts is affected by standby charges under 3 different scenarios.– Aggressive C02 cap on power sector
• 30% of 2002 emissions by 2029– Increasing natural gas prices between 2008 and 2029– Power sector C02 cap & high natural gas prices
• We also highlight key changes in the energy infrastructure as CHP deployment changes.– Power sector fuel switching – CO2 emission levels

Celebrating 40 Years in Support of Clean Air for the NortheastCelebrating 40 Years in Support of Clean Air for the Northeast
Projected CHP Installed Capacity in MA (2005-2025)
750
800
850
900
950
1000
1050
Reference Case (FullStandby Charge)
No Standby No Standby / 225$ kw Grant
MW

Celebrating 40 Years in Support of Clean Air for the NortheastCelebrating 40 Years in Support of Clean Air for the Northeast
Implications for Climate PolicyImplications for Climate Policy
Stabilization Wedges: Pacala and Socolow, Science, August 13, 2004

Celebrating 40 Years in Support of Clean Air for the NortheastCelebrating 40 Years in Support of Clean Air for the Northeast
0
200
400
600
800
1000
1200
2002 2005 2008 2011 2014 2017 2020 2023 2026 2029
CO2
(Mill
ion
TPY
)Regional WedgesRegional Wedges
CA LEV?
Insulation
BAU +RPS+RGGI
+REMAP

Celebrating 40 Years in Support of Clean Air for the NortheastCelebrating 40 Years in Support of Clean Air for the Northeast
Typical Analysis StepsTypical Analysis Steps
• Review technology characterizations, emission factors, and other inputs
• Joint development of reference scenario; input assumptions and policy constraints appropriate to a particular study
• Initial focus on a couple specific measures• This ultimately results in full description
of a menu of options to meet multi-p needs

Celebrating 40 Years in Support of Clean Air for the NortheastCelebrating 40 Years in Support of Clean Air for the Northeast
ImplicationsImplications• Clear advantages to multi-pollutant planning
(using climate motivation to achieve air and energy goals)
• Analytical framework to look at wide range of opportunities across sectors in regional context (i.e. interactions across pollutants/sectors)
• Need to better define state engagement for analytic support and coordination of policy approach that would allow MPAF to serve a role in future AQM plans

Celebrating 40 Years in Support of Clean Air for the NortheastCelebrating 40 Years in Support of Clean Air for the Northeast
Data Wish listData Wish list
• Actual Electricity Trade in 2002, 2005• Capacity transfer limits MD, DE, DC• Emission factors for HD vehicles/Buses• Major mercury source emission factors• Policy assumptions and criteria pollutant
constraints for reference scenario• Data for aircraft, marine, rail sources if
target of analysis

Celebrating 40 Years in Support of Clean Air for the NortheastCelebrating 40 Years in Support of Clean Air for the Northeast
Thank You!Thank You!
Harmonizing environmental, public health, economic and societal goals
The Clean Air Association of the Northeast States


