
Survival Estimation Using Survival Estimation Using Estimated Daily Detection Estimated Daily Detection
ProbabilitiesProbabilities
Benjamin P. SandfordBenjamin P. Sandford
Fish Ecology DivisionFish Ecology Division
NOAA FisheriesNOAA Fisheries
NOAA Fisheries

• Steve Smith – statistical development and programming
• Steve Achord and PTAGIS – data
• COE and BPA - funding
NOAA Fisheries
AcknowledgementsAcknowledgements

General ProblemGeneral Problem
CJS may not be the best survival estimation technique in certain circumstances:
1) Concurrent temporal changes in detection and survival probabilities;
NOAA Fisheries

General ProblemGeneral Problem
CJS may not be the best survival estimation technique in certain circumstances:
1) Concurrent temporally dynamic detection and survival probabilities;
2) Cohort has small sample size but additional data available to estimate detection probability; or
NOAA Fisheries

General ProblemGeneral Problem
CJS may not be the best survival estimation technique in certain circumstances:
1) Concurrent temporally dynamic detection and survival probabilities;
2) Cohort has small sample size but additional data available to estimate detection probability; or
3) Daily detection probabilities needed for non-survival estimation purposes, such as migration timing estimation.
NOAA Fisheries

Specific ExampleSpecific Example
Study: PIT-tagging wild chinook salmon parr.
NOAA Fisheries

Specific ExampleSpecific Example
Primary objective: Migration timing distribution passing Lower Granite Dam.
NOAA Fisheries
0
50
100
150
200
250
300
350
400
450

Specific ExampleSpecific Example
Challenge: Small sample size.
NOAA Fisheries
0
1
2
3

Specific ExampleSpecific Example
Challenge: Variable PIT-tag detection probability.
NOAA Fisheries
0
0.1
0.2
0.3
0.4
0.5
0.6
0.7

Specific ExampleSpecific Example
NOAA Fisheries
Detection distribution inappropriate as index of passage distribution.
Daily detection probabilities needed to properly expand detection distribution into passage distribution.

ConceptConcept
Dam 1 detected distribution for Dam 2 detected day.
NOAA Fisheries
Days at Dam 1
Detected N
Day at Dam 2
Detected N

ConceptConcept
Estimated Dam 1 undetected distribution for Dam 2 detected day
Assumption: same distribution.
NOAA Fisheries
Day at Dam 2
Days at Dam 1
Estimated U
Detected U
ConceptConcept
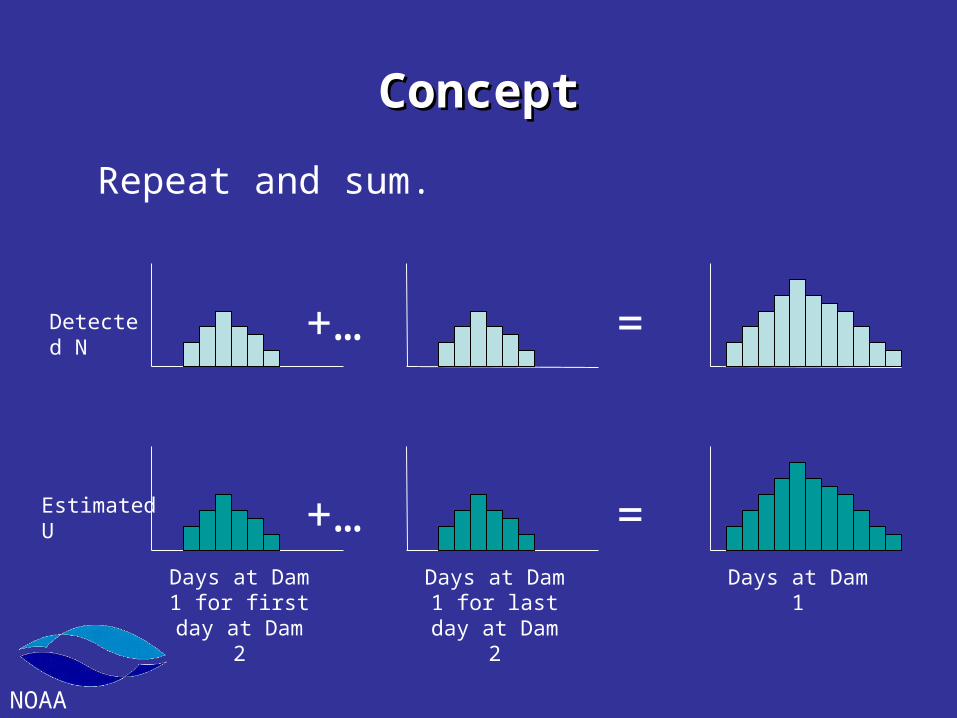
Repeat and sum.
NOAA Fisheries
Days at Dam 1 for first day at
Dam 2
Estimated U
Detected N
Days at Dam 1 for last day at
Dam 2
+…
+…
=
=Days at Dam 1

ConceptConcept
Estimated detection probability for day at Dam 1.
NOAA Fisheries
Det. N
Day at Dam 1
Day at Dam 1
Est. UDet. N
Day at Dam 1
+ (1 – Tran. Prop.)

ConceptConcept
Estimated passage number for day at Dam 1.
NOAA Fisheries
=Estimated detection probability for day at Dam 1
Detected N’
Day at Dam 1Estimated N’
Day at Dam 1

ConceptConcept
Estimated survival to Dam 1.
NOAA Fisheries
Release Number
Estimated N’
All Days at Dam 1
Sum( )

Schaefer MethodSchaefer Method
NOAA Fisheries
t
j j
ijjm
muiu
1 ..ˆ
Estimated undetected at LGR on day i.

Schaefer MethodSchaefer Method
NOAA Fisheries
t
j j
ijjm
muiu
1 ..ˆ
Estimated undetected at LGR on day i.

Schaefer MethodSchaefer Method
NOAA Fisheries
t
j j
ijjm
muiu
1 ..ˆ
Estimated undetected at LGR on day i.

Schaefer MethodSchaefer Method
NOAA Fisheries
t
j j
ijjm
muiu
1 ..ˆ
Estimated undetected at LGR on day i.

Schaefer MethodSchaefer Method
NOAA Fisheries
)1(ˆˆ
1..
.
iii
ii
Tum
mP
Estimated detection probability at LGR on day i.

Schaefer MethodSchaefer Method
NOAA Fisheries
)1(ˆˆ
1..
.
iii
ii
Tum
mP
Estimated detection probability at LGR on day i.

Schaefer MethodSchaefer Method
NOAA Fisheries
i
ii
P
nN
ˆˆ
Estimated passage number at LGR on day i.

Schaefer MethodSchaefer Method
NOAA Fisheries
i
ii
P
nN
ˆˆ
Estimated passage number at LGR on day i.

Schaefer MethodSchaefer Method
NOAA Fisheries
R
N
S
s
i
i 1
ˆ
ˆ
Estimated survival to LGR.

Schaefer MethodSchaefer Method
NOAA Fisheries
R
N
S
s
i
i 1
ˆ
ˆ
Estimated survival to LGR.

Schaefer MethodSchaefer Method
NOAA Fisheries
Adjustments in the passage distribution tails:
- No “detected at LGR” fish: Use LGR to LGO travel time.
- Estimates of 0 or 1: Use spill regression.
- Minor effect on overall estimates.

Schaefer MethodSchaefer Method
NOAA Fisheries
Variance and 95% confidence intervals: Use Bootstrap.
Standard Error estimate: Standard Error of bootstrapped estimates.
95% confidence intervals: 25th and 975th values of the ordered bootstrap estimates.

Wild Chinook Parr Example - OverallWild Chinook Parr Example - Overall
NOAA Fisheries
YearReleaseNumber
EstimatedPassageNumber
EstimatedSurvival
StandardError
95%Lower
Conf. Int.
95%Upper
Conf. Int.
1993 14478 2283 15.8% 0.7% 15.3% 18.2%
1994 12747 2401 18.8% 0.8% 17.6% 20.6%
1995 24417 3289 13.5% 0.3% 12.9% 14.3%
1996 6835 1411 20.6% 1.2% 19.1% 24.0%
1997 5634 1173 20.8% 1.8% 18.6% 25.8%
1998 6225 1516 24.4% 1.0% 23.0% 26.8%
1999 12922 2575 19.9% 0.8% 18.5% 21.7%
2000 13390 2374 17.7% 0.7% 16.7% 19.6%
2001 6526 1276 19.5% 0.6% 18.5% 20.7%
2002 14399 2066 14.3% 0.8% 13.3% 16.4%
Total 117573 20363 17.3%
Average 18.5% 0.9% 17.4% 20.8%
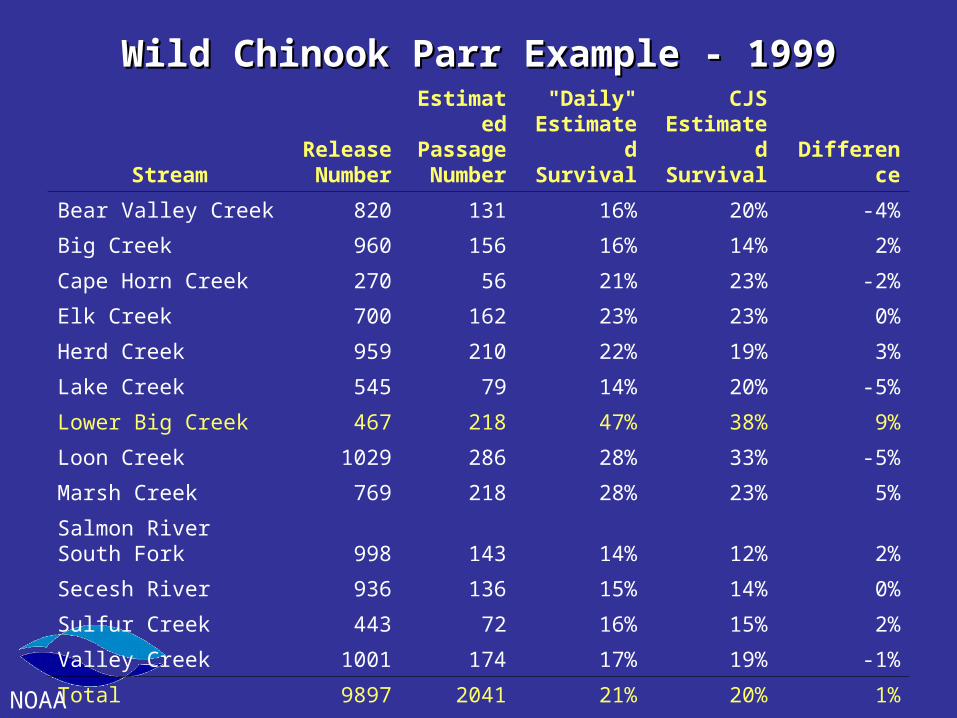
Wild Chinook Parr Example - 1999Wild Chinook Parr Example - 1999
NOAA Fisheries
StreamRelease
Number
EstimatedPassageNumber
"Daily"Estimated
Survival
CJSEstimated
Survival Difference
Bear Valley Creek 820 131 16% 20% -4%
Big Creek 960 156 16% 14% 2%
Cape Horn Creek 270 56 21% 23% -2%
Elk Creek 700 162 23% 23% 0%
Herd Creek 959 210 22% 19% 3%
Lake Creek 545 79 14% 20% -5%
Lower Big Creek 467 218 47% 38% 9%
Loon Creek 1029 286 28% 33% -5%
Marsh Creek 769 218 28% 23% 5%
Salmon River South Fork 998 143 14% 12% 2%
Secesh River 936 136 15% 14% 0%
Sulfur Creek 443 72 16% 15% 2%
Valley Creek 1001 174 17% 19% -1%
Total 9897 2041 21% 20% 1%

Lower Big Creek - 1999Lower Big Creek - 1999
NOAA Fisheries
10%
20%
30%
40%
Dete
cti
on
Prob
ab
ilit
y
CJS = 33% “Daily” = 28%
Det
ecti
on P
rob
abili
ty


