
SUPPLY CHAIN VULNERABILITY AND CUSTOMER
SATISFACTION ON PETROLEUM PRODUCTS IN KENYA
PAUL JACKTON AMBAYO
Research Project Submitted in Partial fulfillment for the Degree of Master of
Business Administration School of Business, University of Nairobi,
2012

DECLARATIONBY THE STUDENT:
I declare that this Research Project is my own work and has not been submitted for a degree in
any other university.
P rV A _______________ & i\'ao\>PAUL JACKTON AMBAYO Date
D61/66954/2011
This Research Proposal is submitted with my approval as the university Supervisor
MAGUTU P. O.
Lecturer,
Department of Management Science
School of Business, University of Nairobi
Date

DEDICATIONS
This research Project is dedicated to my brother; George Ambayo for his determination and
commitment to educate me. Indeed, he made me live the Martin Luther King junior dream that
faith is taking the first step even if you can’t see the whole staircase. My niece Merolyn who
looked up to me for inspiration during this process, may you live to achieve your academic
ambitions. Finally, to Celine, thank you so much for the sleepless nights you spent supporting,
encouraging and keeping me company throughout the period that I spent on this research project.
fACKNOWLEDGEMENTS
I wish to express my appreciation to all individuals who made it possible for this research project
to be produced. I am most indebted to my supervisor, Magutu, for his guidance and goodwill
without which, I would have not gone this far. To my brother, George Ambayo, who sacrificed
every available resource he had to support me on this course. To him, I say thank you for your
big heart. To my classmates; Wycliffe, Dan, Martin, Ben, Joyce and Reuben, God bless you for
your kindness and support. Lastly, thank you, the almighty God for the gift o f life, good health
and wisdom.

TABLE OF CONTENT
Declaration--------------------
Dedications---------- -------- -
Acknowledgement----------
Table of Contents-----------
List of tables------------------
Abstract------------------------
-iii
— iv
---- v
— vi
CHAPTER ONE---------------------------------------------------------------------------------------------------1
1.1 Background to the Study------------------------------------------------------------------------------------- 1
1.1.1 Supply chain vulnerability-------------------------------------------------------------------------------- 2
1.1.2 The Petroleum Industry and Products in Kenya------------------------- ----- ----------------------- 5
1.2 Statement o f the Problem---------------------------------------------------------------------------------- 7
1.3 Objectives o f the Study------------------------------------------------------------------------------------- 8
1.4 Value of the Study------------------------------------------------------------------------------------------ 9
CHAPTER TWO--------------------------------------------------------------
2.1 Introduction----------------------------------------------------------------
2.2. Supply Chain Vulnerability and its drivers---------------------------
2.3 Causes of Supply Chain Vulnerability---------------------------------
2.4 Customer Satisfaction-----------------------------------------------------
2.5 Supply Chain Vulnerability and Customer Satisfaction------------
2.6 Empirical Literature-------------------------------------------------------
2.7 Conceptual Framework---------------------------------- -----------------
2.8 Summary of Empirical Literature---------------------------------------
----------------------------10
-------------------------10
--------------------------- 18
- .................................. - ...............................................22
CHAPTER THREE------------------------------------------------------------------------------------------ 24
3.1 Introduction------------------------------------------ ----------- —....................................................... 24
3.2 Research Design................................. .............................................................. ...........................24

3.3 Population o f the Study-------------------------------------------------------------------------
3.4 Data Collection Method-------------------------------------------------------------------------
3.5 Data Analysis--------------------------------------------------------------------------------------
CHAPTER FOUR-----------------------------------------------------------------------------------
4.1 Introduction-------------------------------------------------- -------------------------------------
4.2 Findings on causes of supply chain vulnerability------------------------------------------
4.3 Findings on causes of supply chain vulnerability and customer satisfaction--------
4.4 Supply chain vulnerability index and customer Dissatisfaction index......................
4.5 Summary and interpretation of the results..................— ------ --------------------------
CHAPTER FIVE-------------------------------------------------------------------------------------
5.1 Summary of the findings------------------------------------------------------------------------
5.2 Conclusions and Recommendations.......................................... - ................................
5.3 Limitations o f the Research--------- -----------------------------------------------------------
5.4 Suggestions for further Research--------------------------------------------------------------
Appendix 2---------------------------------------------------------;------------------------------------
--------- 25
--------- 25
----------26
--------- 26
----------26
----------26
----------29
-------- 31
---------31
-------- 33
-------- 33
-------- 34
---------35
---------- 36
--------- 45
...........48

LIST OF TABLES
Table: 4. 1: Findings on causes of supply chain vulnerability---------------------------------------
Table: 4. 2: Findings on the perception of the respondents on the effects of supply chain
vulnerability causes on customer satisfaction--------------- ------- ------------------------------------
Table: 4. 3: Supply chain vulnerability and customer dissatisfaction index.............................
Table: 4. 4: The model summary--------------------------------------------------------------------------
---- 27
-—29
— 31
— 32
— 32
Table: 4. 6: Coefficient of Regression Analysis 32

ABSTRACT
While a supply chain disruption is the trigger that leads to the occurrence of supply chain risks, it
is a major determinant of the dissatisfaction from the customers. It therefore seems consequential
that the susceptibility of the supply chain to the harm of this disruption is o f significant
relevance. This leads to the concept of supply chain vulnerability. The basic premise is that
supply chain characteristics are antecedents of supply chain vulnerability and impact on both the
probability of occurrence as well as on the severity of supply chain disruptions and hence,
customer dissatisfaction. The understanding of supply chain vulnerability concept is very
important in creating value to the customers.
The research involved a cross sectional survey of the registered distributors of petroleum
products in Kenya. It adopted a descriptive approach in establishing the impact of Supply chain
vulnerability and customer satisfaction on petroleum products in Kenya. The research employed
a census of 54 firms out o f which, 30 responded. Data was collected from the respondents
through a drop and pick method. The data was then analyzed using SPSS and the findings
presented in tables.
This study revealed that there is a positive relationship between the causes of supply chain
vulnerability and customer dissatisfaction. The factors targeted as the causes o f supply chain
vulnerability like focus on efficiency rather than effectiveness, globalization of supply chains,
focused factories and centralized distribution systems, trends to outsourcing, reduction o f
supplier base, volatility of demand, lack of visibility and control, natural calamities, just in time

The study recommends that the distributors of petroleum products in Kenya should mitigate
against the causes o f supply chain vulnerability to create value to the customers of the petroleum
products
CHAPTER ONE: INTRODUCTION
1.1 Background
Supply chain management is the combination of art and science that goes into improving the way
your company finds the raw components it needs to make a product or service and deliver it to
customers (Wailgum and Worthem, 2008). The underlying principle o f Supply Chain
Management is to establish control of the end to end process in order to create a seamless flow of
a good or service to satisfy the customer.
Kenyan consumers and indeed many consumers across the globe have faced tuff economic times
due to arrays of severe crisis and shocks that have direct impact on supply chain. This concern is
gaining a considerable attention notably due to the frequency and intensity of catastrophes,
disasters and crisis that seem to have increased on a global scale (Coleman, 2006, Helferich and
Cook, 2002; Munich Re, 2006). Supply chain vulnerability has a significant negative impact on
shareholder value and on operational performance (Hendricks and Singhal, 2003, 2005).
Generally, Capital Markets have a tendency to severely penalize supply chain vulnerability and
rates highly supply chain robustness. This is due to the fact that logistics flows in many
industries strive to be lean, responsive and agile.
A smooth supply chain process results in reliable supply to the customer at cost effective means.
This tremendously improves firm perfomance by enabling it to gain a competitive edge over its
competitors. Any factors that disrupt the smoothness o f the supply chain results in delays,
inefficiencies, and lack of competitiveness. This ultimately impact on customer satisfaction and
eventually on a firm’s profitability.
A vulnerable supply chain exposes consumers to the supply chain risks. Whether managed or
not, a supply chain will always display some degrees o f vulnerability. (Peck, 2006). Supply chain
risk is compounded by some contemporary supply chain management practices like global
sourcing and single sourcing. These factors increase the level of supply chain risks. (Juttner,
2005: Wegner and Bodes, 2006).
1.1.1 Supply Chain Vulnerability and Customer Satisfaction
A supply chain consists of all parties involved, directly or indirectly, in fulfilling a customer
request. The supply chain not only includes the manufacturer and suppliers, but also transporters,
warehouses, retailers, and customers themselves. Within each Company, such as manufacturing
or distribution, the supply chain includes all functions involved in receiving and filling a
customer request. These functions include, among others, new product development, marketing,
operations, distribution, finance, and customer service.
Supply chain vulnerability has been defined as the susceptibility o f the supply chain to the
likelihood and consequences of disruptions (Bloss et al, 2009: Svensson 2000, 2002; Christopher
and Perk, 2004). It is an exceptional and anomalous situation that is triggered by an underlying
disruptive event. The vulnerability is associated with a certain probability of occurrence and
characterized by its’ severity and in essence direct and indirect effects (Kleindorfer and Saad,
2005).
Peck (2002), in a detailed discussion of supply chain vulnerability identified seven sources of
supply ehain vulnerability. These sources are; over emphasis on efficiency rather than

effectiveness, globalization of supply chains, adoption of focused factories and centralized
distribution, increased tendency to outsource, reduction of the supplier base, volatility of demand
and lack of visibility and control procedures. Jittner, (2005), distinguishes between
environmental, supply and demand risk sources on the one hand, and processes and control
mechanisms as a risk amplifier or absorber on the other hand. Environmental risk sources
comprise any external uncertainties arising from the supply chain such as disruption caused by
political (e.g. fuel crisis), natural (e.g. foot and mouth outbreak, fire, earthquake) or social (e.g.
terrorist attacks) uncertainties.
Compared with external, environmental risk sources, demand and supply sources are internal to
the supply chain. Jittner (2005) notes that processes can either amplify or absorb the effect of
risks in the supply chain and refer to the design and implementation of processes within and
between the entities in the supply chain.
Customer satisfaction refers to the measure of how much products or services supplied by a firm
meet or surpass customer expectation (Fomell et al, 19%). Customer satisfaction is an overall
customer attitude towards a good or a service provider or an emotional reaction towards the
difference between what customers expect and what they receive, regarding the fulfillment of
some desire, need or goal (Hansemark, & Albinson, 2004, Kotler, 2000, Hoycr, & Maclnnis,
2001).
Customer satisfaction is very important because without satisfied customers, you do not have a
business. It influences the customers’ repurchase decisions. To achieve customer satisfaction,
organizations should build and maintain long lasting relationships with the customers through

The importance o f customer satisfaction cannot be dismissed because happy customers are like
free advertisement. Customer satisfaction is regarded as a fundamental determinant in
maintaining long term customer relationship behaviors (Oliver, 1980: Zeithaml, Berry, &
Parasuraman, 1996; Anthanassopoulos, Gounaris, & Sathakopoulos, 2001; Anderson, &
Sullivan, 1993; Fomcl, 1992; Levesque, & McDougall, 1996).
The linkage between supply chain vulnerability and customer satisfaction is based on the
argument that there are four main characters in the supply chain which include suppliers,
manufacturers, distributors and customers. Thus, understanding the relationship between the
mentioned groups and efforts to optimize this relationship is the major issue in organizations.
The most difficult and important issue in supply chain management is to manage relations
between the four main characters, because they have the tremendous effect on all aspects of
supply chain and its function level. Many firms’ supply chain vulnerability is as a result o f poor
transmission of expectations and behaviors that occur between characters o f the chain
(Dehmorde, Shahraki, Lakzaie, 2010).
In addition, the effective management of relationships is necessary in supply chain that suppliers
and customers work together in a coordinated and integrated way while observing of partnership
principles, communication, information and dialogue. Suppliers and customers should have the
same goals and trust each other (Rajabzadeh, Khadivar, Kazemi, 2007). Supply chain

vulnerabilities may destabilize the dimensions of supply chain relationships thereby affecting
customer satisfaction. The linkage between supply chain vulnerability and customer satisfaction
is hinging on the fact that the supply chain vulnerability compromises product quality, increases
production costs hence price o f a product, causes delay in delivery and makes it impossible for
the firm to exercise flexibility. These elements are Key to customer satisfaction. Therefore a
vulnerable Supply Chain exposes consumers to the Supply Chain Risks.
1.1.2 The Petroleum industry and products in Kenya
The Kenyan petroleum industry was deregulated in late 1994 with the deregulation of retail
prices of petroleum products and of the importation of crude oil and refined products. The
industry could not be fully deregulated mainly because of the market’s dependence on Kenya
Petroleum Refinery Limited for liquefied petroleum gas, and the absence o f a viable
infrastructure for its importation. The Government therefore required oil companies to import
and process crude oil through the refinery to satisfy the requirements for liquid petroleum gas.
The Government later introduced an open tender system for the importation o f crude oil to the
refinery. With this system, a tender for importation of crude oil is awarded to individual
petroleum firms, which then import crude oil for the whole industry and supplies to the other
petroleum firms, Petroleum Insight (3rd Quarter Jun-Sep 2010),
The players in petroleum industry in Kenya are close to sixty in number. The main players in the
industry are: Total Kenya Limited, with 27.5% market share, Kenol Kobil with 19.4%, Kenya
Shell with 16.1%, Libya Oil with 11.7%, Gapco with 6.3% National Oil Corporation Kenya with

4.1% and others with a market share of 19% between January and June 2010, Petroleum Insight
(3rd Quarter Jun-Sep 2010),
The petroleum industry in Kenya concentrates mainly on the downstream business i.c. wholesale
and retailing of oil products. Kenya Petroleum Refineries Limited docs not own any petroleum
products but refines for the players in the petroleum industry. Kenya Pipeline Company only
facilitates transfer of petroleum products to various depots owned by these players in the
country. Petroleum Insight (3rd Quarter Jun-Sep 2010),
The operations of Kenya Petroleum Refineries Limited and Kenya Pipeline Company are
governed by the Energy Regulatory Commission Acts. The Kenya government created the
Energy Regulatory Commission with the mandate of offering stewardship to electricity,
petroleum and new and renewable sub-sectors, KIPPRA report, (2010). Currently, Kenya
imports all its crude oil from global sources.
Governments have employed various policy interventions and strategies to improve access,
ensure security of supply of affordable energy and to achieve efficiency and conservation
(KIPPRA report, 2010). Faced with the uncertain global sources o f crude oil, the Kenya
Government through Energy Regulatory Commission has been regulating fuel prices since
December 2010. Some of the measures aimed at protecting customers have ended up disrupting
petroleum products’ supply chain activities
Supply chain vulnerability can result into customer dissatisfaction. For customer satisfaction to
be achieved, aspects of the supply chain relationships that include communication, trust,
conformity, dependence, commitment and co-operation which connects all the players in the
supply chain need to be enhanced. (Rajabzadeh, Khadivar, Kazemi, 2007). Any factor(s) that
destabilize these dimensions of supply chain relationships will most likely result into customer
dissatisfaction. The Kenyan market for petroleum products has been exposed to some o f these
issues. This has resulted into shortage o f the petroleum products, and rise o f the prices. The
energy regulatory commission has been in place but still, these issues remain unresolved.
A number of studies have been done in the area o f supply chain vulnerability. A study by Peck
(2002), on supply chain vulnerability in the United Kingdom found that Supply chain
vulnerability is an important business issue, and that little research has been undertaken in supply
chain vulnerability. The study also revealed that awareness of the subject is poor; and that there
is a need for a methodology for managing supply chain vulnerability. Studies by Maboudi et al,
2011 and Gilaninia et al 2012 found that supply chain relationships have an impact on customer
satisfaction.
Locally, Abuko (2011) carried out a study to determine the Impact of Green Supply Chain on the
performance of oil marketing firms in Kenya. This study used a survey research design and
sampled 6 respondents from each of the 5 major oil marketing firms. A structured questionnaire
was used to collect data and a multivariate data analysis technique was used. The study found out

Although a number of studies have been done on supply chain management practices, Supply
chain vulnerability and Green supply chain management practices, there is no study that has
given an indication on how supply chain vulnerability in the petroleum industry in Kenya impact
on customer satisfaction on the petroleum products. This is the gap that the current study seeks to
fill.
1.3 Objectives of the Study
The general objective of the study was to evaluate the impact of supply chain vulnerability on
customer satisfaction on petroleum products in Kenya. The specific objectives of the study
were:
i. To determine the factors leading to supply chain vulnerability on the petroleum
products in Kenya
ii. To establish the impact of supply chain vulnerability on customer satisfaction on the
petroleum products in Kenya.

This research project present guideline on managing the petroleum supply chain in the era of
turbulence by embracing volatility as an opportunity. By understanding the nature and the impact
of the volatility, the distributors, may then react by shifting the risk exposure into building
hedges and mitigations into their supply chain design.
The management of the regulators will benefit from this study as it will provide insight about the
problems that have arisen due the regulations.
The government agencies will make use of this study, as it will provide useful knowledge in
formulation o f policies and a regulatory framework for price controls.
Researchers and scholars will use this information to add to their understanding of strategic
supply chain vulnerability management policies.
The study will provide foundation and material for further related research.
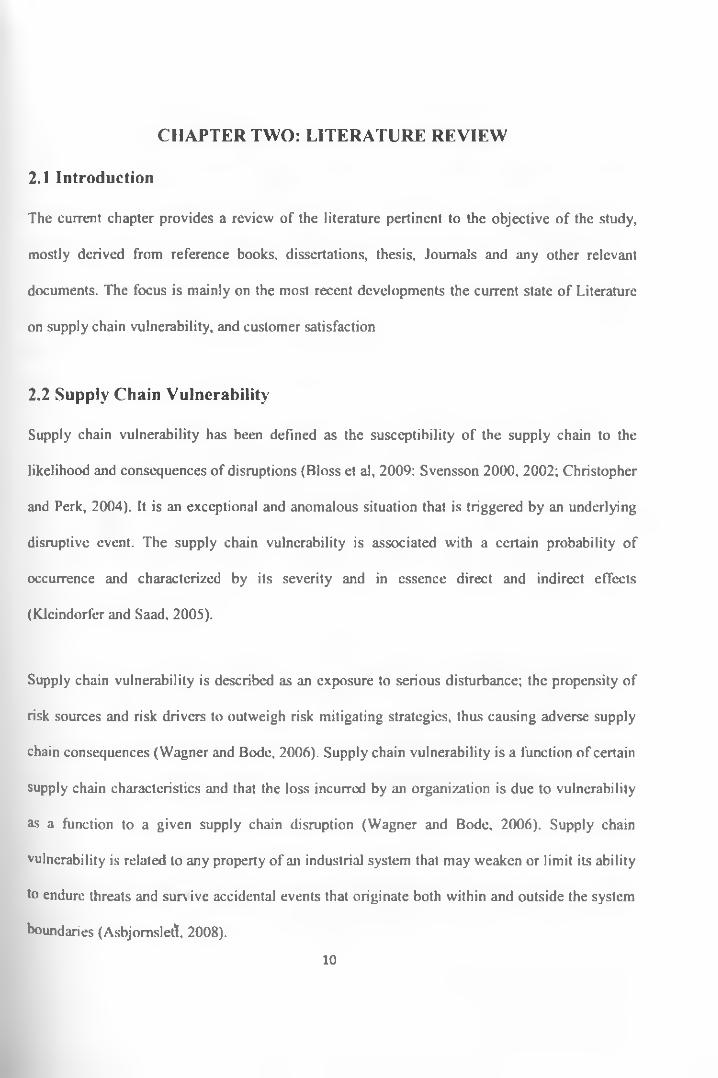
CHAPTER TWO: LITERATURE REVIEW
2.1 Introduction
The current chapter provides a review of the literature pertinent to the objective of the study,
mostly derived from reference books, dissertations, thesis, Journals and any other relevant
documents. The focus is mainly on the most recent developments the current state o f Literature
on supply chain vulnerability, and customer satisfaction
2.2 Supply Chain Vulnerability
Supply chain vulnerability has been defined as the susceptibility of the supply chain to the
likelihood and consequences of disruptions (Bloss et al, 2009: Svensson 2000, 2002; Christopher
and Perk, 2004). It is an exceptional and anomalous situation that is triggered by an underlying
disruptive event. The supply chain vulnerability is associated with a certain probability of
occurrence and characterized by its severity and in essence direct and indirect effects
(KJcindorfer and Saad, 2005).
Supply chain vulnerability is described as an exposure to serious disturbance; the propensity of
risk sources and risk drivers to outweigh risk mitigating strategies, thus causing adverse supply
chain consequences (Wagner and Bode, 2006). Supply chain vulnerability is a function of certain
supply chain characteristics and that the loss incurred by an organization is due to vulnerability
as a function to a given supply chain disruption (Wagner and Bode, 2006). Supply chain
vulnerability is related to any property of an industrial system that may weaken or limit its ability
to endure threats and surv ive accidental events that originate both within and outside the system
boundaries (Asbjomslett, 2008).
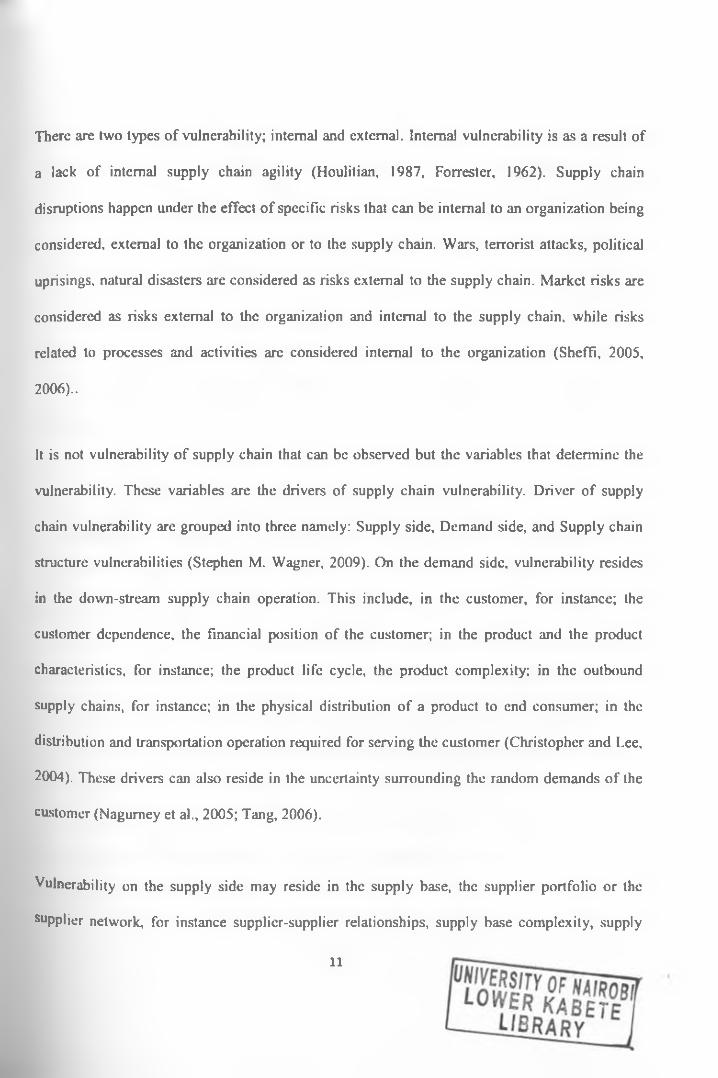
There arc two types of vulnerability; internal and external. Internal vulnerability is as a result of
a lack of internal supply chain agility (Houlitian, 1987, Forrester, 1962). Supply chain
disruptions happen under the effect of specific risks that can be internal to an organization being
considered, external to the organization or to the supply chain. Wars, terrorist attacks, political
uprisings, natural disasters are considered as risks external to the supply chain. Market risks are
considered as risks external to the organization and internal to the supply chain, while risks
related to processes and activities are considered internal to the organization (Sheffi, 2005,
2006)..
It is not vulnerability of supply chain that can be observed but the variables that determine the
vulnerability. These variables are the drivers of supply chain vulnerability. Driver o f supply
chain vulnerability are grouped into three namely: Supply side, Demand side, and Supply chain
structure vulnerabilities (Stephen M. Wagner, 2009). On the demand side, vulnerability resides
in the down-stream supply chain operation. This include, in the customer, for instance; the
customer dependence, the financial position of the customer; in the product and the product
characteristics, for instance; the product life cycle, the product complexity: in the outbound
supply chains, for instance; in the physical distribution o f a product to end consumer; in the
distribution and transportation operation required for serving the customer (Christopher and Lee,
2004). These drivers can also reside in the uncertainty surrounding the random demands of the
customer (Nagumey et al., 2005; Tang, 2006).
Vulnerability on the supply side may reside in the supply base, the supplier portfolio or the
supplier network, for instance supplier-supplier relationships, supply base complexity, supply

base structure (Choi and Hong, 2002; Choi and Krause, 2006; Halikas et al., 2004). When a
supplier in the supply network is vertically integrated by a direct competitor, forcing the
termination o f the relationship with the buying firm it can increase vulnerability (Chopra and
Sodhi, 2004). The characteristics of the individual suppliers in a firm’s supplier portfolio can
also influence supply chain vulnerability. This majorly concerns, in particular, the financial
instability ot suppliers and the consequence of supplier default, insolvency, or bankruptcy
(Babich et al., 2007). The inability ot supplier to adapt to technological or product design
changes may have detrimental effects on the customer’s costs and competitiveness (Zsidisin and
Ellram, 2003).
The supply chain vulnerability drivers that lie on the buyer-supplier interface include
opportunistic behavior from the suppliers, especially in single sourcing procurement. It also
creates dependence on certain suppliers that leave only a limited room for maneuvering for the
procuring firm. (Giunipcro and Eltantawy, 2004; Halikas et al,. 2005; Trevelen and Schweikhart,
1998; Wagner and Johnson, 2004). Supply chain vulnerability originating from supply chain
structure stems largely from the disintegrating supply chains and the global (off shore) sourcing
of value adding activities (Srai and Gregory, 2008). Since globalization requires highly
coordinated llow of information and cash within and across national boundaries (Bowersox and
Calantone, 1998), disruptions can have severe impacts on these flows across national boundaries
and consequently on the supply chain performance (Hendricks and Singhai, 2005; Seshadri and
Subrahma-Nyam. 2005; Wagner and Bode, 2008).

The degree o f external vulnerability is influenced by the complexity o f sourcing and the delivery
and by and large; the uncertainty in demand forecasting. When supply chains have to cover a
large number o f international markets and regions of the world, the more susceptible they are to
the natural and man-made disasters (Manuj and Mentzer, 2008; Myers et al, 2006). Further still,
supply chains contain less slack with lower inventories, fewer buffers and leaner logistics
operation making supply chains more fragile (McGillvray, 2000; Zisidisin et al, 2005). lx>ng and
complex global supply chains are usually slow to respond to changes, and hence, they are more
vulnerable to business disruptions (Tang and Tomlin, 2008). Peck, (2002) noted that supply
chain vulnerability is driven by factors that are both internal and external to the supply chain.
Internal factors that drive supply chain vulnerability are caused by sub-optimal interaction and
co-operation between the entities along the chain. Such supply chain risks result from a lack of
visibility, lack o f ‘ownership’, self-imposed ‘chaos’, just-in-time practices and inaccurate
forecasts. External risks arise from interactions between the supply chain and its environment.
Such interactions include disruptions caused by strikes, terrorism and natural catastrophes. Any
disruption at any stage in a supply chain that can be linked to environmental causes is ascribable
to external risks.
2.3: C auses of Supply Chain Vulnerability
The causes of Supply Chain can be summarized as follows;

Focus on efficiency rather than effectiveness: To attain greater levels o f efficiency in the
supply chain, experience has shown that there is significant opportunity in many sectors of
industry to take out significant cost by focusing on the inventory reduction. Just-in time (JIT)
practices were widely adopted and organizations became increasingly dependent upon suppliers,
Peck (2002). It is therefore argued that when suppliers emphasize more on efficiency and cost
reduction, then the supply chain becomes increasingly vulnerable. Bios et al (2009) notes that the
introduction of new models can result in vulnerability of the supply chain. When models like Just
in time inventory system is introduced, they may eliminate rework process which is an important
aspect in production
The globalization of supply chains: Often, the motivation for off-shore sourcing and
manufacturing is cost, Peck (2002). The result o f these cost- based decisions is often higher level
of risk as a result of extended lead-times, greater buffer stocks and potentially higher levels of
obsolescence. Markwdes and Berge, (1988) identified the trends to the manufacturing offshore
and criticized it as being both unnecessary and risky. They argued that existing manufacturing
capacity could be made more competitive and that the hidden costs of obsolescence, inventory
holding and demand unresponsiveness are risks that counter the headline benefits.
Focused factories and centralized distribution: As a result o f focused factories, production
costs may be lower but the product has to travel greater distances, often across many borders.
Flexibility may be lost because these focused factories tend to be designed to produce in very
large batches to achieve maximum scale of economies. Simultaneously, with this move to fewer
production sites is the tendency to centralize distribution. Forecast driven companies with long
planning horizons and long lead lead-time responses are increasingly vulnerable to wild swings
in demand. Peck (2002)

The trend to outsourcing: Firms have out-sourced distribution, manufacturing, accounting and
information systems for example. There is a strong logic behind outsourcing based upon the
view that organizations are more likely to succeed if they focus on the activities in which they
have a differential advantage over competitors. However, outsourcing brings with it a number of
risks for example, potential loss of control and failure of one of the links in the chain. Jittner,
(2005) notes that outsourcing results in organizational and logistical complexity which results in
organizations becoming more and more dependant on each other thereby enhancing supply chain
vulnerability.
Reduction of the supplier base: Cases exist where major supply chain disruptions have been
caused by a failure at a single source. Blccker et al (2005), observes that the concentration on a
small number of suppliers result in increased supply chain risk because the breakdown o f one of
the suppliers result in the disruption of the whole production process. It also decreases the ability
to compensate disruptions through buffer. Therefore even though there are many benefits to
supplier base reduction, it has to be recognized that it brings with it increased risk. Sometimes a
consolidation of the supply base happens through merger and acquisition. Since the rate of
merger and acquisition has increased so dramatically over recent years, it follows that supply
base reduction will have accelerated if for this reason alone. Peck, (2003)
Volatility of demand: Because firms are still largely forecast driven, with long planning
horizons and long lead-times of response, they are increasingly vulnerable to wild swings in
demand. Peck, (2002). There are many reasons for this increased demand volatility. Some are for
example, shorter life cycles, often driven by technology changes, this means that the risk of
obsolescence increases; higher levels of competitive activity leads to marketing led disturbances
to demand in many consumer markets, increasing variety within product ranges further fragment15

Demand-side risks can originate from the uncertainty surrounding the random demands of the
Customers, Nagumey et al., (2005). Disruptions occur here from a mismatch between a
company’s projections and actual demand as well as from poor supply chain coordination.
Consequence of which are costly shortages, obsolescence, and inefficient capacity utilization.
An important issue in this context, affecting forecast quality and therefore demand-side
disruptions, is the bullwhip effect, which is characterized by an amplification of demand
volatility in the upstream direction of the supply chain
Lack of visibility and control procedures: Lack o f confidence in the supply chain leads to
actions and intervention by managers throughout the supply chain which collectively can
increase the risk. Firms need to understand the elements o f supply chain confidence-visibility
and control; lack o f which, will increase supply chain risk. Peck (2002). ‘Visibility’ refers to the
ability of all members o f a chain to sec from one end o f the pipeline to another; an undistorted
view not clouded by immediate inventories or other barriers to vision, Peck (2002). Lack of
visibility forces supply chain members to rely on forecast and to build buffers which only worsen
the situation. Unfortunately it is often the case that members o f the supply chain do not have
detailed knowledge of what is happening in the rest of the chain - for example, information on
finished goods inventory, material inventory, work-in-process, demand levels, production plans,
capacity, yields, and order status.
Natural Calamities: In many regions o f the world, natural hazards such as tsunamis, droughts,
earthquakes, hurricanes, and floods are a constant threat to societies in general and to firms in
Particular (Helferich and Cook, 2002). The negative consequences on supply chains are obvious

since production facilities and transportation are highly vulnerable to natural disasters. Due to the
globalization of markets and asurge in globe-spanning supply chain operations, local
catastrophes increasingly have indirect global repercussions.
Just in time production system. Just-in-time production (JIT) is a management philosophy that
embraces eliminating all waste and continually upgrading and improving production processes,
Peck (2002). The basic concept o f just-in-time is that materials and supplies are replenished
exactly when they are needed rather than too early or tot) late, thus ensuring an efficient flow of
production. Just-in-time (JIT) reduces the cost of having expensive materials sitting idle while
waiting for production and eliminates the cost of having expensive equipment sitting idle while
waiting for materials, Peck (2002). It also reduces or eliminates related production costs such as
scrap materials, defective products, unnecessary inventory, and wasted space, so that a company
expends the least amount of resource, Blecker et al (2005),
Regulation: A supply chain is vulnerable as influenced by different regulatory factors like
Power/Dependence (Cartwright, 1959; Emerson, 1962), Risk/Uncertainty (Knight, 1921,
Ganeson, 1994), Reliability/Availability (Sandler, 1963; Franlcel, 1988), and Conflict/Control
(Lusch, 1978; Rosdenburg and Stem, 1971, Pfefferand Salancik, 1978).
2.4 Customer Satisfaction
The customer is the one whom the organization is willing to affect his behavior by the values
that are created. Customer satisfaction is an important issue which is related to competition in

global level. The quality o f a product is often associated to customer satisfaction. Therefore,
quality can be as an indicator o f the effectiveness o f customer satisfaction. Customer satisfaction
is a personal approach of the comparison between actual productivity and efficiency expected of
a company (Dehmorde, Shahraki, Lakzae, 2010).
Customer satisfaction is defined as customer’s feelings or attitude towards a product or service
after use. Customer satisfaction leads to the increase o f income and profits through repeat
purchase, the purchase o f new gtxxis and the purchase of goods by customers who have been
encouraged by satisfied customer. Customers who have high satisfaction of an organization give
positive experiences to others. They ad for the organization, as a result, reducing the cost which
is spent to attract customers (Kavandi, Shakeri, 2010).
2.5: Supply Chain Vulnerability and Customer Satisfaction
Ciilaninia et al (2012) identified four main characters in the supply chain which include suppliers,
manufacturers, distributors and customers. Thus, understanding the relationship between the
mentioned groups and efforts to optimize this relationship is the major issue in most
organizations. The elements of customer satisfaction that are likely to be affected by supply
chain vulnerability include; quality, flexibility, delivery speed and price (production cost).
As competition in the globalised world increases, firms are increasingly competing on the basis
of product quality. Customers are frequently exposed to a variety of products and arc without
doubt likely to be loyal to producers of quality products. Any factor(s) therefore that disrupt the

Flexibility is another element that affects customer satisfaction and which may be affected by
supply chain vulnerability. Customers are constantly looking for products that meet their
dynamic tastes and preferences. This means firms have to be prepared at all times to redesign
their products to match the changing tastes and preferences o f their customers. Any factor
disrupting the smooth flow of the supply chain makes it difficult to change its production system
within a short notice.
With the increased demand, customers increasingly become impatient with suppliers who take
long to process their orders. Delivery time has therefore become a major aspect of competitive
advantage that firms cannot afford to overlook. In this light, any disruption o f the supply chain
process would automatically make it impossible for the firm to process and deliver customer
orders within the required timeframe.
A smooth, efficient and effective supply chain process makes it possible for a firm to reduce
wastage and cut down on its production cost. Customers on the other hand, in a competitive
market environment, prefer to pay the lowest price for their required quality.
2.6: Empirical Literature
A study by Peck (2002) of Cranfield university management school in UK on supply chain
vulnerability facing department of transport, local government and other regions in the UK

concluded that there is need for a methodology for managing supply chain vulnerability. The
study observed that Supply chain vulnerability is an important business issue, little research has
been undertaken into supply chain vulnerabilities and that awareness of the subject is poor.
Maboudi et al (2011) sampled out thirty suppliers of Mazandaran Textile Company in a study to
determine the relationship between supply relationship management and customer satisfaction in
textile industry in Iran. The measurement tool was a questionnaire and the relation between two
variables was evaluated by Pearson relation. It observed that the communication management for
the suppliers in textile industry is directly related to the customer satisfaction.
A study was done by Gilaninia (2012) on the impact of supply chain dimension on customer
satisfaction in Iran. The study used field research method to examine correlation between two
independent and dependent variables. Data collection tool of this study was a questionnaire. The
study found that the supply chain dimension has direct relationship with customer satisfaction.
Otila (2011) did a study on the supply chain management practices used in the cosmetic industry
in Kenya. He used a descriptive design and studied all the cosmetic firms in Kenya dealing with
skin care products which are located in Nairobi industrial area. He used both primary and
secondary data. The study found that there is consistent performance measures used across the
supply chain in the cosmetic companies and suppliers are involved in production planning. The
researcher however also found major challenges affecting adoption o f the supply chain e.g.
geographical distance, supply chain disruptions, resistance to supply chain management changes,

lack of adequate resources to implement supply chain initiatives and customer’s geographical
distance.
Abuko, (2011), carried out a study to determine the Impact of Green Supply Chain on the
performance of oil marketing firms in Kenya. This study used a survey research design and
sampled 6 respondents from each of the 5 major oil marketing firms. A structured questionnaire
was used to collect data and a multivariate data analysis technique was used. The study found out
that Green Supply Chain Management practices had positive impact on the overall firms’
performance by improving quality, productivity, efficiency and cost savings.

2.7 Conceptual Framework
The relationship between supply chain vulnerability and customer satisfaction can be
summarized in the conceptual framework below.
Supply Chain Vulnerability Customer Satisfaction
(independent Variables Dependent Variables)
Over emphasis on efficiency Quality
Globalization
Focused factories
Delivery Time
Speed
JIT Flexibility
Centralization Price (Production
Reduction of Supplier base
Demand Volatility
Visibility and Controls
Natural Calamities
Regulation
Cost)
The independent variables are the causes o f supply chain vulnerabilities that include: over
emphasis on the efficiency of the supply chain, globalization of the supply chain, centralization
of the production and distribution system, reduction in supplier base, demand volatility. Just in
time production system, focused factories and centralized distribution systems, visibility and
control procedures in the supply chain, natural calamities and regulation.

The dependent variable is customer satisfaction and include; quality, delivery time, speed,
flexibility, and production cost.
2.8 Summary' of Empirical Literature
Global empirical evidence shows that the dimensions o f supply chain relationships have an effect
on customer satisfaction. (Maboudi et al, 2011; Gilaninia et al 2012).
A Study by Peck (2002) of Cranfield university management school found that even though the
area of supply chain vulnerability is important in business, no research has been done in the area.
Locally, most research work has concentrated on the supply chain management practices and
challenges o f green supply chain management practices. Otila (2011) did a study on the supply
chain management practices used in the cosmetic industry in Kenya. Abuko (2011) carried out a
study to determine the impact of green supply chain on the performance of oil marketing firms in
Kenya. In all these studies, no researcher has studied the effect that supply chain vulnerability
has on customer satisfaction in the petroleum industry in Kenya. There is therefore no
knowledge currently on how supply chain vulnerability impacts on the satisfaction o f customers
in their consumption of petroleum products in Kenya. This study seeks to fill this knowledge
gap.

CHAPTER THREE: RESEARCH METHODOLOGY
3.1 Introduction
This chapter provides a discussion o f the outline of the research methodology that was used in
this study. It focuses on the research design, population of study, sample and sampling
techniques, data collection methods and concludes with the data analysis and data presentation
methods that were used in this study.
3.2 Research DesignThe research design employed in this study was qualitative and descriptive survey method.
According to Cooper and Schindler (2000), descriptive statistics discover and measure cause and
effect relationships among variables. The study used a descriptive design because it enables the
researcher to collect in-depth information about the population being studied. The qualitative
design chosen for this research is theory grounded, or natural inquiry. This design represents
theory that unfolds from the emerging data rather than theory based on prior objectives o f the
study. Grounded theory research unfolds and emerges empirically from the data and is more
responsive to contextual values rather than researcher values.
3.3 Population of the StudyThe population o f study was the companies licensed by energy regulatory commission of Kenya
to distribute petroleum products. Even though these companies are not the ultimate customers of
petroleum products, the researcher preferred to use them considering the fact that they are more
knowledgeable about the supply chain and the challenges faced in the supply chain o f the
petroleum products. Moreover, they are customers at some point in the supply chain of
petroleum products. As at 22nd of August 2012, 50 companies were granted license by energy
regulatory commission to distribute petroleum products at various stages of the supply chain.

Primary data collection method was used. Data was collected via the use of questionnaires as an
interview guide. A structured questionnaire was administered. The questionnaire was based on a
likert scale whereby respondents were required to state whether they strongly agree, agree,
neither agree nor disagree, disagree and strongly disagree.
Cooper and Schindler (2008) observe that a likert scale is reliable and provide a greater volume
of data than any other scales. Likert scale was also used by Abuko (2011) in determining the
input of Green Supply Chain Management Practices on the performance of oil marketing firms in
Kenya.
The drop and pick method was used to collect data. The structured questions were used in an
effort to conserve time and money as well as to facilitate an easier analysis as they are in
immediate usable form. The unstructured questions were used so as to encourage the respondent
to give an in-depth and felt response without feeling held back in revealing of any information.
3.5: Data Analysis
Data wras analyzed using descriptive statistics which arc a vital part of making sense o f the data.
Quantitative method of data analysis was used. Data was coded and thereafter analyzed using
Statistical Package for Social Sciences (SPSS) program and presented using tables and charts to
give a clear picture o f the research findings at a glance.

CHAPTER FOUR: DATA ANALYSIS, FINDINGS OF THE RESEARCHAND DISCUSSIONS
4.1 Introduction
This chapter presents the data analysis, findings and interpretation of the study. The data was
collected from the firms listed by the Energy Regulatory Commission as the official distributors
of petroleum products in Kenya. This w-as then analyzed and presented in form of tables and
figures which are relevant to the objectives of the study.
4.2 Response Rate
The respondents were drawn from a list of registered distributors o f petroleum products as
outlined by the Energy Regulatory Commission. Out of the 50 registered distributors who were
sampled to participate in this study, only 30 responded. This gave a response rate of
approximately 60%. This is an above average rate which indicates that the findings can
adequately be used for generalization.
4.3 Causes of supply chain vulnerability
There are several causes of supply chain vulnerability. These are the factors that can affect the
customer service levels. The researcher asked the respondents to indicate the extent to which
these factors expose their supply chains to vulnerable situations on a likert scale (1^ most likely,
2 = Likely, 3 = Least Likely, 4 = Unlikely). Their responses were as in the table below.

Causes Mean Standard DeviationGlobalization 2.4 2.4Outsourcing 2.3 1.2Natural calamity 2.3 2.3Regulation 2.2 2.2Poor planning 2 2Demand volatility 2 1.6Reduction in supplier base/ single sourcing
1.7 1.7
Just in time 1.7 0.8Lack of control procedure 1.5 1.5Focused factories and centralize distribution systems
1.5 2
From the findings from table 4.1 above, the likely (mean > 2.0), all the 10 causes studied like
Globalization, Natural calamity. Outsourcing trends, Regulation, Poor Planning, Demand
volatility, Just in time production systems, Reduction in supplier base/single sourcing, Focused
factories and Centralized distributing systems, and Lack o f control procedures are rated by the
respondents as the likely causes o f supply chain vulnerability. The mean response from the
respondents ranges from 1.5 to 2.4; give an average of 2, (likely). This finding is in line with the
studies done by. Bleckcr et al (2005), Jittner, (2005), Nagumey et al, (2005), Peck, (2002), Bloss
ct al, (2009) and Markwdes and Berge, (1988). All these studies indentified natural calamity, just
in time production systems, demand volatilities, outsourcing trends, focus on efficiencies rather
than effectiveness, poor planning, globalization, visibilities and lack of control procedures,
regulations and reduction in supplier base/single sourcing.
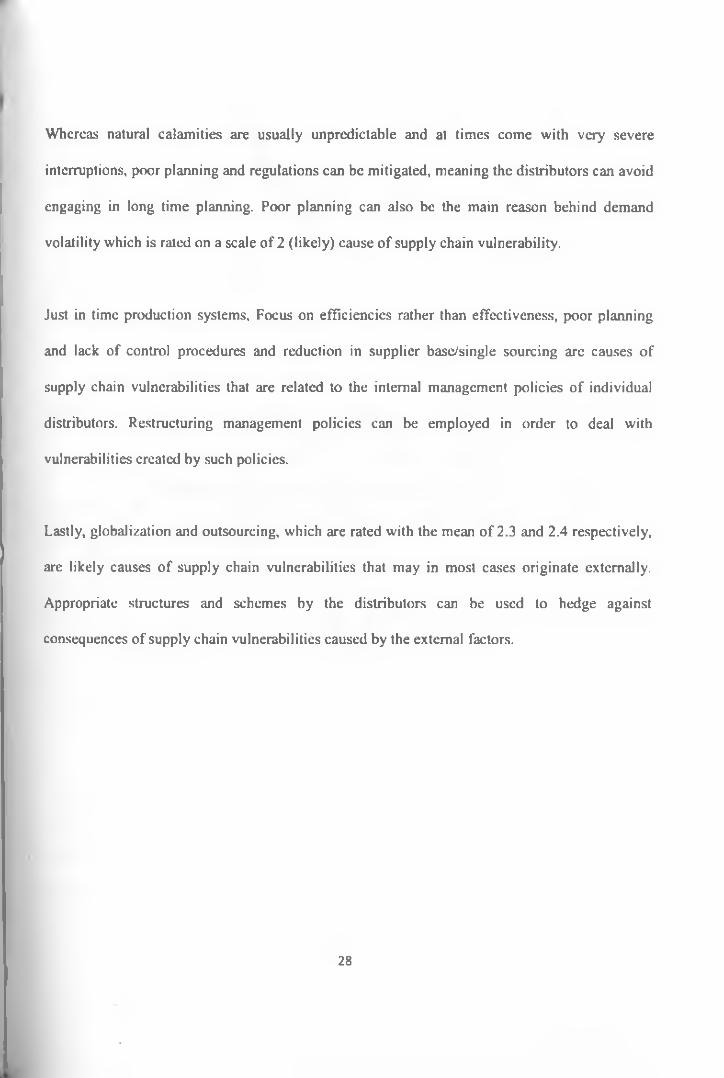
Whereas natural calamities are usually unpredictable and at times come with very severe
interruptions, poor planning and regulations can be mitigated, meaning the distributors can avoid
engaging in long time planning. Poor planning can also be the main reason behind demand
volatility which is rated on a scale of 2 (likely) cause o f supply chain vulnerability.
Just in time production systems. Focus on efficiencies rather than effectiveness, poor planning
and lack of control procedures and reduction in supplier basc/single sourcing are causes of
supply chain vulnerabilities that are related to the internal management policies o f individual
distributors. Restructuring management policies can be employed in order to deal with
vulnerabilities created by such policies.
Lastly, globalization and outsourcing, which are rated with the mean o f 2.3 and 2.4 respectively,
are likely causes o f supply chain vulnerabilities that may in most cases originate externally.
Appropriate structures and schemes by the distributors can be used to hedge against
consequences of supply chain vulnerabilities caused by the external factors.

The causes of supply chain vulnerability have different levels of impact on customer satisfaction
elements of price, speed, quality, delivery time and flexibility. The researcher asked the
respondents to state if they agree that the given factor affects customer satisfaction elements and
secondly, if they agree that the stated cause affects customer satisfaction elements, to rank them
on a likert scale o f 1- Very much, 2- Much, 3- Not much, 4- Not at all. Their responses were as
on the table below.
Table: 4. 2: Perception o f the respondents on effects o f S C V causes on custom er satisfaction
Price Speed Quality DeliveryTime
Flexibility
Mean STD Mean S ID Mean STD Mean STD Mean STDNatural Calamity 1.2 0.41 1.4 0.49 1.5 0.57 1.2 0.48 1.4 0.61Just in time 1.3 0.30 0.4 0.3 1.7 0.4 1.5 0.5 1.5 0.3Demand Volatility 1.4 0.50 1.2 0.1 0.3 0.6 1.2 0.4 1.4 0.5Outsourcing 1.2 0.48 1.2 0.43 1.3 0.55 1.3 0.45 1.3 0.61Focus on Efficiency 1.4 0.5 1.0 0.0 1.3 0.48 1.3 0.47 1.6 0.68Poor planning 1.4 0.5 1.7 0.3 1.4 0.5 1.2 0.4 1.1 0.3Globalization 1.2 0.40 1.4 0.57 1.4 0.50 1.4 0.61 1.4 0.5Lack of control procedure
1.4 0.56 1.6 0.67 1.4 0.49 1.3 0.59 1.3 0.66
^egujation 1.3 0.45 1.4 0.55 1.3 0.47 1.5 0.63 1.4 0.68Reduction in supplier
single sourcing1.3 0.48 1.4 0.57 1.4 0.57 1.5 0.63 1.5 0.57
From the table 4.2 above, the respondents interviewed indicated that even though all the factors
listed as causes of supply chain vulnerability actually cause supply chain vulnerability, different
factors impact differently on the customer satisfaction elements. All the ten factors are rated as
most likely (Mean > 1.0) having an impact on the customer satisfaction element of price, quality,
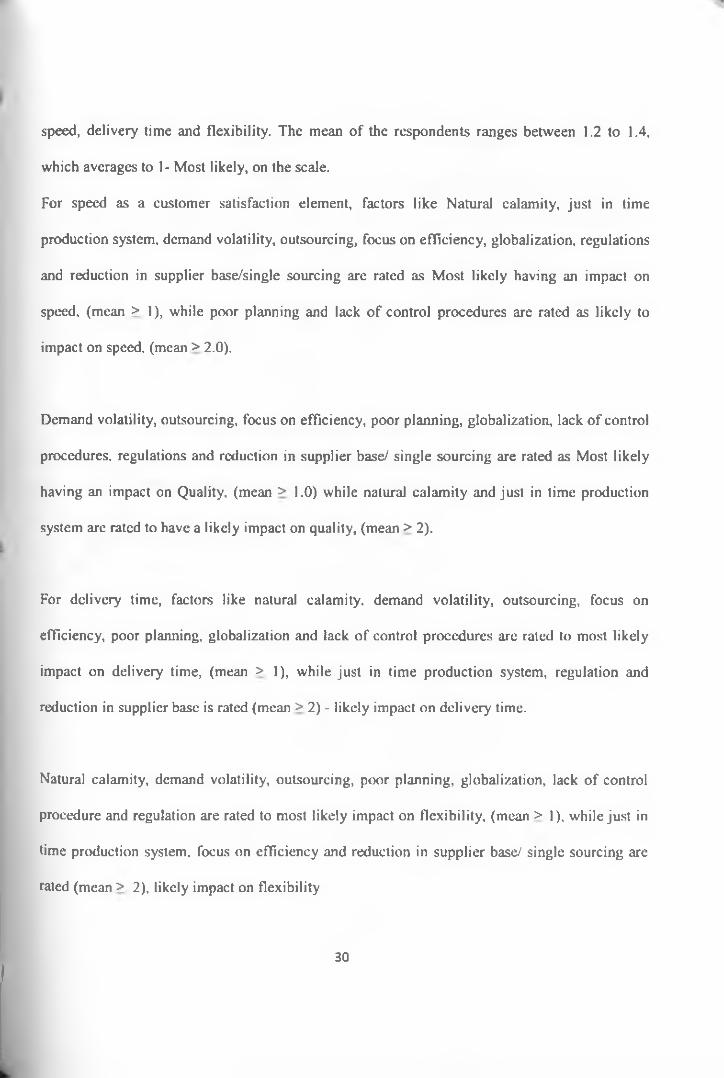
For speed as a customer satisfaction element, factors like Natural calamity, just in time
production system, demand volatility, outsourcing, focus on efficiency, globalization, regulations
and reduction in supplier base/single sourcing are rated as Most likely having an impact on
speed, (mean > 1), while poor planning and lack o f control procedures are rated as likely to
impact on speed, (mean > 2.0).
Demand volatility, outsourcing, focus on efficiency, poor planning, globalization, lack o f control
procedures, regulations and reduction in supplier base/ single sourcing are rated as Most likely
having an impact on Quality, (mean > 1.0) while natural calamity and just in time production
system are rated to have a likely impact on quality, (mean > 2).
For delivery time, factors like natural calamity, demand volatility, outsourcing, focus on
efficiency, poor planning, globalization and lack of control procedures are rated to most likely
impact on delivery time, (mean > 1), while just in time production system, regulation and
reduction in supplier base is rated (mean > 2) - likely impact on delivery time.
Natural calamity, demand volatility, outsourcing, ptxir planning, globalization, lack of control
procedure and regulation are rated to most likely impact on flexibility, (mean > 1), while just in
time production system, focus on efficiency and reduction in supplier base/ single sourcing are
rated (mean > 2), likely impact on flexibility

The researcher obtained the total score per the respondent ratings based on the likert scale (1 =
most likely, 2 = Likely, 3 = Least Likely, 4 = Unlikely) to calculate the supply chain
vulnerability index. The researcher also obtained the total score per the respondents on the extent
to which they felt that the causes of supply chain vulnerability impact on the customer
satisfaction elements of price, quality, speed, delivery time and flexibility; this was used to
calculate the consumer satisfaction index. The indices are represented in a table as below.
Table: 4. 3: Supply Chain Vulnerability and Customer dissatisfaction indices
SC VI 0.69 0.75 0.64 0.67 0.75 0.89 0.72 0.81 0.67 0.89 0.64 0.81 0.89 0.75 0.69
CDI 0.47 0.54 0.55 0.66 0.74 0.79 0.54 0.56 0.63 0.77 0.54 0.67 0.68 0.61 0.52
SCVT 0.72 0.92 0.81 0.56 0.76 0.45 0.88 0.70 0.80 0.76 0.67 0.45 0.57 0.63 0.87
CDI 0.71 0.53 0.55 0.50 0.78 0.54 0.90 0.65 0.78 0.68 0.80 0.60 0.45 0.75 0.78
The indices obtained were then used to run a regression whose results arc relayed on the tables
below.

R R SquareAdjusted R Square
Std. Error of the Estimate
.509a .259 .233 .11053
From the table 4.4 above, R square = 0.259. This means that about 26% of the causes of customer
dissatisfaction can be attributed to causes of supply chain vulnerability
Table: 4. 5: Analysis o f variance
ModelSum of Squares Df Mean Square F S>g.
I Regression .120 1 .120 9.791 .004“Residual .342 28 .012
Total .462 29
The F-value is 9.791 while the F-critical is 0.004 meaning the model is accurate and reliable.
This is shown by the table 4.5 above.
Table: 4. 6: Coefficients o f Regression analysis
Model
UnstandardizedCoefficients
StandardizedCoefficients
t Sig.B Std. Error Beta
1 (Constant)
Supply Chain Vulnerability Index
.245
.525
.124
.168 .509
1.979
3.129
.058
.004
From the table 4.6 above, results of regression analysis show that there is a positive and
significant relationship between customer dissatisfaction and causes of supply chain vulnerability
as shown by the predictor coefficient pi = 0.525.
The t- value is 3.129 while the t-critical is 0.004 meaning the predictor coefficient is significant.32

CHAPTER FIVE
SUMMARY, CONCLUSIONS AND RECCOMENDATIONS
5.1 Summary
The study sought to evaluate the impact of supply chain vulnerability on customer satisfaction on
petroleum products in Kenya. In the study, all the 50 registered petroleum distributing companies
in Kenya were targeted, however, only 30 respondents returned the questionnaires sent to them.
Questionnaires were administered using drop and pick method. Supply chain vulnerability and
customer satisfaction indices were generated from the responses of the respondents. Regression
analysis was used to analyses the impact o f supply chain vulnerability on customer satisfaction.
The study found that all the ten causes of supply chain vulnerability listed, like natural calamity,
globalization, just in time production system, demand volatility outsourcing, reduction in
supplier base/ single sourcing, poor planning, lack of control procedures and regulation affect all
the elements of customer satisfaction i.e. price, speed, delivery time, quality and flexibility.
Results of regression analysis found out that supply chain vulnerability creates customer
dissatisfaction.
5.2 Conclusions and Recommendations
This study concludes that supply chain vulnerability has a significant and positive effect on
customer dissatisfaction and that as company experiences supply chain vulnerability in their
distribution system, their customers increasingly become dissatisfied.
For example, putting in place buffer stock to cushion the company against the effect o f natural
calamities, and demand volatility. Companies should also put in place adequate control
mechanisms and widen their supplier base in order to deal with the problems associated with lag
in supply due to globalization and outsourcing. The companies should also have proper sourcing
plans and buffer stock to hedge against demand volatility. In case of companies focused on
efficiency and employing just in time production system, adequate planning and proper control
procedures on their processes can cushion their customers against the effects o f supply chain
vulnerability.
5.3 Limitations of the research
In the process of carrying out this study, a number of setbacks were encountered which may limit
the findings. One of such limitations include the fact that while the study intended to collect data
from all the petroleum distributing companies in Kenya, only 30 companies responded and as
such the results are limited to only the 30 companies.
Secondly, due to time and financial constraints, the researcher only considered nine causes of
supply chain vulnerability namely, natural calamity, just in time production system, demand
volatility, outsourcing, reduction in supplier base, poor planning, globalization, lack of control
procedures and regulations. The researcher however acknowledges that there are many other
Causes of supply chain vulnerability that if considered would probably change the results of the
study.
5.4 Suggestions for further Research
This study seeks to determine the impact of supply chain vulnerability on customer satisfaction
among petroleum distributing companies in Kenya. Generally, the study found that supply chain
vulnerability causes customer dissatisfaction. The researcher suggests that further research could
be done to determine the effect of supply chain vulnerability on customer satisfaction in the
entire energy sector.
Research could also be done to determine the effect that supply chain vulnerability has on the
financial performance of petroleum companies in Kenya.

APPENDIX 1: QUESTIONNAIRE
SECTION A: Background Information
Designation of Respondent.................................................................................
Number of years in Operation............................................................................
Current Number of Branches.............................................................................
SECTION B: Causes of Supply Chain Vulnerability
Please rank the following factors in the order in which they most cause supply chain vulnerability. (1-Most likely; 2-Likely; 3-Least Likely; 4-Unlikcly)
RANKCAUSES OF SCV
1 2 3 4
Natural calamities
Just in Time production systems
Demand Volatility
Outsourcing
Reduction in Supplier Base/Single Sourcing
Focused factories and centralized distribution systems
Globalization
Lack of Control Procedures
Regulation
Focus on efficiency

SECTION C: Vulnerability and Custom er Satisfaction
1. a. In your opinion, does the following cause of supply chain vulnerability affect customer satisfaction? YES/NO/INDIFFERENT
CSCV - NATURAL CALAMITY Yes No IndifferentCSE - Price
SpeedQuality-Delivery Time
FlexibilityOthers
1. b. If Yes in la above, then, On a scale of I - 4 (1-Very much; 2-Much; 3-Not much;4-Not at all) Indicate the extent to which natural calamity impacts on these elements of customer satisfaction.
1 2 3 4CSE - Price
SpeedQuality
Delivery TimeFlexibility’Others
2. a. In your opinion, does the following cause of supply chain vulnerability affect customer satisfaction? YES/NO/INDIFFERENT
CSCV - GLOBALIZATION Yes No IndifferentCSE - Price
SpeedQualityDelivery Time
FlexibilityOthers
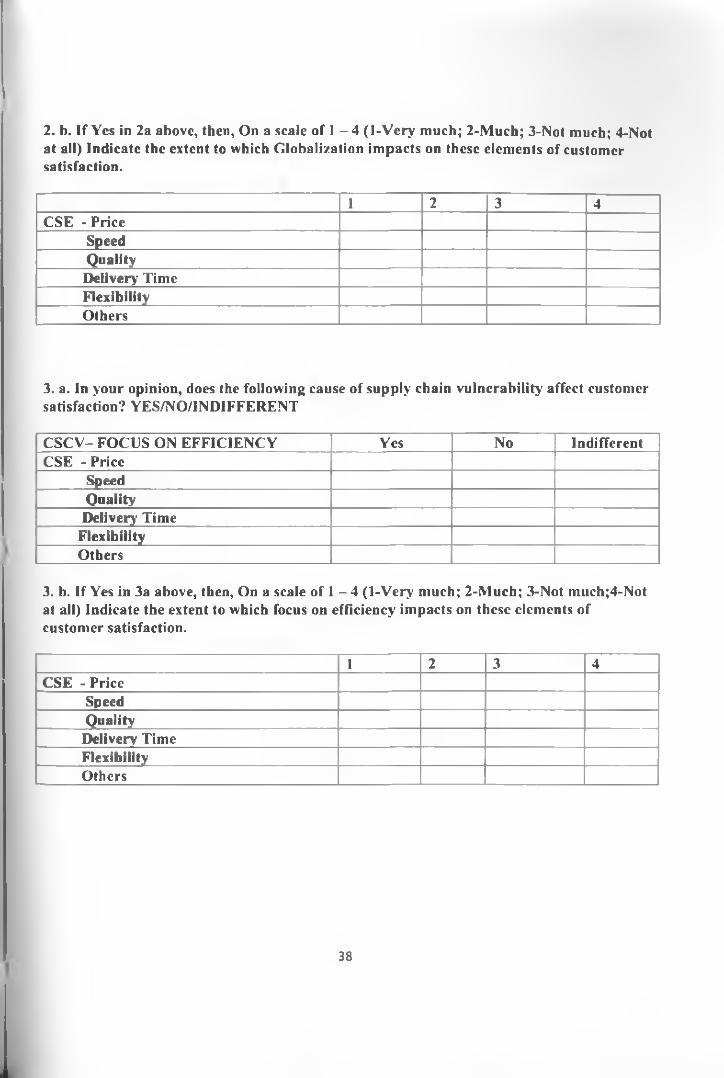
I 2 3 4CSE - Price
SpeedQualityDelivery' TimeFlexibilityOthers
3. a. In your opinion, does the following cause of supply chain vulnerability affect customer satisfaction? YES/NO/INDIFFERENT
CSCV- FOCUS ON EFFICIENCY Yes No IndifferentCSE - Price
SpeedQuality
Delivery' TimeFlexibilityOthers
3. b. If Yes in 3a above, then, On a scale of I - 4 (1-Very much; 2-Much; 3-Not much;4-Not at all) Indicate the extent to which focus on efficiency impacts on these elements of customer satisfaction.
1 2 3 4CSE - Price
SpeedQuality
Delivery TimeFlexibilityOthers

CSCV - OUTSOURCING TRENDS Yes No IndifferentCSE - Price
SpeedQualityDelivery Time
FlexibilityOthers
4. b. If Yes in 4a above, then. On a scale of 1 - 4 (1-Very much; 2-Much; 3-Not much;4-Not at all) Indicate the extent to which outsourcing trends impacts on these elements of customer satisfaction.
1 2 3 4CSE - Price
SpeedQualityDelivery TimeFlexibilityOthers
5. a. In your opinion, does the following cause of supply chain vulnerability affect customer satisfaction? YES/NO/INDIFFERENT
CSCV- REDUCTION IN SUPPLIER BASE Yes No Indifferent
CSE - PriceSpeedQualityDelivery' Time
FlexibilityOthers

1 2 3 4CSE - Price
SpeedQuality
Delivery TimeFlexibilityOthers
6. a. In your opinion, does the following cause of supply chain vulnerability affect customer satisfaction? YES/NO/INDIFFERENT
CSCV- VISIBILITY AND CONTROL PROCEDURE Yes No Indifferent
CSE - PriceSpeedQuality
Delivery TimeFlexibilityOthers
6. b. If Yes in 6a above, then, On a scale of 1 - 4 (I-Vcry much; 2-Much; 3-Not much;4-Not at all) Indicate the extent to which visibility and control procedure impacts on these elements of customer satisfaction.
1 2 3 4CSE - Price
SpeedQuality
Delivery rimeFlcxibilitvOthers 1 1

CSCV-REGULATION Yes No IndifferentCSE - Price
SpeedQualityDelivery Time
FlexibilityOthers
7. b. If Yes in 7a above, then, On a scale of 1 - 4 (1-Very much; 2-Much; 3-Not much;4-Not at all) Indicate the extent to which regulation impacts on these elements of customer satisfaction.
1 2 3 4CSE - Price
SpeedQuality
Delivery TimeFlexibilityOthers
8. a. In your opinion, does the following cause of supply chain vulnerability affect customer satisfaction? YES/NO/INDIFFERENT
CSCV- DEMAND VOLATILITY Yes No IndifferentCSE - Price
SpeedQualityDelivery Time
FlexibilityOthers
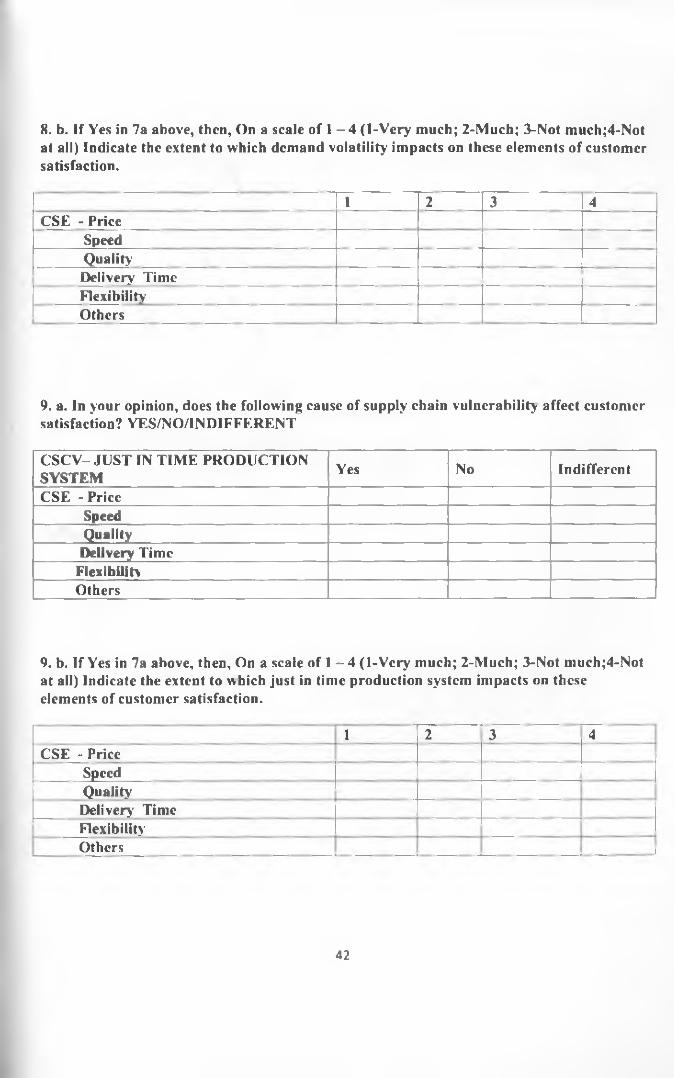
1 2 3 4CSE - Price
SpeedQuality
Delivery TimeFlexibilityOthers
9. a. In your opinion, does the following cause of supply chain vulnerability affect customer satisfaction? YES/NO/IN DIFFERENT
C SC V -JU ST IN TIM E PRODUCTION SYSTEM Yes No Indifferent
CSE - PriceSpeedQualityDelivery Time
FlexibilityOthers
9. b. If Yes in 7a above, then, On a scale of 1 - 4 (1-Vcry much; 2-Much; 3-Not much;4-Not at all) Indicate the extent to which just in time production system impacts on these elements of customer satisfaction.
i 2 3 4CSE - Price
SpeedQuality
Delivery' TimeFlexibilityOthers 1

>CV- FOCUSED FACTORIES AND ENTRALIZED DISTRIBUTION['STEMS
Yes No Indifferent
•iE - PriceSpeedQuality
Delivery TimeFlexibilityOthers
. b. If Yes in 7a above, then, On a scale of 1 - 4 (1-Very much; 2-Much; 3-Not much;4- )t at all) Indicate the extent to which just in time production system impacts on these •ments of customer satisfaction.
1 2 3 4>E - Price
SpeedQualityDelivery TimeFlexibilityOthers

SECTION D:
Please indicate other factors which in your opinion drive supply chain vulnerability

APPENDIX II: List of Companies distributing Petroleum Products in Kenya
Atria Multipurpose Enterprise
Black Sea Petroleum Limited
Chirayu Agencies
Cyn Energy Company Limited
Diesel Power Company Limited
Dollarline Services Limited
Dynergy Enterprises
Euro Petroleum Products E.A. Limited
Famus Trading Enterprises
Fast Energy Limited
Flexon Oil Kenya Limited
Frelas Limited
Futures Energy Company Limited
Generation Petroleum Limited
Gulf Energy Limited
Hashi Energy Limited
Heller petroleum Limited
Jilk Petroleum Limited
Jipa Oil Company Limited
Kamkis Trading Company Limited
KcnolKobil Limited

Kenya Petroleum Refineries Limited
Kenya Shell Limited
Lubeschem Kenya Limited
Lubesol Kenya Limited
Majestic Petroleum Enterprises and General Merchandise Limited
Meifam Petroleum Limited
Ocean Energy Limited
Oceanic Oil Limited
One petroleum Limited
Orlando Energy Limited
Osgafre Petroleum Company Limited
Packfuels Limited
Partex Petroleum (K) Limited
Pat Key Energy Limited
Plan and Trend (EA) Limited
Premium Petroleum Company Limited
Prime Regional Supplies Limited
Prisko Petroleum Network Limited
SAS Energy Limited
Sepyana Oil East Africa Limited
Scydou Resources Limited
Shreeji Petroleum Investments
Tech-Energy Company Limited

Towba Petroleum Company Limited
Trans African Energy Limited
Transoceanic Development Project (Kenya) Limited
Tetra Oil Limited
Ultra Petroleum Limited
VTT1 Kenya Limited

REFERENCES
Abuka, A. A (2011), Impact of Green Supply Chain Management on Performance of oil Companies in Kenya, Unpublished MBA Project. School of Business. University of Nairobi
Briano, E., Caballini, C. and Revetria, R. (2009), “Literature Review about supply chain
vulnerability and resilience”, Proceedings of the 8” WSEAS International Conference on System
Science and Simulation in Engineering, PP 191-7.
Christopher, M and Lee H, (2004), “Mitigating Supply chain risk through improved confidence",
International Journal of Physical Distribution & Logistics Management, Vol. 34 No, 5, pp. 3868.
Christopher, M. and Peck, H. (2004) “ Building the resilient supply chain”. The International
Journal of Logistics Management, Vol. 15 No. 2 pp 1-13
Cooper, D. R., & Schindler, P.S. (2006), Business Research Methods, McGraw Hill, New Delhi
Cranfield University School of Management (2003), Creating Resilient Supply Chains: A
Practical Guide. Department o f Transport, Cranfield School of Management, Cranfield.
Cranfield University School of Management (2002). Supply Chain Vulnerability. An Executive
Report to the Ministry of Transport, Local Government. Government o f the United Kingdom.
Fomell et al “ The American Customer Satisfaction Index: Nature, Purpose and Findings,’
Journal of Marketing. Vol 60, No. 4:1996, pp 7-18.
Fomell, C. (1992). A National customer satisfaction barometer: the Swedish experience. J.
Mark., 56, 6-21
Francis, V. (2008), “Supply Chain Visibility: lost in translation?” Supply Chain Management:
An International Journal, Vol 13 No. 3 pp. 180-4.
Fynes, B., Voss, C., and de Burca, S.( 2005). 'The Impact o f Supply Chain Relationship Quality on Quality Performance", International Journal o f Production Economics, Vol 96, No. 3, pp. 339-354.
Gilaninia ct al (2012). Impact of Supply Chain Dimensions on Customer Satisfaction. Arabian
Journal o f Business and M anagem ent Review• Vol. 1. No. 5; January 2012
Jittncr, U. (2005), “ Supply chain risk management- understanding the business requirements
from a practitioner perspective,” International Journal of Logistics Management, Vol 16 No 1 pp
120-141
Jittncr, U., Peck, H. and Christopher, M. (203), “ Supply chain risk management: model on improvement of service quality to customers and develop the main components. Journal o f Business, volume 43, pp. 185.
Kavandi, R. and Shakeri, F..(2009). To enhance customer satisfaction for sales and after sales services of Iran Khodro. Iranian Journal o f Technolog}’ M anagement, Humanities, Islam ic Azad University o f Sanandaj. Volume 14, pp.44.
Kavandi, Reza and Shakeri, Fatemch. (2009). To enhance customer satisfaction for sales and aftersales services of Iran Khodro. Iranian Journal o f Technology M anagement, Humanities, Islam ic A zad University o f Sanandaj. Volume 14, pp.44.
LaBarbera, P. A., & Mazursky, D. (1993). A Longitudinal Assessment of Consumer Satisfaction,
Dissatisfaction: the Dynamic Aspect of Cognitive Process. Journal of Marketing Research. 20,
393-404
Levesque, T., & McDougall, G.H.G (1996). Determinants of Customer satisfaction in Retail
Banking. Int. J. Bank. Mark. 14(7), 12-20
Maboodi, et al (2010). The effect of applying supply chain management on customer satisfaction in the textile industry, Iranian Journal o f Textile Science and Technology Research. Volume I. pp. 13.
Manuj, I. and Mentzer, J. (2008a), “ Global Supply Chain risk management strategies”.
International Journal of Physical Distribution & Logistics Management, Vol 38 No3,pp 192-223
Manuj. I. and Mentzer, J. (2008b), “ Global Supply Chain risk management, “Journal of
Operations and Production Management, Vol 29 No 1, pp 1433-55
National Oil Company of Kenya website www.nockenva.co.ke
Otila, G.O (2011). Supply Chain Manangemcnt Practices Used in the Cosmetic Industry in
Kenya. Unpublished MBA Project, School o f Business. University o f Nairobi
Peck (2002). Supply Chain Vulnerability. An Executive Report to the ministry o f Transport,
Local Government. Government of United Kingdom.
Peck, H. (2005), “Drivers of Supply Chain Vulnerability: an integrated framework” International
Journal of Physical Distribution & Logistics Management, Vol. 34
Peck, H. (2006) “ Reconciling supply chain vulnerability risk and supply chain management,”
International Journal of Logistics Research and Applications, Vol 9 No. 2 pp.. 127-42
Rajabzadeh, AJ. Khadivar, A.and Kazemi, A..(2007). The effect o f supply chain model on improvement of service quality to customers and develop the main components. Journal o f Business, volume 43, pp. 185.
Svensson El. (2002), “A conceptual framework for the analysis o f vulnerability in firms-
inbound- and outbound logistics flows,” International Journal of Physical Distribution &
Logistics Management, Vol. 32 No 2, pp.l 10-34
Svensson, G. (2000), “ A conceptual framework for the analysis of vulnerability in supply
chains”, International Journal of Physical Distribution & Logistics Management, Vol. 27 No 7,
pp.73 1-49
Taylor, S. A., & Baker, T. L.(1994). An assessment of the relationship between service quality
and customer satisfaction in the formation of consumers’ purchase intentions. J. Retailing.,
70(2), 163-178

Thomas W. & Ben W. (2008). Supply chain Management Definition and Solutions
Van der Vorst, J. and Beulens, A. (2002), “Identifying sources of uncertainty to generate supply
chain redesign and strategies,” International Journal of physical Distribution & Logistics
Management, Vol. 32 No. 6. pp. 409-3 0.
Wagner, S. and Bode, C. (2006), “An empirical investigation into supply chain vulnerability,”
Journal of Purchasing & Supply Management, Vol. 12. No. 6, pp. 301- 12.


