
Supplementary information
The CRAPome: a Contaminant Repository for Affinity Purification Mass Spectrometry Data
D. Mellacheruvu, Z. Wright, A. L. Couzens, J.-‐P. Lambert, N. St-‐Denis, T. Li, Y. V. Miteva, S. Hauri, M. E. Sardiu, T. Y. Low, V. A. Halim, R. D. Bagshaw, N. C. Hubner, A. al-‐Hakim, A. Bouchard, D. Faubert, D. Fermin, W. H. Dunham, M. Goudreault, Z.-‐Y. Lin, B. Gonzalez Badillo, T. Pawson, D. Durocher, B. Coulombe, R. Aebersold, G. Superti-‐Furga, J. Colinge, A. J. R. Heck, H.
Choi, M. Gstaiger, S. Mohammed, I. M. Cristea, K. L. Bennett, M. P. Washburn, B. Raught, R. M. Ewing, A.-‐C. Gingras* and A. I. Nesvizhskii*
*Address correspondence to: [email protected], [email protected]
Supplementary Figures Supplementary Figure 1: Database schema page 2
Supplementary Figure 2: Effect of SAINT options on the results page 3 The number of interactions in iRefIndex is shown in relation to the different sets of SAINT options employed for the analysis of the four bait benchmark test data. The options tested here were minFold (on/off) and norm (on/off). As described in Choi et al., Current Protocols in Bioinformatics, 2012, as well as in the Supplementary Note, minFold “on” forces a separation between the true and false distributions, and norm “on” normalizes the data in relation to the total number of identified spectra in the sample. Both of these options allow for conservative scoring, but they may induce a loss in sensitivity. Systematically testing different parameters allows for a more enlightened selection of the optimal parameters for SAINT filtering in a particular dataset. Here, we found that turning minFold “off” while keeping norm “on” performed slightly better; this is due to the fact that some true interaction partners for MEPCE and EIF4A2 are found at reduced levels in the control runs.
Supplementary Tables Supplementary Table 1: page 4
Controlled vocabularies and values in the CRAPome
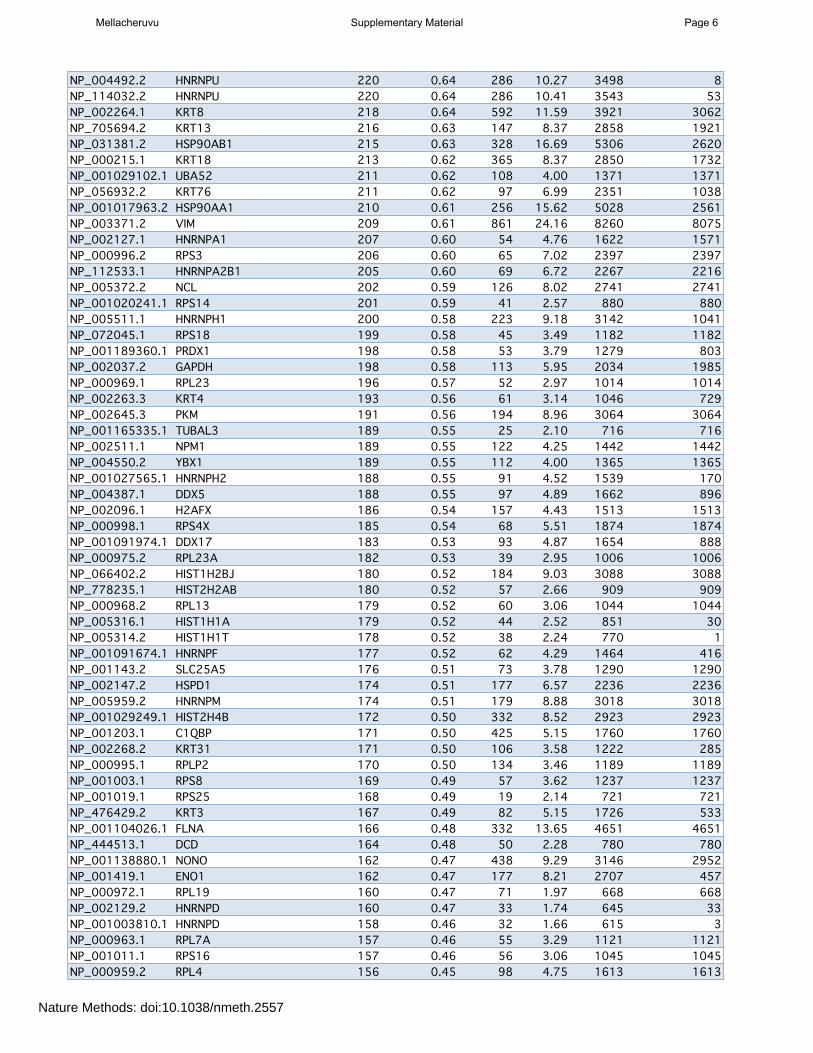
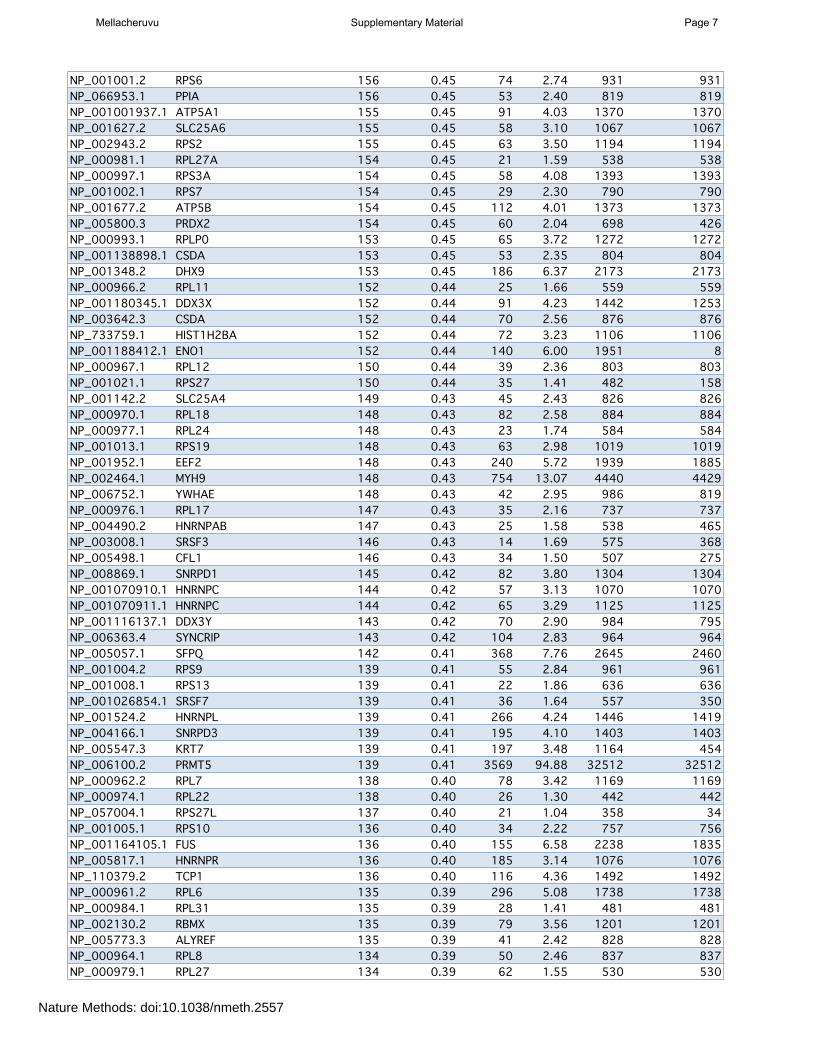
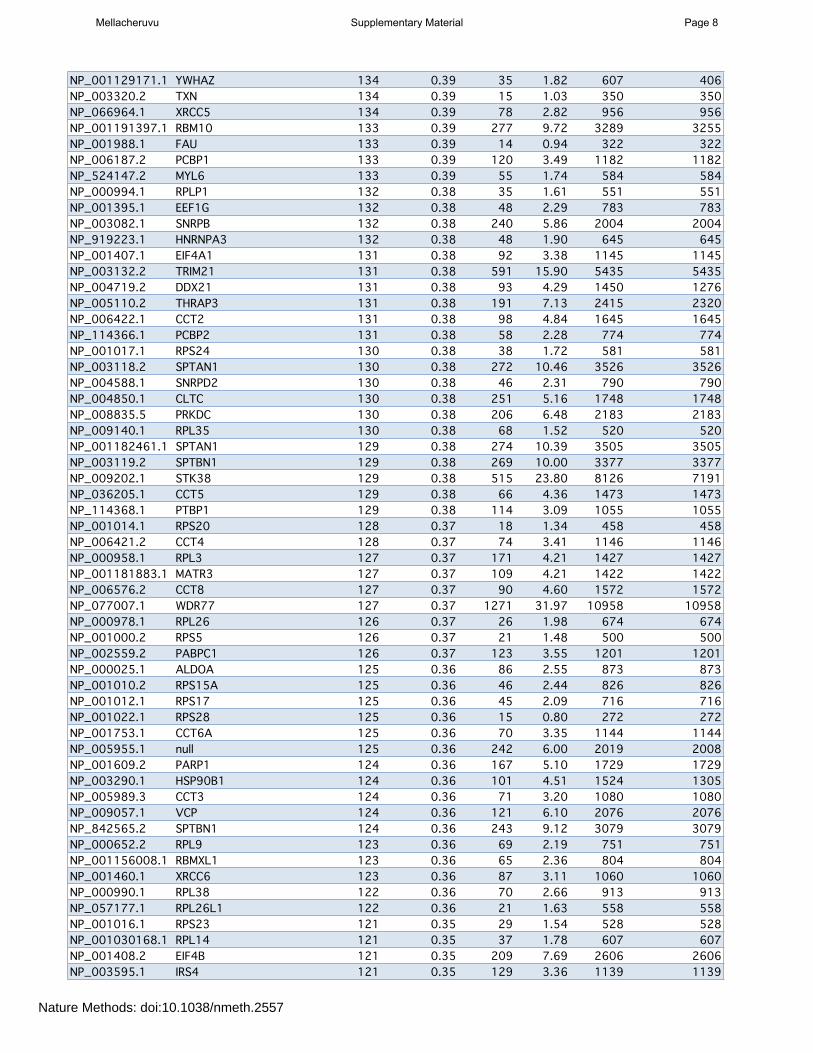
Supplementary Table 2: page 5 List of the most frequently detected proteins across the entire dataset (H. sapiens); reduced list. Only the top entries are shown; see “Supplementary data” section on the www.crapome.org for full list.
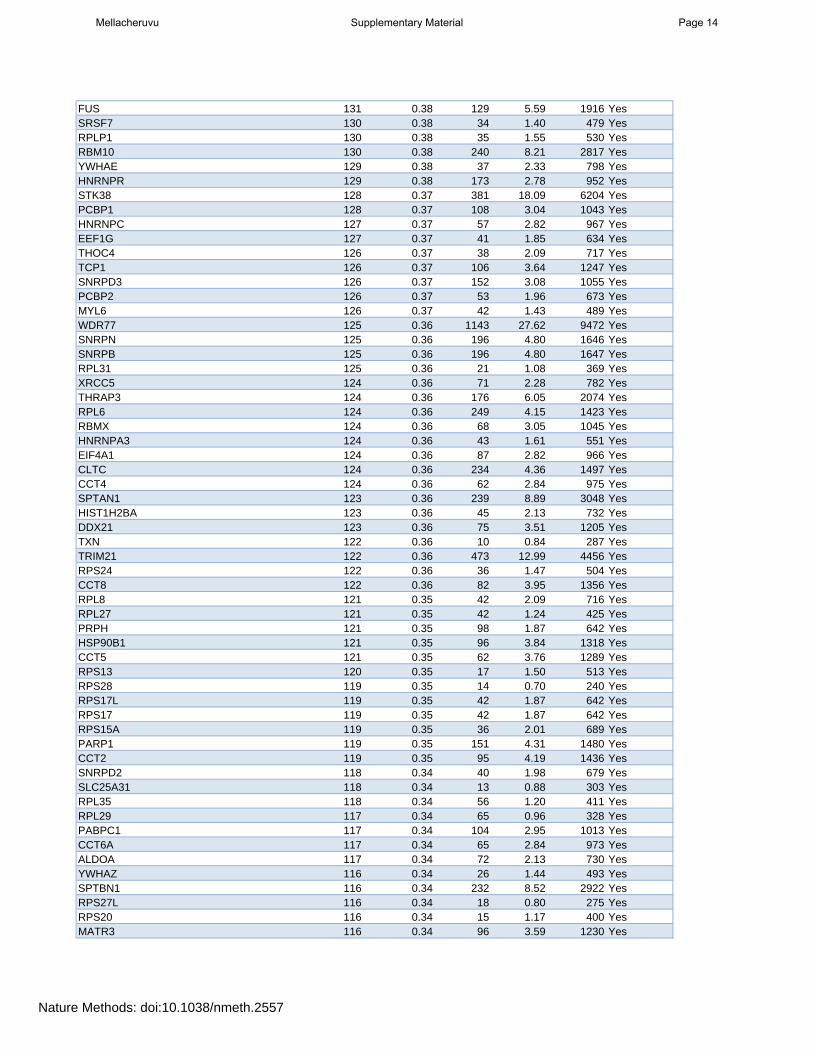
Supplementary Table 3: page 10 List of the most frequently detected proteins across the entire dataset (H. sapiens); redundant list. Only the top entries are shown; see “Supplementary data” section on the www.crapome.org for full list
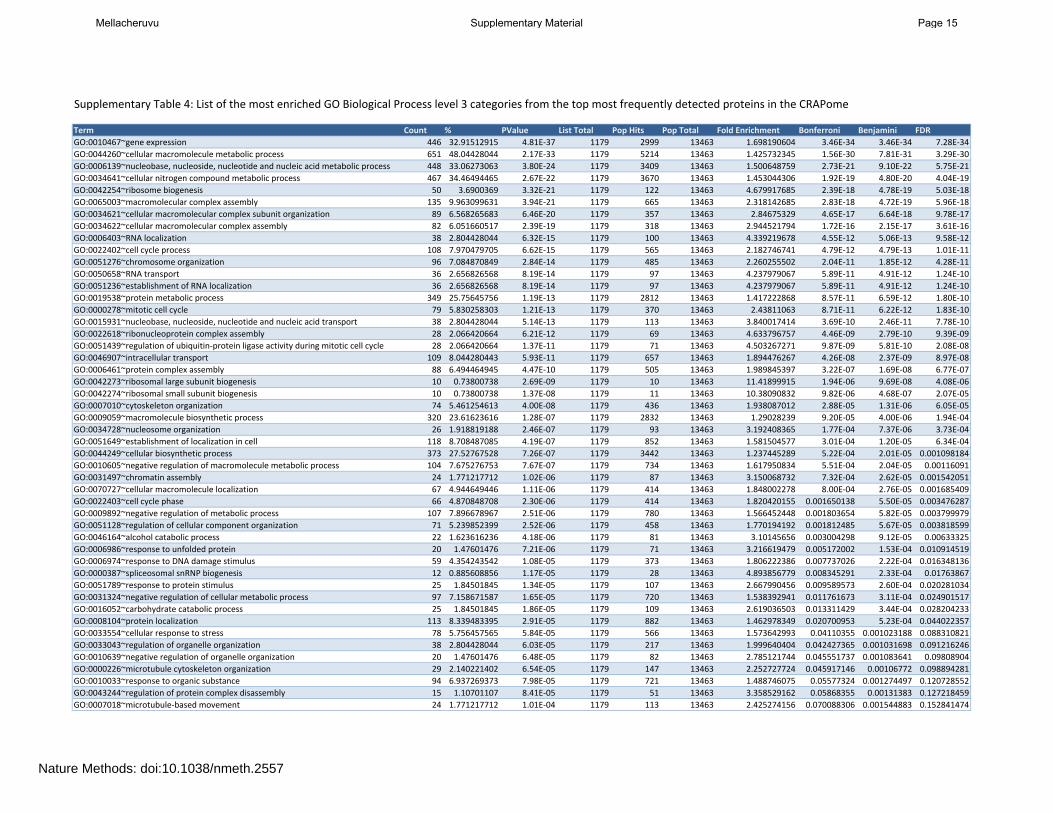
Supplementary Table 4: page 15 List of the most enriched GO biological process (level 3) categories (H. sapiens)
Supplementary Table 5: page 16 List of the most enriched GO molecular function (level 3) categories (H. sapiens)
Supplementary Table 6: page 17 List of the most enriched GO cellular component (level 3) categories (H. sapiens)
Supplementary Notes Supplementary Note 1: User Manual page 18 Supplementary Note 2: Annotator Manual page 29
Mellacheruvu Supplementary Material Page 1
Nature Methods: doi:10.1038/nmeth.2557
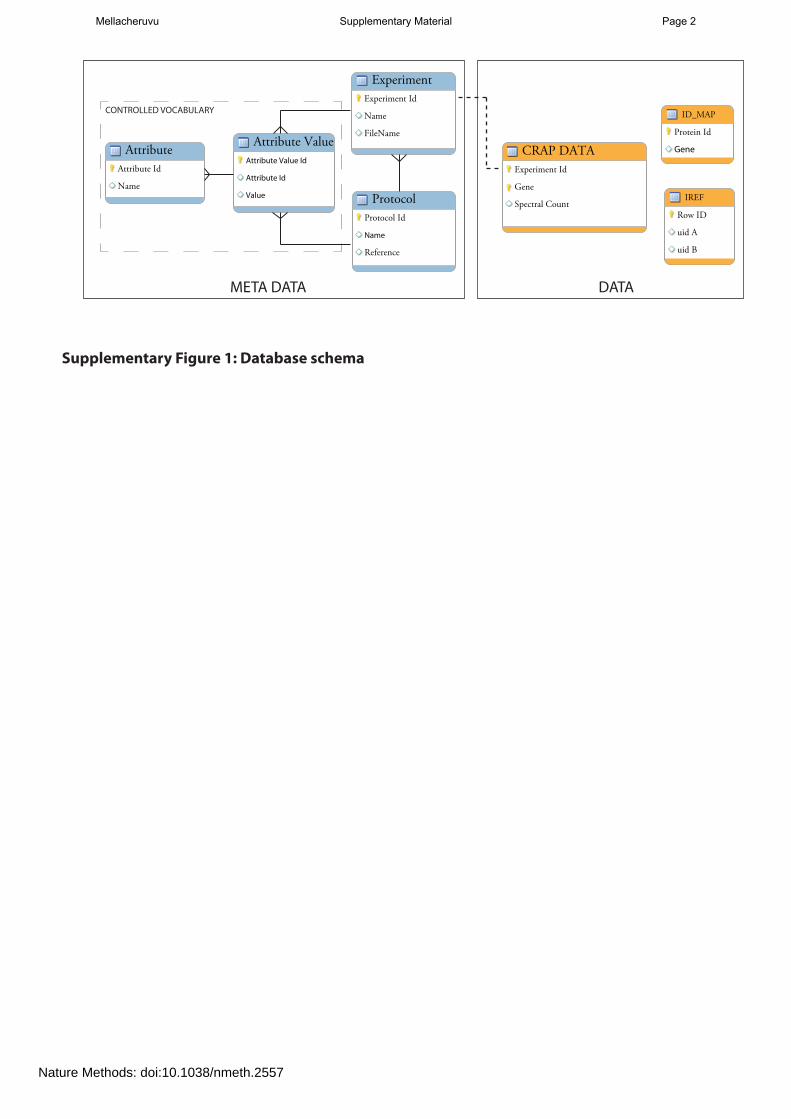
Attribute ValueAttribute Value Id
Attribute Id
Value
AttributeAttribute Id
Name
ExperimentExperiment Id
Name
FileName
ProtocolProtocol Id
Name
Reference
CRAP DATAExperiment Id
Gene
Spectral Count
ID_MAP
Protein Id
Gene
IREF
Row ID
uid A
uid B
META DATA DATA
CONTROLLED VOCABULARY
Supplementary Figure 1: Database schema
Mellacheruvu Supplementary Material Page 2
Nature Methods: doi:10.1038/nmeth.2557

Supplementary Figure 2: E�ect of SAINT options on the results.The number of interactions in iRefIndex is shown in relation to the di�erent sets of SAINT options employed for the analysis of the four bait benchmark test data. The options tested here were minFold (on/o�) and norm (on/o�). As described in Choi et al., Current Protocols in Bioinformatics, 2012, as well as on the tutorial, minFold “on” forces a separation between the true and false distribu-tions, and norm “on” normalizes the data in relation to the total number of identi�ed spectra in the sample. Both of these options allow for conservative scoring, but they may induce a loss in sensi-tivity. Systematically testing di�erent parameters allows for a more enlightened selection of the optimal parameters for SAINT �ltering in a particular dataset. Here, we found that turning minFold “o�” while keeping norm “on” performed slightly better; this is due to the fact that some true inter-action partners for MEPCE and EIF4A2 are found at reduced levels in the control runs.
Mellacheruvu Supplementary Material Page 3
Nature Methods: doi:10.1038/nmeth.2557

Attribute Name Attribute ValuesOrganism H. sapiens, S. cerevisiaeCell/tissue type HEK293, HeLa, U2OS, PBMC, Jurkat, CEM-T, MRC-5, LS174, S288CCell/tissue subtype HEK293T, HEK293 Flp-In T-REx, Jurkat-Flp-In
Drug treatmentaphidicolin, rapamycin, nocodazole, MG132, none, IFN-beta, DMSO, okadaic acid, doxycycline+thymidine, tetracycline+thymidine, thymidine+nocodazole
Subcellular fractionation total cell lysate, total lysate+chromatin, nuclear fraction, cytosolic fractionEpitope tag FLAG, HA, GFP, TAP, HaloTag, Strep-HAControl protein RFP, GFP, FLAG, mCherry, tag alone, untransfected, uninduced, NLS-RFPAP steps single, tandem
Affinity approach 1M2 anti-FLAG, anti-GFP camel, anti-GFP rabbit, HA-7 anti-HA, HaloLink, IgG, Streptactin, 2xFLAG, SBP, anti-GFP mouse, HA.11 anti-HA
Affinity support 1agarose, magnetic (dynabead), magnetic (agarose coated), nano-magnetic, microMACS
Affinity approach 2M2 anti-FLAG, anti-GFP camel, anti-GFP rabbit, calmodulin, HA, 2xHA, HA-7 anti-HA, anti-GFP mouse
Affinity support 2agarose, magnetic bead (dynabead), magnetic beads, agarose coated, nano-magnetic beads, microMACS
Fractionation SDS-PAGE, 1D LC-MS, MudPIT, RP-RP, GeLCInstrument type Velos-Orbitrap, LTQ-Orbitrap, LTQ, LCQ, LTQ-FT, 5600 TripleTOF
Supplementary Table 1: Controlled vocabularies and values in the CRAPome
Mellacheruvu Supplementary Material Page 4
Nature Methods: doi:10.1038/nmeth.2557

PROTID GENEID Num Expt Total Frequency Max SC Ave SC Sum SC Sum SC (unique)NP_005336.3 HSPA1A 334 0.97 385 39.89 13641 5355NP_005518.3 HSPA1L 330 0.96 215 20.67 7065 4NP_006588.1 HSPA8 330 0.96 395 35.92 12287 9630NP_006112.3 KRT1 325 0.95 1424 87.44 29294 28989NP_068814.2 HSPA2 322 0.94 185 14.66 5001 2399NP_006073.2 TUBA1B 321 0.94 366 33.99 11642 11642NP_116093.1 TUBA1C 321 0.94 333 32.13 11001 11001NP_002146.2 HSPA6 318 0.93 173 12.33 4220 312NP_005992.1 TUBA3C 318 0.93 287 24.88 8519 8519NP_821133.1 TUBB 317 0.92 355 33.15 11358 11358NP_005991.1 TUBA4A 313 0.91 284 23.69 8109 8109NP_006079.1 TUBB4B 313 0.91 330 26.84 9308 9308NP_001060.1 TUBB2A 309 0.90 319 23.83 8160 8160NP_821080.1 TUBB2B 309 0.90 321 24.04 8231 8231NP_005338.1 HSPA5 306 0.89 120 12.99 4422 3237NP_000414.2 KRT2 303 0.88 723 44.41 15183 13080NP_001092.1 ACTB 302 0.88 831 35.38 12120 12120NP_006077.2 TUBB3 302 0.88 175 17.36 5945 5945NP_006078.2 TUBB4A 302 0.88 264 19.51 6798 6798NP_000412.3 KRT10 301 0.88 960 68.89 23584 22390NP_001091.1 ACTA1 295 0.86 426 19.07 6532 6532NP_001135417.1 ACTA2 293 0.85 344 17.27 5912 5912NP_001393.1 EEF1A1 290 0.85 168 14.92 5109 1980NP_001077007.1 POTEE 288 0.84 302 12.10 4148 4148NP_000217.2 KRT9 287 0.84 834 49.04 16809 16552NP_001949.1 EEF1A2 283 0.83 113 9.17 3142 13NP_005546.2 KRT6B 278 0.81 383 20.57 7015 5053NP_778253.2 KRT77 274 0.80 182 6.93 2353 1952NP_001017992.1 ACTBL2 266 0.78 171 8.27 2829 2829NP_115914.1 TUBB6 258 0.75 103 8.71 2985 2985NP_000517.2 KRT14 255 0.74 356 20.46 7000 5806NP_005545.1 KRT6A 255 0.74 259 17.38 5908 3946NP_005548.2 KRT16 251 0.73 310 17.96 6152 4958NP_004125.3 HSPA9 249 0.73 185 10.43 3545 3538NP_000415.2 KRT5 244 0.71 279 19.22 6547 4585NP_005310.1 HIST1H1C 240 0.70 93 6.63 2251 87NP_005312.1 HIST1H1E 239 0.70 93 6.60 2249 84NP_005311.1 HIST1H1D 239 0.70 91 6.31 2141 1NP_002267.2 KRT19 233 0.68 181 8.77 3002 1666NP_853515.2 KRT27 231 0.67 199 6.54 2235 2235NP_004684.2 KRT75 230 0.67 104 7.85 2658 997NP_000413.1 KRT17 228 0.66 159 11.35 3880 2643NP_001035807.1 HIST2H2AA4 223 0.65 234 7.34 2507 2507NP_002131.2 HNRNPK 223 0.65 161 8.79 3012 3012NP_002266.2 KRT15 223 0.65 130 7.98 2723 1529NP_003504.2 HIST1H2AB 223 0.65 234 7.09 2423 2423NP_001129064.1 RPS27A 222 0.65 108 4.13 1413 1413NP_787028.1 KRT79 221 0.64 112 6.78 2297 11
Supplementary Table 2: Most frequently detected genes in the CRAPome (reduced list -‐ see Methods). Full Table online at www.crapome.org. This list was processed using ABACUS Columns are as follows: PROTID, RefSeq protein accession used for mapping in ABACUS; GENEID, Universal Gene Symbol; Num Expt Total, number of experiments in which the gene product was idenLfied; Frequency, the percentage of the experiments in the CRAPome in which the gene product was idenLfied; Max SC, the maximum number of spectral counts with which one gene product was idenLfied across all CRAPome experiments; Ave SC, the average number of spectral counts for the gene product across all experiments; Sum SC, the total spectral counts across the enLre CRAPome; Sum SC (unique), the total spectral counts unambiguously assigned to the protein.
Mellacheruvu Supplementary Material Page 5
Nature Methods: doi:10.1038/nmeth.2557
NP_004492.2 HNRNPU 220 0.64 286 10.27 3498 8NP_114032.2 HNRNPU 220 0.64 286 10.41 3543 53NP_002264.1 KRT8 218 0.64 592 11.59 3921 3062NP_705694.2 KRT13 216 0.63 147 8.37 2858 1921NP_031381.2 HSP90AB1 215 0.63 328 16.69 5306 2620NP_000215.1 KRT18 213 0.62 365 8.37 2850 1732NP_001029102.1 UBA52 211 0.62 108 4.00 1371 1371NP_056932.2 KRT76 211 0.62 97 6.99 2351 1038NP_001017963.2 HSP90AA1 210 0.61 256 15.62 5028 2561NP_003371.2 VIM 209 0.61 861 24.16 8260 8075NP_002127.1 HNRNPA1 207 0.60 54 4.76 1622 1571NP_000996.2 RPS3 206 0.60 65 7.02 2397 2397NP_112533.1 HNRNPA2B1 205 0.60 69 6.72 2267 2216NP_005372.2 NCL 202 0.59 126 8.02 2741 2741NP_001020241.1 RPS14 201 0.59 41 2.57 880 880NP_005511.1 HNRNPH1 200 0.58 223 9.18 3142 1041NP_072045.1 RPS18 199 0.58 45 3.49 1182 1182NP_001189360.1 PRDX1 198 0.58 53 3.79 1279 803NP_002037.2 GAPDH 198 0.58 113 5.95 2034 1985NP_000969.1 RPL23 196 0.57 52 2.97 1014 1014NP_002263.3 KRT4 193 0.56 61 3.14 1046 729NP_002645.3 PKM 191 0.56 194 8.96 3064 3064NP_001165335.1 TUBAL3 189 0.55 25 2.10 716 716NP_002511.1 NPM1 189 0.55 122 4.25 1442 1442NP_004550.2 YBX1 189 0.55 112 4.00 1365 1365NP_001027565.1 HNRNPH2 188 0.55 91 4.52 1539 170NP_004387.1 DDX5 188 0.55 97 4.89 1662 896NP_002096.1 H2AFX 186 0.54 157 4.43 1513 1513NP_000998.1 RPS4X 185 0.54 68 5.51 1874 1874NP_001091974.1 DDX17 183 0.53 93 4.87 1654 888NP_000975.2 RPL23A 182 0.53 39 2.95 1006 1006NP_066402.2 HIST1H2BJ 180 0.52 184 9.03 3088 3088NP_778235.1 HIST2H2AB 180 0.52 57 2.66 909 909NP_000968.2 RPL13 179 0.52 60 3.06 1044 1044NP_005316.1 HIST1H1A 179 0.52 44 2.52 851 30NP_005314.2 HIST1H1T 178 0.52 38 2.24 770 1NP_001091674.1 HNRNPF 177 0.52 62 4.29 1464 416NP_001143.2 SLC25A5 176 0.51 73 3.78 1290 1290NP_002147.2 HSPD1 174 0.51 177 6.57 2236 2236NP_005959.2 HNRNPM 174 0.51 179 8.88 3018 3018NP_001029249.1 HIST2H4B 172 0.50 332 8.52 2923 2923NP_001203.1 C1QBP 171 0.50 425 5.15 1760 1760NP_002268.2 KRT31 171 0.50 106 3.58 1222 285NP_000995.1 RPLP2 170 0.50 134 3.46 1189 1189NP_001003.1 RPS8 169 0.49 57 3.62 1237 1237NP_001019.1 RPS25 168 0.49 19 2.14 721 721NP_476429.2 KRT3 167 0.49 82 5.15 1726 533NP_001104026.1 FLNA 166 0.48 332 13.65 4651 4651NP_444513.1 DCD 164 0.48 50 2.28 780 780NP_001138880.1 NONO 162 0.47 438 9.29 3146 2952NP_001419.1 ENO1 162 0.47 177 8.21 2707 457NP_000972.1 RPL19 160 0.47 71 1.97 668 668NP_002129.2 HNRNPD 160 0.47 33 1.74 645 33NP_001003810.1 HNRNPD 158 0.46 32 1.66 615 3NP_000963.1 RPL7A 157 0.46 55 3.29 1121 1121NP_001011.1 RPS16 157 0.46 56 3.06 1045 1045NP_000959.2 RPL4 156 0.45 98 4.75 1613 1613
Mellacheruvu Supplementary Material Page 6
Nature Methods: doi:10.1038/nmeth.2557
NP_001001.2 RPS6 156 0.45 74 2.74 931 931NP_066953.1 PPIA 156 0.45 53 2.40 819 819NP_001001937.1 ATP5A1 155 0.45 91 4.03 1370 1370NP_001627.2 SLC25A6 155 0.45 58 3.10 1067 1067NP_002943.2 RPS2 155 0.45 63 3.50 1194 1194NP_000981.1 RPL27A 154 0.45 21 1.59 538 538NP_000997.1 RPS3A 154 0.45 58 4.08 1393 1393NP_001002.1 RPS7 154 0.45 29 2.30 790 790NP_001677.2 ATP5B 154 0.45 112 4.01 1373 1373NP_005800.3 PRDX2 154 0.45 60 2.04 698 426NP_000993.1 RPLP0 153 0.45 65 3.72 1272 1272NP_001138898.1 CSDA 153 0.45 53 2.35 804 804NP_001348.2 DHX9 153 0.45 186 6.37 2173 2173NP_000966.2 RPL11 152 0.44 25 1.66 559 559NP_001180345.1 DDX3X 152 0.44 91 4.23 1442 1253NP_003642.3 CSDA 152 0.44 70 2.56 876 876NP_733759.1 HIST1H2BA 152 0.44 72 3.23 1106 1106NP_001188412.1 ENO1 152 0.44 140 6.00 1951 8NP_000967.1 RPL12 150 0.44 39 2.36 803 803NP_001021.1 RPS27 150 0.44 35 1.41 482 158NP_001142.2 SLC25A4 149 0.43 45 2.43 826 826NP_000970.1 RPL18 148 0.43 82 2.58 884 884NP_000977.1 RPL24 148 0.43 23 1.74 584 584NP_001013.1 RPS19 148 0.43 63 2.98 1019 1019NP_001952.1 EEF2 148 0.43 240 5.72 1939 1885NP_002464.1 MYH9 148 0.43 754 13.07 4440 4429NP_006752.1 YWHAE 148 0.43 42 2.95 986 819NP_000976.1 RPL17 147 0.43 35 2.16 737 737NP_004490.2 HNRNPAB 147 0.43 25 1.58 538 465NP_003008.1 SRSF3 146 0.43 14 1.69 575 368NP_005498.1 CFL1 146 0.43 34 1.50 507 275NP_008869.1 SNRPD1 145 0.42 82 3.80 1304 1304NP_001070910.1 HNRNPC 144 0.42 57 3.13 1070 1070NP_001070911.1 HNRNPC 144 0.42 65 3.29 1125 1125NP_001116137.1 DDX3Y 143 0.42 70 2.90 984 795NP_006363.4 SYNCRIP 143 0.42 104 2.83 964 964NP_005057.1 SFPQ 142 0.41 368 7.76 2645 2460NP_001004.2 RPS9 139 0.41 55 2.84 961 961NP_001008.1 RPS13 139 0.41 22 1.86 636 636NP_001026854.1 SRSF7 139 0.41 36 1.64 557 350NP_001524.2 HNRNPL 139 0.41 266 4.24 1446 1419NP_004166.1 SNRPD3 139 0.41 195 4.10 1403 1403NP_005547.3 KRT7 139 0.41 197 3.48 1164 454NP_006100.2 PRMT5 139 0.41 3569 94.88 32512 32512NP_000962.2 RPL7 138 0.40 78 3.42 1169 1169NP_000974.1 RPL22 138 0.40 26 1.30 442 442NP_057004.1 RPS27L 137 0.40 21 1.04 358 34NP_001005.1 RPS10 136 0.40 34 2.22 757 756NP_001164105.1 FUS 136 0.40 155 6.58 2238 1835NP_005817.1 HNRNPR 136 0.40 185 3.14 1076 1076NP_110379.2 TCP1 136 0.40 116 4.36 1492 1492NP_000961.2 RPL6 135 0.39 296 5.08 1738 1738NP_000984.1 RPL31 135 0.39 28 1.41 481 481NP_002130.2 RBMX 135 0.39 79 3.56 1201 1201NP_005773.3 ALYREF 135 0.39 41 2.42 828 828NP_000964.1 RPL8 134 0.39 50 2.46 837 837NP_000979.1 RPL27 134 0.39 62 1.55 530 530
Mellacheruvu Supplementary Material Page 7
Nature Methods: doi:10.1038/nmeth.2557
NP_001129171.1 YWHAZ 134 0.39 35 1.82 607 406NP_003320.2 TXN 134 0.39 15 1.03 350 350NP_066964.1 XRCC5 134 0.39 78 2.82 956 956NP_001191397.1 RBM10 133 0.39 277 9.72 3289 3255NP_001988.1 FAU 133 0.39 14 0.94 322 322NP_006187.2 PCBP1 133 0.39 120 3.49 1182 1182NP_524147.2 MYL6 133 0.39 55 1.74 584 584NP_000994.1 RPLP1 132 0.38 35 1.61 551 551NP_001395.1 EEF1G 132 0.38 48 2.29 783 783NP_003082.1 SNRPB 132 0.38 240 5.86 2004 2004NP_919223.1 HNRNPA3 132 0.38 48 1.90 645 645NP_001407.1 EIF4A1 131 0.38 92 3.38 1145 1145NP_003132.2 TRIM21 131 0.38 591 15.90 5435 5435NP_004719.2 DDX21 131 0.38 93 4.29 1450 1276NP_005110.2 THRAP3 131 0.38 191 7.13 2415 2320NP_006422.1 CCT2 131 0.38 98 4.84 1645 1645NP_114366.1 PCBP2 131 0.38 58 2.28 774 774NP_001017.1 RPS24 130 0.38 38 1.72 581 581NP_003118.2 SPTAN1 130 0.38 272 10.46 3526 3526NP_004588.1 SNRPD2 130 0.38 46 2.31 790 790NP_004850.1 CLTC 130 0.38 251 5.16 1748 1748NP_008835.5 PRKDC 130 0.38 206 6.48 2183 2183NP_009140.1 RPL35 130 0.38 68 1.52 520 520NP_001182461.1 SPTAN1 129 0.38 274 10.39 3505 3505NP_003119.2 SPTBN1 129 0.38 269 10.00 3377 3377NP_009202.1 STK38 129 0.38 515 23.80 8126 7191NP_036205.1 CCT5 129 0.38 66 4.36 1473 1473NP_114368.1 PTBP1 129 0.38 114 3.09 1055 1055NP_001014.1 RPS20 128 0.37 18 1.34 458 458NP_006421.2 CCT4 128 0.37 74 3.41 1146 1146NP_000958.1 RPL3 127 0.37 171 4.21 1427 1427NP_001181883.1 MATR3 127 0.37 109 4.21 1422 1422NP_006576.2 CCT8 127 0.37 90 4.60 1572 1572NP_077007.1 WDR77 127 0.37 1271 31.97 10958 10958NP_000978.1 RPL26 126 0.37 26 1.98 674 674NP_001000.2 RPS5 126 0.37 21 1.48 500 500NP_002559.2 PABPC1 126 0.37 123 3.55 1201 1201NP_000025.1 ALDOA 125 0.36 86 2.55 873 873NP_001010.2 RPS15A 125 0.36 46 2.44 826 826NP_001012.1 RPS17 125 0.36 45 2.09 716 716NP_001022.1 RPS28 125 0.36 15 0.80 272 272NP_001753.1 CCT6A 125 0.36 70 3.35 1144 1144NP_005955.1 null 125 0.36 242 6.00 2019 2008NP_001609.2 PARP1 124 0.36 167 5.10 1729 1729NP_003290.1 HSP90B1 124 0.36 101 4.51 1524 1305NP_005989.3 CCT3 124 0.36 71 3.20 1080 1080NP_009057.1 VCP 124 0.36 121 6.10 2076 2076NP_842565.2 SPTBN1 124 0.36 243 9.12 3079 3079NP_000652.2 RPL9 123 0.36 69 2.19 751 751NP_001156008.1 RBMXL1 123 0.36 65 2.36 804 804NP_001460.1 XRCC6 123 0.36 87 3.11 1060 1060NP_000990.1 RPL38 122 0.36 70 2.66 913 913NP_057177.1 RPL26L1 122 0.36 21 1.63 558 558NP_001016.1 RPS23 121 0.35 29 1.54 528 528NP_001030168.1 RPL14 121 0.35 37 1.78 607 607NP_001408.2 EIF4B 121 0.35 209 7.69 2606 2606NP_003595.1 IRS4 121 0.35 129 3.36 1139 1139
Mellacheruvu Supplementary Material Page 8
Nature Methods: doi:10.1038/nmeth.2557

NP_006420.1 CCT7 121 0.35 83 3.40 1149 1149NP_036558.3 SF3B3 121 0.35 255 5.34 1822 1822NP_000983.1 RPL29 120 0.35 71 1.08 371 371NP_002939.2 RPL15 120 0.35 34 2.34 796 796NP_006397.1 PRDX4 120 0.35 34 0.97 327 123NP_001958.2 EIF4A2 119 0.35 42 1.98 669 669NP_000960.2 RPL5 118 0.34 70 2.32 785 785NP_001006.1 RPS11 118 0.34 30 1.81 617 617NP_001018077.1 SERBP1 118 0.34 31 2.14 711 711NP_001157790.1 FLNB 118 0.34 135 2.78 931 931NP_004506.2 ILF2 118 0.34 57 2.05 702 702NP_006704.3 SUB1 118 0.34 27 2.04 693 693NP_001284.1 CLNS1A 117 0.34 353 9.85 3378 3378NP_006004.2 RPL10 117 0.34 40 2.02 687 687NP_001020.2 RPS26 116 0.34 25 0.96 322 322NP_001167568.1 LDHB 116 0.34 105 2.92 992 992NP_001814.2 CKB 116 0.34 116 3.13 1072 1053NP_005753.1 TRIM28 116 0.34 56 2.47 836 836NP_001180432.1 ENO3 115 0.34 30 1.36 463 9NP_036565.2 SF3B1 115 0.34 177 5.42 1840 1840NP_055554.1 BCLAF1 115 0.34 119 5.65 1915 1820NP_056444.3 PRPF31 115 0.34 142 3.44 1170 1170NP_057103.2 LUC7L2 115 0.34 110 4.88 1668 1668NP_001349.2 DHX15 114 0.33 201 4.70 1597 1540NP_001427.2 FBL 114 0.33 29 1.38 468 468NP_003478.1 TAF15 114 0.33 38 1.85 609 206NP_004095.4 FASN 114 0.33 404 8.06 2736 2736NP_001032752.1 EEF1B2 113 0.33 22 1.09 366 360NP_004514.2 KIF11 113 0.33 777 20.10 6853 6853NP_036555.1 RPL13A 112 0.33 87 1.91 642 642NP_001966.1 ENO2 111 0.32 30 1.35 461 12NP_060090.2 ILF3 111 0.32 123 3.67 1231 1231NP_068733.1 CFL2 111 0.32 17 0.83 279 47NP_001012321.1 RPSA 110 0.32 59 1.71 584 584NP_004332.2 CAD 110 0.32 116 2.65 894 889NP_004893.1 RBM39 110 0.32 68 3.10 1054 1054NP_112740.1 HNRPDL 110 0.32 20 1.12 380 212NP_003555.1 TAGLN2 109 0.32 15 1.13 384 384NP_006817.1 YWHAQ 109 0.32 95 1.42 468 260NP_001136077.1 EFTUD2 108 0.31 90 3.77 1275 1221NP_001138416.1 MYL12B 108 0.31 85 1.32 453 453NP_001734.1 CALM2 108 0.31 233 2.17 739 739NP_002256.2 KPNB1 108 0.31 69 2.36 798 798NP_002257.1 KPNA2 108 0.31 36 1.56 523 523NP_003395.1 YWHAB 108 0.31 27 1.49 493 256NP_006462.1 MYL12A 108 0.31 85 1.30 446 446NP_008855.1 SRSF1 108 0.31 69 2.53 863 836NP_001005464.1 HIST2H3A 107 0.31 56 2.07 685 685NP_003520.1 HIST1H3A 107 0.31 44 2.08 688 688NP_006316.1 RAN 107 0.31 39 1.12 383 383NP_006436.3 PRPF8 107 0.31 136 5.70 1917 1917NP_006796.1 HNRNPA0 107 0.31 31 1.07 365 365NP_055815.1 STK38L 106 0.31 375 10.31 3658 2723NP_000973.2 RPL21 105 0.31 38 1.64 557 557NP_001007.2 RPS12 105 0.31 19 1.22 417 417NP_001182356.1 SRSF2 105 0.31 10 0.73 251 251NP_002893.1 RCN2 105 0.31 27 1.11 378 378
Mellacheruvu Supplementary Material Page 9
Nature Methods: doi:10.1038/nmeth.2557
GENEID Num Expt Total Frequency Max SC Ave SC Sum SC IsMapped
HSPA8 328 0.96 332 30.27 10381 YesHSPA1B 328 0.96 331 33.44 11471 YesHSPA1A 328 0.96 331 33.44 11471 YesHSPA1L 322 0.94 189 17.28 5926 YesTUBA1C 321 0.94 281 27.99 9600 YesTUBA1B 321 0.94 314 29.78 10216 YesTUBA1A 321 0.94 299 27.22 9337 YesKRT1 320 0.93 1178 75.65 25949 YesTUBA3D 318 0.93 242 21.60 7410 YesTUBA3C 318 0.93 242 21.60 7410 YesHSPA2 318 0.93 167 11.94 4096 YesTUBA3E 316 0.92 227 18.79 6446 YesTUBB 314 0.92 338 28.72 9850 YesHSPA6 313 0.91 159 10.67 3659 YesTUBA4A 309 0.90 242 20.47 7020 YesTUBB2C 308 0.90 310 22.97 7879 YesTUBA8 308 0.90 175 15.21 5218 YesTUBB2B 304 0.89 301 20.23 6938 YesTUBB2A 304 0.89 299 20.04 6873 YesTUBB4 298 0.87 248 16.73 5739 YesKRT2 298 0.87 629 38.62 13245 YesKRT10 297 0.87 824 58.80 20169 YesTUBB3 296 0.86 172 15.18 5206 YesACTG1 295 0.86 716 30.12 10332 YesACTB 295 0.86 716 30.12 10332 YesHSPA5 292 0.85 108 10.86 3726 YesACTC1 286 0.83 357 15.91 5457 YesACTA1 286 0.83 357 15.87 5445 Yesgi|134133226|ref|NP_001077007.1| 284 0.83 252 10.53 3612 NoPOTEF 283 0.83 193 8.84 3033 YesACTG2 283 0.83 293 14.37 4930 YesACTA2 283 0.83 294 14.42 4946 YesEEF1A1 282 0.82 160 13.06 4481 YesKRT9 281 0.82 699 40.96 14050 YesEEF1A2 275 0.80 109 8.09 2775 YesKRT77 268 0.78 163 5.75 1972 YesKRT6B 266 0.78 320 16.77 5753 YesACTBL2 261 0.76 129 6.67 2289 Yesgi|42558279|ref|NP_817124.1| 254 0.74 155 8.08 2772 NoPOTEI 252 0.73 158 5.69 1952 YesTUBB6 249 0.73 94 7.48 2565 YesPOTEJ 240 0.70 134 5.05 1733 YesHSPA9 239 0.70 159 9.15 3138 YesKRT28 235 0.69 227 7.75 2657 YesKRT6C 234 0.68 212 13.76 4720 YesKRT6A 234 0.68 215 14.05 4820 YesHIST1H1E 234 0.68 76 5.78 1983 YesHIST1H1C 234 0.68 76 5.79 1986 YesHIST1H1D 233 0.68 75 5.52 1893 Yes
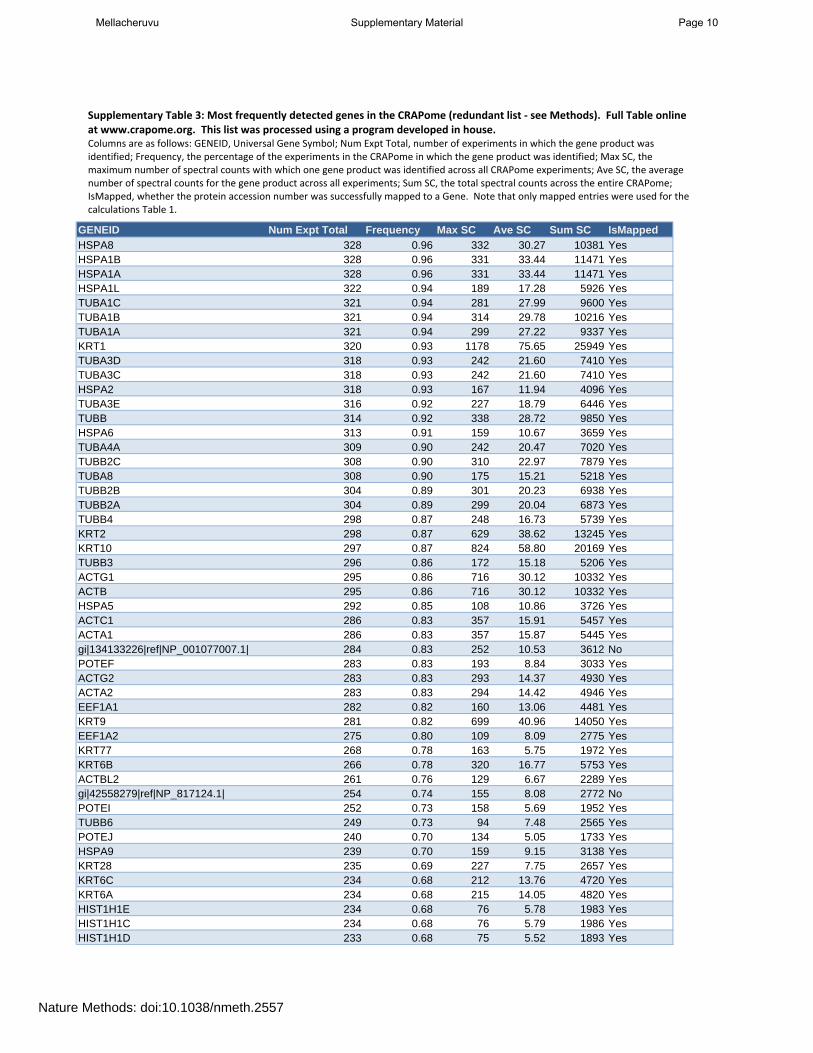
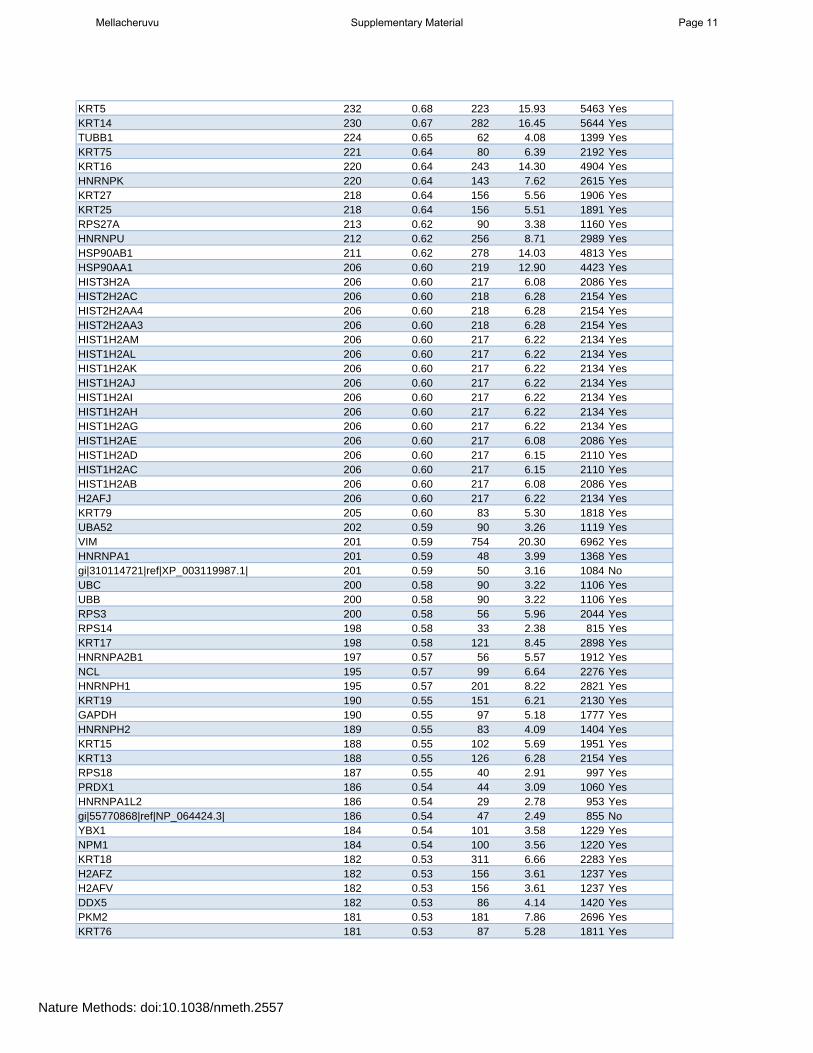
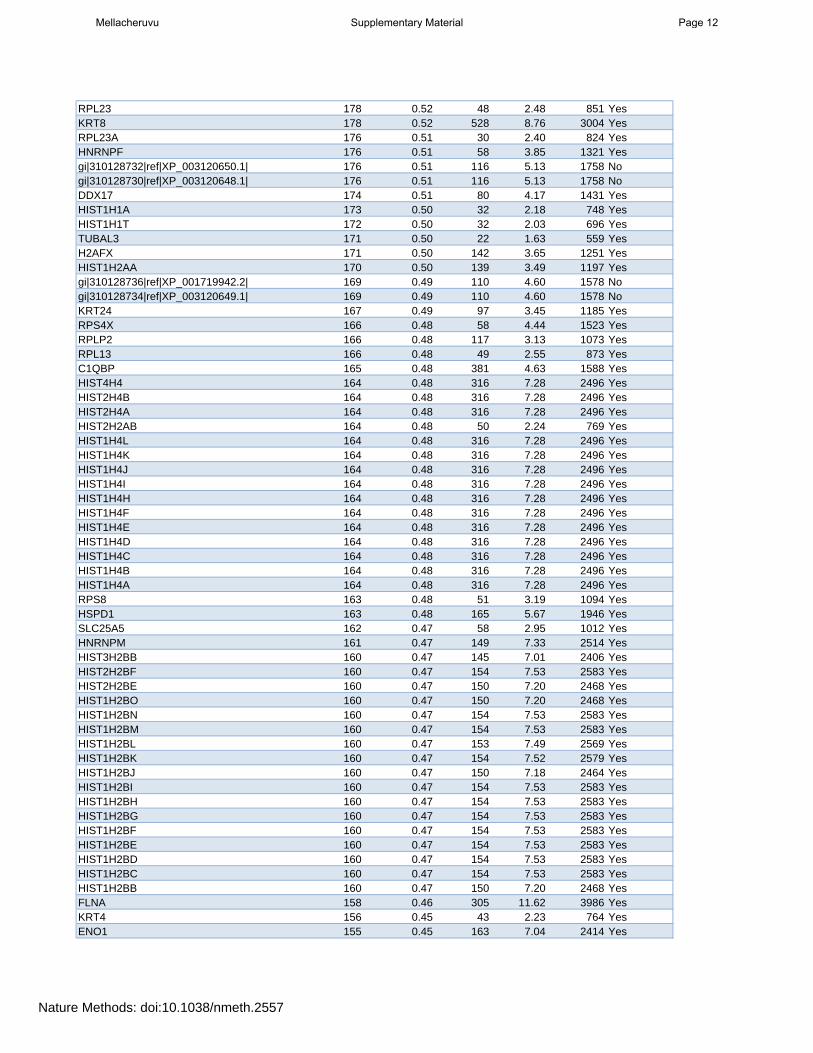
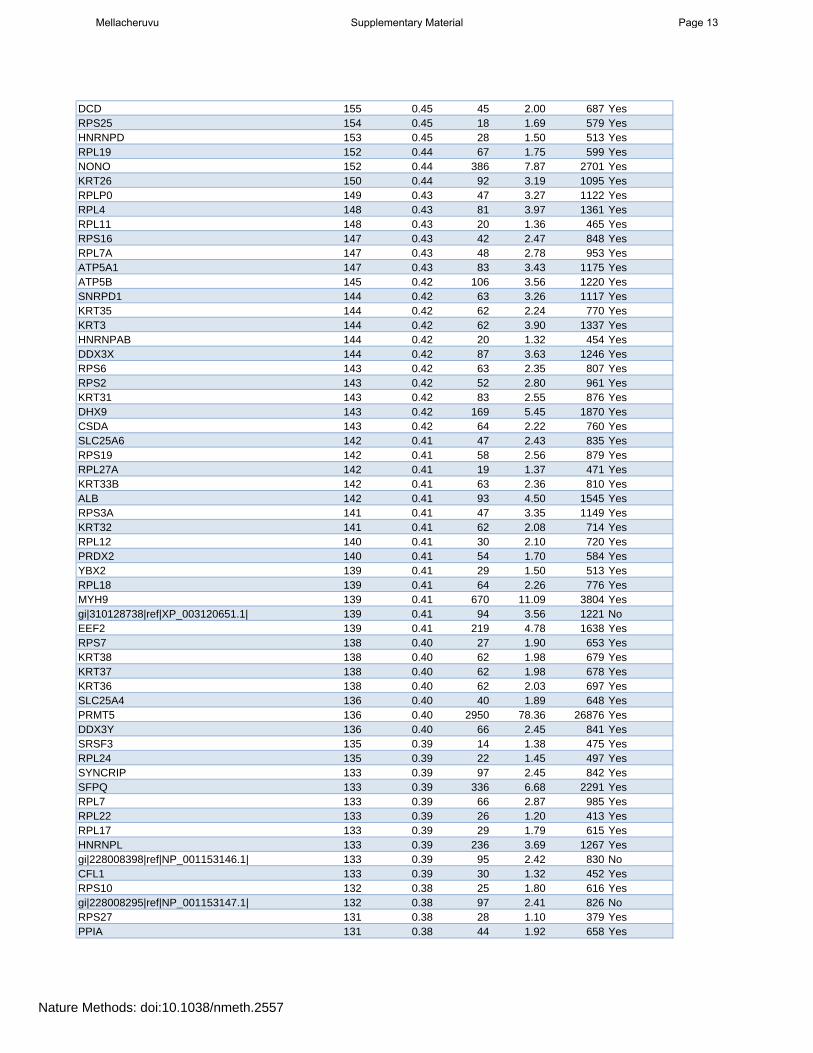
Supplementary Table 3: Most frequently detected genes in the CRAPome (redundant list ‐ see Methods). Full Table online at www.crapome.org. This list was processed using a program developed in house.Columns are as follows: GENEID, Universal Gene Symbol; Num Expt Total, number of experiments in which the gene product was identified; Frequency, the percentage of the experiments in the CRAPome in which the gene product was identified; Max SC, themaximum number of spectral counts with which one gene product was identified across all CRAPome experiments; Ave SC, the averagenumber of spectral counts for the gene product across all experiments; Sum SC, the total spectral counts across the entire CRAPome; IsMapped, whether the protein accession number was successfully mapped to a Gene. Note that only mapped entries were used for the calculations Table 1.
Mellacheruvu Supplementary Material Page 10
Nature Methods: doi:10.1038/nmeth.2557
KRT5 232 0.68 223 15.93 5463 YesKRT14 230 0.67 282 16.45 5644 YesTUBB1 224 0.65 62 4.08 1399 YesKRT75 221 0.64 80 6.39 2192 YesKRT16 220 0.64 243 14.30 4904 YesHNRNPK 220 0.64 143 7.62 2615 YesKRT27 218 0.64 156 5.56 1906 YesKRT25 218 0.64 156 5.51 1891 YesRPS27A 213 0.62 90 3.38 1160 YesHNRNPU 212 0.62 256 8.71 2989 YesHSP90AB1 211 0.62 278 14.03 4813 YesHSP90AA1 206 0.60 219 12.90 4423 YesHIST3H2A 206 0.60 217 6.08 2086 YesHIST2H2AC 206 0.60 218 6.28 2154 YesHIST2H2AA4 206 0.60 218 6.28 2154 YesHIST2H2AA3 206 0.60 218 6.28 2154 YesHIST1H2AM 206 0.60 217 6.22 2134 YesHIST1H2AL 206 0.60 217 6.22 2134 YesHIST1H2AK 206 0.60 217 6.22 2134 YesHIST1H2AJ 206 0.60 217 6.22 2134 YesHIST1H2AI 206 0.60 217 6.22 2134 YesHIST1H2AH 206 0.60 217 6.22 2134 YesHIST1H2AG 206 0.60 217 6.22 2134 YesHIST1H2AE 206 0.60 217 6.08 2086 YesHIST1H2AD 206 0.60 217 6.15 2110 YesHIST1H2AC 206 0.60 217 6.15 2110 YesHIST1H2AB 206 0.60 217 6.08 2086 YesH2AFJ 206 0.60 217 6.22 2134 YesKRT79 205 0.60 83 5.30 1818 YesUBA52 202 0.59 90 3.26 1119 YesVIM 201 0.59 754 20.30 6962 YesHNRNPA1 201 0.59 48 3.99 1368 Yesgi|310114721|ref|XP_003119987.1| 201 0.59 50 3.16 1084 NoUBC 200 0.58 90 3.22 1106 YesUBB 200 0.58 90 3.22 1106 YesRPS3 200 0.58 56 5.96 2044 YesRPS14 198 0.58 33 2.38 815 YesKRT17 198 0.58 121 8.45 2898 YesHNRNPA2B1 197 0.57 56 5.57 1912 YesNCL 195 0.57 99 6.64 2276 YesHNRNPH1 195 0.57 201 8.22 2821 YesKRT19 190 0.55 151 6.21 2130 YesGAPDH 190 0.55 97 5.18 1777 YesHNRNPH2 189 0.55 83 4.09 1404 YesKRT15 188 0.55 102 5.69 1951 YesKRT13 188 0.55 126 6.28 2154 YesRPS18 187 0.55 40 2.91 997 YesPRDX1 186 0.54 44 3.09 1060 YesHNRNPA1L2 186 0.54 29 2.78 953 Yesgi|55770868|ref|NP_064424.3| 186 0.54 47 2.49 855 NoYBX1 184 0.54 101 3.58 1229 YesNPM1 184 0.54 100 3.56 1220 YesKRT18 182 0.53 311 6.66 2283 YesH2AFZ 182 0.53 156 3.61 1237 YesH2AFV 182 0.53 156 3.61 1237 YesDDX5 182 0.53 86 4.14 1420 YesPKM2 181 0.53 181 7.86 2696 YesKRT76 181 0.53 87 5.28 1811 Yes
Mellacheruvu Supplementary Material Page 11
Nature Methods: doi:10.1038/nmeth.2557
RPL23 178 0.52 48 2.48 851 YesKRT8 178 0.52 528 8.76 3004 YesRPL23A 176 0.51 30 2.40 824 YesHNRNPF 176 0.51 58 3.85 1321 Yesgi|310128732|ref|XP_003120650.1| 176 0.51 116 5.13 1758 Nogi|310128730|ref|XP_003120648.1| 176 0.51 116 5.13 1758 NoDDX17 174 0.51 80 4.17 1431 YesHIST1H1A 173 0.50 32 2.18 748 YesHIST1H1T 172 0.50 32 2.03 696 YesTUBAL3 171 0.50 22 1.63 559 YesH2AFX 171 0.50 142 3.65 1251 YesHIST1H2AA 170 0.50 139 3.49 1197 Yesgi|310128736|ref|XP_001719942.2| 169 0.49 110 4.60 1578 Nogi|310128734|ref|XP_003120649.1| 169 0.49 110 4.60 1578 NoKRT24 167 0.49 97 3.45 1185 YesRPS4X 166 0.48 58 4.44 1523 YesRPLP2 166 0.48 117 3.13 1073 YesRPL13 166 0.48 49 2.55 873 YesC1QBP 165 0.48 381 4.63 1588 YesHIST4H4 164 0.48 316 7.28 2496 YesHIST2H4B 164 0.48 316 7.28 2496 YesHIST2H4A 164 0.48 316 7.28 2496 YesHIST2H2AB 164 0.48 50 2.24 769 YesHIST1H4L 164 0.48 316 7.28 2496 YesHIST1H4K 164 0.48 316 7.28 2496 YesHIST1H4J 164 0.48 316 7.28 2496 YesHIST1H4I 164 0.48 316 7.28 2496 YesHIST1H4H 164 0.48 316 7.28 2496 YesHIST1H4F 164 0.48 316 7.28 2496 YesHIST1H4E 164 0.48 316 7.28 2496 YesHIST1H4D 164 0.48 316 7.28 2496 YesHIST1H4C 164 0.48 316 7.28 2496 YesHIST1H4B 164 0.48 316 7.28 2496 YesHIST1H4A 164 0.48 316 7.28 2496 YesRPS8 163 0.48 51 3.19 1094 YesHSPD1 163 0.48 165 5.67 1946 YesSLC25A5 162 0.47 58 2.95 1012 YesHNRNPM 161 0.47 149 7.33 2514 YesHIST3H2BB 160 0.47 145 7.01 2406 YesHIST2H2BF 160 0.47 154 7.53 2583 YesHIST2H2BE 160 0.47 150 7.20 2468 YesHIST1H2BO 160 0.47 150 7.20 2468 YesHIST1H2BN 160 0.47 154 7.53 2583 YesHIST1H2BM 160 0.47 154 7.53 2583 YesHIST1H2BL 160 0.47 153 7.49 2569 YesHIST1H2BK 160 0.47 154 7.52 2579 YesHIST1H2BJ 160 0.47 150 7.18 2464 YesHIST1H2BI 160 0.47 154 7.53 2583 YesHIST1H2BH 160 0.47 154 7.53 2583 YesHIST1H2BG 160 0.47 154 7.53 2583 YesHIST1H2BF 160 0.47 154 7.53 2583 YesHIST1H2BE 160 0.47 154 7.53 2583 YesHIST1H2BD 160 0.47 154 7.53 2583 YesHIST1H2BC 160 0.47 154 7.53 2583 YesHIST1H2BB 160 0.47 150 7.20 2468 YesFLNA 158 0.46 305 11.62 3986 YesKRT4 156 0.45 43 2.23 764 YesENO1 155 0.45 163 7.04 2414 Yes
Mellacheruvu Supplementary Material Page 12
Nature Methods: doi:10.1038/nmeth.2557
DCD 155 0.45 45 2.00 687 YesRPS25 154 0.45 18 1.69 579 YesHNRNPD 153 0.45 28 1.50 513 YesRPL19 152 0.44 67 1.75 599 YesNONO 152 0.44 386 7.87 2701 YesKRT26 150 0.44 92 3.19 1095 YesRPLP0 149 0.43 47 3.27 1122 YesRPL4 148 0.43 81 3.97 1361 YesRPL11 148 0.43 20 1.36 465 YesRPS16 147 0.43 42 2.47 848 YesRPL7A 147 0.43 48 2.78 953 YesATP5A1 147 0.43 83 3.43 1175 YesATP5B 145 0.42 106 3.56 1220 YesSNRPD1 144 0.42 63 3.26 1117 YesKRT35 144 0.42 62 2.24 770 YesKRT3 144 0.42 62 3.90 1337 YesHNRNPAB 144 0.42 20 1.32 454 YesDDX3X 144 0.42 87 3.63 1246 YesRPS6 143 0.42 63 2.35 807 YesRPS2 143 0.42 52 2.80 961 YesKRT31 143 0.42 83 2.55 876 YesDHX9 143 0.42 169 5.45 1870 YesCSDA 143 0.42 64 2.22 760 YesSLC25A6 142 0.41 47 2.43 835 YesRPS19 142 0.41 58 2.56 879 YesRPL27A 142 0.41 19 1.37 471 YesKRT33B 142 0.41 63 2.36 810 YesALB 142 0.41 93 4.50 1545 YesRPS3A 141 0.41 47 3.35 1149 YesKRT32 141 0.41 62 2.08 714 YesRPL12 140 0.41 30 2.10 720 YesPRDX2 140 0.41 54 1.70 584 YesYBX2 139 0.41 29 1.50 513 YesRPL18 139 0.41 64 2.26 776 YesMYH9 139 0.41 670 11.09 3804 Yesgi|310128738|ref|XP_003120651.1| 139 0.41 94 3.56 1221 NoEEF2 139 0.41 219 4.78 1638 YesRPS7 138 0.40 27 1.90 653 YesKRT38 138 0.40 62 1.98 679 YesKRT37 138 0.40 62 1.98 678 YesKRT36 138 0.40 62 2.03 697 YesSLC25A4 136 0.40 40 1.89 648 YesPRMT5 136 0.40 2950 78.36 26876 YesDDX3Y 136 0.40 66 2.45 841 YesSRSF3 135 0.39 14 1.38 475 YesRPL24 135 0.39 22 1.45 497 YesSYNCRIP 133 0.39 97 2.45 842 YesSFPQ 133 0.39 336 6.68 2291 YesRPL7 133 0.39 66 2.87 985 YesRPL22 133 0.39 26 1.20 413 YesRPL17 133 0.39 29 1.79 615 YesHNRNPL 133 0.39 236 3.69 1267 Yesgi|228008398|ref|NP_001153146.1| 133 0.39 95 2.42 830 NoCFL1 133 0.39 30 1.32 452 YesRPS10 132 0.38 25 1.80 616 Yesgi|228008295|ref|NP_001153147.1| 132 0.38 97 2.41 826 NoRPS27 131 0.38 28 1.10 379 YesPPIA 131 0.38 44 1.92 658 Yes
Mellacheruvu Supplementary Material Page 13
Nature Methods: doi:10.1038/nmeth.2557
FUS 131 0.38 129 5.59 1916 YesSRSF7 130 0.38 34 1.40 479 YesRPLP1 130 0.38 35 1.55 530 YesRBM10 130 0.38 240 8.21 2817 YesYWHAE 129 0.38 37 2.33 798 YesHNRNPR 129 0.38 173 2.78 952 YesSTK38 128 0.37 381 18.09 6204 YesPCBP1 128 0.37 108 3.04 1043 YesHNRNPC 127 0.37 57 2.82 967 YesEEF1G 127 0.37 41 1.85 634 YesTHOC4 126 0.37 38 2.09 717 YesTCP1 126 0.37 106 3.64 1247 YesSNRPD3 126 0.37 152 3.08 1055 YesPCBP2 126 0.37 53 1.96 673 YesMYL6 126 0.37 42 1.43 489 YesWDR77 125 0.36 1143 27.62 9472 YesSNRPN 125 0.36 196 4.80 1646 YesSNRPB 125 0.36 196 4.80 1647 YesRPL31 125 0.36 21 1.08 369 YesXRCC5 124 0.36 71 2.28 782 YesTHRAP3 124 0.36 176 6.05 2074 YesRPL6 124 0.36 249 4.15 1423 YesRBMX 124 0.36 68 3.05 1045 YesHNRNPA3 124 0.36 43 1.61 551 YesEIF4A1 124 0.36 87 2.82 966 YesCLTC 124 0.36 234 4.36 1497 YesCCT4 124 0.36 62 2.84 975 YesSPTAN1 123 0.36 239 8.89 3048 YesHIST1H2BA 123 0.36 45 2.13 732 YesDDX21 123 0.36 75 3.51 1205 YesTXN 122 0.36 10 0.84 287 YesTRIM21 122 0.36 473 12.99 4456 YesRPS24 122 0.36 36 1.47 504 YesCCT8 122 0.36 82 3.95 1356 YesRPL8 121 0.35 42 2.09 716 YesRPL27 121 0.35 42 1.24 425 YesPRPH 121 0.35 98 1.87 642 YesHSP90B1 121 0.35 96 3.84 1318 YesCCT5 121 0.35 62 3.76 1289 YesRPS13 120 0.35 17 1.50 513 YesRPS28 119 0.35 14 0.70 240 YesRPS17L 119 0.35 42 1.87 642 YesRPS17 119 0.35 42 1.87 642 YesRPS15A 119 0.35 36 2.01 689 YesPARP1 119 0.35 151 4.31 1480 YesCCT2 119 0.35 95 4.19 1436 YesSNRPD2 118 0.34 40 1.98 679 YesSLC25A31 118 0.34 13 0.88 303 YesRPL35 118 0.34 56 1.20 411 YesRPL29 117 0.34 65 0.96 328 YesPABPC1 117 0.34 104 2.95 1013 YesCCT6A 117 0.34 65 2.84 973 YesALDOA 117 0.34 72 2.13 730 YesYWHAZ 116 0.34 26 1.44 493 YesSPTBN1 116 0.34 232 8.52 2922 YesRPS27L 116 0.34 18 0.80 275 YesRPS20 116 0.34 15 1.17 400 YesMATR3 116 0.34 96 3.59 1230 Yes
Mellacheruvu Supplementary Material Page 14
Nature Methods: doi:10.1038/nmeth.2557
Term Count % PValue List Total Pop Hits Pop Total Fold Enrichment Bonferroni Benjamini FDR
GO:0010467~gene expression 446 32.91512915 4.81E‐37 1179 2999 13463 1.698190604 3.46E‐34 3.46E‐34 7.28E‐34
GO:0044260~cellular macromolecule metabolic process 651 48.04428044 2.17E‐33 1179 5214 13463 1.425732345 1.56E‐30 7.81E‐31 3.29E‐30
GO:0006139~nucleobase, nucleoside, nucleotide and nucleic acid metabolic process 448 33.06273063 3.80E‐24 1179 3409 13463 1.500648759 2.73E‐21 9.10E‐22 5.75E‐21
GO:0034641~cellular nitrogen compound metabolic process 467 34.46494465 2.67E‐22 1179 3670 13463 1.453044306 1.92E‐19 4.80E‐20 4.04E‐19
GO:0042254~ribosome biogenesis 50 3.6900369 3.32E‐21 1179 122 13463 4.679917685 2.39E‐18 4.78E‐19 5.03E‐18
GO:0065003~macromolecular complex assembly 135 9.963099631 3.94E‐21 1179 665 13463 2.318142685 2.83E‐18 4.72E‐19 5.96E‐18
GO:0034621~cellular macromolecular complex subunit organization 89 6.568265683 6.46E‐20 1179 357 13463 2.84675329 4.65E‐17 6.64E‐18 9.78E‐17
GO:0034622~cellular macromolecular complex assembly 82 6.051660517 2.39E‐19 1179 318 13463 2.944521794 1.72E‐16 2.15E‐17 3.61E‐16
GO:0006403~RNA localization 38 2.804428044 6.32E‐15 1179 100 13463 4.339219678 4.55E‐12 5.06E‐13 9.58E‐12
GO:0022402~cell cycle process 108 7.970479705 6.62E‐15 1179 565 13463 2.182746741 4.79E‐12 4.79E‐13 1.01E‐11
GO:0051276~chromosome organization 96 7.084870849 2.84E‐14 1179 485 13463 2.260255502 2.04E‐11 1.85E‐12 4.28E‐11
GO:0050658~RNA transport 36 2.656826568 8.19E‐14 1179 97 13463 4.237979067 5.89E‐11 4.91E‐12 1.24E‐10
GO:0051236~establishment of RNA localization 36 2.656826568 8.19E‐14 1179 97 13463 4.237979067 5.89E‐11 4.91E‐12 1.24E‐10
GO:0019538~protein metabolic process 349 25.75645756 1.19E‐13 1179 2812 13463 1.417222868 8.57E‐11 6.59E‐12 1.80E‐10
GO:0000278~mitotic cell cycle 79 5.830258303 1.21E‐13 1179 370 13463 2.43811063 8.71E‐11 6.22E‐12 1.83E‐10
GO:0015931~nucleobase, nucleoside, nucleotide and nucleic acid transport 38 2.804428044 5.14E‐13 1179 113 13463 3.840017414 3.69E‐10 2.46E‐11 7.78E‐10
GO:0022618~ribonucleoprotein complex assembly 28 2.066420664 6.21E‐12 1179 69 13463 4.633796757 4.46E‐09 2.79E‐10 9.39E‐09
GO:0051439~regulation of ubiquitin‐protein ligase activity during mitotic cell cycle 28 2.066420664 1.37E‐11 1179 71 13463 4.503267271 9.87E‐09 5.81E‐10 2.08E‐08
GO:0046907~intracellular transport 109 8.044280443 5.93E‐11 1179 657 13463 1.894476267 4.26E‐08 2.37E‐09 8.97E‐08
GO:0006461~protein complex assembly 88 6.494464945 4.47E‐10 1179 505 13463 1.989845397 3.22E‐07 1.69E‐08 6.77E‐07
GO:0042273~ribosomal large subunit biogenesis 10 0.73800738 2.69E‐09 1179 10 13463 11.41899915 1.94E‐06 9.69E‐08 4.08E‐06
GO:0042274~ribosomal small subunit biogenesis 10 0.73800738 1.37E‐08 1179 11 13463 10.38090832 9.82E‐06 4.68E‐07 2.07E‐05
GO:0007010~cytoskeleton organization 74 5.461254613 4.00E‐08 1179 436 13463 1.938087012 2.88E‐05 1.31E‐06 6.05E‐05
GO:0009059~macromolecule biosynthetic process 320 23.61623616 1.28E‐07 1179 2832 13463 1.29028239 9.20E‐05 4.00E‐06 1.94E‐04
GO:0034728~nucleosome organization 26 1.918819188 2.46E‐07 1179 93 13463 3.192408365 1.77E‐04 7.37E‐06 3.73E‐04
GO:0051649~establishment of localization in cell 118 8.708487085 4.19E‐07 1179 852 13463 1.581504577 3.01E‐04 1.20E‐05 6.34E‐04
GO:0044249~cellular biosynthetic process 373 27.52767528 7.26E‐07 1179 3442 13463 1.237445289 5.22E‐04 2.01E‐05 0.001098184
GO:0010605~negative regulation of macromolecule metabolic process 104 7.675276753 7.67E‐07 1179 734 13463 1.617950834 5.51E‐04 2.04E‐05 0.00116091
GO:0031497~chromatin assembly 24 1.771217712 1.02E‐06 1179 87 13463 3.150068732 7.32E‐04 2.62E‐05 0.001542051
GO:0070727~cellular macromolecule localization 67 4.944649446 1.11E‐06 1179 414 13463 1.848002278 8.00E‐04 2.76E‐05 0.001685409
GO:0022403~cell cycle phase 66 4.870848708 2.30E‐06 1179 414 13463 1.820420155 0.001650138 5.50E‐05 0.003476287
GO:0009892~negative regulation of metabolic process 107 7.896678967 2.51E‐06 1179 780 13463 1.566452448 0.001803654 5.82E‐05 0.003799979
GO:0051128~regulation of cellular component organization 71 5.239852399 2.52E‐06 1179 458 13463 1.770194192 0.001812485 5.67E‐05 0.003818599
GO:0046164~alcohol catabolic process 22 1.623616236 4.18E‐06 1179 81 13463 3.10145656 0.003004298 9.12E‐05 0.00633325
GO:0006986~response to unfolded protein 20 1.47601476 7.21E‐06 1179 71 13463 3.216619479 0.005172002 1.53E‐04 0.010914519
GO:0006974~response to DNA damage stimulus 59 4.354243542 1.08E‐05 1179 373 13463 1.806222386 0.007737026 2.22E‐04 0.016348136
GO:0000387~spliceosomal snRNP biogenesis 12 0.885608856 1.17E‐05 1179 28 13463 4.893856779 0.008345291 2.33E‐04 0.01763867
GO:0051789~response to protein stimulus 25 1.84501845 1.34E‐05 1179 107 13463 2.667990456 0.009589573 2.60E‐04 0.020281034
GO:0031324~negative regulation of cellular metabolic process 97 7.158671587 1.65E‐05 1179 720 13463 1.538392941 0.011761673 3.11E‐04 0.024901517
GO:0016052~carbohydrate catabolic process 25 1.84501845 1.86E‐05 1179 109 13463 2.619036503 0.013311429 3.44E‐04 0.028204233
GO:0008104~protein localization 113 8.339483395 2.91E‐05 1179 882 13463 1.462978349 0.020700953 5.23E‐04 0.044022357
GO:0033554~cellular response to stress 78 5.756457565 5.84E‐05 1179 566 13463 1.573642993 0.04110355 0.001023188 0.088310821
GO:0033043~regulation of organelle organization 38 2.804428044 6.03E‐05 1179 217 13463 1.999640404 0.042427365 0.001031698 0.091216246
GO:0010639~negative regulation of organelle organization 20 1.47601476 6.48E‐05 1179 82 13463 2.785121744 0.045551737 0.001083641 0.09808904
GO:0000226~microtubule cytoskeleton organization 29 2.140221402 6.54E‐05 1179 147 13463 2.252727724 0.045917146 0.00106772 0.098894281
GO:0010033~response to organic substance 94 6.937269373 7.98E‐05 1179 721 13463 1.488746075 0.05577324 0.001274497 0.120728552
GO:0043244~regulation of protein complex disassembly 15 1.10701107 8.41E‐05 1179 51 13463 3.358529162 0.05868355 0.00131383 0.127218459
GO:0007018~microtubule‐based movement 24 1.771217712 1.01E‐04 1179 113 13463 2.425274156 0.070088306 0.001544883 0.152841474
Supplementary Table 4: List of the most enriched GO Biological Process level 3 categories from the top most frequently detected proteins in the CRAPome
Mellacheruvu Supplementary Material Page 15
Nature Methods: doi:10.1038/nmeth.2557

Term Count % PValue List Total Pop Hits Pop Total Fold Enrichment Bonferroni Benjamini FDR
GO:0003723~RNA binding 262 19.33579336 1.53E‐106 1090 718 13051 4.369121668 3.09E‐104 3.09E‐104 1.92E‐103
GO:0016817~hydrolase activity, acting on acid anhydrides 146 10.77490775 2.74E‐22 1090 764 13051 2.288109419 5.53E‐20 2.77E‐20 3.44E‐19
GO:0032553~ribonucleotide binding 266 19.63099631 1.08E‐21 1090 1836 13051 1.734707481 2.18E‐19 7.25E‐20 1.35E‐18
GO:0017076~purine nucleotide binding 274 20.22140221 1.67E‐21 1090 1918 13051 1.710484928 3.38E‐19 8.45E‐20 2.10E‐18
GO:0001883~purine nucleoside binding 238 17.56457565 1.09E‐20 1090 1601 13051 1.779929975 2.21E‐18 4.41E‐19 1.37E‐17
GO:0008092~cytoskeletal protein binding 101 7.453874539 6.21E‐17 1090 504 13051 2.399430246 2.24E‐14 3.77E‐15 1.44E‐13
GO:0008135~translation factor activity, nucleic acid binding 36 2.656826568 2.81E‐14 1090 98 13051 4.398389815 5.67E‐12 8.11E‐13 3.53E‐11
GO:0051082~unfolded protein binding 35 2.58302583 2.94E‐11 1090 115 13051 3.644076586 5.94E‐09 7.42E‐10 3.69E‐08
GO:0003743~translation initiation factor activity 24 1.771217712 2.13E‐10 1090 61 13051 4.710843736 4.30E‐08 4.77E‐09 2.67E‐07
GO:0019899~enzyme binding 84 6.199261993 6.32E‐09 1090 523 13051 1.923069097 1.28E‐06 1.28E‐07 7.93E‐06
GO:0016875~ligase activity, forming carbon‐oxygen bonds 19 1.402214022 1.48E‐08 1090 47 13051 4.840308413 2.99E‐06 2.72E‐07 1.86E‐05
GO:0008022~protein C‐terminus binding 34 2.509225092 3.85E‐08 1090 141 13051 2.88720151 7.77E‐06 6.47E‐07 4.83E‐05
GO:0016885~ligase activity, forming carbon‐carbon bonds 6 0.442804428 7.30E‐05 1090 7 13051 10.26290957 0.014634866 0.001133435 0.091586475
GO:0042802~identical protein binding 82 6.051660517 8.92E‐05 1090 640 13051 1.53409117 0.017865503 0.001286815 0.111975936
GO:0051920~peroxiredoxin activity 6 0.442804428 1.81E‐04 1090 8 13051 8.980045872 0.035943862 0.002437408 0.227247685
GO:0005516~calmodulin binding 26 1.918819188 2.15E‐04 1090 140 13051 2.223630406 0.042572615 0.002715394 0.270022665
GO:0008565~protein transporter activity 18 1.328413284 7.44E‐04 1090 87 13051 2.477254034 0.139586491 0.008804668 0.930031186
GO:0051287~NAD or NADH binding 12 0.885608856 0.001370911 1090 47 13051 3.057036892 0.242031979 0.015277326 1.707529298
GO:0008134~transcription factor binding 63 4.649446494 0.001856408 1090 513 13051 1.470416868 0.312946347 0.01956104 2.305773093
GO:0002060~purine binding 4 0.295202952 0.002173309 1090 4 13051 11.9733945 0.355632614 0.021734636 2.694459373
GO:0003746~translation elongation factor activity 8 0.590405904 0.002696061 1090 24 13051 3.991131498 0.420355162 0.025634275 3.33251561
GO:0042393~histone binding 11 0.811808118 0.002826456 1090 44 13051 2.993348624 0.435464734 0.025653946 3.491071024
GO:0032403~protein complex binding 29 2.140221402 0.00346242 1090 196 13051 1.771573675 0.503723659 0.030002556 4.2609548
GO:0030674~protein binding, bridging 17 1.254612546 0.004580104 1090 94 13051 2.165401132 0.604382021 0.037900843 5.600317149
GO:0009374~biotin binding 4 0.295202952 0.005095595 1090 5 13051 9.578715596 0.643685561 0.040437346 6.212219441
GO:0033293~monocarboxylic acid binding 11 0.811808118 0.012780778 1090 54 13051 2.439024805 0.925604312 0.095105412 14.91241079
GO:0016835~carbon‐oxygen lyase activity 11 0.811808118 0.014487973 1090 55 13051 2.394678899 0.947554332 0.103434883 16.7413405
GO:0016903~oxidoreductase activity, acting on the aldehyde or oxo group of donors 8 0.590405904 0.01460093 1090 32 13051 2.993348624 0.948754712 0.100675941 16.86106648
GO:0050662~coenzyme binding 25 1.84501845 0.015696616 1090 181 13051 1.65378377 0.959068883 0.104347012 18.01421726
GO:0019904~protein domain specific binding 40 2.95202952 0.017638799 1090 331 13051 1.446935891 0.972534806 0.112926874 20.02215711
GO:0047485~protein N‐terminus binding 13 0.959409594 0.018843036 1090 74 13051 2.103434168 0.978562451 0.116580585 21.24432971
GO:0043023~ribosomal large subunit binding 3 0.221402214 0.019711058 1090 3 13051 11.9733945 0.982072119 0.11809302 22.11459372
GO:0016614~oxidoreductase activity, acting on CH‐OH group of donors 17 1.254612546 0.031290416 1090 116 13051 1.754721607 0.998374053 0.176832767 32.90825408
GO:0051087~chaperone binding 6 0.442804428 0.038048729 1090 23 13051 3.123494216 0.999604706 0.205837395 38.55349411
GO:0016859~cis‐trans isomerase activity 8 0.590405904 0.040246695 1090 39 13051 2.456080922 0.999750975 0.211075395 40.29304022
GO:0002039~p53 binding 5 0.36900369 0.047714235 1090 17 13051 3.521586616 0.999948596 0.239917178 45.87020123
GO:0003713~transcription coactivator activity 26 1.918819188 0.053957471 1090 214 13051 1.454711481 0.999986387 0.261270865 50.16055951
GO:0042153~RPTP‐like protein binding 3 0.221402214 0.05868428 1090 5 13051 7.184036697 0.999995051 0.274925813 53.19815362
GO:0032182~small conjugating protein binding 6 0.442804428 0.079014189 1090 28 13051 2.565727392 0.99999994 0.347097159 64.41904174
GO:0005048~signal sequence binding 5 0.36900369 0.079768827 1090 20 13051 2.993348624 0.999999949 0.342827243 64.78332924
GO:0003916~DNA topoisomerase activity 3 0.221402214 0.083246103 1090 6 13051 5.986697248 0.999999976 0.34833287 66.41799089
GO:0016860~intramolecular oxidoreductase activity 7 0.516605166 0.092740036 1090 38 13051 2.205625302 0.999999997 0.373804663 70.53217549
Supplementary Table 5: List of the most enriched GO Molecular Function level 3 categories from the top most frequently detected proteins in the CRAPome
Mellacheruvu Supplementary Material Page 16
Nature Methods: doi:10.1038/nmeth.2557

Supplementary Table 6: List of the most enriched GO Cellular Component level 3 categories from the top most frequently detected proteins in the CRAPome
Term Count % PValue List Total Pop Hits Pop Total Fold Enrichment Bonferroni Benjamini FDR
GO:0044424~intracellular part 1226 90.4797048 1.15E‐140 1273 10624 15283 1.385423716 3.02E‐138 3.02E‐138 1.51E‐137
GO:0044446~intracellular organelle part 760 56.0885609 7.02E‐139 1273 4225 15283 2.159569019 1.84E‐136 9.20E‐137 9.19E‐136
GO:0005622~intracellular 1233 90.99631 1.40E‐130 1273 10995 15283 1.34631924 3.68E‐128 1.23E‐128 1.84E‐127
GO:0043232~intracellular non‐membrane‐bounded organelle 555 40.9594096 1.16E‐121 1273 2596 15283 2.566660958 3.04E‐119 7.61E‐120 1.52E‐118
GO:0030529~ribonucleoprotein complex 229 16.900369 1.62E‐112 1273 515 15283 5.338367437 4.23E‐110 8.47E‐111 2.12E‐109
GO:0044428~nuclear part 432 31.8819188 3.41E‐105 1273 1822 15283 2.84652881 8.93E‐103 1.49E‐103 4.46E‐102
GO:0070013~intracellular organelle lumen 402 29.6678967 1.79E‐89 1273 1779 15283 2.712878317 4.69E‐87 6.70E‐88 2.34E‐86
GO:0043233~organelle lumen 406 29.9630996 1.23E‐88 1273 1820 15283 2.678149737 3.23E‐86 4.04E‐87 1.61E‐85
GO:0043229~intracellular organelle 1063 78.4501845 3.51E‐87 1273 8977 15283 1.421615823 9.19E‐85 1.02E‐85 4.59E‐84
GO:0005737~cytoplasm 878 64.797048 8.72E‐57 1273 7319 15283 1.440200569 2.29E‐54 2.29E‐55 1.14E‐53
GO:0005681~spliceosome 78 5.75645756 5.62E‐49 1273 132 15283 7.094158395 1.47E‐46 1.34E‐47 7.35E‐46
GO:0033279~ribosomal subunit 70 5.16605166 7.02E‐41 1273 128 15283 6.565507168 1.84E‐38 1.53E‐39 9.18E‐38
GO:0005840~ribosome 90 6.64206642 1.85E‐40 1273 215 15283 5.025557646 4.83E‐38 3.72E‐39 2.41E‐37
GO:0043231~intracellular membrane‐bounded organelle 880 64.9446494 1.10E‐37 1273 7982 15283 1.323582932 2.87E‐35 2.05E‐36 1.43E‐34
GO:0044444~cytoplasmic part 604 44.5756458 2.90E‐33 1273 4895 15283 1.481373093 7.61E‐31 5.07E‐32 3.80E‐30
GO:0044430~cytoskeletal part 161 11.8819188 6.48E‐19 1273 952 15283 2.030341712 1.70E‐16 1.06E‐17 8.47E‐16
GO:0044427~chromosomal part 88 6.49446494 2.27E‐18 1273 386 15283 2.737004913 5.95E‐16 3.50E‐17 2.97E‐15
GO:0030530~heterogeneous nuclear ribonucleoprotein complex 17 1.25461255 7.58E‐17 1273 17 15283 12.00549882 2.91E‐14 1.67E‐15 1.44E‐13
GO:0046930~pore complex 36 2.65682657 9.14E‐15 1273 95 15283 4.549452185 2.39E‐12 1.26E‐13 1.19E‐11
GO:0005643~nuclear pore 32 2.36162362 4.11E‐14 1273 79 15283 4.862986864 1.08E‐11 5.38E‐13 5.38E‐11
GO:0005635~nuclear envelope 53 3.91143911 1.61E‐13 1273 205 15283 3.103860671 4.23E‐11 2.01E‐12 2.11E‐10
GO:0031967~organelle envelope 106 7.82287823 9.79E‐13 1273 620 15283 2.052553024 2.56E‐10 1.17E‐11 1.28E‐09
GO:0000502~proteasome complex 26 1.91881919 3.79E‐12 1273 61 15283 5.117097858 9.93E‐10 4.32E‐11 4.96E‐09
GO:0009295~nucleoid 16 1.18081181 4.92E‐09 1273 31 15283 6.196386489 1.29E‐06 5.37E‐08 6.44E‐06
GO:0044429~mitochondrial part 87 6.42066421 2.64E‐07 1273 595 15283 1.755425878 6.92E‐05 2.77E‐06 3.46E‐04
GO:0005852~eukaryotic translation initiation factor 3 complex 10 0.73800738 5.88E‐07 1273 15 15283 8.003665881 1.54E‐04 5.93E‐06 7.70E‐04
GO:0005625~soluble fraction 53 3.91143911 1.11E‐06 1273 313 15283 2.032879992 2.90E‐04 1.07E‐05 0.00144894
GO:0030532~small nuclear ribonucleoprotein complex 12 0.88560886 1.15E‐06 1273 24 15283 6.002749411 3.01E‐04 1.07E‐05 0.00150321
GO:0030684~preribosome 9 0.66420664 1.98E‐06 1273 13 15283 8.311499184 5.20E‐04 1.79E‐05 0.00259582
GO:0005832~chaperonin‐containing T‐complex 7 0.51660517 2.14E‐06 1273 7 15283 12.00549882 5.60E‐04 1.87E‐05 0.0027983
GO:0031988~membrane‐bounded vesicle 79 5.8302583 6.82E‐06 1273 568 15283 1.669778885 0.001785608 5.77E‐05 0.00892658
GO:0016585~chromatin remodeling complex 19 1.40221402 1.43E‐05 1273 71 15283 3.212739121 0.003735985 1.17E‐04 0.01869421
GO:0019866~organelle inner membrane 51 3.76383764 2.24E‐05 1273 329 15283 1.861034772 0.005846417 1.78E‐04 0.0292839
GO:0016591~DNA‐directed RNA polymerase II, holoenzyme 20 1.47601476 2.74E‐05 1273 81 15283 2.964320697 0.007165559 2.11E‐04 0.03591393
GO:0031410~cytoplasmic vesicle 84 6.19926199 3.37E‐05 1273 642 15283 1.57081293 0.008796337 2.52E‐04 0.04412181
GO:0005844~polysome 9 0.66420664 4.62E‐05 1273 18 15283 6.002749411 0.012019572 3.36E‐04 0.06038252
GO:0031252~cell leading edge 27 1.99261993 6.30E‐05 1273 138 15283 2.348901943 0.016382312 4.46E‐04 0.0824723
GO:0005839~proteasome core complex 9 0.66420664 1.14E‐04 1273 20 15283 5.40247447 0.02948591 7.87E‐04 0.14938362
GO:0000786~nucleosome 16 1.18081181 1.57E‐04 1273 63 15283 3.049015574 0.040364036 0.001055885 0.20558621
GO:0042995~cell projection 86 6.34686347 2.10E‐04 1273 697 15283 1.481309754 0.053583238 0.001375859 0.27470454
GO:0005853~eukaryotic translation elongation factor 1 complex 5 0.36900369 2.23E‐04 1273 5 15283 12.00549882 0.056766215 0.001424378 0.29148413
GO:0016459~myosin complex 16 1.18081181 2.28E‐04 1273 65 15283 2.95519971 0.057997568 0.001421546 0.29798985
GO:0012505~endomembrane system 92 6.7896679 6.24E‐04 1273 782 15283 1.412411626 0.150841959 0.003795337 0.81339613
GO:0000796~condensin complex 5 0.36900369 6.25E‐04 1273 6 15283 10.00458235 0.15104583 0.003714676 0.81458572
GO:0005732~small nucleolar ribonucleoprotein complex 8 0.5904059 8.01E‐04 1273 20 15283 4.802199529 0.189284034 0.004652201 1.04265184
GO:0031965~nuclear membrane 16 1.18081181 8.52E‐04 1273 73 15283 2.631342207 0.200126286 0.004842615 1.10917966
Mellacheruvu Supplementary Material Page 17
Nature Methods: doi:10.1038/nmeth.2557
User manual – CRAPome version 1.1 (March 2013)
Prepared by Datta Mellacheruvu, Anne-‐Claude Gingras and Alexey Nesvizhskii,
1. Introduction
This tutorial describes the Contaminant Repository for Affinity Purification, its web interface, and related tools, collectively referred to as CRAPome (www.crapome.org). The contaminant repository contains the lists of proteins identified in negative control experiments collected using affinity purification followed by mass spectrometry (AP-‐MS). Original MS data for each experiment are obtained from the data creator(s), generally as .raw or mzXML/mzML files (mgf files are also accepted if raw/mzXML data cannot be obtained for any reason). MS/MS data are processed by the repository administrator using a uniform data analysis pipeline consisting of an X!Tandem database search against the RefSeq protein sequence database (H. sapiens data) or SGD (S. cerevisiae), followed by PeptideProphet and ProteinProphet analysis (part of the Trans-‐Proteomic Pipeline). Each experiment in the CRAPome represents a biological replicate (technical replicates, i.e. repeated LC-‐MS/MS runs on the same affinity purified sample, or multiple fractions as in the case of 1D SDS-‐PAGE separation, are combined into a single protein list). Protein identifications are mapped to genes and stored in a database along with their abundance information (spectral counts). CRAPome controls are associated with an experimental description via text-‐based protocols and controlled vocabularies. Users query the database via a web interface at www.crapome.org, using different user workflows (described below). Some functionality in workflow 2 and workflow 3 require user registration. The database currently contains data from H. sapiens and S. cerevisiae AP-‐MS experiments only: as the database expands, additional species will be added. As of March 2013, the database contains ~350 experiments generated using ~75 unique protocols that were deposited by 12 laboratories.
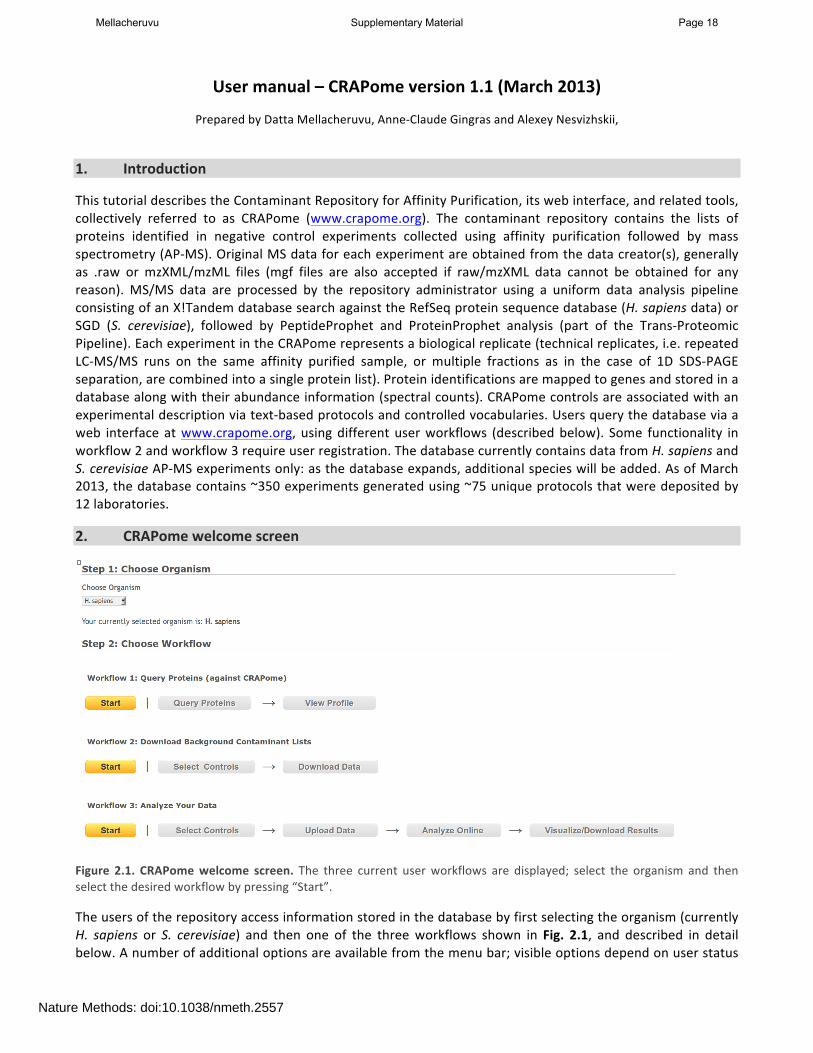
2. CRAPome welcome screen
Figure 2.1. CRAPome welcome screen. The three current user workflows are displayed; select the organism and then select the desired workflow by pressing “Start”.
The users of the repository access information stored in the database by first selecting the organism (currently H. sapiens or S. cerevisiae) and then one of the three workflows shown in Fig. 2.1, and described in detail below. A number of additional options are available from the menu bar; visible options depend on user status
Mellacheruvu Supplementary Material Page 18
Nature Methods: doi:10.1038/nmeth.2557
(e.g. end user, data contributor/annotator, admin). Selecting an organism sets the context and filters the data appropriately throughout the application. H. sapiens is selected for this tutorial.
3. Workflow 1: Query selected proteins
This workflow allows the user to query for selected protein(s) of interest and view their profiles across different negative control experiments.
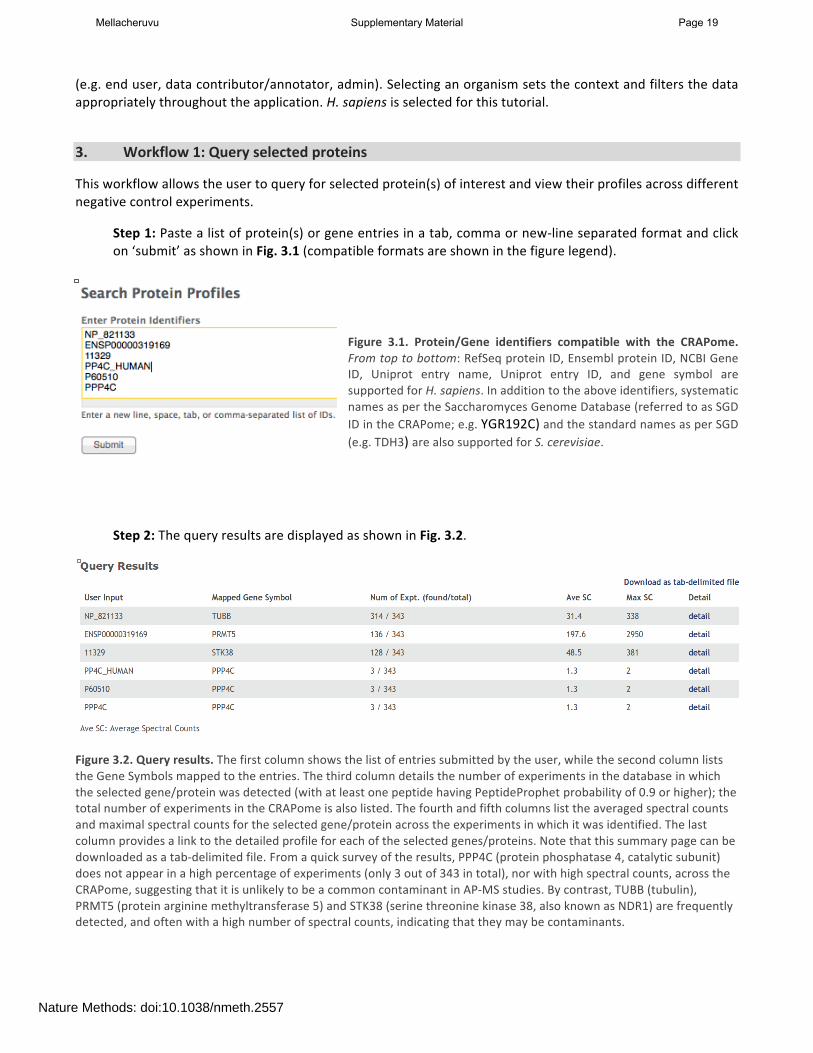
Step 1: Paste a list of protein(s) or gene entries in a tab, comma or new-‐line separated format and click on ‘submit’ as shown in Fig. 3.1 (compatible formats are shown in the figure legend).
Figure 3.1. Protein/Gene identifiers compatible with the CRAPome. From top to bottom: RefSeq protein ID, Ensembl protein ID, NCBI Gene ID, Uniprot entry name, Uniprot entry ID, and gene symbol are supported for H. sapiens. In addition to the above identifiers, systematic names as per the Saccharomyces Genome Database (referred to as SGD ID in the CRAPome; e.g. YGR192C) and the standard names as per SGD (e.g. TDH3) are also supported for S. cerevisiae.
Step 2: The query results are displayed as shown in Fig. 3.2.
Figure 3.2. Query results. The first column shows the list of entries submitted by the user, while the second column lists the Gene Symbols mapped to the entries. The third column details the number of experiments in the database in which the selected gene/protein was detected (with at least one peptide having PeptideProphet probability of 0.9 or higher); the total number of experiments in the CRAPome is also listed. The fourth and fifth columns list the averaged spectral counts and maximal spectral counts for the selected gene/protein across the experiments in which it was identified. The last column provides a link to the detailed profile for each of the selected genes/proteins. Note that this summary page can be downloaded as a tab-‐delimited file. From a quick survey of the results, PPP4C (protein phosphatase 4, catalytic subunit) does not appear in a high percentage of experiments (only 3 out of 343 in total), nor with high spectral counts, across the CRAPome, suggesting that it is unlikely to be a common contaminant in AP-‐MS studies. By contrast, TUBB (tubulin), PRMT5 (protein arginine methyltransferase 5) and STK38 (serine threonine kinase 38, also known as NDR1) are frequently detected, and often with a high number of spectral counts, indicating that they may be contaminants.
Mellacheruvu Supplementary Material Page 19
Nature Methods: doi:10.1038/nmeth.2557
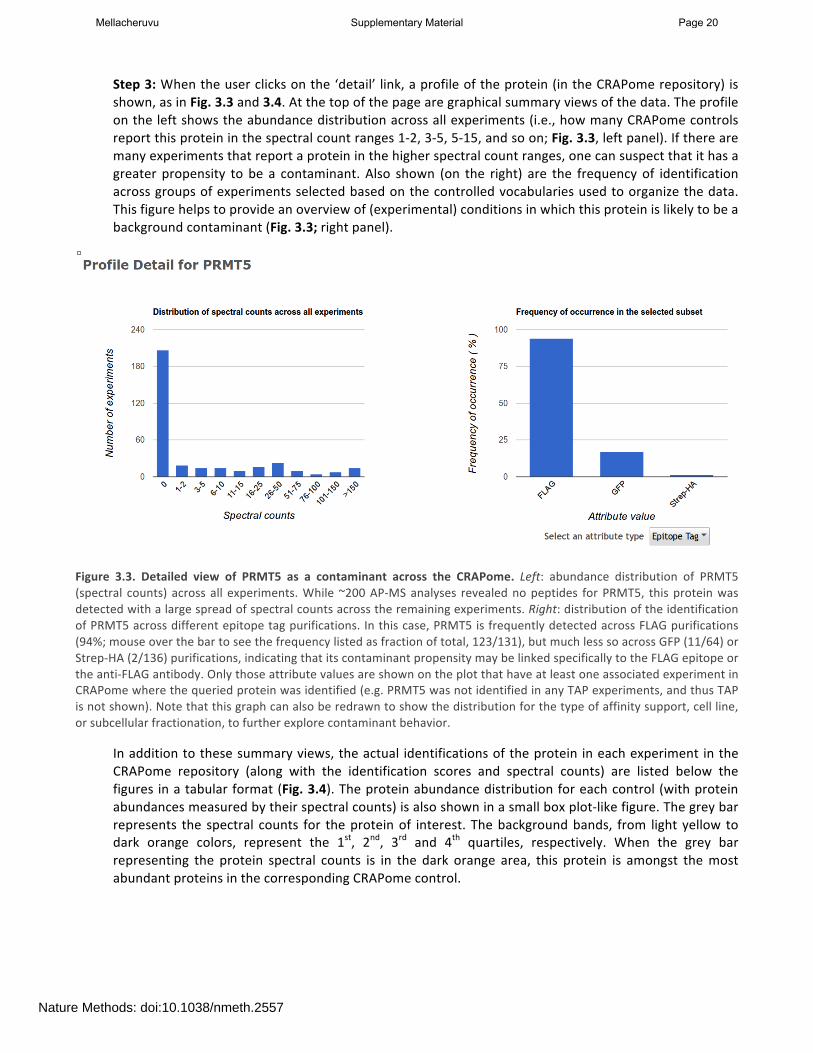
Step 3: When the user clicks on the ‘detail’ link, a profile of the protein (in the CRAPome repository) is shown, as in Fig. 3.3 and 3.4. At the top of the page are graphical summary views of the data. The profile on the left shows the abundance distribution across all experiments (i.e., how many CRAPome controls report this protein in the spectral count ranges 1-‐2, 3-‐5, 5-‐15, and so on; Fig. 3.3, left panel). If there are many experiments that report a protein in the higher spectral count ranges, one can suspect that it has a greater propensity to be a contaminant. Also shown (on the right) are the frequency of identification across groups of experiments selected based on the controlled vocabularies used to organize the data. This figure helps to provide an overview of (experimental) conditions in which this protein is likely to be a background contaminant (Fig. 3.3; right panel).
Figure 3.3. Detailed view of PRMT5 as a contaminant across the CRAPome. Left: abundance distribution of PRMT5 (spectral counts) across all experiments. While ~200 AP-‐MS analyses revealed no peptides for PRMT5, this protein was detected with a large spread of spectral counts across the remaining experiments. Right: distribution of the identification of PRMT5 across different epitope tag purifications. In this case, PRMT5 is frequently detected across FLAG purifications (94%; mouse over the bar to see the frequency listed as fraction of total, 123/131), but much less so across GFP (11/64) or Strep-‐HA (2/136) purifications, indicating that its contaminant propensity may be linked specifically to the FLAG epitope or the anti-‐FLAG antibody. Only those attribute values are shown on the plot that have at least one associated experiment in CRAPome where the queried protein was identified (e.g. PRMT5 was not identified in any TAP experiments, and thus TAP is not shown). Note that this graph can also be redrawn to show the distribution for the type of affinity support, cell line, or subcellular fractionation, to further explore contaminant behavior.
In addition to these summary views, the actual identifications of the protein in each experiment in the CRAPome repository (along with the identification scores and spectral counts) are listed below the figures in a tabular format (Fig. 3.4). The protein abundance distribution for each control (with protein abundances measured by their spectral counts) is also shown in a small box plot-‐like figure. The grey bar represents the spectral counts for the protein of interest. The background bands, from light yellow to dark orange colors, represent the 1st, 2nd, 3rd and 4th quartiles, respectively. When the grey bar representing the protein spectral counts is in the dark orange area, this protein is amongst the most abundant proteins in the corresponding CRAPome control.
Mellacheruvu Supplementary Material Page 20
Nature Methods: doi:10.1038/nmeth.2557
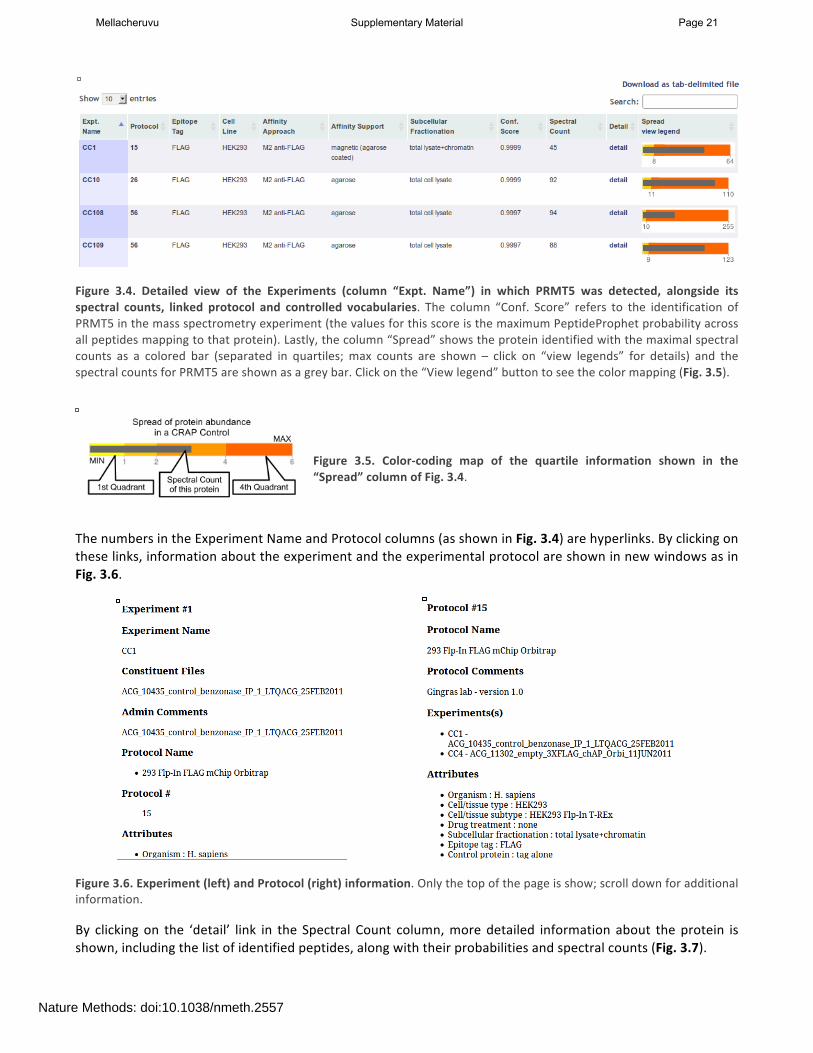
Figure 3.4. Detailed view of the Experiments (column “Expt. Name”) in which PRMT5 was detected, alongside its spectral counts, linked protocol and controlled vocabularies. The column “Conf. Score” refers to the identification of PRMT5 in the mass spectrometry experiment (the values for this score is the maximum PeptideProphet probability across all peptides mapping to that protein). Lastly, the column “Spread” shows the protein identified with the maximal spectral counts as a colored bar (separated in quartiles; max counts are shown – click on “view legends” for details) and the spectral counts for PRMT5 are shown as a grey bar. Click on the “View legend” button to see the color mapping (Fig. 3.5).
Figure 3.5. Color-‐coding map of the quartile information shown in the “Spread” column of Fig. 3.4.
The numbers in the Experiment Name and Protocol columns (as shown in Fig. 3.4) are hyperlinks. By clicking on these links, information about the experiment and the experimental protocol are shown in new windows as in Fig. 3.6.
Figure 3.6. Experiment (left) and Protocol (right) information. Only the top of the page is show; scroll down for additional information.
By clicking on the ‘detail’ link in the Spectral Count column, more detailed information about the protein is shown, including the list of identified peptides, along with their probabilities and spectral counts (Fig. 3.7).
Mellacheruvu Supplementary Material Page 21
Nature Methods: doi:10.1038/nmeth.2557

Figure 3.7. Peptide summary view for a selected protein (STK38) in one experiment (CC138)
The summary table can be downloaded as an Excel-‐compatible table (Fig. 3.7).
Figure 3.8. Summary table. The columns are as follows: A) ID (a unique identifier for the detection of a given protein across the database; B) ipName, the unique identifier for the experiment in the CRAPome; C) protID, the mapped Official Gene Symbol; D) numSpec, the spectral counts associated with PRMT5 in the experiment; E) exptSum, the sum of all spectra assigned in the experiment; F) exptFreq, how often PRMT5 has been detected across the CRAPome; G-‐J) quartiles (defined by their spectral count boundaries); K) protocol used for the experiment; L-‐O) Selected controlled vocabulary values; P-‐R) protein probability scores.
4. Workflow 2: Create contaminant lists
This workflow allows the user to download subsets of data from the CRAPome repository. Each control experiment (CRAPome Control, or CC) is assigned a unique identifier (CC1-‐CCx), linked to a protocol, and annotated with standard vocabulary (such as the epitope tag type, cell line, affinity matrix, etc.). These attributes can be used to filter the list of available CRAPome controls. These filters are available on the left as shown in Fig. 4.1.
Step 1: Use the filters on the left (Fig. 4.1) to narrow down the list of negative controls. Step 2: “Add” each desired CRAPome control of interest by clicking the button in the table. If desired, select the “Add All” button instead. Added controls will appear in the “Selected controls” box on the right. There is a limit of 30 controls that can be selected at the same time. A link at the top of the home page provides an option to download the entire database content as a tab-‐delimited text. Step 3 (optional): Give this list of selected controls a name and save it for future use (note that this option is restricted to registered users). If you wish to reload a previously saved list, you can do so by clicking the “load” link.
Mellacheruvu Supplementary Material Page 22
Nature Methods: doi:10.1038/nmeth.2557

Figure 4.1. Selection of CRAPome controls in User Workflow 2. Left panel: available controlled vocabularies to filter the list of controls (selecting different options across categories is equivalent to an “and” function; selecting multiple boxes within a category corresponds to an “or” function, as shown here with the selection of HA tag and HaloTag experiments from the database. Middle: table of the controls that passed the selected filters. Clicking on the control name (first column) or the protocol name (third column) displays extended information. The second column lists the number of proteins identified in each of the controls. A limited view of the controlled vocabularies is shown in columns 4-‐8. Controls are added to the list by clicking on the “Add” or “Add All” buttons in the last column (note that added controls can also be manually removed). Alternatively, controls can be added by loading a previously saved list (right, bottom). Once the desired controls are selected, the data table can be generated by pressing the blue “Next” button at the top right of the page.
Step 4: Click on “Next” button at the top of the page to view and/or download the data matrix (Fig. 4.2). The data matrix can be downloaded as an Excel compatible table using the “download data matrix” option. Step 5 (optional): Specific proteins can be queried in the data matrix by typing partial or complete gene name (wild cards are automatically added at the beginning and end).
Mellacheruvu Supplementary Material Page 23
Nature Methods: doi:10.1038/nmeth.2557

Figure 4.2. Detailed table output for the User Workflow 2 – limited for search term “ACTA” across all experiments selected based on “Epitope tag = HA” in the previous step. The complete list of the proteins identified across the selected CRAPome controls is shown by default. It can be also restricted to a selected search term (here: “ACTA”). NUM_EXPT is the number of experiments (among the experiments selected in the previous step) in which the protein was identified (4 and 3 experiments for ACTA1 and ACTA2, respectively). Also shown are the averaged spectral counts (AVE_SC) across the experiments in which the protein was identified, and the spectral counts in each of the selected experiments (CC51, CC52, CC53, CC54; highlighted in pink cells). Mapped IDs (RefSeq ID and Uniprot ID) are also provided in the table.
5. Workflow 3: Use the CRAPome to analyze your data.
This workflow allows the user to process his/her data online using the CRAPome controls and the scoring tools implemented within the system. This workflow is only available to registered users. The minimum requirement is for the user to submit information regarding one bait (one sample), though we strongly advocate the use of biological replicates for the bait, and recommend that the user also uploads his/her own negative control runs.
Step 1: Select the CRAPome database controls that are most similar to the user data using controlled vocabularies and detailed protocols as shown for workflow 2 above (see Fig. 4.1). Selected controls can be saved as a list and reloaded as needed as in workflow 2. Press the blue “Next” button to navigate to the next page. Step 2: Upload user data (See Fig. 5.1). The data should be formatted as per instructions on the webpage (also see Fig. 5.2). Once uploaded, the data appear in the ‘user data’ section below. Step 3 (optional): If the user would like to exclude some of his/her data from the analysis, it can be done at this stage by clicking on ‘remove’ button. Similarly, one can go back and add/remove CRAPome controls. For a quick preview of the data matrix, click on ‘Preview Data Matrix’. After the analysis is complete, the data can be deleted by clicking on ‘clear uploaded user data’ (See Fig. 5.1). Step 4: Proceed to the analysis section by clicking on ‘Next’. Here, Fold Change calculations and SAINT probability scoring can be used to generate ranked lists of bait-‐prey interactions.
Mellacheruvu Supplementary Material Page 24
Nature Methods: doi:10.1038/nmeth.2557

Figure 5.1. Upload user data. The top of the page enables browsing to upload the user data prepared in a comma-‐separated values (CSV) file (see Fig. 5.2). The table should not have headers and should consist of four columns: 1) Bait Name; 2) AP Name (the name you are giving to this particular affinity purification); 3) Prey Name; 4) Spectral Counts. Negative control analyses should be labeled "CONTROL" in the "Bait Name" column. The "Prey Name" can be either a RefSeq protein ID, Ensembl protein ID, Uniprot entry name, Uniprot entry ID or gene symbol (SGD systematic gene name or standard name for S. cerevisiae). For mapping purposes, we strongly suggest also using one of these identifiers for the "Bait Name". Different "AP Names" will automatically be merged for analysis if they are assigned to the same "Bait Name". The bottom left of the page lists the User data that was uploaded while the bottom right lists the selected CRAPome controls.
Figure 5.2. Sample column format for upload. Column A is the BAIT name, column B the identifier for the experiment (AP name), column C the PREY identifier (here RefSeq protein ID) and column D is the spectral count for the PREY in the AP.
Step 5: Select desired scoring options for Fold Change calculations (Fig. 5.3). Two different Fold Change calculations are generated by default. The first one (FC-‐A; standard) estimates the background by averaging the spectral counts across the selected controls while the second one (FC-‐B; stringent) estimates the background by combining the top 3 values for each prey. Combining scores from biological replicates of a bait purification is performed in FC-‐A by a simple averaging, while FC-‐B performs a more stringent geometric mean calculation. These parameters are preselected by default, but may be modified by the user as required. The user can also specify what set of controls to use (user controls alone or in combination with selected CRAPome controls). A series of worked examples of the use of the CRAPome for scoring interactions is made available on the CRAPome site, under “Supplementary data”. Step 6 (optional): The user can specify whether to run SAINT or not, and which SAINT options (‘lowMode’, ‘minFold’, ‘norm’) should be employed. Briefly, “lowMode” is an option useful when looking at interconnected datasets (i.e. datasets in which the baits share interactors). In the “lowMode” default setting (“off”), interactions which are detected with multiple baits are penalized, since SAINT expect them to be frequent fliers. Turning lowMode “on” partially alleviates this penalty, enabling more
Mellacheruvu Supplementary Material Page 25
Nature Methods: doi:10.1038/nmeth.2557
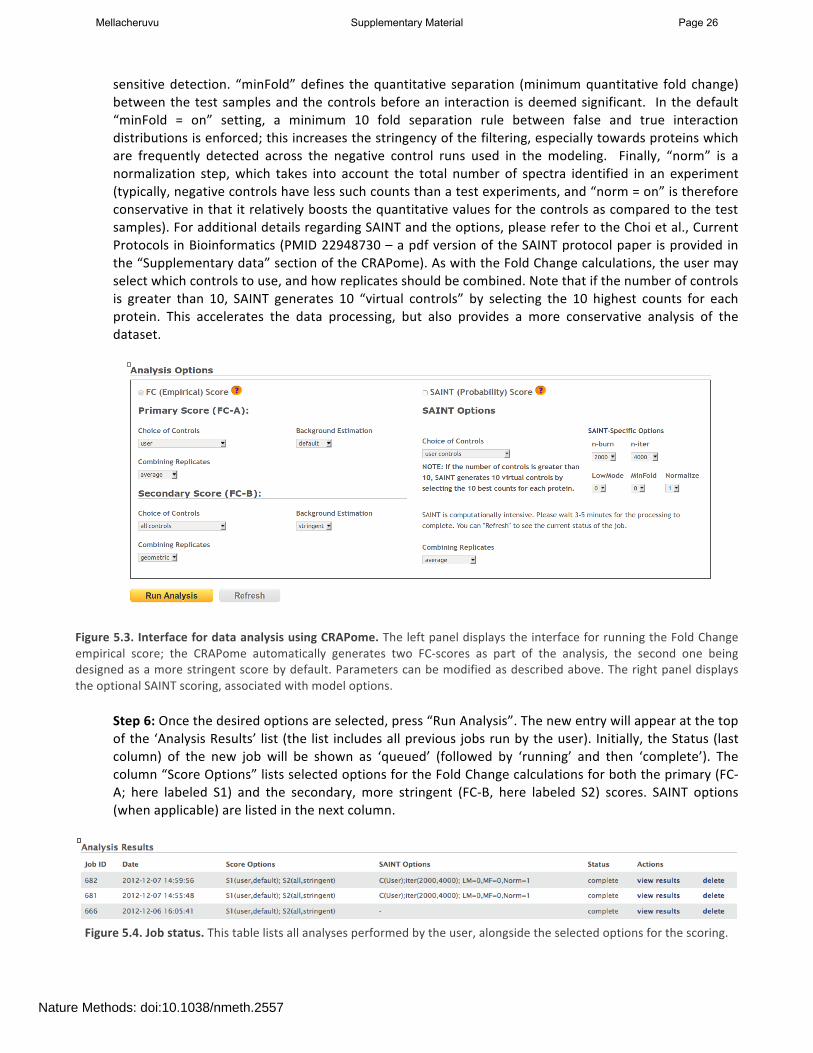
sensitive detection. “minFold” defines the quantitative separation (minimum quantitative fold change) between the test samples and the controls before an interaction is deemed significant. In the default “minFold = on” setting, a minimum 10 fold separation rule between false and true interaction distributions is enforced; this increases the stringency of the filtering, especially towards proteins which are frequently detected across the negative control runs used in the modeling. Finally, “norm” is a normalization step, which takes into account the total number of spectra identified in an experiment (typically, negative controls have less such counts than a test experiments, and “norm = on” is therefore conservative in that it relatively boosts the quantitative values for the controls as compared to the test samples). For additional details regarding SAINT and the options, please refer to the Choi et al., Current Protocols in Bioinformatics (PMID 22948730 – a pdf version of the SAINT protocol paper is provided in the “Supplementary data” section of the CRAPome). As with the Fold Change calculations, the user may select which controls to use, and how replicates should be combined. Note that if the number of controls is greater than 10, SAINT generates 10 “virtual controls” by selecting the 10 highest counts for each protein. This accelerates the data processing, but also provides a more conservative analysis of the dataset.
Figure 5.3. Interface for data analysis using CRAPome. The left panel displays the interface for running the Fold Change empirical score; the CRAPome automatically generates two FC-‐scores as part of the analysis, the second one being designed as a more stringent score by default. Parameters can be modified as described above. The right panel displays the optional SAINT scoring, associated with model options.
Step 6: Once the desired options are selected, press “Run Analysis”. The new entry will appear at the top of the ‘Analysis Results’ list (the list includes all previous jobs run by the user). Initially, the Status (last column) of the new job will be shown as ‘queued’ (followed by ‘running’ and then ‘complete’). The column “Score Options” lists selected options for the Fold Change calculations for both the primary (FC-‐A; here labeled S1) and the secondary, more stringent (FC-‐B, here labeled S2) scores. SAINT options (when applicable) are listed in the next column.
Figure 5.4. Job status. This table lists all analyses performed by the user, alongside the selected options for the scoring.
Mellacheruvu Supplementary Material Page 26
Nature Methods: doi:10.1038/nmeth.2557
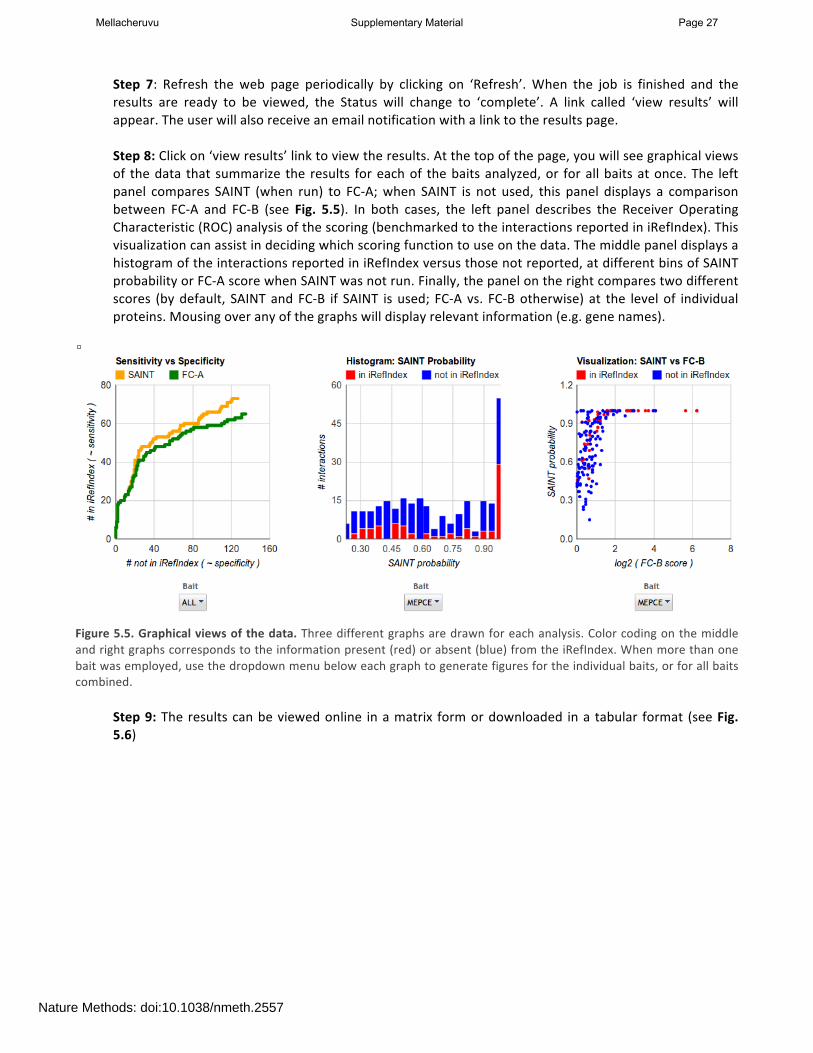
Step 7: Refresh the web page periodically by clicking on ‘Refresh’. When the job is finished and the results are ready to be viewed, the Status will change to ‘complete’. A link called ‘view results’ will appear. The user will also receive an email notification with a link to the results page. Step 8: Click on ‘view results’ link to view the results. At the top of the page, you will see graphical views of the data that summarize the results for each of the baits analyzed, or for all baits at once. The left panel compares SAINT (when run) to FC-‐A; when SAINT is not used, this panel displays a comparison between FC-‐A and FC-‐B (see Fig. 5.5). In both cases, the left panel describes the Receiver Operating Characteristic (ROC) analysis of the scoring (benchmarked to the interactions reported in iRefIndex). This visualization can assist in deciding which scoring function to use on the data. The middle panel displays a histogram of the interactions reported in iRefIndex versus those not reported, at different bins of SAINT probability or FC-‐A score when SAINT was not run. Finally, the panel on the right compares two different scores (by default, SAINT and FC-‐B if SAINT is used; FC-‐A vs. FC-‐B otherwise) at the level of individual proteins. Mousing over any of the graphs will display relevant information (e.g. gene names).
Figure 5.5. Graphical views of the data. Three different graphs are drawn for each analysis. Color coding on the middle and right graphs corresponds to the information present (red) or absent (blue) from the iRefIndex. When more than one bait was employed, use the dropdown menu below each graph to generate figures for the individual baits, or for all baits combined.
Step 9: The results can be viewed online in a matrix form or downloaded in a tabular format (see Fig. 5.6)
Mellacheruvu Supplementary Material Page 27
Nature Methods: doi:10.1038/nmeth.2557

Figure 5.6. Results table. Preys are listed in rows. The columns are as follows: PROTID, the protein name in the upload file; GENENAMES, the mapped Gene Name. The rest of the columns describe the data: B1 indicates Bait 1 (in this case, EIF4A2). FC_A and FC_B are Fold Changes A and B, respectively; SP is the SAINT probability, and IREF denotes an interaction reported in iRefIndex (1 = reported; 0 = not reported). The table has many more columns than can fit in this window, including spectral counts for every replicate (R1 is replicate 1) of a bait purification, and for every selected control. The table can be downloaded in matrix and list formats (compatible with Cytoscape). SAINT results files can also be downloaded.
Mellacheruvu Supplementary Material Page 28
Nature Methods: doi:10.1038/nmeth.2557

Annotator Manual – CRAPome version 1.0
Prepared by Datta Mellacheruvu; Edited by Anne-‐Claude Gingras, December 2012
1: Overview The CRAPome is a repository of negative controls performed in affinity purification coupled with mass spectrometry (AP-‐MS) experiments. Negative controls are collected from various studies (published or unpublished), processed, annotated and made available for download and analysis via an online interface. See User Manual for details. An Annotator is usually the contributor of mass spectrometry data to the CRAPome. Contributors first submit raw mass spectrometry files to the CRAPome administrator. The administrator processes them to yield protein identifiers and spectral counts, assigns an experiment number to each of the files that passed a quality control step (these experiments are labeled CCx; CRAPome Control x), and releases them for annotation. The Annotator defines protocols to describe the experimental procedures and links the protocols to each experiment. Protocols include controlled vocabularies and free text. 2. Accessing the system as an Annotator and viewing existing experiments and protocols Annotators are assigned a higher level of privileges than regular registered users. They can create protocols and link protocols to experiments. Annotator-‐level login access can be requested by emailing the CRAPome administrator. Use the login credentials to enter the CRAPome (Fig. 2.1). The Annotator menu bar will look like Fig. 2.2. Figure 2.1. Welcome screen at the www.CRAPome.org database. Enter username and password as prompted.
Figure 2.2. Annotator menu bar. “Experiments” lists all the experiments that the annotator has access to (those that have been contributed by their laboratory). “Protocols” lists all the protocols in the CRAPome, but enables editing only those protocols belonging to the Annotator. “Define Experiment” and “Define Protocol” enable the creation of new data.
Mellacheruvu Supplementary Material Page 29
Nature Methods: doi:10.1038/nmeth.2557

Select the “Experiments” tab to view the list of all experiments contributed by the Annotator laboratory (Fig. 2.3). Click on an Experiment Name (here CC40) to view the associated details (Fig. 2.4). Similarly, select the “Protocols” tab to view the list of all protocols available in the CRAPome (only those protocols contributed by the Annotator laboratory can be edited; Fig. 2.5). Clicking on the name or protocol number opens a new window with the protocol details (Fig. 2.6).
Figure 2.3. Experiment View. The procedure for creating and editing protocols will be described in section 3. Figure 2.4. Experiment details. Only the top portion of the Experimental details view is shown.
Mellacheruvu Supplementary Material Page 30
Nature Methods: doi:10.1038/nmeth.2557
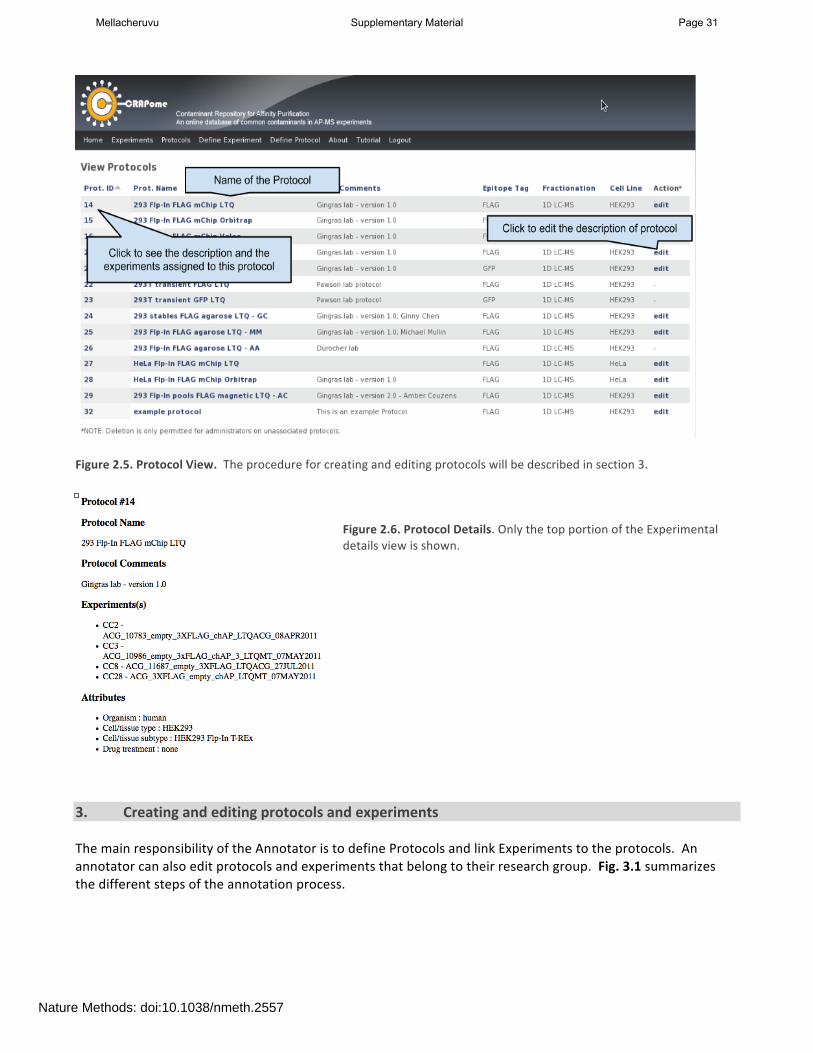
Figure 2.5. Protocol View. The procedure for creating and editing protocols will be described in section 3.
Figure 2.6. Protocol Details. Only the top portion of the Experimental details view is shown.
3. Creating and editing protocols and experiments The main responsibility of the Annotator is to define Protocols and link Experiments to the protocols. An annotator can also edit protocols and experiments that belong to their research group. Fig. 3.1 summarizes the different steps of the annotation process.
Mellacheruvu Supplementary Material Page 31
Nature Methods: doi:10.1038/nmeth.2557
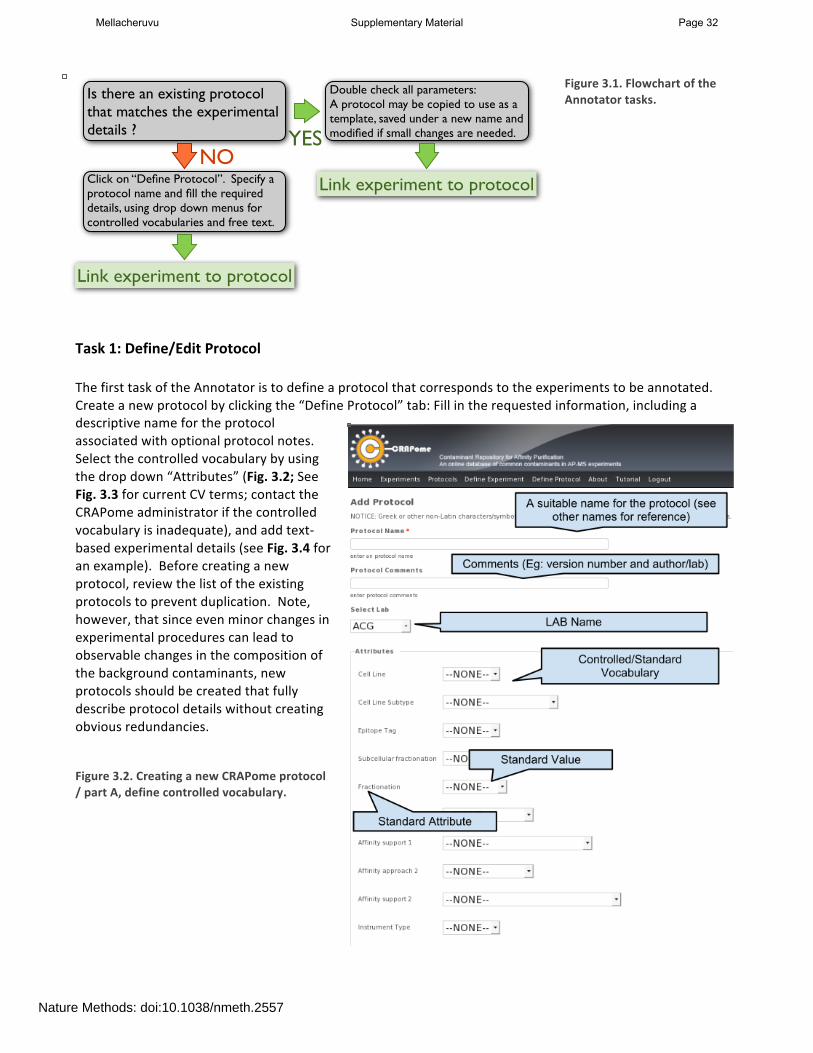
Figure 3.1. Flowchart of the Annotator tasks.
Task 1: Define/Edit Protocol The first task of the Annotator is to define a protocol that corresponds to the experiments to be annotated. Create a new protocol by clicking the “Define Protocol” tab: Fill in the requested information, including a descriptive name for the protocol associated with optional protocol notes. Select the controlled vocabulary by using the drop down “Attributes” (Fig. 3.2; See Fig. 3.3 for current CV terms; contact the CRAPome administrator if the controlled vocabulary is inadequate), and add text-‐based experimental details (see Fig. 3.4 for an example). Before creating a new protocol, review the list of the existing protocols to prevent duplication. Note, however, that since even minor changes in experimental procedures can lead to observable changes in the composition of the background contaminants, new protocols should be created that fully describe protocol details without creating obvious redundancies. Figure 3.2. Creating a new CRAPome protocol / part A, define controlled vocabulary.
Is there an existing protocol that matches the experimental details ?
Double check all parameters:A protocol may be copied to use as a template, saved under a new name and modified if small changes are needed.YES
NOClick on “Define Protocol”. Specify a protocol name and fill the required details, using drop down menus for controlled vocabularies and free text.
Link experiment to protocol
Link experiment to protocol
Mellacheruvu Supplementary Material Page 32
Nature Methods: doi:10.1038/nmeth.2557
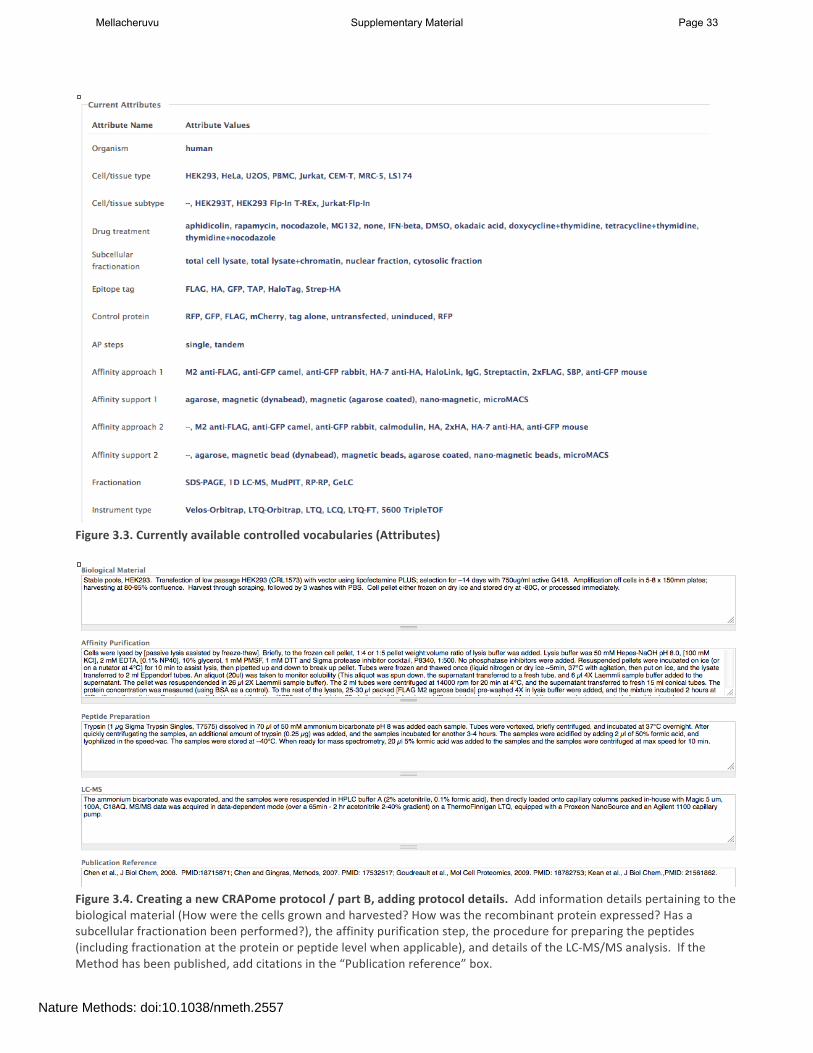
Figure 3.3. Currently available controlled vocabularies (Attributes)
Figure 3.4. Creating a new CRAPome protocol / part B, adding protocol details. Add information details pertaining to the biological material (How were the cells grown and harvested? How was the recombinant protein expressed? Has a subcellular fractionation been performed?), the affinity purification step, the procedure for preparing the peptides (including fractionation at the protein or peptide level when applicable), and details of the LC-‐MS/MS analysis. If the Method has been published, add citations in the “Publication reference” box.
Mellacheruvu Supplementary Material Page 33
Nature Methods: doi:10.1038/nmeth.2557

Task 2: Link protocols to experiments The general pipeline for the addition of experiments to the CRAPome database begins by the processing of the raw mass spectrometry files by the CRAPome administrator. The CRAPome administrator then defines the experiments with some basic information (such as the name of the spectrum file and the laboratory that deposited the data) and initiates the processing of data. The role of the Annotator is to “edit” such experiments by linking protocols to them. To do so, the Annotator access the list of his/her experiments by selecting the “Experiments” tab at the top of the page (as in Fig. 2.3). Experiments which are already linked to a protocol (e.g. CC5 in Fig. 3.4) already have controlled vocabularies associated with them, in addition to the protocol number and protocol name. Experiments which are not yet associated are missing this information (see CC40 in Fig. 3.4). To associate protocols and controlled vocabularies, select the “edit” link on the right. This will open a new window: information entered by the administrator is displayed, but not editable (please contact the CRAPome administrator to report any errors). The Annotator should change the “Experiment Status” to “Annotated” (from the default “newly added”), and link the experiment to a protocol via the drop-‐down menu. When the annotator selects a protocol for an experiment (see Fig. 3.5), all the attributes of the experiment (“controlled vocabularies”) are populated with the attributes of the protocol (see Fig. 3.6).
Figure 3.4. Experiments view. Clicking on “edit” on the right enable linking a protocol to the experiment.
Figure 3.5. Edit experiment view. Data entered by the administrator is greyed out. Select a protocol to link to the experiment. Create new protocols as needed, as described above.
Mellacheruvu Supplementary Material Page 34
Nature Methods: doi:10.1038/nmeth.2557
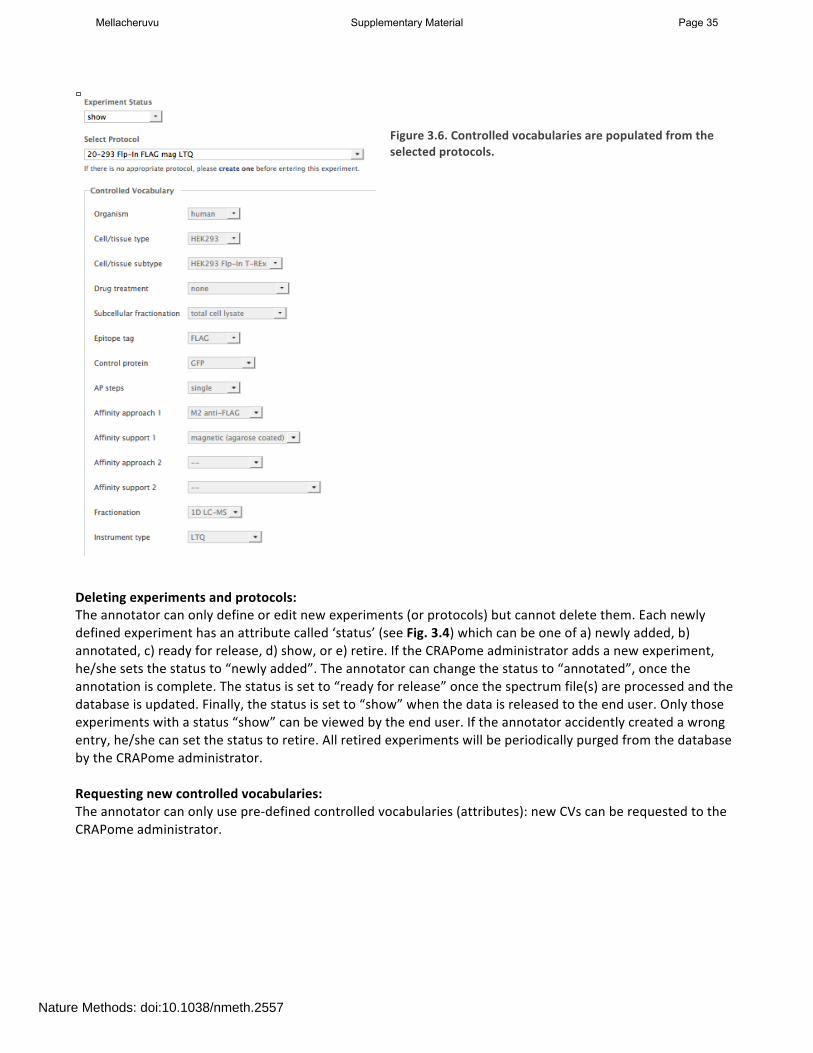
Figure 3.6. Controlled vocabularies are populated from the selected protocols.
Deleting experiments and protocols: The annotator can only define or edit new experiments (or protocols) but cannot delete them. Each newly defined experiment has an attribute called ‘status’ (see Fig. 3.4) which can be one of a) newly added, b) annotated, c) ready for release, d) show, or e) retire. If the CRAPome administrator adds a new experiment, he/she sets the status to “newly added”. The annotator can change the status to “annotated”, once the annotation is complete. The status is set to “ready for release” once the spectrum file(s) are processed and the database is updated. Finally, the status is set to “show” when the data is released to the end user. Only those experiments with a status “show” can be viewed by the end user. If the annotator accidently created a wrong entry, he/she can set the status to retire. All retired experiments will be periodically purged from the database by the CRAPome administrator. Requesting new controlled vocabularies: The annotator can only use pre-‐defined controlled vocabularies (attributes): new CVs can be requested to the CRAPome administrator.
Mellacheruvu Supplementary Material Page 35
Nature Methods: doi:10.1038/nmeth.2557


