
www.sciencesignaling.org/cgi/content/full/4/154/rs1/DC1
Supplementary Materials for
A Genome-Wide RNAi Screen Identifies Core Components of the G2-M DNA Damage Checkpoint
Shu Kondo and Norbert Perrimon*
*To whom correspondence should be addressed. E-mail: [email protected]
Published 4 January 2011, Sci. Signal. 4, rs1 (2011)
DOI: 10.1126/scisignal.2001350 This PDF file includes:
Fig. S1. Caffeine-sensitive G2-M checkpoint of Drosophila S2R+ cells. Fig. S2. Cell cycle profiles of cells depleted of the candidate genes. Fig. S3. Secondary screen for mitotic exit defects. Fig. S4. G2-M checkpoint defect of cells depleted of the candidate genes. Fig. S5. DNA damage–induced phosphorylation of histone H2Av in cells depleted of candidate genes. Fig. S6. Mitotic index and cell cycle profile of cells depleted of pre-IC proteins. Table S1. Genes required for the G2-M checkpoint induced by doxorubicin. Table S2. Primary hits excluded from further analysis and reasons for exclusion. Table S3. Statistics of the secondary screens. Table S4. Sequences of primers used for synthesizing dsRNA templates. References
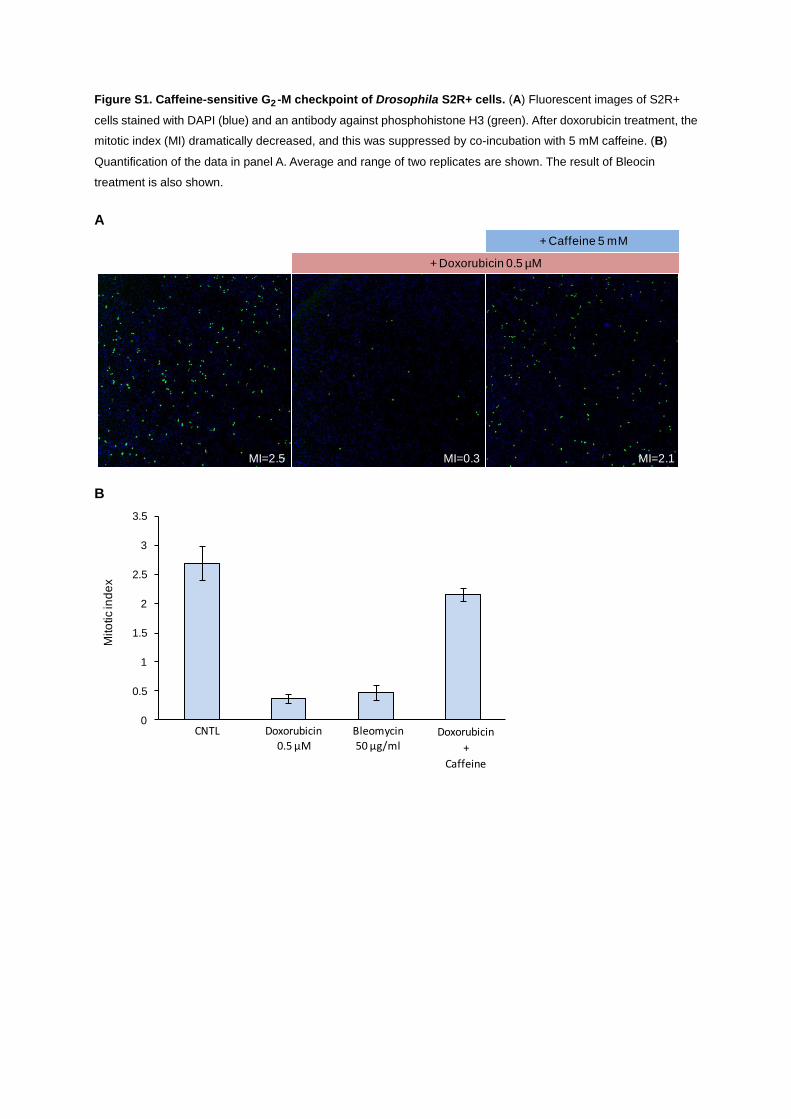
cells stained with DAPI (blue) and an antibody against phosphohistone H3 (green). After doxorubicin treatment, the
Quantification of the data in panel A. Average and range of two replicates are shown. The result of Bleocin
treatment is also shown.
A
B
+ Doxorubicin 0.5 µM
MI=2.5 MI=0.3
+ Caffeine 5 mM
MI=2.1
0
0.5
1
1.5
2
2.5
3
3.5
CNTL Doxorubicin0.5 µM
Bleomycin50 µg/ml
Doxorubicin
+
Caffeine
Mito
tic in
de
xFigure S1. Caffeine-sensitive G -M checkpoint of Drosophila S2R+ cells. (A) Fluorescent images of S2R+
mitotic index (MI) dramatically decreased, and this was suppressed by co-incubation with 5 mM caffeine. (B)
2

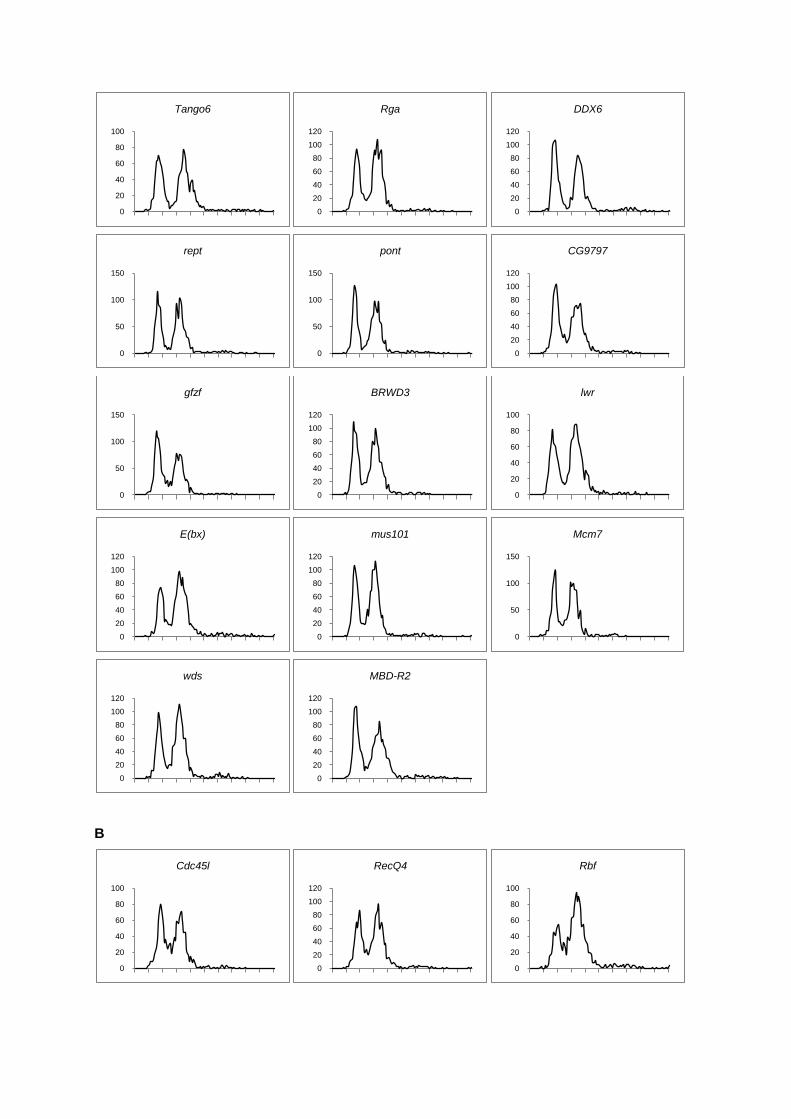
Figure S2. Cell cycle profiles of cells depleted of the candidate genes. The histograms show the cell cycle
profile of cells treated with a dsRNA against each of the candidate genes. The X-axis represents DNA content
determined by DAPI fluorescence intensities. The Y-axis represents cell counts. The results were grouped
according to the change in the cell cycle profile: (A) Normal, (B) increase in S phase, (C) increase in G1, (D)
increase in G2. The relative proportion of cells in each phase of the cell cycle was visually determined by
comparison to the control (luc+).
A
0
20
40
60
80
100
luc+
0
20
40
60
80
100
grp
0
50
100
150
14-3-3epsilon
0
20
40
60
80
mei-41
0
20
40
60
80
100
120
tefu
0
50
100
150
mus304
0
20
40
60
80
100
120
mus312
0
20
40
60
80
100
MED17
0
50
100
150
Spt5
0
20
40
60
80
100
Rpb4
0
20
40
60
80
RpII215
0
20
40
60
80
100
120
Trxr-1
0
20
40
60
80
100
120
Topors
0
50
100
150
DDB1
0
50
100
150
cul-4
B
0
20
40
60
80
100
Tango6
0
20
40
60
80
100
120
Rga
0
20
40
60
80
100
120
DDX6
0
50
100
150
rept
0
50
100
150
pont
0
20
40
60
80
100
120
CG9797
0
50
100
150
gfzf
0
20
40
60
80
100
120
BRWD3
0
20
40
60
80
100
lwr
0
20
40
60
80
100
120
E(bx)
0
20
40
60
80
100
120
mus101
0
50
100
150
Mcm7
0
20
40
60
80
100
120
wds
0
20
40
60
80
100
120
MBD-R2
0
20
40
60
80
100
Cdc45l
0
20
40
60
80
100
120
RecQ4
0
20
40
60
80
100
Rbf

C
0
50
100
150
RpA-70
0
20
40
60
80
100
Top2
0
20
40
60
80
100
CG13745
0
50
100
150
200
250
eIF4G
0
50
100
150
200
Myt1
0
50
100
150
CSN1b
0
50
100
150
200
alien
0
50
100
150
200
CSN3
0
50
100
150
200
CSN4
0
50
100
150
200
CSN5
0
50
100
150
200
CSN6
0
20
40
60
80
100
120
CSN7
0
50
100
150
200
250
CSN8
0
20
40
60
80
100
120
Cdk8
0
20
40
60
80
100
120
CycC
0
20
40
60
80
100
RpII15
0
20
40
60
80
100
120
RpII18
0
50
100
150
Rpb5

D
0
20
40
60
80
100
Rpb8
0
50
100
150
CG4699
0
50
100
150
CG1135
0
50
100
150
CG8233
0
20
40
60
80
100
dgt1
0
20
40
60
80
100
120
Not1
0
20
40
60
80
100
120
Pop2
0
20
40
60
80
100
Ald
0
20
40
60
80
100
120
lin19
0
20
40
60
80
100
120
skpA
0
50
100
150
SF2
0
20
40
60
80
100
120
Kap-alpha3
0
20
40
60
80
100
Su(var)2-10
0
20
40
60
80
100
120
MED4
0
20
40
60
80
100
Yeti
0
50
100
150
nbs

Figure S3. Secondary screen for mitotic exit defects. Relative mitotic index of RNAi-treated cells after an
eight-hour incubation with 30 µM NSC663284. Average and range of two replicates are shown. A dsRNA against
Venus (a green fluorescent protein variant) was used as a negative control. The three genes that led to a relative
mitotic index of more than 50% were excluded as potential false positives.
0
10
20
30
40
50
60
70
80
90
100
TE
R94
Ufd
1-lik
eC
G13779
Rpb4
RpII18
Rpb5
RpII215
CS
N4
Spt5
pont
CS
N7
rept
Top2
Tango6
BR
WD
3m
e31B
CS
N1b
RpII15
Not1
Pop2
Kap-a
lpha3
skpA
Ald
RpA
-70
Rpb8
alie
nC
DC
45L
ME
D17
Yeti
CS
N3
CG
4699
CS
N5
tefu
CG
13879
ME
D4
CS
N6
CS
N8
eIF
4G
CG
9797
Su(v
ar)
2-1
0m
us101
Cdk8
DD
B1
lwr
lin19
Rga
E(b
x)
RecQ
4gfz
fC
ycC
CG
13745
Myt
1m
us304
SF
2m
us312
Rbf
CG
1135
CG
8233
Topors
mei-41
Mcm
7w
ds
dgt1
grp
MB
D-R
214-3
-3epsilo
nV
enus
No d
sR
NA
Rele
tive m
itotic in
dex (
%)
NSC663284 30 µM

mitotic index of cells treated with a dsRNA against each of the 64 candidate genes. Average and range of two
replicates are shown. The cells were treated with doxorubicin (A), etoposide (B), Bleocin (C), or X-rays (D). In a
few cases, the relative mitotic index exceeded 100%. This may be due to compensatory proliferation induced by
DNA damage (Pérez-Garijo et al., 2004).
A
B
0
20
40
60
80
100
120
140
160
RecQ
4T
op2
Myt
114-3
-3epsilo
nR
pII215
CD
C45L
Topors
Cyc
CR
pb5
RpII18
grp
Cdk8
Rpb8
Spt5
alie
nR
pII15
Pop2
wds
CG
8233
CS
N7
Yeti
ME
D17
Ald
skpA
cul-4
CS
N4
Kap-a
lpha3
rept
Rpb4
E(b
x)
CS
N1b
CG
4699
BR
WD
3m
us312
Not1
mus304
CG
9797
ME
D4
CS
N3
eIF
4G
RpA
-70
SF
2R
bf
Tango6
pont
mei-41
nbs
CS
N5
CS
N8
Mcm
7m
us101
lin19
CS
N6
dgt1
DD
B1
Su(v
ar)
2-1
0M
BD
-R2
gfz
fR
ga
tefu lwr
CG
13745
me31B
CG
1135
luc+
No d
sR
NA
Rela
tive m
itotic in
dex (
%)
Doxorubicin 0.5 µM
0
20
40
60
80
100
120
Top2
RecQ
4M
yt1
grp
14-3
-3epsilo
nm
us312
tefu
Kap-a
lpha3
skpA
Cyc
Ccul-4
CG
8233
RpII215
mus304
gfz
fC
DC
45L
CG
4699
mei-41
Rpb5
eIF
4G
BR
WD
3R
pII18
Topors
E(b
x)
RpII15
Rpb8
Yeti
Cdk8
Rga
alie
nM
ED
17
CG
9797
MB
D-R
2C
SN
6C
SN
1b
CS
N4
CS
N5
mus101
CS
N3
dgt1
rept
pont
wds
CG
1135
CS
N7
me31B
lin19
SF
2R
bf
Pop2
CS
N8
Mcm
7S
u(v
ar)
2-1
0nbs
Not1
Spt5
Ald
Rpb4
luc+
CG
13745
Tango6
RpA
-70
ME
D4
DD
B1
No d
sR
NA
lwr
Rela
tive m
itotic in
dex (
%)
Etoposide 10 µM
Figure S4. G2 -M checkpoint defect of cells depleted of the candidate genes. The graphs show the relative

C
D
0
20
40
60
80
100
120
140
160
180
RecQ
414-3
-3epsilo
ngrp
Cyc
CC
dk8
CD
C45L
RpA
-70
Myt
1m
us304
RpII215
mus312
mei-41
Rpb8
CS
N4
eIF
4G
CS
N1b
alie
nm
us101
Pop2
Kap-a
lpha3
CS
N7
Ald
me31B
E(b
x)
CS
N6
Not1
CS
N3
Yeti
RpII18
CS
N5
Rpb5
RpII15
cul-4
lin19
SF
2re
pt
CG
8233
Top2
wds
CG
4699
ME
D4
pont
dgt1
ME
D17
Su(v
ar)
2-1
0gfz
fS
pt5
CG
9797
CS
N8
Rga
Mcm
7D
DB
1skpA
lwr
Tango6
Rpb4
Rbf
tefu
CG
13745
CG
1135
MB
D-R
2T
opors
nbs
No d
sR
NA
luc+
BR
WD
3
Rela
tive m
itotic in
dex (
%)
Bleocin 50 µg/µl
0
20
40
60
80
100
120
140
160
180
200
RecQ
4C
DC
45L
14-3
-3epsilo
nC
ycC
Myt
1eIF
4G
Rpb8
grp
mus312
mei-41
E(b
x)
RpII215
mus304
lin19
Cdk8
alie
nR
pA
-70
Rpb5
cul-4
Ald
CS
N6
rept
Pop2
Rga
CS
N4
RpII18
CS
N5
Top2
CS
N3
Not1
CS
N1b
CG
4699
Kap-a
lpha3
CG
9797
Yeti
RpII15
CS
N7
pont
wds
CS
N8
ME
D4
me31B
ME
D17
Su(v
ar)
2-1
0C
G8233
SF
2M
cm
7M
BD
-R2
mus101
Rbf
CG
13745
Rpb4
dgt1
BR
WD
3T
ango6
tefu
DD
B1
skpA
CG
1135
lwr
Topors
Spt5
gfz
fN
o d
sR
NA
luc+
nbs
Rela
tive m
itotic in
dex (
%)
X-ray 150 Gy

Figure S5. DNA damage-induced phosphorylation of histone H2Av in cells depleted of candidate genes.
S2R+ cells were stained with DAPI (blue) and an antibody against phosphohistone H2Av (white). The cells were
treated with dsRNAs targeting the indicated genes. (A) Before doxorubicin treatment. (B) After doxorubicin
treatment.
A
B
No dsRNA
No dsRNA
luc+
Top2
Topors

Figure S6. Mitotic index and cell cycle profile of cells depleted of pre-IC proteins. (A) Mitotic index of S2R+
cells treated with a dsRNA for each of the pre-IC genes. The cells were treated with 0.5 µM doxorubicin or 150 Gy of X-rays. Mitotic indices of untreated (blue bars) and treated cells (red bars) are shown. Luciferase (luc+) RNAi is shown as a wild-type control. grp (known as CHK1 in mammals) RNAi is shown as a positive control of a defective G2/M checkpoint. Knockdown of mcm7 or mus101 also produced a decrease in the mitotic index before DNA damage. The relative mitotic indices after DNA damage were mcm7, 26.03% (+/-2.45); mus101, 25.93% (+/-0.38); luciferase, 11.61% (+/-1.31). (B) Cell cycle profiles of the RNAi-treated cells in the absence of DNA damage.
A
B
0
0.5
1
1.5
2
2.5
3
Mitotic in
dex (
%)
Mitotic index after doxorubicin treatment
-Dox
+Dox
0
0.5
1
1.5
2
2.5
3
Mitotic in
dex (
%)
Mitotic index after X-ray irradiation
-IR
+IR
0
20
40
60
80
100
luc+
0
20
40
60
80
100
grp
0
20
40
60
80
100
Cdc45l
0
20
40
60
80
100
120
RecQ4
0
50
100
150
Mcm7
0
20
40
60
80
100
120
mus101

candidate G2/M checkpoint genes that passed the secondary screen. For each gene, the Flybase
(http://flybase.org/) gene name, CG number, alternative name, human ortholog, and dsRNA amplicons used are
provided. In Fig. 1, the alternative names are used when available.
Gene CG # Synonyms Human ortholog Amplicon #1 Amplicon #2 Note
mei-41 CG4252 ATR ATR DRSC36631
Have a known role in DNA damage checkpoints.
mus304 CG7347 ATRIP ATRIP DRSC11372
tefu CG6535 ATM ATM DRSC16060
nbs CG6754 NBS1 NBS1 custom
grp CG17161 CHK1 CHK1 DRSC03541
Myt1 CG32417 MYT1 DRSC30071 DRSC11228
14-3-3ε CG31196 14-3-3-EPSILON DRSC16370
mus101 CG11156 TOPBP1 TOPBP1 DRSC19388
CG13745 CG13745 FANCI FANCI DRSC06416
Top2 CG10223 TOP2A DRSC03459
pont CG4003 PONTIN DRSC17029 REPTIN and PONTIN form a dimer.
rept CG9750 REPTIN DRSC11388
CG4699 CG4699 NSL1 hNSL1 DRSC15625
Components of the Nonspecific Lethal (NSL) complex.
dgt1 CG18041 NSL2 hNSL2 DRSC15301
CG8233 CG8233 NSL3 hNSL3 DRSC23713 DRSC07116
CG1135 CG1135 MCRS1 MCRS1 DRSC27788 DRSC08180
MBD-R2 CG10042 PHF20 DRSC14180
wds CG17437 WDR5 WDR5 DRSC18852
Pop2 CG5684 POP2 DRSC10537
Components of the CCR4-Not complex Not1 CG34407 NOT1 DRSC06787
Rga CG2161 NOT2 NOT2 DRSC12364
me31B CG4916 DDX6 DDX6 DRSC03569
Cdk8 CG10572 CDK8 DRSC11113
Components of the mediator complex CycC CG7281 CYCLIN C DRSC16619
MED17 CG7957 MED17 DRSC16889
MED4 CG8609 MED4 DRSC25135
CSN1b CG3889 GPS1 DRSC11108
Components of the CO9 signalosome (CSN) complex
alien CG9556 CSN2 COPS2 DRSC03482
CSN3 CG18332 COPS3 DRSC25919
CSN4 CG8725 COPS4 DRSC07350
CSN5 CG14884 COPS5 DRSC16592
CSN6 CG6932 COPS6 DRSC16593
CSN7 CG2038 COPS7A DRSC06807
CSN8 CG42522 COPS8 DRSC02257
DDB1 CG7769 DDB1 DRSC16639 DRSC31603 DDB1 and CUL4 are components of an E3 ubiquitin ligase complex. cul-4 CG8711 CUL4 CUL4A DRSC27185
skpA CG16983 SKP1 SKP1 DRSC18833 SKP1 and CUL1 are components of the SCF complex.
lin19 CG1877 CUL1 CUL1 DRSC07645
Rpb4 CG33520 RPB4 DRSC21598
Subunits of the RNA polymerase II complex
Rpb5 CG11979 RPB5 DRSC06100
Rpb8 CG11246 RPB8 DRSC11642
RpII15 CG3284 RPB9 DRSC16832
RpII18 CG1163 RPB6 DRSC12366
RpII215 CG1554 RPB1 DRSC20280
mus312 CG8601 BTBD12 DRSC27742 DRSC11008
BRWD3 CG31132 BRWD3 DRSC15369 DRSC16032
E(bx) CG32346 BPTF DRSC08583 DRSC08509
lwr CG3018 UBC9 UBC9 DRSC27034 custom
Topors CG15104 TOPORS DRSC06531 custom
Su(var)2-10 CG8068 PIAS PIAS1 DRSC07721 custom
RpA-70 CG9633 RPA70 RPA1 DRSC16830 custom
RecQ4 CG7487 RECQL4 RECQL4 DRSC11265 DRSC27616
CDC45L CG3658 CDC45L DRSC17747 DRSC31324
Mcm7 CG4978 MCM7 DRSC24311 DRSC11219
Rbf CG7413 RB RB DRSC18704 custom
eIF4G CG10811 EIF4G3 DRSC17218 DRSC29786
Ald CG6058 ALDOB DRSC25381 DRSC14109
gfzf CG33546 N/A DRSC12506 DRSC21874
Tango6 CG18398 TMCO7 DRSC02671 DRSC29389
Kap-alpha3 CG9423 KPNA3 DRSC16976 DRSC34268
Spt5 CG7626 SPT5H DRSC07556 DRSC37651
SF2 CG6987 SFRS1 DRSC16845 DRSC32604
CG9797 CG9797 N/A DRSC16566 custom
Yeti CG40218 SWC5 CFDP1 DRSC21138 DRSC37982
Table S1. Genes required for the G2 -M checkpoint induced by doxorubicin. Listed in the table are the 64

Table S2. Primary hits excluded from further analysis and reasons for exclusion. The following genes
identified in the primary screen showed strong phenotypes, but were excluded from further analysis for indicated
reasons. Fold change in mitotic index is provided where available.
Gene DRSC amplicon ID Human ortholog
MI fold change
Reason for exclusion
dup DRSC07088 CDT1 7.2
These genes were excluded because of a highly elevated mitotic index (more than two-fold compared to wild type) without DNA damage.
CG3625 DRSC00621 AIG1 3.2
mask DRSC16018, DRSC16005,
ANKRD17 2.5 DRSC15370
14-3-3ζ DRSC05028 14-3-3-ZETA 3.1
CG12420 DRSC14514 N/A 2.3
CG13779 DRSC02282 DSS1
These genes had an apparent defect in mitotic exit (see Fig. S3). TER94 DRSC27600 VCP
CG4673 DRSC15616 NPL4
Pp1-87B DRSC16794 PPP1CA
Known role in mitosis. These genes encode phosphatases whose knockdown leads to mitotic arrest (Chen et al., 2007).
Pp1-13C DRSC20269 PPP1CA
mts DRSC03574 PPP2CA 4.8
Pp2A-29B DRSC28394 PPP2R1A 5.3
tws DRSC27776, DRSC17092 PPP2R2A
Pp4-19C DRSC21251 PPP4C
PpV DRSC18700 PPP6C
Act87E, Act5C, Act88F, DRSC14104 actin
Known role in cytokinesis (Goshima et al., 2007). This dsRNA targets multiple isoforms of Actin. Act57B, Act79B
alphaTub67C DRSC25162, DRSC11321 α-tubulin
Known role in mitosis. Tubulins play an essential role in spindle assembly (Goshima et al., 2007).
alphaTub84B DRSC25011, DRSC12622 α-tubulin 8.6
alphaTub84D DRSC12623 α-tubulin
alphaTub85E DRSC23424, DRSC16899 α-tubulin
betaTub56D DRSC23516, DRSC07583 β-tubulin
betaTub85D DRSC16910 β-tubulin 5.3
betaTub97EF DRSC15666 β-tubulin
T-cp1 DRSC26661, DRSC16877 CCT1 2.6
These genes encode components of the CCT chaperone complex, which has an important role in proper folding of actin and tubulin. Thus, they are likely to play an important role in spindle assembly and cytokinesis. They also showed a highly elevated mitotic index without DNA damage.
CG7033 DRSC18415 CCT2 3.9
Cctgamma DRSC16602 CCT3 3.5
CG5525 DRSC28909, DRSC02865 CCT4 3.5
Cct5 DRSC26229, DRSC07357 CCT5 4.6
Tcp-1zeta DRSC20095 CCT6 3.3
Tcp-1eta DRSC16410 CCT7 3.4
CG8258 DRSC27213, DRSC07130 CCT8 2.2
dgt2 DRSC29741, DRSC02548 N/A
Known role in mitosis. These genes encode components of the recently identified Augmin complex, which has an essential role in spindle assembly (Goshima and Kimura, 2010).
dgt3 DRSC04349 N/A
dgt4 DRSC18659 N/A
dgt5 DRSC29379, DRSC07280 N/A
dgt6 DRSC14424 FAM29A
CG2213 DRSC26406, DRSC08560 N/A 2.0
CG13879 DRSC28973, DRSC08349 N/A 2.1
CG13914 DRSC08383 N/A
Arp11 DRSC19448, DRSC19448 ACTR10
Known role in mitosis. These genes encode Dynactin subunits (Goshima et al., 2007).
Arp87C DRSC14118 ACTR1A
Gl DRSC23441 DCTN1
Dmn DRSC07132 DCTN2
dyn-p25 DRSC03525 DCTN5
l(2)37Ce DRSC02609, DRSC22810 DCTN6
Sdic4, Sdic3, Sdic2, DRSC20696 DYNC1I2
Known role in mitosis. These genes encode Dynein subunits (Goshima et al., 2007).
sw, Sdic1
Dhc64C DRSC25497, DRSC08656 DYHC1
Dlic2 DRSC19824 DYNC1LI1
Grip84 DRSC26202, DRSC20248 TUBGCP2
Known role in mitosis. These genes encode components of the γ-tubulin ring complex (Goshima et al., 2007).
l(1)dd4 DRSC20249 TUBGCP3
Grip163 DRSC26469, DRSC10538 TUBGCP6
Grip71 DRSC02042 N/A
Klp61F DRSC28179, DRSC08671, KIF11
Known role in mitosis. These genes encode Kinesin proteins (Goshima et al., 2007).
DRSC23255
Klp67A DRSC26028, DRSC11205 KIF18A 5.4
pav DRSC08730 KIF23
dmt DRSC16932 N/A Known role in mitosis (Goshima et al., 2007).
chb DRSC11469, DRSC39154 CLASP1 Known role in mitosis (Lemos et al., 2000).
Spindly DRSC00430 N/A Known role in mitosis (Griffis et al., 2007).
polo DRSC22359 PLK1 Known role in mitosis (Llamazares et al., 1991).
barr DRSC03488 NCAPH Known role in mitosis (Bhat et al., 1996).
Lis-1 DRSC07459 PAFAH1B1 Known role in mitosis (Siller et al., 2005).
nudE DRSC10962 NDEL1 Known role in mitosis (Wainman et al., 2009).
mars DRSC06656 DLG7 Known role in mitosis (Tan et al., 2008).
SNF1A DRSC18714 PRKAA2 Known role in mitosis (Lee et al., 2007).
SNF4Agamma DRSC16847 PRKAG2 Known role in mitosis (Lee et al., 2007).
endos DRSC29476, DRSC10658 ARPP-19 Known role in mitosis (Goshima et al., 2007).
(Continued on next page.)

vih DRSC23625, DRSC09778 UBCH10 11.0
These genes are components of the anaphase promoting complex (APC), which regulates transition from M to G1. Disruption of APC activity results in accumulation of cells in M phase.
fzy DRSC03534 CDC20
shtd DRSC20166 APC1
mr DRSC29384 APC2
Cdc27 DRSC23438, DRSC11112 APC3 13.0
APC4 DRSC29994, DRSC18360 APC4
ida DRSC08163 APC5
cdc16 DRSC16920 APC6
cdc23 DRSC02708 APC8
CG11419 DRSC06071 APC10
Pomp DRSC27581, DRSC03201 POMP 2.9
These genes are components of the proteasome. Knockdown of these genes result in metaphase arrest presumably due to abrogation of APC activity.
Pros35 DRSC03401 PSMA1
Pros25 DRSC28078, DRSC16798 PSMA2
Prosalpha7 DRSC29365, DRSC07516 PSMA3
Pros29 DRSC04644 PSMA4
ProsMA5 DRSC07514 PSMA5
Prosalpha6 DRSC29087, DRSC07515 PSMA6
Pros26 DRSC11256 PSMB1
CG17331 DRSC02603 PSMB2
Prosbeta3 DRSC16801 PSMB3
Prosbeta4 DRSC12186 PSMB4
Prosbeta5 DRSC28939, DRSC07517 PSMB5
Prosbeta2 DRSC11257 PSMB7
Rpn1 DRSC11274 RPN1 3.1
Rpn2 DRSC16839 RPN2 6.3
Dox-A2 DRSC29446, DRSC03318 RPN3
Rpn5 DRSC28279, DRSC12367 RPN5
Rpn6 DRSC07541 RPN6
Rpn7 DRSC25951, DRSC16841 RPN7
Mov34 DRSC29897, DRSC04624 RPN8
Rpn9 DRSC27177, DRSC16840 RPN9
Pros54 DRSC11876 RPN10
Rpn11 DRSC03422 RPN11
Rpn12 DRSC28589, DRSC11275 RPN12
Rpt1 DRSC07542 RPT1
Pros26.4 DRSC25012, DRSC16799 RPT2
Rpt3 DRSC23412, DRSC20283 RPT3
Rpt4 DRSC18713 RPT4
Tbp-1 DRSC26269, DRSC16842 RPT5
r-l DRSC17042 UMPS
These genes were not included in the current analysis for technical reasons.
CG11123 DRSC06040 C14orf21
CCKLR-17D3 DRSC20015 CCKAR
CG11425 DRSC28400 PPAP2B
tlk DRSC22926 TLK1
Nxt1 DRSC04630 NXT2
CG31150 DRSC16524 N/A
LSm-4 DRSC02845 LOC441016

Table S3. Statistics of the secondary screens. S2R+ cells were treated with indicated DNA damaging agents.
Mitotic indices with or without treatment and relative mitotic indices are shown with range of two replicates. The
treatment condition is indicated at the top of each table. The data correspond to fig. S4.
Doxorubicin 0.5 µM
Gene MI without treatment (%) MI after treatment (%) Relative MI (%)
mean range mean range mean range
RecQ4 2.98 0.13 4.13 0.05 137.90 4.97 Top2 1.58 0.04 1.62 0.01 102.24 3.21 Myt1 1.82 0.02 1.87 0.04 101.91 0.29
14-3-3epsilon 3.20 0.03 3.29 0.18 100.24 1.82 RpII215 0.57 0.00 0.45 0.02 80.22 2.07 CDC45L 2.80 0.01 2.09 0.08 76.16 1.78 Topors 1.87 0.03 1.40 0.01 75.10 1.03 CycC 2.05 0.04 1.37 0.05 65.56 2.45 Rpb5 0.82 0.01 0.51 0.01 61.27 1.37 RpII18 0.79 0.01 0.51 0.07 61.05 5.13
grp 2.15 0.04 1.29 0.02 59.72 1.61 Cdk8 2.21 0.06 1.33 0.06 58.87 0.23 Rpb8 0.83 0.05 0.49 0.01 58.63 3.97 Spt5 0.82 0.03 0.51 0.07 58.15 2.10 alien 0.71 0.07 0.39 0.02 56.43 6.46
RpII15 0.77 0.04 0.45 0.06 54.74 1.46 Pop2 1.81 0.01 0.78 0.03 43.84 0.75 wds 2.34 0.18 1.03 0.03 43.58 2.76
CG8233 1.72 0.02 0.72 0.04 42.99 1.65 CSN7 0.72 0.02 0.30 0.02 42.52 0.27 Yeti 1.67 0.02 0.68 0.05 42.12 2.03
MED17 1.10 0.06 0.45 0.00 40.63 2.34 Ald 1.29 0.05 0.51 0.01 39.42 1.74
skpA 1.71 0.04 0.69 0.06 38.89 0.69 cul-4 1.20 0.10 0.49 0.07 38.14 0.43 CSN4 0.67 0.03 0.25 0.00 37.93 1.40
Kap-alpha3 0.96 0.02 0.37 0.02 37.64 0.04 rept 1.45 0.02 0.55 0.02 37.39 1.20
Rpb4 1.08 0.04 0.42 0.03 37.24 0.12 E(bx) 2.41 0.02 0.88 0.03 35.86 0.27
CSN1b 0.73 0.02 0.26 0.01 35.20 0.21
CG4699 1.80 0.07 0.66 0.05 35.19 0.07 BRWD3 1.79 0.01 0.61 0.02 34.66 0.65 mus312 1.76 0.03 0.62 0.01 34.62 0.15
Not1 1.80 0.03 0.63 0.03 34.50 1.19 mus304 2.21 0.02 0.75 0.04 33.18 1.28 CG9797 2.53 0.04 0.89 0.13 32.74 2.09 MED4 1.60 0.02 0.55 0.06 32.70 1.49 CSN3 0.87 0.01 0.28 0.00 31.96 0.40 eIF4G 1.42 0.09 0.46 0.04 31.40 3.68
RpA-70 1.28 0.00 0.41 0.03 30.61 1.11 SF2 2.31 0.06 0.72 0.05 30.22 0.39 Rbf 3.04 0.15 0.96 0.13 29.59 0.68
Tango6 1.16 0.01 0.34 0.01 29.10 0.09 pont 1.38 0.02 0.43 0.05 29.08 1.25
mei-41 2.25 0.17 0.66 0.07 27.94 3.69 nbs 2.27 0.20 0.70 0.15 27.41 0.80
CSN5 1.07 0.06 0.28 0.01 26.92 2.11 CSN8 0.92 0.00 0.24 0.01 26.47 0.69 Mcm7 1.51 0.13 0.39 0.01 26.03 2.45
mus101 1.90 0.03 0.48 0.03 25.93 0.38 lin19 1.15 0.09 0.29 0.01 25.72 2.25 CSN6 0.93 0.04 0.23 0.00 24.87 0.85 dgt1 2.02 0.01 0.50 0.00 24.59 0.21
DDB1 1.28 0.03 0.31 0.02 23.33 0.31 Su(var)2-10 1.86 0.01 0.43 0.00 23.25 0.01
MBD-R2 2.12 0.01 0.47 0.04 23.10 1.00 gfzf 1.93 0.12 0.45 0.01 23.01 1.75 Rga 2.04 0.09 0.49 0.05 22.69 0.21 tefu 1.97 0.07 0.41 0.00 20.66 0.77 lwr 1.84 0.01 0.39 0.04 20.12 1.27
CG13745 2.17 0.03 0.43 0.02 19.36 0.60 me31B 1.68 0.08 0.33 0.02 18.95 1.56 CG1135 2.20 0.02 0.43 0.07 17.96 1.43
luc+ 2.17 0.11 0.27 0.03 11.61 1.31 No dsRNA 2.05 0.06 0.20 0.02 9.51 0.44

Etoposide 10 µM
Gene MI without treatment (%) MI after treatment (%) Relative MI (%)
mean range mean range mean range
RecQ4 1.27 0.02 1.15 0.10 94.79 5.43 Top2 1.92 0.01 1.85 0.04 95.33 0.62 Myt1 1.55 0.14 1.27 0.09 85.70 10.43
14-3-3epsilon 2.65 0.00 1.70 0.02 64.42 0.41 RpII215 1.30 0.01 0.71 0.02 53.84 0.42 CDC45L 1.65 0.03 0.82 0.07 51.88 3.17 Topors 1.55 0.01 0.70 0.09 47.98 2.67 CycC 1.19 0.04 0.68 0.01 56.66 1.89 Rpb5 1.13 0.01 0.56 0.01 49.74 0.88 RpII18 1.09 0.07 0.50 0.04 48.07 5.00
grp 2.44 0.06 1.61 0.09 68.03 3.65 Cdk8 1.33 0.12 0.56 0.03 43.77 4.83 Rpb8 1.09 0.10 0.53 0.06 45.74 1.46 Spt5 1.15 0.01 0.33 0.06 26.07 3.05 alien 0.91 0.02 0.34 0.02 38.81 1.67
RpII15 1.13 0.05 0.54 0.03 46.90 3.23 Pop2 2.03 0.04 0.61 0.02 29.79 1.14 wds 2.03 0.01 0.63 0.09 33.10 2.28
CG8233 1.43 0.11 0.77 0.00 54.33 4.38 CSN7 0.89 0.02 0.30 0.03 31.84 1.30 Yeti 1.27 0.05 0.53 0.05 43.93 3.74
MED17 1.18 0.13 0.41 0.07 38.67 7.11 Ald 1.29 0.00 0.36 0.04 25.85 1.71
skpA 1.66 0.05 0.98 0.00 58.96 1.57 cul-4 1.47 0.03 0.77 0.07 54.94 3.40 CSN4 1.02 0.00 0.40 0.05 36.50 2.65
Kap-alpha3 1.15 0.05 0.65 0.06 59.19 4.98 rept 1.76 0.02 0.62 0.03 34.17 1.35
Rpb4 0.93 0.09 0.23 0.01 25.66 1.76 E(bx) 2.91 0.01 1.37 0.03 47.67 0.24
CSN1b 0.91 0.04 0.33 0.00 36.89 1.81 CG4699 1.76 0.02 0.91 0.06 50.43 2.28 BRWD3 1.87 0.07 0.94 0.04 48.98 0.67 mus312 1.56 0.04 0.93 0.01 59.98 1.14
Not1 2.32 0.09 0.64 0.07 26.16 2.49 mus304 2.45 0.11 1.33 0.06 53.11 3.55 CG9797 2.66 0.05 0.98 0.05 37.85 0.21 MED4 1.49 0.03 0.34 0.02 23.33 0.16 CSN3 1.06 0.01 0.37 0.00 34.83 0.11 eIF4G 1.85 0.09 0.91 0.02 49.62 1.83
RpA-70 1.28 0.09 0.32 0.05 23.49 3.64 SF2 1.76 0.05 0.54 0.01 30.41 1.12 Rbf 2.61 0.00 0.78 0.02 30.02 0.34
Tango6 1.25 0.04 0.30 0.01 24.12 1.12 pont 1.58 0.13 0.53 0.01 33.45 2.50
mei-41 2.51 0.00 1.21 0.09 49.79 1.71 nbs 2.11 0.04 0.58 0.00 27.44 0.41
CSN5 1.24 0.02 0.43 0.01 34.93 0.12 CSN8 1.01 0.01 0.31 0.03 29.57 1.69 Mcm7 1.31 0.07 0.36 0.04 28.89 2.91
mus101 1.44 0.03 0.51 0.02 34.84 0.05 lin19 1.10 0.16 0.36 0.05 30.47 2.01 CSN6 0.91 0.04 0.35 0.02 37.18 2.91 dgt1 1.52 0.01 0.54 0.03 34.45 0.67
DDB1 1.22 0.02 0.27 0.01 22.07 0.74 Su(var)2-10 1.63 0.01 0.44 0.01 27.54 0.35
MBD-R2 1.62 0.03 0.61 0.02 37.18 0.06 gfzf 1.63 0.02 0.84 0.02 51.91 0.16
Rga 2.27 0.02 0.92 0.05 41.46 1.31 tefu 2.28 0.09 1.30 0.12 59.83 5.03 lwr 1.74 0.10 0.20 0.01 11.90 0.90
CG13745 1.66 0.08 0.44 0.09 24.17 4.01 me31B 1.35 0.04 0.42 0.01 31.21 1.30 CG1135 1.61 0.01 0.52 0.01 32.84 0.67
luc+ 1.82 0.09 0.40 0.10 24.52 1.65 No dsRNA 1.50 0.04 0.31 0.03 20.48 1.38

Bleocin 50 µg/µl
Gene MI without treatment (%) MI after treatment (%) Relative MI (%)
mean range mean range mean range
RecQ4 2.98 0.13 4.22 0.30 146.83 11.28 Top2 1.58 0.04 0.30 0.02 18.74 1.04 Myt1 1.82 0.02 0.99 0.03 55.21 1.63
14-3-3epsilon 3.20 0.03 2.36 0.06 74.89 1.65 RpII215 0.57 0.00 0.28 0.02 47.52 1.17 CDC45L 2.80 0.01 1.65 0.03 58.63 0.25 Topors 1.87 0.03 0.21 0.01 10.79 0.49 CycC 2.05 0.04 1.25 0.03 60.08 2.04 Rpb5 0.82 0.01 0.17 0.01 21.52 0.38 RpII18 0.79 0.01 0.19 0.02 23.35 1.67
grp 2.15 0.04 1.59 0.05 72.77 2.65 Cdk8 2.21 0.06 1.23 0.14 59.14 4.71 Rpb8 0.83 0.05 0.31 0.01 38.09 1.70 Spt5 0.82 0.03 0.15 0.02 16.45 0.75 alien 0.71 0.07 0.22 0.01 30.12 1.84
RpII15 0.77 0.04 0.17 0.01 21.39 0.43 Pop2 1.81 0.01 0.55 0.02 29.78 0.65 wds 2.34 0.18 0.45 0.04 18.50 0.52
CG8233 1.72 0.02 0.35 0.00 20.24 0.23 CSN7 0.72 0.02 0.19 0.03 28.70 1.03 Yeti 1.67 0.02 0.40 0.01 23.74 0.07
MED17 1.10 0.06 0.18 0.00 16.90 1.05 Ald 1.29 0.05 0.37 0.00 28.68 1.05
skpA 1.71 0.04 0.24 0.02 14.88 1.00 cul-4 1.20 0.10 0.28 0.05 21.36 0.17 CSN4 0.67 0.03 0.23 0.02 32.43 2.83
Kap-alpha3 0.96 0.02 0.29 0.01 29.02 0.02 rept 1.45 0.02 0.29 0.00 20.33 0.07
Rpb4 1.08 0.04 0.14 0.01 12.51 0.04 E(bx) 2.41 0.02 0.64 0.04 25.58 0.52
CSN1b 0.73 0.02 0.22 0.00 30.64 0.52 CG4699 1.80 0.07 0.34 0.03 17.95 0.17 BRWD3 1.79 0.01 0.14 0.01 7.82 0.14 mus312 1.76 0.03 0.83 0.03 46.40 0.13
Not1 1.80 0.03 0.47 0.07 24.36 2.42 mus304 2.21 0.02 1.09 0.01 49.37 0.69 CG9797 2.53 0.04 0.40 0.00 15.74 0.21 MED4 1.60 0.02 0.27 0.01 17.31 0.43 CSN3 0.87 0.01 0.19 0.03 24.17 1.91 eIF4G 1.42 0.09 0.45 0.03 31.11 3.14
RpA-70 1.28 0.00 0.76 0.06 57.27 2.31 SF2 2.31 0.06 0.48 0.01 20.61 0.27 Rbf 3.04 0.15 0.39 0.04 12.16 0.06
Tango6 1.16 0.01 0.15 0.01 12.61 0.34 pont 1.38 0.02 0.24 0.02 17.02 0.32
mei-41 2.25 0.17 1.05 0.03 46.24 4.28 nbs 2.27 0.20 0.23 0.04 9.31 0.11
CSN5 1.07 0.06 0.23 0.02 22.24 2.01 CSN8 0.92 0.00 0.15 0.02 15.32 1.29 Mcm7 1.51 0.13 0.23 0.00 14.99 1.18
mus101 1.90 0.03 0.58 0.02 30.08 1.05 lin19 1.15 0.09 0.22 0.04 20.98 3.41 CSN6 0.93 0.04 0.22 0.02 24.44 1.95 dgt1 2.02 0.01 0.33 0.03 17.01 0.55
DDB1 1.28 0.03 0.20 0.02 14.95 0.62 Su(var)2-10 1.86 0.01 0.30 0.03 16.86 0.76
MBD-R2 2.12 0.01 0.23 0.02 11.41 0.65 gfzf 1.93 0.12 0.32 0.00 16.46 0.96
Rga 2.04 0.09 0.30 0.01 15.17 0.92 tefu 1.97 0.07 0.25 0.04 11.98 1.33 lwr 1.84 0.01 0.26 0.03 13.19 0.92
CG13745 2.17 0.03 0.26 0.02 11.78 0.52 me31B 1.68 0.08 0.49 0.03 28.41 2.22 CG1135 2.20 0.02 0.26 0.02 11.50 0.30
luc+ 2.17 0.11 0.19 0.01 8.38 0.74 No dsRNA 2.05 0.06 0.18 0.01 8.54 0.42

X-ray 150 Gy
Gene MI without treatment (%) MI after treatment (%) Relative MI (%)
mean range mean range mean range
RecQ4 2.15 0.37 3.40 0.19 166.15 24.10 Top2 1.59 0.29 0.77 0.05 51.38 7.99 Myt1 1.85 0.14 1.28 0.03 70.26 5.99
14-3-3epsilon 3.20 0.19 2.49 0.08 79.23 3.46 RpII215 1.07 0.05 0.62 0.16 64.83 4.13 CDC45L 2.16 0.32 1.99 0.13 96.81 11.33 Topors 1.94 0.21 0.57 0.04 30.78 2.45 CycC 2.25 0.22 1.71 0.07 78.02 6.11 Rpb5 1.06 0.04 0.57 0.09 57.90 6.00 RpII18 1.18 0.12 0.57 0.08 52.15 2.08
grp 2.06 0.02 1.50 0.16 68.96 4.67 Cdk8 2.35 0.27 1.40 0.00 60.28 6.93 Rpb8 1.20 0.09 0.75 0.17 69.40 2.07 Spt5 1.35 0.04 0.40 0.03 30.75 0.17 alien 0.81 0.06 0.46 0.02 59.04 3.02
RpII15 1.17 0.03 0.50 0.11 47.44 3.41 Pop2 1.94 0.20 1.00 0.06 53.42 3.79 wds 2.49 0.10 1.10 0.12 46.64 4.27
CG8233 1.94 0.11 0.74 0.10 40.66 0.16 CSN7 0.89 0.02 0.41 0.02 46.89 2.11 Yeti 1.49 0.14 0.68 0.08 48.45 1.83
MED17 1.35 0.06 0.54 0.09 43.10 5.18 Ald 1.37 0.17 0.76 0.01 55.87 7.27
skpA 2.02 0.08 0.69 0.03 35.07 0.76 cul-4 1.29 0.11 0.69 0.05 56.31 2.78 CSN4 0.73 0.07 0.36 0.05 52.42 1.33
Kap-alpha3 1.12 0.05 0.52 0.04 49.05 0.28 rept 1.79 0.20 0.89 0.13 53.60 2.25
Rpb4 1.05 0.04 0.38 0.01 36.60 1.03 E(bx) 3.21 0.05 2.06 0.08 65.45 0.26
CSN1b 0.79 0.08 0.38 0.02 49.90 3.37 CG4699 2.20 0.08 1.03 0.09 49.11 0.35 BRWD3 1.72 0.12 0.56 0.10 35.67 0.41 mus312 1.88 0.19 1.21 0.13 68.18 3.44
Not1 1.74 0.12 0.83 0.09 50.49 0.99 mus304 2.36 0.15 1.46 0.09 63.83 2.12 CG9797 2.44 0.35 1.08 0.20 48.77 2.80 MED4 1.60 0.16 0.67 0.11 45.31 1.03 CSN3 0.95 0.03 0.47 0.02 50.58 0.72 eIF4G 1.67 0.26 1.11 0.07 69.74 8.87
RpA-70 1.07 0.12 0.64 0.03 59.04 7.95 SF2 2.35 0.12 0.87 0.09 38.96 0.16 Rbf 2.61 0.31 0.98 0.00 38.05 4.62
Tango6 1.42 0.12 0.46 0.10 35.47 0.50 pont 1.81 0.13 0.79 0.10 46.81 0.55
mei-41 1.94 0.12 1.32 0.05 67.21 5.60 nbs 2.12 0.24 0.49 0.07 24.95 1.15
CSN5 1.06 0.04 0.52 0.06 51.49 0.76 CSN8 0.85 0.05 0.36 0.07 46.19 1.00 Mcm7 1.45 0.10 0.52 0.08 38.91 0.09
mus101 1.91 0.07 0.69 0.07 38.05 3.25 lin19 1.40 0.07 0.79 0.15 62.07 2.19 CSN6 0.85 0.06 0.43 0.05 53.82 0.68 dgt1 2.44 0.08 0.85 0.09 36.52 0.64
DDB1 0.96 0.12 0.32 0.03 35.10 2.82 Su(var)2-10 1.74 0.09 0.70 0.05 41.56 0.85
MBD-R2 2.69 0.07 0.98 0.12 38.53 1.15 gfzf 2.15 0.06 0.54 0.07 26.74 0.85
Rga 2.22 0.19 1.13 0.11 53.29 2.17 tefu 2.18 0.15 0.71 0.11 35.19 0.21 lwr 1.72 0.21 0.52 0.01 31.00 3.60
CG13745 2.06 0.08 0.76 0.01 37.26 1.83 me31B 1.98 0.24 0.86 0.06 45.18 3.83 CG1135 2.55 0.08 0.78 0.07 31.99 0.43
luc+ 2.23 0.29 0.55 0.03 25.77 2.73 No dsRNA 2.12 0.18 0.52 0.05 26.10 1.12

Table S4. Sequences of primers used for synthesizing dsRNA templates. The following primers were used to
PCR-amplify DNA templates for in vitro transcription of dsRNAs.
luc+-F: TAATACGACTCACTATAGGGAGCCTTCAGGATTACAAGATTCAAAG luc+-R: TAATACGACTCACTATAGGGATCAGAGACTTCAGGCGGTCAACG Venus-F: TAATACGACTCACTATAGGGATGGTGAGCAAGGGCGAGG Venus-R: TAATACGACTCACTATAGGGGAAGTTGGCCTTGATGCCG Su(var)2-10-F: TAATACGACTCACTATAGGGTGACTGAGGATGCTGACTGC Su(var)2-10-R: TAATACGACTCACTATAGGGCTGTTTGACGTTGATGTGGG lwr-F: TAATACGACTCACTATAGGGTCACCATCAAGCAAATCCTG lwr-R: TAATACGACTCACTATAGGGAGAATAATCGGCACCTGCAC CG9797-F: TAATACGACTCACTATAGGGACGATTTCATTTCGGATTGC CG9797-R: TAATACGACTCACTATAGGGAATATCCTCGCCCATGACAG Trxr-1-F: TAATACGACTCACTATAGGGCGCGTCTATGGACTGCACTA Trxr-1-R: TAATACGACTCACTATAGGGAGTTCCACTGGTGTCGTTCC Rbf-F: TAATACGACTCACTATAGGGCGATCTCATCAACCCCAAAT Rbf-R: TAATACGACTCACTATAGGGTGCTTCACGTTGTTAGTGGC Topors-F: TAATACGACTCACTATAGGGCGGGAAAAGGACATCTCGTA Topors-R: TAATACGACTCACTATAGGGAACGAACTTAATGGAGCCGA RPA70-F: TAATACGACTCACTATAGGGCAATGGAGGTGGTGACAGTG RPA70-R: TAATACGACTCACTATAGGGGCGCAGCTTAAAGATGTGTG nbs-F: TAATACGACTCACTATAGGGACACCCTGCATATCGAGGAC nbs-R: TAATACGACTCACTATAGGGGAAGAGACGGGTACGCTCAG mus81-F: TAATACGACTCACTATAGGGAAAAATGCCACCACCAGAAG mus81-R: TAATACGACTCACTATAGGGGCTGCTTCTCCTGAACCTTG
References
Bhat, MA, Philp, AV, Glover, DM, Bellen, HJ (1996) Chromatid segregation at anaphase requires the barren product, a novel chromosome-associated protein that interacts with Topoisomerase II. Cell 87: 1103-14.
Chen, F, Archambault, V, Kar, A, Lio', P, D'Avino, PP, Sinka, R, Lilley, K, Laue, ED, Deak, P, Capalbo, L, Glover, DM (2007) Multiple protein phosphatases are required for mitosis in Drosophila. Curr Biol 17: 293-303.
Goshima, G, Kimura, A (2010) New look inside the spindle: microtubule-dependent microtubule generation within the spindle. Curr Opin Cell Biol 22: 44-9.
Goshima, G, Wollman, R, Goodwin, SS, Zhang, N, Scholey, JM, Vale, RD, Stuurman, N (2007) Genes required for mitotic spindle assembly in Drosophila S2 cells. Science 316: 417-21.
Griffis, ER, Stuurman, N, Vale, RD (2007) Spindly, a novel protein essential for silencing the spindle assembly checkpoint, recruits dynein to the kinetochore. J Cell Biol 177: 1005-15.
Lee, JH, Koh, H, Kim, M, Kim, Y, Lee, SY, Karess, RE, Lee, SH, Shong, M, Kim, JM, Kim, J, Chung, J (2007) Energy-dependent regulation of cell structure by AMP-activated protein kinase. Nature 447: 1017-20.
Lemos, CL, Sampaio, P, Maiato, H, Costa, M, Omel'yanchuk, LV, Liberal, V, Sunkel, CE (2000) Mast, a conserved microtubule-associated protein required for bipolar mitotic spindle organization. EMBO J 19: 3668-82.
Llamazares, S, Moreira, A, Tavares, A, Girdham, C, Spruce, BA, Gonzalez, C, Karess, RE, Glover, DM, Sunkel, CE (1991) polo encodes a protein kinase homolog required for mitosis in Drosophila. Genes Dev 5: 2153-65.
Pérez-Garijo, A, Martín, FA, Morata, G (2004) Caspase inhibition during apoptosis causes abnormal signalling and developmental aberrations in Drosophila. Development 131: 5591-8.
Siller, KH, Serr, M, Steward, R, Hays, TS, Doe, CQ (2005) Live imaging of Drosophila brain neuroblasts reveals a role for Lis1/dynactin in spindle assembly and mitotic checkpoint control. Mol Biol Cell 16: 5127-40.
Tan, S, Lyulcheva, E, Dean, J, Bennett, D (2008) Mars promotes dTACC dephosphorylation on mitotic spindles to ensure spindle stability. J Cell Biol 182: 27-33.
Wainman, A, Creque, J, Williams, B, Williams, EV, Bonaccorsi, S, Gatti, M, Goldberg, ML (2009) Roles of the Drosophila NudE protein in kinetochore function and centrosome migration. J Cell Sci 122: 1747-58.


