
Supplemental Figure S1 a-‐n Arisa Plots of Significant Co-‐occurring OTU Pairs Fig. S1a) day 30 stacked plot

Fig. S1b) Stacked plot stage 41
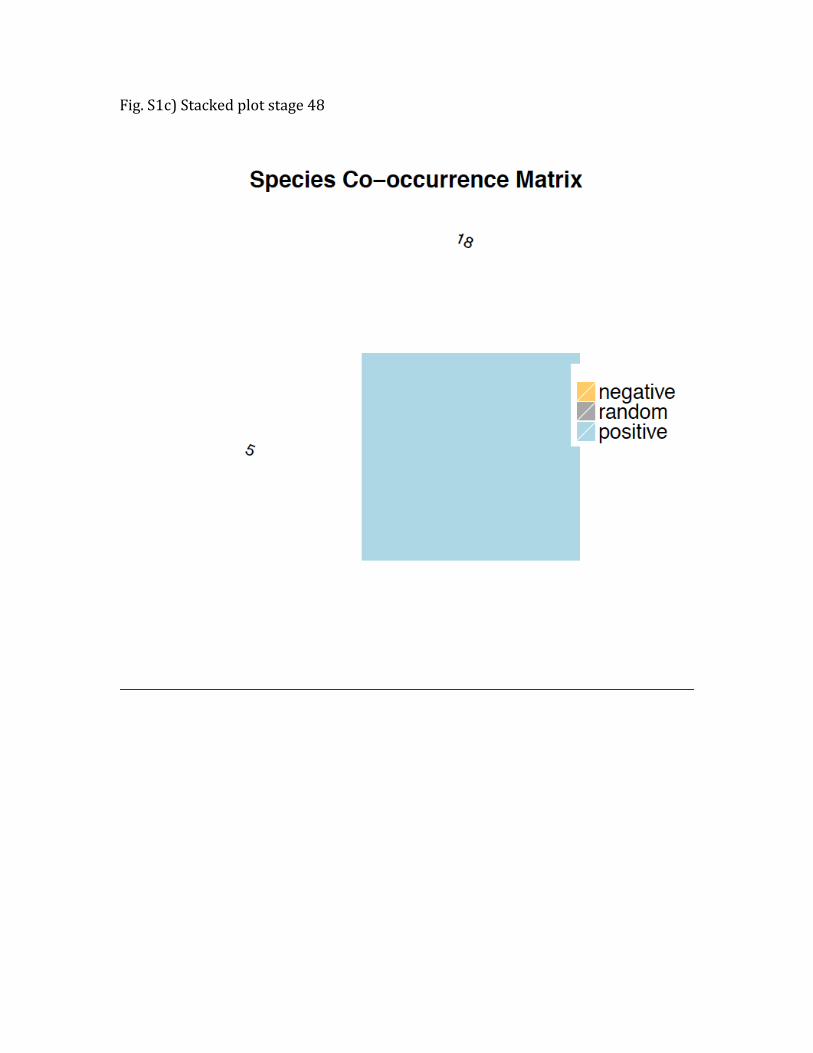
Fig. S1c) Stacked plot stage 48

Fig. S1d) Stacked plot stage 58 (Note—no pairs were significant at this stage)

Fig. S1e) Stacked plot stage 62

Fig. S1f) Stacked plot stage 72

Fig. S1g) Stacked plot stage 80

Fig. S1h) Paired OTU plot stage 30

Fig. S1i) Paired OTU plot stage 41

Fig. S1j) Paired OTU plot stage 48

Fig. S1k) Paired OTU plot stage 58

Fig. S1l) Paired OTU plot stage 62

Fig. S1m) Paired OTU plot stage 72
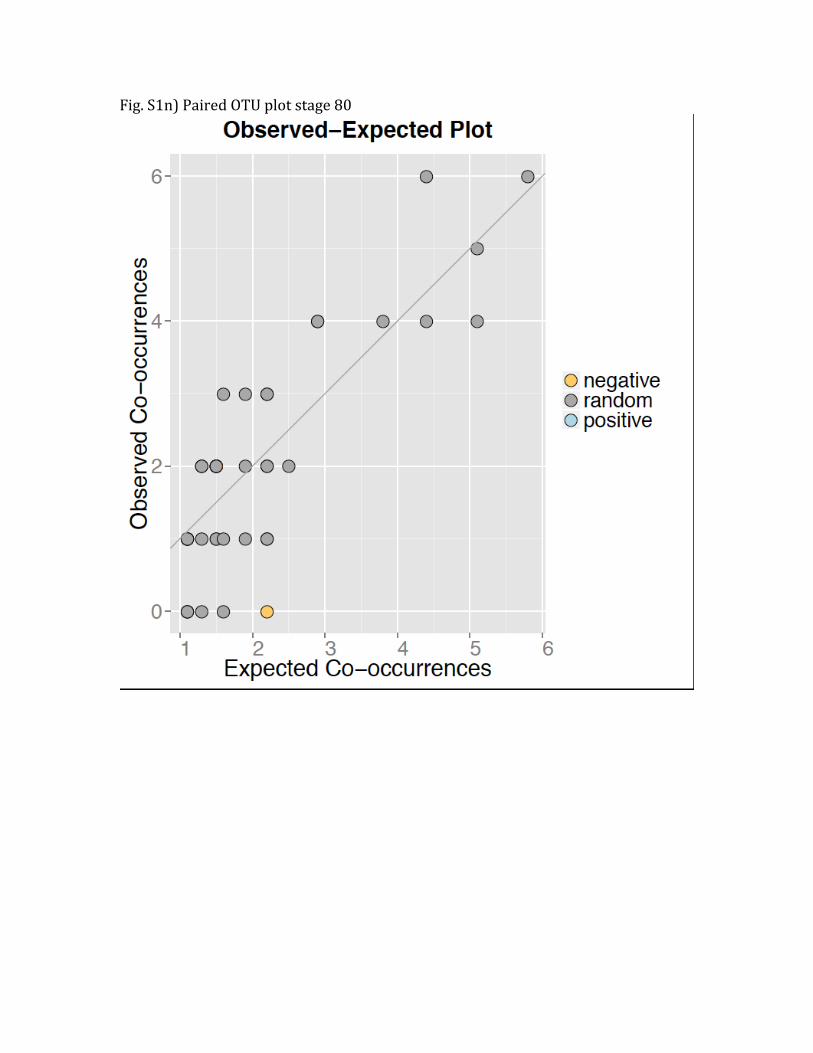
Fig. S1n) Paired OTU plot stage 80


