Download - Supelco Reporter Vol. 27 - Sigma-Aldrich
ReporterVolume 27.4
During the last decade, analysis of food and beverage products for both harmful and beneficial compounds has become a topic of major interest.
Food & Beverage Analysis
•• Liquid Chromatography
•• Sample Handling
•• Gas Chromatography
•• Standards
•• Accessories
•• Chiral Chromatography
2
sigm
a-al
dric
h.co
m/a
naly
tical
Volume 27.4
Reporter Visit us on the web at sigma-aldrich.com/thereporter
Reporter is published 5 times a year by Supelco Marketing, 595 North Harrison Road, Bellefonte, PA 16823-0048.
Innovation & Trends in Sample Preparation
An Trinh
Product Manager, Sample Prep
Volume 27.4
Table of ContentsLiquid Chromatography
UHPLC with the new Ascentis® Express Phenyl-Hexyl Column .........................3
NEW! Ultra-High Performance Liquid Chromatography Accessories .............7
Reversed-Phase HPLC Buffers.............8
Discovery® BIO GFC 3 μm Packings ..10
Sample HandlingExtraction of Nitroimidazoles from Milk and Eggs using Molecularly Imprinted Polymers ..........................15
The Analysis of Resveratrol in Red Wine by On-Fiber Derivatization/SPME .........................18
Gas ChromatographyComparing the Enantioselectivity of Cyclodextrin-Based GC Chiral Stationary Phases .............................11
Determination of Triglycerides and Waxes in Food Products Using Cool On-Column Injection and the MET-Biodiesel Capillary Column .......12
StandardsNSI Solutions Inorganic Product Line ....................................20
Characterized Reference Oils for Standardizing Lipid Procedures ........22
Mono-, Di-, and Triglyceride Chemical Standards. ........................22
AccessoriesSGE Slim Line Syringes for CTC/Leap Autosamplers ...................23
Accelerating Customers’ Success through Innovation and Leadership in Life Science, High Technology and Service
Dear Colleague:
As LC-MS becomes increasingly commonplace, analysts are expected to develop assays that are faster, provide greater throughput, and achieve sensitivity levels that were near impossible just a decade prior.
I highlight below some of the recent trends observed in sample prep technology:
Multi-Residue Methods. Most solid phase extraction procedures target a specifi c analyte or class of analytes; however, many researchers, especially in the fi eld of food safety/quality, must monitor for dozens of classes of analytes. In such applications, fi nding a single SPE condition that can adequately retain such a broad range of compounds would be impossible. To negotiate this issue, researchers have developed SPE techniques that target the retention and removal of specifi c interferences for a given sample matrix. These researchers have recognized that if the sample prep method can remove one to three key interferences, targeted LLODS can often be achieved. A classic example is the recently popular QuEChERS technique for multi-residue pesticide analysis.
Simple and Generic Methods. In order to maximize the throughput benefi ts of LC-MS technology, most researchers desire faster and easier sample prep. As a result, simple and generic techniques such as protein precipitation have become the preferred method when analyzing biological plasma. When improved selectivity is desired, such analysts look towards SPE phases that are more amenable to generic methodology such as hydrophilic polymer SPE phases and mixed-mode SPE technology.
Highly Selective Techniques. As mentioned previously, more and more assays are targeting lower limits of detection. As trace analysis becomes mainstream, highly selective sample prep techniques are becoming more prevalent. For example, molecularly imprinted polymers have seen a surge in publications in recent years; and many of the more recent and exciting developments in sample prep technology are application specifi c. In the last 5 years, Supelco has commercialized an array of application specifi c products including: HybridSPE™-Precipitation technology for protein and phospholipid removal, SupelMIP™ molecularly imprinted polymers, silver-ion SPE for FAMEs analysis, Supelclean™ sulfoxide SPE for PCB fractionation... to name a few.
To learn more about these trends and our solutions for them, visit our web site at sigma-aldrich.com/sampleprep or call our Technical Service Group at 800-359-3041 (US and Canada only) and 814-359-3041.
Best regards,
An TrinhProduct Manager, Sample Prep

3
orde
ring:
800
-247
-662
8 (U
S on
ly) /
814
-359
-344
1 te
chni
cal s
ervi
ce: 8
00-3
59-3
041
(US
and
Can
ada
only
) / 8
14-3
59-3
041
Volume 27.4
Richard A. Henry(2) and Hillel K. [email protected]
Peak resolution is a requirement for sensitive, accurate
chromatographic analysis. Scientifi c meetings and
publications have been dominated recently by reports on
HPLC columns with Fused-Core™ particles and porous
particles in the sub-2 μm range, which can both signifi -
cantly enhance resolution and speed by producing either
higher effi ciency (N) for the same column length or
equivalent effi ciency with shorter column length.
Ultra-high performance liquid chromatography (UHPLC)
comes at a price of much higher pressure when sub-2 μm
particles are employed. The revolutionary Ascentis Express
2.7 μm Fused-Core silica particle (Figure 1) has quickly
become accepted as an attractive alternative because it is
equivalent in performance to particles in the sub-2 μm
range. With a very narrow particle size distribution,
Ascentis Express columns employ conventional 2 μm frits
and operate ruggedly at much lower pressures that are
within the comfort zone of conventional HPLC instruments.
column family, and describes how column selectivity and
higher effi ciency can be coupled to achieve much faster
separations than have previously been possible.
The vast majority of UHPLC separations have been
carried out with C18 columns in the classic reversed-phase
(RP) mode; however, suppliers now offer many different
phases. Although no one would dispute the fact that
UHPLC columns with different phases are needed, very
little has been published yet on the performance that can
be expected from UHPLC columns having different,
complementary selectivity to C18 and C8. Two of the
most popular polar-RP phases are RP-Amide, which is
often categorized as an embedded polar-group phase,
and Phenyl, which can interact with solutes by π-π
mechanisms. A brief retention and selectivity comparison
for the Ascentis Express column family is given in Table 1.
Liq
uid
Ch
rom
ato
gra
ph
y
sigma-aldrich.com/express
Ultra-High Performance Liquid Chromatography (UHPLC) with the new Ascentis Express Phenyl-Hexyl Column
0.5
μm
1.7
μm
2.7
μm
G004850
Figure 1. Fused-Core Structure of Ascentis Express
C18 and C8 phases are highly popular because they are
stable, reproducible, and easy-to-use. Retention correlates
closely with log P values, which have been established for
many solutes. Solute ionization causes retention to
decrease in a predictable manner and is relatively easy to
control by adding dilute acids, bases, and buffers to the
mobile phase. Changing the organic component of the
mobile phase between acetonitrile and methanol (or other
solvents) allows the user to tweak resolution because
solvation affects phase structure and selectivity. Tempera-
ture is also a useful variable for optimizing phase selectiv-
ity. Columns with C18 and C8 phases will frequently give
optimum resolution when solutes are nonpolar or slightly
polar; however, columns with polar-RP phases such as
RP-Amide or Phenyl-Hexyl will often show improved (continued on page 4)
Table 1. Brief Overview of Ascentis Express Column Retention and Selectivity
Ascentis Express Principle PrincipleFused-Core Retention SolutePhase Mode Interaction
C18 Reversed-Phase (RP) Hydrophobic (dispersive)
C8 Reversed-Phase (RP) Hydrophobic (dispersive)
RP-Amide RP with embedded Hydrophobic and polarity H-bonding
Phenyl-Hexyl RP with pendant Hydrophobic and π-π aromaticity
HILIC (Silica) HILIC (or normal Hydrophilic (dipole, phase) H-bonding, ion exchange)
Why Do We Need Different HPLC Phases?
Even though new column technologies have more than
doubled the plates per meter possible with traditional 5 μm
columns, resolution still cannot be routinely achieved in
every case without the ability to adjust retention and
selectivity by proper selection of column stationary and
mobile phases. This article features Ascentis Express
Phenyl-Hexyl phase, a new addition to the Fused-Core
4
sigm
a-al
dric
h.co
m/a
naly
tical
Volume 27.4
Liq
uid
Ch
rom
ato
gra
ph
y
sigma-aldrich.com/express
retention and selectivity for more polar solutes. It should
be emphasized that even polar-RP phases have a signifi -
cant alkyl phase character in addition to their polar
character. The same mobile phase solvents and techniques
may be employed with polar-RP phases, with comparable
phase stability to C18.
The RP-Amide phase is complementary to C18 because
the amide group has several unique features: 1) strong
interaction by H-bonding when solutes can donate or
accept protons, 2) effective shielding of silanols by internal
H-bonding between amide group and silica surface, and
3) the ability to wet and operate well, even in 100%
aqueous solvents. H-bonding allows solutes with carboxyl
and phenol groups to be retained much longer and
separate much better on RP-Amide than on C18 or C8.
Shielding prevents solutes with amino groups from
interacting with silanols and can result in shorter retention
and sharper peaks on amide phases. Another interesting
feature of amide phases is that methanol and other
alcohols become much stronger solvents when H-bonding
between phase and solute occurs. Except for the special
situations listed above, an RP-Amide phase often performs
similar to C18 due to the long alkyl chain extending away
from the surface.
The Phenyl phase has unique selectivity arising from
solute interaction with the aromatic ring and its delocalized
electrons. It is complementary (orthogonal) to both C18
and RP-Amide phases because of this unique aromaticity.
An unsubstituted phenyl ring is a π-donor or Lewis base,
which interacts strongly with π-acceptors and any electron-
defi cient Lewis acid. Phenyl phases also tend to exhibit
good shape selectivity, which may originate from solute
multipoint interaction with the planar ring system. More
retention and selectivity will often be observed for solutes
with aromatic electron-withdrawing groups (fl uorine, nitro,
etc.) or with a delocalized heterocyclic ring system such as
the benzodiazepine compounds studied.
UHPLC Results with Ascentis Express Phenyl-Hexyl
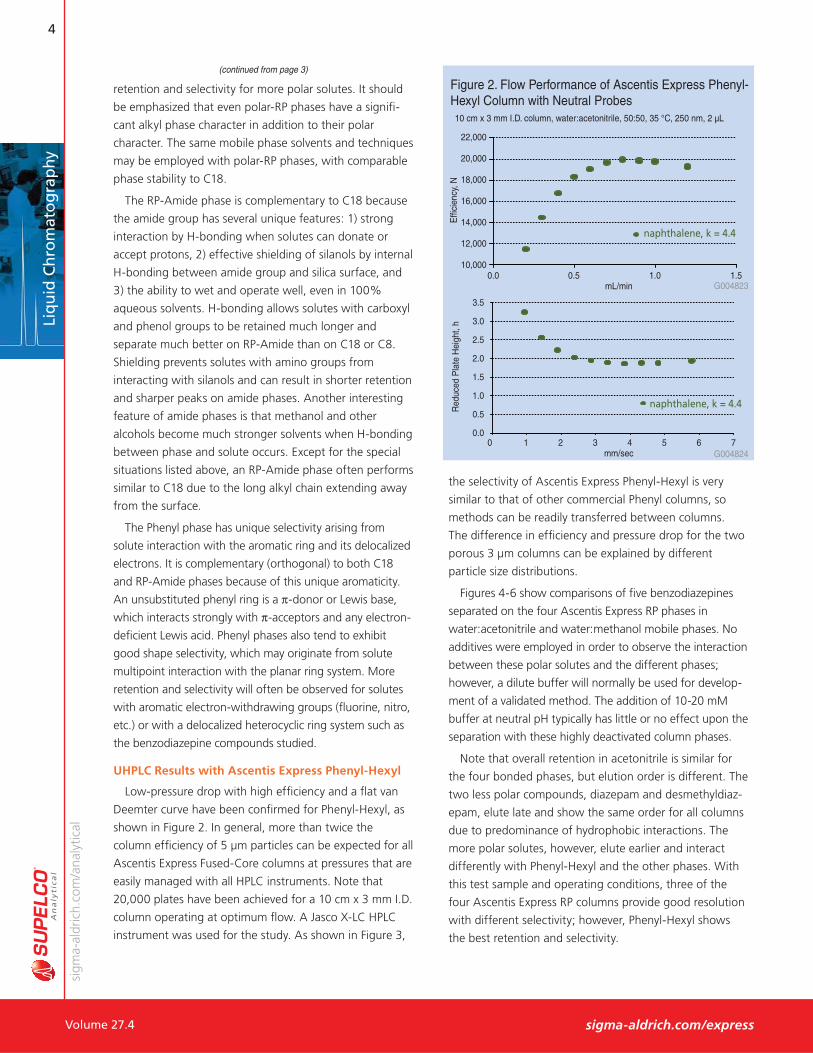
Low-pressure drop with high effi ciency and a fl at van
Deemter curve have been confi rmed for Phenyl-Hexyl, as
shown in Figure 2. In general, more than twice the
column effi ciency of 5 μm particles can be expected for all
Ascentis Express Fused-Core columns at pressures that are
easily managed with all HPLC instruments. Note that
20,000 plates have been achieved for a 10 cm x 3 mm I.D.
column operating at optimum fl ow. A Jasco X-LC HPLC
instrument was used for the study. As shown in Figure 3,
(continued from page 3)
the selectivity of Ascentis Express Phenyl-Hexyl is very
similar to that of other commercial Phenyl columns, so
methods can be readily transferred between columns.
The difference in effi ciency and pressure drop for the two
porous 3 μm columns can be explained by different
particle size distributions.
Figures 4-6 show comparisons of fi ve benzodiazepines
separated on the four Ascentis Express RP phases in
water:acetonitrile and water:methanol mobile phases. No
additives were employed in order to observe the interaction
between these polar solutes and the different phases;
however, a dilute buffer will normally be used for develop-
ment of a validated method. The addition of 10-20 mM
buffer at neutral pH typically has little or no effect upon the
separation with these highly deactivated column phases.
Note that overall retention in acetonitrile is similar for
the four bonded phases, but elution order is different. The
two less polar compounds, diazepam and desmethyldiaz-
epam, elute late and show the same order for all columns
due to predominance of hydrophobic interactions. The
more polar solutes, however, elute earlier and interact
differently with Phenyl-Hexyl and the other phases. With
this test sample and operating conditions, three of the
four Ascentis Express RP columns provide good resolution
with different selectivity; however, Phenyl-Hexyl shows
the best retention and selectivity.
Figure 2. Flow Performance of Ascentis Express Phenyl-Hexyl Column with Neutral Probes10 cm x 3 mm I.D. column, water:acetonitrile, 50:50, 35 °C, 250 nm, 2 μL
Effi
cien
cy, N
22,000
20,000
18,000
16,000
14,000
12,000
10,0000.0 0.5 1.0 1.5
mL/min
Red
uced
Pla
te H
eigh
t, h
3.5
3.0
2.5
2.0
1.5
1.0
0.5
0.00 1 2 3 4 5 6 7
mm/sec
naphthalene, k = 4.4
naphthalene, k = 4.4
G004823
G004824

5
orde
ring:
800
-247
-662
8 (U
S on
ly) /
814
-359
-344
1 te
chni
cal s
ervi
ce: 8
00-3
59-3
041
(US
and
Can
ada
only
) / 8
14-3
59-3
041
Volume 27.4
1
23
4
5
Liq
uid
Ch
rom
ato
gra
ph
y
sigma-aldrich.com/express
Figure 3. Comparison of Phenyl Column Selectivity for Benzodiazepines
column: as indicated - 10 cm x 3 mm I.D. mobile phase A: water mobile phase B: acetonitrile mobile phase ratios: A:B = 65:35 fl ow rate: 0.6 mL/min. temp.: 35°C det.: UV, 250 nm injection: 2 μL
Sample (0.1 g/L ea.) 1. Oxazepam 2. Alprazolam 3. Clonazepam 4. N-desmethyldiazepam 5. Diazepam
0 2 4 6 8 10Min
G004825
G004826
G004827
Figure 4. Benzodiazepine Structures
N = 18,900
k = 10.4
N = 14,200
k = 14.1
N = 10,600
k = 13.3
Ascentis Express Phenyl-Hexyl
Total = 3000 psiCol = 2360 psi
Column A Phenyl-Hexyl, 3μ
Total = 2700 psiCol = 2060 psi
Column B Phenyl, 3μ
Total = 1750 psiCol = 1110 psi
Diazepam N-desmethyldiazepam Alprazolam
Clonazepam Oxazepam
G002881 G003672 G003670
G002879 G003654
(continued on page 6)
Figure 5. Benzodiazepines in 35% Acetonitrile Mobile Phase with no Additive
column: Ascentis Express, as indicated - 10 cm x 3 mm I.D., 2.7 μm particles mobile phase A: water mobile phase B: acetonitrile mobile phase ratios: A:B = 65:35 fl ow rate: 0.6 mL/min. pressure: 3000 psi total, 2360 psi column temp.: 35 °C det.: UV, 250 nm injection: 2 μL
1
23
4
5
1
2
3 4
5
0 2 4 6 8Min
1
2
3
4
5
Phenyl-Hexyl
C18
C8
Sample (0.1 g/L ea.) 1. Oxazepam 2. Alprazolam 3. Clonazepam 4. N-desmethyldiazepam 5. Diazepam
A switch to water:methanol in Figure 6 (page 6) shows a
dramatic change in retention for Ascentis Express Phenyl-
Hexyl. In water:methanol mobile phase, the phenyl group
interacts much more strongly than the other phases with
the solute heterocyclic ring system, presumably by a π-π
mechanism. Kazakevitch (1) has published evidence that
methanol forms only monolayer coverage on aromatic
phases (and also thinly solvates other phases), which allows
the aromatic selectivity to shine through more strongly.
Elution order for the polar compounds also changes from
that of water:acetonitrile conditions. For this test sample,
Ascentis Express Phenyl-Hexyl selectivity is clearly superior
in water:methanol to the other phases.
G004809
G004808
G004807
G004806
3
1
2
4
5
3
1
2
4
5
3
1
2
4
5
RP-Amide

6
sigm
a-al
dric
h.co
m/a
naly
tical
Volume 27.4
Liq
uid
Ch
rom
ato
gra
ph
y
sigma-aldrich.com/express
Featured Products+Ascentis Express Phenyl-Hexyl HPLC Columns
Length (cm) I.D. (mm) Cat. No.
3 2.1 53332-U 5 2.1 53334-U 7.5 2.1 53335-U 10 2.1 53336-U 15 2.1 53338-U 3 3.0 53341-U 5 3.0 53342-U 7.5 3.0 53343-U 10 3.0 53345-U 15 3.0 53346-U 3 4.6 53347-U 5 4.6 53348-U 7.5 4.6 53351-U 10 4.6 53352-U 15 4.6 53353-U
Figure 7. Ascentis Express Phenyl-Hexyl High-Speed Separation
column: 10 cm x 3 mm I.D. mobile phase A: water mobile phase B: acetonitrile mobile phase ratios: A:B = 50:50 fl ow rate: 1.2 mL/min pressure: 5525 psi temp.: 35 °C det.: UV, 250 nm injection: 2 μL
Figure 6. Benzodiazepines in 60% Methanol Mobile Phase with no Additive
column: Ascentis Express, as indicated - 10 cm x 3 mm I.D. mobile phase A: water mobile phase B: methanol mobile phase ratios: A:B = 40:60 fl ow rate: 0.6 mL/min pressure: 4200 psi total; 3420 psi column temp.: 35 °C det.: UV, 250 nm injection: 2 μL
A major objective for development of UHPLC columns is
to gain separation speed and sample throughput by using
shorter columns at higher fl ow rates. These columns also
improve sensitivity and uses less solvent. The fl at van
Deemter curve shown in Figure 2 allows an increase in
fl ow rate and mobile phase velocity without a signifi cant
loss in resolution. This result is illustrated in Figure 7 for a
neutral polar test mix in water:acetonitrile mobile phase.
(continued from page 5)
Phenyl-Hexyl
C8
C18
RP-Amide
Sample (0.1 g/L ea.) 1. Oxazepam 2. Alprazolam 3. Clonazepam 4. N-desmethyldiazepam 5. Diazepam
Conclusions
A new Phenyl-Hexyl phase has been paired with Fused-
Core particles to complete the primary Ascentis Express
column family. High performance with lower pressure drop
than other UHPLC columns has been confi rmed for all
Fused-Core particle phases. Ascentis Express Phenyl-Hexyl
correlates well to other Phenyl phases for easy method
development or method transfer. Selectivity for benzodiaz-
epine compounds has been compared to the other Ascentis
Express RP phases in water:acetonitrile and water:methanol.
The extra retention possible with Phenyl phases in
water:methanol has been demonstrated for these heterocy-
clic aromatic compounds. The potential for faster, more
sensitive assays using Ascentis Express Phenyl-Hexyl and all
Ascentis Express phases has been shown.
References 1. Kazakevitch, Y. V., et al. J. Chromatogr., A. 2005, 1082, 158–165.
2. Consultant to Supelco/Sigma-Aldrich.
0 2 4 6 8Min G004831
31
2
4
5
3 1,2
4
5
3 1
2
4
5
31
24
5
0 1.0 2.0Min G004832
G004830
G004829
G004828
N = 19,200
1. Uracil 2. Acetophenone 3. Benzene 4. Toluene 5. Naphthalene
31
2
4 5
7
orde
ring:
800
-247
-662
8 (U
S on
ly) /
814
-359
-344
1 te
chni
cal s
ervi
ce: 8
00-3
59-3
041
(US
and
Can
ada
only
) / 8
14-3
59-3
041
Volume 27.4sigma-aldrich.com/hplc
Liq
uid
Ch
rom
ato
gra
ph
y
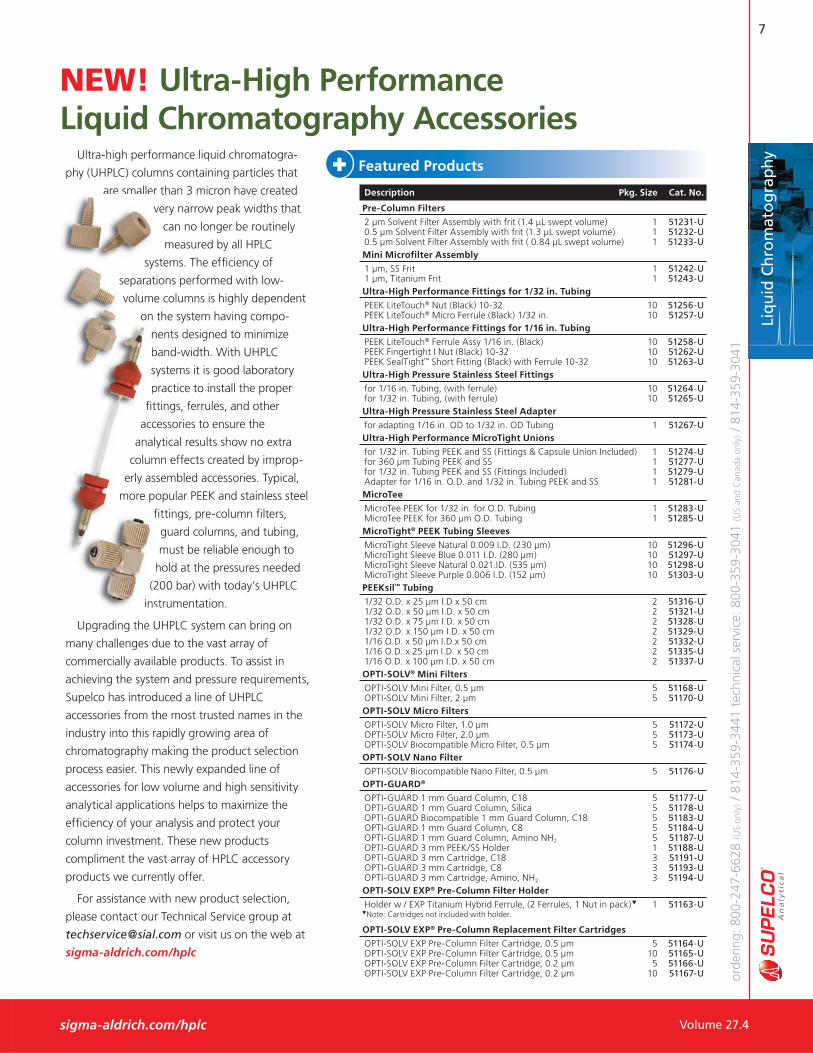
NEW! Ultra-High Performance Liquid Chromatography Accessories
Ultra-high performance liquid chromatogra-
phy (UHPLC) columns containing particles that
are smaller than 3 micron have created
very narrow peak widths that
can no longer be routinely
measured by all HPLC
systems. The effi ciency of
separations performed with low-
volume columns is highly dependent
on the system having compo-
nents designed to minimize
band-width. With UHPLC
systems it is good laboratory
practice to install the proper
fi ttings, ferrules, and other
accessories to ensure the
analytical results show no extra
column effects created by improp-
erly assembled accessories. Typical,
more popular PEEK and stainless steel
fi ttings, pre-column fi lters,
guard columns, and tubing,
must be reliable enough to
hold at the pressures needed
(200 bar) with today’s UHPLC
instrumentation.
Upgrading the UHPLC system can bring on
many challenges due to the vast array of
commercially available products. To assist in
achieving the system and pressure requirements,
Supelco has introduced a line of UHPLC
accessories from the most trusted names in the
industry into this rapidly growing area of
chromatography making the product selection
process easier. This newly expanded line of
accessories for low volume and high sensitivity
analytical applications helps to maximize the
effi ciency of your analysis and protect your
column investment. These new products
compliment the vast array of HPLC accessory
products we currently offer.
For assistance with new product selection,
please contact our Technical Service group at
[email protected] or visit us on the web at
sigma-aldrich.com/hplc
are smaller
v
sys
separati
volume
on t
n
b
sy
p
fi tt
acc
analy
colum
erly ass
more po
fi
h
(2
ins
Featured Products+Description Pkg. Size Cat. No.
Pre-Column Filters
2 μm Solvent Filter Assembly with frit (1.4 μL swept volume) 1 51231-U0.5 μm Solvent Filter Assembly with frit (1.3 μL swept volume) 1 51232-U0.5 μm Solvent Filter Assembly with frit ( 0.84 μL swept volume) 1 51233-UMini Microfi lter Assembly
1 μm, SS Frit 1 51242-U1 μm, Titanium Frit 1 51243-UUltra-High Performance Fittings for 1/32 in. Tubing
PEEK LiteTouch® Nut (Black) 10-32 10 51256-UPEEK LiteTouch® Micro Ferrule (Black) 1/32 in. 10 51257-UUltra-High Performance Fittings for 1/16 in. Tubing
PEEK LiteTouch® Ferrule Assy 1/16 in. (Black) 10 51258-UPEEK Fingertight I Nut (Black) 10-32 10 51262-U PEEK SealTight™ Short Fitting (Black) with Ferrule 10-32 10 51263-UUltra-High Pressure Stainless Steel Fittings
for 1/16 in. Tubing, (with ferrule) 10 51264-Ufor 1/32 in. Tubing, (with ferrule) 10 51265-UUltra-High Pressure Stainless Steel Adapter
for adapting 1/16 in. OD to 1/32 in. OD Tubing 1 51267-UUltra-High Performance MicroTight Unions
for 1/32 in. Tubing PEEK and SS (Fittings & Capsule Union Included) 1 51274-Ufor 360 μm Tubing PEEK and SS 1 51277-Ufor 1/32 in. Tubing PEEK and SS (Fittings Included) 1 51279-UAdapter for 1/16 in. O.D. and 1/32 in. Tubing PEEK and SS 1 51281-UMicroTee
MicroTee PEEK for 1/32 in. for O.D. Tubing 1 51283-UMicroTee PEEK for 360 μm O.D. Tubing 1 51285-UMicroTight® PEEK Tubing Sleeves
MicroTight Sleeve Natural 0.009 I.D. (230 μm) 10 51296-UMicroTight Sleeve Blue 0.011 I.D. (280 μm) 10 51297-UMicroTight Sleeve Natural 0.021.ID. (535 μm) 10 51298-UMicroTight Sleeve Purple 0.006 I.D. (152 μm) 10 51303-UPEEKsil™ Tubing
1/32 O.D. x 25 μm I.D x 50 cm 2 51316-U1/32 O.D. x 50 μm I.D. x 50 cm 2 51321-U1/32 O.D. x 75 μm I.D. x 50 cm 2 51328-U1/32 O.D. x 150 μm I.D. x 50 cm 2 51329-U1/16 O.D. x 50 μm I.D.x 50 cm 2 51332-U1/16 O.D. x 25 μm I.D. x 50 cm 2 51335-U1/16 O.D. x 100 μm I.D. x 50 cm 2 51337-UOPTI-SOLV® Mini Filters
OPTI-SOLV Mini Filter, 0.5 μm 5 51168-UOPTI-SOLV Mini Filter, 2 μm 5 51170-UOPTI-SOLV Micro Filters
OPTI-SOLV Micro Filter, 1.0 μm 5 51172-UOPTI-SOLV Micro Filter, 2.0 μm 5 51173-UOPTI-SOLV Biocompatible Micro Filter, 0.5 μm 5 51174-UOPTI-SOLV Nano Filter
OPTI-SOLV Biocompatible Nano Filter, 0.5 μm 5 51176-UOPTI-GUARD®
OPTI-GUARD 1 mm Guard Column, C18 5 51177-UOPTI-GUARD 1 mm Guard Column, Silica 5 51178-UOPTI-GUARD Biocompatible 1 mm Guard Column, C18 5 51183-UOPTI-GUARD 1 mm Guard Column, C8 5 51184-UOPTI-GUARD 1 mm Guard Column, Amino NH2 5 51187-U OPTI-GUARD 3 mm PEEK/SS Holder 1 51188-UOPTI-GUARD 3 mm Cartridge, C18 3 51191-UOPTI-GUARD 3 mm Cartridge, C8 3 51193-UOPTI-GUARD 3 mm Cartridge, Amino, NH2 3 51194-UOPTI-SOLV EXP® Pre-Column Filter Holder
Holder w / EXP Titanium Hybrid Ferrule, (2 Ferrules, 1 Nut in pack)▼ 1 51163-U▼Note: Cartridges not included with holder.
OPTI-SOLV EXP® Pre-Column Replacement Filter Cartridges
OPTI-SOLV EXP Pre-Column Filter Cartridge, 0.5 μm 5 51164-UOPTI-SOLV EXP Pre-Column Filter Cartridge, 0.5 μm 10 51165-UOPTI-SOLV EXP Pre-Column Filter Cartridge, 0.2 μm 5 51166-UOPTI-SOLV EXP Pre-Column Filter Cartridge, 0.2 μm 10 51167-U
8
sigm
a-al
dric
h.co
m/a
naly
tical
Volume 27.4 sigma-aldrich.com/hplc
Reversed-Phase HPLC BuffersHigh quality buffers (solutions, solids or concentrates)
Shyam [email protected]
Preparation of aqueous mobile phase is the most critical
step in reversed-phase chromatography (RPC) method
development for ionic analytes. This includes consider-
ation of the affects of pH on analyte retention, type of
buffer to use, and its concentration, solubility in the
organic modifi er and its affect on detection, among other
considerations. The improper choice of buffer, in terms of
buffering species, ionic strength and pH, can result in
poor or irreproducible retention and tailing in reversed-
phase separation of polar and ionizable compounds.
Problems like partial ionization of the analyte and
strong interaction between analytes and residual silanoles
or other active sites on the stationary phases can be
overcome by proper mobile phase buffering (maintaining
the pH within a narrow range) and choosing the right
ionic species and its concentration (ionic strength) in the
mobile phase (1-2). In sensitive LC-MS separations that
depend heavily on the correct choice of acid, base,
buffering species and other additives (3), a buffer must be
chosen based on its ability to maintain, and not suppress
analyte ionization in the MS interface.
Mobile Phase pH and Reversed-Phase Retention
Retention of ionic analytes in RPC is fundamentally
affected by mobile phase pH. The dissociation properties
of the ionic functional groups also impact analyte
retention. Retention of non-ionic analytes is minimally
affected by mobile phase pH.
For acidic moieties (usually carboxylates), a pH below
the pKa (within limits) and for basic moieties (usually
amines), a pH above the pKa (within limits) of the
compound enhances retention. Dramatic effects are
observed on retention of these analytes in pH range near
the pKa of a given functional group. This becomes
apparent in consideration of chemical dissociation as
illustrated in Figure 1.
The last two equations are commonly known as the
Henderson-Hasselbach equation. These equations suggest
that for pH far removed from the pKa, a small change in the
pH has a minimal affect on the ratio of unprotonated-to-
protonated species. Therefore, moderate change in pH will
not affect retention signifi cantly. However, at pH near the
pKa, a small change in pH will produce a signifi cant change
in the ratio of the two species. Therefore, changing the pH
within a range of values suffi ciently close to the pKa will
dramatically affect retention. When pH is used to increase
reversed-phase retention, the pH should be changed in the
direction that decreases analyte ionization.
Buffer Selection
Buffers are solutions of a weak acid and its conjugate
base, or a weak base and its conjugate acid. They mitigate
the infl uence of hydrogen/hydronium and hydroxide ions
and subsequently reduce the pH fl uctuations, even upon
dilution. The typical pH range for reversed-phase on a
silica-based packing is pH 2 to 8. Choice of buffer is
typically governed by the desired pH. It is important that
the buffer has a pKa close to the desired pH since buffers
control pH best at their pKa. A rule of thumb is to choose
a buffer with a pKa value <2 units of the desired mobile
phase pH (see Table 1).
Phosphoric acid and its sodium or potassium salts are
the most common buffer systems for reversed-phase
HPLC. Phosphate’s two pKa values, 2.1 and 7.1, and UV
transparency make it ideal for most HPLC separations. Its
pKa of 12.3 is suitable for buffering in 11.3-13.3 pH range.
Phosphonate buffers can be replaced with sulfonate
buffers when analyzing organophosphate compounds.
With the growth in popularity of LC-MS, volatile buffer
systems, such as TFA, acetate, formate, and ammonia, are
frequently used.
Buffer Concentration: A higher buffer concentration
that enhance buffer capacity will give more reproducible
separation of compounds partially ionized at the pH of the
HA H+ + A- and Ka =[ H+ ] [ A- ]
HABy defi nition: pH = –log [H+], or pH = pKa + log
The corresponding equation for a weak base is:
or pH = pKa + log[ B ]
[ BH+ ]
Liq
uid
Ch
rom
ato
gra
ph
y Figure 1. Chemical Dissociation of an Ionic Analyte
For a weak acid:
[ A- ]
[ HA ]

9
orde
ring:
800
-247
-662
8 (U
S on
ly) /
814
-359
-344
1 te
chni
cal s
ervi
ce: 8
00-3
59-3
041
(US
and
Can
ada
only
) / 8
14-3
59-3
041
Volume 27.4
Table 1. HPLC Buffers, pKa Values and Useful pH Range
sigma-aldrich.com/derivatization
mobile phase, by reducing local perturbations of the pH of
the migrating analyte peak. Generally, a buffer concentra-
tion of 10-50 mM is adequate for small molecules.
Buffer Solubility: It is especially important when
performing gradient separations. Solubility can be
empirically determined by mixing given volume fractions
of buffer and the organic solvent. Appearance of precipi-
tates or opaque solution indicates solubility issues. A
general rule is no more than 50% organic should be used
with a buffer. This will depend on the specifi c buffer as
well as its concentration.
Effects on Detection: The choice of buffer is also
dependent upon means of detection. For traditional UV
detection, the buffer needs to be effectively transparent
in this region, especially critical for gradient separations.
Buffers listed in Table 1 have low enough absorption
below 220 nm.
More common issues today are related to compatibility
with mass spectral (MS) detection. Preferred buffers
addressing the issue of volatility are formate, acetate, and
ammonia. In regard to the issue of suppression of ioniza-
tion, formate and acetate are ideal choices for positive-ion
Featured Products+HPLC-Grade (puris p.a.) Buffers and Additives
Description Pkg. Size Cat. No.
Ammonium acetate, >99.0% (NT) 50 g, 250 g 17836
Ammonium formate, >99.0% (NT) 50 g, 250 g 17843 (dried material)
Ammonium hydroxide solution, 100 mL, 1 L 17837 ~10% (T) in water
Ammonium phosphate monobasic, >99.0% (T) 250 g 17842
Ammonium trifl uoroacetate, >99.0% (NT) 10 g, 50 g 17839
Potassium phosphate dibasic anhydrous, 250 g 17835 >99.0% (T)
Sodium formate, >99.0% (NT) 250 g 17841
Sodium phosphate dibasic dihydrate, ~99% (T) 50 g, 250 g 71633
Sodium phosphate monobasic anhydrous, 50 g, 250 g 17844 >99.0% (T)
Sodium trifl uoroacetate, >99.0% (T) 10 g 17840
Trifl uoroacetic acid:Triethylamine 2M:1M 500 mL 9746
Trifl uoroacetic acid:Triethylamine 2M:2M 100 mL 9747
mode detection. TFA, however, can negatively impact
detector response even in positive-ion mode (4,5), while it
strongly suppresses ionization with negative ion mode.
Acetic acid is good for negative-ion mode. LC-MS applica-
tions further limit buffer selection and buffer concentration.
References 1. McMaster, M.C. HPLC A Practical User’s Guide, VCH Publishers, Inc.: New York,
NY, 1994; 85.
2. Poole, C.F. and Poole, S.K. Chromatography Today, Elsevier Science: Amsterdam, The Netherlands, 1991; 431.
3. Analytix, Five-part series on Mobile Phase Additives for LC-MS, Issue 3, 2006 (www.sigma-ldrich.com/analytix).
4. Temesi, D., Law, B., The Effect of LC Eluent Composition on MS Response Using Electrospray Ionization, LC-GC, 17:626. 1999.
5. Apffel, A. et. al. Enhanced Sensitivity for Peptide Mapping with Electrospray Liquid Chromatography-Mass Spectrometry in the Presence of Signal Suppression Due to Trifl uoroacetic Acid-Containing Mobile Phases, J. Chrom. A. 712:177. 1995.
For a complete list of HPLC buffers and additives, refer
to our online product catalog at: sigma-aldrich.com
Liq
uid
Ch
rom
ato
gra
ph
y
Derivatization Reagents BrochureListing over 400 Derivatization Reagents
To order your free copy either go to sigma-aldrich.com/derivatization, call 800-359-3041 (US and Canada)
or 814-359-3041, email [email protected] or request KDI on the attached card.
● Products sorted by GC, HPLC, Chiral and TLC techniques● Reagents also listed by “Application”● Vials, syringes and other useful items for derivatization reactions● Up-to-date application information and references
Buffer pKa (25°C) Useful pH Range
TFA 0.5 <1.5 Sulfonate 1.8 <1-2.8 Phosphate 2.1 1.1-3.1 Chloroacetate 2.9 1.9-3.9 Formate 3.8 2.8-4.8 Acetate 4.8 3.8-5.8 Sulfonate 6.9 5.9-7.9 Phosphate 7.2 6.2-8.2 Ammonia 9.2 8.2-10.2 Phosphate 12.3 11.3-13.3

10
sigm
a-al
dric
h.co
m/a
naly
tical
Volume 27.4 sigma-aldrich.com/discovery
Ch
iral
Ch
rom
ato
gra
ph
y
Discovery BIO GFC 3 μm PackingsHillel Brandes and Hugh [email protected]
Gel fi ltration chromatography (GFC) (or size exclusion
chromatography) is a common technique for resolution of
biological macromolecules based on size and/or shape.
Analytes that are large relative to the pore size of the
stationary phase are excluded from the pores and therefore
elute relatively early. Conversely, analytes that are small
relative to the pore size, are well-retained and therefore
elute later. Shape also affects retention: Molecules with a
more elongated structure are not as retained as much as
those that are more spherical or globular.
The Discovery BIO GFC product line for gel fi ltration of
macromolecules is based on uniform, spherical, high-purity
silica with a hydrophilic surface. To date, Discovery BIO GFC
has been available as a 5 μm product line; now, the 3 μm
particles have been added. While the 3 μm will generate
higher backpressures, the relatively low fl ow rates that are
generally optimal for gel fi ltration chromatography only
generate modest back pressures. However, the tremendous
advantage of the 3 μm columns is their higher effi ciency.
This will directly translate to higher resolution and peak
capacity. Request Application Note 187 (T309187) for
further discussion of peak capacity.
Figure 1 compares the elution profi les of a protein
mixture on Discovery BIO GFC, 3 μm versus 5
μm, with the same y-axis scaling. The
improvement in the 3 μm packing is evident
in the narrower and taller peaks. Also evident is
improvements in fi ne detail of the chromato-
gram, which refl ects the higher resolution. A
comparison of the calculated peak effi ciencies,
however, is particularly striking. This is shown
in Table 1 with a sampling of analytes. The
greatest gains are evident with moderately
retained analytes, with peak effi ciencies
improving on the order of 100%. Even for uracil,
representative of a fully retained analyte, effi ciency
has improved 30%, which itself is signifi cant.
Table 1. Peak Effi ciencies (N) of Discovery BIO GFC, 3 μm versus 5 μm
GFC 100 GFC 150 GFC 300Protein/Analyte 5 μm 3 μm % Improvement 5 μm 3 μm % Improvement 5 μm 3 μm % Improvement
BSA monomer -- -- -- 5200 9200 77 10000 19300 93
Ovalbumin -- -- -- 5600 11500 105 9700 18300 89
Myoglobin 13500 24500 81 12600 28800 129 16600 32900 98
Ribonuclease A 14200 25100 77 12900 23400 81 16100 31500 96
Uracil 36400 47900 32 26600 37300 40 26300 36200 38
Figure 1. Elution Profi les of 3 μm Discovery BIO GFC 300 (A) and 5 μm Discovery BIO GFC 300 (B)
column: Discovery BIO GFC 300, 30 cm x 7.8 mm I.D., 3 μm particles (567337-U) mobile phase: 150 mM potassium phosphate monobasic, pH 7.0 (adjusted with potassium hydroxide) fl ow rate: 0.7 mL/min. pressure: 1100 psi temp.: ambient det.: UV, 214 nm injection: 1 μL sample: 1 g/L ea. (except uracil, 0.1 g/L) in mobile phase
1. Thyroglobulin aggregate 2. Thyroglobulin 3. γ-Globulin dimer 4. γ-Globulin monomer
mAU
214
nm
40
20
0
G004833
mAU
214
nm
6 8 10 12 14 16 18 20mL/min G004834
A
B
1
2
3
4
5
6
78
1
2
3
4
5
6
7 8
ytic
al
higher
general
generate
advantage
This will dir
capacity. R
further disc
Figure
mim xt
μ
im
in the
improv
gram, w
compari
however,
in Table 1 w
greatest gain
retained analyt
improving on the
representative of a
has improved 30%
Featured Products+Description Cat. No.
Discovery BIO GFC 100: (100 – 100,000 mw range)
5 cm x 4.6 mm I.D., 3 μm particles 567322-U30 cm x 4.6 mm I.D., 3 μm particles 567323-U5 cm x 7.8 mm I.D., 3 μm particles 567324-U30 cm x 7.8 mm I.D., 3 μm particles 567325-U
Discovery BIO GFC 150: (500 – 150,000 mw range)
5 cm x 4.6 mm I.D., 3 μm particles 567328-U30 cm x 4.6 mm I.D., 3 μm particles 567329-U5 cm x 7.8 mm I.D., 3 μm particles 567330-U30 cm x 7.8 mm I.D., 3 μm particles 567331-U
Discovery BIO GFC 300: (5,000 – 1,250,000 mw range)
5 cm x 4.6 mm I.D., 3 μm particles 567334-U30 cm x 4.6 mm I.D., 3 μm particles 567335-U5 cm x 7.8 mm I.D., 3 μm particles 567336-U30 cm x 7.8 mm I.D., 3 μm particles 567337-U
6 8 10 12 14 16 18 20mL/min
40
20
0
5. Ovalbumin 6. Myoglobin 7. Poly-DL-alanine 8. Uracil
11
orde
ring:
800
-247
-662
8 (U
S on
ly) /
814
-359
-344
1 te
chni
cal s
ervi
ce: 8
00-3
59-3
041
(US
and
Can
ada
only
) / 8
14-3
59-3
041
Volume 27.4
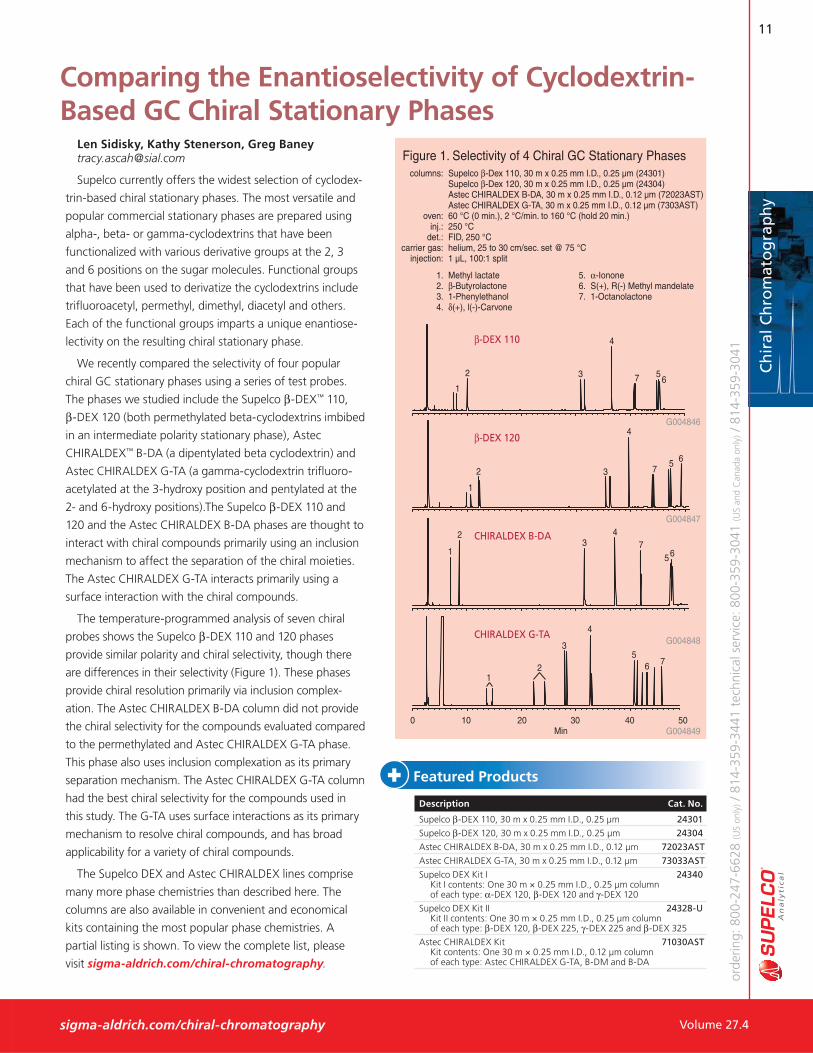
Figure 1. Selectivity of 4 Chiral GC Stationary Phases columns: Supelco β-Dex 110, 30 m x 0.25 mm I.D., 0.25 μm (24301) Supelco β-Dex 120, 30 m x 0.25 mm I.D., 0.25 μm (24304) Astec CHIRALDEX B-DA, 30 m x 0.25 mm I.D., 0.12 μm (72023AST) Astec CHIRALDEX G-TA, 30 m x 0.25 mm I.D., 0.12 μm (7303AST) oven: 60 °C (0 min.), 2 °C/min. to 160 °C (hold 20 min.) inj.: 250 °C det.: FID, 250 °C carrier gas: helium, 25 to 30 cm/sec. set @ 75 °C injection: 1 μL, 100:1 split
sigma-aldrich.com/chiral-chromatography
Ch
iral
Ch
rom
ato
gra
ph
y
Comparing the Enantioselectivity of Cyclodextrin-Based GC Chiral Stationary Phases
Len Sidisky, Kathy Stenerson, Greg [email protected]
Supelco currently offers the widest selection of cyclodex-
trin-based chiral stationary phases. The most versatile and
popular commercial stationary phases are prepared using
alpha-, beta- or gamma-cyclodextrins that have been
functionalized with various derivative groups at the 2, 3
and 6 positions on the sugar molecules. Functional groups
that have been used to derivatize the cyclodextrins include
trifl uoroacetyl, permethyl, dimethyl, diacetyl and others.
Each of the functional groups imparts a unique enantiose-
lectivity on the resulting chiral stationary phase.
We recently compared the selectivity of four popular
chiral GC stationary phases using a series of test probes.
The phases we studied include the Supelco β-DEX™ 110,
β-DEX 120 (both permethylated beta-cyclodextrins imbibed
in an intermediate polarity stationary phase), Astec
CHIRALDEX™ B-DA (a dipentylated beta cyclodextrin) and
Astec CHIRALDEX G-TA (a gamma-cyclodextrin trifl uoro-
acetylated at the 3-hydroxy position and pentylated at the
2- and 6-hydroxy positions).The Supelco β-DEX 110 and
120 and the Astec CHIRALDEX B-DA phases are thought to
interact with chiral compounds primarily using an inclusion
mechanism to affect the separation of the chiral moieties.
The Astec CHIRALDEX G-TA interacts primarily using a
surface interaction with the chiral compounds.
The temperature-programmed analysis of seven chiral
probes shows the Supelco β-DEX 110 and 120 phases
provide similar polarity and chiral selectivity, though there
are differences in their selectivity (Figure 1). These phases
provide chiral resolution primarily via inclusion complex-
ation. The Astec CHIRALDEX B-DA column did not provide
the chiral selectivity for the compounds evaluated compared
to the permethylated and Astec CHIRALDEX G-TA phase.
This phase also uses inclusion complexation as its primary
separation mechanism. The Astec CHIRALDEX G-TA column
had the best chiral selectivity for the compounds used in
this study. The G-TA uses surface interactions as its primary
mechanism to resolve chiral compounds, and has broad
applicability for a variety of chiral compounds.
The Supelco DEX and Astec CHIRALDEX lines comprise
many more phase chemistries than described here. The
columns are also available in convenient and economical
kits containing the most popular phase chemistries. A
partial listing is shown. To view the complete list, please
visit sigma-aldrich.com/chiral-chromatography.
Featured Products+Description Cat. No.
Supelco β-DEX 110, 30 m x 0.25 mm I.D., 0.25 μm 24301
Supelco β-DEX 120, 30 m x 0.25 mm I.D., 0.25 μm 24304
Astec CHIRALDEX B-DA, 30 m x 0.25 mm I.D., 0.12 μm 72023AST
Astec CHIRALDEX G-TA, 30 m x 0.25 mm I.D., 0.12 μm 73033AST
Supelco DEX Kit I 24340 Kit I contents: One 30 m × 0.25 mm I.D., 0.25 μm column of each type: α-DEX 120, β-DEX 120 and γ-DEX 120
Supelco DEX Kit II 24328-U Kit II contents: One 30 m × 0.25 mm I.D., 0.25 μm column of each type: β-DEX 120, β-DEX 225, γ-DEX 225 and β-DEX 325
Astec CHIRALDEX Kit 71030AST Kit contents: One 30 m × 0.25 mm I.D., 0.12 μm column of each type: Astec CHIRALDEX G-TA, B-DM and B-DA
0 10 20 30 40 50Min
G004846
G004847
G004848
G004849
1
2 3
4
567
1
2 3
4
5 67
1
23
4
567
12
3
4
56 7
β-DEX 110
β-DEX 120
CHIRALDEX B-DA
CHIRALDEX G-TA
1. Methyl lactate 2. β-Butyrolactone 3. 1-Phenylethanol 4. δ(+), l(-)-Carvone
5. α-Ionone 6. S(+), R(-) Methyl mandelate 7. 1-Octanolactone

sigm
a-al
dric
h.co
m/a
naly
tical
12
Volume 27.4 sigma-aldrich.com/gc
Gas
Ch
rom
ato
gra
ph
y
Determination of Triglycerides and Waxes in Food Products Using Cool On-Column Injection and the MET-Biodiesel Capillary Column
Michael D. [email protected]
Introduction
Food nutrition (composition, fat content, labeling
requirements, etc.) and food chemistry (ingredients,
purity, fl avors & fragrances, etc.) are two areas of study in
a food & beverage laboratory. Examples of each are:
● Desired nutritional data includes the triglyceride content of various food products, providing informa-tion that complements that of the fatty acid composition
● Food chemistry analysis includes the characterization of wax content in olive oil, used to help ensure the product is unadulterated
Both of these analyses can be accomplished with the use
of capillary gas chromatography (GC). The suitability of the
MET-Biodiesel capillary column to perform both of these
applications was investigated.
MET-Biodiesel Column
The Supelco MET-Biodiesel capillary GC column was
designed specifi cally for the determination of free and
total glycerin in B100 biodiesel samples. Table 1 lists the
column specifi cations. Several features and benefi ts of this
column indicate that it is also well-suited for the analysis
of triglycerides and waxes in food products. These
features and benefi ts include:
● Metal column holds up better than fused silica, virtually eliminating column breakage
● Integrated guard protects the analytical column, extending column life with a leak-free connection
● Integrated guard also acts as a retention gap, minimizing peak broadening
● Provides good peak shape and resolution for glycerides
● Able to separate mono-, di-, and triglycerides (the mono- and diglycerides analyzed as TMS derivatives)
● Short column length, allowing for fast analysis times ● Operates at a maximum temperature of 380 °C
(isothermal) and 430 °C (programmed)
Our goal was to obtain the acceptable resolution in as
fast of a run time as possible. Several analyses, each using
a different mix, were performed to illustrate the chro-
matographic results that can be obtained with this
column. All separations were performed using cool
on-column injection, which improves the recovery of high
molecular weight substances.
Triglycerides
Triglycerides (also called triacylglycerol, triacylglyceride,
or TAG) are the main constituent of vegetable oil and
animal fat, and make up most of the fats digested by
humans. They are important in that they allow the uptake
and transport of fat-soluble vitamins. Plus, they play a role
in metabolism (unused saturated or monounsaturated
fatty acids are stored by the body as triglycerides).
However, triglyceride intake should be monitored because
high levels of triglycerides have been linked to an in-
creased risk of heart disease and stroke.
Most natural fats contain a complex mixture of indi-
vidual triglycerides. Therefore, effi cient capillary columns
with the ability to provide ample resolution are required
for proper identifi cation. Triglycerides are large com-
pounds requiring a relatively high fi nal oven temperature
for elution in a reasonable time.
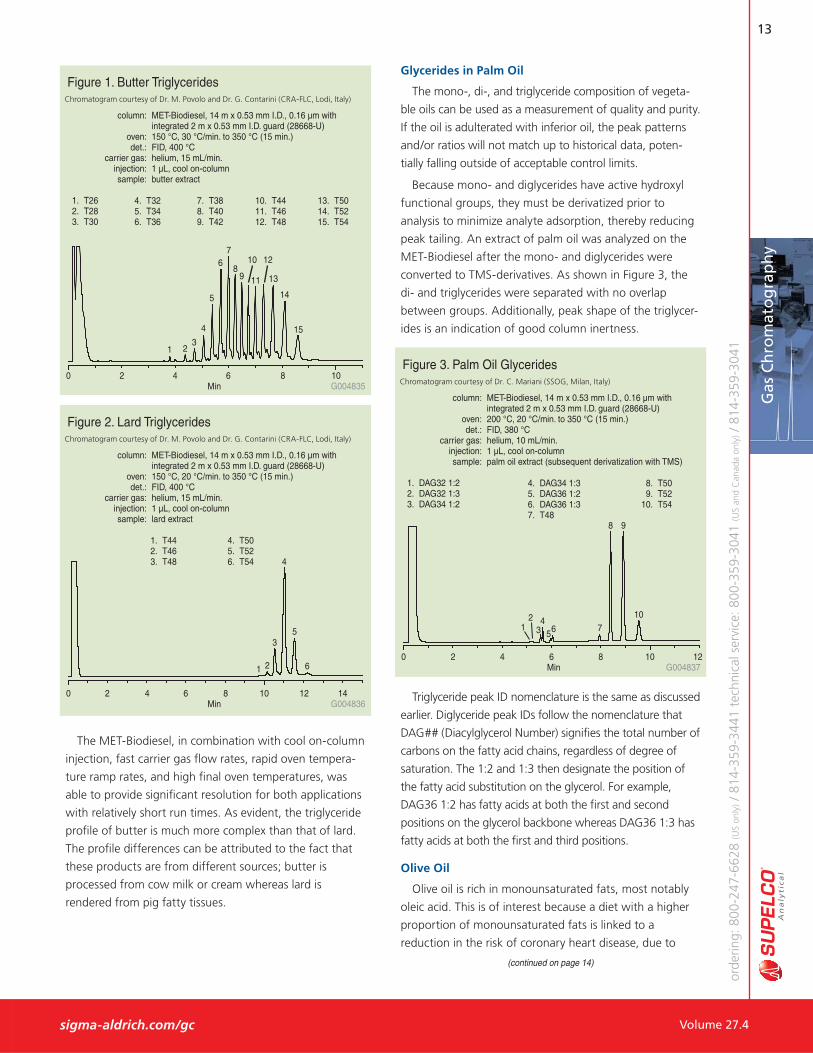
Triglycerides in Butter and Lard
The extraction and analysis of triglycerides in butter and
lard samples were performed, with the resulting chro-
matograms shown in Figure 1 and Figure 2, respectively.
Peak IDs follow the nomenclature that T## (Triglyceride
Number or Triacylglycerol Number) signifi es the total
number of carbons on the fatty acid chains, regardless of
degree of saturation or position on the glycerol backbone.
For example, T54 could be SSS, a triglyceride containing
three stearic acids (C18:0). It could also be SOS or SSO, a
triglyceride containing two stearic acids (C18:0) and one
oleic acid (C18:1).
Table 1. MET-Biodiesel Specifi cations Application: This rugged metal column was designed
specifi cally for the determination of free and total glycerin in B100 biodiesel samples. A guard is integrated, thereby providing protection with a leak-free connection (the guard and analytical column are one continuous piece of tubing; there is no union between the guard and analytical column).
USP Code: None Phase: Bonded; proprietary Temperature Limits: -60 °C to 380/430 °C
13
orde
ring:
800
-247
-662
8 (U
S on
ly) /
814
-359
-344
1 te
chni
cal s
ervi
ce: 8
00-3
59-3
041
(US
and
Can
ada
only
) / 8
14-3
59-3
041
Volume 27.4
Gas
Ch
rom
ato
gra
ph
y
sigma-aldrich.com/gc
The MET-Biodiesel, in combination with cool on-column
injection, fast carrier gas fl ow rates, rapid oven tempera-
ture ramp rates, and high fi nal oven temperatures, was
able to provide signifi cant resolution for both applications
with relatively short run times. As evident, the triglyceride
profi le of butter is much more complex than that of lard.
The profi le differences can be attributed to the fact that
these products are from different sources; butter is
processed from cow milk or cream whereas lard is
rendered from pig fatty tissues.
Glycerides in Palm Oil
The mono-, di-, and triglyceride composition of vegeta-
ble oils can be used as a measurement of quality and purity.
If the oil is adulterated with inferior oil, the peak patterns
and/or ratios will not match up to historical data, poten-
tially falling outside of acceptable control limits.
Because mono- and diglycerides have active hydroxyl
functional groups, they must be derivatized prior to
analysis to minimize analyte adsorption, thereby reducing
peak tailing. An extract of palm oil was analyzed on the
MET-Biodiesel after the mono- and diglycerides were
converted to TMS-derivatives. As shown in Figure 3, the
di- and triglycerides were separated with no overlap
between groups. Additionally, peak shape of the triglycer-
ides is an indication of good column inertness.
Figure 1. Butter Triglycerides Chromatogram courtesy of Dr. M. Povolo and Dr. G. Contarini (CRA-FLC, Lodi, Italy)
column: MET-Biodiesel, 14 m x 0.53 mm I.D., 0.16 μm with integrated 2 m x 0.53 mm I.D. guard (28668-U) oven: 150 °C, 30 °C/min. to 350 °C (15 min.) det.: FID, 400 °C carrier gas: helium, 15 mL/min. injection: 1 μL, cool on-column sample: butter extract
1. T26 2. T28 3. T30
(continued on page 14)
4. T32 5. T34 6. T36
7. T38 8. T40 9. T42
10. T44 11. T46 12. T48
Figure 2. Lard Triglycerides Chromatogram courtesy of Dr. M. Povolo and Dr. G. Contarini (CRA-FLC, Lodi, Italy)
column: MET-Biodiesel, 14 m x 0.53 mm I.D., 0.16 μm with integrated 2 m x 0.53 mm I.D. guard (28668-U) oven: 150 °C, 20 °C/min. to 350 °C (15 min.) det.: FID, 400 °C carrier gas: helium, 15 mL/min. injection: 1 μL, cool on-column sample: lard extract
1. T44 2. T46 3. T48
4. T50 5. T52 6. T54
Figure 3. Palm Oil Glycerides Chromatogram courtesy of Dr. C. Mariani (SSOG, Milan, Italy)
column: MET-Biodiesel, 14 m x 0.53 mm I.D., 0.16 μm with integrated 2 m x 0.53 mm I.D. guard (28668-U) oven: 200 °C, 20 °C/min. to 350 °C (15 min.) det.: FID, 380 °C carrier gas: helium, 10 mL/min. injection: 1 μL, cool on-column sample: palm oil extract (subsequent derivatization with TMS)
1. DAG32 1:2 2. DAG32 1:3 3. DAG34 1:2
4. DAG34 1:3 5. DAG36 1:2 6. DAG36 1:3 7. T48
8. T50 9. T52 10. T54
Triglyceride peak ID nomenclature is the same as discussed
earlier. Diglyceride peak IDs follow the nomenclature that
DAG## (Diacylglycerol Number) signifi es the total number of
carbons on the fatty acid chains, regardless of degree of
saturation. The 1:2 and 1:3 then designate the position of
the fatty acid substitution on the glycerol. For example,
DAG36 1:2 has fatty acids at both the fi rst and second
positions on the glycerol backbone whereas DAG36 1:3 has
fatty acids at both the fi rst and third positions.
Olive Oil
Olive oil is rich in monounsaturated fats, most notably
oleic acid. This is of interest because a diet with a higher
proportion of monounsaturated fats is linked to a
reduction in the risk of coronary heart disease, due to
0 2 4 6 8 10Min G004835
1 23
4
5
67
89
10
11
12
13
14
15
0 2 4 6 8 10 12 14Min G004836
1 2
3
4
5
60 2 4 6 8 10 12
Min G004837
12
34
56 7
8 9
10
13. T50 14. T52 15. T54

sigm
a-al
dric
h.co
m/a
naly
tical
14
Volume 27.4 sigma-aldrich.com/gc
Gas
Ch
rom
ato
gra
ph
y
favorable effects on cholesterol regulation and LDL
cholesterol oxidation, as well as helping to build a more
healthy balance between omega 3 and omega 6 fats.
Therefore, it is desirable to substitute olive oil for other
food products wherever possible.
Olive oil is used throughout the world, especially in the
countries surrounding the Mediterranean Sea. The quality
of the olive oil, infl uenced by the source of the olives and
also how it is processed, determines what it can best be
used for. Possible uses for various grades of olive oils are
shown in Table 2.
(continued from page 13)
Table 2. Grades/Uses of Olive OilGrade UseExtra-virgin olive oil Salads, soups and stews,
dipping breadVirgin olive oil Sautéing ingredientsOlive oil Cosmetics, pharmaceuticals,
soapsOlive-pomace oil Certain kinds of cooking in
restaurantsLampante oil Fuel in traditional oil-burning
lamps (non-edible)
Olive oil is regulated in much of the world to discourage
the labeling of lower grade oils as higher grade oils. As
such, detailed analytical work is performed to fully
characterize the oil. This may include the determination of
free fatty acids, peroxide index, wax content, sterol
content, erythrodiol and uvaol, saturated fatty acids in
position 2 of the triglyceride, spectrophotometric analysis,
fatty acid composition, volatile halogenated solvents,
organoleptic characteristics, stigmastadienes, triglyceride
content, and aliphatic alcohol content.
Olive Oil Waxes
One of the regulated characteristics of olive oil is its wax
content, an indicator of both quality and purity. Because
wax content varies among the various categories of edible
oils, comparing peak patterns and ratios to known
references and specifi cations can determine if the olive oil
has been adulterated with inferior oil.
Because some of these wax compounds may have high
boiling points, GC analysis using a column with a high
temperature limit is desirable. This allows for elution of all
analytes in a reasonable amount of time with good peak
shape. Figure 4 shows the chromatogram obtained from
the analysis of olive oil on the MET-Biodiesel column. The
use of a 350 °C fi nal oven temperature helps to produce
sharp peaks, allowing for easy and accurate peak pattern
and ratio comparisons to known references.
Conclusion
The MET-Biodiesel capillary column is a suitable choice
for analysts who work on triglyceride and/or wax separa-
tions in which high column temperatures are required. The
column’s inertness, high thermal stability, and low bleed
ensure good peak shape and resolution for the analytes
that were evaluated. As shown, this column can be used to
achieve optimal result for these applications.
References 1. ISO/DIS 17678.2, Milk and Milk Products – Determination of Milk Fat Purity by Gas
Chromatographic Analysis of Triglyceride, International Organization for Standard-ization.
2. M. Povolo, V. Pelizzola, and G. Contarini, Directly Resistively Heated Column Gas Chromatography for the Evaluation of Cow Milk Fat Purity, European Journal of Lipid Science and Technology 110.11 (2008) page 1050-1057.
3. Commission Regulation (EEC) No 2568/91 of 11 July 1991, On the Characteristics of Olive Oils and Olive-Residue Oils and on the Relevant Methods of Analysis, Offi cial Journal of the European Communities L 248 (5 September 1991) page 1.
4. Commission Regulation (EC) No 2472/97 of 11 December 1997, Offi cial Journal of the European Communities L 341 (12 December 1997) page 25-39.
5. C. Mariani, P. Bondioli, S. Venturini, and E. Fedeli, Sulla formazione di acidi grassi trans nel processo di raffi nazione dell´olio di oliva lampante, Rivista Italiana delle Sostanze Grasse 68 (1991) page 455-459.
6. M. Buchanan, K. Stenerson, and V. Yearick, Determination of Free and Total Glycerin in B100 Biodiesel, Supelco Reporter 27.1 (2009) page 3-6.
Figure 4. Olive Oil Waxes Chromatogram courtesy of Dr. C. Mariani (SSOG, Milan, Italy)
column: MET-Biodiesel, 14 m x 0.53 mm I.D., 0.16 μm with integrated 2 m x 0.53 mm I.D. guard (28668-U) oven: 200 °C, 20 °C/min. to 350 °C (15 min.) det.: FID, 380 °C carrier gas: helium, 10 mL/min. injection: 1 μL, cool on-column sample: olive oil waxes
1. Diterpenes 2. C40-C46 esters 3. Sterol ester triterpene alcohols
Related Products +Description Cat. No.
Ceramic scribe for cutting capillary columns, Z290254-1PAK pack of 10
Needle-nose pliers, 7½ inch length 22437
Featured Products+Description Cat. No.
MET-Biodiesel, 14 m x 0.53 mm I.D., 0.16 μm 28668-U with integrated 2 m x 0.53 mm I.D. guard
0 2 4 6 8 10 12Min G004836
21
3
Volume 27.4

15
orde
ring:
800
-247
-662
8 (U
S on
ly) /
814
-359
-344
1 te
chni
cal s
ervi
ce: 8
00-3
59-3
041
(US
and
Can
ada
only
) / 8
14-3
59-3
041
Volume 27.4
SupelMIP SPE – Nitroimidazoles Extraction Procedure
One egg was homogenized. 10 g of the mix was spiked
at levels of 1, 2, and 5 μg/kg nitroimidazoles: DMZ, IPZ,
MNZ, RNZ, and metabolites DMZOH and MNZOH.
Deuterated internal standards of each compound were
added at the spike level of 2 μg/kg. For MNZ and
MNZOH, DMZOH-d3 was used as the internal standard.
10 g of the spiked samples were extracted with 10 mL
acetonitrile followed by centrifugation for 5 minutes. 2 g
sodium chloride was mixed with the isolated supernatant
followed by centrifugation. The extract was evaporated to
dryness in a silanized glass test tube. The residue was
reconstituted in 2 mL DI water and sonicated for 3
minutes prior to SPE processing.
Similar sample pre-treatment was followed for milk
samples; however, the acetonitrile and sodium chloride
extraction process was conducted in one step.
After sample pre-treatment, the resulting samples were
processed using the SupelMIP SPE procedure described in
Figure 2 (page 16).
LC-MS Analysis
After SupelMIP SPE, the samples were analyzed via
LC-MS using the conditions described in Table 1 (page 16).
Relative recovery was determined against internal standards
for each of the spike levels tested. The data was also used
to determine reproducibility and to estimate LLOD. Matrix
(ionization) effects were assessed by spiking nitroimidazoles
into post-SPE blank samples. The results were quantifi ed
against an external calibration curve diluted in buffer.
sigma-aldrich.com/supelmip
Sam
ple
Han
dlin
g
Extraction of Nitroimidazoles from Milk and Eggs using Molecularly Imprinted Polymers
Introduction
Nitroimidazoles are anti-bacterial and anti-coccidial
drugs used in the treatment of cattle, poultry, and pigs.
These compounds and their metabolites are suspected
carcinogens and mutagens. Consequently, their use in
veterinary practice is strictly regulated within European
Union Countries (Council Regulation 2377/90, Annex IV
Banned Compounds).
Metronidazole (MNZ), ipronidazole (IPZ) and ronidazole
(RNZ) belong to a list of pharmacologically active sub-
stances for which no maximum residue limit (MRL) can be
fi xed. As a result, their use is prohibited in food-producing
animals, and any residue of these compounds detected in
animals (and their products) intended for human con-
sumption is considered a violation of EU regulation. The
on-going surveillance of nitroimidazole drug residues and
their metabolites in animal products requires a highly
selective and sensitive assay for trace detection.
In this report, a new molecularly imprinted polymer SPE
phase (SupelMIP™) was evaluated for the extraction of
nitroimidazoles: dimetridazole (DMZ), metronidazole
(MNZ), ipronidazole (IPZ), ronidazole (RNZ), and their
hydroxylated metabolites (DMZOH and MNZOH) (Figure 1).
The nitroimidazole compounds were extracted from milk
and egg samples and analyzed via LC-MS.
What are Molecularly Imprinted Polymers?
Molecularly imprinted polymers (MIPs) are a class of
highly cross-linked polymer-based molecular recogition
elements engineered to bind one specifi c target com-
pound or a class of structurally related compounds with
high selectivity. The MIP material is designed with cavities
that are sterically and chemically complementary to the
target analyte(s). As a result, multiple interactions (e.g.,
hydrogen bonding, ionic, Van der Waals, hydrophobic)
can take place between the MIP captivity and the analyte.
Figure 1. Structure of Nitroimidazoles
G003649 G004839
Dimetridazole (DMZ) Metronidazole (MNZ)
G004840
Ipronidazole (IPZ) Ronidazole (RNZ)
(continued on page 16)
G004841
The following was generated with the assistance of an outside source using Sigma-Aldrich products. Technical content was generated and provided by:
Olga Shimelis1, Anna-Karin Wihlborg2, Marcus Rudolfsson2, Brian Boyd2, and An Trinh1
1. Supelco, Bellefonte, PA, USA2. MIP Technologies AB, Lund, Sweden
Contributed Article
16
sigm
a-al
dric
h.co
m/a
naly
tical
Volume 27.4 sigma-aldrich.com/supelmip
Sam
ple
Han
dlin
g
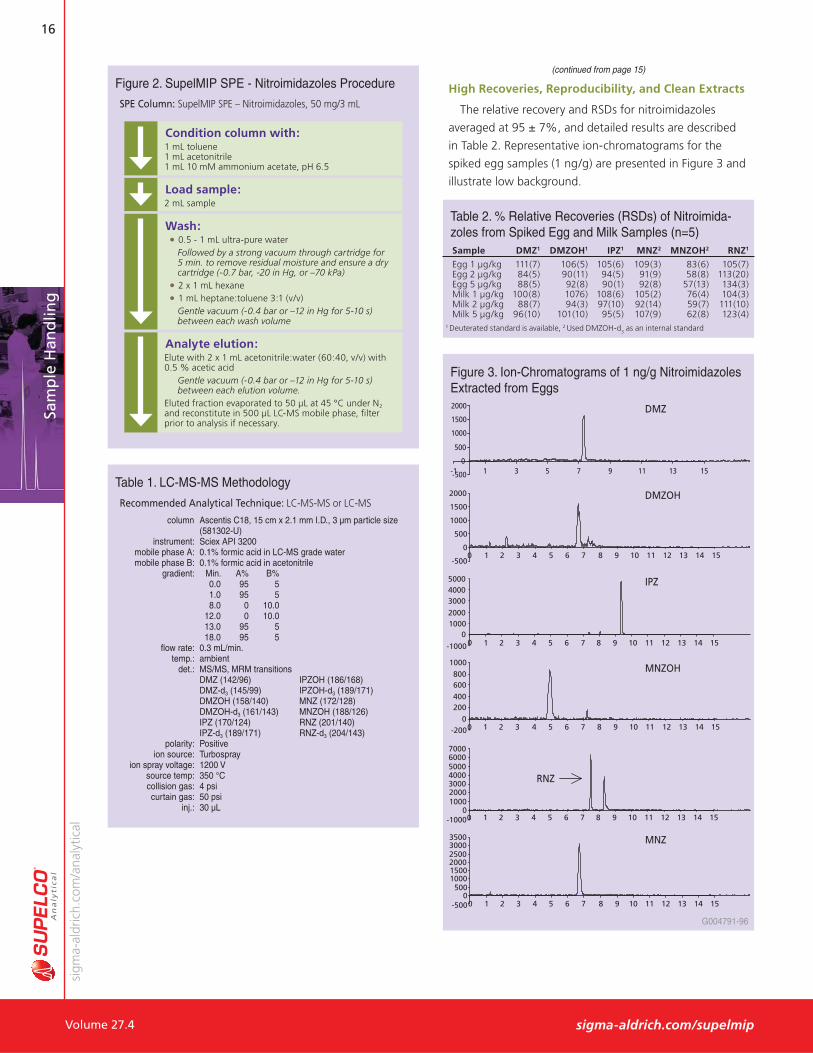
Figure 2. SupelMIP SPE - Nitroimidazoles Procedure
SPE Column: SupelMIP SPE – Nitroimidazoles, 50 mg/3 mL
(continued from page 15)
High Recoveries, Reproducibility, and Clean Extracts
The relative recovery and RSDs for nitroimidazoles
averaged at 95 ± 7%, and detailed results are described
in Table 2. Representative ion-chromatograms for the
spiked egg samples (1 ng/g) are presented in Figure 3 and
illustrate low background.
Table 1. LC-MS-MS Methodology
Recommended Analytical Technique: LC-MS-MS or LC-MS
column Ascentis C18, 15 cm x 2.1 mm I.D., 3 μm particle size (581302-U) instrument: Sciex API 3200 mobile phase A: 0.1% formic acid in LC-MS grade water mobile phase B: 0.1% formic acid in acetonitrile gradient: Min. A% B% 0.0 95 5 1.0 95 5 8.0 0 10.0 12.0 0 10.0 13.0 95 5 18.0 95 5 fl ow rate: 0.3 mL/min. temp.: ambient det.: MS/MS, MRM transitions DMZ (142/96) IPZOH (186/168) DMZ-d3 (145/99) IPZOH-d3 (189/171) DMZOH (158/140) MNZ (172/128) DMZOH-d3 (161/143) MNZOH (188/126) IPZ (170/124) RNZ (201/140) IPZ-d3 (189/171) RNZ-d3 (204/143) polarity: Positive ion source: Turbospray ion spray voltage: 1200 V source temp: 350 °C collision gas: 4 psi curtain gas: 50 psi inj.: 30 μL
Table 2. % Relative Recoveries (RSDs) of Nitroimida-zoles from Spiked Egg and Milk Samples (n=5)
Sample DMZ1 DMZOH1 IPZ1 MNZ2 MNZOH2 RNZ1
Egg 1 μg/kg 111(7) 106(5) 105(6) 109(3) 83(6) 105(7) Egg 2 μg/kg 84(5) 90(11) 94(5) 91(9) 58(8) 113(20) Egg 5 μg/kg 88(5) 92(8) 90(1) 92(8) 57(13) 134(3) Milk 1 μg/kg 100(8) 1076) 108(6) 105(2) 76(4) 104(3) Milk 2 μg/kg 88(7) 94(3) 97(10) 92(14) 59(7) 111(10) Milk 5 μg/kg 96(10) 101(10) 95(5) 107(9) 62(8) 123(4)
1 Deuterated standard is available, 2 Used DMZOH-d3 as an internal standard
Figure 3. Ion-Chromatograms of 1 ng/g Nitroimidazoles Extracted from Eggs
-500
0
500
1000
1500
2000
-1 1 3 5 7 9 11 13 15
-500
0
500
1000
1500
2000
0 1 2 3 4 5 6 7 8 9 10 11 12 13 14 15
-1000
010002000
300040005000
0 1 2 3 4 5 6 7 8 9 10 11 12 13 14 15
-2000
200400600800
1000
0 1 2 3 4 5 6 7 8 9 10 11 12 13 14 15
-10000
1000200030004000500060007000
0 1 2 3 4 5 6 7 8 9 10 11 12 13 14 15
-5000
500100015002000250030003500
0 1 2 3 4 5 6 7 8 9 10 11 12 13 14 15
DMZ
DMZOH
IPZ
MNZOH
RNZ
MNZ
G004791-96
Condition column with:1 mL toluene1 mL acetonitrile1 mL 10 mM ammonium acetate, pH 6.5
Load sample:2 mL sample
Wash: ● 0.5 - 1 mL ultra-pure water
Followed by a strong vacuum through cartridge for 5 min. to remove residual moisture and ensure a dry cartridge (-0.7 bar, -20 in Hg, or –70 kPa)
● 2 x 1 mL hexane ● 1 mL heptane:toluene 3:1 (v/v)
Gentle vacuum (-0.4 bar or –12 in Hg for 5-10 s) between each wash volume
Analyte elution:Elute with 2 x 1 mL acetonitrile:water (60:40, v/v) with 0.5 % acetic acid
Gentle vacuum (-0.4 bar or –12 in Hg for 5-10 s) between each elution volume.
Eluted fraction evaporated to 50 μL at 45 °C under N2 and reconstitute in 500 μL LC-MS mobile phase, fi lter prior to analysis if necessary.

17
orde
ring:
800
-247
-662
8 (U
S on
ly) /
814
-359
-344
1 te
chni
cal s
ervi
ce: 8
00-3
59-3
041
(US
and
Can
ada
only
) / 8
14-3
59-3
041
Volume 27.4
Sam
ple
Han
dlin
g
sigma-aldrich.com/supelmip
Conclusion
In this report, SupelMIP SPE – Nitroimidazoles was
evaluated for the extraction of nitroimidazoles and
metabolites from milk and egg. Using molecularly
imprinted polymer technology, high and reproducible
recoveries were observed. Extraction was conducted with
a high degree of selectivity minimizing ion-suppression,
allowing researchers to achieve LODs at the ppt to low
ppb levels. The SupelMIP method described in this report
is highly robust and reproducible offering the necessary
selectivity to achieve the stringent detection limit de-
mands in food safety surveillance.
For more information, please visit our website:
sigma-aldrich.com/supelmip
Samples spiked into post-SPE blank extracts revealed
good sample cleanup and low ion-suppression. The matrix
ionization effects were minimal as evident from the
90-120% recovery values depicted in Table 3.
Table 3. Determination of Matrix Effects – Absolute Recovery of Post-SPE Spiked Samples
Sample DMZ DMZOH IPZ MNZ MNZOH RNZ
Egg 91 92 103 96 99 89 Milk 118 110 123 116 98 109
Table 4. Estimated LOD of Nitroimidazoles using SupelMIP SPE
LOD (ng/g) RNZ MNZ DNZ DMZOH MNZOH IPZ
Egg 0.016 0.020 0.066 0.124 0.061 0.026 Milk 0.010 0.023 0.063 0.162 0.076 0.015
Featured Products+Description Oty. Cat. No.
SupelMIP SPE - Nitroimidazoles, 50 mg/3 mL 50 52734-U
Ascentis C18 Column, 15 cm x 2.1 mm I.D., 1 581302-U 3 μm particle size
The estimated detection levels of nitroimidazoles ranged
from 0.010-0.16 μg/kg in milk and 0.016-0.12 μg/kg in egg
(Table 4). The LODs were estimated by analyzing the
analyte and background response levels of the lowest
spike concentration; and extrapolating a theoretic
signal-to-noise ratio of 3:1.

18
sigm
a-al
dric
h.co
m/a
naly
tical
Volume 27.4 sigma-aldrich.com/spme
The Analysis of Resveratrol in Red Wine by On-Fiber Derivatization/SPME
Katherine [email protected]
Introduction
Resveratrol is a phytoallexin produced by grapes and
other plants to increase resistance to fungal infection.
Recent research suggests that consumption of resveratrol
may reduce the risk of certain cancers, heart disease, and
other age-related disorders (1). Red wine, which is produced
by fermentation of juice on the crushed grapes, has been
found to contain a greater amount of resveratrol than white
wine, which is produced by fermentation of the juice alone.
In this study, the extraction and analysis of resveratrol
from red wine is demonstrated using solid phase microex-
traction (SPME) and GC-MS. The presence of 3-hydroxyl
(OH) groups make it necessary to derivatize this compound
prior to GC analysis. Derivatization was conducted, after
extraction, directly on the SPME fi ber by exposing it to the
vapors of a silyating reagent. The derivative of resveratrol
was then analyzed directly from the fi ber using GC-MS.
Experimental
The extraction and derivatization conditions used are
summarized in Table 1. The polyacrylate fi ber, which is
suitable for the extraction of polar semivolatiles and is more
resistant to swelling than other types of fi bers, was chosen
based on recently published fi ndings (2,3). The extraction
conditions were based on these works as well, with some
modifi cations made to extraction and desorption times to
decrease matrix interference from the wine sample.
minutes directly in the injection port of the GC-MS. The
derivatization procedure resulted in silylation of all three
–OH groups present in resveratrol (Figure 1). The resulting
derivative has a molecular weight of 444, and subsequent
GC-MS analysis showed a predominance of the molecular
ion, which was used for quantifi cation.
Calibration standards ranging from 10 – 300 μg/L were
prepared by spiking a solution of 12% ethanol in water
with trans resveratrol. Red wine (California merlot),
diluted 3:1 in 12% ethanol in water, was analyzed both
“as is” and spiked with a known level of trans-resveratrol.
Results/Discussion
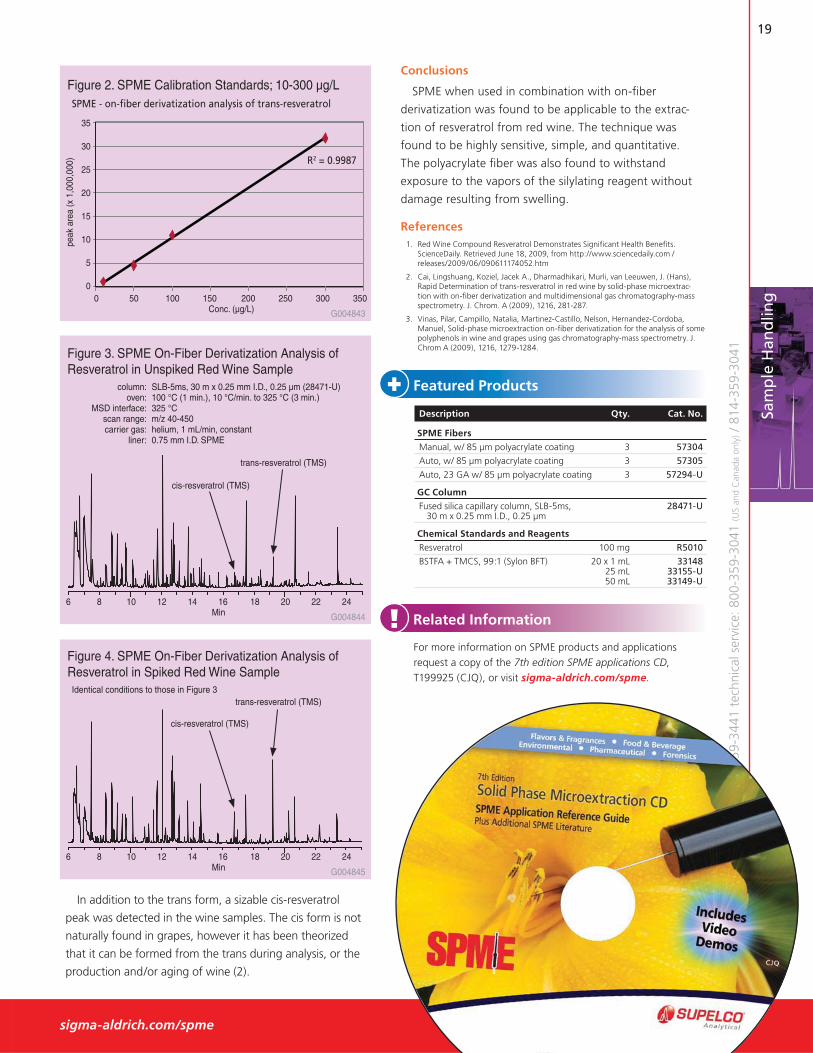
A plot of the calibration standards as absolute response
vs. concentration is presented in Figure 2. Linearity was very
good, with a correlation coeffi cient of 0.9987, indicating
that the extraction and derivatization procedure is quantita-
tive. Peak responses obtained using the technique were
adequate to allow for detection of the lowest calibration
standard while using the MSD in full scan mode.
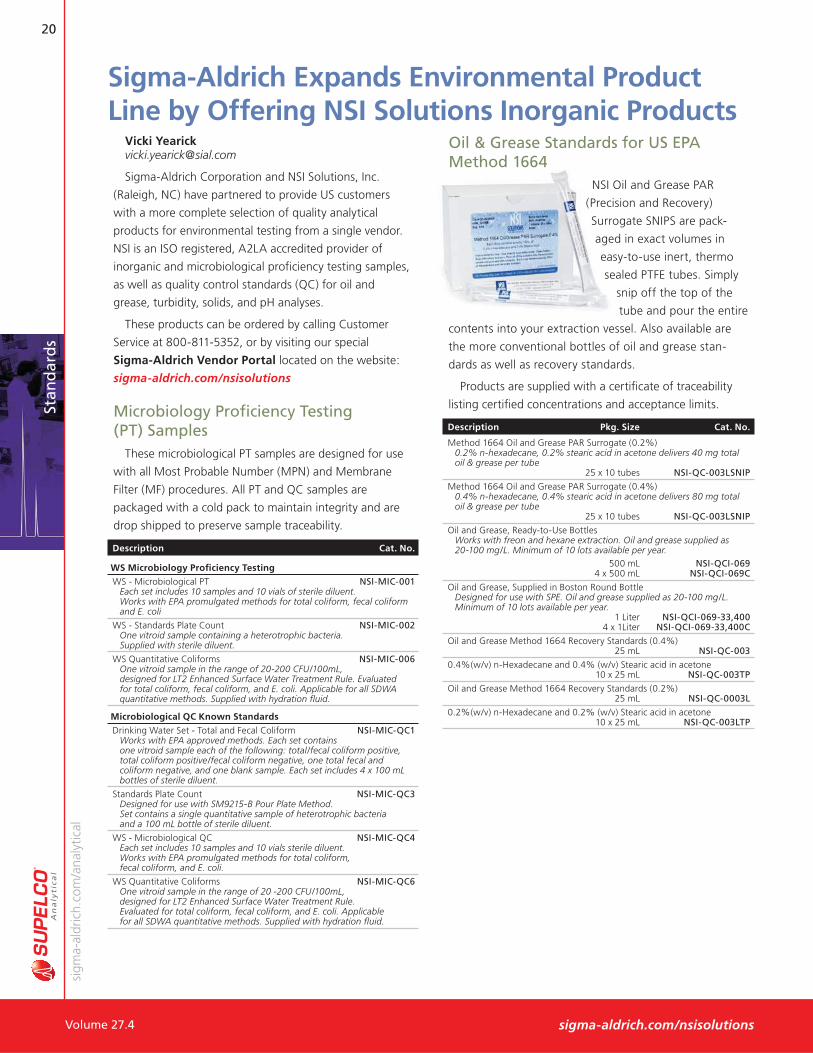
Chromatograms of the unspiked and spiked red wine
samples are presented in Figures 3 and 4. Using the
average response factor from the calibration, the levels of
trans-resveratrol in each were calculated, along with a
percent accuracy of this experimental value relative to the
known spiking level of the wine sample (Table 2).
Table 1. SPME – On-Fiber Derivatization Conditions sample/matrix: 3 mL of red wine (California merlot) diluted 3:1 in 12% ethanol:water SPME fi ber: 85 μm polyacrylate extraction: immersion at room temperature, 15 min., with stirring at 400 rpm derivatization: 20 min. in 4 mL vial containing 5 μL of Sylon-BFT desorption: 280 °C, 2 minutes
Figure 1. Derivatization of Resveratrol
G004842
Sam
ple
Han
dlin
g
After sample extraction, the SPME fi ber was gently
blotted with a Kimwipe® to remove excess water. The fi ber
was then inserted into a 4 mL vial containing 5 μL of Sylon™
-BFT (BSTFA + 1% TMCS) reagent. For consistency, the vial
containing the Sylon-BFT was allowed to equilibrate for 60
– 90 minutes prior to use, and a new reagent vial was used
for each extraction. The fi ber was desorbed at 280 °C for 2
Table 2. Wine Spike Levels Unspiked Spiked Red Wine Red Wine (100 μg/L)
Conc. of trans-resveratrol (μg/L) 22.6 134.7
% Accuracy --- 110%
19
orde
ring:
800
-247
-662
8 (U
S on
ly) /
814
-359
-344
1 te
chni
cal s
ervi
ce: 8
00-3
59-3
041
(US
and
Can
ada
only
) / 8
14-3
59-3
041
Volume 27.4sigma-aldrich.com/spme
Conclusions
SPME when used in combination with on-fi ber
derivatization was found to be applicable to the extrac-
tion of resveratrol from red wine. The technique was
found to be highly sensitive, simple, and quantitative.
The polyacrylate fi ber was also found to withstand
exposure to the vapors of the silylating reagent without
damage resulting from swelling.
References 1. Red Wine Compound Resveratrol Demonstrates Signifi cant Health Benefi ts.
ScienceDaily. Retrieved June 18, 2009, from http://www.sciencedaily.com /releases/2009/06/090611174052.htm
2. Cai, Lingshuang, Koziel, Jacek A., Dharmadhikari, Murli, van Leeuwen, J. (Hans), Rapid Determination of trans-resveratrol in red wine by solid-phase microextrac-tion with on-fi ber derivatization and multidimensional gas chromatography-mass spectrometry. J. Chrom. A (2009), 1216, 281-287.
3. Vinas, Pilar, Campillo, Natalia, Martinez-Castillo, Nelson, Hernandez-Cordoba, Manuel, Solid-phase microextraction on-fi ber derivatization for the analysis of some polyphenols in wine and grapes using gas chromatography-mass spectrometry. J. Chrom A (2009), 1216, 1279-1284.
Featured Products+Description Qty. Cat. No.
SPME Fibers
Manual, w/ 85 μm polyacrylate coating 3 57304
Auto, w/ 85 μm polyacrylate coating 3 57305
Auto, 23 GA w/ 85 μm polyacrylate coating 3 57294-U
GC Column
Fused silica capillary column, SLB-5ms, 28471-U 30 m x 0.25 mm I.D., 0.25 μm
Chemical Standards and Reagents
Resveratrol 100 mg R5010
BSTFA + TMCS, 99:1 (Sylon BFT) 20 x 1 mL 33148 25 mL 33155-U 50 mL 33149-U
For more information on SPME products and applications request a copy of the 7th edition SPME applications CD, T199925 (CJQ), or visit sigma-aldrich.com/spme.
Related Information!Figure 4. SPME On-Fiber Derivatization Analysis of Resveratrol in Spiked Red Wine SampleIdentical conditions to those in Figure 3
Figure 2. SPME Calibration Standards; 10-300 μg/LSPME - on-fi ber derivatization analysis of trans-resveratrol
Sam
ple
Han
dlin
g
peak
are
a (x
1,0
00,0
00)
35
30
25
20
15
10
5
00 50 100 150 200 250 300 350
Conc. (μg/L) G004843
R2 = 0.9987
Figure 3. SPME On-Fiber Derivatization Analysis of Resveratrol in Unspiked Red Wine Sample
column: SLB-5ms, 30 m x 0.25 mm I.D., 0.25 μm (28471-U) oven: 100 °C (1 min.), 10 °C/min. to 325 °C (3 min.) MSD interface: 325 °C scan range: m/z 40-450 carrier gas: helium, 1 mL/min, constant liner: 0.75 mm I.D. SPME
6 8 10 12 14 16 18 20 22 24Min G004844
trans-resveratrol (TMS)
cis-resveratrol (TMS)
6 8 10 12 14 16 18 20 22 24Min G004845
trans-resveratrol (TMS)
cis-resveratrol (TMS)
In addition to the trans form, a sizable cis-resveratrol
peak was detected in the wine samples. The cis form is not
naturally found in grapes, however it has been theorized
that it can be formed from the trans during analysis, or the
production and/or aging of wine (2).
20
sigm
a-al
dric
h.co
m/a
naly
tical
Volume 27.4 sigma-aldrich.com/nsisolutions
Stan
dar
ds
Sigma-Aldrich Expands Environmental Product Line by Offering NSI Solutions Inorganic Products
Vicki [email protected]
Sigma-Aldrich Corporation and NSI Solutions, Inc.
(Raleigh, NC) have partnered to provide US customers
with a more complete selection of quality analytical
products for environmental testing from a single vendor.
NSI is an ISO registered, A2LA accredited provider of
inorganic and microbiological profi ciency testing samples,
as well as quality control standards (QC) for oil and
grease, turbidity, solids, and pH analyses.
These products can be ordered by calling Customer
Service at 800-811-5352, or by visiting our special
Sigma-Aldrich Vendor Portal located on the website:
sigma-aldrich.com/nsisolutions
Microbiology Profi ciency Testing (PT) Samples
These microbiological PT samples are designed for use
with all Most Probable Number (MPN) and Membrane
Filter (MF) procedures. All PT and QC samples are
packaged with a cold pack to maintain integrity and are
drop shipped to preserve sample traceability.
Description Cat. No.
WS Microbiology Profi ciency Testing
WS - Microbiological PT NSI-MIC-001 Each set includes 10 samples and 10 vials of sterile diluent. Works with EPA promulgated methods for total coliform, fecal coliform and E. coli
WS - Standards Plate Count NSI-MIC-002 One vitroid sample containing a heterotrophic bacteria. Supplied with sterile diluent.
WS Quantitative Coliforms NSI-MIC-006 One vitroid sample in the range of 20-200 CFU/100mL, designed for LT2 Enhanced Surface Water Treatment Rule. Evaluated for total coliform, fecal coliform, and E. coli. Applicable for all SDWA quantitative methods. Supplied with hydration fl uid.
Microbiological QC Known Standards
Drinking Water Set - Total and Fecal Coliform NSI-MIC-QC1 Works with EPA approved methods. Each set contains one vitroid sample each of the following: total/fecal coliform positive, total coliform positive/fecal coliform negative, one total fecal and coliform negative, and one blank sample. Each set includes 4 x 100 mL bottles of sterile diluent.
Standards Plate Count NSI-MIC-QC3 Designed for use with SM9215-B Pour Plate Method. Set contains a single quantitative sample of heterotrophic bacteria and a 100 mL bottle of sterile diluent.
WS - Microbiological QC NSI-MIC-QC4 Each set includes 10 samples and 10 vials sterile diluent. Works with EPA promulgated methods for total coliform, fecal coliform, and E. coli.
WS Quantitative Coliforms NSI-MIC-QC6 One vitroid sample in the range of 20 -200 CFU/100mL, designed for LT2 Enhanced Surface Water Treatment Rule. Evaluated for total coliform, fecal coliform, and E. coli. Applicable for all SDWA quantitative methods. Supplied with hydration fl uid.
Oil & Grease Standards for US EPA Method 1664
NSI Oil and Grease PAR
(Precision and Recovery)
Surrogate SNIPS are pack-
aged in exact volumes in
easy-to-use inert, thermo
sealed PTFE tubes. Simply
snip off the top of the
tube and pour the entire
contents into your extraction vessel. Also available are
the more conventional bottles of oil and grease stan-
dards as well as recovery standards.
Products are supplied with a certifi cate of traceability
listing certifi ed concentrations and acceptance limits.
Description Pkg. Size Cat. No.
Method 1664 Oil and Grease PAR Surrogate (0.2%) 0.2% n-hexadecane, 0.2% stearic acid in acetone delivers 40 mg total oil & grease per tube 25 x 10 tubes NSI-QC-003LSNIP
Method 1664 Oil and Grease PAR Surrogate (0.4%) 0.4% n-hexadecane, 0.4% stearic acid in acetone delivers 80 mg total oil & grease per tube 25 x 10 tubes NSI-QC-003LSNIP
Oil and Grease, Ready-to-Use Bottles Works with freon and hexane extraction. Oil and grease supplied as 20-100 mg/L. Minimum of 10 lots available per year. 500 mL NSI-QCI-069 4 x 500 mL NSI-QCI-069C
Oil and Grease, Supplied in Boston Round Bottle Designed for use with SPE. Oil and grease supplied as 20-100 mg/L. Minimum of 10 lots available per year. 1 Liter NSI-QCI-069-33,400 4 x 1Liter NSI-QCI-069-33,400C
Oil and Grease Method 1664 Recovery Standards (0.4%) 25 mL NSI-QC-003
0.4%(w/v) n-Hexadecane and 0.4% (w/v) Stearic acid in acetone 10 x 25 mL NSI-QC-003TP
Oil and Grease Method 1664 Recovery Standards (0.2%) 25 mL NSI-QC-0003L
0.2%(w/v) n-Hexadecane and 0.2% (w/v) Stearic acid in acetone 10 x 25 mL NSI-QC-003LTP
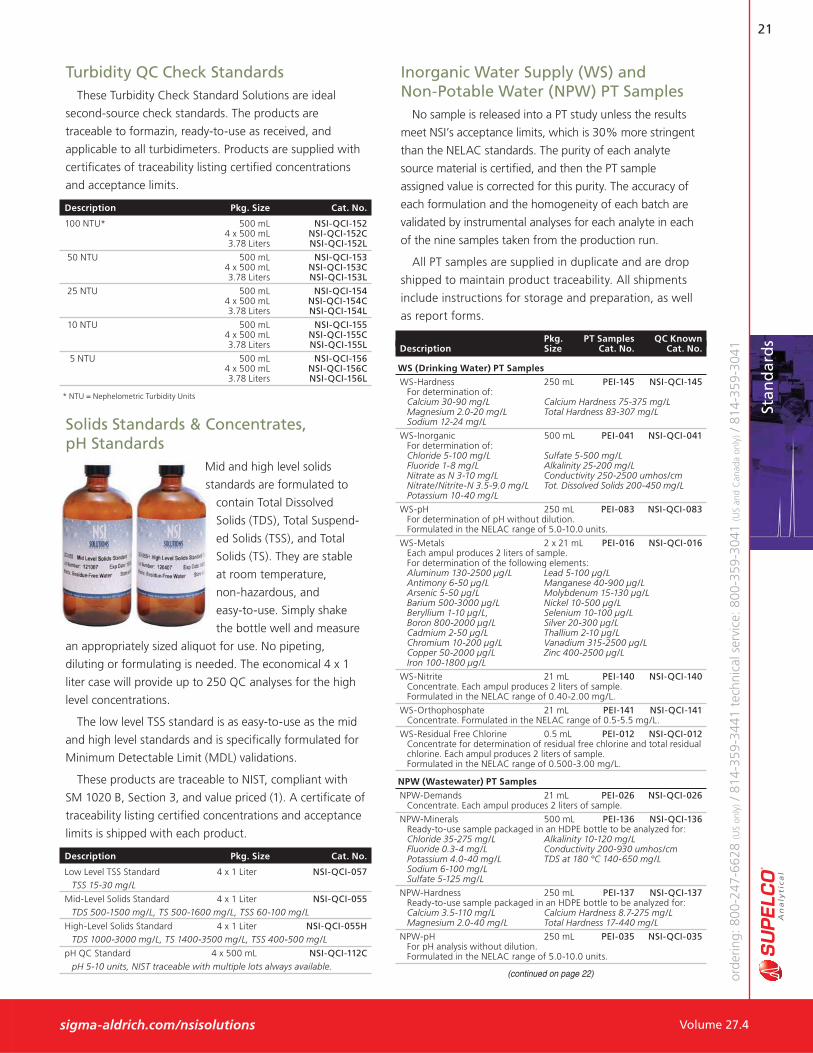
21
orde
ring:
800
-247
-662
8 (U
S on
ly) /
814
-359
-344
1 te
chni
cal s
ervi
ce: 8
00-3
59-3
041
(US
and
Can
ada
only
) / 8
14-3
59-3
041
Volume 27.4
Turbidity QC Check StandardsThese Turbidity Check Standard Solutions are ideal
second-source check standards. The products are
traceable to formazin, ready-to-use as received, and
applicable to all turbidimeters. Products are supplied with
certifi cates of traceability listing certifi ed concentrations
and acceptance limits.
Description Pkg. Size Cat. No.
100 NTU* 500 mL NSI-QCI-152 4 x 500 mL NSI-QCI-152C 3.78 Liters NSI-QCI-152L
50 NTU 500 mL NSI-QCI-153 4 x 500 mL NSI-QCI-153C 3.78 Liters NSI-QCI-153L
25 NTU 500 mL NSI-QCI-154 4 x 500 mL NSI-QCI-154C 3.78 Liters NSI-QCI-154L
10 NTU 500 mL NSI-QCI-155 4 x 500 mL NSI-QCI-155C 3.78 Liters NSI-QCI-155L
5 NTU 500 mL NSI-QCI-156 4 x 500 mL NSI-QCI-156C 3.78 Liters NSI-QCI-156L
* NTU = Nephelometric Turbidity Units
Solids Standards & Concentrates, pH Standards
Mid and high level solids
standards are formulated to
contain Total Dissolved
Solids (TDS), Total Suspend-
ed Solids (TSS), and Total
Solids (TS). They are stable
at room temperature,
non-hazardous, and
easy-to-use. Simply shake
the bottle well and measure
an appropriately sized aliquot for use. No pipeting,
diluting or formulating is needed. The economical 4 x 1
liter case will provide up to 250 QC analyses for the high
level concentrations.
The low level TSS standard is as easy-to-use as the mid
and high level standards and is specifi cally formulated for
Minimum Detectable Limit (MDL) validations.
These products are traceable to NIST, compliant with
SM 1020 B, Section 3, and value priced (1). A certifi cate of
traceability listing certifi ed concentrations and acceptance
limits is shipped with each product.
Description Pkg. Size Cat. No.
Low Level TSS Standard 4 x 1 Liter NSI-QCI-057 TSS 15-30 mg/L
Mid-Level Solids Standard 4 x 1 Liter NSI-QCI-055 TDS 500-1500 mg/L, TS 500-1600 mg/L, TSS 60-100 mg/L
High-Level Solids Standard 4 x 1 Liter NSI-QCI-055H TDS 1000-3000 mg/L, TS 1400-3500 mg/L, TSS 400-500 mg/L
pH QC Standard 4 x 500 mL NSI-QCI-112C pH 5-10 units, NIST traceable with multiple lots always available.
sigma-aldrich.com/nsisolutions
Stan
dar
ds
Inorganic Water Supply (WS) and Non-Potable Water (NPW) PT Samples
No sample is released into a PT study unless the results
meet NSI’s acceptance limits, which is 30% more stringent
than the NELAC standards. The purity of each analyte
source material is certifi ed, and then the PT sample
assigned value is corrected for this purity. The accuracy of
each formulation and the homogeneity of each batch are
validated by instrumental analyses for each analyte in each
of the nine samples taken from the production run.
All PT samples are supplied in duplicate and are drop
shipped to maintain product traceability. All shipments
include instructions for storage and preparation, as well
as report forms.
Pkg. PT Samples QC KnownDescription Size Cat. No. Cat. No.
WS (Drinking Water) PT Samples
WS-Hardness 250 mL PEI-145 NSI-QCI-145 For determination of: Calcium 30-90 mg/L Calcium Hardness 75-375 mg/L Magnesium 2.0-20 mg/L Total Hardness 83-307 mg/L Sodium 12-24 mg/L
WS-Inorganic 500 mL PEI-041 NSI-QCI-041 For determination of: Chloride 5-100 mg/L Sulfate 5-500 mg/L Fluoride 1-8 mg/L Alkalinity 25-200 mg/L Nitrate as N 3-10 mg/L Conductivity 250-2500 umhos/cm Nitrate/Nitrite-N 3.5-9.0 mg/L Tot. Dissolved Solids 200-450 mg/L Potassium 10-40 mg/L
WS-pH 250 mL PEI-083 NSI-QCI-083 For determination of pH without dilution. Formulated in the NELAC range of 5.0-10.0 units.
WS-Metals 2 x 21 mL PEI-016 NSI-QCI-016 Each ampul produces 2 liters of sample. For determination of the following elements: Aluminum 130-2500 μg/L Lead 5-100 μg/L Antimony 6-50 μg/L Manganese 40-900 μg/L Arsenic 5-50 μg/L Molybdenum 15-130 μg/L Barium 500-3000 μg/L Nickel 10-500 μg/L Beryllium 1-10 μg/L, Selenium 10-100 μg/L Boron 800-2000 μg/L Silver 20-300 μg/L Cadmium 2-50 μg/L Thallium 2-10 μg/L Chromium 10-200 μg/L Vanadium 315-2500 μg/L Copper 50-2000 μg/L Zinc 400-2500 μg/L Iron 100-1800 μg/L
WS-Nitrite 21 mL PEI-140 NSI-QCI-140 Concentrate. Each ampul produces 2 liters of sample. Formulated in the NELAC range of 0.40-2.00 mg/L.
WS-Orthophosphate 21 mL PEI-141 NSI-QCI-141 Concentrate. Formulated in the NELAC range of 0.5-5.5 mg/L.
WS-Residual Free Chlorine 0.5 mL PEI-012 NSI-QCI-012 Concentrate for determination of residual free chlorine and total residual chlorine. Each ampul produces 2 liters of sample. Formulated in the NELAC range of 0.500-3.00 mg/L.
NPW (Wastewater) PT Samples
NPW-Demands 21 mL PEI-026 NSI-QCI-026 Concentrate. Each ampul produces 2 liters of sample.
NPW-Minerals 500 mL PEI-136 NSI-QCI-136 Ready-to-use sample packaged in an HDPE bottle to be analyzed for: Chloride 35-275 mg/L Alkalinity 10-120 mg/L Fluoride 0.3-4 mg/L Conductivity 200-930 umhos/cm Potassium 4.0-40 mg/L TDS at 180 °C 140-650 mg/L Sodium 6-100 mg/L Sulfate 5-125 mg/L
NPW-Hardness 250 mL PEI-137 NSI-QCI-137 Ready-to-use sample packaged in an HDPE bottle to be analyzed for: Calcium 3.5-110 mg/L Calcium Hardness 8.7-275 mg/L Magnesium 2.0-40 mg/L Total Hardness 17-440 mg/L
NPW-pH 250 mL PEI-035 NSI-QCI-035 For pH analysis without dilution. Formulated in the NELAC range of 5.0-10.0 units.
(continued on page 22)
22
sigm
a-al
dric
h.co
m/a
naly
tical
Volume 27.4 sigma-aldrich.com
Stan
dar
ds
Pkg. PT Samples QC KnownDescription Size Cat. No. Cat. No.
NPW-Residue 500 mL PEI-079 NSI-QCI-079 Ready-to-use whole volume sample to be analyzed for total suspended solids in the NELAC range of 23-100 mg/L and total solids formulated in the NELAC range of 140-675 mg/L.
NPW-Simple Nutrients 21 mL PEI-138 NSI-QCI-138 Concentrate. Each ampul produces 2 liters of sample. Ammonia as N 0.65-19.0 mg/L Nitrate/Nitrite as N 0.25-40.0 mg/L Nitrate as N 0.25-40.0 mg/L Orthophosphate as P 0.50-5.50 mg/L
NPW Complex Nutrients 21 mL PEI-139 NSI-QCI-139 Concentrate. Each ampul produces 2 liters of sample. TKN 1.50-35.0 mg/L Total Phosphorus 0.50-10.0 mg/L
NPW Trace Metals 2 x 21 mL PEI-034 NSI-QCI-034 Each ampul produces 2 liters of sample. For analysis of the following elements: Aluminum 200-4000 μg/L Manganese 70-4000 μg/L Antimony 95-900 μg/L Molybdenum 60-600 μg/L Arsenic 70-900 μg/L Nickel 80-3000 μg/L Barium 100-2500 μg/L Selenium 90-2000 μg/L Beryllium 8-900 μg/L Silver 26-600 μg/L Cadmium 8-750 μg/L Strontium 30-300 μg/L Chromium 17-1000 μg/L Thallium 60-900 μg/L Cobalt 28-1000 μg/L Tin 1000-5000 μg/L Copper 40-900 μg/L Titanium 80-300 μg/L Iron 200-4000 μg/L Vanadium 55-2000 μg/L Lead 70-3000 μg/L Zinc 100-2000 μg/L
NPW-Mercury 21 mL PEI-087 NSI-QCI-087 A 21 mL concentrate for determination of Mercury. Each ampul produces 2 liters of sample. Formulated in the NELAC range of 2.0-30 μg/L.
NPW Total Residual Chlorine 2.2 mL PEI-033 NSI-QCI-033 Concentrate. Each ampul produces 2 liters of sample. Formulated in the NELAC range of 0.50-3.00 mg/L.
Visit sigma-aldrich.com/nsisolutions for a complete
list of NSI products now available through Sigma-Aldrich.
Reference 1. American Public Health Association. Standard Methods for the Examination of
Water & Wastewater. 20th ed.; Baltimore, MD, 1999.
Characterized Reference Oils for Standardizing Lipid Procedures
We offer characterized reference oil samples for use
as controls or check samples for fatty acid methyl ester
(FAME) analyses. These samples provide an excellent
means of standardizing your lipid procedures and
comparing your results to other researchers. Each
standard is packaged in an amber ampul under
nitrogen. Package size is 1000 mg. A Certifi cate of
Composition is provided with each oil sample.
Description CAS No. Cat. No.
Canola oil 120962-03-0 46961Coconut oil 8001-31-8 46949Corn oil 8001-30-7 47112-UCottonseed oil 8001-29-4 47113Lard oil 8016-28-2 47115-ULinseed (fl axseed) oil 8001-26-1 47559-UMenhaden fi sh oil 8002-50-4 47116Olive oil 8001-25-0 47118Palm oil 8002-75-3 46962Peanut oil 8002-03-7 47119Saffl ower oil 8001-23-8 47120-USoybean oil 8001-22-7 47122Sunfl ower seed oil 8001-21-6 47123
Mono-, Di-, andTriglyceride Chemical Standards
Sigma-Aldrich offers numerous qualitative mono-, di-,
and triglyceride standards for determining relative retention
times and establishing approximate response factors when
used in chromatographic applications. These standard
mixtures are prepared by weight, and the composition
verifi ed by gas and/or thin layer liquid chromatography. A
certifi cate of composition is provided with each standard.
A sampling of this product line is listed below. Addi-
tional glyceride standards can be found by visiting
sigma-aldrich.com.
Glyceride and Phospholipid MixturesDescription Pkg. Size Cat. No.
Mono-, Di-, & Triglyceride Mix 40 mg 1787-1AMP 1,3-Diolein, 10 mg Monoolein, 10 mg 1,2-Dioleoyl-rac-glycerol, 10 mg Triolein, 10 mg
Triglyceride Mixtures 100 mg 17811-1AMP Tricaprin, ~20 mg Tripalmitin, ~20 mg Tricaprylin, ~20 mg Trimyristin, ~20 mg Trilaurin, ~20 mg
Phospholipid Mixture for HPLC 2 mL P3817-1VL derived from soybeans, in chloroform (varied conc.) L-α-Lysophosphatidylcholine, 0.3 mg/mL L-α-Phosphatidylcholine, 1.5 mg/mL L-α-Phosphatidylethanolamine Escherichia coli, 1.2 mg/mL L-α-Phosphatidylinositol ammonium salt from Glycine max (soybean), 0.9 mg/mL
Glyceride KitsDescription Cat. No.
Mono-, Di-, and Triglycerides Kit MDT12-1KT (individually packaged in 100 mg each) Dilaurin 1-Monopalmitoyl-rac-glycerol Dimyristin 1-Monostearoyl-rac-glycerol Dipalmitin Trilaurin Distearin Trimyristan 1-Monolauroyl-rac-glycerol Tripalmitin 1-Monomyristoyl-rac-glycerol Tristearin
Triglycerides Kit TRI19-1KT (individually packaged in 100 mg unless otherwise indicated) Triacetin Trilaurin Triarachidin Trilinolein Tribehenin Trilinolenin Tributyrin Trimyristin Tricaprin Triolein Tricaproin, 1 mL Tripalmitin Tricaprylin, 0.5 mL Tripalmitolein Trielaidin Tripetroselinin Tri-11-eicosenoin Tristearin Trierucin
Saturated, Even Carbon Triglycerides Kit TRI11-1KT (individually packaged in 100 mg unless otherwise indicated) Triacetin Tricaprylin, 1 mL Triarachidin Trilaurin Tribehenin Trimyristin Tributyrin Tripalmitin Tricaprin Tristearin Tricaproin, 1 mL
(continued from page 21)

23
orde
ring:
800
-247
-662
8 (U
S on
ly) /
814
-359
-344
1 te
chni
cal s
ervi
ce: 8
00-3
59-3
041
(US
and
Can
ada
only
) / 8
14-3
59-3
041
Volume 27.4
29634-U
29624-U
Featured Products+Slim Line (6.5 mm O.D. syringe barrel), 50 mm Cone Tip Needle SGE Syringes for CTC CombiPAL and GC PAL
Volume Description Needle Pack Size SGE Cat. No. Supelco Cat. No.
Slim Line, Fixed Needle
5 μL 5F-C/F-5/0.63 23 gauge (0.63 mm OD) 1 001981 29622-U 5 μL 5F-C/F-5/0.47 26 gauge (0.47 mm OD) 1 001982 29623-U 10 μL 10F-C/F-/0.63 23 gauge (0.63 mm OD) 1 002981 29624-U 10 μL 10F-C/F-5/0.47C 26 gauge (0.47 mm OD) 1 002980 29625-U 25 μL 25F-C/F-0.47C 26 gauge (0.47 mm OD) 1 003980 29628-U
Slim Line, Fixed Needle, Gas Tight
10 μL SK 10F-C/F-5/0.47C 26 gauge (0.47 mm OD) 6 002986 29626-U 10 μL 10F-C/F-GT-0.63 23 gauge (0.63 mm OD) 1 002987 29627-U 25 μL 25F-C/F-GT-0.63 23 gauge (0.63 mm OD) 1 003987 29629-U 100 μL 100F-C/F-GT-0.63 23 gauge (0.63 mm OD) 1 005335 29631-U 100 μL 100R-C/F-GT-0.47C 26 gauge (0.47 mm OD) 1 005333 29632-U
Slim Line, Removable Needle
0.5 μL 0.5BNR-C/F-0.63 23 gauge (0.63 mm OD) 1 000492 29633-U 10 μL 10R-C/F-5/0.47C 26 gauge (0.47 mm OD) 1 002982 29634-U 10 μL 10R-C/F-0.63 23 gauge (0.63 mm OD) 1 002984 29635-U
Slim Line, Removable Needle, Gas Tight
10 μL 10R-C/F-GT-0.47 26 gauge (0.47 mm OD) 1 002985 29636-U
sigma-aldrich.com/ctc-gc-syringes
Acc
esso
ries
SGE Slim Line Syringes for CTC/Leap Autosamplers
A gas chromatograph (GC) autosampler syringe serves
as the interface between the sample and the instrument;
compatibility is critical for rapid and precise sampling. The
wrong sized syringe can lead to inconsistent results and,
more seriously, can damage the instrument. Syringes also
must deliver accurate amounts with no-dead volume or
carryover between injections.
Sigma-Aldrich has introduced a new line of GC
autosampler syringes from SGE™ that are made to be used
with CTC CombiPAL™ and GC PAL autosamplers. SGE Slim
Line syringes are designed with a unique plunger that
eliminates bending and seizing and are tested to ensure
optimal fi t within autosampler specifi cations. The cone tip
point style of the needle withstands multiple and fast
septum injections, making it one of the most trouble-free
autosampler syringes available.
When used with CombiPAL and GC PAL autosamplers,
these syringes are installed into a syringe holder designed
to accommodate the outside diameter of the syringe barrel.
SGE Slim Line autosampler syringes are available with
both fi xed and removable needle with the following
specifi cations:
● Volumes from 0.5 to 100 μL ● Needle length of 50 mm ● Point style 1 (cone tip) ● Two gauge sizes: 23 (0.63 mm) and
26 (0.47 mm) O.D.
For more information on any of our syringes, email our
Technical Service Department at [email protected]
or visit us on the web at sigma-aldrich.com/syringes.
TRADEMARKS: Ascentis, CHIRALDEX, DEX, Discovery, HybridSPE, Sigma-Aldrich, Supelco, SupelMIP, Supelclean, Sylon – Sigma-Aldrich Biotechnology LP; CombiPAL – CTC Analytics; Fused-Core – Advanced Materials Technologies, Inc.; Kimwipe – Kimberly-Clark Corporation; LiteTouch, MicroTight, SealTight – IDEX Health and Science, Inc (Upchurch Scientifi c); OPTI-SOLV, OPTI-GUARD, EXP – Optimize Technologies, Inc.; SGE – SGE Analytical Science; PEEKsil – SGE International Pty. Ltd.; Tefzel – E.I. du Pont de Nemours and Company
E001072
E001073
Accelerating Customers’
Success through Innovation and
Leadership in Life Science,
High Technology and Service
World Headquarters3050 Spruce St., St. Louis, MO 63103(314) 771-5765sigma-aldrich.com
Order/Customer Service (800) 325-3010 • Fax (800) 325-5052
Technical Service (800) 325-5832 • sigma-aldrich.com/techservice
Development/Custom Manufacturing Inquiries (800) 244-1173
©2009 Sigma-Aldrich Co. All rights reserved. SIGMA, , SAFC, , SIGMA-ALDRICH, ALDRICH, , FLUKA, , and SUPELCO, are trademarks belonging to Sigma-Aldrich Co. and its affiliate Sigma-Aldrich Biotechnology, L.P. Sigma brand products are sold through Sigma-Aldrich, Inc. Sigma-Aldrich, Inc. warrants that its products conform to the information contained in this and other Sigma-Aldrich publications. Purchaser must determine the suitability of the product(s) for their particular use. Additional terms and conditions may apply. Please see reverse side of the invoice or packing slip.
ArgentinaSIGMA-ALDRICH DE ARGENTINA S.A.Free Tel: 0810 888 7446Tel: (+54) 11 4556 1472Fax: (+54) 11 4552 1698
AustraliaSIGMA-ALDRICH PTY LTD.Free Tel: 1800 800 097 Free Fax: 1800 800 096Tel: (+61) 2 9841 0555Fax: (+61) 2 9841 0500
AustriaSIGMA-ALDRICH HANDELS GmbHTel: (+43) 1 605 81 10Fax: (+43) 1 605 81 20
BelgiumSIGMA-ALDRICH NV/S.A.Free Tel: 0800 14747Free Fax: 0800 14745Tel: (+32) 3 899 13 01Fax: (+32) 3 899 13 11
BrazilSIGMA-ALDRICH BRASIL LTDA.Free Tel: 0800 701 7425Tel: (+55) 11 3732 3100Fax: (+55) 11 5522 9895
CanadaSIGMA-ALDRICH CANADA LTD.Free Tel: 1800 565 1400Free Fax: 1800 265 3858Tel: (+1) 905 829 9500Fax: (+1) 905 829 9292
ChileSIGMA-ALDRICH QUIMICA LIMITADATel: (+56) 2 495 7395Fax: (+56) 2 495 7396
ChinaSIGMA-ALDRICH (SHANGHAI) TRADING CO. LTD.Free Tel: 800 819 3336Tel: (+86) 21 6141 5566Fax: (+86) 21 6141 5567
Czech RepublicSIGMA-ALDRICH spol. s r. o.Tel: (+420) 246 003 200Fax: (+420) 246 003 291
DenmarkSIGMA-ALDRICH DENMARK A/STel: (+45) 43 56 59 00Fax: (+45) 43 56 59 05
FinlandSIGMA-ALDRICH FINLAND OYTel: (+358) 9 350 9250Fax: (+358) 9 350 92555
FranceSIGMA-ALDRICH CHIMIE S.à.r.l.Free Tel: 0800 211 408Free Fax: 0800 031 052Tel: (+33) 474 82 28 00Fax: (+33) 474 95 68 08
GermanySIGMA-ALDRICH CHEMIE GmbHFree Tel: 0800 51 55 000Free Fax: 0800 64 90 000Tel: (+49) 89 6513 0Fax: (+49) 89 6513 1160
GreeceSIGMA-ALDRICH (O.M.) LTD.Tel: (+30) 210 994 8010Fax: (+30) 210 994 3831
HungarySIGMA-ALDRICH KftIngyenes telefonszám: 06 80 355 355Ingyenes fax szám: 06 80 344 344Tel: (+36) 1 235 9055Fax: (+36) 1 235 9050
IndiaSIGMA-ALDRICH CHEMICALS PRIVATE LIMITEDTelephoneBangalore: (+91) 80 6621 9400New Delhi: (+91) 11 4358 8000Mumbai: (+91) 22 2570 2364Hyderabad: (+91) 40 4015 5488Kolkata: (+91) 33 4013 8003FaxBangalore: (+91) 80 6621 9650New Delhi: (+91) 11 4358 8001Mumbai: (+91) 22 2579 7589Hyderabad: (+91) 40 4015 5466Kolkata: (+91) 33 4013 8016
IrelandSIGMA-ALDRICH IRELAND LTD.Free Tel: 1800 200 888Free Fax: 1800 600 222Tel: (+353) 402 20370Fax: (+ 353) 402 20375
IsraelSIGMA-ALDRICH ISRAEL LTD.Free Tel: 1 800 70 2222Tel: (+972) 8 948 4100Fax: (+972) 8 948 4200
ItalySIGMA-ALDRICH S.r.l.Numero Verde: 800 827018Tel: (+39) 02 3341 7310Fax: (+39) 02 3801 0737
JapanSIGMA-ALDRICH JAPAN K.K.Tel: (+81) 3 5796 7300Fax: (+81) 3 5796 7315
KoreaSIGMA-ALDRICH KOREAFree Tel: (+82) 80 023 7111Free Fax: (+82) 80 023 8111Tel: (+82) 31 329 9000Fax: (+82) 31 329 9090
MalaysiaSIGMA-ALDRICH (M) SDN. BHDTel: (+60) 3 5635 3321Fax: (+60) 3 5635 4116
MexicoSIGMA-ALDRICH QUÍMICA, S.A. de C.V.Free Tel: 01 800 007 5300Free Fax: 01 800 712 9920Tel: (+52) 722 276 1600Fax: (+52) 722 276 1601
The NetherlandsSIGMA-ALDRICH CHEMIE BVFree Tel: 0800 022 9088Free Fax: 0800 022 9089Tel: (+31) 78 620 5411Fax: (+31) 78 620 5421
New ZealandSIGMA-ALDRICH NEW ZEALAND LTD.Free Tel: 0800 936 666Free Fax: 0800 937 777Tel: (+61) 2 9841 0555Fax: (+61) 2 9841 0500
NorwaySIGMA-ALDRICH NORWAY ASTel: (+47) 23 17 60 00Fax: (+47) 23 17 60 10
PolandSIGMA-ALDRICH Sp. z o.o.Tel: (+48) 61 829 01 00Fax: (+48) 61 829 01 20
PortugalSIGMA-ALDRICH QUÍMICA, S.A.Free Tel: 800 202 180Free Fax: 800 202 178Tel: (+351) 21 924 2555Fax: (+351) 21 924 2610
RussiaSIGMA-ALDRICH RUS, LLCTel: (+7) 495 621 5579Fax: (+7) 495 621 5923
SingaporeSIGMA-ALDRICH PTE. LTD.Tel: (+65) 6779 1200Fax: (+65) 6779 1822
SlovakiaSIGMA-ALDRICH spol. s r. o.Tel: (+421) 255 571 562Fax: (+421) 255 571 564
South AfricaSIGMA-ALDRICH (PTY) LTD.Free Tel: 0800 1100 75Free Fax: 0800 1100 79Tel: (+27) 11 979 1188Fax: (+27) 11 979 1119
SpainSIGMA-ALDRICH QUÍMICA, S.A.Free Tel: 900 101 376Free Fax: 900 102 028Tel: (+34) 91 661 99 77Fax: (+34) 91 661 96 42
SwedenSIGMA-ALDRICH SWEDEN ABTel: (+46) 8 742 4200Fax: (+46) 8 742 4243
SwitzerlandSIGMA-ALDRICH CHEMIE GmbHFree Tel: 0800 80 00 80Free Fax: 0800 80 00 81Tel: (+41) 81 755 2828Fax: (+41) 81 755 2815
United KingdomSIGMA-ALDRICH COMPANY LTD.Free Tel: 0800 717 181Free Fax: 0800 378 785Tel: (+44) 1747 833 000Fax: (+44) 1747 833 313
United StatesSIGMA-ALDRICHToll-Free: 800 325 3010Toll-Free Fax: 800 325 5052Tel: (+1) 314 771 5765Fax: (+1) 314 771 5757
VietnamSIGMA-ALDRICH PTE LTD. VN R.O.Tel: (+84) 3516 2810Fax: (+84) 6258 4238
Internetsigma-aldrich.com
LDAT209004


