PoNoy, Planning, and Reesarak
WORKING PAPERS
Education and Empoyment
Population and Human ResourcesDepartment
The World BankAugust 1988
WP3 61
Student Performanceand School Costsin the Philippines'
High SchoolsEmmanuel Jimenez,
Vicente Paqueo,and
Ma. Lourdes de Vera
Private schools in the Philippines are substantially more effec-tive than their public counterparts in teaching language skills,marginally less effective in teaching mathematics skills, andmuch less costly per pupil than public schools.
3 Policy, Plng, and R mRchCanplex diatsbutsPFRWoiingPapentodatntethefindingpof wokin pweu andtoancange dithe exangeof ideu among Bank ataff and al othem intead in devlopmnent ismes. Thus papea cam the names ofthe anthua, rellea aly their views, and ad be used and cited accoringly. Te findings, intitatiams. and cmncuhions ar theautbW own. They shold not be atitd to the World Bank, it Boad of Dirmctis, itmanagemen, or tany of its member em.
Pub
lic D
iscl
osur
e A
utho
rized
Pub
lic D
iscl
osur
e A
utho
rized
Pub
lic D
iscl
osur
e A
utho
rized
Pub
lic D
iscl
osur
e A
utho
rized
Pub
lic D
iscl
osur
e A
utho
rized
Pub
lic D
iscl
osur
e A
utho
rized
Pub
lic D
iscl
osur
e A
utho
rized
Pub
lic D
iscl
osur
e A
utho
rized
PoNcy, Pbnnin, a*d R_euech
Edotn and Employmentn
A key consideration in the policy debate on the tion, and innate ability, the private schools showappropriate role of private schools in preuomi- a significant edge over public schools in bothnantly public school systems is cost effective- English and Pilipino (about 15 percent of theness. The questions are: Do private school sample mean achievement scores). Publicstudents leam more than their public school schools, on the other hand, had a slight (roughlycounterparts? And is it more or less expensive 4 percent) advantage in mathematics.to educate students in private schools?
A comparison of cost per student reveals aPast studies in the Philippines and elsewhere substanlial ad, antage for private schools: public
have claimed that the educational achievement schools in the Philippines spend on averageof students in the private schools is higher than roughly twice as much as private schools. Thesethat of students in public schools. These studies findings strongly suggest that private schools areprovide, however, only weak evidence regarding an efficient purveyor of secondary education inthe relative cost effectiveness of public and the Philippines, a conclusion that should beprivate schools. A fundamental weakness is the taken into account in the formulation of policypotentially serious problem of selectivity due to measures that could threaten the existence ofunobserved differences between the student such schools.population of each type of school. Most of thestudies do not compare costs in the two types of This paper is a product of the Education andinstitutions. Employment Division, Population and Human
Resources Department. Copies are availableTaking selectivity into account, the paper free from the World Bank, 1818 H Street NW,
finds that controlling for the effects of students' Washington, DC 20433. Please contact Teresasocioeconomic background, individual motiva- Hawkins, ir,,m S6-224. extension 33678.
The PPR Working Paper Series disseminates the findings of work under way in the Bank-s Policy, Plarning, and ResearchComplex. An objec'ave of the series is to get these fmdings out quickly, even if presentations are less than fully polished.The findings, interpretations, and conclusions in these papers do not necessarily represent official policy of the Bank.
Copyright © 1988 by the International Bank for Reconstruction and Developmentft'he World Bank
Student Performance and Schools CostsIn the Philippines' High Schools
byEmmanuel imenez,
Vicente Paqueo,and
Ma. Lourdes de Vera
Table of Contents
Introduction ...... . ....................... .2The Basic Empirical Data . . .5Data. . .9
Thw Philippine Context . . . 9S le ... 10Acldevement and Student Background . ........................... 11
The Effect of Background on Achievement in Public and Private Schools 14What Determines the Choice of School Type? .14How Does Socio-economic Background Affect School Achievement? 16Background Constant, Is There a Private School Effect? .19
Codusions ... 22References ................................................................................................................ 24Tables
INTRODUCTION
Few analysts have challenged the notion that the public
sector has a role to play in directing and stimulating education.
However, the nature of that role has been the focus of a recent lively
exchange in the literature.1 In particular, it has been argued
that, sincs private schools have built-in incentives to provide
education efficiently, they should be allowed to compete with public
schools on a (more or less) equal footing. Among developing countries,
there is an added policy dimension: tightening fiscal constraints have
limited the ability of the public sector to expand its provision of free
public education (World Bank 1986). A greater reliance on the private
sector may become a financial necessity if ambitious educational
targets are going to be met in the near future.
The key empirical questions ares Do private school stuc%ncs
learn more than their public school counterparts? Is it more or less
expensive to educate students in private schools? The debate is fueled
by controversy over methodology, interpretation and date. The most
important methodological issue is the difficulty in attributing
differences between the cognitive abilities of students in public versus
private schools to school inputs alone, since a variety of non-school
factors also affect achievement, such as socio-economic background,
innate ability and individual motivation. Moreover, these non-school
factors also affect school choices made by families. For example,
I In the United States, the debate was sparked by the Coleman,Hoffer and Kilgore (1982) report which concluded that private (Catholic)schools are more effective than public schools in helping students toacquire cognitive skills.
Achievement in the Philippines ....... .. page 2
if children from privileged backgrounds only attended private schools,
it would be difficult to infer how they would do in public schools.
Thus, unless non-school factors are controlled appropriately, estimates
of school effects will be contaminated by what has become known as
"selectivity bias." The.problem is that the researcher's measures of
these factors, particularly those that act &s proxies for ability and
motivation, are far from perfect.2 Modern statistical techniques help in
controlling for this bias, although recent research has revealed that it
is also important to keep track of one's assumptions in mod1lling (see
Murnane, Newstead and Olsen, 1985, for a careful assessment of the
results of Coleman et al. and their critics).
This paper contributes to the literature in s4 important
dimensions. First, it extends the empirical evidence fo_ dsveloping
countries by analyzing data secondary level from the Household and
School Matching Survey (HSMS) conducted by the Educational Development
Projects Implementing Task Force (EDPITAF) of the Philippines during the
1981-82 academic year. The only other rigorous comparisons of
publiciprivate schools in determining achievement in developing
countries have been conducted in Kenya (Armitage and Sabot, 1987),
Colombia and Tanzania (Psacharopoulos, 1987; Cox and Jimenez, 1987), and
Thailand (Jimenez, Lockheed and Wattanawaha, 1988). The Philippines is
a particularly apt extension because it has one of the highest rates of
priv&ta school (about 402 of total secondary) enrollment in the world.
2 Several studies have attempted to use direct measures of abilitythrough the use of tests specifically designed to measure innate ability(e.g , an I. Q. test) rather than cognitive achievement (Psacharopoulosand Loxley, 1985; Boissiere, Knight and Sabot, 1984 among others). Manyanalysts have questioned the validity of these tests in distinguishingbetween ability and achievement. In any case, no one has ever suggestedthat such tests fully control for both ability and motivation.
Achievement in the Philippines.;.page 3
Second, the paper also confronts the difficult methodological
questions that have arisen in other studies. An individual's status as
public or private school student is a choice made by student and parent.
If this choice is systematically correlated with personal
characteristics, there may be sample selection bias. We use some recent
methodological advances to model and correct statistically for this
bias.
Third, we use independently gathered data to compare unit costs
of public and private schools, before reaching conclusions regarding the
relative efficiency (as opposed to the relative productivity) of public
and private schools.
In the next section of this paper, we outline the basic
conceptual model and our approach in correcting for selection bias.
Then, this is followed by sections ont data, results on school effActs,
results on relative costs and conclusions.
Achievement in the Philippines ..................... page 4
THE BASIC EMPIRICAL FRAMEWORK
Would a Filipino high school student, randomly selected from
the general studernt populatior, do better in a public or private school?
In the absence of experimental data, a reliable answer can be obtained
from a cross-section comparison of public and private school students'
performance in standardized tests -- if we control for student
background, motivation and innate ability.
A standard method is to postulate the following reduced form
model: the "ith" private school student's achievement score (A) is a
function of a vector of observed background variables (X) and unobserved
variables (e)3
(la) Aip - bp Xip + eipt
where each component of b measures the marginal effect of a
characteristic on achievement. The "jth" public (or government) school
student's score can be be similarly expressed by replacing the subscript
p* with Ug3s
(lb) Ajg - b8 Xjg + ej*g
If the effects due to unobserved variables, e, 4re randomly and normally
distributed, ordinary least squares regression techniques can be
3Alternatively, equations (la) and (lb) can be estimated as one equa-tion, with a dummy variable for private and public types of schools.However, statistical (F-) tests lead us to reject the hypothesis thatthe coefficients of all the other variables are equivalent in both typesof schools. Results are available from the authors.
Achievement in the Philippines ........ page 5
used to estimate the parameters of equations (la) and (lb).
PiLvate/public comparisons can then be made using this information. The
method would be to compare the predicted test score of a person with a
given set of background c - cteristics in each of the public and
private school systems by u 'tg equations (la) and (1').
A critical problem arises if the observed public and private
subsamples are basically incomparable due to selection bias. This would
be the case if students with a certain background systematically chose
one type of school over another. For example, if privileged students
chose only private schools, there would be no privileged students
enrolled in public schools. Thus, it might be misleading to uae
equation (lb) to infer how privileged students would do in public
schools. The error terms e are no longer normally distributed and OLS
should not be used to estimate the above equations.
To correct for sample selection, we use Heckman's
(1979) two-step technique. The first step in this methodology is to
estimate what determines the choice of type of school. We assume that
individuals will choose an educational plan, including the type of
school, that maximizes the child's economic well-being, net of private
costs. The solution to this problem can be shown to result in the
following choice equation for the "ith" child (Cox and Jimer.ez 1987):
(3) Ii* - k Yi + wi,
where Ii* is an unobserved variable which characterizes the propensity
of a household to choose a certain type of school for the child. Since
Achievement in the Philippines ............................* page 6
it is unobserved, we use the indicator variable:
Ii - 1 iff II* > 0 and
Ii 0 O otherwise.
Y indicates the explanatory variables and w is a random error term.
The second st p is to use the results of the first step to
correct for the selection bias in (la) and (lb). With selection, the
expected values of Ai are conditional on the choice of public and
private sector. This means that the error terms *i are correlated with
wi. The expected value of ei will no longer be equal to zero and the
estimated parameters in (la-b) will be biased if OLS is applied. If we
assume that (wi, *i) are jointly distributed normal with mean zero,
then,
(4a) E(eipVII>O) - ap Xip, and
(4b) E(eiglli<O) - ag "ig,
where the )i's are (Mills) ratios of the ordinate of the standard
normal at I1 to the probability of being in the sample. These are
calculated from the first stage probit equation. Including the
Xi's in (3a) and (3b) would enable us to treat the selection bias as
an omitted variables problem. The Xi's times their OLS coefficients
ma'sl can then be interpreted as the direction and magnitude of aslection
bias in each of the public and private school achievement equations.
The estimation of (la) and (lb) with the inclusion of the X\is by OLS
would be consistent (unbiased) because, in theory, the equations hold
Achievement in the Philippines ........ page 7
constant for the probability of being selected in one subsoample or
another.
Achievement in the Phlippins............................ pags 8
DATA
The Pailippine context
Secondary education in the Philippines is geared mainly toward
providing students with general academic education for college
preparation, as well as vocational/technical training for employment
preparation. The secondary etucation system provides for four years of
high school after six years of elementary school. Students are generally
13-16 years old.
The various secondary schools comprising the system canr
categorized in terms of funding as follows:
- Public national high schools funded by the national government.They includa those administered by the Department ofEducation, Culture, and Sporte (DECS), those attached to theState Colleges and Universities (SCUs), and the specializedschools.
- Public local schools funded mainly by local government units.They include the city, municipal, provincial, and barangayschools; and
- Private schools which are further classified into sectarian andnon-sectarian institutions.
In school-year 1983, the year the our data were gathered, there were
about 5,190 secondary schools nationwide. Of these, 62% were public and
382 private.
The public secondary school system derives support from two
main types of sources: those generated within the school (6S-19S), such
as tuition/school fees and funds from other sources, including income
from business-type activities, rAnts, loans, and fund-raising
activities; and aid from the national and local government units, by way
of the general tax fund and other receipts. For the private schools,
the financing process is relatively simple and direct. They retain all
Achievement in the Philippines .......... .... -........ page 9
income earned -- mainly from student fees, business-type activities, and
grants -- and plow it back. to the school, net of profits.
A recent study (Laya 1987) of secondary school expenditures
shows that over all types of schools, unit costs come to about P666
(Philippine pesos) per student (See Table 1). The schools appear to be
highl differentiated in their individual costs. The average private
school is considerably cheaper (by about half) than the average public
school. However, there is also a large difference between the two main
types of public schools. Unit costs of local public schools are similar
to (in fact, slightly lower than) those of private schools. However,
national schools are three times more expensive than private schools.
Sample
The sample of children used in our regression analysis was
obtained from data collected by the Household and School Matching
Project (HSMS). These data, which were collected to provide integrated
baseline information for policy analysis and the impact evaluation of
the Program for Decentralized Educational Development (PRODED), include
socioeconomic, demographic, and education-related information at the
level of the community, school, household and individuals.
The data were collected nationwide between May 1982 and
December 1983 from 260 barangays (villages) and 4990 households, which
were chosen on the basis of a two-stage stratified random sampling
scheme.
The identification of the barangay samples involved the
stratified random selection of 20 barangays in each region across urban
and rural and affected and unaffected strata. The households were, in
turn, drawn randomly from the sampled barangays. Urban areas are
Achievement in the Philippines ............. ...... page 10
somewhat over-represented in the sample. From the listing of members in
each sample households, the sample children for the study were
identified.
About 621 of all sampled children aged 11-15 were administered
an educational achievement test during the last quarter of the School
Year 1982-1983. (The other children were not examined due to transfer
of residence, refusal or failure to locate them.) The test employed to
measure educational achievement was the Philippine Educational Placement
Test (PEPT); it is the instrument developed by the National Educational
Testing Center of the Ministry of Education for its annual Accreditation
and Equivalency Program. It is a battery of tests designed to measure
the grade (or year) level learning performance of early school lcavers.
The PEPT consists of sub-tests in Mathematics, English and Filipino,
each of which consists of items that broadly cover the hierarchy of
learning objectives as dofined in the learning continuum from grade one
to fourth year high school. In this type of test, called an *omnibus"
test, all examinees are allowed to answer as many items as they can
manage within the time allocation of 90 minutea per sub-test.
After deleting from the sample children who were not in high
school and those who had incomplete information, we were left with a
sample of 446 students for the analysis.
Achievement end student background
Of the 446 sample secondary students, 302 (68X) belong to
public schools; 144 (32Z) to private schools. Among the public
school-going students, 57X live in urban communities; 431 in rural
communities. Of the private school students, 631 come from urban
communities and 371 from rural communities.
Achievement in the Philippines ......... .. page 11
The mean characteristics of our sample secondary students, by
school type, are presented in Table 2.
The table shows that the average grade equivalency for private
school students, compared to public school students, is 34S higher
overall. This trend does not vary by subject except for Pilipino where
the public school students register an edge. However, this cannot be
taken immediately as conclusive *vidence that one school type is more or
less effective than the other because the students in public and private
schools differ in high school levels attained. As shown in the same
table, almost a quarter of the private school students are already in
their third or fourth year, compared to only about a tenth of the public
school students. With rcspect to performance in Mental Ability Tests
(MAT), the mean score for private students ia likewise higher than for
public school students but only slightly.
In terms of socio-economic standing, the private school
students on the whole come from slightly advantaged backgrounds.
Private scho-l students come from household. with income and assets
almost double that of the public school students' households. The
mothers of private school students also have, on the average, longer
years of schooling over mothers of public school students. A lower
percentage of private school students live in rural communities.
Related to this could be the findings regarding media exposure,
availability of electricity, and distance to school. Private school
students have slightly more exposure to media than public school
students. A greater percentage of them also live in communities where
electricity is available, an amenity which can have an influence on
Achievement in th Philipp$nes.. .. ....... ....... ..... page 12
student achievement. Private school atudents live closer to both
private and public achools probably because more schools of both types
are situated in metropolitan aroas. Proximity of private school
students to both achool types is about the same, although they have a
alightly greater access to public schools. On the other hand, the
difference in proximity of public school students to private versus that
of public schools is more pronounced, with private schools considerably
less accessible than public schools.
With respect to personal and other household characteristies of
the students, on the average, private school students are slightly older
than public school students. Both groups of students have about the
same sex distribution with the females taking the majority. As to birth
order, private school students tend to be slightly at the earlier line
of siblings than public school students. There is, finally, a notable
difference between the two groups of students, in ternm of language used
at home. A greater percentage of private school students use both
English tnd Pilipino at home than public achool students. This is
significant because English and Pilipino are the two languages used for
instruction in all secondary schools. One of these are used as medium
of instruction in selected subjects.
Achievement in the Philipplnes................e .......... page 13
THE EmFCT OF BACKGROUND ON ACHIEVEMENT INPUBLIC AND PRIVATE SCHOOLS
Because the private and public subsamples are not necessarily a
random draw from the student population, the assumptions of the basic
linear model and could lead to biased estimates of the achievement
effect. As noted earlier, the way to correct for this is to use the
two-step technique: (i) estimate what determines the choice of school
type and (ii) estimate the achievement functions holding constant for
the probability of being in one type of school versus another.
What determines the choice of school type?
The first step in the estimation technique is to regress
private school choice with variables that measure socio-economic
characteristics. In specifying the regression equation, each household
is assumed to maximize utility. Hence, it is expected to balance the
gains and losses in deciding whether to send a child to private rather
than public school. In this regard, although the private school charges
higher fees, it may p-ovide better and more educational services for
which parents expect certain, benefits.
Given that the decision has been made to enroll a child in
school, the latent or unobserved variable (I ) in equation 3 may be
interpreted as the net utility gain of sending a child to a private
instead of a public school. Consequently, if the net utility gain is
positive (I* >O), then private school will be chosen (I-1); otherwise,
(I*<O) the decision would be in favor of public school (I-0).
From this perspective the relative cost of public and private
schools and ability to pay ire of paramount importance. The tuition
costs of private and public schools were not available. Moreover,
Achievement in the Philippines .......... ............. page 14
such costs are not appropriate explanatory variables of school choice
since they may reflect school quality and would thus be endogenous
variables. We, instead, use a measure of the other private costs of
education. In particular, the relative distance of private vis-a-vis
public school is expected to reduce the net gain of choosing private
education and, hence, the probability of sending a child to private
school. This is confirmed by the results presented in Table 3. The
coef cient of the relative distance variable has the expected sign and
is highly significant. At the mean values of the explanatory
variables, an increase in the differential distance of private and
public schools of 1 kilometer (i.e., private schools are 1 kilometer
further away than public schools) will decrease the probability of being
in private schools by two and one-half percentage points.4
Inasmuch as the value or willingness to pay by parents for the
extra services (quality or quantity) offered by private schools depends
on the household's ability to pay, the probability of choosing private
education should also be positively related with income and household
asset. This is borne out by the data. An increase in gross household
income of one peso will increase the probability of being in a private
school by a tenth of a percentage point. Parental education likewise
increases the probability of private school choice. More educated
parents may be assumed to put more value into the extra quality of
educational services offered by private schools.
4 Fol the jth variable, this is computed from the formula kj A (k y)where k denotes the estimated probit coefficient and #(.) refers to thestandard normal density function.
Achievement in the Philippines ............................... page 15
Other relevant variables include media *xposure and the s*.,
sex and birth order of the child. These have no effect on choice of
school type. It is possible that for some variables, conflicting
effects wash out. For example, given the same total household
resources, it is also plausible that higher order births may be at a
disadvantage. It is also possible, however, that children born later
may be going to school at the time when their parents are older and have
more income; when older siblings are already contributing to household
income. If these hypotheses are true, there may be no linear
correlat'on between birth order and the choice of private school.
The parameters of the probit equation in Table 2 are used to
estimate the term that will be used to correct for the selection
bias. The average values of this term, called the )'s, which are used
explanatory variables in equations (la) and (lb), are shown in the pen.-
ultimate row of Table 2.
How does socio-economic background affect school achievement?
The second step in the estimation is to use OLS to estimate the
impact of background on achievement. The variables that are used to
explain achievement, as measured by grade equivalency, in the
Philippines (i.e., the vector X) include many of the same variableo that
are used in Table 3. These include assets, income, mother's education,
media exposure, age, male and birth order. However, there are other
variables which we expected would affect achievement, but not the choice
of type of school. These include mental ability, the language used at
home, community variables and the present year of schooling. Most
importantly, there is one variable that is included in the
Achievement in the Philipplnes page 16
public/private choice equation but not in the achievement equation --
the relative distance of the studen:'s home from private as opposed to
public schools. This becomes our identifying restriction.5 Finally,
the achievement equation includes a term that holds constant for the
selection bias --i.e., for the probability that a given student will be
in private schools. This term is derived from parameters in the choice
equation, as described earlier.
The estimated achievement equations are presented in Table 4,
for private and public school students, respectively. These equations
can be used to estimate whether or not a school achievement advantage
exists in the public or the private sector, after holding constant for
student background and selection.
As expected, the mental ability test score is significantly and
positively correlated with the grade level equivalent (GLE) test score
for all subjects. Another variable which consistently has significantly
positive coefficients for all regression equations is sex. A female
person compared to a male has an achievement score that is greater by
about .63 - .95 of a year of GLE. This finding as it relates to
mathematics is an interesting cultural phenomenon. It contrasts well
with the U.S. experience. In a recent literature review of sex and
5 Without this restriction, the school choice and achievement equationsmay not be identified. Only the functional form would distinguish them.In many other studiea, such a restriction is not available.
Achievement in the Philippines ............. ........... .page 17
ethnic differences in middle school mathematics, Lockhe-d et al. (1985)
have concluded that sex differences are not statistically significant.
(Earlier, meta-anal-ses cited by the authors have concluded that boys
performed better than girls.)
The asset and income variables, which perform extremely well in
the probit equation, do not have statistically significant coefficient
excezt in public schools for mathematics and English. And in the latter
case the coefficient has a negative sign. Mother's education, which in
the Philippines is very highly correlated with father's education, is
statistically significant at customary levels only for English in
private schools and mathematics in public schools. Exposure to mass
media has a significant positive effect on English but a negative impact
on mathematics. Not surprisingly, children from Tagalog-speaking
families perform better in Pilipino, which is essentially a Tagalog
based national language. Interestingly also, children from households
that more frequently use English at home do worse in Pilipino, but do
not score higher in the English test.
With regards to the effect of the community variables, the
presence of electricity in the village turns out to have a very
important effect on the child's achievement in mathematics and Pilipino.
Children from communities that have electricity seem to score higher in
these subjects by as much as .86 - 1.5 of GLE. On the other hand,
holding other things constant, being in the rural area has a negative
and significant effect only in the achievement score of children in
English in public schools.
The coefficient of lambda times its coefficient can be
interpreted as the selection term. Suppose that students are free to
choose whichever type of school they prefer. One type of selection
Achievement in the Philippines* ................. to ....... page 18
results if student sort themselves into those institutions where they
think they can perform the best. There would be positive selection in
both private and public school samples. Another alternative is that
students are hierarchically sorted. For example, if there is excess
demand for places into the public schools and the best students are
selected, there would be positive selection into public schools but
negative seloction into private ones. In either case, the analyst
cannot observe the characteristics of privats school students among the
public school sample or vice versa.
The results shown that in math and pilipino achievement, the
selection term is not significantly different from zero. However, in
english language achievement the selection term is positive for both
groups and significant for public school students. This is an indica-
tion (albeit a weak one) that students sort themselves according to com-
parative advantage in the choice of type of school, at least when it
comes to language achievement.
Background constant, is there a private school effect?
The estimated differential in public and private school
students' achievement score can be computed from the parameters
presented in Table 4 to hold constant for the effect of background.
Because private and public school achievement equations differ in terms
of intersept and slope, the estimated differential could vary depending
4n the value of the lndependent variables. Hence, we estimate the
private-public differential using alternative sets of assumptions
regarding the value of the independent variables.
Achievement in the Philippineoa.. ......... . . . ......... page 19
The first row in Table 5 presonts the unconditional private
school effects calculated at the average characteristics of the overall
sample of public and private students. The estimates show that
students in private school perform better in English and Pilipino. The
private school offect is close to 15 percent of the average achievement
scores of the sample students. In mathematics, on the other hand,
private school students have a lower performance, although the
disadvantage is relatively small -- the negative private school effect
is only 4 percent of the sample average score for mathematics.
To examine the sensitivity of the private/public differentials
to sociooeconomic status (SES), we compare the above results with those
for low and high SES students. Theso are shown in rows 2 and 3,
rosp-etively. The private school advantage persists for all the groups.
However, its magnitude varies. The advantage of the private school
increases with SES in English. The development of English-language
skills is emphasized in many Philippine private schools. Children from
higher status backgrounds will benefit more from these schools since
they will tend to come from environments where English is used often and
where they have better access to English-language media. In Pilipino
there is no relationship between SES and the strength of the private
school effect; in mathematics the private school effect diminishes with
SES.
Our measure of academic performance reflects the cumulative
achievement of students in the sample. The private/public differential
may be sensitive to the numbor of years of secondary education
completed. A comparison of the figures in rows 4 and 5 of Table 5
reveals that the private school effects in all three subjects are
Achievement in the Philippines-* ... ..... o....... ...... . page 20
positive for first and second year students. For third and fourth year
students, this private shcool advantage persists in English and
Pilipino. In mathematics the effect becomes negative, although its size
is relatively small at about 6 percent of the sample mean score for
mathematics. Furthermore, the estimates show that while the private
school advantage decreased in English, it increased in Pilipino. This
may reflect the relative emphasis of public schools in the quality of
teaching in upper years relative to lower years.
In sum, the overall direction of the private school effect is
the same for various socioeconomic groups and for different yeas of high
school. However, the magnitude varies. The variation depends upon the
measure of educational output -- whether math or language skills.
Achievement in the Philippines .............. .........*O. page 21
CONCLUSIONS
According to the data analyzed in this paper, private school
students in the Philippines, on average, attain a higher grade
equivalency than their public school counterparts in tests in
mathematics (by 1.4 years, or 317) and in English (by 1.6 years, or
42%). In Pilipino, the national language, public school students
perform considerably better than their private school counterparts -- by
almost double the grade equivalency.
Simple comparisons of averages do not necessarily measure the
advantage of one type of school over another. Students may differ
systematically and their characteristics also influence their
performance in grade equivalency tests. In this paper we used
regression analysis to control for the effect of these characteristics.
The regressions were corrected for sample selection bias. Our
conclusions differ from those deduced from the simple comparisons
described in the preceding paragraph. There is a decided private school
advantage in both English and Pilipino (by more than half a year, or
roughly 15 percent of the sample mean achievement scores). The private
school advantage in Pilipino is particularly remarkable because of the
emphasis placed on this subject in public schools. Although public
school students do better, they do so because of their background
characteristics, rather than because of what they learn in school. In
mathematics, one finds a relatively small difference favoring the public
schools -- roughly four percent of the sample mean score in mathematics.
A comparison of cost per student reveals that on average public
schools spend roughly twice as much as private schools. Yet, academic
performance in English and Pilipino is better among the latter.
Achievement in the Philippines ...... ................... page 22
Moreover, even in mathematics where public school students did better,
their advantage is slight and is unlikely to outweigh the substantial
public/private cost differential.
These findings strongly suggest that private schools are an
efficient purveyor of secondary education in the Philippines. This
finding is consistent with the hypothesis that a more decentralized
management of schools and greater accountability, which characterize
private schools, are key factors in the internal efficiency of the
education sector. It appears that what counts is not only the magnitude
of available school resources but also the extent to which those
responsible for influencing student achievement have the incentive to
plan and manage these resources themselves. This finding should be
considered in the formulation of policy measures which could threaten
the existence of such schools -- such as overly restrictive fee ceilings
and massive expansion of subsidized public schools.
Achievement in thc Philippines****.....4................... page 23
REFERENCES
Armitage, Jane and Richard Sabot, "Efficiency and equityimplications of subsidies in secondary educationin Kenya." In David Newberry and NicholasStern, ods. The Theory of Taxation forDeveloping Countries. New Yorks OxfordUniversity Press (1987).
Boissiere, Maurice, John Knight and Richard Sabot,"Earnings Schooling Ability and CognitiveSkills," American Economic Review, 75(2):1016-1030 (1985).
Coleman, James, Thomas Hoffer, and Sally Kilgore. HiuhSchool Achievement: Public, Catholic and PrivateSchools Compared. New York: Basic Books, 1982.
Coleman, James and Thomas Hoffer. Public and Private HluhSchools: The Impact of Communities. New York:Basic Books 1987.
Cox, .onald and Emmanuel Jimenez, "Private-publicdifferences in secondary school performance: therole of selection effects in Colombia andTanzania," Education and Training Department,The World Bank, 1987.
Hanushek, Eric. "The economics of schooling: Productionand efficiency in the public schools," Journalof Economic Literature (September 1986):1141-77.
Heckman, James J. "Sample selection bias as specificationerror," Econometrica (January 1979): 153-161.
Jimenez, Emmanuel, Marlaine Lockheed and Nongnuch Wattana-waha, "The relative efficiency of public andprivate schools: the case of Thailand," TheWorld Bank Economic Review (May 1988).
Laya, J. and Associates, Philippine Secondary EducationFinancina and Rate of Return, Bureau ofSecondary Education and Secondary EducationDevelopment Budget, Manila, February 1987.
Lockheed, M. et al., Sex and Ethnic Differences in MiddleSchool Mathematics. Science and CompucerScience: What Do We Know? Education TestingService, Princeton, New Jersey, May 1985.
Murnane, Richard J. "Comparisons of public and privateschools: Lessons from the uproar," Journal ofHuman Resources (Spring 1985): 263-267.
Achiovement in the Philipplnos . .. page 24
Murnane, Richard J. "Comparisons of private and publicichoolss the critical role of regulations," inDaniel C. Lavy (ed.) Private Education: Studiesin Choice and Public Polica, New York: OxfordUniversity Press, 1986.
Murnane, Richard J., Stuart Newstead and Randall Olsen."Comparing Public and Private Schools: ThePuzzling Role of Selectivity Bias," Journal ofBusiness and Economic Statistics 3(1): 23-35.1985.
Psacharopoulos, George, "Public versus private schools indeveloping countries: Evidence from Colombiaand Tanzania," International Journal forEducational Development 7(1):59-67 (1987).
Roth, Gabriel. Private Provison of Public Services inDeveloping Countries. New York: OxfordUniversity Press 1987.
Willis, Robert J. and Sherwin Rosen. "Education andself-selection," Journal of Political Economy(October 1979 supplement): S7-S36.
4.
The World Bank. Financing Education in DevelopingCountries: An Exploration of Policy Options,Washington, D.C., 1986.
Achievement in the Philippines.........1 ...........e. page 25
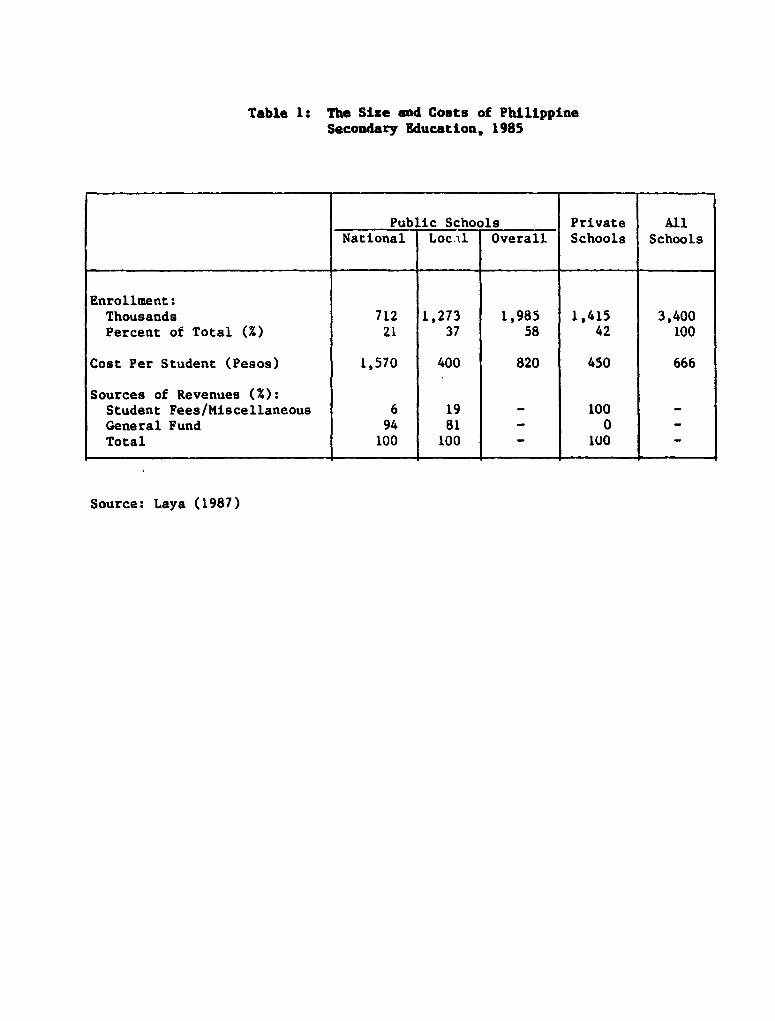
Table 1: The Size and Costs of PhilippineSecondary Education, 1985
Public Schools Private AllNational Loc.l Overall Schools Schools
Enrollment:Thousands 712 1,273 1,985 1,415 3,400Percent of Total (X) 21 37 58 42 100
Cost Per Student (Pesos) 1,570 400 820 450 666
Sources of Revenues (%):Student Fees/Miscellaneous 6 19 - 100 -
General Fund 94 81 _ 0 _Total 100 100 _ 100 _
Source: Laya (1987)
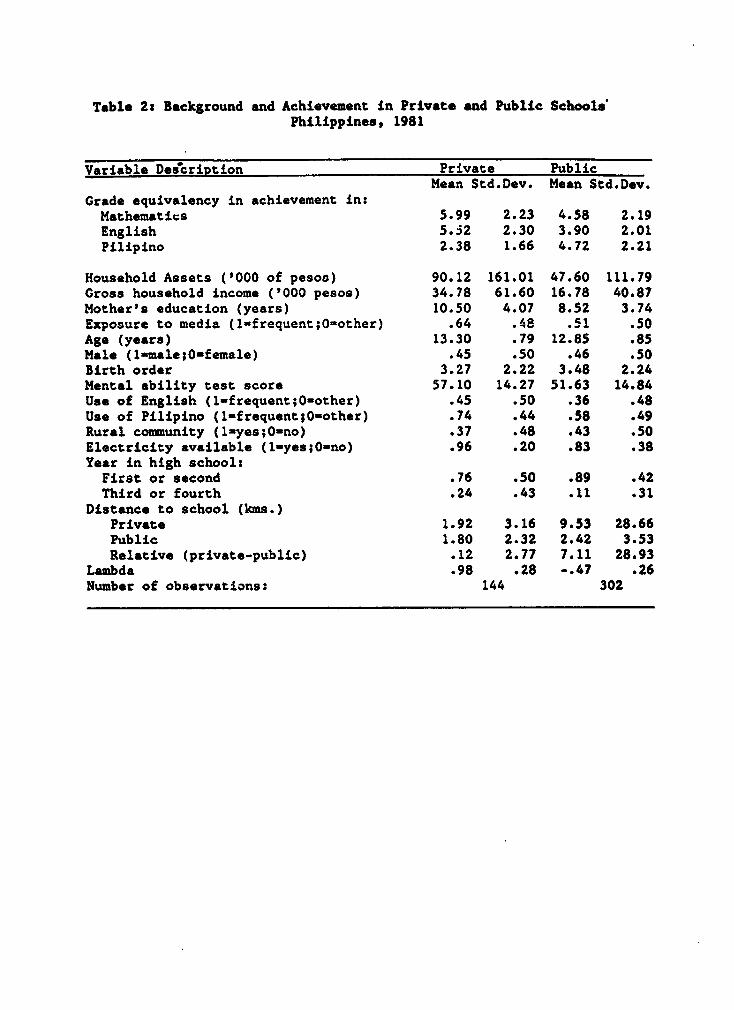
Table 2: Background and Achievement in Private and Public SchoolsPhilippines, 1981
Variable Des'cription Private PublicMean Std.Dev. Mean Std.Dev.
Grade equivalency in achievement in:Mathematics 5.99 2.23 4.58 2.19English 5.32 2.30 3.90 2.01Pilipino 2.38 1.66 4.72 2.21
Household Assets ('000 of pesos) 90.12 161.01 47.60 111.79Gross household income ('000 pesos) 34.78 61.60 16.78 40.87Mother's education (years) 10.50 4.07 8.52 3.74Exposure to media (lwfrequent;Oiother) .64 .48 .51 .50Age (years) 13.30 .79 12.85 .85Male (1-male;0-female) .45 .50 .46 .50Birth order 3.27 2.22 3.48 2.24Mental ability test score 57.10 14.27 51.63 14.84Use of English (1-frequent;0-other) .45 .50 .36 .48Use of Pilipino (1-frequent;0-other) .74 .44 .58 .49Rural community (1-yes;0-no) .37 .48 .43 .50Electricity available (l-yes;0-no) .96 .20 .83 .38Year in high school:First or second .76 .50 .89 .42Third or fourth .24 .43 .11 .31
Distance to school (kms.)Private 1.92 3.16 9.53 28.66Public 1.80 2.32 2.42 3.53Relative (private-public) .12 2.77 7.11 28.93
Lambda .98 .28 -.47 .26Number of observations: 144 302
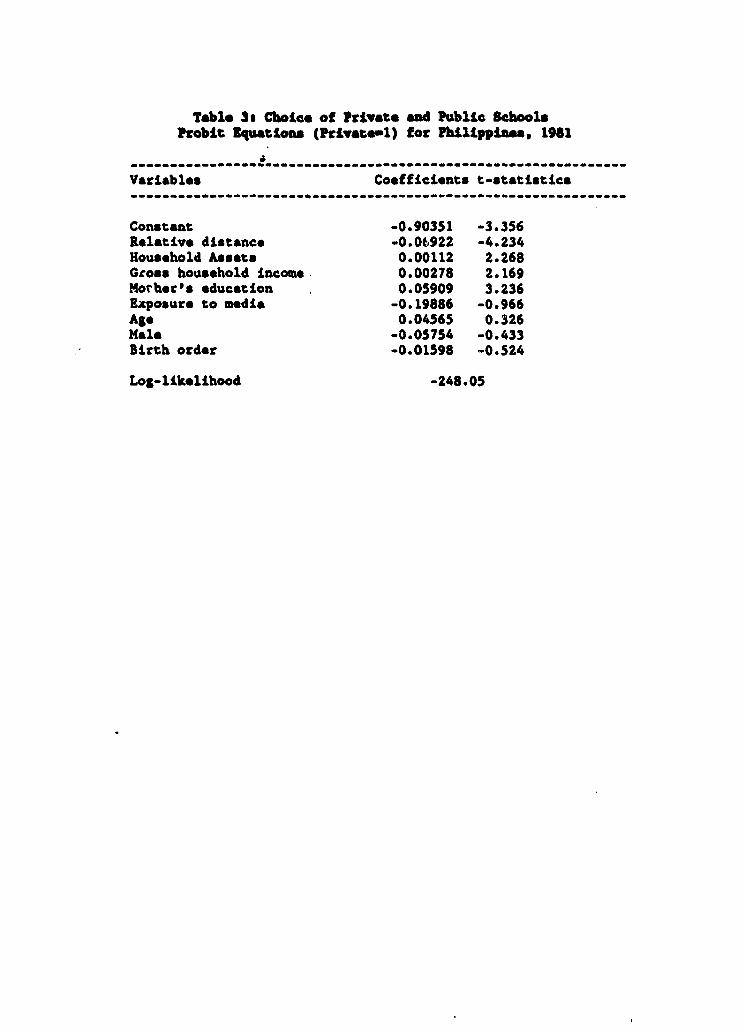
Table 3S Choice of Private and Public SchoolsProbit Squatiooa (Privatoel) for Philippines, 1981
Variables Coefficients t-statistics
Constant -0.90351 -3.356Relative distance -0.06922 -4.234Household Assets 0.00112 2.268Gross household income 0.00278 2.169Mother's education 0.05909 3.236Exposure to media -0.19886 -0.966Age 0.04565 0.326Male -0.05754 -0.433Birth order -0.01598 -0.524
Log-likelihood -248.05

Table 4: Achievement Functions for Private and PublicSchools in the Philippines
Coefficients (t-statistics)Variable Math English Pilipino
Priv. Pub. Priv. Pub. Priv. Pub.…-----------------------------------------------------------
Constant -1.987 1.661 -2.208 1.689 -1.921 0.611
HH Assets 0.0004 0.002 0.001 -0.0001-0.001 -0.0010.321 2.327 0.614 -0.115 -0.658 -1.032
Gross HH income -0.002 0.004 -0.001 -0.005 0.004 -0.004-0.628 1.374 -0.469 -2.366 1.345 -1.231
Mother's educ. 0.049 0.062 0.173 -0.042 -0.033 -0.0100.800 1.652 2.719 -1.156 -0.518 -0.251
Media exposure -0.636 -0.194 -0.341 0.359 0.161 0.276-2.111 -0.924 -1.087 1.768 0.514 1.222
Age 0.099 -0.130 0.100 -0.104 0.069 0.0080.434 -0.933 0.420 -0.777 0.292 0.053
Male -0.745 -0.708 -0.955 -0.630 -0.863 -0.819-2.531 -3.463 -3.112 -3.205 -2.820 -3.727
Birth order -0.019 -0.043 0.006 0.034 -0.077 0.019-0.291 -0.910 0.082 0.754 -1.132 0.385
Mental ability 0.099 0.081 0.084 O.G61 0.106 0.0648.894 11.424 7.273 9.055 9.153 8.419
Use of English -0.410 -0.388 -0.109 0.028 -0.036 -0.705-1.169 -1.579 -0.298 0.120 -0.099 -2.669
Use of Pilipino 0.136 0.136 -0.105 -0.039 0.504 0.6460.391 0.559 -0.290 -0.166 1.393 2.482
Rural community 0.089 0.220 -0.438 -0.441 -0.i58 -0.0880.288 0.958 -1.359 -1.991 -0.490 -0.359
Electricity 0.988 0.568 -0.433 0.246 1.497 0.8621.364 1.987 -0.578 0.884 1.984 2.809
3rd/4th yr. dummy 0.327 0.672 0.085 0.380 0.411 0.1781.585 1.847 0.514 1.121 1.923 0.478
Lambda 0.379 0.654 1.093 -1.689 0.112 -0.4970.353 1.160 0.986 -3.013 0.100 -0.823
…-----------------------------------------------------------
R-squared .488 .346 .474 .283 0.511 .296F-stats 8.128 11.632 7.682 8.905 8.912 8.005
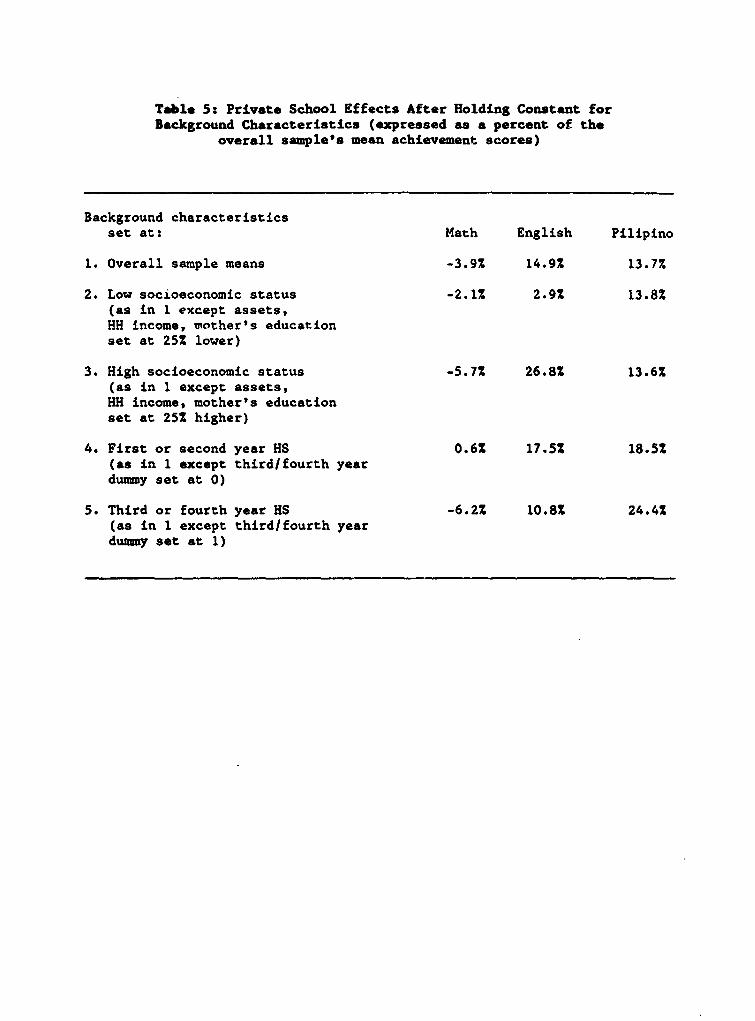
Table 5: Private School Effects After Holding Constant forBackground Characteristics (expressed as a percent of the
overall sample's mean achievement scores)
Background characteristicsset at: Math English Pilipino
1. Overall sample means -3.9% 14.9% 13.7%
2. Low socioeconomic status -2.1% 2.9% 13.8%(as in 1 except assets,HH income, mother's educationset at 252 lower)
3. High socioeconomic status -5.7% 26.8% 13.6%(as in 1 except assets,HH income, mother's educationset at 25% higher)
4. First or second year HS 0.6% 17.5% 18.5%(as in 1 except third/fourth yeardummy set at 0)
5. Third or fourth year HS -6.2% 10.8% 24.4%(as in 1 except third/fourth yeardummy set at 1)
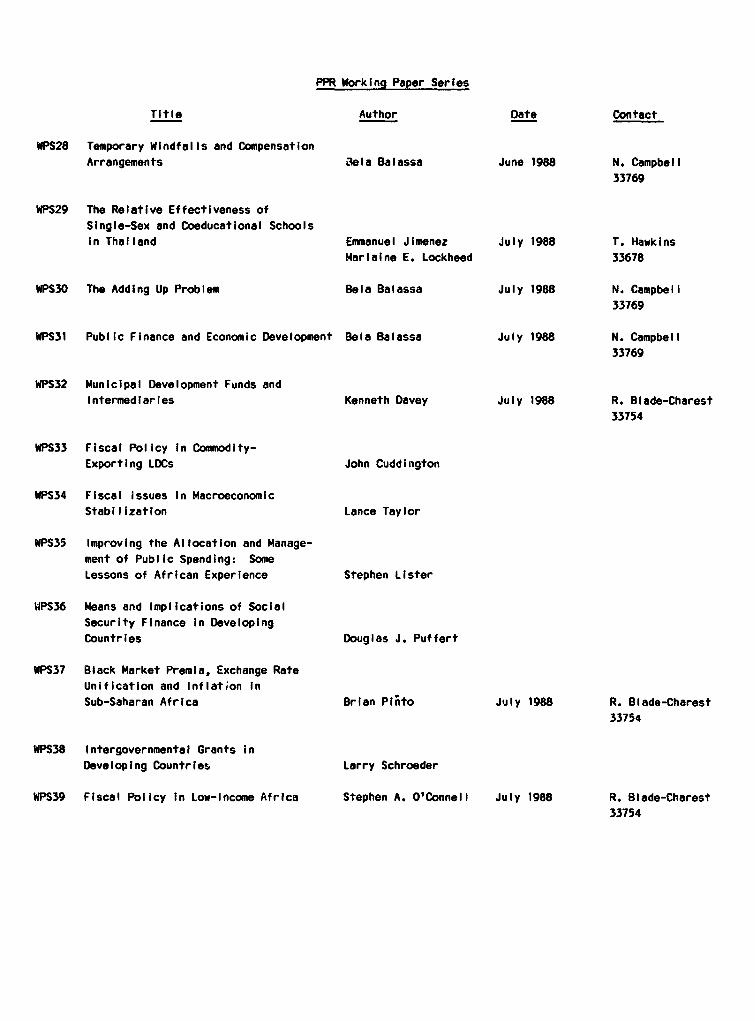
PPR Working Paper Series
Title Author Date Contact
WPS28 Temporary Windfalls and CompensationArrangements .3ela Balassa June 1988 N. Campbell
33769
WPS29 The Relative Effectiveness of
Single-Sex and Coeducational SchoolsIn Thailand Emmanuel Jimenez July 1988 T. Hawkins
Marlaine E. Lockheed 33678
WPS30 The Adding Up Problem Bela Balassa July 1988 N. Campbell
33769
WPS31 Public Finance and Economic Development Bela Balassa July 1988 N. Campbell
33769
WPS32 Municipal Development Funds andIntermediaries Kenneth Davey July 1988 R. Blade-Charest
33754
WPS33 Fiscal Policy In Commodity-Exporting LDCs John Cuddington
WPS34 Fiscal issues in MacroeconomicStabilization Lance Taylor
WPS35 Improving the Allocation and Manage-
ment of Public Spending: SomeLessons of African Experience Stephen Lister
WPS36 Means and Implications of Social
Security Finance In DevelopingCountries Douglas J. Puffert
WPS37 Black Market Premia, Exchange Rate
Unification and lnflation InSub-Saharan Africa Brian Pinto July 1988 R. Blade-Charest
33754
WPS38 Intergovernmental Grants inDeveloping Countries Larry Schroeder
WPS39 Fiscal Policy in Low-Income Africa Stephen A. O'Connell July 1988 R. Blade-Charest
33754
PPR Working Paper Series
Title Author Date Contact
WPS40 Financial Deregulation and the
Globalization of Capital Markets:A Stabilizing Force or a Conduitof Volatility and Uncertainty? Eugene L. Versluysen
WPS41 Urban Property Tax Reform In
Developing Countries William Dillinger
WPS42 Government Pay and Employment Policy
and Government Performance In
Developing Economies David L. Lindauer
WPS43 Tax Administration In Developing
Countries: Strategies and Toolsof Implementation Tax Administration
Division
WPS44- Assigned to WDR
WPS6o
WPS61 Student Performance and Schools Costs
in the Philippines' High Schools Emmanuel Jimenez July 1988 T. HawkinsVicente Paqueo 33678
Ma. Lourdes de Vera
WPS62 Status of Universities in the ArabCountries of the Middle East and
North Africa George 1. Za'rour
WPS63 Does Japan Import Less Than It Should?
A Review of the Econometric
Literature Kenji Takeuchi July 1988 J. Epps33710
WPS64 Analysis of Cocoa and Coffee Pricing
Policies in the Cote d'lvoire Takamasa Akiyama
WPS65 Interaction of Infant Mortality and
Fertility and the Effectiveness ofHealth and Family Planning Programs Howard Barnum July 1988 S. Ainsworth
31091
WPS66 Slowing the Stork: Better Health forWomen through Family Planning Anthony R. Measham July 1988 A. Manciano
Roger W. Rochat 33226


![Funk-Rufnamen-Regelung des THW [THW-FuRnR] · THW-FuRnR Stand: 07.01.2013 Seite 2 von 25 Inhaltsverzeichnis 1 Grundsätze 4 2 Zusammensetzung des Funk-Rufnamens 5 2.1 Kennwort für](https://cdn.vdocuments.mx/doc/165x107/5b1436db7f8b9a347c8be3c7/funk-rufnamen-regelung-des-thw-thw-furnr-thw-furnr-stand-07012013-seite.jpg)

