
Page 1
Storage the ultimate insurance –
Smoothing the Jagged Edges of Energy Markets
Crude Oil Markets and Storage Summit 2015
Page 2 Page 2
Stone Bridge Energy Partners is a leading developer of diversified energy and chemicals projects. Stone Bridge, in partnership with leading strategic and financial investors, is pursuing fundamental opportunities in the North American energy complex. The industry is in a highly dynamic period offering the opportunity to create layers of value in unexpected and at moments non-obvious ways. Directionally Stone Bridge identifies market imperfections, including structural arbitrage opportunities, delivering fast track projects that cover off these seams at lowest cost and lowest risk. Stone Bridge is attracted to high growth markets, with compelling margin opportunities, quality partners and defensible competitive barriers.
Stone Bridge manages commodity-to-commodity risk contractually arranging project
structures at lowest market risk with optimum financial returns. The company’s tolling strategy has been tried and tested over many years from gas storage, to pipelines, to LNG, to power and petrochemicals. Stone Bridge is extending the tolling plus strategy to a range of diverse midstream and downstream opportunities.
Stone Bridge keeps the end in mind from project concept, through development and
structuring. The company anticipates exiting projects through trade sale, MLPs and conventional public offerings.
Confidential - Not for Distribution
About Stone Bridge
Page 3 Page 3 Confidential - Not for Distribution
Agenda
Some Preliminaries Some Fundamentals Some Resources Some Maps Some Numbers Some Truths Some Conclusions Some Doubt Some Need for Insurance !

Page 4 Page 4 Confidential - Not for Distribution
What a difference a year makes
Source EIA

Page 5 Page 5 Confidential - Not for Distribution
Things Keep Moving - Week Ending May 29: Change in Weekly Crude Oil Inventory
Page 6
"
!!!!
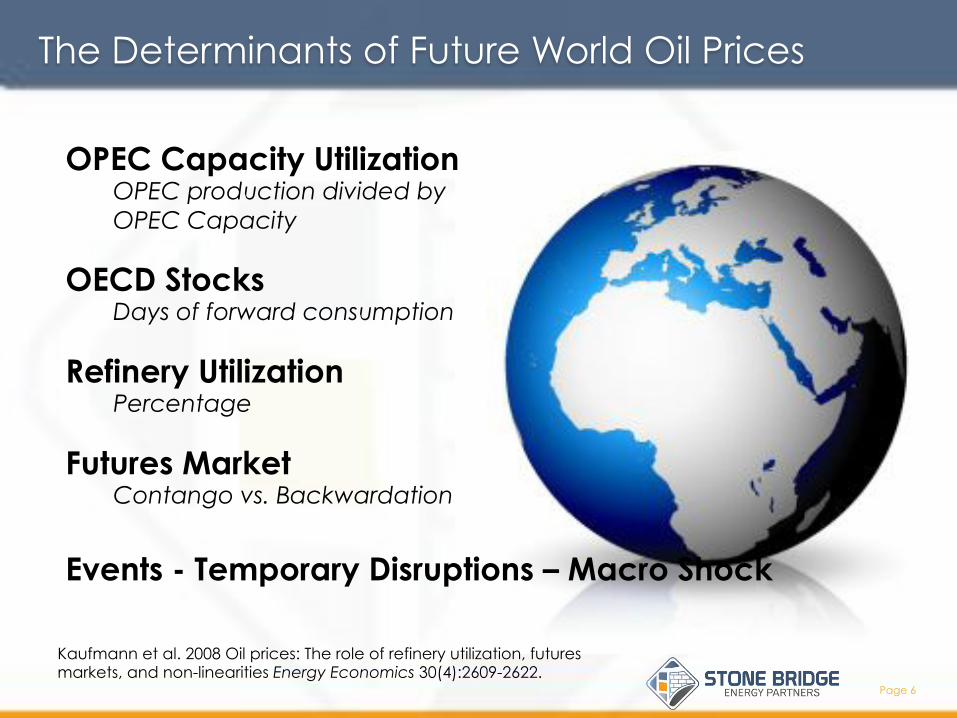
OPEC Capacity Utilization OPEC production divided by OPEC Capacity
Kaufmann et al. 2008 Oil prices: The role of refinery utilization, futures markets, and non-linearities Energy Economics 30(4):2609-2622.
The Determinants of Future World Oil Prices
OECD Stocks Days of forward consumption
Refinery Utilization Percentage
Futures Market Contango vs. Backwardation
Events - Temporary Disruptions – Macro Shock

Page 7 Page 7 Confidential - Not for Distribution
To the Future!
An examination of EIA long-term forecasts from 1994 through 2012 shows that on average, for forecasts over five years in the future, the actual crude oil price was at least 50% higher than the EIA forecast. – WTRG Economics
!

Page 8 Page 8 Confidential - Not for Distribution
To the Future!
Our analysis of NYMEX futures contracts based on the average futures price for all available December contracts demonstrates that on average, the actual price was below the NYMEX price for 1 – 7 years out. Furthermore, in all instances for a time horizon greater than three years, the actual price was higher than the price implied by the NYMEX contracts– WTRG Economics
!
Page 9 Page 9 Confidential - Not for Distribution
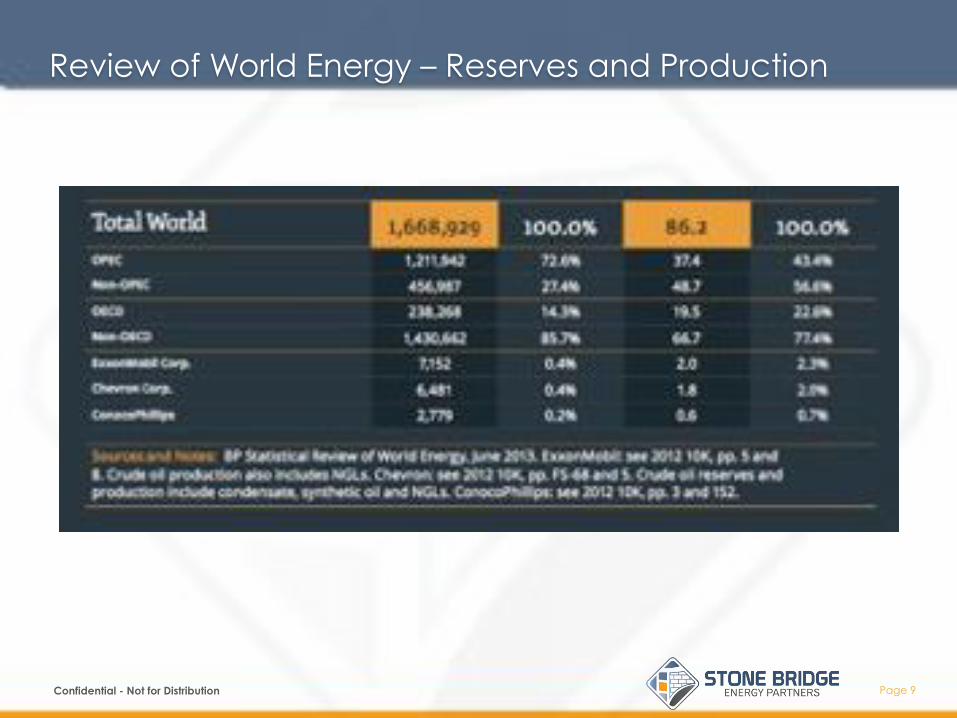
Review of World Energy – Reserves and Production

Page 10 Page 10 Confidential - Not for Distribution
Progress = New Marginal Demand

Page 11 Page 11 Confidential - Not for Distribution
Urbanization and Expanding Middle Class
The magnitude of China’s middle-class growth is transforming the nation.
Share of urban households,1 %
Urban private consumption,1 %
Income segment2 Projected growth of private consumption, CAGR,3 2012-22, %
100% = 256 million
357 million
3 - 9 14
54 54
22
29 16
16
25 20
56 54
14 16
11
10,048 billion renminbi
26,804 billion
renminbi
- 5 2012 2022 2012 2022
Affluent
Upper Middle Class
Mass Middle Class
Poor
10.3
19.6
22.4
-3.3
-1.5
1Figures may not sum to 100%, because of rounding; data for 2022 are projected. 2Defined by annual disposable income per urban household, in 2010 real terms; affluent, >229,000 renminbi (equivalent to >$34,000); upper middle class, 106,000 to 229,000 renminbi (equivalent to $16,000 to $34,000); mass middle class, 60,000 to 106,000 renminbi (equivalent to $9,000 to $16,000); poor, <60,000 renminbi (equivalent to <$9,000). 3Compound annual growth.

Page 12 Page 12 Confidential - Not for Distribution
Urbanization and Expanding Middle Class
Generation 2 – Chinese consumers in their teens and early 20s – takes a more Western approach to shopping.
% of respondents
Confident about personal-income growth
Loyal to brands Willing to trade up 3
Often early adopter of new products/services
Seek feedback/ comments on Internet before buying 3
Upper-middle-class urban Generation 2 members1
Upper-middle-class urban population2
Total urban population
64 58 56 46 43 40 41 36 33 29 25 22 21 16
12
1People born after the mid-1980s and raised in a period of relative abundance. 2Annual household income of 106,000 – 229,000 renminbi (equivalent to $16k - $34k in 2010 terms). 3Personal-care-product example. Source: 2012 McKinsey survey of 10,000 Chinese consumers

Page 13 Page 13 Confidential - Not for Distribution
Urbanization and Expanding Middle Class
Gongzhuling
Beijing
Yulin (Shaanxi)
Linfen
Liuan Shanghai
Wuhan
Chongqing
Leshan
Ziyang
Guangzhou
Shenzhen Foshan
Yongzhou
Zhaotong
Meishan Chengdu
Tier-1 Cities
Selected Tier-2 Cities
Selected Tier-3 Cities
Selected Tier-4 Cities
Share of middle class by type of city, % 16
40
45
31
43
15 - 8 3 -
16

Page 14 Page 14 Confidential - Not for Distribution
Year-Over-Year Change in World Demand for Oil (million barrels per day)
Page 15 Page 15 Confidential - Not for Distribution
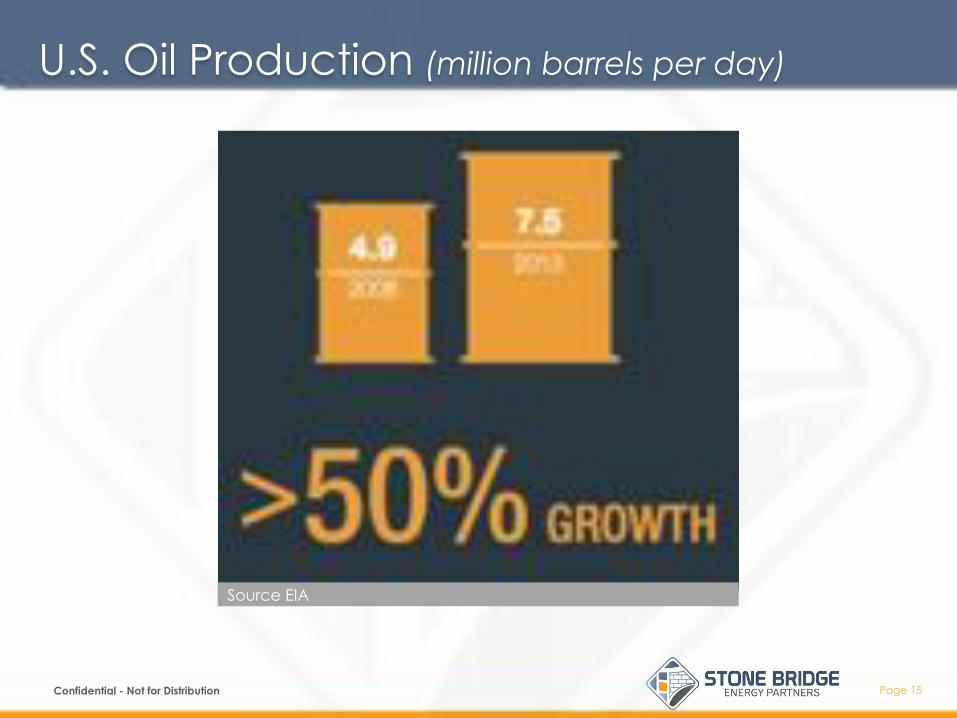
U.S. Oil Production (million barrels per day)
Source EIA

Page 16 Page 16 Confidential - Not for Distribution
Resources
Canada
United States
Mexico Trinidad & Tobago
Venezuela Columbia
Ecuador
Peru Brazil
Argentina
Production (thousand barrels per day)
8,000 to 12,000
2,000 to 8,000
500 to 2,000
0 to 500
Source: BP Statistical Review of World Energy, June 2013

Page 17
North American Resources
Source: OGJ 2012 Confidential - Not for Distribution

Page 18 Page 18 Confidential - Not for Distribution
New Trade Flows Create New Dynamics
1.0 (-0.6)
1.1 (+0.3)
1.2 (+0.6)
1.8 (-0.6)
3.1 (0.3) 4.1
(-0.6) 5.2 (+0.3)
1.6 (-0.2)
0.1 (-0.7)
2.0 (-0.6)
2.2 (+0.8)
1.2 (+0.1)
3.6 (-0.5)
0.5 (-0.0)
1.3 (+0.6)
0.7 (+0.4)
0.3 (0.2)
0.2 (0)
Crude Exports in 2019 & Growth in 2013-19 for Key Trade Routes 1
(million barrels per day)
Red number in brackets denotes growth in period 2013-19 1 Excludes Intra-Regional Trade 2 Includes Chile 3 Includes Israel
Asia imports increase by 2.6 mb/d to 22.1 mb, or 65% of the international crude market.
OECD Americas 2
OECD Europe
OECD Asia
Oceania 3
China
Other Asia
Page 19 Page 19 Confidential - Not for Distribution
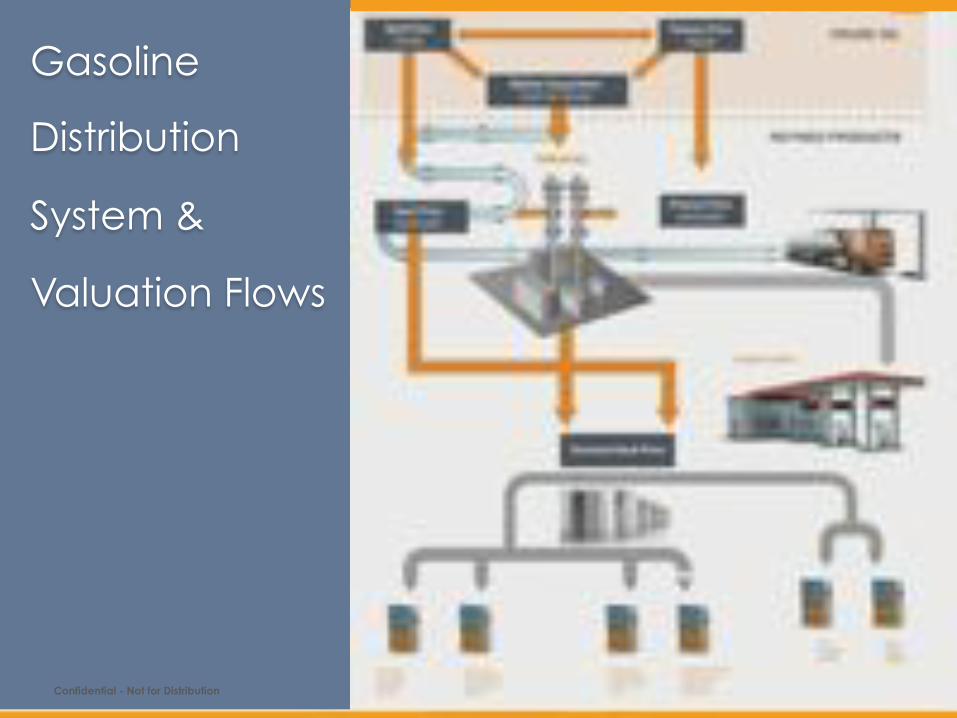
Gasoline
Distribution
System &
Valuation Flows

Page 20 Page 20 Confidential - Not for Distribution
The U.S. Refining Sector

Page 21 Page 21 Confidential - Not for Distribution
Gasoline Pricing

Page 22 Page 22 Confidential - Not for Distribution
U.S. Finished Petroleum Products Demand (million barrels per day)
Source: EIA. Data for 2013 is the average of January through November.

Page 23
-60
-40
-20
0
20
40
60
80
1900 1910 1920 1930 1940 1950 1960 1970 1980 1990 2000
"
!!!!
Competitive Market OPEC
Kaufmann, R.K. 1995. A model of the world oil market for Project LINK Economic Modelling 12:165-178
Annual Change in Real Oil Prices
TX Railroad Commission

Page 24 Page 24 Confidential - Not for Distribution
WTI Crude Oil Futures Contracts Traded by Year, 1990 - 2013 (millions of contracts traded)

Page 25
Events cut both ways
Page 26
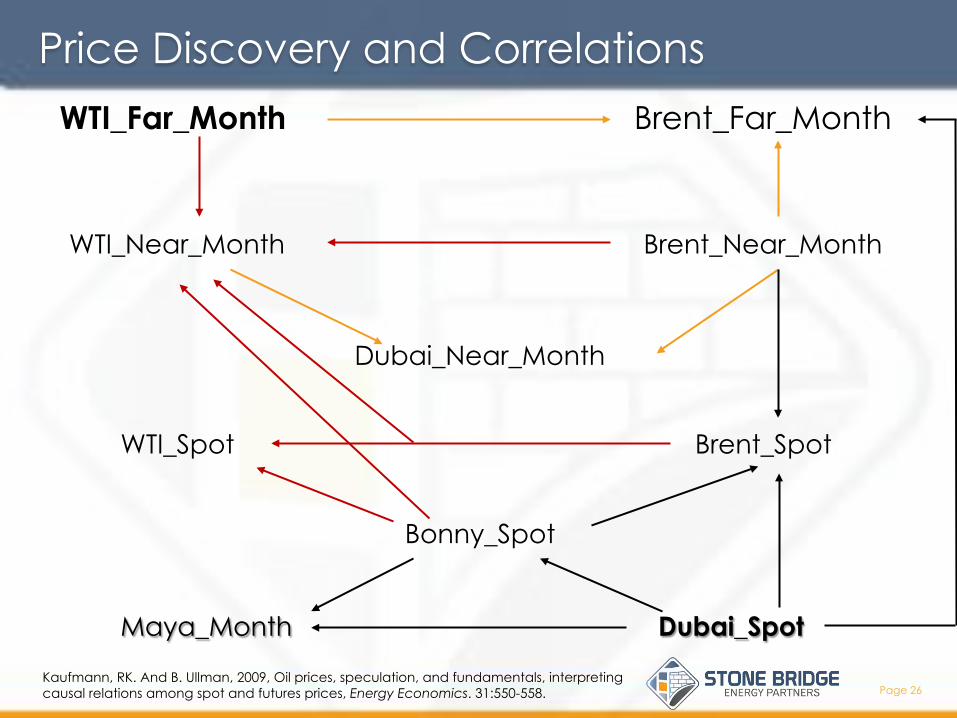
WTI_Far_Month Brent_Far_Month
WTI_Near_Month Brent_Near_Month
Dubai_Near_Month
WTI_Spot Brent_Spot
Bonny_Spot
Maya_Month Dubai_Spot
Kaufmann, RK. And B. Ullman, 2009, Oil prices, speculation, and fundamentals, interpreting causal relations among spot and futures prices, Energy Economics. 31:550-558.
Price Discovery and Correlations

Page 27
0
20
40
60
80
100
120
140
160
180
1900 1920 1940 1960 1980 2000 2020 2040
1 trillion barrels
2.5 trillion barrels
Mill
ion
ba
rre
ls /
Da
y This Will Never Happen… But
Page 28
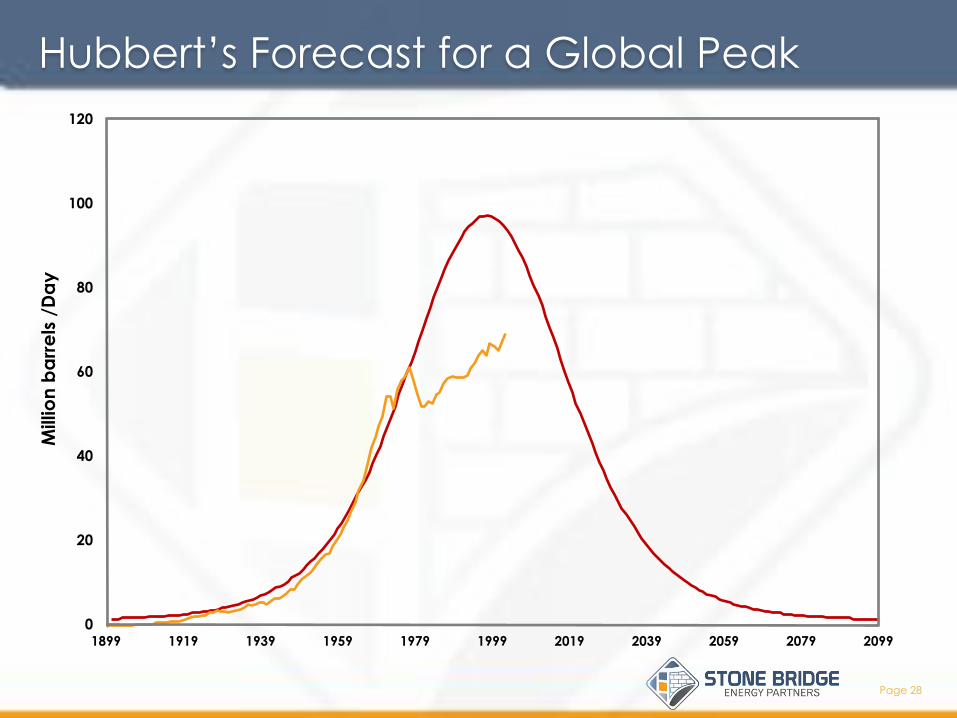
0
20
40
60
80
100
120
1899 1919 1939 1959 1979 1999 2019 2039 2059 2079 2099
Mill
ion
ba
rre
ls /
Da
y Hubbert’s Forecast for a Global Peak
Page 29
0
20
40
60
80
100
120
140
160
180
1900 1920 1940 1960 1980 2000 2020 2040 2060 2080 2100
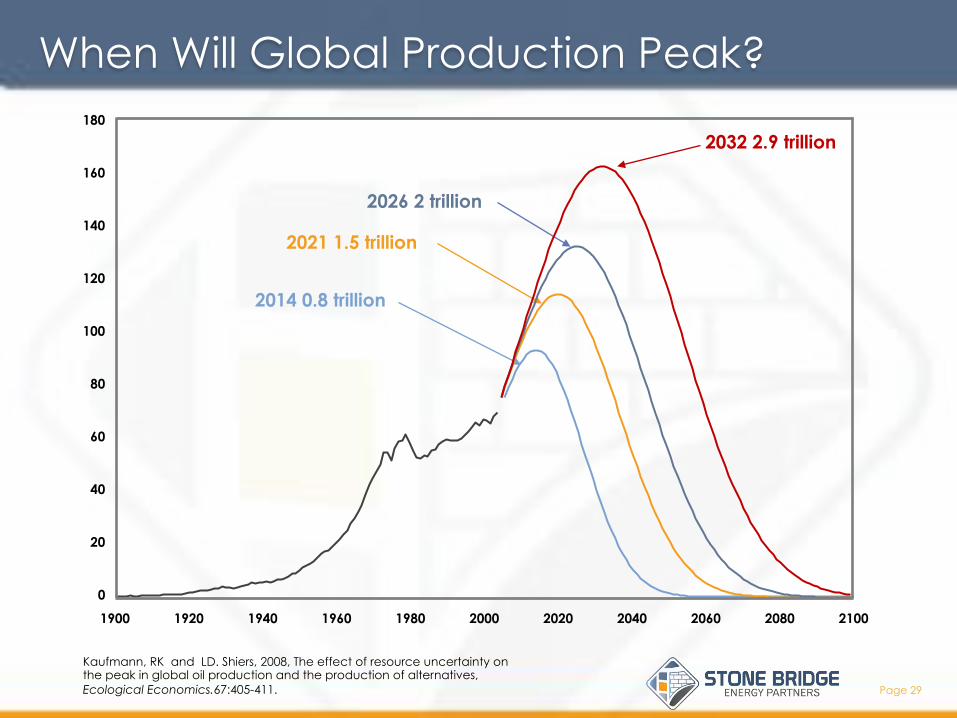
2014 0.8 trillion
2021 1.5 trillion
2026 2 trillion
2032 2.9 trillion
Kaufmann, RK and LD. Shiers, 2008, The effect of resource uncertainty on the peak in global oil production and the production of alternatives, Ecological Economics.67:405-411.
!
When Will Global Production Peak?

Page 30 Page 30 Confidential - Not for Distribution
Changes in Saudi Arabia Production v WTI

Page 31 Page 31 Confidential - Not for Distribution
Historical World Spare Oil Production Capacity & WTI Spot Price
Average Quarterly, 1995 - 2013
Page 32 Page 32 Confidential - Not for Distribution
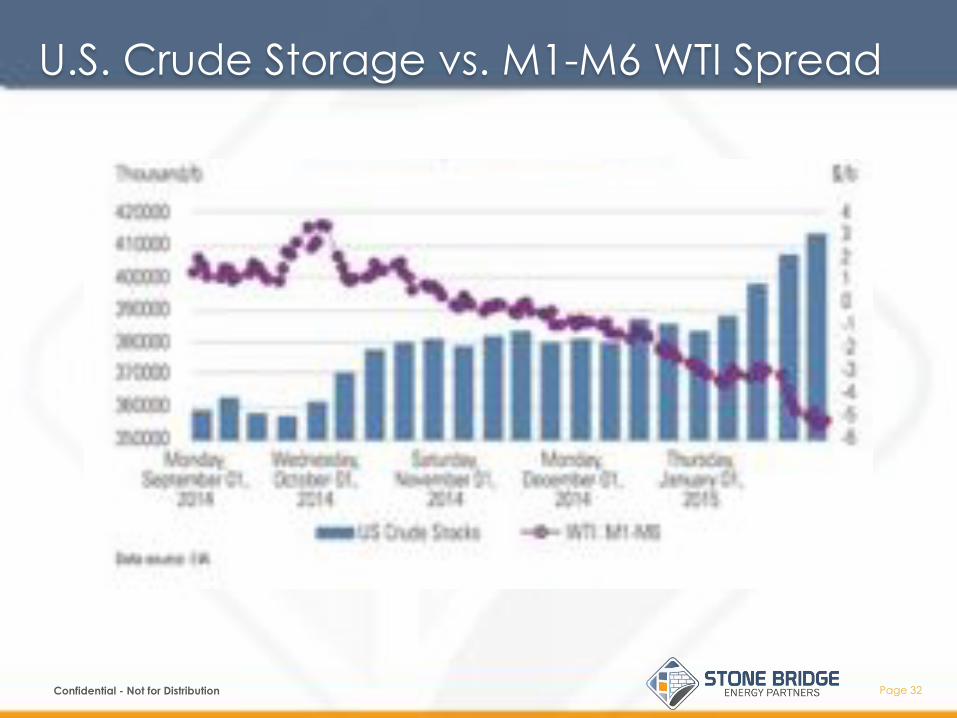
U.S. Crude Storage vs. M1-M6 WTI Spread

Page 33 Page 33 Confidential - Not for Distribution
Imports Displaced
Page 34 Page 34 Confidential - Not for Distribution
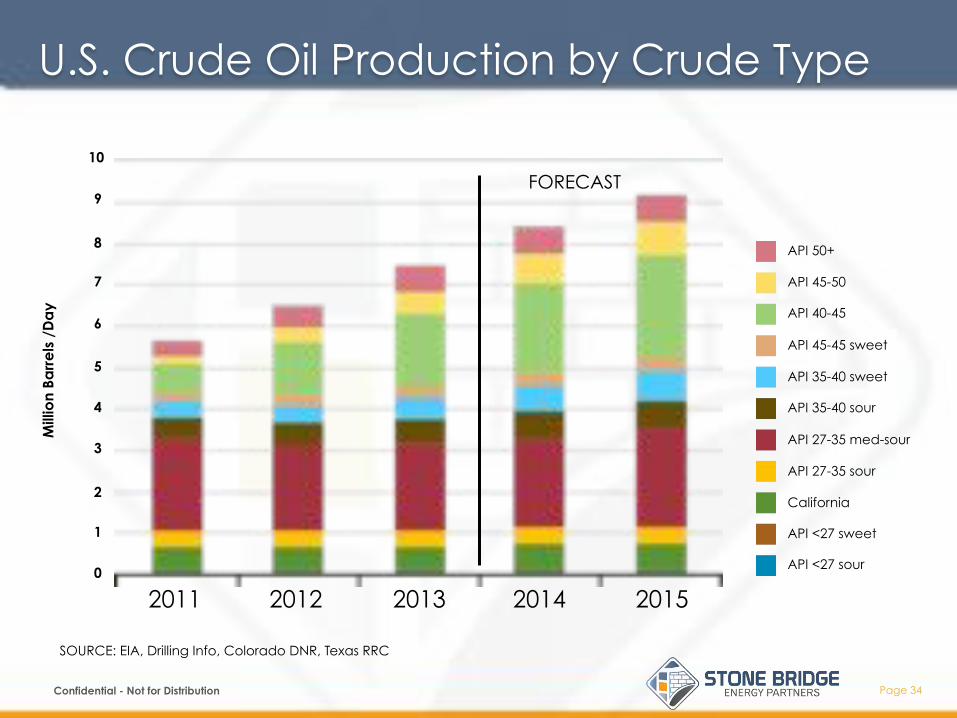
U.S. Crude Oil Production by Crude Type
SOURCE: EIA, Drilling Info, Colorado DNR, Texas RRC
FORECAST
Mill
ion
Barr
els
/D
ay
10
9
8
7
6
5
4
3
2
1
0
2011 2012 2013 2014 2015
API 50+
API 45-50
API 40-45
API 45-45 sweet
API 35-40 sweet
API 35-40 sour
API 27-35 med-sour
API 27-35 sour
California
API <27 sweet
API <27 sour

Page 35 Page 35 Confidential - Not for Distribution
Imports by Crude Oil Quality (million barrels per day)
Source: Import volumes from EIA. 2013 data is through November. Note: Heavy, Medium and Light are characterized by the oil’s API gravity in the following manner: <28: Heavy; 28-33: Medium; >33: Light. The sweet/sour characterization is defined by the oil’s sulfur content, with <=0.42% Sulfur characterizing “Sweet” oil.

Page 36 Page 36 Confidential - Not for Distribution
Global Crudes & Their Physical Characteristics – Density & Sulphur
Oil%Sands!
Permian%Basin!
0 0.5 1 1.5 2 2.5 3 3.5 4
Sulphur%content%%!
API
De
gre
e
10
15
20
25
30
35
40
45
50
IEA Aggregate
BFOE Brent

Page 37 Page 37 Confidential - Not for Distribution
Domestic Crude Oil First Purchase Prices for Selected Crude Streams
0
20
40
60
80
100
120
140 A
pr-
2011
Jun-
2011
Aug
-201
1
Oc
t-20
11
De
c-2
011
Feb
-201
2
Ap
r-20
12
Jun-
2012
Aug
-201
2
Oc
t-20
12
De
c-2
012
Feb
-201
3
Ap
r-20
13
Jun-
2013
Aug
-201
3
Oc
t-20
13
De
c-2
013
Feb
-201
4
Ap
r-20
14
Alaska No. Slope
Cali. Kern River
Cali. Midway-Sunset
Heavy La. Sweet
Light La. Sweet
Mars Blend
West Tx. Intermediate
West Tx. Sour
Wyoming Sweet
Page 38 Page 38 Confidential - Not for Distribution
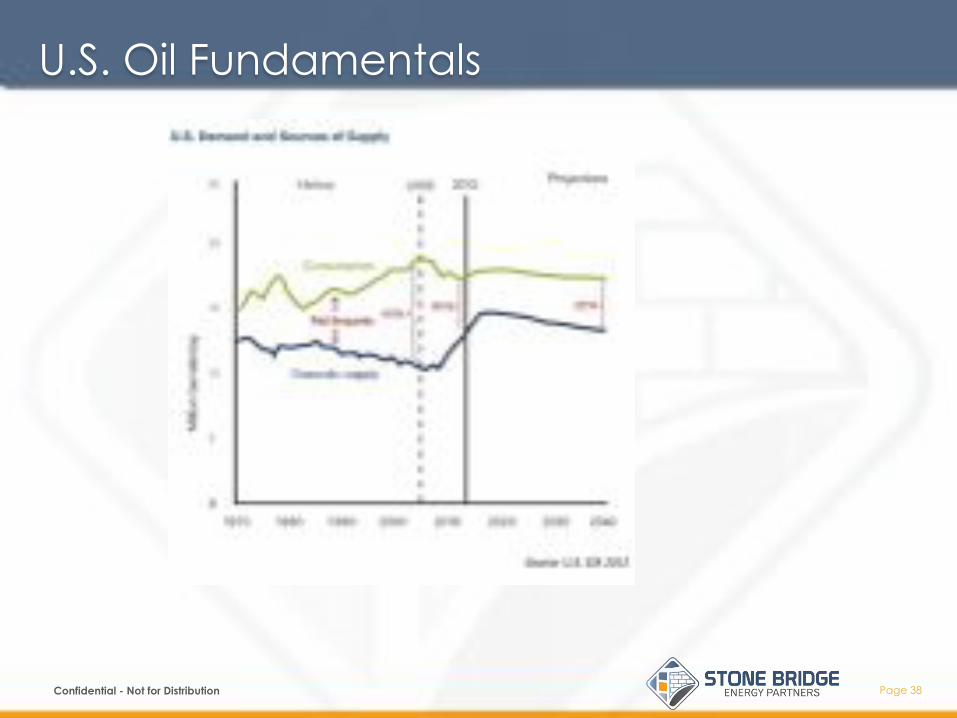
U.S. Oil Fundamentals

Page 39 Page 39 Confidential - Not for Distribution
A function of resources
Source EIA

Page 40 Page 40 Confidential - Not for Distribution
WCSB Takeaway Capacity vs. Supply Forecast (millions barrels per day)

Page 41 Page 41 Confidential - Not for Distribution
Canadian Oil Production (million barrels per day)
A new 40-in, 750-mile pipeline of one million bbls/day capacity from Montrealto deep-water East Coast ports and refineries, with a right-of-way paralleling the TransCanada Highway, could be built for $4 billion. Assuming an average pipeline toll of $8/bbl and an average throughput of 1.5 million bbls/day over a 50-year life, total pipeline revenue of $220 billion is ten to twenty times the capital and operating costs for the pipeline. This is a terrific project business return by any measure – though pipeline tolls and return on capital must be approved by shippers and regulators. The real value of this pipeline is economic. Based on a value of $200/bbl for refined products, two million bbls/day of Canadian bitumen extracted, upgraded, pipelined to eastern Canada and there refined, and consumed or exported, will contribute more than $150 billion/year to Canada's economy and balance of payments. And those economic benefits do not include spin-off benefits to local economies and governments associated with upgrading, pipelining, refining, petro-chemicals and port activities.

Page 42 Page 42 Confidential - Not for Distribution
Energy Partners

Page 43 Page 43 Confidential - Not for Distribution
Shipping Oil

Page 44 Page 44 Confidential - Not for Distribution
Midstream Collapses Arbs

Page 45 Page 45 Confidential - Not for Distribution
Convergence Club

Page 46 Page 46 Confidential - Not for Distribution
Global Activity

Page 47 Page 47 Confidential - Not for Distribution
U.S. and Canada Pipes – Concentrated and Inflexible

Page 48 Page 48 Confidential - Not for Distribution
U.S. Oil Pipelines

Page 49 Page 49 Confidential - Not for Distribution
U.S. Crude Oil Storage Capacity Utilization Now Up to 60% March 24, 2015

Page 50 Page 50 Confidential - Not for Distribution
Oil Infrastructure Snap

Page 51 Page 51 Confidential - Not for Distribution
Success follows Success

Page 52 Page 52 Confidential - Not for Distribution
Rail – Big and Flexible

Page 53 Page 53 Confidential - Not for Distribution
Canadian Movements to USGC

Page 54 Page 54 Confidential - Not for Distribution
Everything is moving

Page 55 Page 55 Confidential - Not for Distribution
Events
Page 56 Page 56 Confidential - Not for Distribution
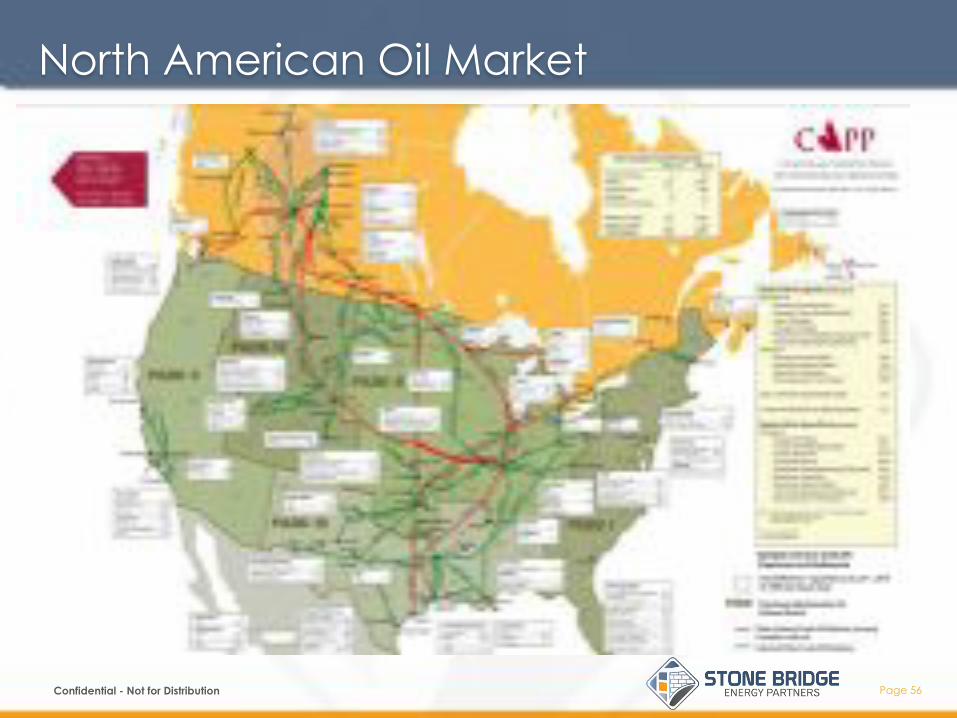
North American Oil Market

Page 57 Page 57 Confidential - Not for Distribution
Canadian Infrastructure

Page 58 Page 58 Confidential - Not for Distribution
Go West

Page 59 Page 59 Confidential - Not for Distribution
East too – maybe North?

Page 60 Page 60 Confidential - Not for Distribution
Take Away Capacity Constraints

Page 61 Page 61 Confidential - Not for Distribution
Invitation to Invest

Page 62 Page 62 Confidential - Not for Distribution
St James Growing but Not for Storage
Page 63 Page 63 Confidential - Not for Distribution
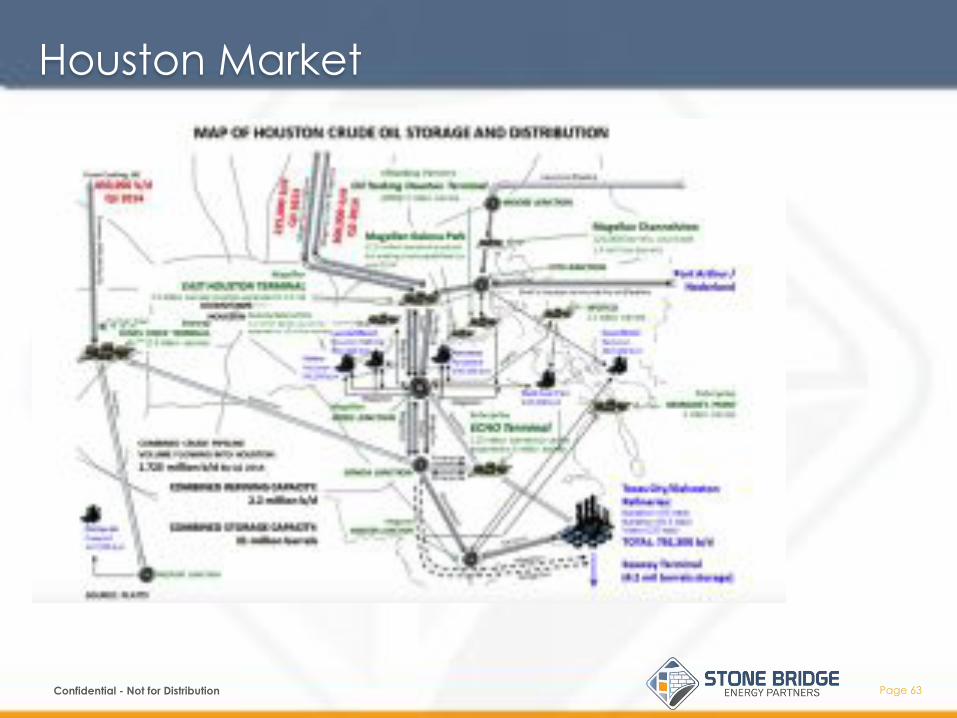
Houston Market

Page 64 Page 64 Confidential - Not for Distribution
Houston Market “The development of over 1.7 million b/d of pipeline capacity to bring U.S. crude production to Houston by 2014 has set the stage for a new spot market and created the need for a new marker that reflects both U.S. Gulf Coast and global crude fundamentals,” said Esa Ramasamy, Platts editorial director, strategic oil markets development. “As new pipelines and other forms of transportation enable domestic crude to flow to the Gulf Coast rather than being trapped inland, the U.S. market is rapidly resetting itself. The change is already evident in the narrowing price spread between WTI and Brent, two global benchmarks. The rise in U.S. domestic crude oil production is beginning to be felt globally.” Houston, currently the location for several Americas refined products benchmarks, is the largest refining center in the U.S. with 2.2 million b/d of refining capacity. With the rebirth of U.S. crude production nearby, the Gulf Coast port city is undergoing a massive infrastructure renaissance, evidenced by the development of 31 million barrels of crude oil storage and the expansion of local pipeline capacity between storage terminals and refineries by the middle of 2014. Pipelines, including Enterprise/Enbridge’s Seaway and Magellan’s Longhorn, are connecting inland production centers to the U.S. Gulf Coast, with Houston as the main target of these shifting crude oil flows. “Houston’s superior refining capacity, storage, and waterborne loading infrastructure positions it to become a key pricing hub in the Americas,” said Suzanne Evans, senior manager, Platts’ Price Group. “The prolific Permian Basin – the home of WTI – and the Eagle Ford shale are in Houston’s backyard. This new crude oil production, combined with movements of Domestic Light Sweet from the Cushing, Oklahoma, hub to Houston via the Seaway Pipeline, is creating a vibrant light, sweet spot market in Houston.”

Page 65 Page 65 Confidential - Not for Distribution
So Louisiana Market Access – 5 million barrels
Page 66 Page 66 Confidential - Not for Distribution
Some Storage Data from Above
About 126 MM barrels of U.S. and Canadian crude oil storage are visible to the Genscape system. More than 50% of the total, or 82 MM barrels of the total are in Cushing. The next largest storage hub is Hardesty at 17 MM, followed (in order of size) by Patoka, Edmonton, Midland, Wichita Falls, Colorado City, Hardisty-Caverh, Kerrobert, and Wink. The construction sites are tracked by Genscape’s aerial photography. In addition to Cushing, there are about 3 MM bbls under construction at Hardesty, and around 1 MM bbls each at Edmonton, Midland, and Patoka. There are several unit train terminals (100+ rail car loading facilities) being built in the Bakken to relieve pipeline transportation constraints in the region. (see A Perfect Storm in the Bakken.) There are only two places in the country that can handle receipt of these unit trains without breaking them up and losing the efficiencies of unit train transportation: St. James, LA (home of Light Louisiana Sweet) and Stroud near Cushing, OK (home of West Texas Intermediate and the CME/NYMEX futures delivery point). Few refineries have the available land necessary to build one of these facilities. [James Cairns, Vice President, Petroleum and Chemicals, CN Rail] Source: RBN

Page 67
Crystal Balls have always been broken – and the next resource play…
Confidential - Not for Distribution
Page 68 Page 68
These materials have been provided to you by Stone Bridge Energy Partners LLC (SBE) for discussion purposes only and may not be used or relied upon for any purpose other than as specifically contemplated by a definitive agreement with Stone Bridge Energy Partners LLC (SBE). In addition, these materials may not be disclosed, in whole or in part, or summarized or otherwise referred to except as agreed in writing by Stone Bridge Energy Partners LLC (SBE). Stone Bridge Energy Partners LLC (SBE) assumes no responsibility for independent verification of the information enclosed. Stone Bridge Energy Partners LLC (SBE) does not make any representation or warranty, express or implied, as to the accuracy or completeness of the information contained herein including any financial projections and shall not have any liability for the information contained in, or any omissions from, this presentation. These materials were designed for use by individuals and specific persons familiar with the business and the affairs of your company and Stone Bridge Energy Partners LLC (SBE) and assumes no obligation to update or otherwise revise these materials.
Confidential - Not for Distribution
Disclaimer

Page 70 Page 70 Confidential - Not for Distribution
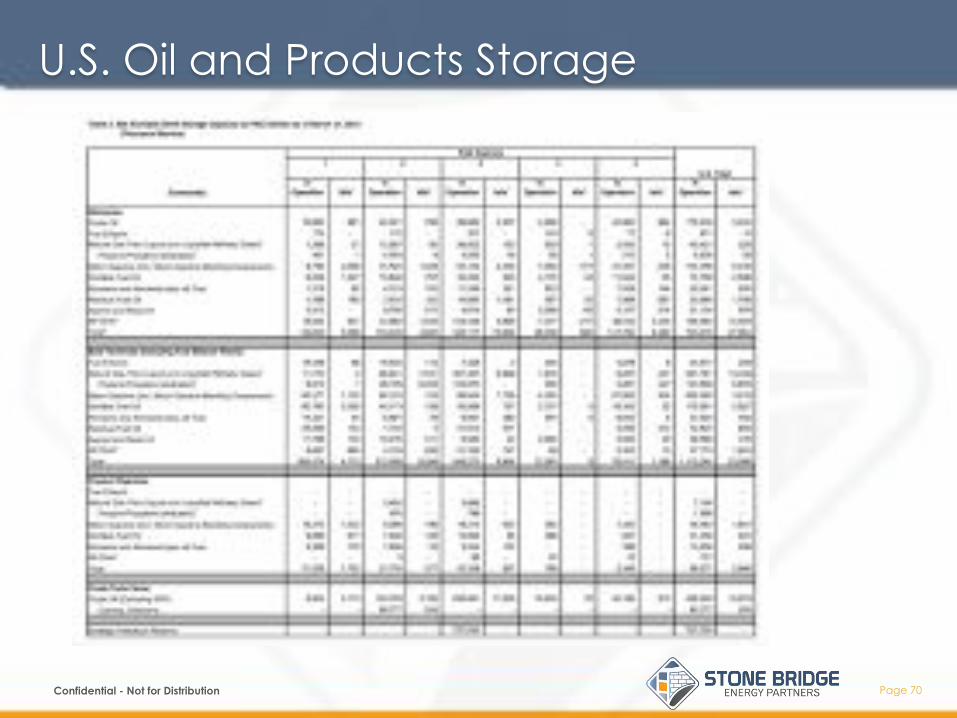
U.S. Oil and Products Storage

Page 71 Page 71 Confidential - Not for Distribution
SPR Storage Sites
Bryan Mound
Big Hill
West Hackberry
Bayou Choctaw

Page 72 Page 72 Confidential - Not for Distribution
U.S. Petroleum Balance Sheet, Week Ending 2/27/2015


