Top-Down Approach to MonitoringJuly 30, 2015

1996
2
Tivoli Software acquired by IBM
Patrol Software acquired by BMC
Ethan Galstad creates a simple MS-DOS application designed to "ping" Novell Netware servers
“HOW to monitor?” is the primary question


Shifting from “How?” to “What?”
4

5

Bottom-Up Approach
6
Network Servers Apps
Overall System Health

Problem #1: Inflation of Tools
7
Problem #2: Inflation of “Whats”
8
Problem #3: Inflation of Alerts
9

10

11
We’re trying to answer a simple question:
Is our system in a healthy state?

12
No Alerts
Many Alerts Unhealthy System≠
≠ Healthy System

13
Healthy System =A system that continuously generates value for its users under a well known set of KPIs

Top-Down Approach
14
KPIs UX
Overall System Health

15
KPIs UX
Overall System Health Network Servers Apps
Overall System Health
• Selective • Proactive
• Exhaustive • Reactive
vs
Bottom-UpTop-Down

A key performance indicator (KPI) is a business metric used to evaluate factors that are crucial to the success of an organization. KPIs differ per organization;
Definition of KPI
16
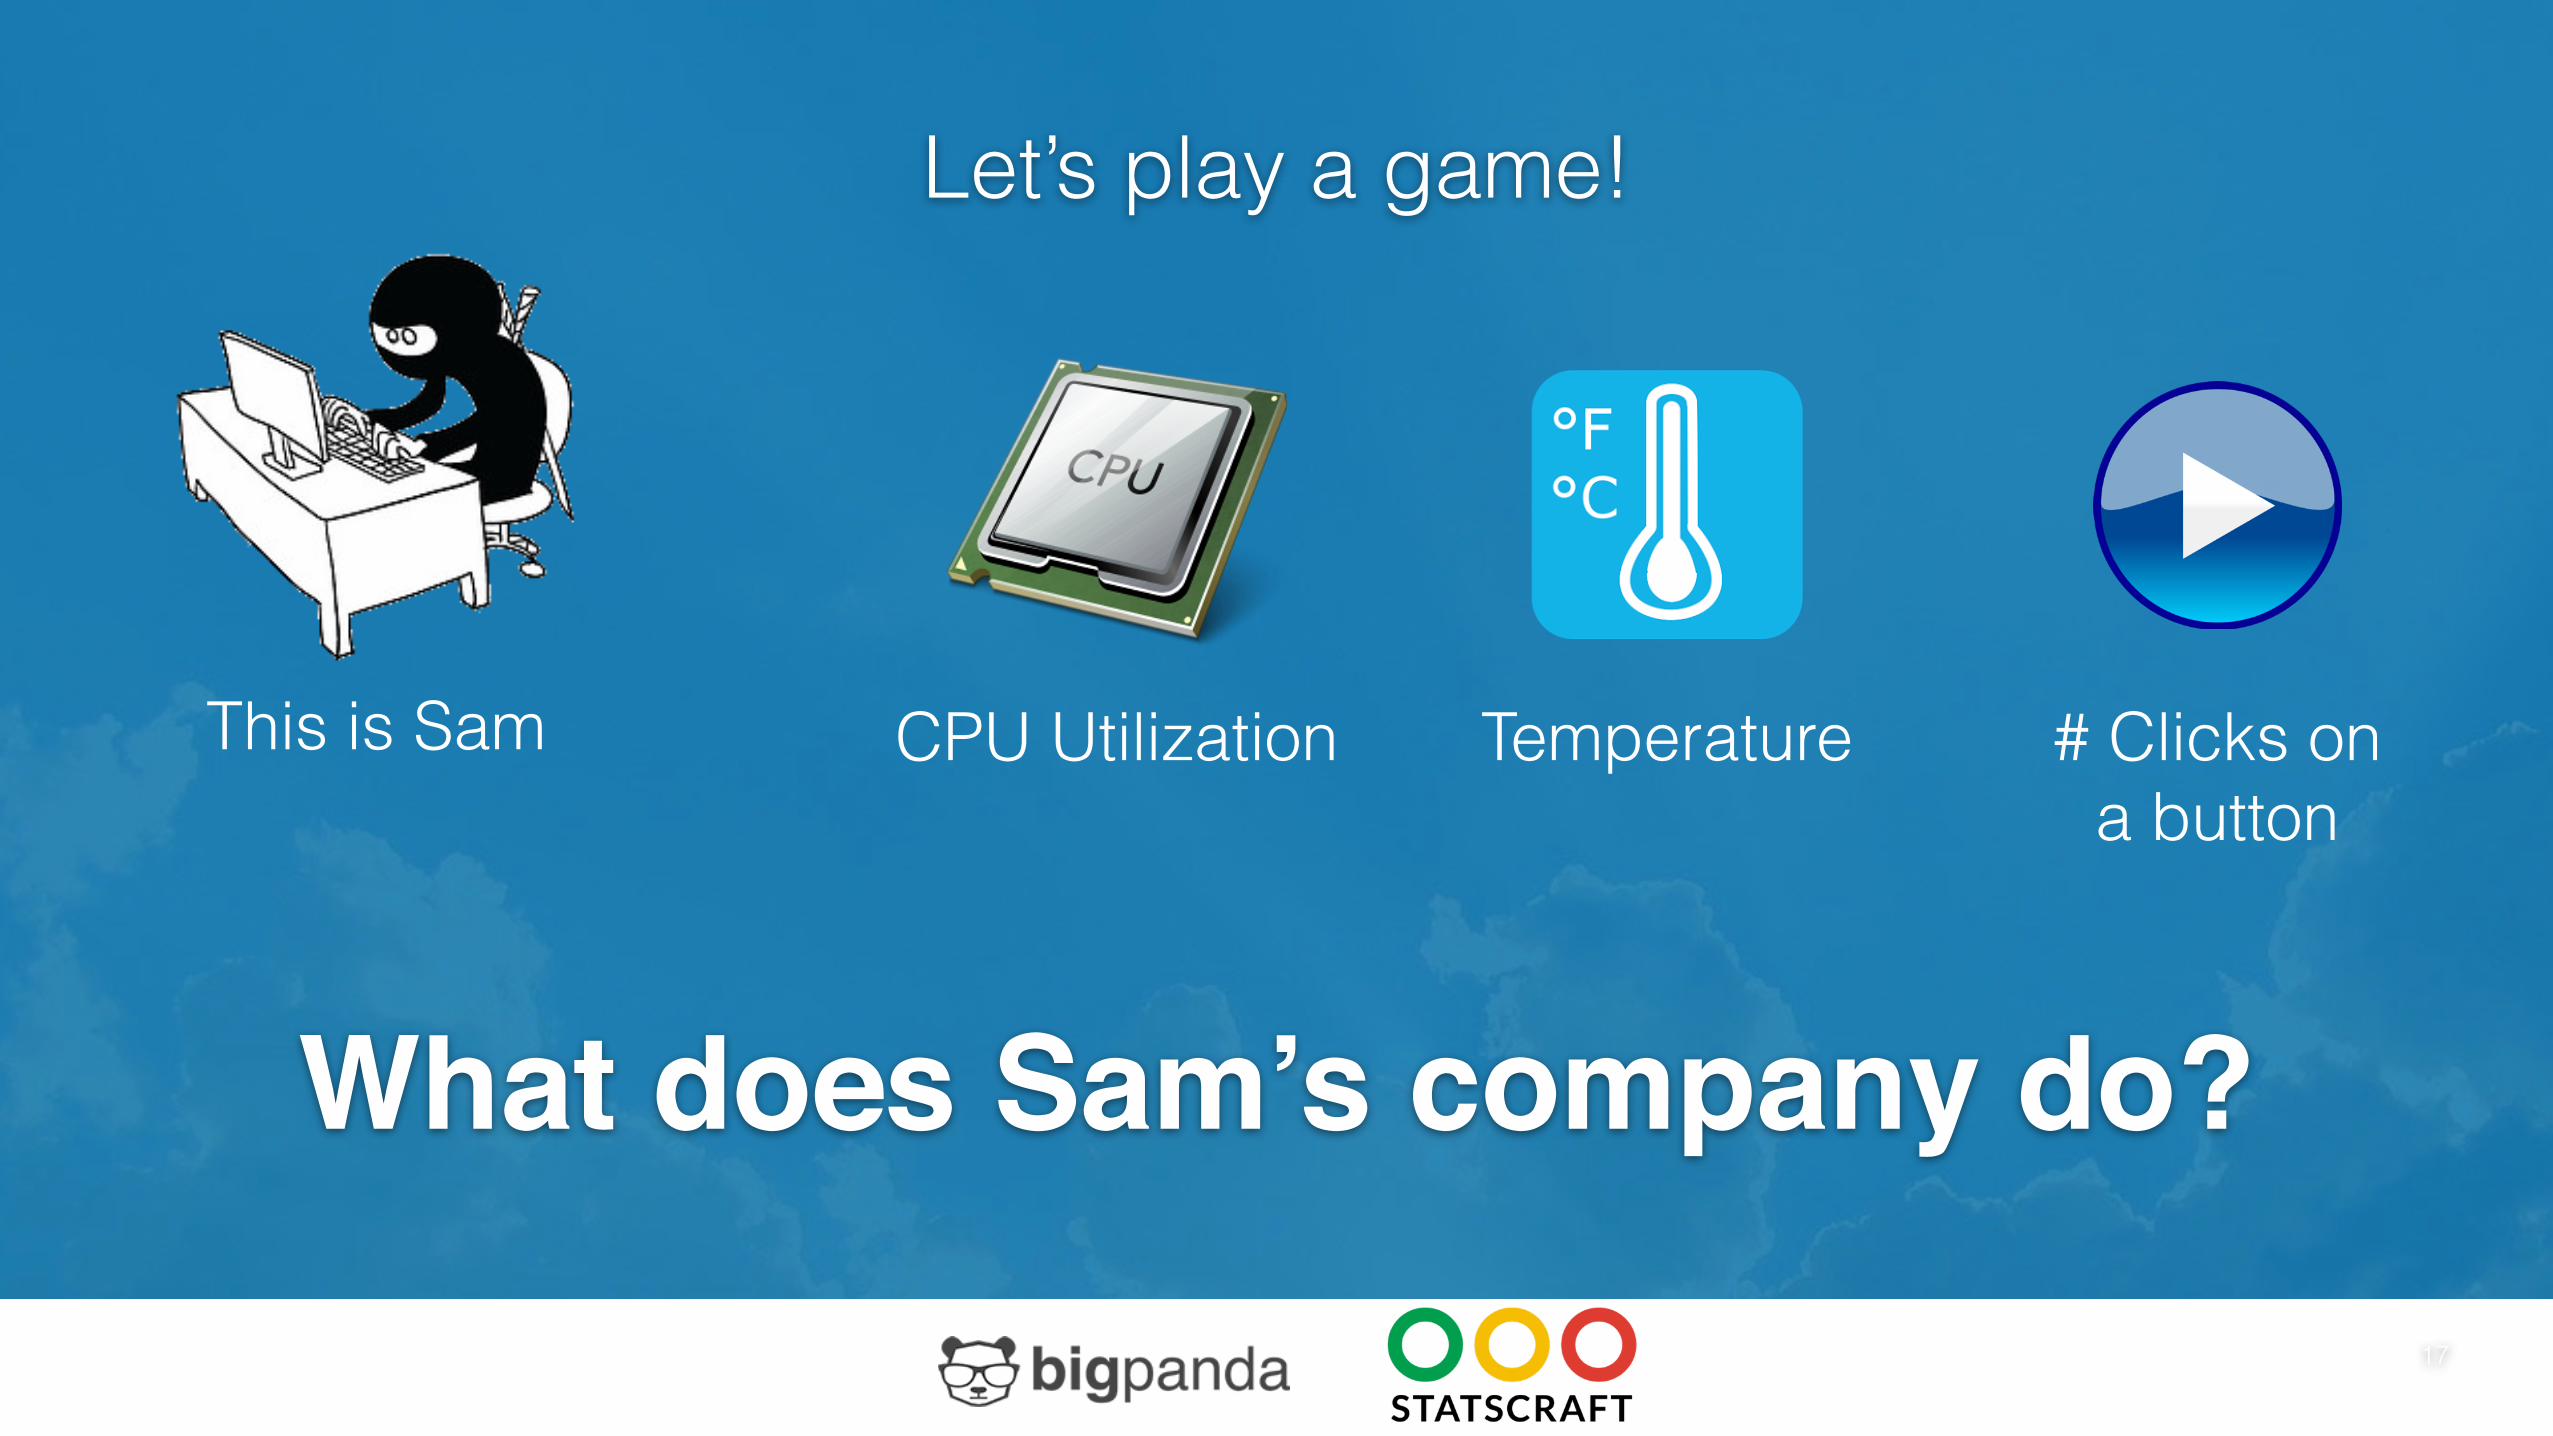
Let’s play a game!
17
CPU Utilization # Clicks on a button
TemperatureThis is Sam
What does Sam’s company do?

We sought out a single indicator that closely approximated our most important activity: viewing. We discovered that a server-side metric related to playback starts (the act of “clicking play”) had both a predictable pattern and fluctuated significantly when UI/device/server problems were happening. The Netflix streaming pulse was created.
The Pulse of Netflix
18
http://techblog.netflix.com/2015/02/sps-pulse-of-netflix-streaming.html
We named it “SPS” for “starts per second”.

Healthy SPS Pattern
19
http://techblog.netflix.com/2015/02/sps-pulse-of-netflix-streaming.html

Unhealthy SPS Pattern
20
http://techblog.netflix.com/2015/02/sps-pulse-of-netflix-streaming.html

What’s so special about SPS?
21
• SPS is easy to understand by all stakeholders
• One metric that covers different point of failure: server problems, device problems, etc.
• Most important: it’s a clear KPI that indicates when user experience is compromised

But what about root cause analysis?
22
KPIs UX
Overall System Health
Network Servers Apps
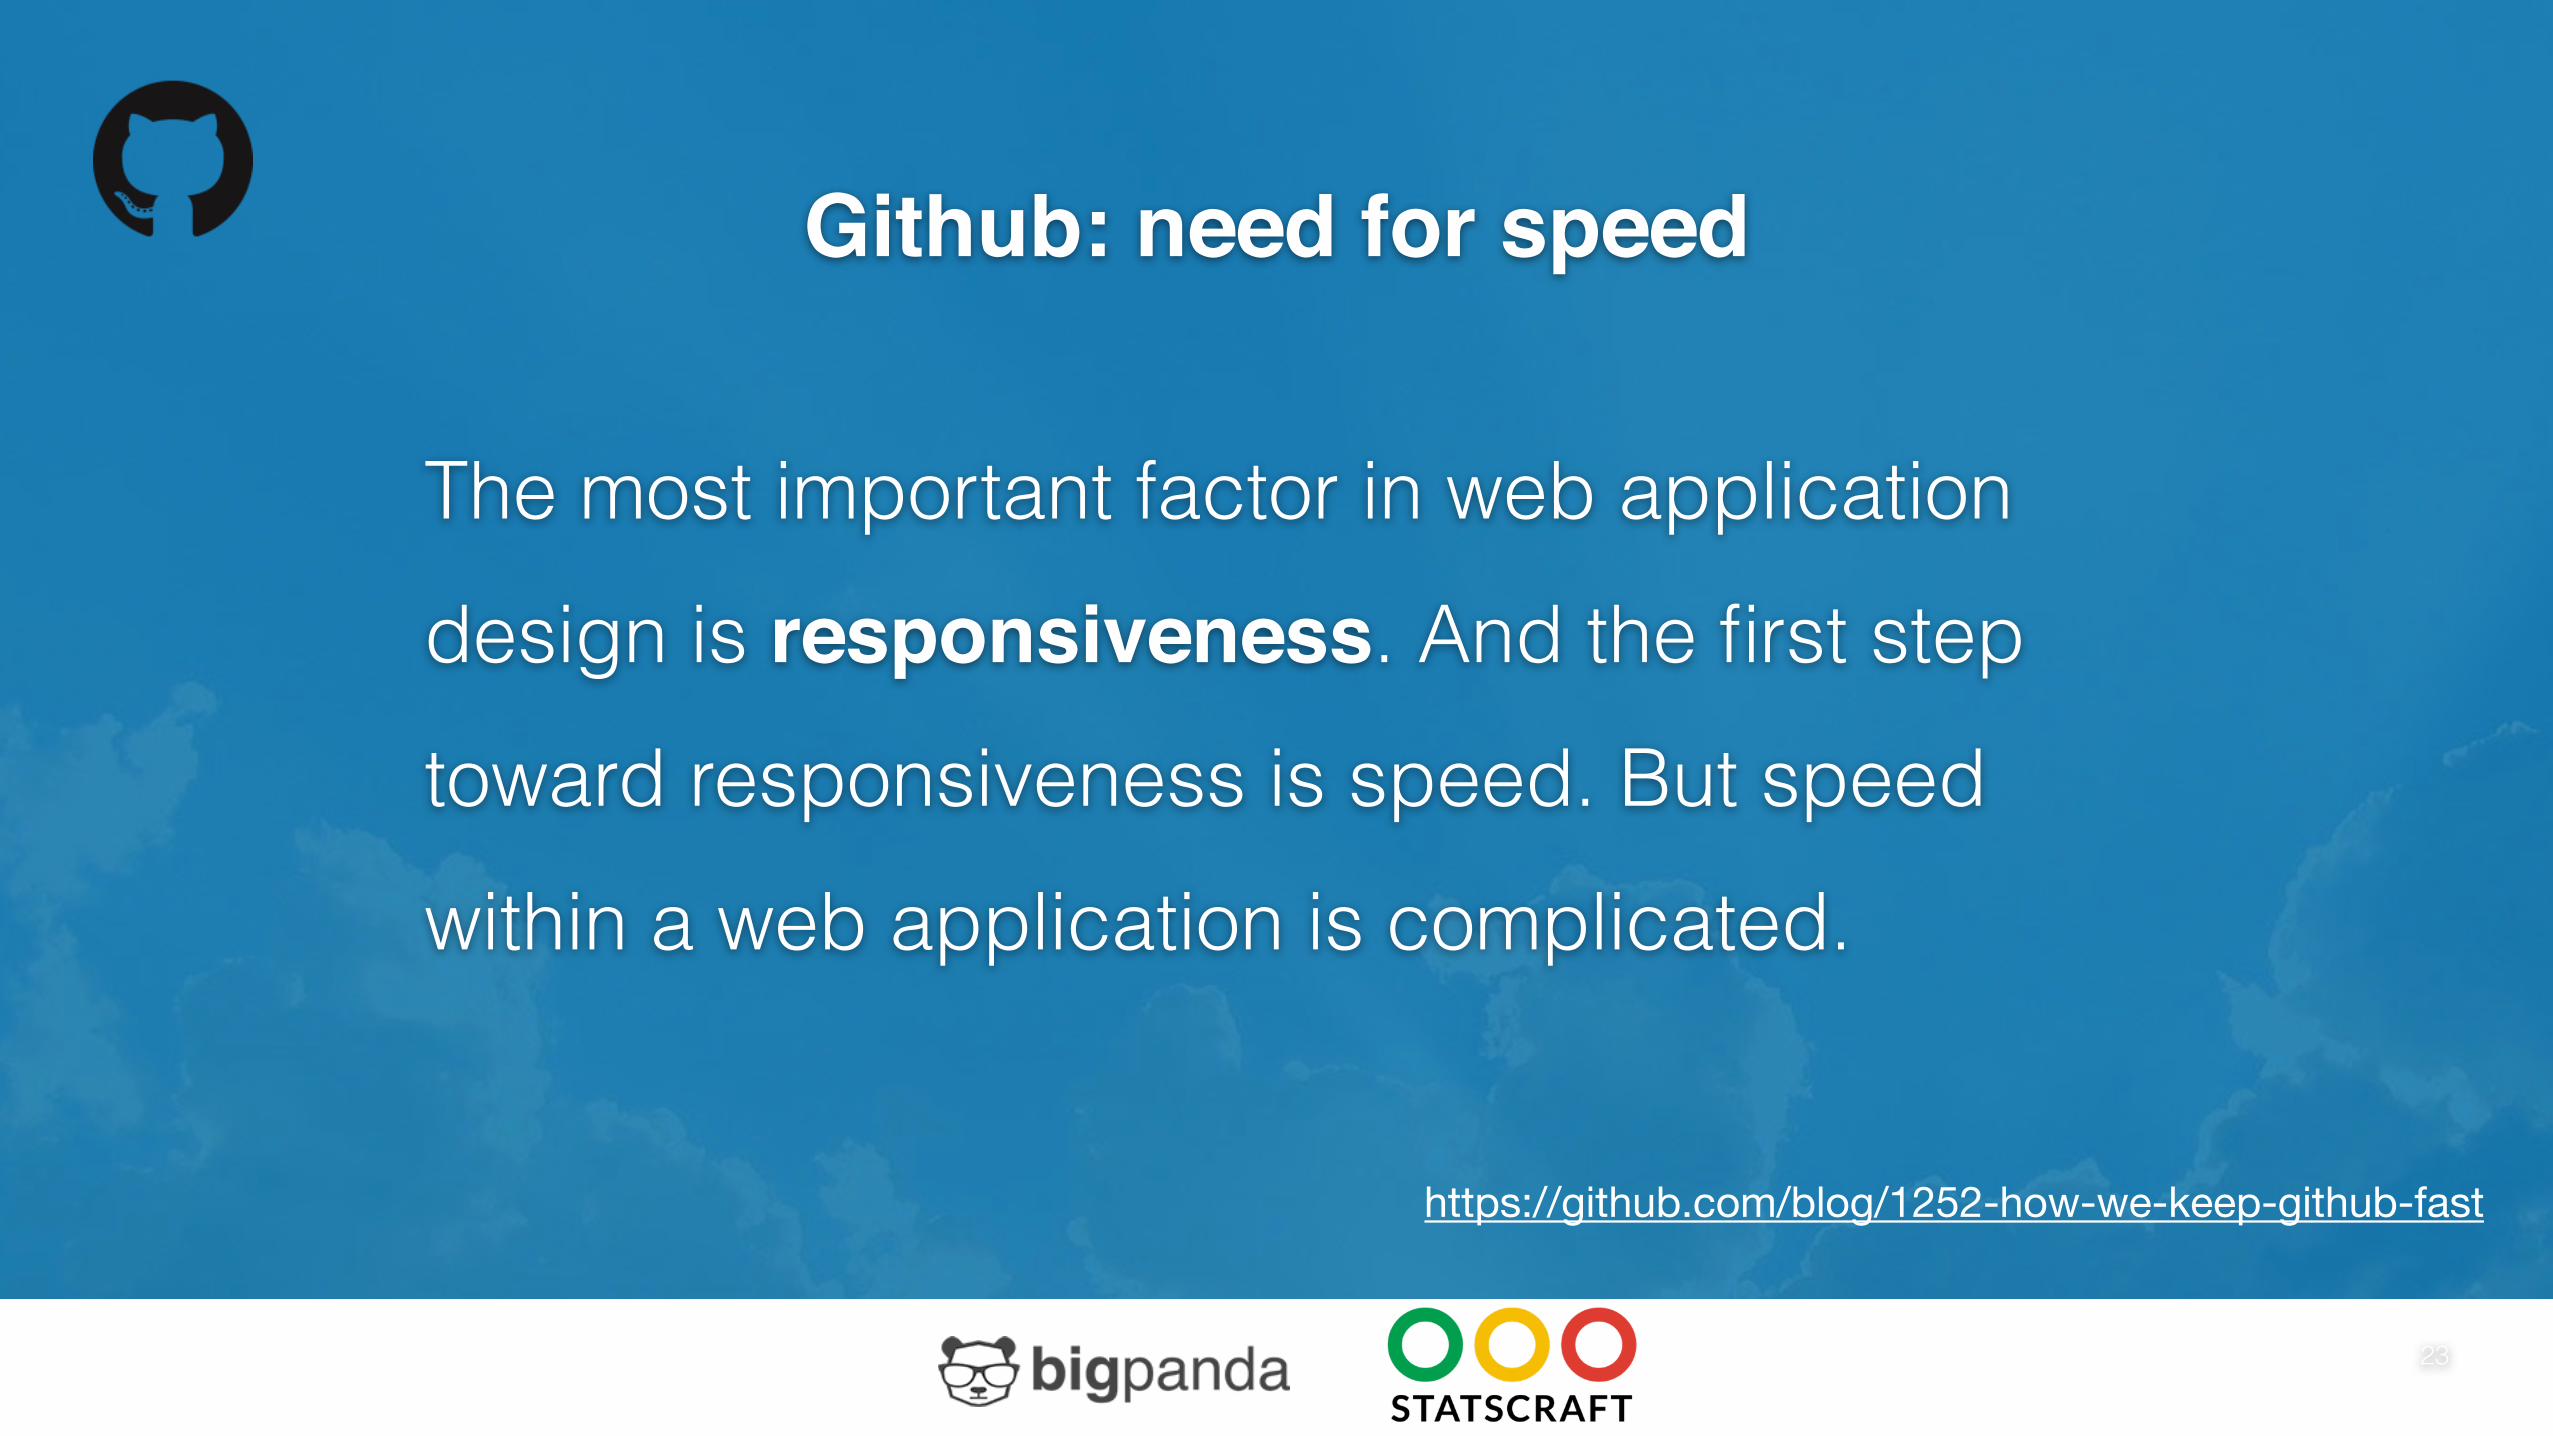
Github: need for speed
23
https://github.com/blog/1252-how-we-keep-github-fast
The most important factor in web application
design is responsiveness. And the first step
toward responsiveness is speed. But speed
within a web application is complicated.

Start from the Top:Response Times Dashboard
24
https://github.com/blog/1252-how-we-keep-github-fast
• Each row represented a different major component
• Clicking one of the rows allows you to dive in and see the mean, 98th percentile, and 99.9th percentile response times
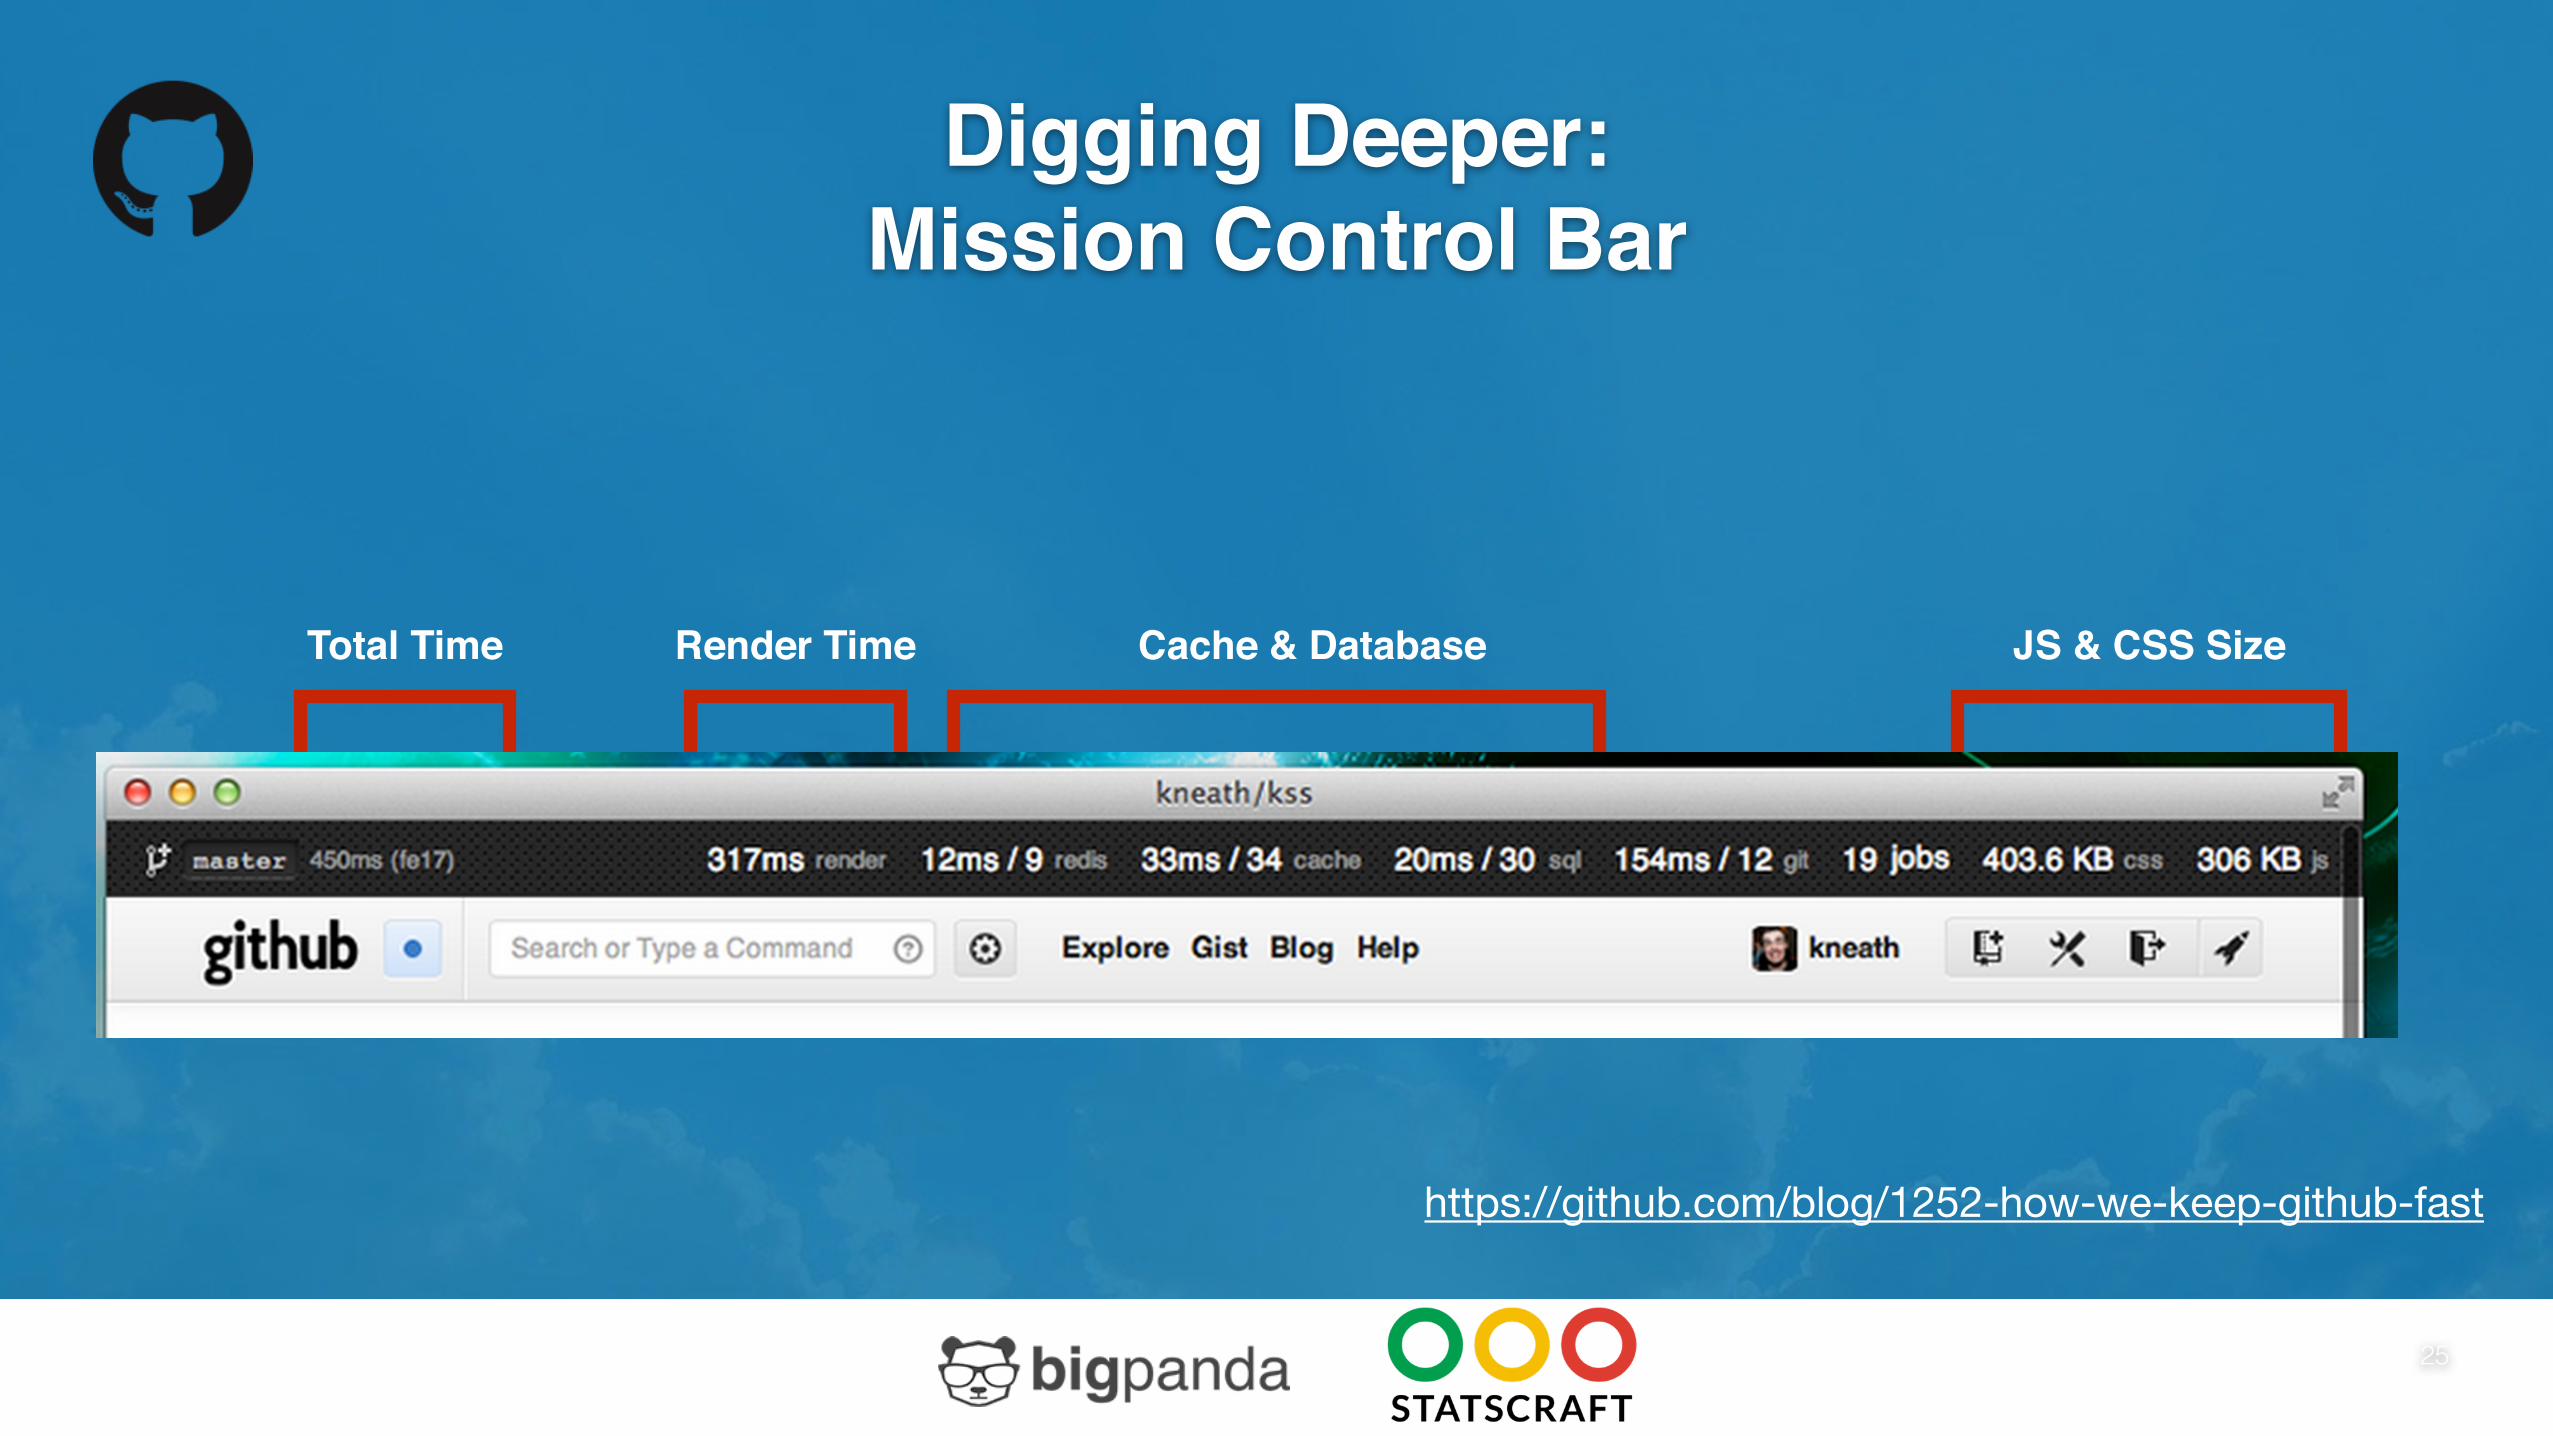
Digging Deeper:Mission Control Bar
25
https://github.com/blog/1252-how-we-keep-github-fast
Total Time Render Time Cache & Database JS & CSS Size
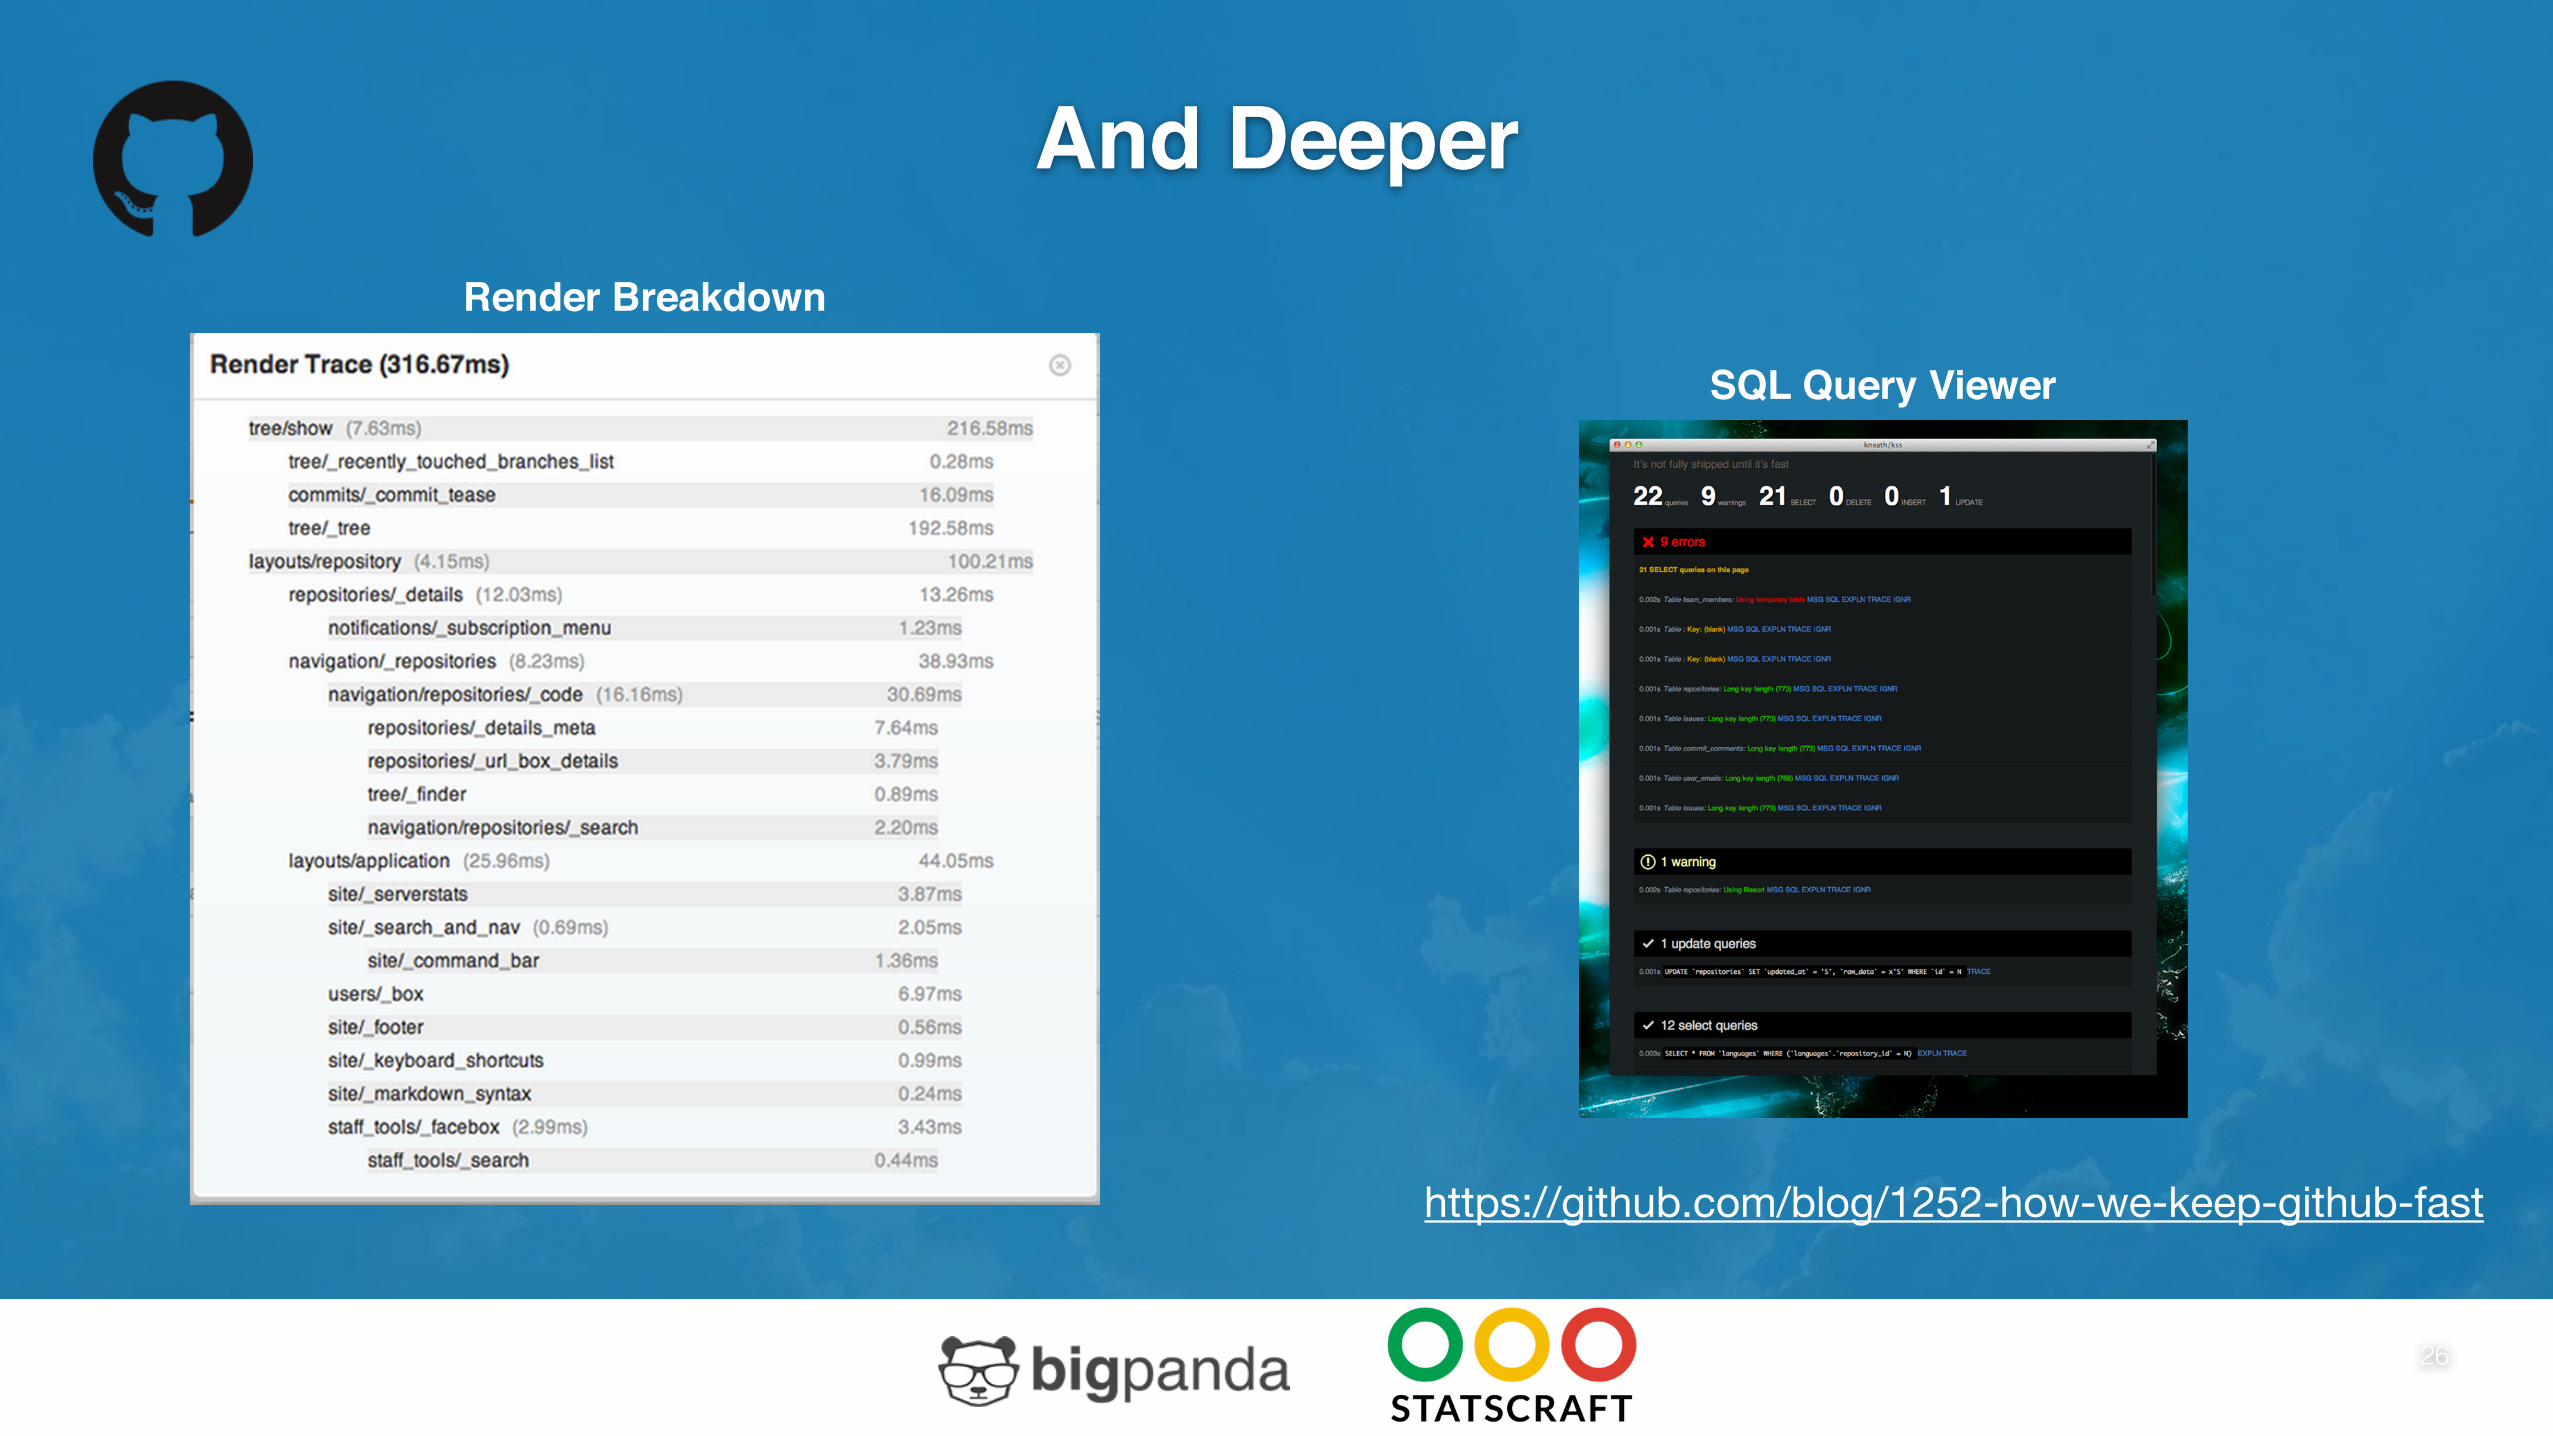
And Deeper
26
https://github.com/blog/1252-how-we-keep-github-fast
Render Breakdown
SQL Query Viewer

27
Why talk about BigPanda?
Because Pandas are awesome!
BigPanda
28
Because.. • We’re not Netflix or Github: growing startup (7 devs, 1 full-time Ops)
• We feel the pain!
• Our KPIs are easy to describe and understand (especially if you’re an Ops person)

BigPanda
29
As a unified dashboard on top of all your
monitoring systems, and eventually a single
point of truth for production incidents, our data
pipeline has to be reliable and fast.
KPI: Low data pipeline latency

Pipeline Latency Metric
30
• Metric are sent from within the apps
• Stored in Graphite
• Sum of all the average latencies of all alerts that went through the pipeline
• Monitored by Nagios
• Very good indicator of possible service outage
• Must have for detection of SLA violation
• Very good indicator of performance bottlenecks (can be broken down to sub-pipelines / specific organizations etc)
• Simple and high-level: easy to explain to non-technical stakeholders (e.g. sales)
Pipeline Latency Metric
31
• Bottom-up approach (“monitor all the things”) is easier to start with, but soon enough leads to alert fatigue and disorientation.
• Top-down approach requires thought and custom instrumentation, but keeps you focused on what’s important.
• High level metrics can be complemented by low level metrics. Trying to deduce the former from the latter is futile.
• Take advantage of the rich monitoring landscape, but as means to an end. Don’t let the tools dictate to you what you need to measure.
• Monitoring is - first of all - about your business.
TL;DR
32

33
Questions?

34
Thanks!


