
1
Statistical Commission Background document Forty-third session Available in English only 28 February – 2 March 2012 Item 3(i) of the provisional agenda Items for discussion and decision: Information and communication technology (ICT) statistics
Background document to the Report of the Partnership on Measuring ICT for Development on Information and communication technology statistics
Prepared by the Partnership on Measuring ICT for Development

2
Table of contents
1.Introduction ..................................................................................................................... 3
2.Revised and Extended Core List of ICT Indicators by the Partnership on Measuring ICT for Development ...................................................................................... 4
3.Availability of, and progress in measuring, the core ICT indicators by country and region ........................................................................................................................... 6
Table 3.1: Availability of the core ICT indicators on infrastructure 2009/2010 (as reported to ITU) .............................................................................................. 7
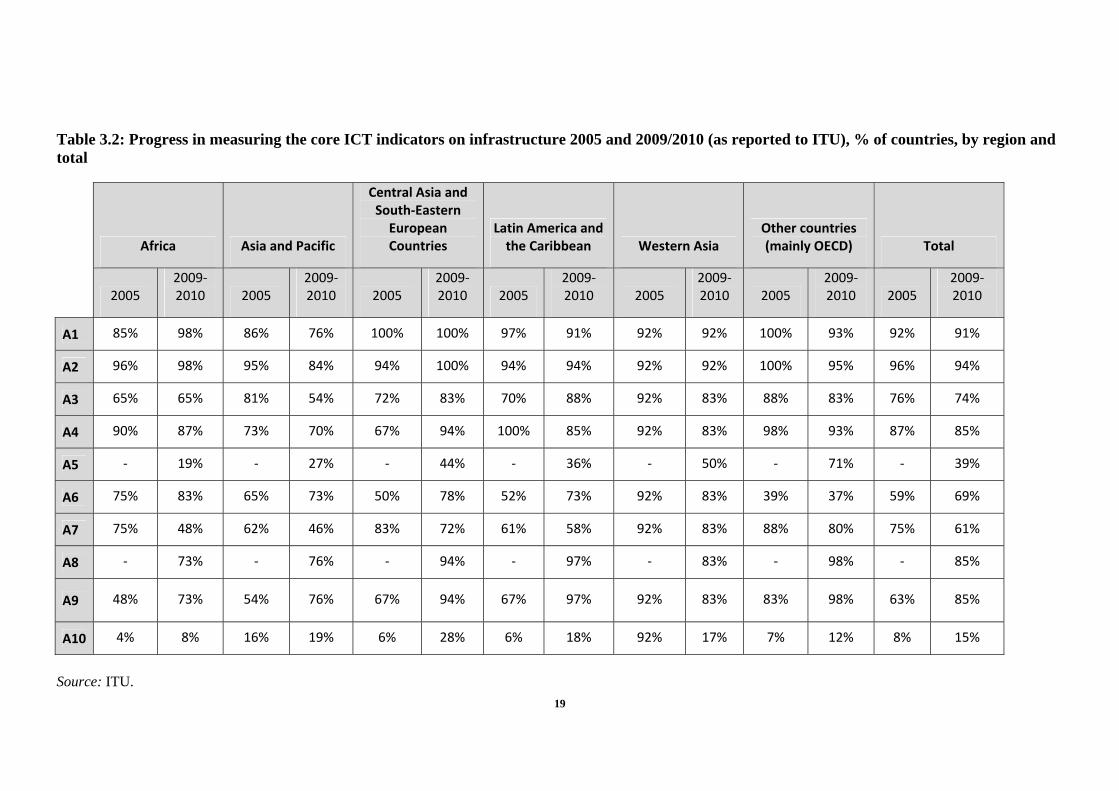
Table 3.2: Progress in measuring the core ICT indicators on infrastructure 2005 and 2009/2010 (as reported to ITU), % of countries, by region and total............ 19
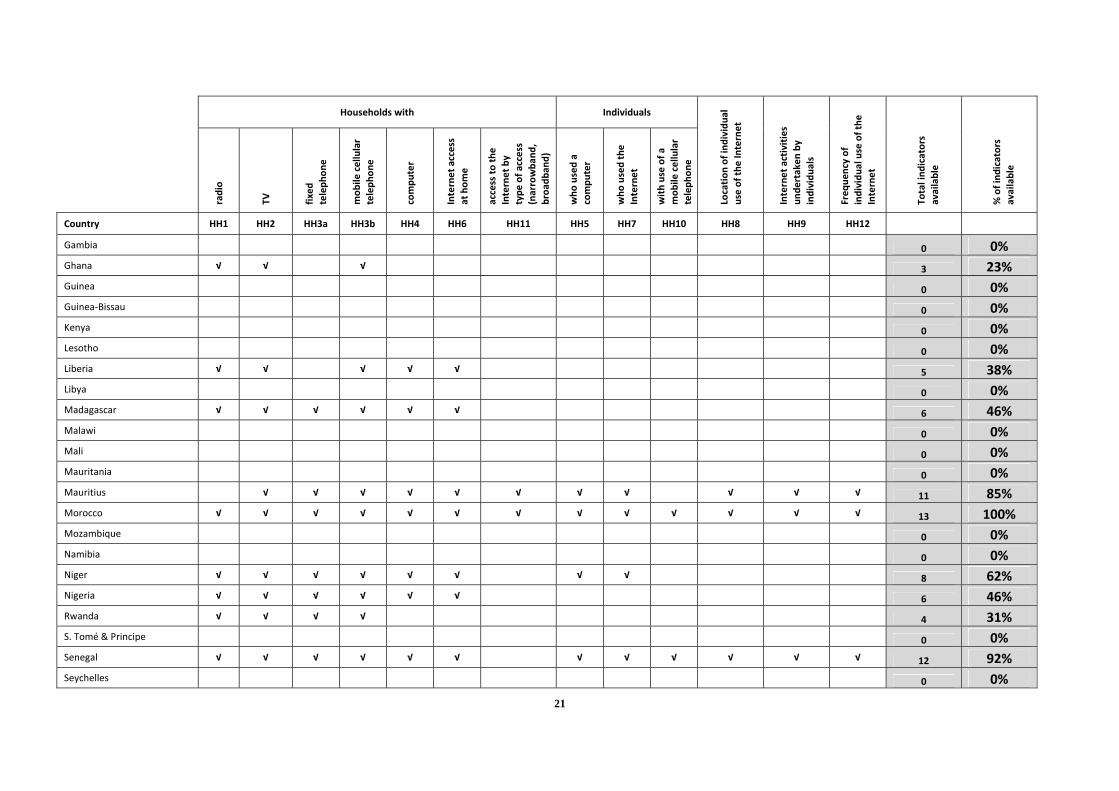
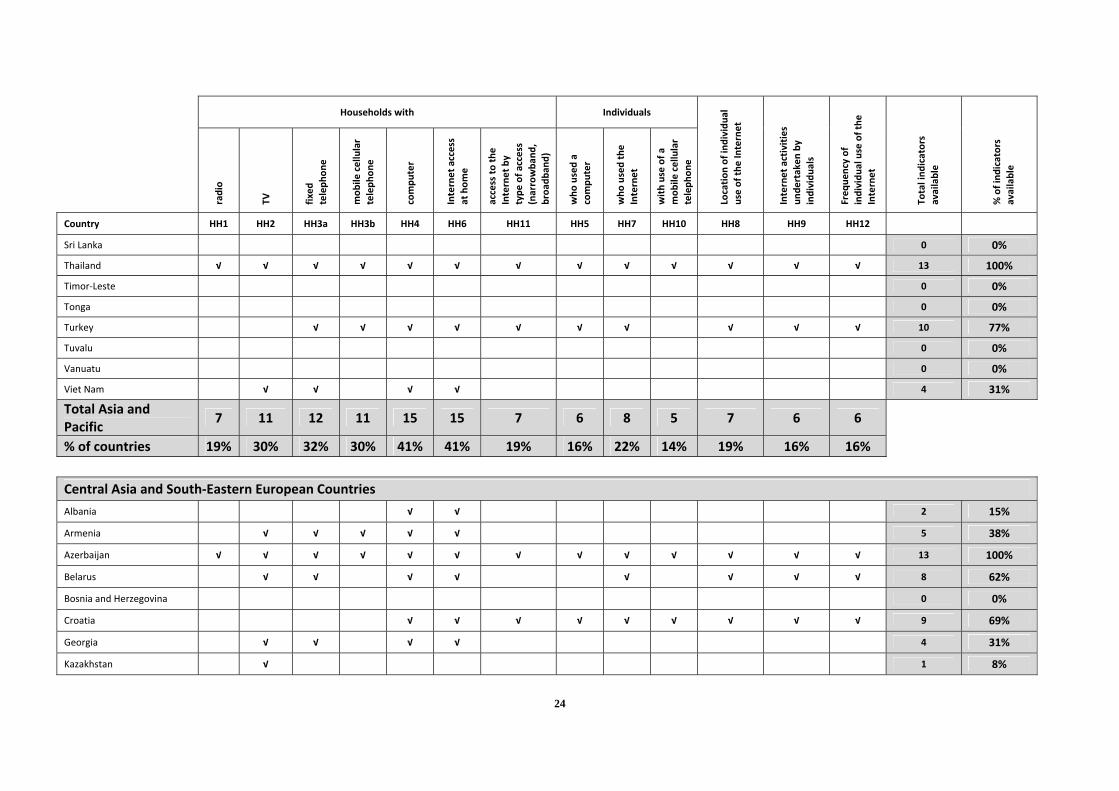
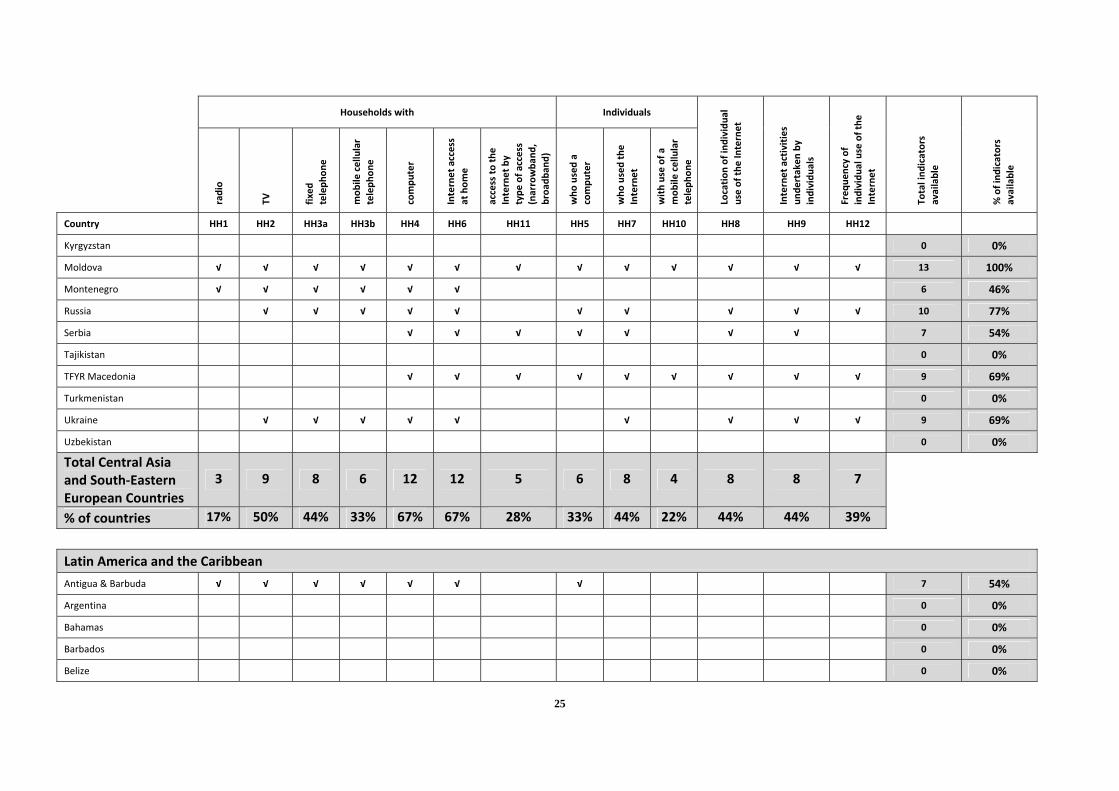
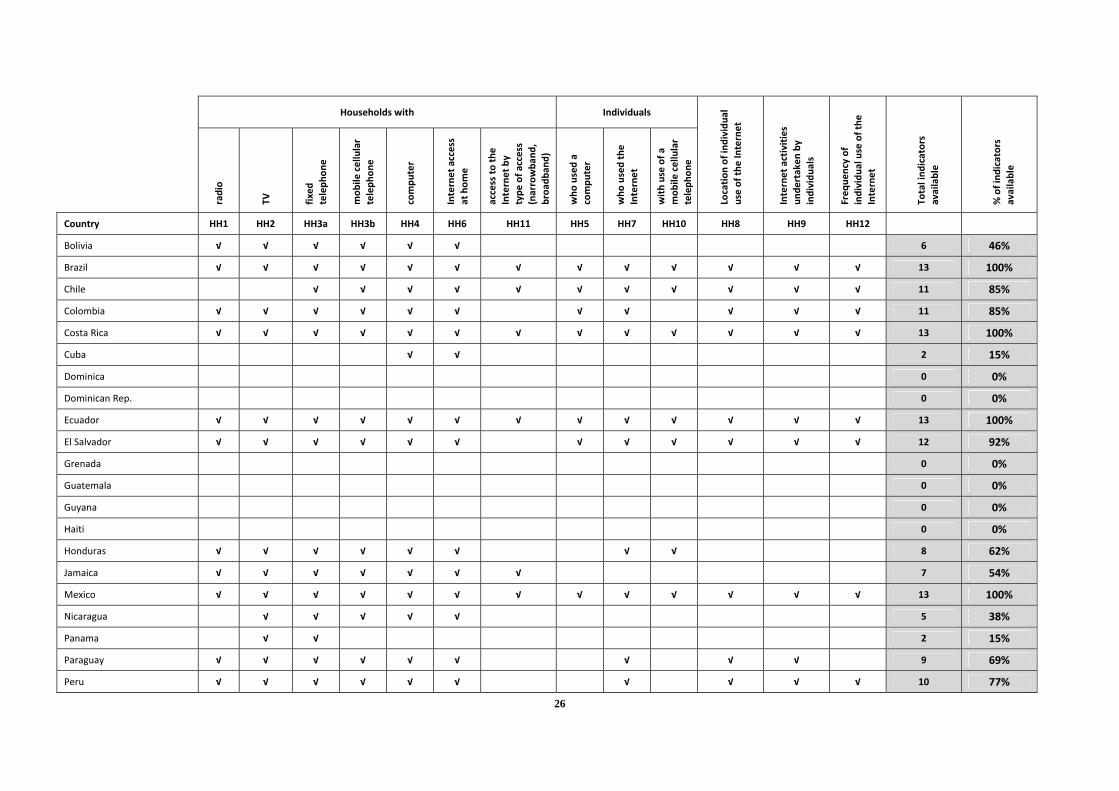
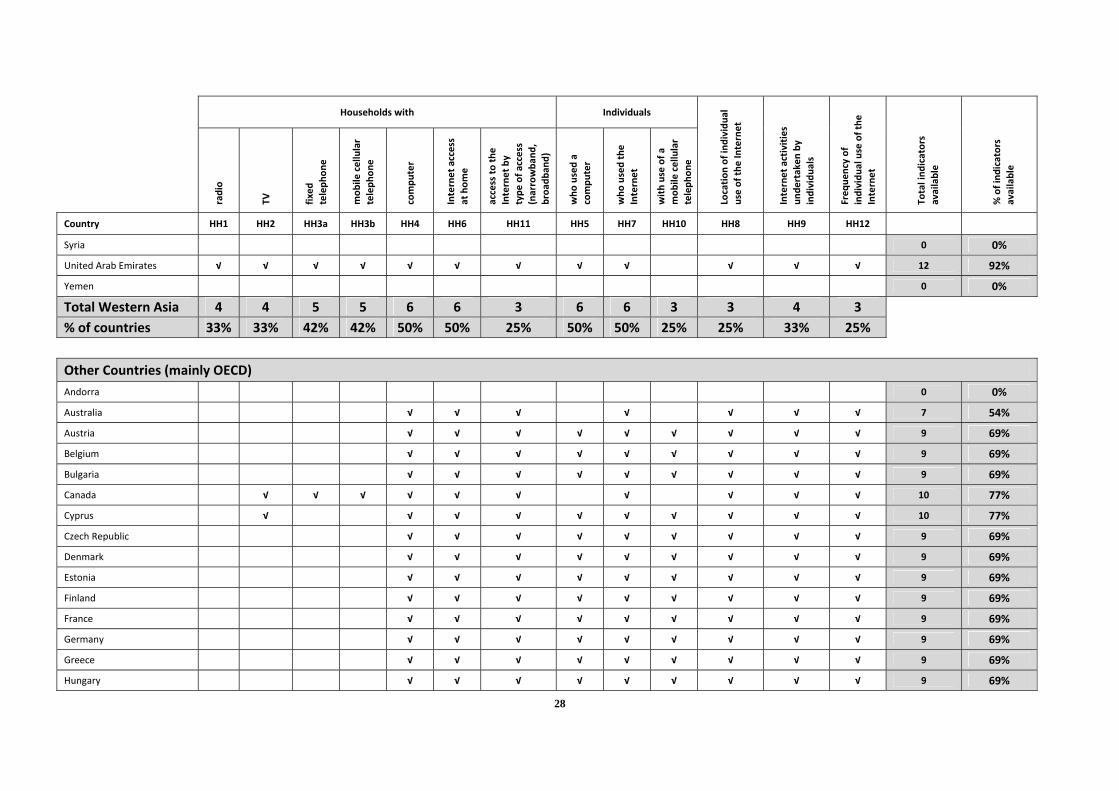
Table 3.3: Availability of the core indicators on household ICT access and individuals ICT use, 2008-2010 (as reported to ITU) ................................... 20
Table 3.4: Progress in measuring the core indicators on household ICT access and individuals ICT use, 2003-2005 and 2008-2010 (as reported to ITU), % of countries, by region and total ........................................................................ 31
Table 3.5: Availability of the core ICT indicators on ICT use by businesses and on the ICT sector, 2007-2009 (as reported to UNCTAD) .................................. 32
Table 3.6: Progress in measuring the core ICT indicators on ICT use by businesses and on the ICT sector (as reported to UNCTAD).......................................... 44
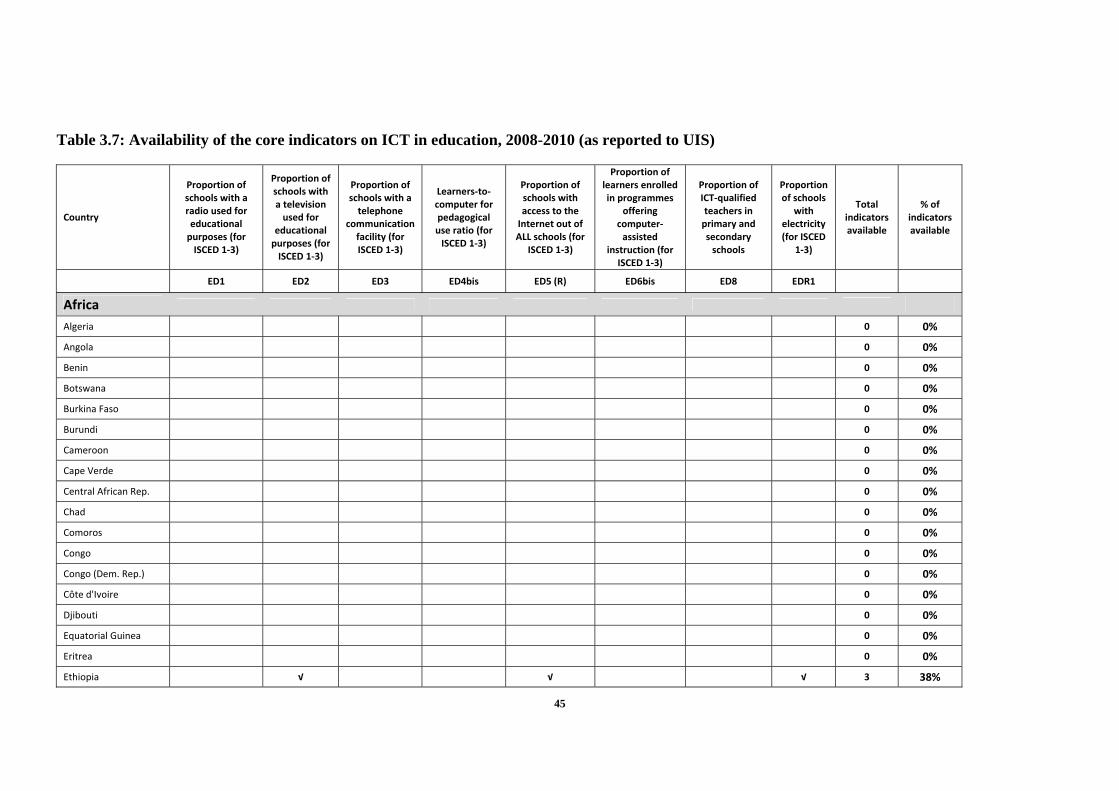
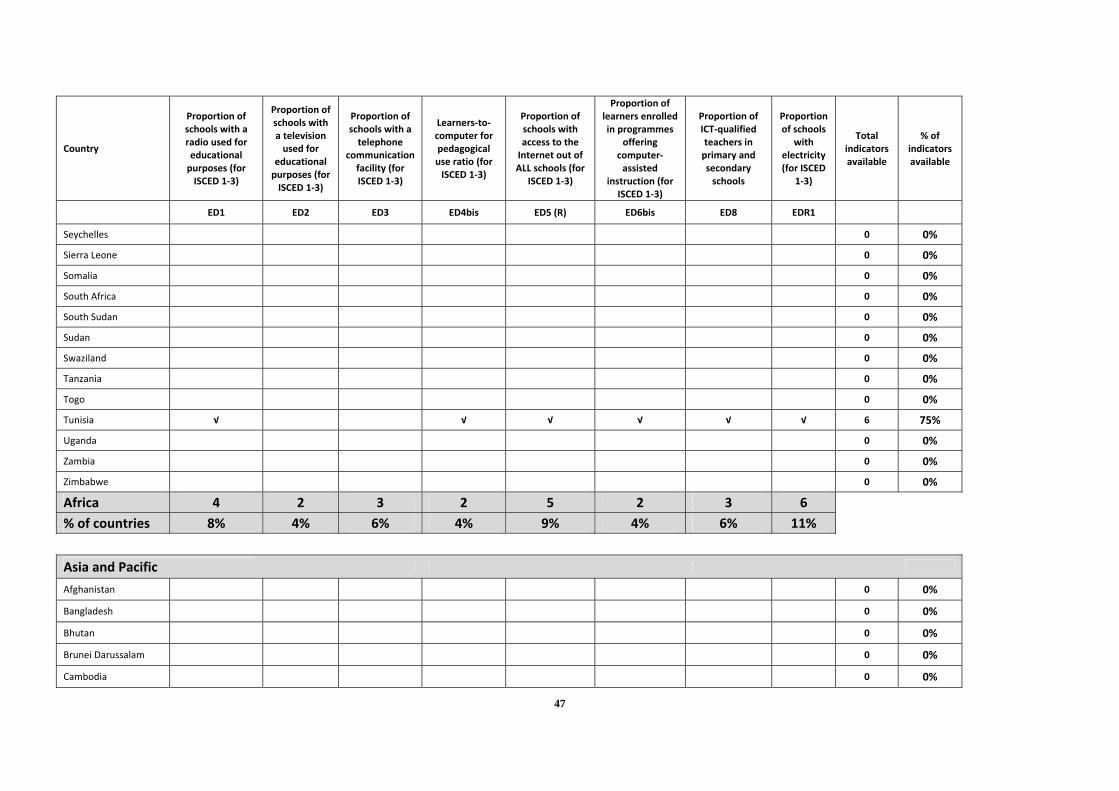
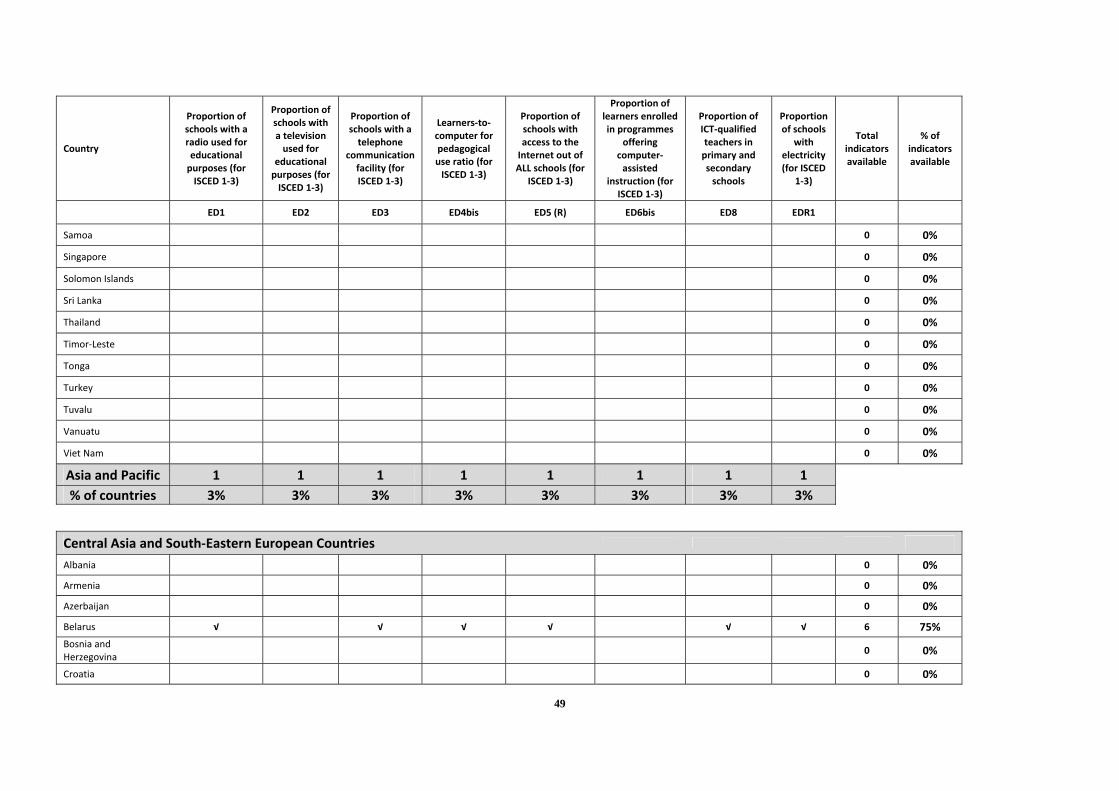
Table 3.7: Availability of the core indicators on ICT in education, 2008-2010 (as reported to UIS) ............................................................................................ 45

3
1. Introduction
The background document to the Report of the Partnership on Measuring ICT for Development on Information and communication technology statistics provides country-level information about the availability of the core ICT indicators developed by the Partnership on Measuring ICT for Development and shows progress in measuring the core ICT indicators between 2005 and 2010.

4
2. Revised and Extended Core List of ICT Indicators by the Partnership on Measuring ICT for Development
A1 Fixed telephone lines per 100 inhabitants
A2 Mobile cellular telephone subscriptions per 100 inhabitants
A3 Fixed Internet subscribers per 100 inhabitants
A4 Fixed broadband Internet subscribers per 100 inhabitants
A5 Mobile broadband subscriptions per 100 inhabitants
A6 International Internet bandwidth per inhabitant (bits/second/inhabitant)
A7 Percentage of the population covered by a mobile cellular telephone network
A8 Fixed broadband Internet access tariffs per month in US$, and as a percentage of monthly per capita income
A9 Mobile cellular telephone prepaid tariffs per month in US$, and as a percentage of monthly per capita income
A10 Percentage of localities with public Internet access centres (PIACs)
HH1 Proportion of households with a radio
HH2 Proportion of households with a TV
HH3 Proportion of households with telephone
HH4 Proportion of households with a computer
HH5 Proportion of individuals who used a computer in the last 12 months
HH6 Proportion of households with Internet access
HH7 Proportion of individuals who used the Internet in the last 12 months
HH8 Location of individual use of the Internet in the last 12 months
HH9 Internet activities undertaken by individuals in the last 12 months
HH10 Proportion of individuals who used a mobile cellular telephone in the last 12 months
HH11 Proportion of households with access to the Internet by type of access
HH12 Frequency of individual use of the Internet in the last 12 months
B1 Proportion of businesses using computer
B2 Proportion of persons employed routinely using computer
B3 Proportion of businesses using the Internet
B4 Proportion of persons employed routinely using the Internet
B5 Proportion of businesses with a web presence
B6 Proportion of businesses with an intranet
B7 Proportion of businesses receiving orders over the Internet

5
B8 Proportion of businesses placing orders over the Internet
B9 Proportion of businesses using the Internet by type of access
B10 Proportion of businesses with a local area network (LAN)
B11 Proportion of businesses with an extranet
B12 Proportion of businesses using the Internet by type of activity
ICT1 Proportion of total business sector workforce involved in the ICT sector
ICT2 ICT sector share of gross value added
ICT3 ICT goods imports as a percentage of total imports
ICT4 ICT goods exports as a percentage of total export
ED1 Proportion of schools with a radio used for educational purposes
ED2 Proportion of schools with a television used for educational purposes
ED3 Proportion of schools with a telephone communication facility
ED4 Learners-to-computer ratio in schools with computer-assisted instruction
ED5 Proportion of schools with Internet access by type of access
ED6 Proportion of learners who have access to the Internet at school
ED7 Proportion of learners enrolled at the post-secondary level in ICT-related fields
ED8 Proportion of ICT-qualified teachers in schools
EG1 Proportion of persons employed in central government organizations routinely using computers
EG2 Proportion of persons employed in central government organizations routinely using the Internet
EG3 Proportion of central government organizations with a Local Area Network (LAN)
EG4 Proportion of central government organizations with an intranet
EG5 Proportion of central government organizations with Internet access, by type of access
EG6 Proportion of central government organizations with a web presence
EG7 Selected Internet-based online services available to citizens, by level of sophistication of service

6
3. Availability of, and progress in measuring, the core ICT indicators by country and region

7
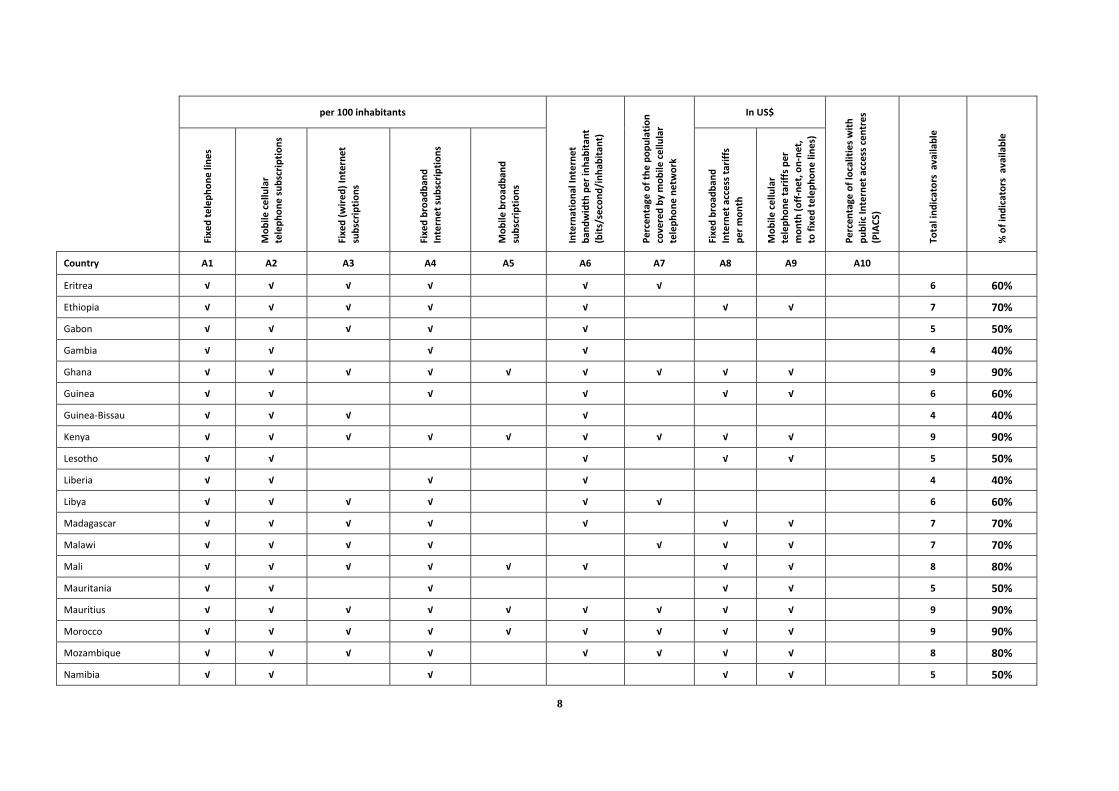
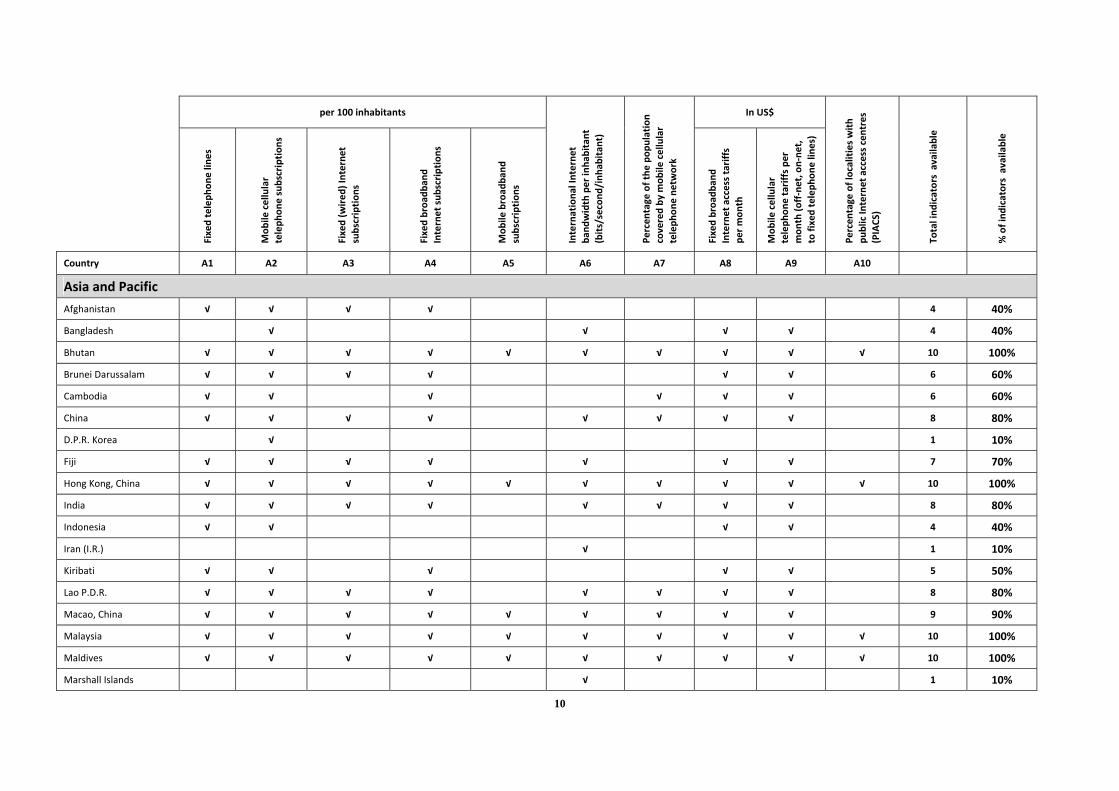
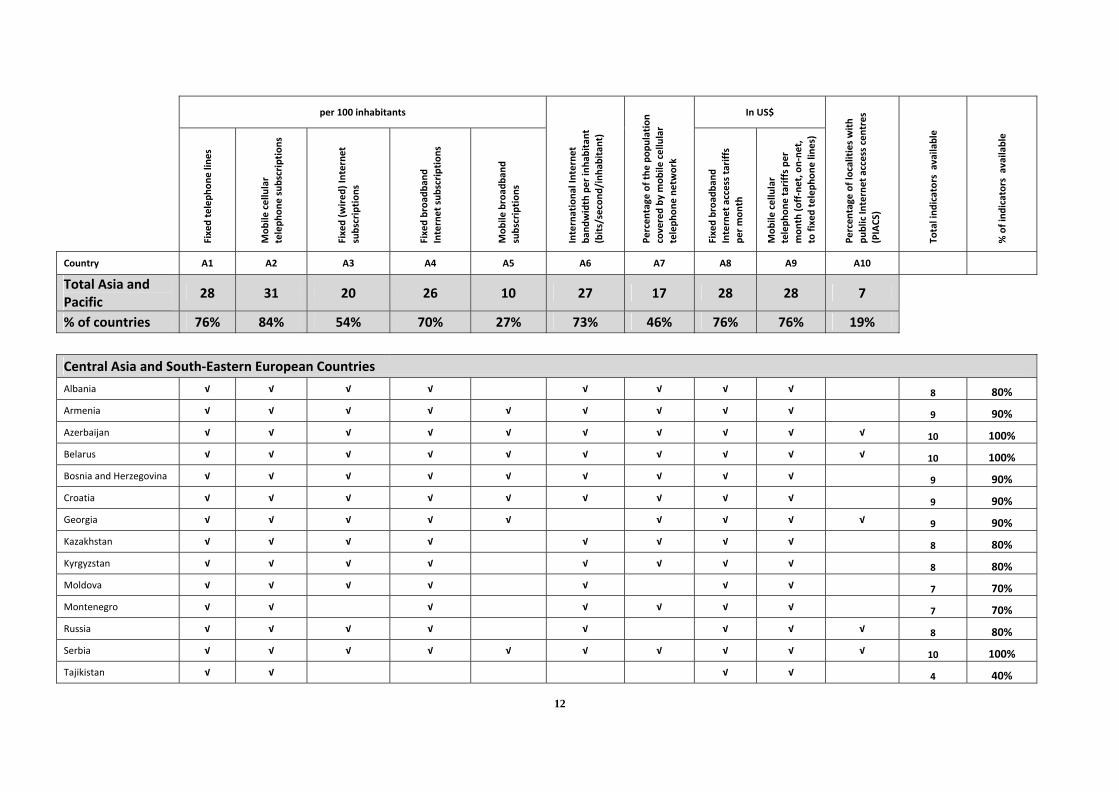
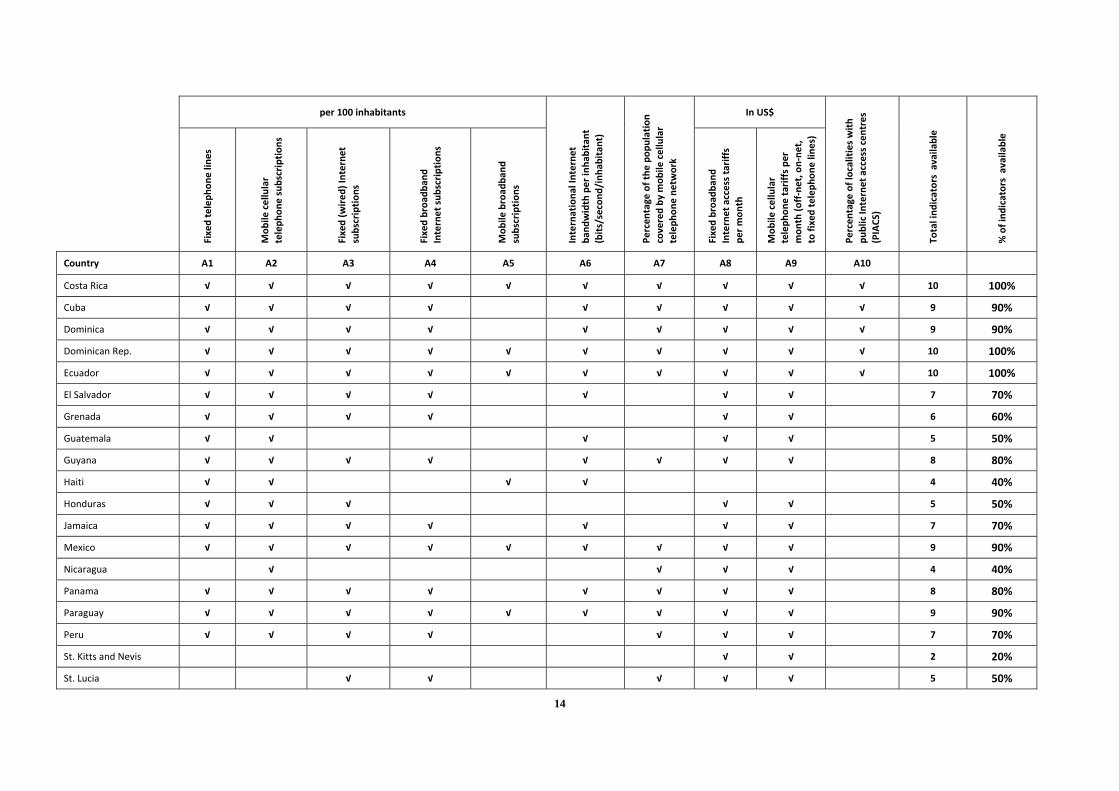
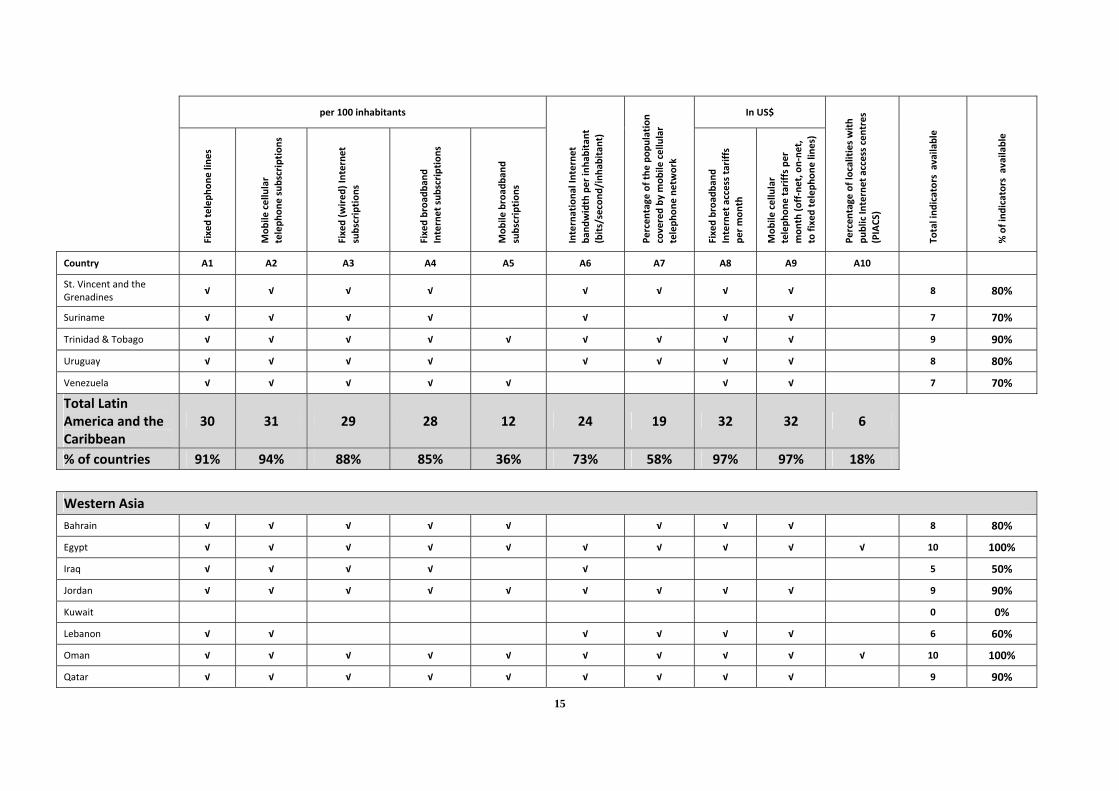
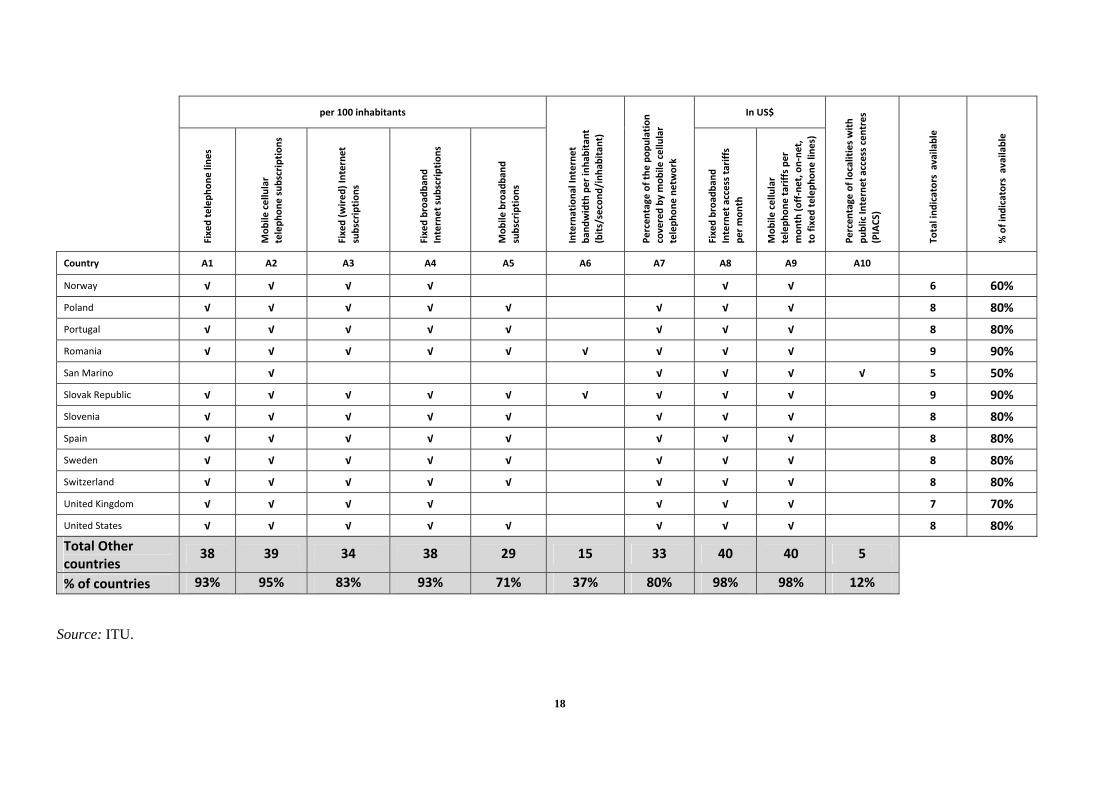
Table 3.1: Availability of the core ICT indicators on infrastructure 2009/2010 (as reported to ITU)
per 100 inhabitants In US$
Fixed teleph
one lin
es
Mob
ile cellular
teleph
one subscription
s
Fixed (w
ired
) Interne
t subscription
s
Fixed broa
dban
d Internet sub
scriptions
Mob
ile broad
band
subscription
s
Internationa
l Interne
t ba
ndwidth per in
habitant
(bits/second
/inh
abitan
t)
Percen
tage
of the
pop
ulation
covered by
mob
ile cellular
teleph
one ne
twork
Fixed broa
dban
d Internet access tariffs
per mon
th
Mob
ile cellular
teleph
one tariffs pe
r mon
th (o
ff‐net, o
n‐ne
t,
to fixed teleph
one lin
es)
Percen
tage
of localities with
public In
ternet access centres
(PIACS)
Total ind
icators available
% of ind
icators available
Country A1 A2 A3 A4 A5 A6 A7 A8 A9 A10
Africa Algeria √ √ √ √ √ √ 6 60%
Angola √ √ √ √ √ 5 50%
Benin √ √ √ √ √ √ √ 7 70%
Botswana √ √ √ √ √ √ √ √ 8 80%
Burkina Faso √ √ √ √ √ √ √ 7 70%
Burundi √ √ √ √ √ √ 6 60%
Cameroon √ √ √ √ √ √ 6 60%
Cape Verde √ √ √ √ √ √ √ √ 8 80%
Central African Rep. √ √ √ √ √ 5 50%
Chad √ √ √ √ √ √ √ 7 70%
Comoros √ √ √ √ √ √ √ 7 70%
Congo √ √ √ 3 30%
Congo (Dem. Rep.) √ √ √ √ √ √ 6 60%
Côte d'Ivoire √ √ √ √ √ √ 6 60%
Djibouti √ √ √ √ √ √ √ √ √ √ 10 100%
Equatorial Guinea √ √ √ √ 4 40%
8
per 100 inhabitants In US$
Fixed teleph
one lin
es
Mob
ile cellular
teleph
one subscription
s
Fixed (w
ired
) Interne
t subscription
s
Fixed broa
dban
d Internet sub
scriptions
Mob
ile broad
band
subscription
s
Internationa
l Interne
t ba
ndwidth per in
habitant
(bits/second
/inh
abitan
t)
Percen
tage
of the
pop
ulation
covered by
mob
ile cellular
teleph
one ne
twork
Fixed broa
dban
d Internet access tariffs
per mon
th
Mob
ile cellular
teleph
one tariffs pe
r mon
th (o
ff‐net, o
n‐ne
t,
to fixed teleph
one lin
es)
Percen
tage
of localities with
public In
ternet access centres
(PIACS)
Total ind
icators available
% of ind
icators available
Country A1 A2 A3 A4 A5 A6 A7 A8 A9 A10
Eritrea √ √ √ √ √ √ 6 60%
Ethiopia √ √ √ √ √ √ √ 7 70%
Gabon √ √ √ √ √ 5 50%
Gambia √ √ √ √ 4 40%
Ghana √ √ √ √ √ √ √ √ √ 9 90%
Guinea √ √ √ √ √ √ 6 60%
Guinea‐Bissau √ √ √ √ 4 40%
Kenya √ √ √ √ √ √ √ √ √ 9 90%
Lesotho √ √ √ √ √ 5 50%
Liberia √ √ √ √ 4 40%
Libya √ √ √ √ √ √ 6 60%
Madagascar √ √ √ √ √ √ √ 7 70%
Malawi √ √ √ √ √ √ √ 7 70%
Mali √ √ √ √ √ √ √ √ 8 80%
Mauritania √ √ √ √ √ 5 50%
Mauritius √ √ √ √ √ √ √ √ √ 9 90%
Morocco √ √ √ √ √ √ √ √ √ 9 90%
Mozambique √ √ √ √ √ √ √ √ 8 80%
Namibia √ √ √ √ √ 5 50%

9
per 100 inhabitants In US$
Fixed teleph
one lin
es
Mob
ile cellular
teleph
one subscription
s
Fixed (w
ired
) Interne
t subscription
s
Fixed broa
dban
d Internet sub
scriptions
Mob
ile broad
band
subscription
s
Internationa
l Interne
t ba
ndwidth per in
habitant
(bits/second
/inh
abitan
t)
Percen
tage
of the
pop
ulation
covered by
mob
ile cellular
teleph
one ne
twork
Fixed broa
dban
d Internet access tariffs
per mon
th
Mob
ile cellular
teleph
one tariffs pe
r mon
th (o
ff‐net, o
n‐ne
t,
to fixed teleph
one lin
es)
Percen
tage
of localities with
public In
ternet access centres
(PIACS)
Total ind
icators available
% of ind
icators available
Country A1 A2 A3 A4 A5 A6 A7 A8 A9 A10
Niger √ √ √ √ √ 5 50%
Nigeria √ √ √ √ √ √ √ 7 70%
Rwanda √ √ √ √ √ √ √ √ 8 80%
S. Tomé & Principe √ √ √ √ √ √ 6 60%
Senegal √ √ √ √ √ √ √ √ 8 80%
Seychelles √ √ √ √ √ √ √ √ √ 9 90%
Sierra Leone √ √ √ 3 30%
Somalia 0 0%
South Africa √ √ √ √ √ √ 6 60%
Sudan √ √ √ √ √ 5 50%
Swaziland √ √ √ √ √ √ √ √ 8 80%
Tanzania √ √ √ √ √ √ √ √ √ 9 90%
Togo √ √ √ √ √ √ √ √ 8 80%
Tunisia √ √ √ √ √ √ √ √ 8 80%
Uganda √ √ √ √ √ √ √ √ 8 80%
Zambia √ √ √ √ √ √ √ √ 8 80%
Zimbabwe √ √ √ √ √ √ √ √ √ 9 90%
Total Africa 51 51 34 45 10 43 25 38 38 4
% of countries 98% 98% 65% 87% 19% 83% 48% 73% 73% 8%
10
per 100 inhabitants In US$
Fixed teleph
one lin
es
Mob
ile cellular
teleph
one subscription
s
Fixed (w
ired
) Interne
t subscription
s
Fixed broa
dban
d Internet sub
scriptions
Mob
ile broad
band
subscription
s
Internationa
l Interne
t ba
ndwidth per in
habitant
(bits/second
/inh
abitan
t)
Percen
tage
of the
pop
ulation
covered by
mob
ile cellular
teleph
one ne
twork
Fixed broa
dban
d Internet access tariffs
per mon
th
Mob
ile cellular
teleph
one tariffs pe
r mon
th (o
ff‐net, o
n‐ne
t,
to fixed teleph
one lin
es)
Percen
tage
of localities with
public In
ternet access centres
(PIACS)
Total ind
icators available
% of ind
icators available
Country A1 A2 A3 A4 A5 A6 A7 A8 A9 A10
Asia and Pacific
Afghanistan √ √ √ √ 4 40%
Bangladesh √ √ √ √ 4 40%
Bhutan √ √ √ √ √ √ √ √ √ √ 10 100%
Brunei Darussalam √ √ √ √ √ √ 6 60%
Cambodia √ √ √ √ √ √ 6 60%
China √ √ √ √ √ √ √ √ 8 80%
D.P.R. Korea √ 1 10%
Fiji √ √ √ √ √ √ √ 7 70%
Hong Kong, China √ √ √ √ √ √ √ √ √ √ 10 100%
India √ √ √ √ √ √ √ √ 8 80%
Indonesia √ √ √ √ 4 40%
Iran (I.R.) √ 1 10%
Kiribati √ √ √ √ √ 5 50%
Lao P.D.R. √ √ √ √ √ √ √ √ 8 80%
Macao, China √ √ √ √ √ √ √ √ √ 9 90%
Malaysia √ √ √ √ √ √ √ √ √ √ 10 100%
Maldives √ √ √ √ √ √ √ √ √ √ 10 100%
Marshall Islands √ 1 10%

11
per 100 inhabitants In US$
Fixed teleph
one lin
es
Mob
ile cellular
teleph
one subscription
s
Fixed (w
ired
) Interne
t subscription
s
Fixed broa
dban
d Internet sub
scriptions
Mob
ile broad
band
subscription
s
Internationa
l Interne
t ba
ndwidth per in
habitant
(bits/second
/inh
abitan
t)
Percen
tage
of the
pop
ulation
covered by
mob
ile cellular
teleph
one ne
twork
Fixed broa
dban
d Internet access tariffs
per mon
th
Mob
ile cellular
teleph
one tariffs pe
r mon
th (o
ff‐net, o
n‐ne
t,
to fixed teleph
one lin
es)
Percen
tage
of localities with
public In
ternet access centres
(PIACS)
Total ind
icators available
% of ind
icators available
Country A1 A2 A3 A4 A5 A6 A7 A8 A9 A10
Micronesia √ √ √ √ √ √ 6 60%
Mongolia √ √ √ √ √ √ √ √ 8 80%
Myanmar √ √ 2 20%
Nauru √ √ √ √ √ 5 50%
Nepal √ √ √ √ √ √ √ 7 70%
Pakistan √ √ √ √ √ √ √ √ √ 9 90%
Papua New Guinea √ √ √ √ √ √ 6 60%
Philippines √ √ √ √ √ √ √ √ 8 80%
Samoa √ √ √ 3 30%
Singapore √ √ √ √ √ √ √ √ √ √ 10 100%
Solomon Islands √ 1 10%
Sri Lanka √ √ √ √ √ √ √ √ 8 80%
Thailand √ √ √ √ √ √ √ 7 70%
Timor‐Leste √ √ √ 3 30%
Tonga √ √ √ 3 30%
Turkey √ √ √ √ √ √ √ √ √ 9 90%
Tuvalu √ √ 2 20%
Vanuatu √ √ √ √ √ √ √ 7 70%
Viet Nam √ √ √ √ √ √ 6 60%
12
per 100 inhabitants In US$
Fixed teleph
one lin
es
Mob
ile cellular
teleph
one subscription
s
Fixed (w
ired
) Interne
t subscription
s
Fixed broa
dban
d Internet sub
scriptions
Mob
ile broad
band
subscription
s
Internationa
l Interne
t ba
ndwidth per in
habitant
(bits/second
/inh
abitan
t)
Percen
tage
of the
pop
ulation
covered by
mob
ile cellular
teleph
one ne
twork
Fixed broa
dban
d Internet access tariffs
per mon
th
Mob
ile cellular
teleph
one tariffs pe
r mon
th (o
ff‐net, o
n‐ne
t,
to fixed teleph
one lin
es)
Percen
tage
of localities with
public In
ternet access centres
(PIACS)
Total ind
icators available
% of ind
icators available
Country A1 A2 A3 A4 A5 A6 A7 A8 A9 A10
Total Asia and Pacific
28 31 20 26 10 27 17 28 28 7
% of countries 76% 84% 54% 70% 27% 73% 46% 76% 76% 19%
Central Asia and South‐Eastern European Countries
Albania √ √ √ √ √ √ √ √ 8 80%
Armenia √ √ √ √ √ √ √ √ √ 9 90%
Azerbaijan √ √ √ √ √ √ √ √ √ √ 10 100%
Belarus √ √ √ √ √ √ √ √ √ √ 10 100%
Bosnia and Herzegovina √ √ √ √ √ √ √ √ √ 9 90%
Croatia √ √ √ √ √ √ √ √ √ 9 90%
Georgia √ √ √ √ √ √ √ √ √ 9 90%
Kazakhstan √ √ √ √ √ √ √ √ 8 80%
Kyrgyzstan √ √ √ √ √ √ √ √ 8 80%
Moldova √ √ √ √ √ √ √ 7 70%
Montenegro √ √ √ √ √ √ √ 7 70%
Russia √ √ √ √ √ √ √ √ 8 80%
Serbia √ √ √ √ √ √ √ √ √ √ 10 100%
Tajikistan √ √ √ √ 4 40%

13
per 100 inhabitants In US$
Fixed teleph
one lin
es
Mob
ile cellular
teleph
one subscription
s
Fixed (w
ired
) Interne
t subscription
s
Fixed broa
dban
d Internet sub
scriptions
Mob
ile broad
band
subscription
s
Internationa
l Interne
t ba
ndwidth per in
habitant
(bits/second
/inh
abitan
t)
Percen
tage
of the
pop
ulation
covered by
mob
ile cellular
teleph
one ne
twork
Fixed broa
dban
d Internet access tariffs
per mon
th
Mob
ile cellular
teleph
one tariffs pe
r mon
th (o
ff‐net, o
n‐ne
t,
to fixed teleph
one lin
es)
Percen
tage
of localities with
public In
ternet access centres
(PIACS)
Total ind
icators available
% of ind
icators available
Country A1 A2 A3 A4 A5 A6 A7 A8 A9 A10
TFYR Macedonia √ √ √ √ √ √ √ √ 8 80%
Turkmenistan √ √ √ √ 4 40%
Ukraine √ √ √ √ √ √ √ 7 70%
Uzbekistan √ √ √ √ √ √ √ 7 70%
Total Central Asia and South‐Eastern European
18 18 15 17 8 14 13 17 17 5
% of countries 100% 100% 83% 94% 44% 78% 72% 94% 94% 28%
Latin America and the Caribbean
Antigua & Barbuda √ √ √ √ √ √ √ √ √ 9 90%
Argentina √ √ √ √ √ √ 6 60%
Bahamas √ √ √ √ √ √ √ √ 8 80%
Barbados √ √ √ √ √ √ √ 7 70%
Belize √ √ √ √ √ √ √ 7 70%
Bolivia √ √ √ √ √ √ √ 7 70%
Brazil √ √ √ √ √ √ √ √ 8 80%
Chile √ √ √ √ √ √ √ √ √ 9 90%
Colombia √ √ √ √ √ √ √ √ √ 9 90%
14
per 100 inhabitants In US$
Fixed teleph
one lin
es
Mob
ile cellular
teleph
one subscription
s
Fixed (w
ired
) Interne
t subscription
s
Fixed broa
dban
d Internet sub
scriptions
Mob
ile broad
band
subscription
s
Internationa
l Interne
t ba
ndwidth per in
habitant
(bits/second
/inh
abitan
t)
Percen
tage
of the
pop
ulation
covered by
mob
ile cellular
teleph
one ne
twork
Fixed broa
dban
d Internet access tariffs
per mon
th
Mob
ile cellular
teleph
one tariffs pe
r mon
th (o
ff‐net, o
n‐ne
t,
to fixed teleph
one lin
es)
Percen
tage
of localities with
public In
ternet access centres
(PIACS)
Total ind
icators available
% of ind
icators available
Country A1 A2 A3 A4 A5 A6 A7 A8 A9 A10
Costa Rica √ √ √ √ √ √ √ √ √ √ 10 100%
Cuba √ √ √ √ √ √ √ √ √ 9 90%
Dominica √ √ √ √ √ √ √ √ √ 9 90%
Dominican Rep. √ √ √ √ √ √ √ √ √ √ 10 100%
Ecuador √ √ √ √ √ √ √ √ √ √ 10 100%
El Salvador √ √ √ √ √ √ √ 7 70%
Grenada √ √ √ √ √ √ 6 60%
Guatemala √ √ √ √ √ 5 50%
Guyana √ √ √ √ √ √ √ √ 8 80%
Haiti √ √ √ √ 4 40%
Honduras √ √ √ √ √ 5 50%
Jamaica √ √ √ √ √ √ √ 7 70%
Mexico √ √ √ √ √ √ √ √ √ 9 90%
Nicaragua √ √ √ √ 4 40%
Panama √ √ √ √ √ √ √ √ 8 80%
Paraguay √ √ √ √ √ √ √ √ √ 9 90%
Peru √ √ √ √ √ √ √ 7 70%
St. Kitts and Nevis √ √ 2 20%
St. Lucia √ √ √ √ √ 5 50%
15
per 100 inhabitants In US$
Fixed teleph
one lin
es
Mob
ile cellular
teleph
one subscription
s
Fixed (w
ired
) Interne
t subscription
s
Fixed broa
dban
d Internet sub
scriptions
Mob
ile broad
band
subscription
s
Internationa
l Interne
t ba
ndwidth per in
habitant
(bits/second
/inh
abitan
t)
Percen
tage
of the
pop
ulation
covered by
mob
ile cellular
teleph
one ne
twork
Fixed broa
dban
d Internet access tariffs
per mon
th
Mob
ile cellular
teleph
one tariffs pe
r mon
th (o
ff‐net, o
n‐ne
t,
to fixed teleph
one lin
es)
Percen
tage
of localities with
public In
ternet access centres
(PIACS)
Total ind
icators available
% of ind
icators available
Country A1 A2 A3 A4 A5 A6 A7 A8 A9 A10
St. Vincent and the Grenadines
√ √ √ √ √ √ √ √ 8 80%
Suriname √ √ √ √ √ √ √ 7 70%
Trinidad & Tobago √ √ √ √ √ √ √ √ √ 9 90%
Uruguay √ √ √ √ √ √ √ √ 8 80%
Venezuela √ √ √ √ √ √ √ 7 70%
Total Latin America and the Caribbean
30 31 29 28 12 24 19 32 32 6
% of countries 91% 94% 88% 85% 36% 73% 58% 97% 97% 18%
Western Asia
Bahrain √ √ √ √ √ √ √ √ 8 80%
Egypt √ √ √ √ √ √ √ √ √ √ 10 100%
Iraq √ √ √ √ √ 5 50%
Jordan √ √ √ √ √ √ √ √ √ 9 90%
Kuwait 0 0%
Lebanon √ √ √ √ √ √ 6 60%
Oman √ √ √ √ √ √ √ √ √ √ 10 100%
Qatar √ √ √ √ √ √ √ √ √ 9 90%

16
per 100 inhabitants In US$
Fixed teleph
one lin
es
Mob
ile cellular
teleph
one subscription
s
Fixed (w
ired
) Interne
t subscription
s
Fixed broa
dban
d Internet sub
scriptions
Mob
ile broad
band
subscription
s
Internationa
l Interne
t ba
ndwidth per in
habitant
(bits/second
/inh
abitan
t)
Percen
tage
of the
pop
ulation
covered by
mob
ile cellular
teleph
one ne
twork
Fixed broa
dban
d Internet access tariffs
per mon
th
Mob
ile cellular
teleph
one tariffs pe
r mon
th (o
ff‐net, o
n‐ne
t,
to fixed teleph
one lin
es)
Percen
tage
of localities with
public In
ternet access centres
(PIACS)
Total ind
icators available
% of ind
icators available
Country A1 A2 A3 A4 A5 A6 A7 A8 A9 A10
Saudi Arabia √ √ √ √ √ √ √ √ √ 9 90%
Syria √ √ √ √ √ √ √ √ 8 80%
United Arab Emirates √ √ √ √ √ √ √ √ 8 80%
Yemen √ √ √ √ √ √ √ √ 8 80%
Total Western Asia
11 11 10 10 6 10 10 10 10 2
% of countries 92% 92% 83% 83% 50% 83% 83% 83% 83% 17%
Other countries (mainly OECD)
Andorra √ √ √ √ √ √ 6 60%
Australia √ √ √ √ √ √ √ √ 8 80%
Austria √ √ √ √ √ √ √ √ 8 80%
Belgium √ √ √ √ √ √ √ √ 8 80%
Bulgaria √ √ √ √ √ √ √ √ √ 9 90%
Canada √ √ √ √ √ √ √ 7 70%
Cyprus √ √ √ √ √ √ √ √ √ 9 90%
Czech Republic √ √ √ √ √ √ √ √ 8 80%
Denmark √ √ √ √ √ √ √ 7 70%
Estonia √ √ √ √ √ √ √ √ √ 9 90%

17
per 100 inhabitants In US$
Fixed teleph
one lin
es
Mob
ile cellular
teleph
one subscription
s
Fixed (w
ired
) Interne
t subscription
s
Fixed broa
dban
d Internet sub
scriptions
Mob
ile broad
band
subscription
s
Internationa
l Interne
t ba
ndwidth per in
habitant
(bits/second
/inh
abitan
t)
Percen
tage
of the
pop
ulation
covered by
mob
ile cellular
teleph
one ne
twork
Fixed broa
dban
d Internet access tariffs
per mon
th
Mob
ile cellular
teleph
one tariffs pe
r mon
th (o
ff‐net, o
n‐ne
t,
to fixed teleph
one lin
es)
Percen
tage
of localities with
public In
ternet access centres
(PIACS)
Total ind
icators available
% of ind
icators available
Country A1 A2 A3 A4 A5 A6 A7 A8 A9 A10
Finland √ √ √ √ √ √ 6 60%
France √ √ √ √ √ √ 6 60%
Germany √ √ √ √ √ √ √ √ 8 80%
Greece √ √ √ √ √ √ √ √ √ 9 90%
Hungary √ √ √ √ √ √ √ √ √ 9 90%
Iceland √ √ √ √ √ √ √ √ √ 9 90%
Ireland √ √ √ √ √ √ √ 7 70%
Israel √ √ 2 20%
Italy √ √ √ √ √ √ √ √ √ 9 90%
Japan √ √ √ √ √ √ √ 7 70%
Korea (Rep.) √ √ √ √ √ √ √ √ √ 9 90%
Latvia √ √ √ √ √ √ √ 7 70%
Liechtenstein √ √ 2 20%
Lithuania √ √ √ √ √ √ √ √ √ 9 90%
Luxembourg √ √ √ √ √ √ √ √ √ 9 90%
Malta √ √ √ √ √ √ √ √ √ 9 90%
Monaco √ √ √ √ √ √ √ √ √ 9 90%
Netherlands √ √ √ √ √ √ √ 7 70%
New Zealand √ √ √ √ √ √ √ 7 70%
18
per 100 inhabitants In US$
Fixed teleph
one lin
es
Mob
ile cellular
teleph
one subscription
s
Fixed (w
ired
) Interne
t subscription
s
Fixed broa
dban
d Internet sub
scriptions
Mob
ile broad
band
subscription
s
Internationa
l Interne
t ba
ndwidth per in
habitant
(bits/second
/inh
abitan
t)
Percen
tage
of the
pop
ulation
covered by
mob
ile cellular
teleph
one ne
twork
Fixed broa
dban
d Internet access tariffs
per mon
th
Mob
ile cellular
teleph
one tariffs pe
r mon
th (o
ff‐net, o
n‐ne
t,
to fixed teleph
one lin
es)
Percen
tage
of localities with
public In
ternet access centres
(PIACS)
Total ind
icators available
% of ind
icators available
Country A1 A2 A3 A4 A5 A6 A7 A8 A9 A10
Norway √ √ √ √ √ √ 6 60%
Poland √ √ √ √ √ √ √ √ 8 80%
Portugal √ √ √ √ √ √ √ √ 8 80%
Romania √ √ √ √ √ √ √ √ √ 9 90%
San Marino √ √ √ √ √ 5 50%
Slovak Republic √ √ √ √ √ √ √ √ √ 9 90%
Slovenia √ √ √ √ √ √ √ √ 8 80%
Spain √ √ √ √ √ √ √ √ 8 80%
Sweden √ √ √ √ √ √ √ √ 8 80%
Switzerland √ √ √ √ √ √ √ √ 8 80%
United Kingdom √ √ √ √ √ √ √ 7 70%
United States √ √ √ √ √ √ √ √ 8 80%
Total Other countries
38 39 34 38 29 15 33 40 40 5
% of countries 93% 95% 83% 93% 71% 37% 80% 98% 98% 12%
Source: ITU.
19
Table 3.2: Progress in measuring the core ICT indicators on infrastructure 2005 and 2009/2010 (as reported to ITU), % of countries, by region and total
Africa Asia and Pacific
Central Asia and South‐Eastern European Countries
Latin America and the Caribbean Western Asia
Other countries (mainly OECD) Total
2005 2009‐2010 2005
2009‐2010 2005
2009‐2010 2005
2009‐2010 2005
2009‐2010 2005
2009‐2010 2005
2009‐2010
A1 85% 98% 86% 76% 100% 100% 97% 91% 92% 92% 100% 93% 92% 91%
A2 96% 98% 95% 84% 94% 100% 94% 94% 92% 92% 100% 95% 96% 94%
A3 65% 65% 81% 54% 72% 83% 70% 88% 92% 83% 88% 83% 76% 74%
A4 90% 87% 73% 70% 67% 94% 100% 85% 92% 83% 98% 93% 87% 85%
A5 ‐ 19% ‐ 27% ‐ 44% ‐ 36% ‐ 50% ‐ 71% ‐ 39%
A6 75% 83% 65% 73% 50% 78% 52% 73% 92% 83% 39% 37% 59% 69%
A7 75% 48% 62% 46% 83% 72% 61% 58% 92% 83% 88% 80% 75% 61%
A8 ‐ 73% ‐ 76% ‐ 94% ‐ 97% ‐ 83% ‐ 98% ‐ 85%
A9 48% 73% 54% 76% 67% 94% 67% 97% 92% 83% 83% 98% 63% 85%
A10 4% 8% 16% 19% 6% 28% 6% 18% 92% 17% 7% 12% 8% 15%
Source: ITU.

20
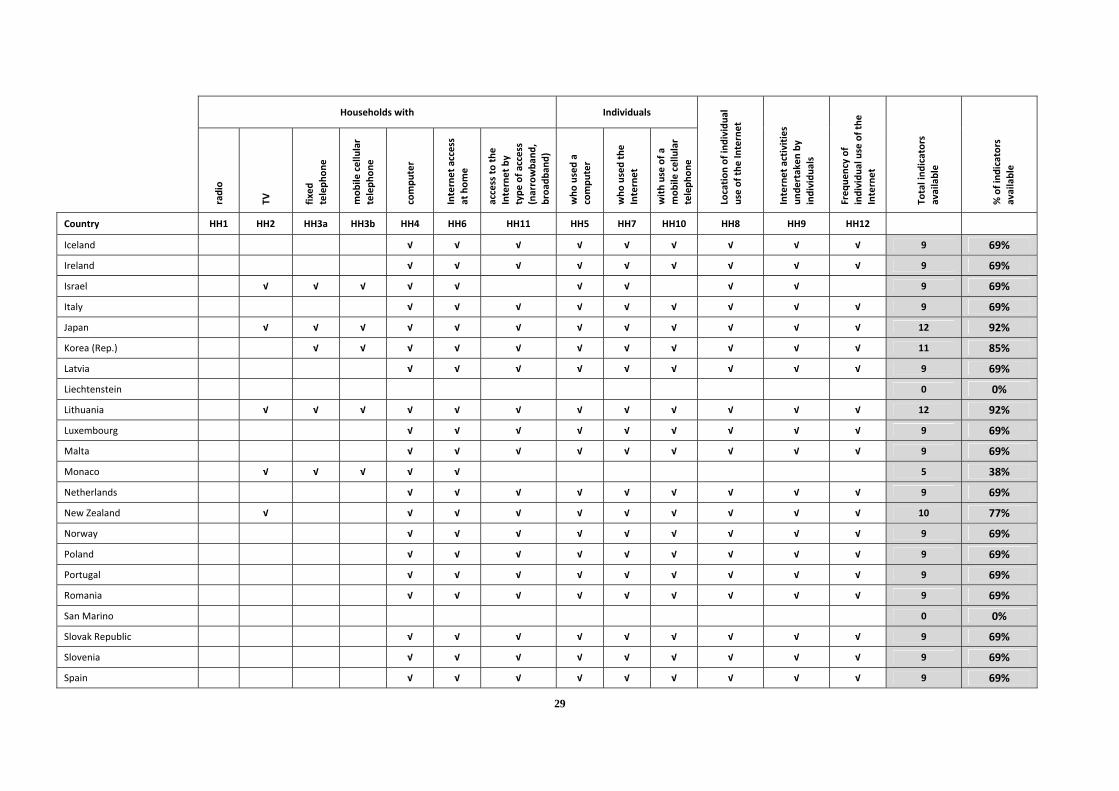
Table 3.3: Availability of the core indicators on household ICT access and individuals ICT use, 2008-2010 (as reported to ITU)
Households with Individuals
radio
TV
fixed
teleph
one
mob
ile cellular
teleph
one
compu
ter
Internet access
at hom
e
access to
the
Internet by
type
of a
ccess
(narrowba
nd,
broa
dban
d)
who
used a
compu
ter
who
used the
Internet
with use of a
mob
ile cellular
teleph
one
Location
of ind
ividua
l use of the
Internet
Internet activities
unde
rtaken
by
individu
als
Freq
uency of
individu
al use of the
Internet
Total ind
icators
available
% of ind
icators
available
Country HH1 HH2 HH3a HH3b HH4 HH6 HH11 HH5 HH7 HH10 HH8 HH9 HH12
Africa Algeria √ √ √ √ √ √ 6 46% Angola 0 0% Benin 0 0% Botswana 0 0% Burkina Faso 0 0% Burundi 0 0% Cameroon 0 0% Cape Verde 0 0% Central African Rep. 0 0% Chad 0 0% Comoros 0 0% Congo √ √ √ √ √ √ 6 46% Congo (Dem. Rep.) 0 0% Côte d'Ivoire 0 0% Djibouti √ √ √ √ 4 31% Equatorial Guinea 0 0% Eritrea 0 0% Ethiopia 0 0% Gabon 0 0%
21
Households with Individuals
radio
TV
fixed
teleph
one
mob
ile cellular
teleph
one
compu
ter
Internet access
at hom
e
access to
the
Internet by
type
of a
ccess
(narrowba
nd,
broa
dban
d)
who
used a
compu
ter
who
used the
Internet
with use of a
mob
ile cellular
teleph
one
Location
of ind
ividua
l use of the
Internet
Internet activities
unde
rtaken
by
individu
als
Freq
uency of
individu
al use of the
Internet
Total ind
icators
available
% of ind
icators
available
Country HH1 HH2 HH3a HH3b HH4 HH6 HH11 HH5 HH7 HH10 HH8 HH9 HH12
Gambia 0 0% Ghana √ √ √ 3 23% Guinea 0 0% Guinea‐Bissau 0 0% Kenya 0 0% Lesotho 0 0% Liberia √ √ √ √ √ 5 38% Libya 0 0% Madagascar √ √ √ √ √ √ 6 46% Malawi 0 0% Mali 0 0% Mauritania 0 0% Mauritius √ √ √ √ √ √ √ √ √ √ √ 11 85% Morocco √ √ √ √ √ √ √ √ √ √ √ √ √ 13 100% Mozambique 0 0% Namibia 0 0% Niger √ √ √ √ √ √ √ √ 8 62% Nigeria √ √ √ √ √ √ 6 46% Rwanda √ √ √ √ 4 31% S. Tomé & Principe 0 0% Senegal √ √ √ √ √ √ √ √ √ √ √ √ 12 92% Seychelles 0 0%

22
Households with Individuals
radio
TV
fixed
teleph
one
mob
ile cellular
teleph
one
compu
ter
Internet access
at hom
e
access to
the
Internet by
type
of a
ccess
(narrowba
nd,
broa
dban
d)
who
used a
compu
ter
who
used the
Internet
with use of a
mob
ile cellular
teleph
one
Location
of ind
ividua
l use of the
Internet
Internet activities
unde
rtaken
by
individu
als
Freq
uency of
individu
al use of the
Internet
Total ind
icators
available
% of ind
icators
available
Country HH1 HH2 HH3a HH3b HH4 HH6 HH11 HH5 HH7 HH10 HH8 HH9 HH12
Sierra Leone √ √ √ √ 4 31% Somalia 0 0% South Africa √ √ √ √ 4 31% Sudan 0 0% Swaziland 0 0% Tanzania √ √ √ √ 4 31% Togo 0 0% Tunisia √ √ 2 15% Uganda √ 1 8% Zambia 0 0% Zimbabwe 0 0% Total Africa 14 14 13 15 11 11 2 4 4 2 3 3 3 % of countries 27% 27% 25% 29% 21% 21% 4% 8% 8% 4% 6% 6% 6% Asia and Pacific Afghanistan 0 0%
Bangladesh 0 0%
Bhutan √ √ √ √ √ √ √ 7 54%
Brunei Darussalam 0 0%
Cambodia √ √ √ √ √ √ 6 46%
China 0 0%
D.P.R. Korea 0 0%

23
Households with Individuals
radio
TV
fixed
teleph
one
mob
ile cellular
teleph
one
compu
ter
Internet access
at hom
e
access to
the
Internet by
type
of a
ccess
(narrowba
nd,
broa
dban
d)
who
used a
compu
ter
who
used the
Internet
with use of a
mob
ile cellular
teleph
one
Location
of ind
ividua
l use of the
Internet
Internet activities
unde
rtaken
by
individu
als
Freq
uency of
individu
al use of the
Internet
Total ind
icators
available
% of ind
icators
available
Country HH1 HH2 HH3a HH3b HH4 HH6 HH11 HH5 HH7 HH10 HH8 HH9 HH12
Fiji 0 0%
Hong Kong, China √ √ √ √ √ √ √ √ √ 9 69%
India √ 1 8%
Indonesia √ √ √ √ √ √ √ 7 54%
Iran (I.R.) √ √ √ √ √ √ √ √ √ √ 10 77%
Kiribati 0 0%
Lao P.D.R. 0 0%
Macao, China √ √ √ √ √ √ √ √ 8 62%
Malaysia √ √ 2 15%
Maldives √ √ √ √ √ √ √ √ 8 62%
Marshall Islands 0 0%
Micronesia 0 0%
Mongolia √ √ √ √ √ √ √ 7 54%
Myanmar 0 0%
Nauru 0 0%
Nepal √ √ √ √ √ √ 6 46%
Pakistan √ 1 8%
Papua New Guinea 0 0%
Philippines √ √ √ √ √ √ 6 46%
Samoa 0 0%
Singapore √ √ √ √ √ √ √ √ √ √ √ 11 85%
Solomon Islands 0 0%
24
Households with Individuals
radio
TV
fixed
teleph
one
mob
ile cellular
teleph
one
compu
ter
Internet access
at hom
e
access to
the
Internet by
type
of a
ccess
(narrowba
nd,
broa
dban
d)
who
used a
compu
ter
who
used the
Internet
with use of a
mob
ile cellular
teleph
one
Location
of ind
ividua
l use of the
Internet
Internet activities
unde
rtaken
by
individu
als
Freq
uency of
individu
al use of the
Internet
Total ind
icators
available
% of ind
icators
available
Country HH1 HH2 HH3a HH3b HH4 HH6 HH11 HH5 HH7 HH10 HH8 HH9 HH12
Sri Lanka 0 0%
Thailand √ √ √ √ √ √ √ √ √ √ √ √ √ 13 100%
Timor‐Leste 0 0%
Tonga 0 0%
Turkey √ √ √ √ √ √ √ √ √ √ 10 77%
Tuvalu 0 0%
Vanuatu 0 0%
Viet Nam √ √ √ √ 4 31%
Total Asia and Pacific
7 11 12 11 15 15 7 6 8 5 7 6 6
% of countries 19% 30% 32% 30% 41% 41% 19% 16% 22% 14% 19% 16% 16%
Central Asia and South‐Eastern European Countries
Albania √ √ 2 15%
Armenia √ √ √ √ √ 5 38%
Azerbaijan √ √ √ √ √ √ √ √ √ √ √ √ √ 13 100%
Belarus √ √ √ √ √ √ √ √ 8 62%
Bosnia and Herzegovina 0 0%
Croatia √ √ √ √ √ √ √ √ √ 9 69%
Georgia √ √ √ √ 4 31%
Kazakhstan √ 1 8%
25
Households with Individuals
radio
TV
fixed
teleph
one
mob
ile cellular
teleph
one
compu
ter
Internet access
at hom
e
access to
the
Internet by
type
of a
ccess
(narrowba
nd,
broa
dban
d)
who
used a
compu
ter
who
used the
Internet
with use of a
mob
ile cellular
teleph
one
Location
of ind
ividua
l use of the
Internet
Internet activities
unde
rtaken
by
individu
als
Freq
uency of
individu
al use of the
Internet
Total ind
icators
available
% of ind
icators
available
Country HH1 HH2 HH3a HH3b HH4 HH6 HH11 HH5 HH7 HH10 HH8 HH9 HH12
Kyrgyzstan 0 0%
Moldova √ √ √ √ √ √ √ √ √ √ √ √ √ 13 100%
Montenegro √ √ √ √ √ √ 6 46%
Russia √ √ √ √ √ √ √ √ √ √ 10 77%
Serbia √ √ √ √ √ √ √ 7 54%
Tajikistan 0 0%
TFYR Macedonia √ √ √ √ √ √ √ √ √ 9 69%
Turkmenistan 0 0%
Ukraine √ √ √ √ √ √ √ √ √ 9 69%
Uzbekistan 0 0%
Total Central Asia and South‐Eastern European Countries
3 9 8 6 12 12 5 6 8 4 8 8 7
% of countries 17% 50% 44% 33% 67% 67% 28% 33% 44% 22% 44% 44% 39%
Latin America and the Caribbean
Antigua & Barbuda √ √ √ √ √ √ √ 7 54%
Argentina 0 0%
Bahamas 0 0%
Barbados 0 0%
Belize 0 0%
26
Households with Individuals
radio
TV
fixed
teleph
one
mob
ile cellular
teleph
one
compu
ter
Internet access
at hom
e
access to
the
Internet by
type
of a
ccess
(narrowba
nd,
broa
dban
d)
who
used a
compu
ter
who
used the
Internet
with use of a
mob
ile cellular
teleph
one
Location
of ind
ividua
l use of the
Internet
Internet activities
unde
rtaken
by
individu
als
Freq
uency of
individu
al use of the
Internet
Total ind
icators
available
% of ind
icators
available
Country HH1 HH2 HH3a HH3b HH4 HH6 HH11 HH5 HH7 HH10 HH8 HH9 HH12
Bolivia √ √ √ √ √ √ 6 46%
Brazil √ √ √ √ √ √ √ √ √ √ √ √ √ 13 100%
Chile √ √ √ √ √ √ √ √ √ √ √ 11 85%
Colombia √ √ √ √ √ √ √ √ √ √ √ 11 85%
Costa Rica √ √ √ √ √ √ √ √ √ √ √ √ √ 13 100%
Cuba √ √ 2 15%
Dominica 0 0%
Dominican Rep. 0 0%
Ecuador √ √ √ √ √ √ √ √ √ √ √ √ √ 13 100%
El Salvador √ √ √ √ √ √ √ √ √ √ √ √ 12 92%
Grenada 0 0%
Guatemala 0 0%
Guyana 0 0%
Haiti 0 0%
Honduras √ √ √ √ √ √ √ √ 8 62%
Jamaica √ √ √ √ √ √ √ 7 54%
Mexico √ √ √ √ √ √ √ √ √ √ √ √ √ 13 100%
Nicaragua √ √ √ √ √ 5 38%
Panama √ √ 2 15%
Paraguay √ √ √ √ √ √ √ √ √ 9 69%
Peru √ √ √ √ √ √ √ √ √ √ 10 77%

27
Households with Individuals
radio
TV
fixed
teleph
one
mob
ile cellular
teleph
one
compu
ter
Internet access
at hom
e
access to
the
Internet by
type
of a
ccess
(narrowba
nd,
broa
dban
d)
who
used a
compu
ter
who
used the
Internet
with use of a
mob
ile cellular
teleph
one
Location
of ind
ividua
l use of the
Internet
Internet activities
unde
rtaken
by
individu
als
Freq
uency of
individu
al use of the
Internet
Total ind
icators
available
% of ind
icators
available
Country HH1 HH2 HH3a HH3b HH4 HH6 HH11 HH5 HH7 HH10 HH8 HH9 HH12
St. Kitts and Nevis 0 0%
St. Lucia 0 0%
St. Vincent and the Grenadines
√ √ 2 15%
Suriname √ √ √ √ 4 31%
Trinidad & Tobago 0 0%
Uruguay √ √ √ √ √ √ √ √ √ √ √ 11 85%
Venezuela 0 0%
Total Latin America and the Caribbean
13 15 17 16 18 18 6 9 11 8 10 9 9
% of countries 39% 45% 52% 48% 55% 55% 18% 27% 33% 24% 30% 27% 27%
Western Asia Bahrain √ √ √ √ √ √ 6 46%
Egypt √ √ √ √ √ √ √ √ √ √ √ √ √ 13 100%
Iraq √ √ √ √ √ √ √ √ 8 62%
Jordan √ √ √ √ √ √ 6 46%
Kuwait 0 0%
Lebanon 0 0%
Oman 0 0%
Qatar √ √ √ √ √ √ √ √ √ √ √ √ √ 13 100%
Saudi Arabia 0 0%
28
Households with Individuals
radio
TV
fixed
teleph
one
mob
ile cellular
teleph
one
compu
ter
Internet access
at hom
e
access to
the
Internet by
type
of a
ccess
(narrowba
nd,
broa
dban
d)
who
used a
compu
ter
who
used the
Internet
with use of a
mob
ile cellular
teleph
one
Location
of ind
ividua
l use of the
Internet
Internet activities
unde
rtaken
by
individu
als
Freq
uency of
individu
al use of the
Internet
Total ind
icators
available
% of ind
icators
available
Country HH1 HH2 HH3a HH3b HH4 HH6 HH11 HH5 HH7 HH10 HH8 HH9 HH12
Syria 0 0%
United Arab Emirates √ √ √ √ √ √ √ √ √ √ √ √ 12 92%
Yemen 0 0%
Total Western Asia 4 4 5 5 6 6 3 6 6 3 3 4 3 % of countries 33% 33% 42% 42% 50% 50% 25% 50% 50% 25% 25% 33% 25%
Other Countries (mainly OECD) Andorra 0 0%
Australia √ √ √ √ √ √ √ 7 54%
Austria √ √ √ √ √ √ √ √ √ 9 69%
Belgium √ √ √ √ √ √ √ √ √ 9 69%
Bulgaria √ √ √ √ √ √ √ √ √ 9 69%
Canada √ √ √ √ √ √ √ √ √ √ 10 77%
Cyprus √ √ √ √ √ √ √ √ √ √ 10 77%
Czech Republic √ √ √ √ √ √ √ √ √ 9 69%
Denmark √ √ √ √ √ √ √ √ √ 9 69%
Estonia √ √ √ √ √ √ √ √ √ 9 69%
Finland √ √ √ √ √ √ √ √ √ 9 69%
France √ √ √ √ √ √ √ √ √ 9 69%
Germany √ √ √ √ √ √ √ √ √ 9 69%
Greece √ √ √ √ √ √ √ √ √ 9 69%
Hungary √ √ √ √ √ √ √ √ √ 9 69%
29
Households with Individuals
radio
TV
fixed
teleph
one
mob
ile cellular
teleph
one
compu
ter
Internet access
at hom
e
access to
the
Internet by
type
of a
ccess
(narrowba
nd,
broa
dban
d)
who
used a
compu
ter
who
used the
Internet
with use of a
mob
ile cellular
teleph
one
Location
of ind
ividua
l use of the
Internet
Internet activities
unde
rtaken
by
individu
als
Freq
uency of
individu
al use of the
Internet
Total ind
icators
available
% of ind
icators
available
Country HH1 HH2 HH3a HH3b HH4 HH6 HH11 HH5 HH7 HH10 HH8 HH9 HH12
Iceland √ √ √ √ √ √ √ √ √ 9 69%
Ireland √ √ √ √ √ √ √ √ √ 9 69%
Israel √ √ √ √ √ √ √ √ √ 9 69%
Italy √ √ √ √ √ √ √ √ √ 9 69%
Japan √ √ √ √ √ √ √ √ √ √ √ √ 12 92%
Korea (Rep.) √ √ √ √ √ √ √ √ √ √ √ 11 85%
Latvia √ √ √ √ √ √ √ √ √ 9 69%
Liechtenstein 0 0%
Lithuania √ √ √ √ √ √ √ √ √ √ √ √ 12 92%
Luxembourg √ √ √ √ √ √ √ √ √ 9 69%
Malta √ √ √ √ √ √ √ √ √ 9 69%
Monaco √ √ √ √ √ 5 38%
Netherlands √ √ √ √ √ √ √ √ √ 9 69%
New Zealand √ √ √ √ √ √ √ √ √ √ 10 77%
Norway √ √ √ √ √ √ √ √ √ 9 69%
Poland √ √ √ √ √ √ √ √ √ 9 69%
Portugal √ √ √ √ √ √ √ √ √ 9 69%
Romania √ √ √ √ √ √ √ √ √ 9 69%
San Marino 0 0%
Slovak Republic √ √ √ √ √ √ √ √ √ 9 69%
Slovenia √ √ √ √ √ √ √ √ √ 9 69%
Spain √ √ √ √ √ √ √ √ √ 9 69%

30
Households with Individuals
radio
TV
fixed
teleph
one
mob
ile cellular
teleph
one
compu
ter
Internet access
at hom
e
access to
the
Internet by
type
of a
ccess
(narrowba
nd,
broa
dban
d)
who
used a
compu
ter
who
used the
Internet
with use of a
mob
ile cellular
teleph
one
Location
of ind
ividua
l use of the
Internet
Internet activities
unde
rtaken
by
individu
als
Freq
uency of
individu
al use of the
Internet
Total ind
icators
available
% of ind
icators
available
Country HH1 HH2 HH3a HH3b HH4 HH6 HH11 HH5 HH7 HH10 HH8 HH9 HH12
Sweden √ √ √ √ √ √ √ √ √ 9 69%
Switzerland √ √ √ √ 4 31%
United Kingdom √ √ √ √ √ √ √ √ √ 9 69%
United States √ √ √ 3 23%
Total Other countries
0 7 6 6 36 36 35 33 37 32 37 36 35
% of countries 0% 17% 15% 15% 88% 88% 85% 80% 90% 78% 90% 88% 85% Source: ITU.

31
Table 3.4: Progress in measuring the core indicators on household ICT access and individuals ICT use, 2003-2005 and 2008-2010 (as reported to ITU), % of countries, by region and total
Africa Asia and Pacific
Central Asia and South‐Eastern
European Countries Latin America and the Caribbean Western Asia
Other countries (mainly OECD) Total
2003‐2005 2008‐2010 2003‐2005 2008‐2010 2003‐2005 2008‐2010 2003‐2005 2008‐2010 2003‐2005 2008‐2010 2003‐2005 2008‐2010 2003‐2005 2008‐2010
HH1 58% 27% 30% 19% 33% 17% 45% 39% 42% 33% 12% 0% 37% 21%
HH2 69% 27% 41% 30% 50% 50% 48% 45% 50% 33% 78% 17% 59% 31%
HH3a 35% 25% 22% 32% 39% 44% 42% 52% 25% 42% 46% 15% 36% 32%
HH3b 25% 29% 19% 30% 28% 33% 42% 48% 25% 42% 76% 15% 38% 31%
HH4 19% 21% 30% 41% 33% 67% 58% 55% 50% 50% 88% 88% 46% 51%
HH6 4% 21% 22% 41% 17% 67% 48% 55% 17% 50% 83% 88% 34% 51%
HH11 0% 4% 3% 19% 6% 28% 6% 18% 0% 25% 68% 85% 17% 30%
HH5 0% 8% 11% 16% 11% 33% 12% 27% 8% 50% 76% 80% 22% 33%
HH7 2% 8% 14% 22% 11% 44% 21% 33% 17% 50% 85% 90% 27% 38%
HH10 2% 4% 5% 14% 0% 22% 18% 24% 8% 25% 17% 78% 9% 28%
HH8 0% 6% 3% 19% 6% 44% 6% 30% 0% 25% 66% 90% 16% 35%
HH9 0% 6% 3% 16% 6% 44% 6% 27% 0% 33% 66% 88% 16% 34%
HH12 0% 6% 0% 16% 0% 39% 3% 27% 0% 25% 0% 85% 1% 33%
Source: ITU.

32
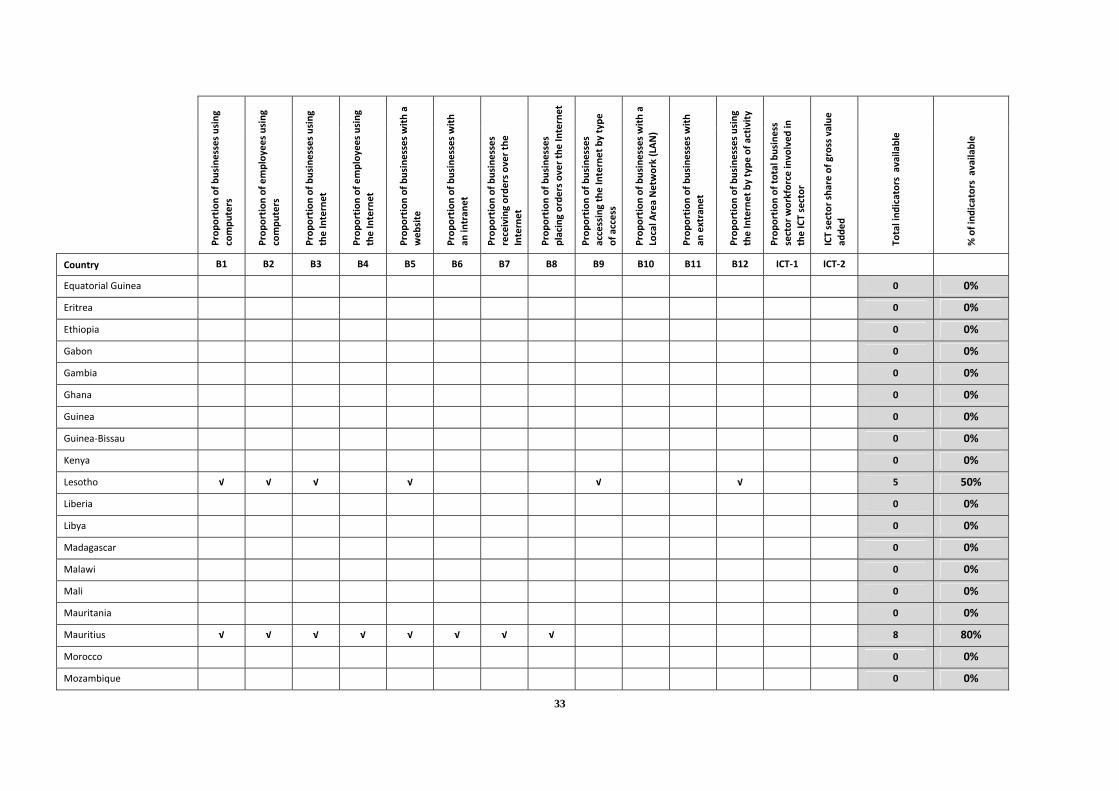
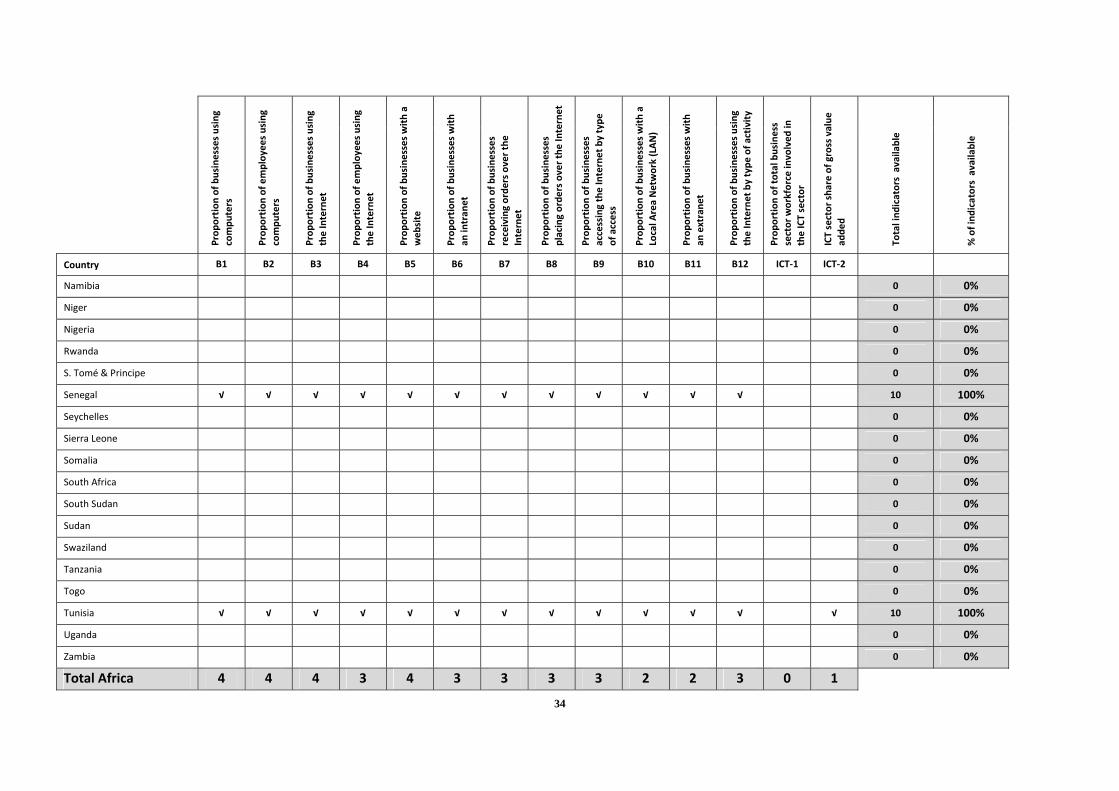
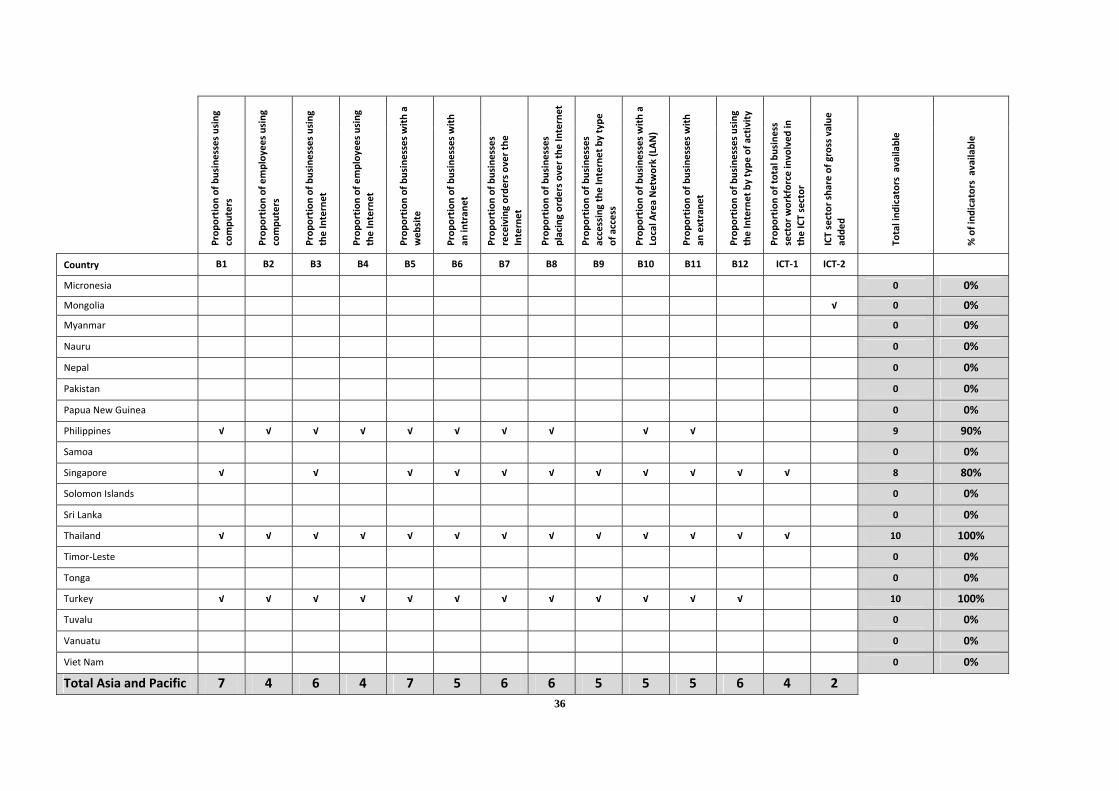
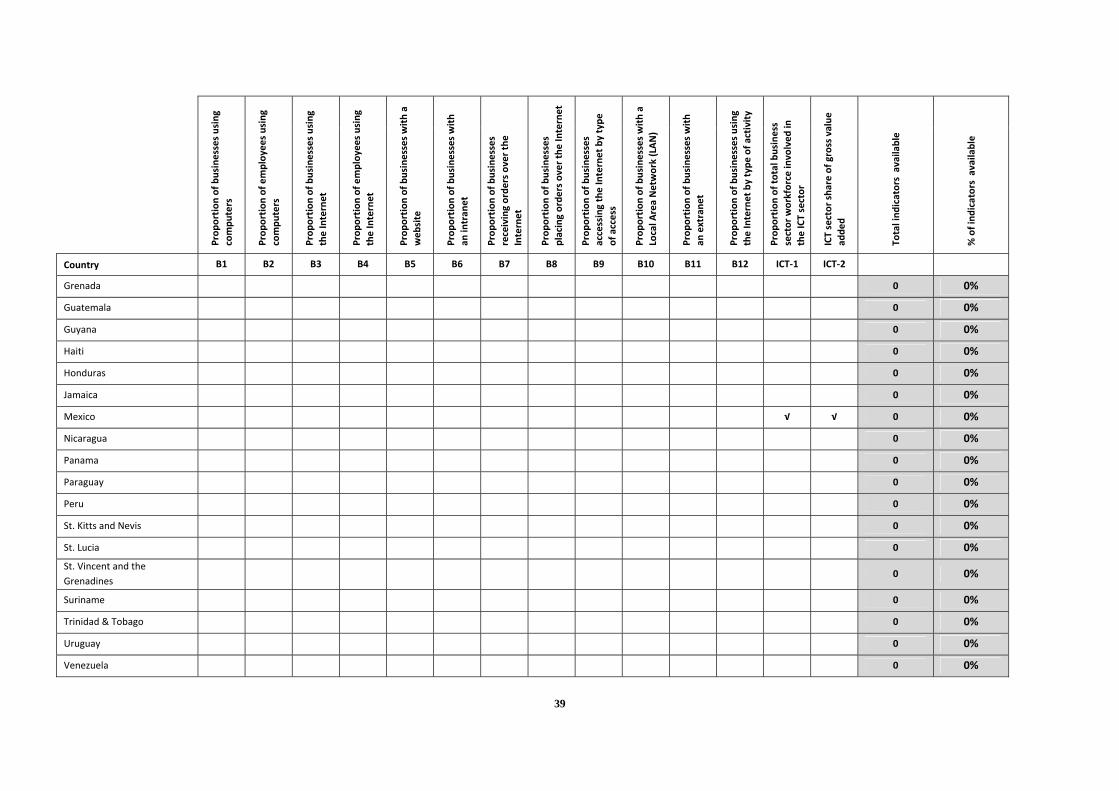
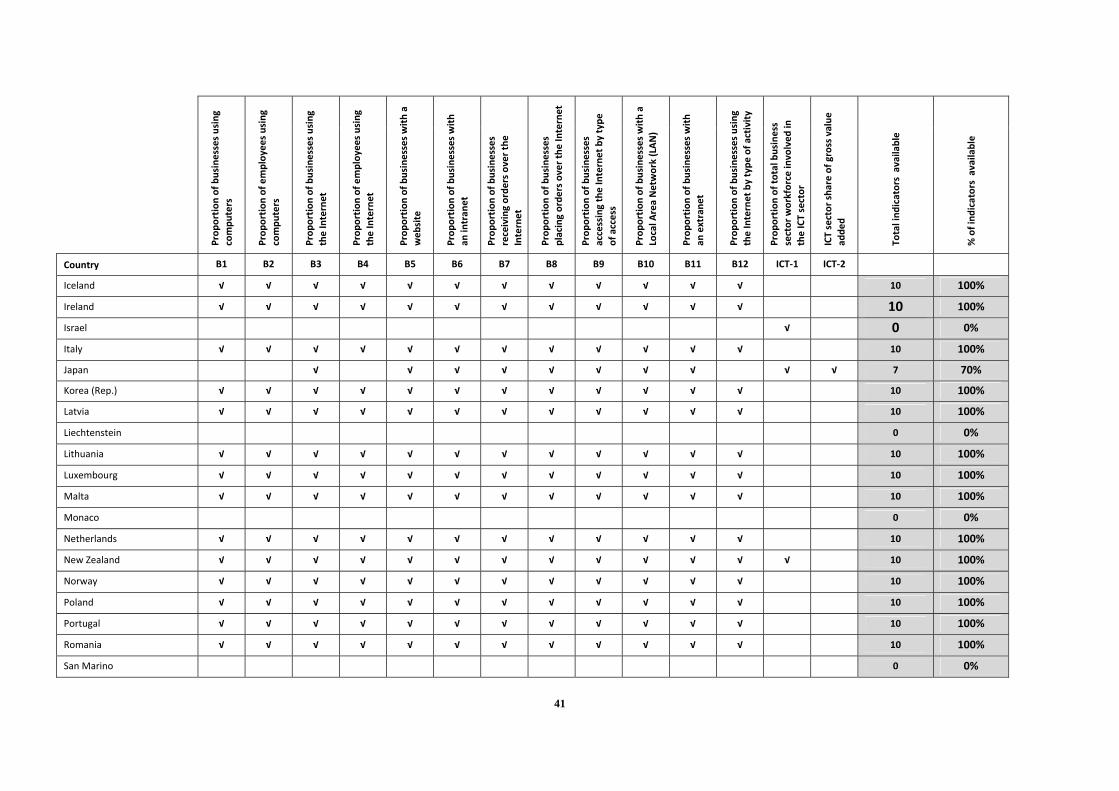
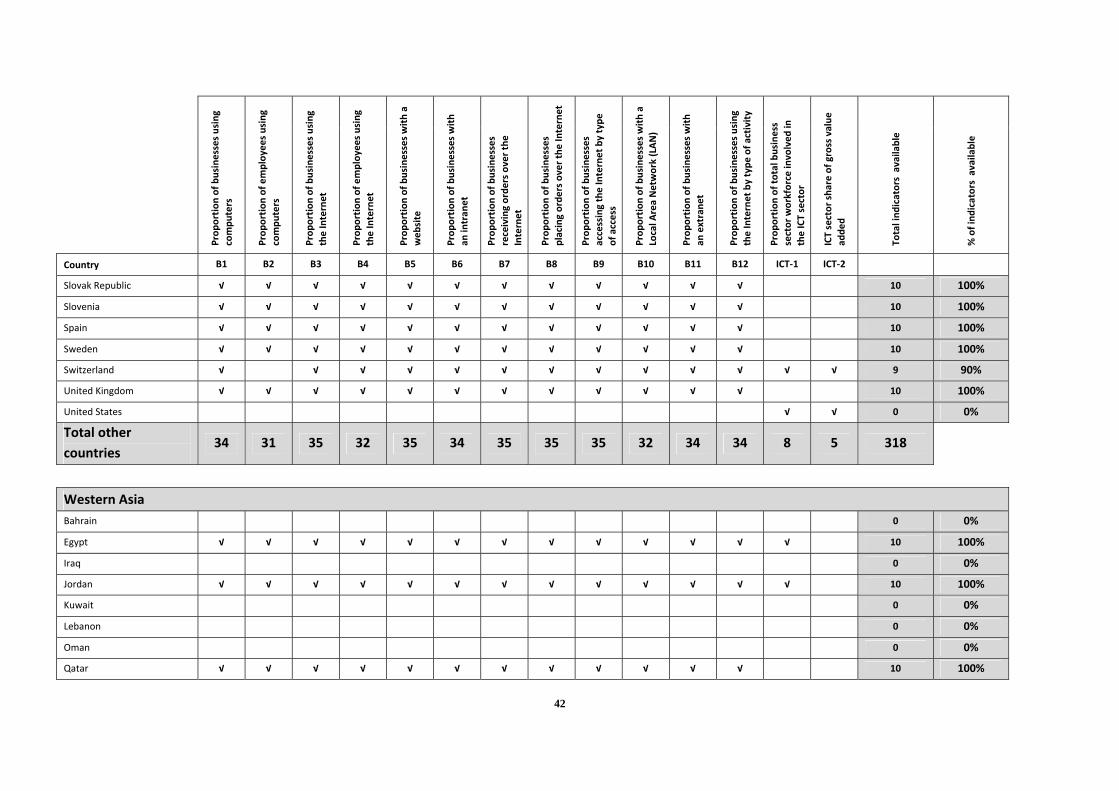
Table 3.5: Availability of the core ICT indicators on ICT use by businesses and on the ICT sector, 2007-2009 (as reported to UNCTAD)
Prop
ortion
of b
usinesses using
compu
ters
Prop
ortion
of e
mployees using
compu
ters
Prop
ortion
of b
usinesses using
the Internet
Prop
ortion
of e
mployees using
the Internet
Prop
ortion
of b
usinesses with a
web
site
Prop
ortion
of b
usinesses with
an intran
et
Prop
ortion
of b
usinesses
receiving orde
rs over the
Internet
Prop
ortion
of b
usinesses
placing orde
rs over the Internet
Prop
ortion
of b
usinesses
accessing the Internet by type
of access
Prop
ortion
of b
usinesses with a
Local A
rea Network (LAN)
Prop
ortion
of b
usinesses with
an extrane
t
Prop
ortion
of b
usinesses using
the Internet by type
of a
ctivity
Prop
ortion
of total business
sector workforce in
volved
in
the ICT sector
ICT sector sha
re of g
ross value
ad
ded
Total ind
icators available
% of ind
icators available
Country B1 B2 B3 B4 B5 B6 B7 B8 B9 B10 B11 B12 ICT‐1 ICT‐2
Africa Algeria 0 0%
Angola 0 0%
Benin 0 0%
Botswana 0 0%
Burkina Faso 0 0%
Burundi 0 0%
Cameroon 0 0%
Cape Verde 0 0%
Central African Rep. 0 0%
Chad 0 0%
Comoros 0 0%
Congo 0 0%
Congo (Dem. Rep.) 0 0%
Côte d'Ivoire 0 0%
Djibouti 0 0%
33
Prop
ortion
of b
usinesses using
compu
ters
Prop
ortion
of e
mployees using
compu
ters
Prop
ortion
of b
usinesses using
the Internet
Prop
ortion
of e
mployees using
the Internet
Prop
ortion
of b
usinesses with a
web
site
Prop
ortion
of b
usinesses with
an intran
et
Prop
ortion
of b
usinesses
receiving orde
rs over the
Internet
Prop
ortion
of b
usinesses
placing orde
rs over the Internet
Prop
ortion
of b
usinesses
accessing the Internet by type
of access
Prop
ortion
of b
usinesses with a
Local A
rea Network (LAN)
Prop
ortion
of b
usinesses with
an extrane
t
Prop
ortion
of b
usinesses using
the Internet by type
of a
ctivity
Prop
ortion
of total business
sector workforce in
volved
in
the ICT sector
ICT sector sha
re of g
ross value
ad
ded
Total ind
icators available
% of ind
icators available
Country B1 B2 B3 B4 B5 B6 B7 B8 B9 B10 B11 B12 ICT‐1 ICT‐2
Equatorial Guinea 0 0%
Eritrea 0 0%
Ethiopia 0 0%
Gabon 0 0%
Gambia 0 0%
Ghana 0 0%
Guinea 0 0%
Guinea‐Bissau 0 0%
Kenya 0 0%
Lesotho √ √ √ √ √ √ 5 50%
Liberia 0 0%
Libya 0 0%
Madagascar 0 0%
Malawi 0 0%
Mali 0 0%
Mauritania 0 0%
Mauritius √ √ √ √ √ √ √ √ 8 80%
Morocco 0 0%
Mozambique 0 0%
34
Prop
ortion
of b
usinesses using
compu
ters
Prop
ortion
of e
mployees using
compu
ters
Prop
ortion
of b
usinesses using
the Internet
Prop
ortion
of e
mployees using
the Internet
Prop
ortion
of b
usinesses with a
web
site
Prop
ortion
of b
usinesses with
an intran
et
Prop
ortion
of b
usinesses
receiving orde
rs over the
Internet
Prop
ortion
of b
usinesses
placing orde
rs over the Internet
Prop
ortion
of b
usinesses
accessing the Internet by type
of access
Prop
ortion
of b
usinesses with a
Local A
rea Network (LAN)
Prop
ortion
of b
usinesses with
an extrane
t
Prop
ortion
of b
usinesses using
the Internet by type
of a
ctivity
Prop
ortion
of total business
sector workforce in
volved
in
the ICT sector
ICT sector sha
re of g
ross value
ad
ded
Total ind
icators available
% of ind
icators available
Country B1 B2 B3 B4 B5 B6 B7 B8 B9 B10 B11 B12 ICT‐1 ICT‐2
Namibia 0 0%
Niger 0 0%
Nigeria 0 0%
Rwanda 0 0%
S. Tomé & Principe 0 0%
Senegal √ √ √ √ √ √ √ √ √ √ √ √ 10 100%
Seychelles 0 0%
Sierra Leone 0 0%
Somalia 0 0%
South Africa 0 0%
South Sudan 0 0%
Sudan 0 0%
Swaziland 0 0%
Tanzania 0 0%
Togo 0 0%
Tunisia √ √ √ √ √ √ √ √ √ √ √ √ √ 10 100%
Uganda 0 0%
Zambia 0 0%
Total Africa 4 4 4 3 4 3 3 3 3 2 2 3 0 1

35
Prop
ortion
of b
usinesses using
compu
ters
Prop
ortion
of e
mployees using
compu
ters
Prop
ortion
of b
usinesses using
the Internet
Prop
ortion
of e
mployees using
the Internet
Prop
ortion
of b
usinesses with a
web
site
Prop
ortion
of b
usinesses with
an intran
et
Prop
ortion
of b
usinesses
receiving orde
rs over the
Internet
Prop
ortion
of b
usinesses
placing orde
rs over the Internet
Prop
ortion
of b
usinesses
accessing the Internet by type
of access
Prop
ortion
of b
usinesses with a
Local A
rea Network (LAN)
Prop
ortion
of b
usinesses with
an extrane
t
Prop
ortion
of b
usinesses using
the Internet by type
of a
ctivity
Prop
ortion
of total business
sector workforce in
volved
in
the ICT sector
ICT sector sha
re of g
ross value
ad
ded
Total ind
icators available
% of ind
icators available
Country B1 B2 B3 B4 B5 B6 B7 B8 B9 B10 B11 B12 ICT‐1 ICT‐2
Asia and Pacific Afghanistan 0 0%
Bangladesh 0 0%
Bhutan 0 0%
Brunei Darussalam 0 0%
Cambodia 0 0%
China 0 0%
D.P.R. Korea 0 0%
Fiji 0 0%
Hong Kong, China √ √ √ √ √ √ √ √ √ √ √ √ √ √ 10 100%
India √ 1 10%
Indonesia 0 0%
Iran (I.R.) 0 0%
Kiribati 0 0%
Lao P.D.R. 0 0%
Macao, China √ √ √ √ √ √ √ 6 60%
Malaysia √ √ 0 0%
Maldives 0 0%
Marshall Islands 0 0%
36
Prop
ortion
of b
usinesses using
compu
ters
Prop
ortion
of e
mployees using
compu
ters
Prop
ortion
of b
usinesses using
the Internet
Prop
ortion
of e
mployees using
the Internet
Prop
ortion
of b
usinesses with a
web
site
Prop
ortion
of b
usinesses with
an intran
et
Prop
ortion
of b
usinesses
receiving orde
rs over the
Internet
Prop
ortion
of b
usinesses
placing orde
rs over the Internet
Prop
ortion
of b
usinesses
accessing the Internet by type
of access
Prop
ortion
of b
usinesses with a
Local A
rea Network (LAN)
Prop
ortion
of b
usinesses with
an extrane
t
Prop
ortion
of b
usinesses using
the Internet by type
of a
ctivity
Prop
ortion
of total business
sector workforce in
volved
in
the ICT sector
ICT sector sha
re of g
ross value
ad
ded
Total ind
icators available
% of ind
icators available
Country B1 B2 B3 B4 B5 B6 B7 B8 B9 B10 B11 B12 ICT‐1 ICT‐2
Micronesia 0 0%
Mongolia √ 0 0%
Myanmar 0 0%
Nauru 0 0%
Nepal 0 0%
Pakistan 0 0%
Papua New Guinea 0 0%
Philippines √ √ √ √ √ √ √ √ √ √ 9 90%
Samoa 0 0%
Singapore √ √ √ √ √ √ √ √ √ √ √ 8 80%
Solomon Islands 0 0%
Sri Lanka 0 0%
Thailand √ √ √ √ √ √ √ √ √ √ √ √ √ 10 100%
Timor‐Leste 0 0%
Tonga 0 0%
Turkey √ √ √ √ √ √ √ √ √ √ √ √ 10 100%
Tuvalu 0 0%
Vanuatu 0 0%
Viet Nam 0 0%
Total Asia and Pacific 7 4 6 4 7 5 6 6 5 5 5 6 4 2

37
Prop
ortion
of b
usinesses using
compu
ters
Prop
ortion
of e
mployees using
compu
ters
Prop
ortion
of b
usinesses using
the Internet
Prop
ortion
of e
mployees using
the Internet
Prop
ortion
of b
usinesses with a
web
site
Prop
ortion
of b
usinesses with
an intran
et
Prop
ortion
of b
usinesses
receiving orde
rs over the
Internet
Prop
ortion
of b
usinesses
placing orde
rs over the Internet
Prop
ortion
of b
usinesses
accessing the Internet by type
of access
Prop
ortion
of b
usinesses with a
Local A
rea Network (LAN)
Prop
ortion
of b
usinesses with
an extrane
t
Prop
ortion
of b
usinesses using
the Internet by type
of a
ctivity
Prop
ortion
of total business
sector workforce in
volved
in
the ICT sector
ICT sector sha
re of g
ross value
ad
ded
Total ind
icators available
% of ind
icators available
Country B1 B2 B3 B4 B5 B6 B7 B8 B9 B10 B11 B12 ICT‐1 ICT‐2
Central Asia and South‐Eastern European Countries Albania 0 0%
Armenia 0 0%
Azerbaijan √ √ √ √ √ √ √ √ √ √ √ √ √ 10 100%
Belarus 0 0%
Bosnia and Herzegovina 0 0%
Croatia √ √ √ √ √ √ √ √ √ √ √ √ √ √ 10 100%
Georgia 0 0%
Kazakhstan √ √ √ √ √ √ √ √ √ √ √ √ √ 10 100%
Kyrgyzstan √ √ √ √ √ √ 5 50%
Moldova 0 0%
Montenegro 0 0%
Russia √ √ √ √ √ √ √ √ √ √ √ √ √ √ 10 100%
Serbia √ √ √ √ √ √ √ √ √ √ √ 9 90%
Tajikistan 0 0%
TFYR Macedonia 0 0%
Turkmenistan 0 0%
Ukraine 0 0%
Uzbekistan 0 0%

38
Prop
ortion
of b
usinesses using
compu
ters
Prop
ortion
of e
mployees using
compu
ters
Prop
ortion
of b
usinesses using
the Internet
Prop
ortion
of e
mployees using
the Internet
Prop
ortion
of b
usinesses with a
web
site
Prop
ortion
of b
usinesses with
an intran
et
Prop
ortion
of b
usinesses
receiving orde
rs over the
Internet
Prop
ortion
of b
usinesses
placing orde
rs over the Internet
Prop
ortion
of b
usinesses
accessing the Internet by type
of access
Prop
ortion
of b
usinesses with a
Local A
rea Network (LAN)
Prop
ortion
of b
usinesses with
an extrane
t
Prop
ortion
of b
usinesses using
the Internet by type
of a
ctivity
Prop
ortion
of total business
sector workforce in
volved
in
the ICT sector
ICT sector sha
re of g
ross value
ad
ded
Total ind
icators available
% of ind
icators available
Country B1 B2 B3 B4 B5 B6 B7 B8 B9 B10 B11 B12 ICT‐1 ICT‐2
Total Central Asia and South‐Eastern European
6 5 6 4 6 5 5 5 6 6 5 6 4 2
Latin America and the Caribbean Antigua & Barbuda 0 0%
Argentina √ √ √ √ √ √ √ √ √ √ √ √ 10 100%
Bahamas 0 0%
Barbados 0 0%
Belize 0 0%
Bolivia 0 0%
Brazil √ √ √ √ √ √ √ √ √ √ 8 80%
Chile √ √ √ √ √ √ √ √ √ 7 70%
Colombia √ √ √ √ √ √ √ √ √ √ √ √ 10 100%
Costa Rica 0 0%
Cuba √ √ √ √ √ √ √ √ √ √ √ √ √ √ 10 100%
Dominica 0 0%
Dominican Rep. 0 0%
Ecuador 0 0%
El Salvador 0 0%
39
Prop
ortion
of b
usinesses using
compu
ters
Prop
ortion
of e
mployees using
compu
ters
Prop
ortion
of b
usinesses using
the Internet
Prop
ortion
of e
mployees using
the Internet
Prop
ortion
of b
usinesses with a
web
site
Prop
ortion
of b
usinesses with
an intran
et
Prop
ortion
of b
usinesses
receiving orde
rs over the
Internet
Prop
ortion
of b
usinesses
placing orde
rs over the Internet
Prop
ortion
of b
usinesses
accessing the Internet by type
of access
Prop
ortion
of b
usinesses with a
Local A
rea Network (LAN)
Prop
ortion
of b
usinesses with
an extrane
t
Prop
ortion
of b
usinesses using
the Internet by type
of a
ctivity
Prop
ortion
of total business
sector workforce in
volved
in
the ICT sector
ICT sector sha
re of g
ross value
ad
ded
Total ind
icators available
% of ind
icators available
Country B1 B2 B3 B4 B5 B6 B7 B8 B9 B10 B11 B12 ICT‐1 ICT‐2
Grenada 0 0%
Guatemala 0 0%
Guyana 0 0%
Haiti 0 0%
Honduras 0 0%
Jamaica 0 0%
Mexico √ √ 0 0%
Nicaragua 0 0%
Panama 0 0%
Paraguay 0 0%
Peru 0 0%
St. Kitts and Nevis 0 0%
St. Lucia 0 0%
St. Vincent and the Grenadines
0 0%
Suriname 0 0%
Trinidad & Tobago 0 0%
Uruguay 0 0%
Venezuela 0 0%

40
Prop
ortion
of b
usinesses using
compu
ters
Prop
ortion
of e
mployees using
compu
ters
Prop
ortion
of b
usinesses using
the Internet
Prop
ortion
of e
mployees using
the Internet
Prop
ortion
of b
usinesses with a
web
site
Prop
ortion
of b
usinesses with
an intran
et
Prop
ortion
of b
usinesses
receiving orde
rs over the
Internet
Prop
ortion
of b
usinesses
placing orde
rs over the Internet
Prop
ortion
of b
usinesses
accessing the Internet by type
of access
Prop
ortion
of b
usinesses with a
Local A
rea Network (LAN)
Prop
ortion
of b
usinesses with
an extrane
t
Prop
ortion
of b
usinesses using
the Internet by type
of a
ctivity
Prop
ortion
of total business
sector workforce in
volved
in
the ICT sector
ICT sector sha
re of g
ross value
ad
ded
Total ind
icators available
% of ind
icators available
Country B1 B2 B3 B4 B5 B6 B7 B8 B9 B10 B11 B12 ICT‐1 ICT‐2
Bermuda √ √ √ √ √ √ √ √ √ √ 8 80%
Total Latin America and the Caribbean
6 5 6 5 6 5 6 6 4 4 4 4 4 4 53
Other countries (mainly OECD)
Andorra 0 0%
Australia √ √ √ √ √ √ √ √ √ 6 60%
Austria √ √ √ √ √ √ √ √ √ √ √ √ √ √ 10 100%
Belgium √ √ √ √ √ √ √ √ √ √ √ √ √ √ 10 100%
Bulgaria √ √ √ √ √ √ √ √ √ √ √ √ 10 100%
Canada √ √ √ √ √ √ √ √ √ √ 7 70%
Cyprus √ √ √ √ √ √ √ √ √ √ √ √ 10 100%
Czech Republic √ √ √ √ √ √ √ √ √ √ √ √ 10 100%
Denmark √ √ √ √ √ √ √ √ √ √ √ √ 10 100%
Estonia √ √ √ √ √ √ √ √ √ √ √ 9 90%
Finland √ √ √ √ √ √ √ √ √ √ √ √ 10 100%
France √ √ √ √ √ √ √ √ √ √ √ √ 10 100%
Germany √ √ √ √ √ √ √ √ √ √ √ √ 10 100%
Greece √ √ √ √ √ √ √ √ √ √ √ √ 10 100%
Hungary √ √ √ √ √ √ √ √ √ √ √ √ 10 100%
41
Prop
ortion
of b
usinesses using
compu
ters
Prop
ortion
of e
mployees using
compu
ters
Prop
ortion
of b
usinesses using
the Internet
Prop
ortion
of e
mployees using
the Internet
Prop
ortion
of b
usinesses with a
web
site
Prop
ortion
of b
usinesses with
an intran
et
Prop
ortion
of b
usinesses
receiving orde
rs over the
Internet
Prop
ortion
of b
usinesses
placing orde
rs over the Internet
Prop
ortion
of b
usinesses
accessing the Internet by type
of access
Prop
ortion
of b
usinesses with a
Local A
rea Network (LAN)
Prop
ortion
of b
usinesses with
an extrane
t
Prop
ortion
of b
usinesses using
the Internet by type
of a
ctivity
Prop
ortion
of total business
sector workforce in
volved
in
the ICT sector
ICT sector sha
re of g
ross value
ad
ded
Total ind
icators available
% of ind
icators available
Country B1 B2 B3 B4 B5 B6 B7 B8 B9 B10 B11 B12 ICT‐1 ICT‐2
Iceland √ √ √ √ √ √ √ √ √ √ √ √ 10 100%
Ireland √ √ √ √ √ √ √ √ √ √ √ √ 10 100%
Israel √ 0 0%
Italy √ √ √ √ √ √ √ √ √ √ √ √ 10 100%
Japan √ √ √ √ √ √ √ √ √ √ 7 70%
Korea (Rep.) √ √ √ √ √ √ √ √ √ √ √ √ 10 100%
Latvia √ √ √ √ √ √ √ √ √ √ √ √ 10 100%
Liechtenstein 0 0%
Lithuania √ √ √ √ √ √ √ √ √ √ √ √ 10 100%
Luxembourg √ √ √ √ √ √ √ √ √ √ √ √ 10 100%
Malta √ √ √ √ √ √ √ √ √ √ √ √ 10 100%
Monaco 0 0%
Netherlands √ √ √ √ √ √ √ √ √ √ √ √ 10 100%
New Zealand √ √ √ √ √ √ √ √ √ √ √ √ √ 10 100%
Norway √ √ √ √ √ √ √ √ √ √ √ √ 10 100%
Poland √ √ √ √ √ √ √ √ √ √ √ √ 10 100%
Portugal √ √ √ √ √ √ √ √ √ √ √ √ 10 100%
Romania √ √ √ √ √ √ √ √ √ √ √ √ 10 100%
San Marino 0 0%
42
Prop
ortion
of b
usinesses using
compu
ters
Prop
ortion
of e
mployees using
compu
ters
Prop
ortion
of b
usinesses using
the Internet
Prop
ortion
of e
mployees using
the Internet
Prop
ortion
of b
usinesses with a
web
site
Prop
ortion
of b
usinesses with
an intran
et
Prop
ortion
of b
usinesses
receiving orde
rs over the
Internet
Prop
ortion
of b
usinesses
placing orde
rs over the Internet
Prop
ortion
of b
usinesses
accessing the Internet by type
of access
Prop
ortion
of b
usinesses with a
Local A
rea Network (LAN)
Prop
ortion
of b
usinesses with
an extrane
t
Prop
ortion
of b
usinesses using
the Internet by type
of a
ctivity
Prop
ortion
of total business
sector workforce in
volved
in
the ICT sector
ICT sector sha
re of g
ross value
ad
ded
Total ind
icators available
% of ind
icators available
Country B1 B2 B3 B4 B5 B6 B7 B8 B9 B10 B11 B12 ICT‐1 ICT‐2
Slovak Republic √ √ √ √ √ √ √ √ √ √ √ √ 10 100%
Slovenia √ √ √ √ √ √ √ √ √ √ √ √ 10 100%
Spain √ √ √ √ √ √ √ √ √ √ √ √ 10 100%
Sweden √ √ √ √ √ √ √ √ √ √ √ √ 10 100%
Switzerland √ √ √ √ √ √ √ √ √ √ √ √ √ 9 90%
United Kingdom √ √ √ √ √ √ √ √ √ √ √ √ 10 100%
United States √ √ 0 0%
Total other countries
34 31 35 32 35 34 35 35 35 32 34 34 8 5 318
Western Asia Bahrain 0 0%
Egypt √ √ √ √ √ √ √ √ √ √ √ √ √ 10 100%
Iraq 0 0%
Jordan √ √ √ √ √ √ √ √ √ √ √ √ √ 10 100%
Kuwait 0 0%
Lebanon 0 0%
Oman 0 0%
Qatar √ √ √ √ √ √ √ √ √ √ √ √ 10 100%

43
Prop
ortion
of b
usinesses using
compu
ters
Prop
ortion
of e
mployees using
compu
ters
Prop
ortion
of b
usinesses using
the Internet
Prop
ortion
of e
mployees using
the Internet
Prop
ortion
of b
usinesses with a
web
site
Prop
ortion
of b
usinesses with
an intran
et
Prop
ortion
of b
usinesses
receiving orde
rs over the
Internet
Prop
ortion
of b
usinesses
placing orde
rs over the Internet
Prop
ortion
of b
usinesses
accessing the Internet by type
of access
Prop
ortion
of b
usinesses with a
Local A
rea Network (LAN)
Prop
ortion
of b
usinesses with
an extrane
t
Prop
ortion
of b
usinesses using
the Internet by type
of a
ctivity
Prop
ortion
of total business
sector workforce in
volved
in
the ICT sector
ICT sector sha
re of g
ross value
ad
ded
Total ind
icators available
% of ind
icators available
Country B1 B2 B3 B4 B5 B6 B7 B8 B9 B10 B11 B12 ICT‐1 ICT‐2
Saudi Arabia 0 0%
Syria 0 0%
United Arab Emirates √ √ √ √ √ √ √ √ √ √ 8 80%
Yemen 0 0%
Palestinian Authority √ √ √ √ √ √ √ √ √ √ √ √ 10 100%
Total Western Asia 5 4 5 4 5 5 5 5 5 5 5 5 2 0 48
Source: UNCTAD.
44
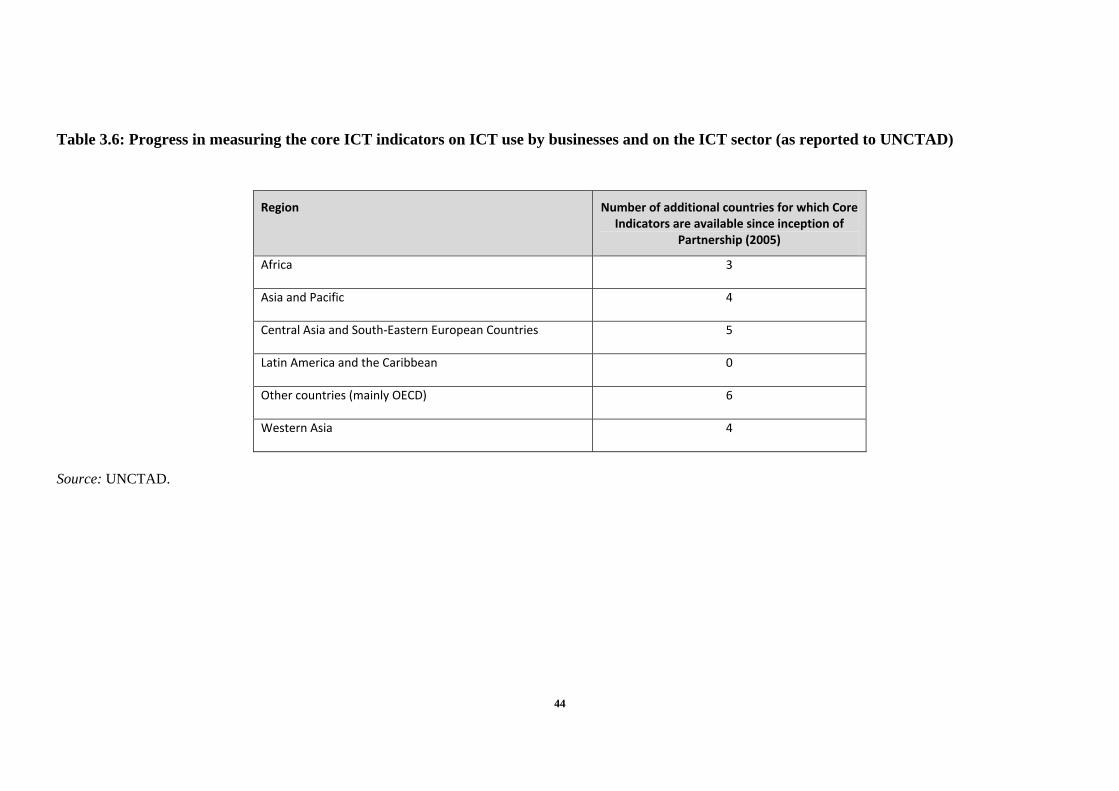
Table 3.6: Progress in measuring the core ICT indicators on ICT use by businesses and on the ICT sector (as reported to UNCTAD)
Region Number of additional countries for which Core Indicators are available since inception of
Partnership (2005)
Africa 3
Asia and Pacific 4
Central Asia and South‐Eastern European Countries 5
Latin America and the Caribbean 0
Other countries (mainly OECD) 6
Western Asia 4
Source: UNCTAD.
45
Table 3.7: Availability of the core indicators on ICT in education, 2008-2010 (as reported to UIS)
Country
Proportion of schools with a radio used for educational purposes (for ISCED 1‐3)
Proportion of schools with a television used for
educational purposes (for ISCED 1‐3)
Proportion of schools with a telephone
communication facility (for ISCED 1‐3)
Learners‐to‐computer for pedagogical use ratio (for ISCED 1‐3)
Proportion of schools with access to the Internet out of ALL schools (for
ISCED 1‐3)
Proportion of learners enrolled in programmes
offering computer‐assisted
instruction (for ISCED 1‐3)
Proportion of ICT‐qualified teachers in primary and secondary schools
Proportion of schools
with electricity (for ISCED
1‐3)
Total indicators available
% of indicators available
ED1 ED2 ED3 ED4bis ED5 (R) ED6bis ED8 EDR1
Africa
Algeria 0 0%
Angola 0 0%
Benin 0 0%
Botswana 0 0%
Burkina Faso 0 0%
Burundi 0 0%
Cameroon 0 0%
Cape Verde 0 0%
Central African Rep. 0 0%
Chad 0 0%
Comoros 0 0%
Congo 0 0%
Congo (Dem. Rep.) 0 0%
Côte d'Ivoire 0 0%
Djibouti 0 0%
Equatorial Guinea 0 0%
Eritrea 0 0%
Ethiopia √ √ √ 3 38%

46
Country
Proportion of schools with a radio used for educational purposes (for ISCED 1‐3)
Proportion of schools with a television used for
educational purposes (for ISCED 1‐3)
Proportion of schools with a telephone
communication facility (for ISCED 1‐3)
Learners‐to‐computer for pedagogical use ratio (for ISCED 1‐3)
Proportion of schools with access to the Internet out of ALL schools (for
ISCED 1‐3)
Proportion of learners enrolled in programmes
offering computer‐assisted
instruction (for ISCED 1‐3)
Proportion of ICT‐qualified teachers in primary and secondary schools
Proportion of schools
with electricity (for ISCED
1‐3)
Total indicators available
% of indicators available
ED1 ED2 ED3 ED4bis ED5 (R) ED6bis ED8 EDR1
Gabon 0 0%
Gambia 0 0%
Ghana √ √ √ 3 38%
Guinea 0 0%
Guinea‐Bissau 0 0%
Kenya 0 0%
Lesotho 0 0%
Liberia 0 0%
Libya 0 0%
Madagascar 0 0%
Malawi 0 0%
Mali 0 0%
Mauritania 0 0%
Mauritius √ √ √ √ √ √ √ 7 88%
Morocco √ √ √ √ √ 5 63%
Mozambique 0 0%
Namibia 0 0%
Niger 0 0%
Nigeria 0 0%
Rwanda 0 0%
S. Tomé & Principe 0 0%
Senegal √ √ √ 3 38%
47
Country
Proportion of schools with a radio used for educational purposes (for ISCED 1‐3)
Proportion of schools with a television used for
educational purposes (for ISCED 1‐3)
Proportion of schools with a telephone
communication facility (for ISCED 1‐3)
Learners‐to‐computer for pedagogical use ratio (for ISCED 1‐3)
Proportion of schools with access to the Internet out of ALL schools (for
ISCED 1‐3)
Proportion of learners enrolled in programmes
offering computer‐assisted
instruction (for ISCED 1‐3)
Proportion of ICT‐qualified teachers in primary and secondary schools
Proportion of schools
with electricity (for ISCED
1‐3)
Total indicators available
% of indicators available
ED1 ED2 ED3 ED4bis ED5 (R) ED6bis ED8 EDR1
Seychelles 0 0%
Sierra Leone 0 0%
Somalia 0 0%
South Africa 0 0%
South Sudan 0 0%
Sudan 0 0%
Swaziland 0 0%
Tanzania 0 0%
Togo 0 0%
Tunisia √ √ √ √ √ √ 6 75%
Uganda 0 0%
Zambia 0 0%
Zimbabwe 0 0%
Africa 4 2 3 2 5 2 3 6
% of countries 8% 4% 6% 4% 9% 4% 6% 11%
Asia and Pacific
Afghanistan 0 0%
Bangladesh 0 0%
Bhutan 0 0%
Brunei Darussalam 0 0%
Cambodia 0 0%

48
Country
Proportion of schools with a radio used for educational purposes (for ISCED 1‐3)
Proportion of schools with a television used for
educational purposes (for ISCED 1‐3)
Proportion of schools with a telephone
communication facility (for ISCED 1‐3)
Learners‐to‐computer for pedagogical use ratio (for ISCED 1‐3)
Proportion of schools with access to the Internet out of ALL schools (for
ISCED 1‐3)
Proportion of learners enrolled in programmes
offering computer‐assisted
instruction (for ISCED 1‐3)
Proportion of ICT‐qualified teachers in primary and secondary schools
Proportion of schools
with electricity (for ISCED
1‐3)
Total indicators available
% of indicators available
ED1 ED2 ED3 ED4bis ED5 (R) ED6bis ED8 EDR1
China 0 0%
D.P.R. Korea 0 0%
Fiji 0 0%
Hong Kong, China 0 0%
India 0 0%
Indonesia 0 0%
Iran (I.R.) 0 0%
Kiribati 0 0%
Lao P.D.R. 0 0%
Macao, China 0 0%
Malaysia √ √ √ √ √ √ √ √ 8 100%
Maldives 0 0%
Marshall Islands 0 0%
Micronesia 0 0%
Mongolia 0 0%
Myanmar 0 0%
Nauru 0 0%
Nepal 0 0%
Pakistan 0 0%
Papua New Guinea 0 0%
Philippines 0 0%
49
Country
Proportion of schools with a radio used for educational purposes (for ISCED 1‐3)
Proportion of schools with a television used for
educational purposes (for ISCED 1‐3)
Proportion of schools with a telephone
communication facility (for ISCED 1‐3)
Learners‐to‐computer for pedagogical use ratio (for ISCED 1‐3)
Proportion of schools with access to the Internet out of ALL schools (for
ISCED 1‐3)
Proportion of learners enrolled in programmes
offering computer‐assisted
instruction (for ISCED 1‐3)
Proportion of ICT‐qualified teachers in primary and secondary schools
Proportion of schools
with electricity (for ISCED
1‐3)
Total indicators available
% of indicators available
ED1 ED2 ED3 ED4bis ED5 (R) ED6bis ED8 EDR1
Samoa 0 0%
Singapore 0 0%
Solomon Islands 0 0%
Sri Lanka 0 0%
Thailand 0 0%
Timor‐Leste 0 0%
Tonga 0 0%
Turkey 0 0%
Tuvalu 0 0%
Vanuatu 0 0%
Viet Nam 0 0%
Asia and Pacific 1 1 1 1 1 1 1 1
% of countries 3% 3% 3% 3% 3% 3% 3% 3%
Central Asia and South‐Eastern European Countries
Albania 0 0%
Armenia 0 0%
Azerbaijan 0 0%
Belarus √ √ √ √ √ √ 6 75% Bosnia and Herzegovina
0 0%
Croatia 0 0%
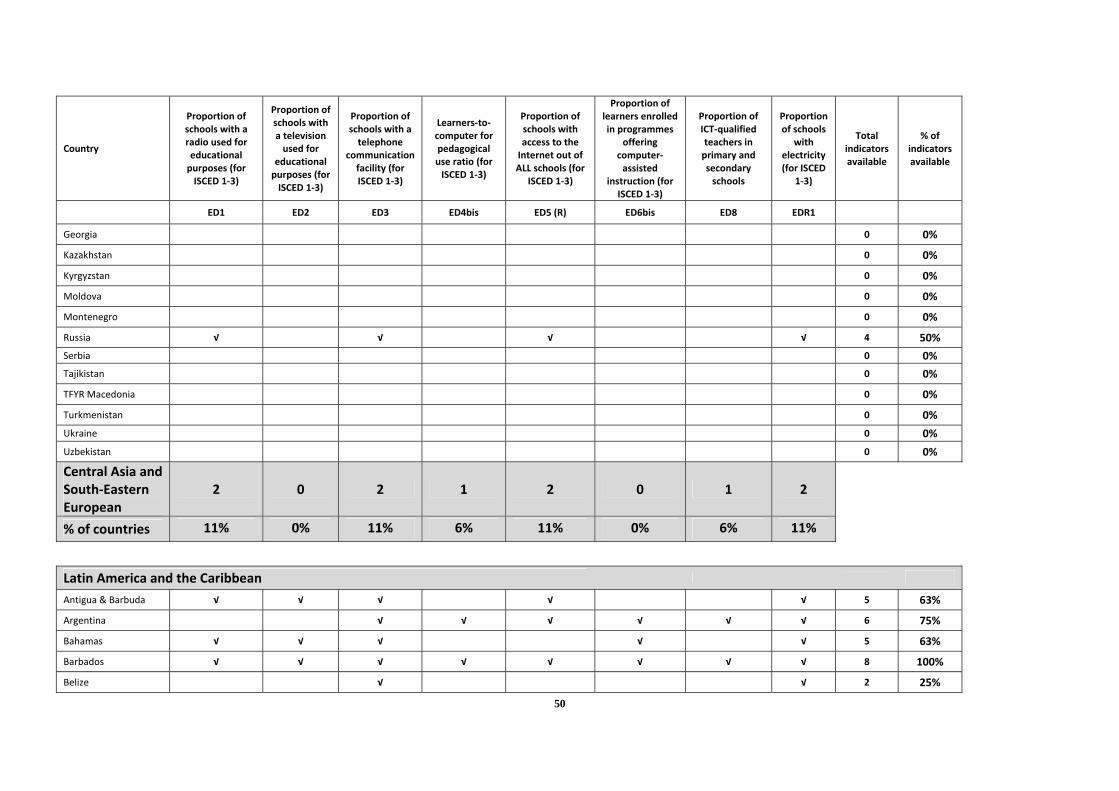
50
Country
Proportion of schools with a radio used for educational purposes (for ISCED 1‐3)
Proportion of schools with a television used for
educational purposes (for ISCED 1‐3)
Proportion of schools with a telephone
communication facility (for ISCED 1‐3)
Learners‐to‐computer for pedagogical use ratio (for ISCED 1‐3)
Proportion of schools with access to the Internet out of ALL schools (for
ISCED 1‐3)
Proportion of learners enrolled in programmes
offering computer‐assisted
instruction (for ISCED 1‐3)
Proportion of ICT‐qualified teachers in primary and secondary schools
Proportion of schools
with electricity (for ISCED
1‐3)
Total indicators available
% of indicators available
ED1 ED2 ED3 ED4bis ED5 (R) ED6bis ED8 EDR1
Georgia 0 0%
Kazakhstan 0 0%
Kyrgyzstan 0 0%
Moldova 0 0%
Montenegro 0 0%
Russia √ √ √ √ 4 50%
Serbia 0 0%
Tajikistan 0 0%
TFYR Macedonia 0 0%
Turkmenistan 0 0%
Ukraine 0 0%
Uzbekistan 0 0%
Central Asia and South‐Eastern European
2 0 2 1 2 0 1 2
% of countries 11% 0% 11% 6% 11% 0% 6% 11%
Latin America and the Caribbean
Antigua & Barbuda √ √ √ √ √ 5 63%
Argentina √ √ √ √ √ √ 6 75%
Bahamas √ √ √ √ √ 5 63%
Barbados √ √ √ √ √ √ √ √ 8 100%
Belize √ √ 2 25%

51
Country
Proportion of schools with a radio used for educational purposes (for ISCED 1‐3)
Proportion of schools with a television used for
educational purposes (for ISCED 1‐3)
Proportion of schools with a telephone
communication facility (for ISCED 1‐3)
Learners‐to‐computer for pedagogical use ratio (for ISCED 1‐3)
Proportion of schools with access to the Internet out of ALL schools (for
ISCED 1‐3)
Proportion of learners enrolled in programmes
offering computer‐assisted
instruction (for ISCED 1‐3)
Proportion of ICT‐qualified teachers in primary and secondary schools
Proportion of schools
with electricity (for ISCED
1‐3)
Total indicators available
% of indicators available
ED1 ED2 ED3 ED4bis ED5 (R) ED6bis ED8 EDR1
Bolivia √ √ 2 25%
Brazil √ √ √ √ √ 5 63%
Chile √ √ 2 25%
Colombia √ √ √ 3 38%
Costa Rica √ √ √ √ √ √ √ 7 88%
Cuba ‐ √ √ √ √ √ 6 75%
Dominica √ √ √ √ √ √ √ 7 88%
Dominican Rep. √ √ √ √ √ √ √ 7 88%
Ecuador ‐ √ √ √ √ 5 63%
El Salvador √ √ √ √ √ 5 63%
Grenada √ √ √ √ √ √ √ 7 88%
Guatemala √ √ √ √ √ 5 63%
Guyana √ √ √ 3 38%
Haiti 0 0%
Honduras 0 0%
Jamaica √ √ √ 3 38%
Mexico √ 1 13%
Nicaragua √ √ √ 3 38%
Panama √ √ 2 25%
Paraguay √ √ √ √ √ √ 6 75%
Peru 0 0%
St. Kitts and Nevis √ √ √ √ √ 5 63%
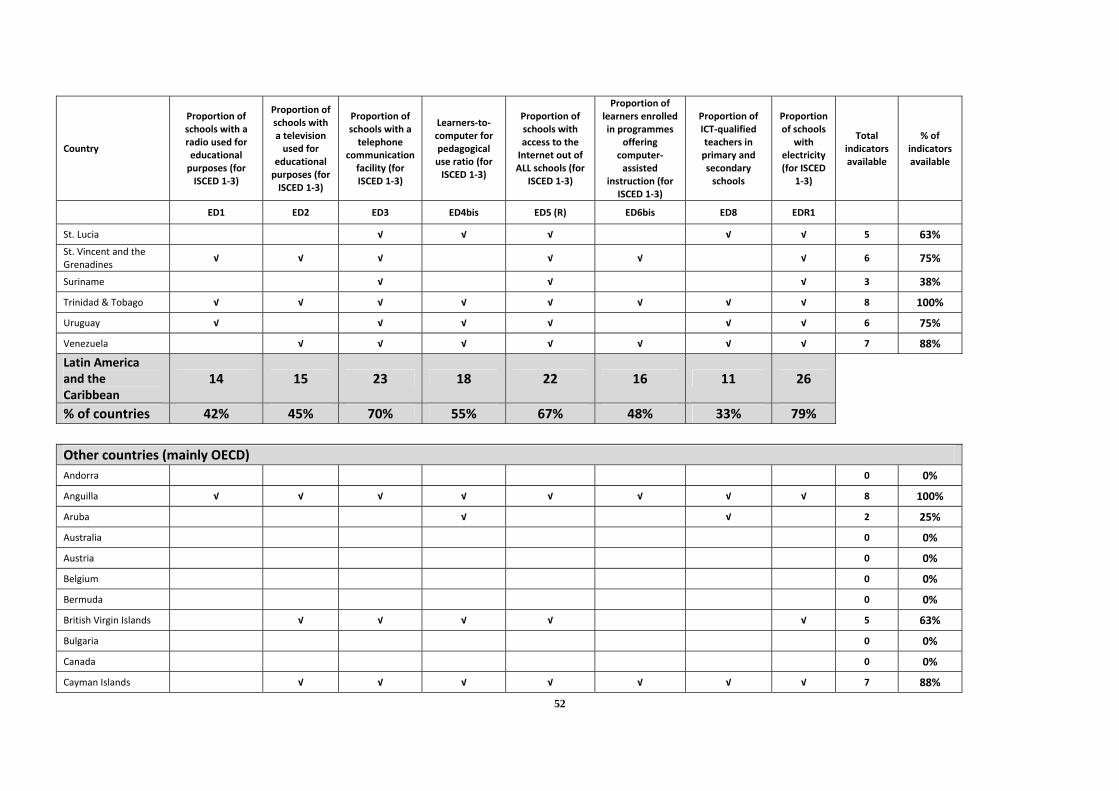
52
Country
Proportion of schools with a radio used for educational purposes (for ISCED 1‐3)
Proportion of schools with a television used for
educational purposes (for ISCED 1‐3)
Proportion of schools with a telephone
communication facility (for ISCED 1‐3)
Learners‐to‐computer for pedagogical use ratio (for ISCED 1‐3)
Proportion of schools with access to the Internet out of ALL schools (for
ISCED 1‐3)
Proportion of learners enrolled in programmes
offering computer‐assisted
instruction (for ISCED 1‐3)
Proportion of ICT‐qualified teachers in primary and secondary schools
Proportion of schools
with electricity (for ISCED
1‐3)
Total indicators available
% of indicators available
ED1 ED2 ED3 ED4bis ED5 (R) ED6bis ED8 EDR1
St. Lucia √ √ √ √ √ 5 63% St. Vincent and the Grenadines
√ √ √ √ √ √ 6 75%
Suriname √ √ √ 3 38%
Trinidad & Tobago √ √ √ √ √ √ √ √ 8 100%
Uruguay √ √ √ √ √ √ 6 75%
Venezuela √ √ √ √ √ √ √ 7 88%
Latin America and the Caribbean
14 15 23 18 22 16 11 26
% of countries 42% 45% 70% 55% 67% 48% 33% 79% Other countries (mainly OECD) Andorra 0 0%
Anguilla √ √ √ √ √ √ √ √ 8 100%
Aruba √ √ 2 25%
Australia 0 0%
Austria 0 0%
Belgium 0 0%
Bermuda 0 0%
British Virgin Islands √ √ √ √ √ 5 63%
Bulgaria 0 0%
Canada 0 0%
Cayman Islands √ √ √ √ √ √ √ 7 88%

53
Country
Proportion of schools with a radio used for educational purposes (for ISCED 1‐3)
Proportion of schools with a television used for
educational purposes (for ISCED 1‐3)
Proportion of schools with a telephone
communication facility (for ISCED 1‐3)
Learners‐to‐computer for pedagogical use ratio (for ISCED 1‐3)
Proportion of schools with access to the Internet out of ALL schools (for
ISCED 1‐3)
Proportion of learners enrolled in programmes
offering computer‐assisted
instruction (for ISCED 1‐3)
Proportion of ICT‐qualified teachers in primary and secondary schools
Proportion of schools
with electricity (for ISCED
1‐3)
Total indicators available
% of indicators available
ED1 ED2 ED3 ED4bis ED5 (R) ED6bis ED8 EDR1
Curaçao 0 0%
Cyprus 0 0%
Czech Republic 0 0%
Denmark 0 0%
Estonia 0 0%
Falkland (Malvinas) Is. 0 0%
Finland √ √ √ √ √ 5 63%
France 0 0%
Germany 0 0%
Greece 0 0%
Greenland 0 0%
Iceland 0 0%
Ireland 0 0%
Israel 0 0%
Italy 0 0%
Japan 0 0%
Korea (Rep.) √ √ √ √ √ √ √ √ 8 100%
Latvia 0 0%
Liechtenstein 0 0%
Lithuania 0 0%
Luxembourg 0 0%
Malta 0 0%

54
Country
Proportion of schools with a radio used for educational purposes (for ISCED 1‐3)
Proportion of schools with a television used for
educational purposes (for ISCED 1‐3)
Proportion of schools with a telephone
communication facility (for ISCED 1‐3)
Learners‐to‐computer for pedagogical use ratio (for ISCED 1‐3)
Proportion of schools with access to the Internet out of ALL schools (for
ISCED 1‐3)
Proportion of learners enrolled in programmes
offering computer‐assisted
instruction (for ISCED 1‐3)
Proportion of ICT‐qualified teachers in primary and secondary schools
Proportion of schools
with electricity (for ISCED
1‐3)
Total indicators available
% of indicators available
ED1 ED2 ED3 ED4bis ED5 (R) ED6bis ED8 EDR1
Monaco 0 0%
Montserrat √ √ √ √ √ √ √ √ 8 100%
Netherlands 0 0%
New Zealand 0 0%
Norway √ √ √ √ 4 50%
Poland √ √ √ 3 38%
Portugal 0 0%
Puerto Rico 0 0%
Romania 0 0%
San Marino 0 0%
St. Pierre & Miquelon 0 0%
Sint Maarten √ √ √ 3 38%
Slovak Republic 0 0%
Slovenia 0 0%
Spain 0 0%
Sweden √ √ √ √ √ 5 63%
Switzerland 0 0%
Turks & Caicos Is. √ √ √ √ √ √ √ √ 8 100%
United Kingdom 0 0%
United States 0 0%
Virgin Islands (US) 0 0%
Other countries (mainly OECD)
9 9 12 7 11 5 7 12
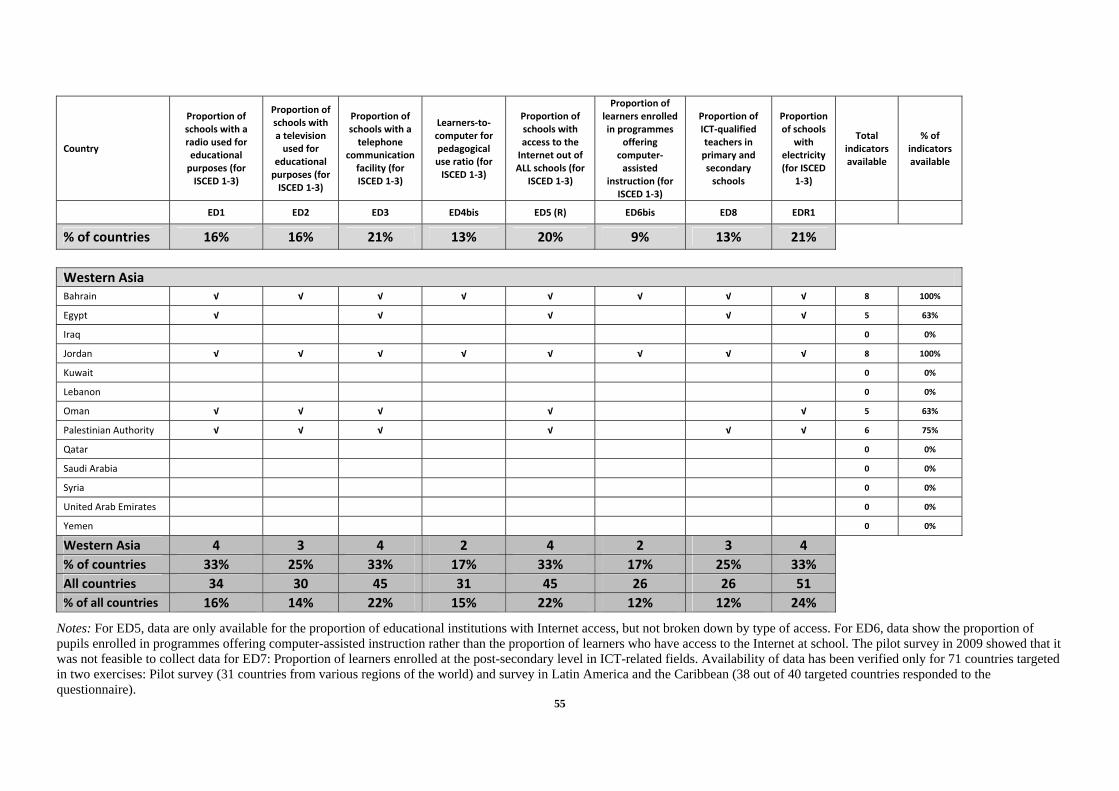
55
Country
Proportion of schools with a radio used for educational purposes (for ISCED 1‐3)
Proportion of schools with a television used for
educational purposes (for ISCED 1‐3)
Proportion of schools with a telephone
communication facility (for ISCED 1‐3)
Learners‐to‐computer for pedagogical use ratio (for ISCED 1‐3)
Proportion of schools with access to the Internet out of ALL schools (for
ISCED 1‐3)
Proportion of learners enrolled in programmes
offering computer‐assisted
instruction (for ISCED 1‐3)
Proportion of ICT‐qualified teachers in primary and secondary schools
Proportion of schools
with electricity (for ISCED
1‐3)
Total indicators available
% of indicators available
ED1 ED2 ED3 ED4bis ED5 (R) ED6bis ED8 EDR1
% of countries 16% 16% 21% 13% 20% 9% 13% 21%
Western Asia Bahrain √ √ √ √ √ √ √ √ 8 100%
Egypt √ √ √ √ √ 5 63%
Iraq 0 0%
Jordan √ √ √ √ √ √ √ √ 8 100%
Kuwait 0 0%
Lebanon 0 0%
Oman √ √ √ √ √ 5 63%
Palestinian Authority √ √ √ √ √ √ 6 75%
Qatar 0 0%
Saudi Arabia 0 0%
Syria 0 0%
United Arab Emirates 0 0%
Yemen 0 0%
Western Asia 4 3 4 2 4 2 3 4
% of countries 33% 25% 33% 17% 33% 17% 25% 33%
All countries 34 30 45 31 45 26 26 51
% of all countries 16% 14% 22% 15% 22% 12% 12% 24%
Notes: For ED5, data are only available for the proportion of educational institutions with Internet access, but not broken down by type of access. For ED6, data show the proportion of pupils enrolled in programmes offering computer-assisted instruction rather than the proportion of learners who have access to the Internet at school. The pilot survey in 2009 showed that it was not feasible to collect data for ED7: Proportion of learners enrolled at the post-secondary level in ICT-related fields. Availability of data has been verified only for 71 countries targeted in two exercises: Pilot survey (31 countries from various regions of the world) and survey in Latin America and the Caribbean (38 out of 40 targeted countries responded to the questionnaire).

56
Source: UIS.


![EIGHTY-THIRD SESSION 2003 FORTY-SEVENTH DAY S P , T , M … · 47TH DAY] THURSDAY, MAY 1, 2003 3173 STATE OF MINNESOTA EIGHTY-THIRD SESSION 2003 _____ FORTY-SEVENTH DAY SAINT PAUL,](https://cdn.vdocuments.mx/doc/165x107/5f08c6307e708231d423a85f/eighty-third-session-2003-forty-seventh-day-s-p-t-m-47th-day-thursday-may.jpg)

