
Ecological Economics 87 (2013) 75–83
Contents lists available at SciVerse ScienceDirect
Ecological Economics
j ourna l homepage: www.e lsev ie r .com/ locate /eco lecon
Analysis
Stakeholders' incentives for land-use change and REDD+: The case of Indonesia
Silvia Irawan a,⁎, Luca Tacconi a, Irene Ring b
a Crawford School of Public Policy, The Australian National University, Canberra, Australiab UFZ — Helmholtz Centre for Environmental Research, Department of Economics, Leipzig, Germany
⁎ Corresponding author at: Crawford School of PublicCrossing, The Australian National University, Canberra,6281916196111.
E-mail address: [email protected] (S. Irawan)
0921-8009/$ – see front matter © 2013 Elsevier B.V. Allhttp://dx.doi.org/10.1016/j.ecolecon.2012.12.018
a b s t r a c t
a r t i c l e i n f oArticle history:Received 2 September 2011Received in revised form 4 September 2012Accepted 17 December 2012Available online 23 January 2013
Keywords:REDD+DeforestationOpportunity costsDiscount ratesDecentralisationIndonesia
The opportunity costs of Reducing Emissions fromDeforestation and Forest Degradation (REDD+) accruing todifferent stakeholders in Indonesia, including companies and the national, provincial and district level govern-ments, are estimated, with particular emphasis on the influence of alternative discount rates. A cost–benefitanalysis of the opportunity costs of avoided deforestation is conducted. The three major land-use activitiesconsidered are commercial logging, timber and oil palm plantation. The opportunity cost of oil palm plantationson mineral soil preceded by logging of degraded forest is prohibitively high. REDD+ measures that imposerestrictions on the development of those land-use activities would lead to a substantial loss of public revenuesat the various government levels. The results of this study reveal that land-use management in Indonesia israther centralistic, where the national government retains most of the revenues from land-use alternatives toREDD+. To influence their behaviour towards land-use change, REDD+ schemes need to create a direct linkbetween the distribution of public revenues and district governments' decisions on land-use activities in theirlocalities.
© 2013 Elsevier B.V. All rights reserved.
1. Introduction
The agreement on Reducing Emissions from Deforestation andForest Degradation (REDD+) reached at the 2010 Cancun meetingof the UN Framework Convention on Climate Change (UNFCCC) wasexpected to result in the provision of significant amounts of fundsfrom developed to developing countries. Research on the economicsof REDD+ focused, therefore, on estimating the costs of REDD+and the required flow of funds at the global, national, and sectorallevels (for example, Bellassen and Gitz, 2008; Boucher, 2008; Butleret al., 2009; Grieg-Gran, 2008; Kindermann et al., 2008; Pagiolaand Bosquet, 2008; Wertz-Kanounnikoff, 2008). Depending on themethods used, global reviews of the opportunity costs of REDD+estimate them to lie between US$2.51/tCO2 (Boucher, 2008) and arange of US$10 to 21/tCO2 (Kindermann et al., 2008). Funding todeveloping countries on a significant scale will only take place, how-ever, if a functioning REDD+ mechanism is actually developed. Prog-ress on such a mechanism has been limited, partly because of the lackof progress on an overall agreement on climate change (within whichREDD+ was expected to be implemented), but also because REDD+does not seem to be as cheap as initially suggested by the SternReview (Angelsen and McNeill, 2012). Angelsen and McNeill (2012)also stress that REDD+ is not as easy to be implemented as some
Policy, Building #132, LennoxACT 0200, Australia. Tel.: +61
.
rights reserved.
analysts had initially suggested (for example, see also Hansen et al.,2009).
This paper aims, therefore, to provide a two-fold contribution to thedebate about REDD+. Firstly, we present a more nuanced assessmentof the opportunity costs of implementing REDD+. This is significantbecause, while it has been emphasised that implementing REDD+may not be as cheap as initially thought, we demonstrate that evenfor oil palm cultivation (a very lucrative activity which has been thesubject of recent intense attention), there may be opportunities forthe cost effective implementation of REDD+, if the significant emis-sions from peat land are taken into account.
Secondly, we contribute to the analysis of the complexities ofREDD+, and options for its implementation, by considering the dis-tribution of benefits from deforestation and forest degradation acrossthe various government levels, and the private sector. Previous stud-ies of opportunity costs (such as those cited above) focused on privatestakeholders — namely, companies and smallholders. However, thelegal framework determining the rights over forests needs to be con-sidered in estimating the opportunity costs of REDD+ and the associ-ated incentives at the national level. The legal framework regulateswho owns forests, who bears the costs of the implementation ofREDD+ activities and, therefore, who should receive appropriate in-centives to change deforestation-related behaviour (Gregersen et al.,2010). When the state claims ownership of forests – a situation com-mon in many of the top deforesting countries (Tacconi et al., 2010) –the opportunity cost it faces in reducing emissions from forests isequal to the revenue stream it forgoes for not issuing permits forincome-generating activities in forests (Gregersen et al., 2010). The

76 S. Irawan et al. / Ecological Economics 87 (2013) 75–83
costs and incentives faced by governments in the implementationof REDD+ should also be considered, including those of local levelgovernments — as most countries responsible for emissions fromdeforestation and forest degradation have implemented some degreeof decentralisation in public administration and forest management(Irawan and Tacconi, 2009). Local governments often obtain (a shareof) revenues from timber extraction and agricultural development. Itis in the interest of local governments and their citizens, to whomthey are accountable in a democratic country, tomaximise the revenuesfrom resource utilisation (Tacconi, 2007).1 As REDD+ policies andmeasures might restrict local governments' capacity to generate thoserevenues, compensation to reconcile local costs with the benefits thatreach far beyond local boundaries may be required for local govern-ments to support the implementation of REDD+.
The analysis presented in this paper is grounded in the case ofIndonesia. The paper first presents the forest governance frameworkin Indonesia, which affects the distribution of incentives from forestryand land-use change. The opportunity costs of REDD+ accruing tothe national, provincial and local2 governments, and companies areestimated in relation to the provinces of Riau and Papua. The estima-tion of government's opportunity costs is based on taxes, fees andcharges generated by the alternative land-use activities, taking intoaccount the implications of adopting alternative discount rates, anissue that has not been clearly addressed by previous studies focusedon REDD+. The presentation of the results is followed by a discussionof the implications for REDD+, and the conclusion.
Before proceeding with the analysis, we emphasise that Indonesia isan important case study in its own right because it is the largest globalemitter of greenhouse gases from the forestry sector, if emissions frompeatlands are included (Houghton, 2003). Therefore, understanding thepolitical economyof REDD+ in Indonesia has globally relevant implica-tions. However, this case study of a decentralised country can also beconsidered typical of the situation in other forested countries giventhat decentralisation of forest management has been taking place inmany countries (Larson, 2005). Findings about a typical case study arerelevant to the broader population of cases (Gerring, 2008), and theyneed to be taken into account in developing or testing hypotheses.This applies therefore to the case of REDD+, which is hypothesised tobe applicable to all interested forested countries.
2. Forest Governance, Deforestation, and Public Revenuesin Indonesia
2.1. Governance, Deforestation and Forest Degradation
The Forestry Law 41/1999 grants the national Ministry of Forestrythe authority to manage 120 million ha of state forestland. Accordingto the Law, forested lands are classified into production, protection,and conservation forests. The main function of production forests is toproduce forest commodities, mainly timber. Some production forestsare also classified as conversion forests, which can be legally convertedto other non-forest land-use activities. Protection forests provide envi-ronmental services such as hydrological regulation, flood prevention,erosion control, avoidance of seawater intrusion and maintenance ofsoil fertility. Conservation forests, which include national parks andnature reserves, are intended to conserve biodiversity.
1 This does not imply that revenue maximisation is, or should be, the only parameterused by local governments to make decisions concerning the exploitations of naturalresources. There is evidence, however, that it is a significant determinant of forest re-sources management (exploitation). For example, see Barr et al. (2006) and Anderssonet al. (2006).
2 The third tier of government in Indonesia includes districts and municipalities, thelatter referring to city areas. We refer only to districts, as forests are not found in mu-nicipalities. Moreover, ‘subnational’ and ‘local’ levels are used interchangeably to referto both provincial and district levels.
A number of productive activities are permitted by law to exploitIndonesia's forests and often cause forest degradation and deforestation.Commercial logging is normally the first activity allowed to open upnatural forests legally. This activity requires the issuance of a commer-cial logging concession, which is granted for a 20-year period to performselective timber-cutting based on legal guidelines provided by theMinistry of Forestry (Kartodihardjo and Supriono, 2000). Over the past40 years, commercial logging operators have failed to implementsustainable forest management (Kartodihardjo and Supriono, 2000).According to 1998 data, 16.57 million ha out of 69.4 million ha underlogging concessions were degraded (Kartodihardjo and Supriono,2000). Forest degradation data for 2004 show that this trend continuedinto the first part of the 2000s (Nawir et al., 2007). The total area of de-graded production forest amounts to 14.2 million ha, with an additional13.6 million ha of logged-over areas. The area of degraded forest insidethe protection forest category in 2004 was reported at 8.1 million ha(Nawir et al., 2007).3
Despite the severe destruction of natural forests caused by loggingoperators, the government continued to issue logging permits in naturalforests to generate revenues and employment (Kartodihardjo andSupriono, 2000). Licences granted to logging operators that causedsevere forest degradation at the end of the concession period wereterminated in some cases, and the degraded forest handed over to astate-owned company for rehabilitation (Kartodihardjo and Supriono,2000; Nawir et al., 2007). However, one of the so-called rehabilitationpolicies actually involves converting severely degraded forest to com-mercial timber plantations. The underlying concept was to replaceforest vegetation (with a remaining standing stock of less than 16 m3
per hectare) with fast-growing species such as acacia (Kartodihardjoand Supriono, 2000; Nawir et al., 2007),4 thus legitimising forest degra-dation within commercial logging areas (Kartodihardjo and Supriono,2000).
According to the Forestry Law, conversion forests can be allocated toa number of purposes, including infrastructure and other land uses suchas agriculture, tree crop plantations and mining. Conversion forestsare not supposed to have significant tree cover or timber potential. Inreality, however, primary forests can also be found in areas designatedas conversion forests. In Papua, approximately 3.6 million ha of conver-sion forest are primary forest (Ministry of Forestry, 2008b). One of themajor drivers of the massive conversion of Indonesia's natural forest isthe establishment of oil palm plantations (Butler et al., 2009; Koh andWilcove, 2008; Sandker et al., 2007; Venter et al., 2009). Conversionof natural forests to oil palm plantations provides additional profitsfor plantation companies because timber is harvested and sold duringland-clearing at the beginning of operations. As a result, companiesseek to acquire areas larger than the areawhichwill actually be planted(Forest Watch Indonesia and Global Forest Watch, 2002; Kartodihardjoand Supriono, 2000).
2.2. Public Revenues from Forest and Land Use Change
The aforementioned land-use activities generate revenues for alllevels of government. Before discussing the methods and the revenuesgenerated by each activity, let us consider the existing decentralisedforest governance arrangements, including rules on the distribution ofpublic revenues.
District governments (elected by citizens) have the authority to pro-vide important public services, while provincial governments representthe national government. The authority to issue commercial logging
3 Forest degradation is defined as forested lands that are severely impacted by inten-sive and/or repeated disturbances, therefore, the abilities of forests to supply goodsand services are reduced (Nawir et al., 2007).
4 The precise definition of unproductive forests, however, varies. Since 1986, large-scale timber plantations must be allocated on unproductive forests, ranging from 5 to20 m3 commercial timber per hectare (Pirard, 2008).

Table 2Tax and fee rates related to logging and plantations.
Taxes and fees Rate
Oil palm plantationsLand and building tax 0.5×40%×determined value of the landValue added tax 10%×price of crude oil and kernel oil×yieldCorporation income tax 25%×net profit of companiesLand and building transfer fee 5%×determined value of the land
Commercial logging and timber plantationsReforestation levy
Dipterocarpaceae USD 16/m3 (Riau); US$ 13/m3 (Papua)Mixed tropical hardwood USD 13/m3 (Riau); US$ 10.5/m3 (Papua)Superior (prime) species USD 18/m3 (all regions)
Forest licence fee USD 0.289×total area (timber plantation in Sumatra)USD 1.67×total area (commercial logging in Papua)
Forest resource rent 10%×volume of timber harvested×timber priceDipterocarpaceae USD 7.1×volume of timber harvested (Riau)
USD 6×volume of timber harvested (Papua)Mixed tropical hardwood USD 4×volume of timber harvested (Riau)
USD 2.94×volume of timber harvested (Papua)Superior (prime) species USD 10.05×volume (all regions)Acacia USD 0.31×volume (all regions)
Land and building tax 0.5×40%×value of object at the selling pointCorporation income tax 30%×net profit of companies
Source: Government Regulation No. 59/1998; Government Regulation No. 74/1998;Government Regulation No. 92/1999; Ministerial Decree No. 859/Kpts-II/1999.
77S. Irawan et al. / Ecological Economics 87 (2013) 75–83
permits in production forests is still held by the national government.Provincial governments approve annual logging plans prepared byconcessionaires, while district governments provide technical recom-mendations to the national government related to logging operationswithin their administrative boundaries. Commercial logging extractionis considered the most lucrative activity in the forestry sector (Barret al., 2006). Public revenues collected by the national governmentfrom commercial logging comes from licence fees, forest rents, thereforestation fund, the land and building tax, and personal and corpora-tion income taxes.
All public revenues generated from commercial logging extrac-tion, except the corporation tax (which is retained by the nationalgovernment), are distributed amongst government levels using arevenue-sharing mechanism. A licence fee is paid when a timber con-cession is issued or renewed. The amount of fees charged depends onthe size of the concession area and whether it is a new licence or arenewal. The forest rent is a timber royalty, which is collected onthe basis of volume and the type of species harvested. The reforesta-tion fee is non-refundable and is based on the type of species, gradeand location of the wood harvested. Revenues are allocated acrossgovernmental levels according to percentages established in Law33/2004 and Government Regulation 55/2005 (see Tables 1 and 2).
District governments are authorised by Law 26/2007 on SpatialPlanning to develop local spatial plans according to guidelines andnorms established by the national government. Of particular signifi-cance to the research presented in this paper, district governmentscan submit proposals for land-use change within conversion foreststo the Ministry of Forestry. If forests are converted to crop plantationactivities, government at all levels also obtains revenues from othertaxes and charges. Charges applied to plantation activities are theland and building transfer fee, as well as taxes on land and buildings,personal and corporate incomes, and the market value added to plan-tation products. The national government retains the totality of thevalue added tax from plantation products and the corporate incometax. As with taxes on logging activities, the land and building taxand the fees from plantation activities are distributed back to districtsand provinces using the revenue-sharing scheme, thereby sustainingthe activities within their administrative boundaries. Governmentregulation 48/1997 stipulates that the tax on plantations of 25 ha ormore could be up to 40% of the selling value of the land. Other reve-nue sources for district governments related to plantation activitiesare the fees they charge on agricultural products. The form andamount of local fees on oil palm products varies between localities.
3. Methods
3.1. Opportunity Cost Analysis
The cost of implementing REDD+ includes opportunity costs,management costs and transaction costs. Opportunity costs are thebenefits of the best alternative land use that are forgone as a resultof reducing deforestation and forest degradation. Management costsarise from activities such as illegal logging prevention, research foragricultural intensification and land titling to provide traditional and
Table 1Percentage allocation of taxes and natural resource fees between government levels.
Revenue source National Provincial Originating d
Land and building tax 9 16.2 64.8Land and building transfer fee 0 16 64Personal income tax 80 8 12Forest licence fee 20 16 64Forest resource rent 20 16 32Reforestation levy (funds) 60 0 40
Source: Law 33/2004 on Fiscal Balance between the Central and Local Governments; Gover
indigenous communities with incentives to safeguard forests. Trans-action costs relate to the processes to identify and negotiate REDD+activities as well as to perform monitoring, reporting, verifying andcertification of carbon emission reductions. This paper focuses on theopportunity costs, as they are thought to account for the largest shareof the costs (Pagiola and Bosquet, 2008). It should be noted, however,that the other costs might not be insignificant. The transaction costsreported in the literature are in the range of US$0.01–16.40 per tCO2
(Wertz-Kanounnikoff, 2008), while the management costs, in theBrazilian Amazon for instance, were estimated at US$1–3 per hectareper year (Nepstad et al., 2009).
Approaches that are commonly used to estimate the opportunitycosts of REDD+ include local as well as global empirical models andglobal simulation models (Wertz-Kanounnikoff, 2008). Local empiri-cal models use data collected directly within a particular location,mostly through surveys. Based on the amount of carbon that wouldbe lost should deforestation take place, the benefits from the nextbest alternative land uses ($/ha) are then converted to the value ofper-tonne carbon dioxide equivalent ($/tCO2eq). The estimates fromlocal empirical models can be further aggregated to obtain globalper-area opportunity costs, which usually ignore the variation of car-bon density across space (Wertz-Kanounnikoff, 2008). Global simula-tion models estimate opportunity costs using dynamic models of theworld economy. Those models include important sectors that affectland use such as forestry, agriculture and energy (Kindermann et al.,2008; Wertz-Kanounnikoff, 2008). As this study assesses the oppor-tunity costs faced by different national stakeholders, it uses the localempirical approach.
istrict Other districts in the same province All districts in Indonesia
0 100 200 00 0
32 00 0
nment Regulation 55/2005.

0
200
400
600
800
1,000
1,200
1,400
1,600
1,800
2001 2002 2003 2004 2005 2006 2007 2008
Th
ou
san
ds
Commercial Logging Timber Plantation
Fig. 1. Logging concessions and timber plantations in Riau's production forests.Source: Forest Statistics 2001–2008 issued by the Ministry of Forestry.
78 S. Irawan et al. / Ecological Economics 87 (2013) 75–83
Different land users face different costs and benefits in reducingemissions, and the cost of pursuing REDD+ can be described by asupply curve (Boucher, 2008). We will consider, therefore, the differ-ent land uses separately in order to identify their relative costs andbenefits (and their distribution to the stakeholders) to assess whetherthey could be prioritised for cost-effective emission reductions.
It is important to emphasise that even when the same methodis applied (for example, the local empirical method), the estimatesof REDD+ opportunity costs – even those in the same country –canvary as a result of different data sources and, importantly, the dis-count rate used. For instance, the opportunity cost of oil palm inIndonesia has been estimated at US$9.85–33.44 per tCO2 on mineralsoil and US$1.63–4.66 per tCO2 on peat soil by Venter et al. (2009),and US$7.66–19.24 per tCO2 (without reference to soil types) byButler et al. (2009).5 The differences in estimates appear to be dueto the sources of data and the assumptions used as follows.
• Profit data for oil palm plantations: Butler et al. (2009) assessed theprofitability of a hypothetical oil palm plantation by calculatingyear-by-year yields and applying alternative pricing scenarios, where-as Venter et al. (2009) used profit data from published materials ofseveral companies operating in Indonesia. The profit data used byVenter et al. (2009) were the net profits (after taxes) of companies op-erating in Indonesia. Butler et al. (2009) did not consider governmenttaxes in their estimation of companies' net profits.
• Prices of palm oil: Butler et al. (2009) used price data and forecaststhrough to 2020 from The World Bank. They assumed that, under ahigh-price scenario, the price was constant at US$749/ton from2009 to 2039. Under a low-price scenario, they used the price ofUS$643/ton in 2010, which decreases to US$510 in 2020, and remainsat that level until 2039. Venter et al. (2009) did not state the price ofpalm oil used, as they use the net profit data from companies' reports.
• Carbon stock data: Butler et al. (2009) used an average amount ofavoided emissions of 682.92 tCO2/ha, while Venter et al. (2009) spa-tially estimated the avoided emissions in mineral and peat soil forestsat 389 tCO2/ha and 2249 tCO2/ha respectively. The assumed carbonlosses for the different land uses are reported in Table 4.
• Discount rates: Butler et al. (2009) used a 10% discount rate, whilstVenter et al. (2009) applied an 8% discount rate.
3.2. Discount Rate
According to Smith (2011), the choice of the discount rate dependsonwhether: i) thepolicy question ismarginal or non-marginal; ii) socialor private preferences should be considered; and iii) the country isdeveloped or developing (that is, the relative level of income). A policyaimed at implementing REDD+ over large areas for a long period oftime is a non-marginal policy. Non-marginal policies are evaluatedusing a social discount rate, rather than a market rate which reflectsprivate preferences (Smith, 2011). Social discount rates are lower thanprivate ones because, inter alia, social preferences place greater valueon thewelfare of future generations comparedwith private preferences.In relation to the development stage of a country, the Garnaut Review(2011) suggests that discount rates applied in developing countriesshould be higher than those in developed countries. This is due to thefact that the present generation in developing countries can be expectedto be significantly poorer than future ones, whereas the gap in welfarebetween generations is more limited in developed countries.
The social discount rates used by major assessments of climatechange policies, such as the Stern Review and the Garnaut Review,were as low as 1 to 2% (Smith, 2011). However, the most commonrate used by studies of the opportunity costs of REDD+ has been
5 Butler et al. (2009) report REDD opportunity costs from oil palm plantations areUS$3835–9630 per hectare, while the net carbon saving of avoided conversion is149 ton/ha.
10% (Grieg-Gran, 2008). To account for the gap between the wealthof different generations in a developing country such as Indonesia,we use a social discount rate of 5% based on the normative approach.This rate is significantly higher than that used in the Stern andGarnaut Reviews. A positive rate (determined from observation ofmarket data) could also be considered to approximate social prefer-ences, with the most appropriate one being the yield of long-termgovernment bonds (Smith, 2011). For Indonesia, this rate currentlyis about 7%.6
International practice recommends discount rates varying from 1to 15% in the assessment of the value of projects (Harrison, 2010).To enable consideration of the different social and business issuesthat arise in assessing land-use options and minimum REDD+ pay-ments, we present opportunity costs calculated using discount ratesof 5, 10 and 15% with a 30-year time horizon (this time frame reflectsthe time horizon of commercial logging concessions, timber planta-tions, and oil palm plantations). The rate of 10% is slightly higherthan the rate of long-term government bonds, but it presents a usefulmid-point between the lower social discount rate and the higher pri-vate discount rate; it is also similar to that used by the studies of theopportunity costs of REDD+ mentioned above.
3.3. Case Studies: Provinces and Data on Land Use Activities
This study focuses on the two provinces of Riau and Papua, whichvary in terms of deforestation rates and causes of deforestation. Riauis thought to have the highest deforestation rate in Indonesia, withan estimated total forest loss between 1982 and 2007 of around4.2 million ha, approximately 65% of the original forest cover (Uryuet al., 2008). Two major causes of deforestation in Riau are the expan-sion of oil palm plantations and timber plantations to supply thepulp and paper industry. Between 1982 and 2007, 1.1 million ha(28.7%) of Riau's forests were replaced by oil palm plantations, while0.95 million ha (24.4%) were cleared for acacia plantations (Uryu etal., 2008). Logging concessions within production forests are beingreplaced by acacia plantations (Fig. 1). Uryu et al. (2008) also reportthat 659,200 ha (17%) were deforested but have not been planted yet;the remaining lands were cleared for smallholder oil palm plantations(7.2%) and other purposes (18.1%), such as rubber, coconut and otherplantations, and infrastructure.
The Papuan region (which includes the provinces of Papua andWest Papua) is home to the largest area of remaining tropical forestin Indonesia and it has the lowest rate of deforestation in the country.FWI and GFW (2002) estimate that 1.8 million ha were deforestedbetween 1985 and 1997, representing 5% of Papua's total forest cover.
6 http://www.tradingeconomics.com/Economics/Government-Bond-Yield.aspx?symbol=IDR, accessed on 18 August 2011.
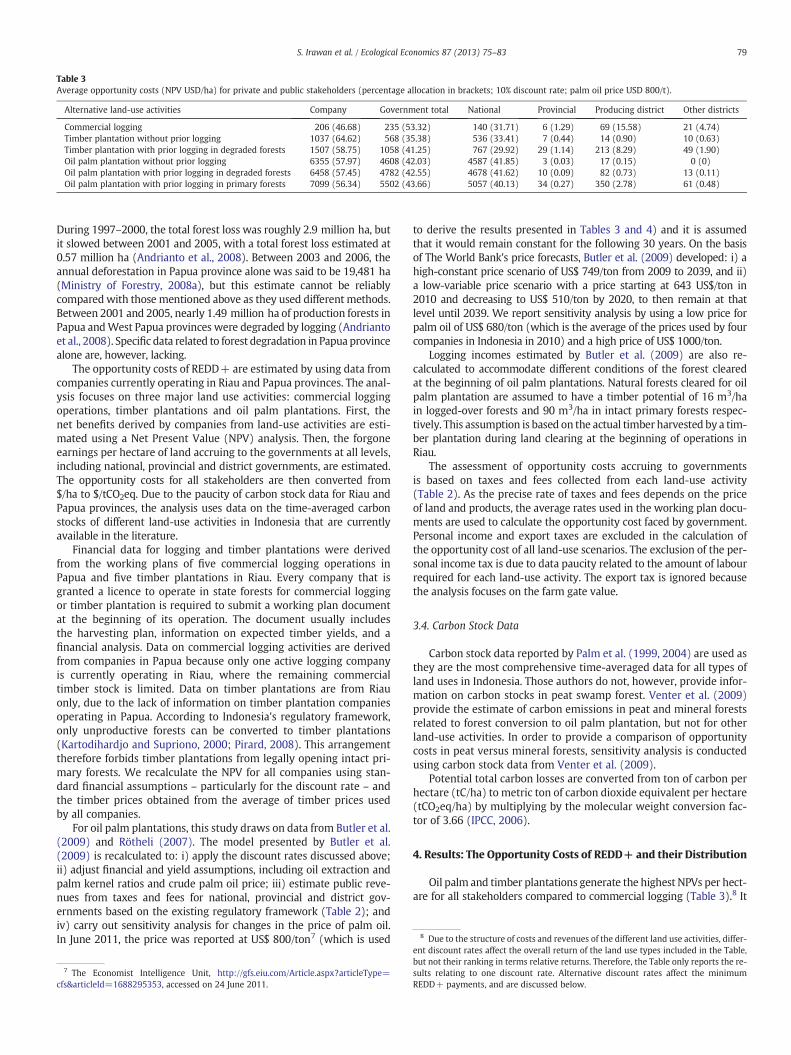
Table 3Average opportunity costs (NPV USD/ha) for private and public stakeholders (percentage allocation in brackets; 10% discount rate; palm oil price USD 800/t).
Alternative land-use activities Company Government total National Provincial Producing district Other districts
Commercial logging 206 (46.68) 235 (53.32) 140 (31.71) 6 (1.29) 69 (15.58) 21 (4.74)Timber plantation without prior logging 1037 (64.62) 568 (35.38) 536 (33.41) 7 (0.44) 14 (0.90) 10 (0.63)Timber plantation with prior logging in degraded forests 1507 (58.75) 1058 (41.25) 767 (29.92) 29 (1.14) 213 (8.29) 49 (1.90)Oil palm plantation without prior logging 6355 (57.97) 4608 (42.03) 4587 (41.85) 3 (0.03) 17 (0.15) 0 (0)Oil palm plantation with prior logging in degraded forests 6458 (57.45) 4782 (42.55) 4678 (41.62) 10 (0.09) 82 (0.73) 13 (0.11)Oil palm plantation with prior logging in primary forests 7099 (56.34) 5502 (43.66) 5057 (40.13) 34 (0.27) 350 (2.78) 61 (0.48)
8 Due to the structure of costs and revenues of the different land use activities, differ-
79S. Irawan et al. / Ecological Economics 87 (2013) 75–83
During 1997–2000, the total forest loss was roughly 2.9 million ha, butit slowed between 2001 and 2005, with a total forest loss estimated at0.57 million ha (Andrianto et al., 2008). Between 2003 and 2006, theannual deforestation in Papua province alone was said to be 19,481 ha(Ministry of Forestry, 2008a), but this estimate cannot be reliablycomparedwith those mentioned above as they used different methods.Between 2001 and 2005, nearly 1.49 million ha of production forests inPapua andWest Papua provinces were degraded by logging (Andriantoet al., 2008). Specific data related to forest degradation in Papua provincealone are, however, lacking.
The opportunity costs of REDD+ are estimated by using data fromcompanies currently operating in Riau and Papua provinces. The anal-ysis focuses on three major land use activities: commercial loggingoperations, timber plantations and oil palm plantations. First, thenet benefits derived by companies from land-use activities are esti-mated using a Net Present Value (NPV) analysis. Then, the forgoneearnings per hectare of land accruing to the governments at all levels,including national, provincial and district governments, are estimated.The opportunity costs for all stakeholders are then converted from$/ha to $/tCO2eq. Due to the paucity of carbon stock data for Riau andPapua provinces, the analysis uses data on the time-averaged carbonstocks of different land-use activities in Indonesia that are currentlyavailable in the literature.
Financial data for logging and timber plantations were derivedfrom the working plans of five commercial logging operations inPapua and five timber plantations in Riau. Every company that isgranted a licence to operate in state forests for commercial loggingor timber plantation is required to submit a working plan documentat the beginning of its operation. The document usually includesthe harvesting plan, information on expected timber yields, and afinancial analysis. Data on commercial logging activities are derivedfrom companies in Papua because only one active logging companyis currently operating in Riau, where the remaining commercialtimber stock is limited. Data on timber plantations are from Riauonly, due to the lack of information on timber plantation companiesoperating in Papua. According to Indonesia's regulatory framework,only unproductive forests can be converted to timber plantations(Kartodihardjo and Supriono, 2000; Pirard, 2008). This arrangementtherefore forbids timber plantations from legally opening intact pri-mary forests. We recalculate the NPV for all companies using stan-dard financial assumptions – particularly for the discount rate – andthe timber prices obtained from the average of timber prices usedby all companies.
For oil palm plantations, this study draws on data from Butler et al.(2009) and Rötheli (2007). The model presented by Butler et al.(2009) is recalculated to: i) apply the discount rates discussed above;ii) adjust financial and yield assumptions, including oil extraction andpalm kernel ratios and crude palm oil price; iii) estimate public reve-nues from taxes and fees for national, provincial and district gov-ernments based on the existing regulatory framework (Table 2); andiv) carry out sensitivity analysis for changes in the price of palm oil.In June 2011, the price was reported at US$ 800/ton7 (which is used
7 The Economist Intelligence Unit, http://gfs.eiu.com/Article.aspx?articleType=cfs&articleId=1688295353, accessed on 24 June 2011.
to derive the results presented in Tables 3 and 4) and it is assumedthat it would remain constant for the following 30 years. On the basisof The World Bank's price forecasts, Butler et al. (2009) developed: i) ahigh-constant price scenario of US$ 749/ton from 2009 to 2039, and ii)a low-variable price scenario with a price starting at 643 US$/ton in2010 and decreasing to US$ 510/ton by 2020, to then remain at thatlevel until 2039. We report sensitivity analysis by using a low price forpalm oil of US$ 680/ton (which is the average of the prices used by fourcompanies in Indonesia in 2010) and a high price of US$ 1000/ton.
Logging incomes estimated by Butler et al. (2009) are also re-calculated to accommodate different conditions of the forest clearedat the beginning of oil palm plantations. Natural forests cleared for oilpalm plantation are assumed to have a timber potential of 16 m3/hain logged-over forests and 90 m3/ha in intact primary forests respec-tively. This assumption is based on the actual timber harvested by a tim-ber plantation during land clearing at the beginning of operations inRiau.
The assessment of opportunity costs accruing to governmentsis based on taxes and fees collected from each land-use activity(Table 2). As the precise rate of taxes and fees depends on the priceof land and products, the average rates used in the working plan docu-ments are used to calculate the opportunity cost faced by government.Personal income and export taxes are excluded in the calculation ofthe opportunity cost of all land-use scenarios. The exclusion of the per-sonal income tax is due to data paucity related to the amount of labourrequired for each land-use activity. The export tax is ignored becausethe analysis focuses on the farm gate value.
3.4. Carbon Stock Data
Carbon stock data reported by Palm et al. (1999, 2004) are used asthey are the most comprehensive time-averaged data for all types ofland uses in Indonesia. Those authors do not, however, provide infor-mation on carbon stocks in peat swamp forest. Venter et al. (2009)provide the estimate of carbon emissions in peat and mineral forestsrelated to forest conversion to oil palm plantation, but not for otherland-use activities. In order to provide a comparison of opportunitycosts in peat versus mineral forests, sensitivity analysis is conductedusing carbon stock data from Venter et al. (2009).
Potential total carbon losses are converted from ton of carbon perhectare (tC/ha) to metric ton of carbon dioxide equivalent per hectare(tCO2eq/ha) by multiplying by the molecular weight conversion fac-tor of 3.66 (IPCC, 2006).
4. Results: The Opportunity Costs of REDD+ and their Distribution
Oil palm and timber plantations generate the highest NPVs per hect-are for all stakeholders compared to commercial logging (Table 3).8 It
ent discount rates affect the overall return of the land use types included in the Table,but not their ranking in terms relative returns. Therefore, the Table only reports the re-sults relating to one discount rate. Alternative discount rates affect the minimumREDD+ payments, and are discussed below.
9 http://www.pointcarbon.com, accessed in 11 June 2011 and August 24, 2012.10 It could be argued that current EUAprices arenot representative of long termprices,withAustralia, for example, pricing carbon at A$23 (aboutUS$ 24 inAugust 2012), http://afr.com/p/national/carbon_price_to_be_double_the_world_Km4LXRDbbjvFt6iXM0X4sM.
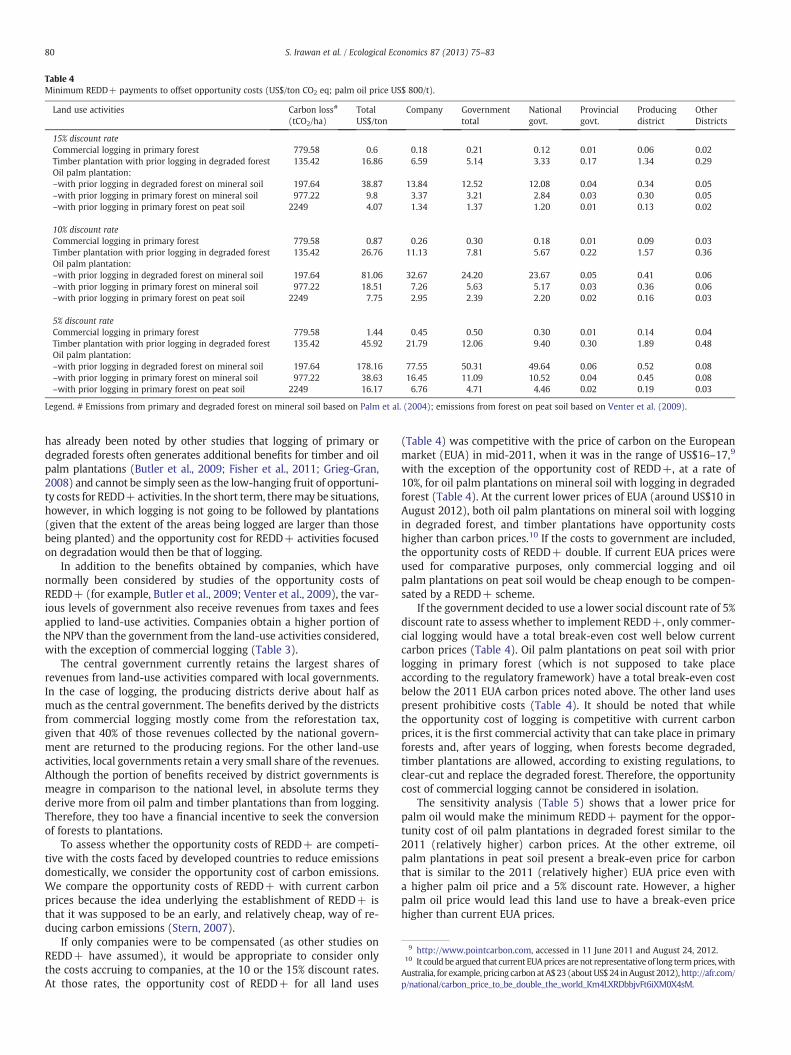
Table 4Minimum REDD+ payments to offset opportunity costs (US$/ton CO2 eq; palm oil price US$ 800/t).
Land use activities Carbon loss#
(tCO2/ha)TotalUS$/ton
Company Governmenttotal
Nationalgovt.
Provincialgovt.
Producingdistrict
OtherDistricts
15% discount rateCommercial logging in primary forest 779.58 0.6 0.18 0.21 0.12 0.01 0.06 0.02Timber plantation with prior logging in degraded forest 135.42 16.86 6.59 5.14 3.33 0.17 1.34 0.29Oil palm plantation:–with prior logging in degraded forest on mineral soil 197.64 38.87 13.84 12.52 12.08 0.04 0.34 0.05–with prior logging in primary forest on mineral soil 977.22 9.8 3.37 3.21 2.84 0.03 0.30 0.05–with prior logging in primary forest on peat soil 2249 4.07 1.34 1.37 1.20 0.01 0.13 0.02
10% discount rateCommercial logging in primary forest 779.58 0.87 0.26 0.30 0.18 0.01 0.09 0.03Timber plantation with prior logging in degraded forest 135.42 26.76 11.13 7.81 5.67 0.22 1.57 0.36Oil palm plantation:–with prior logging in degraded forest on mineral soil 197.64 81.06 32.67 24.20 23.67 0.05 0.41 0.06–with prior logging in primary forest on mineral soil 977.22 18.51 7.26 5.63 5.17 0.03 0.36 0.06–with prior logging in primary forest on peat soil 2249 7.75 2.95 2.39 2.20 0.02 0.16 0.03
5% discount rateCommercial logging in primary forest 779.58 1.44 0.45 0.50 0.30 0.01 0.14 0.04Timber plantation with prior logging in degraded forest 135.42 45.92 21.79 12.06 9.40 0.30 1.89 0.48Oil palm plantation:–with prior logging in degraded forest on mineral soil 197.64 178.16 77.55 50.31 49.64 0.06 0.52 0.08–with prior logging in primary forest on mineral soil 977.22 38.63 16.45 11.09 10.52 0.04 0.45 0.08–with prior logging in primary forest on peat soil 2249 16.17 6.76 4.71 4.46 0.02 0.19 0.03
Legend. # Emissions from primary and degraded forest on mineral soil based on Palm et al. (2004); emissions from forest on peat soil based on Venter et al. (2009).
80 S. Irawan et al. / Ecological Economics 87 (2013) 75–83
has already been noted by other studies that logging of primary ordegraded forests often generates additional benefits for timber and oilpalm plantations (Butler et al., 2009; Fisher et al., 2011; Grieg-Gran,2008) and cannot be simply seen as the low-hanging fruit of opportuni-ty costs for REDD+activities. In the short term, theremay be situations,however, in which logging is not going to be followed by plantations(given that the extent of the areas being logged are larger than thosebeing planted) and the opportunity cost for REDD+ activities focusedon degradation would then be that of logging.
In addition to the benefits obtained by companies, which havenormally been considered by studies of the opportunity costs ofREDD+ (for example, Butler et al., 2009; Venter et al., 2009), the var-ious levels of government also receive revenues from taxes and feesapplied to land-use activities. Companies obtain a higher portion ofthe NPV than the government from the land-use activities considered,with the exception of commercial logging (Table 3).
The central government currently retains the largest shares ofrevenues from land-use activities compared with local governments.In the case of logging, the producing districts derive about half asmuch as the central government. The benefits derived by the districtsfrom commercial logging mostly come from the reforestation tax,given that 40% of those revenues collected by the national govern-ment are returned to the producing regions. For the other land-useactivities, local governments retain a very small share of the revenues.Although the portion of benefits received by district governments ismeagre in comparison to the national level, in absolute terms theyderive more from oil palm and timber plantations than from logging.Therefore, they too have a financial incentive to seek the conversionof forests to plantations.
To assess whether the opportunity costs of REDD+ are competi-tive with the costs faced by developed countries to reduce emissionsdomestically, we consider the opportunity cost of carbon emissions.We compare the opportunity costs of REDD+ with current carbonprices because the idea underlying the establishment of REDD+ isthat it was supposed to be an early, and relatively cheap, way of re-ducing carbon emissions (Stern, 2007).
If only companies were to be compensated (as other studies onREDD+ have assumed), it would be appropriate to consider onlythe costs accruing to companies, at the 10 or the 15% discount rates.At those rates, the opportunity cost of REDD+ for all land uses
(Table 4) was competitive with the price of carbon on the Europeanmarket (EUA) in mid-2011, when it was in the range of US$16–17,9
with the exception of the opportunity cost of REDD+, at a rate of10%, for oil palm plantations on mineral soil with logging in degradedforest (Table 4). At the current lower prices of EUA (around US$10 inAugust 2012), both oil palm plantations on mineral soil with loggingin degraded forest, and timber plantations have opportunity costshigher than carbon prices.10 If the costs to government are included,the opportunity costs of REDD+ double. If current EUA prices wereused for comparative purposes, only commercial logging and oilpalm plantations on peat soil would be cheap enough to be compen-sated by a REDD+ scheme.
If the government decided to use a lower social discount rate of 5%discount rate to assess whether to implement REDD+, only commer-cial logging would have a total break-even cost well below currentcarbon prices (Table 4). Oil palm plantations on peat soil with priorlogging in primary forest (which is not supposed to take placeaccording to the regulatory framework) have a total break-even costbelow the 2011 EUA carbon prices noted above. The other land usespresent prohibitive costs (Table 4). It should be noted that whilethe opportunity cost of logging is competitive with current carbonprices, it is the first commercial activity that can take place in primaryforests and, after years of logging, when forests become degraded,timber plantations are allowed, according to existing regulations, toclear-cut and replace the degraded forest. Therefore, the opportunitycost of commercial logging cannot be considered in isolation.
The sensitivity analysis (Table 5) shows that a lower price forpalm oil would make the minimum REDD+ payment for the oppor-tunity cost of oil palm plantations in degraded forest similar to the2011 (relatively higher) carbon prices. At the other extreme, oilpalm plantations in peat soil present a break-even price for carbonthat is similar to the 2011 (relatively higher) EUA price even witha higher palm oil price and a 5% discount rate. However, a higherpalm oil price would lead this land use to have a break-even pricehigher than current EUA prices.
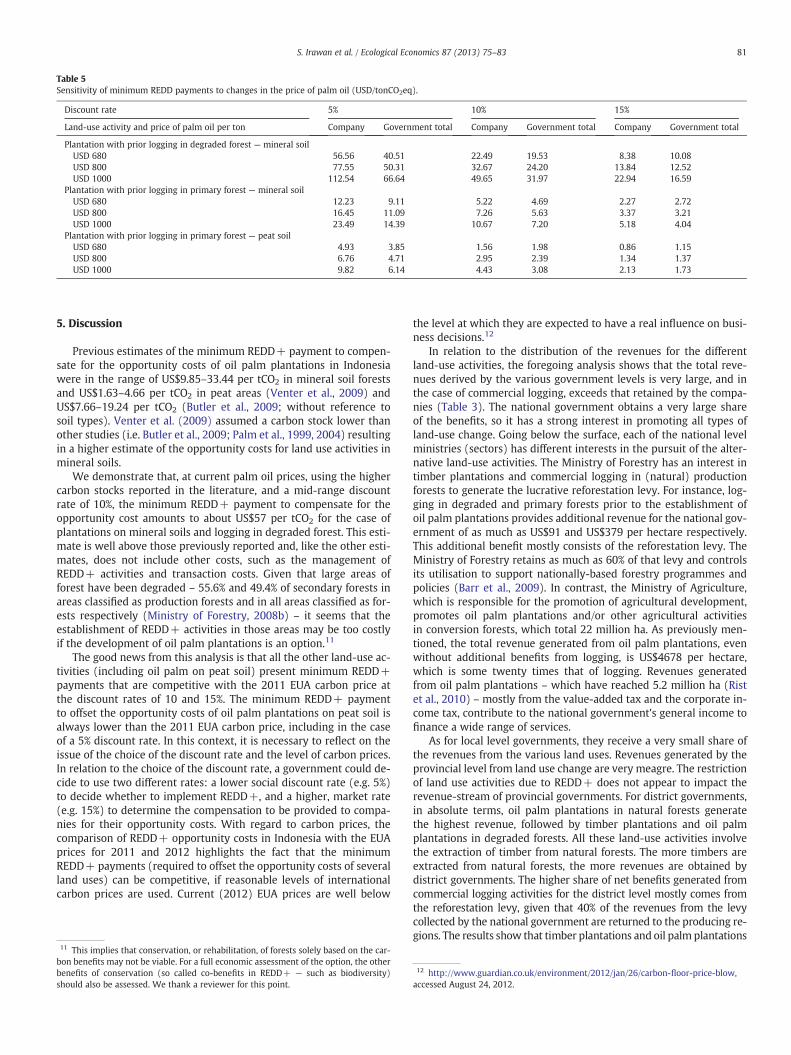
Table 5Sensitivity of minimum REDD payments to changes in the price of palm oil (USD/tonCO2eq).
Discount rate 5% 10% 15%
Land-use activity and price of palm oil per ton Company Government total Company Government total Company Government total
Plantation with prior logging in degraded forest — mineral soilUSD 680 56.56 40.51 22.49 19.53 8.38 10.08USD 800 77.55 50.31 32.67 24.20 13.84 12.52USD 1000 112.54 66.64 49.65 31.97 22.94 16.59
Plantation with prior logging in primary forest — mineral soilUSD 680 12.23 9.11 5.22 4.69 2.27 2.72USD 800 16.45 11.09 7.26 5.63 3.37 3.21USD 1000 23.49 14.39 10.67 7.20 5.18 4.04
Plantation with prior logging in primary forest — peat soilUSD 680 4.93 3.85 1.56 1.98 0.86 1.15USD 800 6.76 4.71 2.95 2.39 1.34 1.37USD 1000 9.82 6.14 4.43 3.08 2.13 1.73
81S. Irawan et al. / Ecological Economics 87 (2013) 75–83
5. Discussion
Previous estimates of the minimum REDD+ payment to compen-sate for the opportunity costs of oil palm plantations in Indonesiawere in the range of US$9.85–33.44 per tCO2 in mineral soil forestsand US$1.63–4.66 per tCO2 in peat areas (Venter et al., 2009) andUS$7.66–19.24 per tCO2 (Butler et al., 2009; without reference tosoil types). Venter et al. (2009) assumed a carbon stock lower thanother studies (i.e. Butler et al., 2009; Palm et al., 1999, 2004) resultingin a higher estimate of the opportunity costs for land use activities inmineral soils.
We demonstrate that, at current palm oil prices, using the highercarbon stocks reported in the literature, and a mid-range discountrate of 10%, the minimum REDD+ payment to compensate for theopportunity cost amounts to about US$57 per tCO2 for the case ofplantations on mineral soils and logging in degraded forest. This esti-mate is well above those previously reported and, like the other esti-mates, does not include other costs, such as the management ofREDD+ activities and transaction costs. Given that large areas offorest have been degraded – 55.6% and 49.4% of secondary forests inareas classified as production forests and in all areas classified as for-ests respectively (Ministry of Forestry, 2008b) – it seems that theestablishment of REDD+ activities in those areas may be too costlyif the development of oil palm plantations is an option.11
The good news from this analysis is that all the other land-use ac-tivities (including oil palm on peat soil) present minimum REDD+payments that are competitive with the 2011 EUA carbon price atthe discount rates of 10 and 15%. The minimum REDD+ paymentto offset the opportunity costs of oil palm plantations on peat soil isalways lower than the 2011 EUA carbon price, including in the caseof a 5% discount rate. In this context, it is necessary to reflect on theissue of the choice of the discount rate and the level of carbon prices.In relation to the choice of the discount rate, a government could de-cide to use two different rates: a lower social discount rate (e.g. 5%)to decide whether to implement REDD+, and a higher, market rate(e.g. 15%) to determine the compensation to be provided to compa-nies for their opportunity costs. With regard to carbon prices, thecomparison of REDD+ opportunity costs in Indonesia with the EUAprices for 2011 and 2012 highlights the fact that the minimumREDD+ payments (required to offset the opportunity costs of severalland uses) can be competitive, if reasonable levels of internationalcarbon prices are used. Current (2012) EUA prices are well below
11 This implies that conservation, or rehabilitation, of forests solely based on the car-bon benefits may not be viable. For a full economic assessment of the option, the otherbenefits of conservation (so called co-benefits in REDD+ — such as biodiversity)should also be assessed. We thank a reviewer for this point.
the level at which they are expected to have a real influence on busi-ness decisions.12
In relation to the distribution of the revenues for the differentland-use activities, the foregoing analysis shows that the total reve-nues derived by the various government levels is very large, and inthe case of commercial logging, exceeds that retained by the compa-nies (Table 3). The national government obtains a very large shareof the benefits, so it has a strong interest in promoting all types ofland-use change. Going below the surface, each of the national levelministries (sectors) has different interests in the pursuit of the alter-native land-use activities. The Ministry of Forestry has an interest intimber plantations and commercial logging in (natural) productionforests to generate the lucrative reforestation levy. For instance, log-ging in degraded and primary forests prior to the establishment ofoil palm plantations provides additional revenue for the national gov-ernment of as much as US$91 and US$379 per hectare respectively.This additional benefit mostly consists of the reforestation levy. TheMinistry of Forestry retains as much as 60% of that levy and controlsits utilisation to support nationally-based forestry programmes andpolicies (Barr et al., 2009). In contrast, the Ministry of Agriculture,which is responsible for the promotion of agricultural development,promotes oil palm plantations and/or other agricultural activitiesin conversion forests, which total 22 million ha. As previously men-tioned, the total revenue generated from oil palm plantations, evenwithout additional benefits from logging, is US$4678 per hectare,which is some twenty times that of logging. Revenues generatedfrom oil palm plantations – which have reached 5.2 million ha (Ristet al., 2010) – mostly from the value-added tax and the corporate in-come tax, contribute to the national government's general income tofinance a wide range of services.
As for local level governments, they receive a very small share ofthe revenues from the various land uses. Revenues generated by theprovincial level from land use change are very meagre. The restrictionof land use activities due to REDD+ does not appear to impact therevenue-stream of provincial governments. For district governments,in absolute terms, oil palm plantations in natural forests generatethe highest revenue, followed by timber plantations and oil palmplantations in degraded forests. All these land-use activities involvethe extraction of timber from natural forests. The more timbers areextracted from natural forests, the more revenues are obtained bydistrict governments. The higher share of net benefits generated fromcommercial logging activities for the district level mostly comes fromthe reforestation levy, given that 40% of the revenues from the levycollected by the national government are returned to the producing re-gions. The results show that timber plantations and oil palm plantations
12 http://www.guardian.co.uk/environment/2012/jan/26/carbon-floor-price-blow,accessed August 24, 2012.

82 S. Irawan et al. / Ecological Economics 87 (2013) 75–83
without prior logging only generate US$14 and US$17 per hectare forthe producing district (Table 3), compared to US$213 and US$82 withprior logging in degraded forest for timber plantations and oil planta-tions respectively. This suggests that the structure of the reforestationlevy may need to be revised as it creates perverse incentives, which en-courage district governments to support the extraction of more timberfrom natural forests.
Although they receive a small share, local governments (particu-larly the producing districts) do derive financial benefits from timber.This explains the fact that forest agencies at the district level are in-terested in promoting timber plantations like their counterparts atthe national level. The permits for commercial logging and timberplantations are issued by the Ministry of Forestry, although districtgovernments can submit a proposal for activities at the district level(Resosudarmo et al., 2006). Local governments' support is also crucialfor licences issued at the national level, as strong resistance from localstakeholders can hinder companies' operations, as reported in a num-ber of regions in Indonesia.13
Local governments are also interested in expanding oil palm plan-tations in their localities (McCarthy and Cramb, 2009; Rist et al.,2010; Sandker et al., 2007; Zen et al., 2005). In the case of oil palmplantation, local governments have the authority to issue a businesspermit, which is required before the final decision on forest clearancecan be made by the Ministry of Forestry (Colchester et al., 2006).Therefore, district governments have more influence in thisdecision-making process compared with commercial logging andtimber plantations. Although district governments obtain a small por-tion from the total benefits of oil palm, some regions apply a local fee,which is called a third-party contribution, to oil palm products.
The interests of district governments to support proposals for nat-ural forest conversion to productive land-use activities could also bedue to other economic and political benefits. Heads of districtsmight have a greater chance of maintaining their popularity if they at-tract investments and generate local revenues. Oil palm plantations,for instance, also generate employment and livelihoods for local peo-ple (McCarthy and Cramb, 2009; Rist et al., 2010; Sandker et al., 2007;Susila, 2004; Zen et al., 2005). Susila (2004) claims that oil palm activ-ities can contribute as much as 63% of smallholder household incomesin two locations in Sumatra Island. Sandker et al. (2007) simulatedthe impact of conversion of forests to oil palm in Malinau district(East Kalimantan Province, located on the Indonesian side of Borneo)and found that the total number of formal jobs created by oil palm de-velopment (22,000–120,000) could exceed the employment opportu-nities generated by mining, logging, and civil service put together(estimated at 10,000). Moreover, Rist et al. (2010) reported thatlocal elites obtained financial support during electoral campaigns byproviding their backing for the establishment of oil palm plantations.
The findings related to the share of benefits obtained by govern-ment stakeholders reveal the existing structure of fiscal decentralisa-tion in Indonesia. The national government controls most of therevenues generated from forest exploitation and land use change. Inthe forestry sector, the distribution of benefits to local governmentsis based on the amount of timber extracted from the localities.According to the existing regulatory framework, the major portionof the benefits generated from logging activities, particularly in pri-mary forests, should be spent to rehabilitate forests at the locallevel. In contrast, the national government retains most of the reve-nues generated from the taxes collected from oil palm plantation ac-tivities, except for the land and building tax and the land and buildingtransfer fee. The national government, however, distributes at least26% of the net national income to all subnational governments in
13 http://www.riaumandiri.net/rm/index.php?option=com_content&view=article&id=14559:datangi-kantor-bupati-meranti-ratusan-massa-demo-tolak-hti-&catid=40:riau-raya; http://dpd.go.id/2010/01/dpd-desak-menhut-hentikan-izin-usaha-hutan/,accessed on 11 June 2011.
the form of an unconditional transfer (block grant). The distributionof the unconditional transfer is, however, not based on any particulareconomic activity pursued at the local level. The unconditional trans-fer aims to cover the civil servants' wages and to address the fiscalgap between local expenditures (based on population, area, and acost element) and local revenues (based on total revenues fromlocal own-sources and shared revenues from taxes and natural re-sources). Local governments with lower capacity to generate localrevenues, including from local taxes and fees as well as revenue shar-ing from natural resources, are entitled for the higher amount of theunconditional transfer. Therefore, there is not a significant link be-tween the distribution of revenue with local governments' decisionson land use change and economic activities.
6. Conclusion
Recent work on REDD+ casts doubt on its financial viability, giventhe seemingly high opportunity costs (Angelsen and McNeill, 2012).This study demonstrates that REDD+ might not be able to competewith some alternative land uses which have very high opportunitycosts, such as oil palm plantation in degraded forests on mineralsoils. However, we also demonstrate that in some cases REDD+ ac-tivities may be a viable options to reduce deforestation and degrada-tion. Oil palm and timber plantation companies are keen to operate innatural forests, because they can obtain additional logging incomeprior to the establishment of the actual plantations. When convertedfurther to dollars per tCO2, the additional benefit from logging incomeis very low, as logging natural forests results in very high emissions.Therefore, REDD+ payments could be allocated to support the relo-cation of plantations from natural forests to non-forested areas. Fur-thermore, REDD+ payments could also prevent the conversion ofpeat forests, as it results in extremely high emissions, and it is there-fore associated with low opportunity costs.
The results of this study highlight the importance of consideringthe political economy of land-use change, including the distributionof power between the central and local governments, and the existingincentive structures influencing different stakeholders in the pursuitof forest exploitation and land-use change. In Indonesia, the nationalgovernment currently retains most of the revenues from currentland-use activities. This situation is also common in other decentralisedcountries, where the higher level of government collects the largestshare of public revenues anddistributes part of this to local governmentsusing intergovernmental fiscal transfers (deMello, 2000), which are thecornerstones of subnational government financing in most developingand transition countries (Bahl, 2000).
Given the existing fiscal structure, REDD+ would most probablybe implemented using a national-based implementation approach,in which the national government would receive REDD+ payments,and there would be no direct payments from the international levelto local governments (Angelsen et al., 2008). However, given thefinancial interest of local level governments in promoting land usechange, as documented in this study, the design of the distributionof revenues generated from REDD+ should consider the provisionof incentives to local governments. REDD+ payments should compen-sate at least the costs of REDD+ implementation, including opportunitycosts, so that they would not have to face forgone taxes, fees andshared-revenues (Ring et al., 2010). However, REDD+ paymentsbased simply on the opportunity costs incurred by local governmentsmight not change local governments' perspectives, because they alsosee other benefits from the support of land-use change activities, suchas job creation. Therefore, REDD+ payments should be designed to ex-ceed local level governments' forgone revenues from land use change,to ensure support for REDD+. The exact amount bywhich REDD+pay-ments need to exceed the opportunity costs of local level governmentwill vary from situation to situation, similarly to the opportunity costs

83S. Irawan et al. / Ecological Economics 87 (2013) 75–83
and would need to be assessed when a country were considering theimplementation of REDD+.
Acknowledgements
This study was made possible by the Australian Government'sAustralian Leadership Award scholarship (for S.I.) and funding fromthe Australian Centre for International Agricultural Research (FST/2007/052). We thank Anne Larson for providing comments on an ear-lier draft.
References
Andersson, K.P., Gibson, C.C., Lehoucq, F., 2006. Municipal politics and forest governance:comparative analysis of decentralization in Bolivia and Guatemala. World Develop-ment 34, 576–595.
Andrianto, A., Obidzinski, K., Wajdi, F., Tetuka, B., 2008. Deforestation and Forest Degrada-tion in Papua Post-New Order Regime. Center for International Forestry Research(CIFOR), Bogor.
Angelsen, A., McNeill, D., 2012. The evolution of REDD+. In: Angelsen, A., Brockhaus, M.,Sunderlin,W.D., Verchot, L.V. (Eds.), AnalysingREDD+:Challenges andChoices. Centerfor International Forestry Research (CIFOR), Bogor, pp. 31–50.
Angelsen, A., Streck, C., Peskett, L., Brown, J., Luttrell, C., 2008. What is the right scale forREDD? The implications of national, subnational and nested approaches.
Bahl, R., 2000. Intergovernmental transfers in developing and transition countries:principles and practice. Urban and Local Government Background Series No. 2.The World Bank, Washington, DC.
Barr, C., Resosudarmo, I.A.P., Dermawan, A., McCarthy, J.F., Moeliono, M., Setiono, B.,2006. Decentralisation of Forest Administration in Indonesia: Implications forForest Sustainability, Economic Development and Community Livelihoods. Centerfor International Forestry Research (CIFOR), Bogor.
Barr, C., Dermawan, A., Purnomo, H., Komarudin, H., 2009. Financial Governance andLessons from Indonesia's Reforestation Fund. Center for International ForestryResearch (CIFOR), Bogor.
Bellassen, V., Gitz, V., 2008. Reducing emissions from deforestation and degradation inCameroon: assessing costs and benefits. Ecological Economics 68, 336–344.
Boucher, D., 2008. Out of the Woods: A Realistic Role for Tropical Forests in CurbingGlobal Warming. Union Concerned Scientist, Cambridge.
Butler, R.A., Koh, L.P., Ghazoul, J., 2009. REDD in the red: palm oil could undermine carbonpayment schemes. Conservation Letters 2, 67–73.
Colchester, M., Jiwan, N., Andiko, Sirait, M., Firdaus, A., Surambo, Pane, H., 2006. Prom-ised Land: Palm Oil and Land Acquisition in Indonesia — Implications for LocalCommunities and Indigenous Peoples. Forest Peoples Programme, PerkumpulanSawit Watch, HuMA and the World Agroforestry Centre, Bogor.
de Mello, L.R., 2000. Fiscal decentralization and intergovernmental fiscal relations: across-country analysis. World Development 28, 365–380.
Fisher, B., Edwards, D.P., Giam, X., Wilcove, D.S., 2011. The high costs of conservingSoutheast Asia's lowland rainforests. Frontiers in Ecology and the Environment 9,329–334.
Forest Watch Indonesia, Global Forest Watch, 2002. The State of the Forest Indonesia.World Resources Indonesia, Jakarta.
FWI, GFW, 2002. The State of the Forest Indonesia. World Resources Indonesia,Indonesia.
Garnaut Review, 2011. Update Paper 1: Weighing the Costs and Benefits of ClimateChange Action. Garnaut Climate Change Review — Update 2011, Canberra.
Gerring, J., 2008. Case study selection for case study analysis: qualitative and quan-titative techniques. In: Box-Steffensmeier, J.M., Brady, H.E., Collier, D. (Eds.),The Oxford Handbook of Political Methodology. Oxford University Press, Oxford,pp. 645–684.
Gregersen, H., Lakany, H.E., Karsenty, A., White, A., 2010. Does the Opportunity CostApproach Indicate the Real Cost of REDD+? Rights and Realities of Paying forREDD+. Rights and Resources Initiative, Washington DC.
Grieg-Gran, M., 2008. The Cost of Avoiding Deforestation: Update of the Report Preparedfor the Stern Review of the Economics of Climate Change. International Institute forEnvironment and Development, London.
Hansen, C.P., Lund, J.F., Treue, T., 2009. Neither fast, nor easy: the prospect of ReducedEmissions from Deforestation and Degradation (REDD) in Ghana. InternationalForestry Review 11, 439–455.
Harrison, M., 2010. Valuing the Future: The Social Discount Rate in Cost–Benefit AnalysisVisiting Researcher Paper. Productivity Commission, Canberra.
Houghton, R.A., 2003. Emissions and sinks of carbon from land use change. Report tothe World Resources Institute from the Woods Hole Research Center, Washington,DC.
IPCC, 2006. IPCC Guidelines for National Greenhouse Gas Inventories. Volume 4: Agriculture,Forestry and Other Land Use.Intergovernmental Panel on Climate Change (IPCC).
Irawan, S., Tacconi, L., 2009. Reducing Emissions from Deforestation and ForestDegradation (REDD) and decentralized forest management. International ForestryReview 11, 427–438.
Kartodihardjo, H., Supriono, A., 2000. Dampak Pembangunan Sektoral terhadap Konversidan Degradasi Hutan Alam: Kasus Pembangunan HTI dan Perkebunan di Indonesia.Center for International Forestry Research (CIFOR), Bogor.
Kindermann, G., Obersteiner, M., Sohngen, B., Sathaye, J., Andrasko, K., Rametsteiner, E.,Schlamadinger, B., Wunder, S., Beach, R., 2008. Global cost estimates of reducing car-bon emissions through avoided deforestation. Proceedings of the National Academyof Sciences 105, 10302–10307.
Koh, L.P.,Wilcove, D.S., 2008. Is oil palmagriculture really destroying tropical biodiversity?Conservation Letters 1, 60–64.
Larson, A.M., 2005. Democratic decentralization in the forestry sector: lessons learnedfrom Africa, Asia and Latin America. In: Pierce Colfer, C.J., Capistrano, D. (Eds.), ThePolitics of Decentralization: Forests, Power and People. Earthscan/James & James,London, pp. 32–62.
McCarthy, J.F., Cramb, R.A., 2009. Policy narratives, landholder engagement, and oilpalm expansion on theMalaysian and Indonesian frontiers. The Geographical Journal175, 112–123.
Ministry of Forestry, 2008a. Penghitungan Deforestasi Indonesia. TheMinistry of Forestry,Indonesia, Jakarta.
Ministry of Forestry, 2008b. Rekalkulasi Penutupan Lahan Indonesia Tahun 2008.Ministryof Forestry, Jakarta, Indonesia.
Nawir, A.A., Murniati, Rumboko, L., 2007. Forest Rehabilitation in Indonesia: Where ToAfter Three Decades? Center for International Forestry Research (CIFOR), Bogor.
Nepstad, D., Soares-Filho, B.S., Merry, F., Lima, A., Moutinho, P., Carter, J., Bowman, M.,Cattaneo, A., Rodrigues, H., Schwartzman, S., McGrath, D.G., Stickler, C.M., Lubowski,R., Piris-Cabezas, P., Rivero, S., Alencar, A., Almeida, O., Stella, O., 2009. The end ofdeforestation in the Brazilian Amazon. Science 326, 1350–1351.
Pagiola, S., Bosquet, B., 2008. Estimating the Costs of REDD at the Country Level. Centerfor International Forestry Research (CIFOR), Bogor.
Palm, C.A., Woomer, P.L., Alegre, J., Arevalo, L., Castilla, C., Cordeiro, D.G., Feigl, B.,Hairiah, K., Kotto-Same, J., Mendes, A., Moukam, A., Murdiyarso, D., Njomgang, R.,Parton, W.J., Ricse, A., Rodrigues, V., Sitompul, S.M., van Noordwijk, M., 1999.Carbon sequestration and trace gas emissions in slash and burn and alternativeland uses in the humid tropics. ASB Climate Change Working Group Final Report,Phase II, ASB Coordination Office, ICRAF, Nairobi.
Palm, C., Tomich, T., Van Noordwijk, M., Vosti, S., Gockowski, J., Alegre, J., Verchot, L.,2004. Mitigating GHG emissions in the humid tropics: case studies from the Alterna-tives to Slash-and-Burn Program (ASB). Environment, Development and Sustainability6, 145–162.
Pirard, R., 2008. Estimating opportunity costs of avoided deforestation (REDD): appli-cation of a flexible stepwise approach to the Indonesian pulp sector. InternationalForestry Review 10, 512–522.
Resosudarmo, I.A.P., Barr, C., Dermawan, A., McCarthy, J.F., 2006. Fiscal balancing andthe redistribution of forest revenues. In: Barr, C., Resosudarmo, I.A.P., Dermawan,A., McCarthy, J.F., Moeliono, M., Setiono, B. (Eds.), Decentralization of ForestAdministration in Indonesia: Implications for Forest Sustainability, Economic De-velopment and Community Livelihoods. Center for International Forestry Research(CIFOR), Bogor, pp. 58–86.
Ring, I., Drechsler, M., van Teeffelen, A.J.A., Irawan, S., Venter, O., 2010. Biodiversityconservation and climate mitigation: what role can economic instruments play?Current Opinion in Environmental Sustainability 2, 50–58.
Rist, L., Feintrenie, L., Levang, P., 2010. The livelihood impacts of oil palm: smallholdersin Indonesia. Biodiversity and Conservation 19, 1009–1024.
Rötheli, E., 2007. An Analysis of the Economic Implications of Developing Oil PalmPlantations on Deforestated Land in Indonesia. Worldwide Fund for Nature, Gland,Switzerland.
Sandker, M., Suwarno, A., Campbell, B., 2007. Ecology and society: will forests remainin the face of oil palm expansion? Simulating change in Malinau, Indonesia. Ecologyand Society 12, 37.
Smith, K., 2011. Discounting, risk and uncertainty in economic appraisals of climatechange policy: comparing Nordhaus, Garnaut and Stern, Commissioned work. GarnautClimate Change Review — Update 2011, Canberra.
Stern, Nicholas, 2007. The Economics of Climate Change: The Stern Review. CambridgeUniversity Press, Cambridge.
Susila, W., 2004. Contribution of oil palm industry to economic growth and povertyalleviation in Indonesia. Jurnal Litbang Pertanian 23, 107–114.
Tacconi, L., 2007. Decentralization, forests and livelihoods: theory and narrative. GlobalEnvironmental Change 17, 338–348.
Tacconi, L., Mahanty, S., Suich, H., 2010. Forests, payments for environmental servicesand livelihoods. In: Tacconi, L., Mahanty, S., Suich, H. (Eds.), Payments for Environ-mental Services, Forest Conservation and Climate Change: Livelihoods in theREDD? Edward Elgar, Cheltenham, pp. 1–25.
Uryu, Y., Mott, C., Foead, N., Yulianto, K., Budiman, A., Setiabudi, Takakai, F., Nursamsu,Sunarto, Purastuti, E., Fadhli, N., Hutajulu, C.M.B., Jaenicke, J., Hatano, R., Siegert, F.,Stüwe, M., 2008. Deforestation, Forest Degradation, Biodiversity Loss and CO2
Emissions in Riau, Sumatra, Indonesia. WWF Indonesia Technical Report, Jakarta.Venter, O., Meijaard, E., Possingham, H., Dennis, R., Sheil, D., Wich, S., Hovani, L., Wilson,
K., 2009. Carbon payments as a safeguard for threatened tropical mammals. Con-servation Letters 2, 123–129.
Wertz-Kanounnikoff, S., 2008. Estimating the Costs of Reducing Forest Emissions: AReview Methods. Center for International Forestry Research (CIFOR), Bogor.
Zen, Z., Barlow, C., Gondowarsito, R., 2005. Oil palm in Indonesian socio-economicimprovement: a review of options, Working Papers in Trade and Development2005–11. Research School of Pacific andAsian Studies. AustralianNational University,Canberra.


