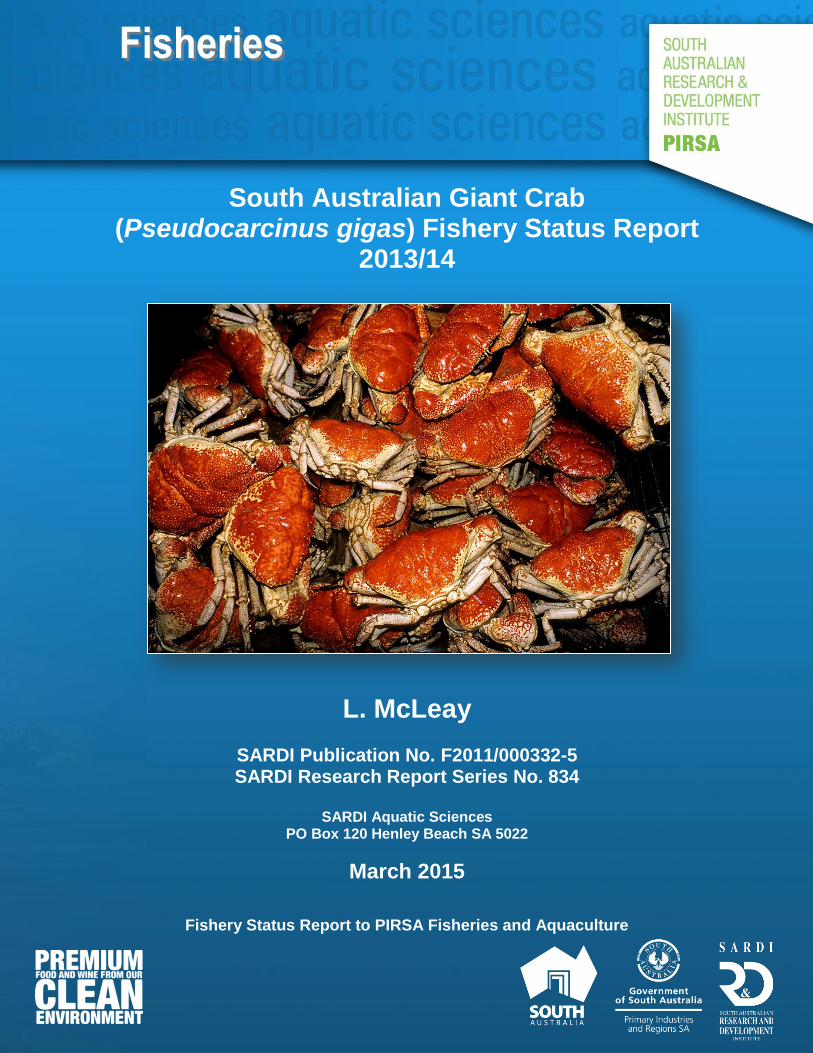
South Australian Giant Crab (Pseudocarcinus gigas) Fishery Status Report
2013/14
L. McLeay
SARDI Publication No. F2011/000332-5 SARDI Research Report Series No. 834
SARDI Aquatic Sciences
PO Box 120 Henley Beach SA 5022
March 2015
Fishery Status Report to PIRSA Fisheries and Aquaculture
McLeay, L. (2015) SA Giant Crab Fishery 2013/14
ii
South Australian Giant Crab (Pseudocarcinus gigas) Fishery Status Report
2013/14
Fishery Status Report to PIRSA Fisheries and Aquaculture
L. McLeay
SARDI Publication No. F2011/000332-5 SARDI Research Report Series No. 834
March 2015
McLeay, L. (2015) SA Giant Crab Fishery 2013/14
iii
This publication may be cited as: McLeay, L. (2015). South Australian Giant Crab (Pseudocarcinus gigas) Fishery Status Report 2013/14. Fishery Status Report to PIRSA Fisheries and Aquaculture. South Australian Research and Development Institute (Aquatic Sciences), Adelaide. SARDI Publication No. F2011/000332-5. SARDI Research Report Series No. 834. 17pp.
South Australian Research and Development Institute SARDI Aquatic Sciences 2 Hamra Avenue West Beach SA 5024 Telephone: (08) 8207 5400 Facsimile: (08) 8207 5406 http://www.sardi.sa.gov.au
DISCLAIMER
The authors warrant that they have taken all reasonable care in producing this report. The report has been through the SARDI internal review process, and has been formally approved for release by the Research Chief, Aquatic Sciences. Although all reasonable efforts have been made to ensure quality, SARDI does not warrant that the information in this report is free from errors or omissions. SARDI does not accept any liability for the contents of this report or for any consequences arising from its use or any reliance placed upon it. The SARDI Report Series is an Administrative Report Series which has not been reviewed outside the department and is not considered peer-reviewed literature. Material presented in these Administrative Reports may later be published in formal peer-reviewed scientific literature.
© 2015 SARDI
This work is copyright. Apart from any use as permitted under the Copyright Act 1968 (Cth), no part may be reproduced by any process, electronic or otherwise without the specific written permission of the copyright owner. Neither may information be stored electronically in any form whatsoever without such permission. Printed in Adelaide: March 2015 SARDI Publication No. F2011/000332-5 SARDI Research Report Series No. 834 Author(s): L. McLeay Reviewer(s): B. Stobart, J. Carroll (SARDI) and A. Jones (PIRSA) Approved by: S. Mayfield Science Leader - Fisheries Signed: Date: 26 March 2015 Distribution: PIRSA Fisheries and Aquaculture, SAASC Library, University of Adelaide
Library, Parliamentary Library, State Library and National Library Circulation: Public Domain
McLeay, L. (2015) SA Giant Crab Fishery 2013/14
iv
TABLE OF CONTENTS
LIST OF TABLES .............................................................................................. v
LIST OF FIGURES ............................................................................................ vi
ACKNOWLEDGEMENTS ................................................................................ vii
1. EXECUTIVE SUMMARY ............................................................................. 1
2. INTRODUCTION ......................................................................................... 3
3. METHODS ................................................................................................... 3
4. RESULTS .................................................................................................... 4
4.1. Catch................................................................................................................. 4 4.2. Effort ................................................................................................................. 5 4.3. Catch rate (CPUE) ............................................................................................ 5 4.4. Catch, Effort and CPUE by Fishing Sector ........................................................ 6 4.5. Performance Indicators ................................................................................... 10
4.5.1. Northern Zone ....................................................................................... 10 4.5.2. Southern Zone ....................................................................................... 10
5. DISCUSSION ............................................................................................ 13
5.1. Information, data gaps and uncertainty in the assessment .............................. 13 5.2. Status of the Giant Crab Fishery ..................................................................... 14
6. REFERENCES .......................................................................................... 16
McLeay, L. (2015) SA Giant Crab Fishery 2013/14
v
LIST OF TABLES
Table 1. Total catch (kg) in the Giant Crab Fishery in each fishing zone and sector
since the establishment of TACCs in 1999.. .................................................................. 8
Table 2. Performance indicators, upper and lower reference points and their values for
the NZ and SZ of the South Australian Giant Crab Fishery in 2013.. ........................... 11
McLeay, L. (2015) SA Giant Crab Fishery 2013/14
vi
LIST OF FIGURES
Figure 1. Levels of (A) total catch (blue bars) and fishing effort (total potlifts) (red line) and; (B) catch per unit effort (CPUE; kg potlift-1) in the Giant Crab Fishery. .................. 5
Figure 2. Annual (fishing season) measures of (A) total catch; (B) fishing effort; and (C) catch per unit effort (CPUE) for each sector in the Northern and Southern Zones of the Giant Crab Fishery. ....................................................................................................... 9
Figure 3. Annual (fishing season) measures of the six performance indicators for the NZ (blue lines) and SZ (green lines) of the Giant Crab Fishery: A. Catch (as percentage of the TACC caught); B. Effort; C. Catch rate (CPUE) (kg.potlift-1); D. Mean weight; E. Pre-recruit abundance i.e. number of undersize (<150mm) crabs per potlift and; F. Sex ratio.. .......................................................................................................................... 12
McLeay, L. (2015) SA Giant Crab Fishery 2013/14
vii
ACKNOWLEDGEMENTS
Funds for this research were obtained through licence fees managed by Primary
Industries and Regions South Australia (PIRSA). John Feenstra (SARDI Aquatic
Sciences) provided catch data through data extraction procedures run from the South
Australian Rock Lobster (SARL) database. Kylie Howard (SARDI Information Services
Group) provided valuable and timely administrative support to corrections required in
the SARL database. Dr Ben Stobart provided advice relating to data preparation and
analyses. The report was formally reviewed by Dr Jonathan Carroll and Dr Ben Stobart
(SARDI Aquatic Sciences) and formally approved for release by Dr Stephen Mayfield
(SARDI Aquatic Sciences).
McLeay, L. (2015) SA Giant Crab Fishery 2013/14
1
EXECUTIVE SUMMARY
This report provides an assessment of the status of the Giant Crab
(Pseudocarcinus gigas) resource in 2015, utilising data to the end of the 2013/14 fishing
season (Northern Zone (NZ): 1 November 2013 to 31 May 2014; Southern Zone (SZ):
1 October 2013 to 30 April 2014). It is reliant on fishery-dependent data. Data are
analysed at the scale of the whole fishery, the NZ and SZ, and among commercial fishing
sectors.
The three commercial fishing sectors that contribute to the fishery are the (1)
Miscellaneous Fishery licence holders; (2) Rock Lobster licence holders with Giant Crab
quota (RL-quota) and; (3) remaining Rock Lobster licence holders entitled to catch Giant
Crab as a by-product (RL by-product). In this report, reference to the fishing season
refers to the first year of the start of the season (e.g. 2013 refers to the 2013/14 fishing
season).
In 2013, the Total Allowable Commercial Catch (TACC) was 22.1 t (NZ 13.4 t and SZ
8.7 t) and has remained unchanged since 2000. Total catch has been relatively stable
since the introduction of sectorial quotas in 2002. However, in 2013, the total catch was
the lowest recorded since 1996 at 17.3 t, with 77% and 75% of the zonal TACCs
harvested in the NZ and SZ, respectively.
In 2013, the distribution of catch among sectors was 65.4% (11.3 t) in the Miscellaneous
Fishery sector, 32.2% (5.6 t) in the RL-quota sector and 2.4% (0.4 t) harvested as by-
product by Rock Lobster fishers. The distribution of catch among sectors has changed
little since the previous assessment in 2012 (71%, 27% and 2%, respectively) and is
similar in the NZ and SZ.
Total effort has generally declined through time, and in 2013 was the second lowest value
of effort recorded since 1994 (2013: 15,248 potlifts). This trend is primarily due to
substantial decreases in effort in the RL by-product sector.
Relatively stable catches combined with reduced effort have resulted in steady increases
in catch rates (CPUE) across the fishery since 2009. The last four fishing seasons (2010:
1.86 kg.potlift-1; 2011: 1.25 kg.potlift-1; 2012: 1.43 kg.potlift-1; 2013: 1.13 kg.potlift-1) have
recorded some of the highest estimates of CPUE since 1993 (2.03 kg.potlift-1). From 2000
to 2013, CPUE in the Miscellaneous Fishery sector in the NZ (range: 2.2 - 4.3 kg.potlift-1)
and SZ (range: 2.1 - 4.1 kg.potlift-1) has consistently been more than double that of the
RL-quota sector and ten times that of the RL by-product sector.
The extent to which any of the current performance indicators reflect a change in stock
status of Giant Crab in South Australia is unclear. Data were available to assess fishery
McLeay, L. (2015) SA Giant Crab Fishery 2013/14
2
performance against six of the seven interim PIs in each zone in 2013. There were no
data for the PI relating to spawning female abundance. In both the NZ and SZ, three PIs
(effort, catch rate (CPUE) and sex ratio) were within the ranges prescribed by the upper
and lower reference points. The PIs for catch (percentage of TACC caught), mean weight
of crabs harvested and pre-recruit abundance were below the lower reference points
defined for these PIs in both zones. Catch reduced by at least 20% in both zones
between 2012 and 2013. Mean weight of crabs remains near, but below, the lower
reference point for this PI in both zones. In 2013, pre-recruit abundance for the NZ was
the lowest on record while in the SZ pre-recruit abundance was also among the lowest on
record. Pre-recruit abundance has been below the reference point in the NZ and SZ for
the past four and five seasons, respectively, indicating that future recruitment to the
fishable stock may be reduced.
Catch rate (CPUE), pre-recruit abundance and effort are unlikely to be reliable proxies for
determining trends in the abundance of Giant Crab due to (1) the inclusion of data from
the South Australian Rock Lobster Fishery (SARLF) that are subject to historical
inconsistencies in the reporting of targeted fishing effort; and (2) the limited number of
dedicated Giant Crab fishers that impedes estimation of PIs from this sector of the fishery
alone.
Refinements in the methods used to define and calculate PIs and reference points are
required. The PIs described in this report do not align with those listed for Giant Crab
under the nationally agreed framework for assessing fish stock sustainability (Flood et al.
2014) and some of the current reference points do not reflect the range of temporal
variation shown by a PI. Inclusion of new PIs, based on levels of egg production and the
proportion of the spawning stock protected by minimum size limits, could be estimated
through the collection of representative length-frequency data. These data would also
align with PIs calculated for Giant Crab in other States, aid interpretation of current PIs,
particularly CPUE and mean weight, and increase the reliability of the overall assessment
of Giant Crab stock status in South Australia and nationally.
Given the uncertainty surrounding the reliability of some data and the contrast in
inference of stock status among PIs, using the national framework for stock status
reporting, the status of the SA Giant Crab stock would be classified as undefined1.
1 The stock status classification 'undefined stock' is described in Flood et al. (2014) as indicating that not
enough information exists to determine stock status.
McLeay, L. (2015) SA Giant Crab Fishery 2013/14
3
1. INTRODUCTION
This status report for the South Australian Giant Crab (Pseudocarcinus gigas) Fishery
(GCF) updates previous stock assessment and status reports for this species (Currie
and Ward 2005; Currie et al. 2006; Currie 2008; Currie and Ward 2009; Currie 2010;
Currie 2011a, b; Chick 2013; Stobart 2014) and is part of the SARDI Aquatic Science’s
ongoing assessment program for this fishery. This document summarises information
collected from commercial logbook returns from 1 November 1987 to 31 May 2014.
A detailed description of the history and management arrangements for the fishery, and
the biological information available for its assessment are provided in Sloan (2002,
2003) and previous stock assessment and status reports. In summary, in 1997, the
GCF was separated into two zones, the Southern Zone (SZ) and Northern Zone (NZ)
that are consistent with those designated for the South Australian Rock Lobster Fishery
(SARLF). Fishing in each zone is subject to a seasonal closure. The fishing season in
the SZ is between 1 October and 30 April, while fishing in the NZ is between
1 November and 31 May. In this report, reference to a fishing season refers to the year
the fishing season started (e.g. SZ fishery-dependent data reported for 2013 includes
data from 1 October 2013 to 30 April 2014; NZ includes those data from 1 November
2013 to 31 May 2014).
An annual Total Allowable Commercial Catch (TACC) of 26 t was implemented for the
GCF in 1999 (NZ: 13.4 t and SZ: 12.6 t). From 2000 onwards, this TACC was reduced
to 22.1 t (NZ: 13.4 t and SZ: 8.7 t) and has since remained unchanged (PIRSA 2009
and Table 1). In 2013, the TACC was allocated among 16 licence holders: two in the
South Australian Miscellaneous Fishery and 14 in the SARLF. Within the SARLF, Giant
Crab quota is allocated to licence holders as a unit holding (RL–quota). Remaining
SARLF licence holders have an entitlement to land up to five individual Giant Crabs per
fishing trip as bycatch (RL by-product).
2. METHODS
Fishery-dependent data are collected from the three commercial fishing sectors
(Miscellaneous Fishery, RL–quota and RL by-product). Historical data are unavailable
to accurately identify SARLF licence holders that held Giant Crab quota between 1999
and 2005. Based on previously applied decision rules (SARDI unpublished data)
fishery-dependent data within this period was allocated to the RL-quota sector by
referencing SARLF licence holders who held Giant Crab quota in 2006 and an
additional SARLF licence holder (between 1999 and 2002). From 2006, PIRSA has
McLeay, L. (2015) SA Giant Crab Fishery 2013/14
4
provided information to SARDI to identify licence holders among each fishing sector
with Giant Crab entitlement. All other fishery-dependent data from SARLF licence
holders without allocated Giant Crab quota is assigned to the RL by-product sector.
Effort is reported as the total number of potlifts recorded against Giant Crab catch
across all sectors of the fishery, including all SARLF potlifts (unless otherwise stated).
This decision rule for effort is applied to maintain consistency with previous stock
assessment and status reports, and due to the fact that Giant Crab catch in the SARLF
has not always been segregated by the specific pots used to target Rock Lobster or
Giant Crab. Historical inconsistencies in reporting the numbers of pots used to catch
Giant Crabs by RLF licence holders have resulted in measures of effort and CPUE
from these sectors to be less reliable than those data from Miscellaneous Fishery
licence holders. To aid the interpretation of trends in catch, effort and CPUE in this
report, fishery-dependent data are presented separately for each sector that contribute
to the catch of Giant Crab.
In addition, from 2011, previously unreported historical data were made available
through data-entry corrections (equating to <550 kg difference in catch in each zone
per year). Consequently, there are small discrepancies between the fishery-dependent
data reported previously and this report.
Performance indicators (PIs) for this fishery are detailed in Sloan (2003) and have been
calculated using fishery-dependent data from the Miscellaneous Fishery and RL-quota
sectors only. Further, the PI for ‘pre-recruit abundance’ is the number of undersize
(<150 mm) Giant Crabs per potlift (undersize crabs.potlift-1), where the PI measure of
effort was the number of Giant Crab pots lifted, not total effort (that includes RL pots).
3. RESULTS
3.1. Catch
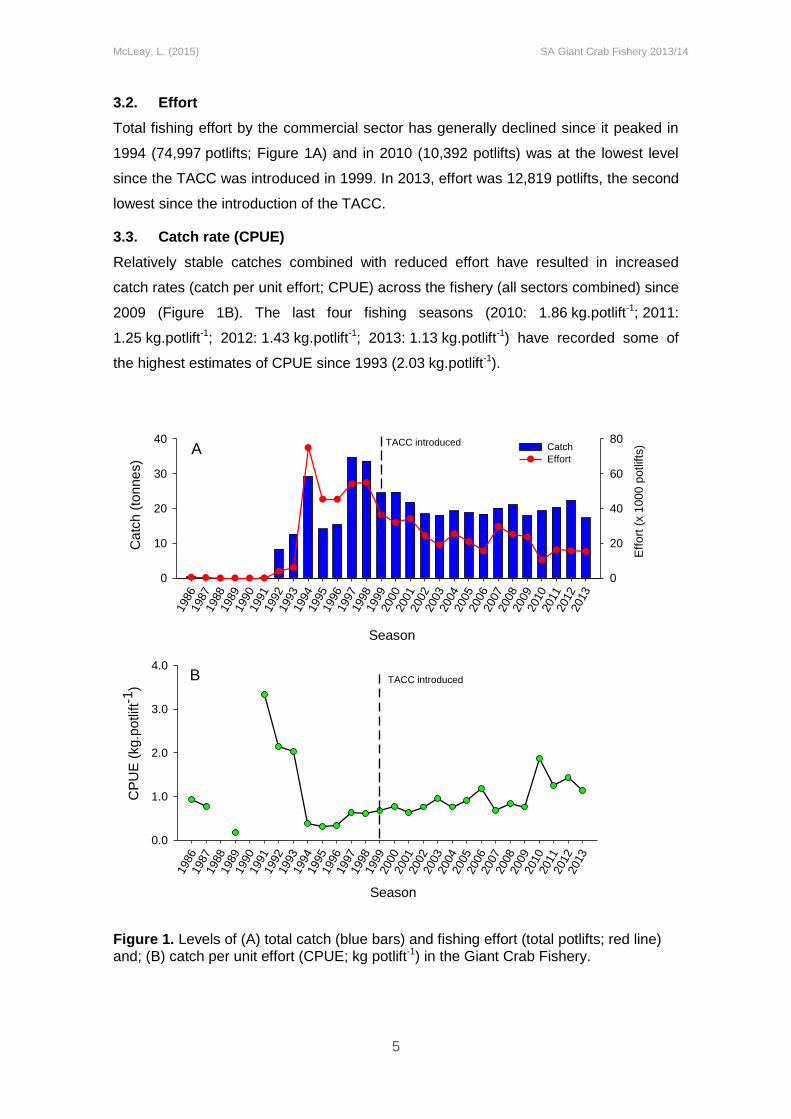
The total annual catch of Giant Crab landed by all three commercial sectors (i.e.
Miscellaneous Fishery, RL–quota and RL by-product) varied considerably prior to the
introduction of TACC in 1999 (Figure 1). The annual catch reached a historical high of
34.7 t in 1997. Subsequently, catches declined and, after the introduction of the TACC
in 1999, remained relatively stable (17-22 t) following higher catches in 1999 (24.6 t)
and 2000 (24.6 t). In 2013, 17.3 t of Giant Crab were landed by commercial fishers,
representing the lowest level of catch recorded since 1996 (Figure 1A; Table 1).
McLeay, L. (2015) SA Giant Crab Fishery 2013/14
5
3.2. Effort
Total fishing effort by the commercial sector has generally declined since it peaked in
1994 (74,997 potlifts; Figure 1A) and in 2010 (10,392 potlifts) was at the lowest level
since the TACC was introduced in 1999. In 2013, effort was 12,819 potlifts, the second
lowest since the introduction of the TACC.
3.3. Catch rate (CPUE)
Relatively stable catches combined with reduced effort have resulted in increased
catch rates (catch per unit effort; CPUE) across the fishery (all sectors combined) since
2009 (Figure 1B). The last four fishing seasons (2010: 1.86 kg.potlift-1; 2011:
1.25 kg.potlift-1; 2012: 1.43 kg.potlift-1; 2013: 1.13 kg.potlift-1) have recorded some of
the highest estimates of CPUE since 1993 (2.03 kg.potlift-1).
Figure 1. Levels of (A) total catch (blue bars) and fishing effort (total potlifts; red line) and; (B) catch per unit effort (CPUE; kg potlift-1) in the Giant Crab Fishery.
1986
1987
1988
1989
1990
1991
1992
1993
1994
1995
1996
1997
1998
1999
2000
2001
2002
2003
2004
2005
2006
2007
2008
2009
2010
2011
2012
2013
Catc
h (
tonnes)
0
10
20
30
40
Eff
ort
(x 1
00
0 p
otlifts
)
0
20
40
60
80Catch
Effort
1986
1987
1988
1989
1990
1991
1992
1993
1994
1995
1996
1997
1998
1999
2000
2001
2002
2003
2004
2005
2006
2007
2008
2009
2010
2011
2012
2013
CP
UE
(kg.p
otlift-1
)
0.0
1.0
2.0
3.0
4.0
A
B
Season
Season
TACC introduced
TACC introduced
McLeay, L. (2015) SA Giant Crab Fishery 2013/14
6
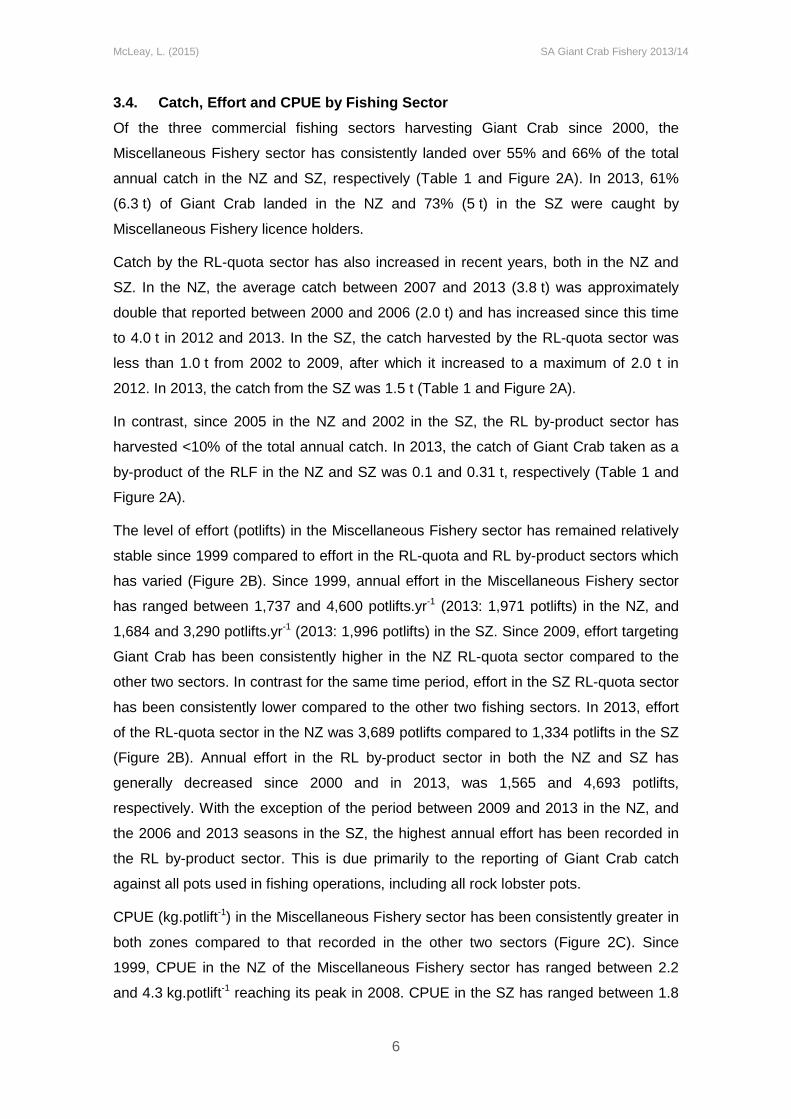
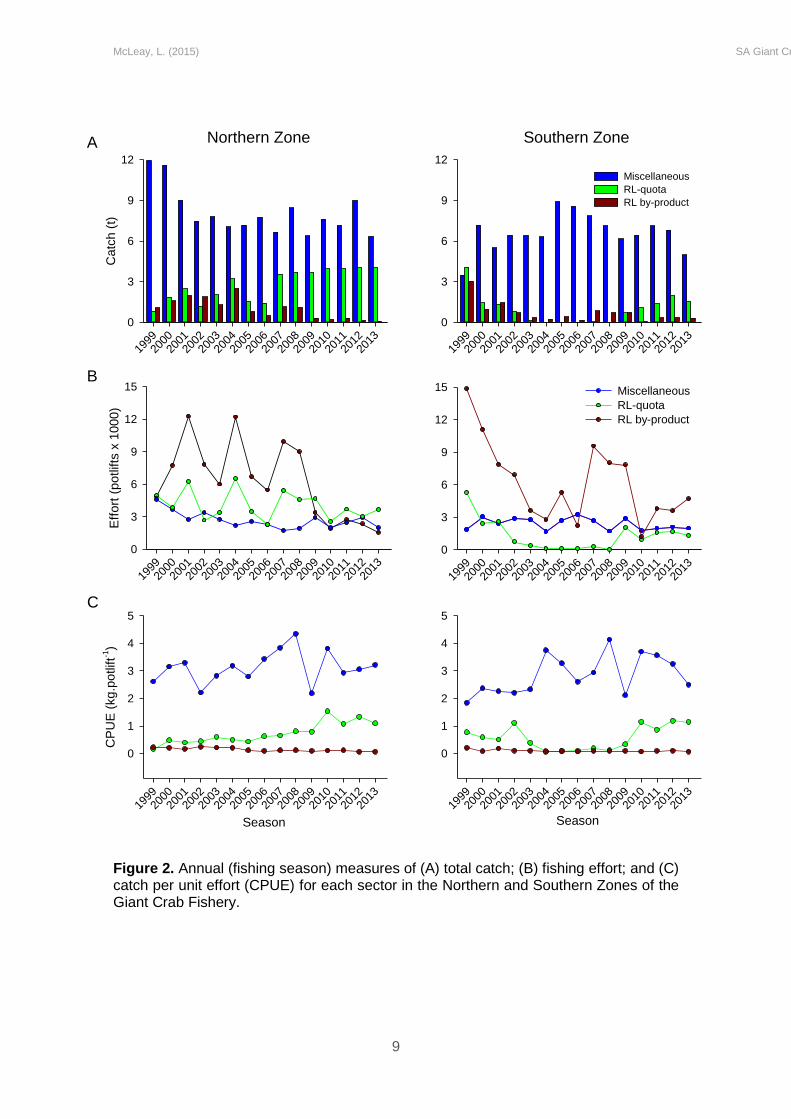
3.4. Catch, Effort and CPUE by Fishing Sector
Of the three commercial fishing sectors harvesting Giant Crab since 2000, the
Miscellaneous Fishery sector has consistently landed over 55% and 66% of the total
annual catch in the NZ and SZ, respectively (Table 1 and Figure 2A). In 2013, 61%
(6.3 t) of Giant Crab landed in the NZ and 73% (5 t) in the SZ were caught by
Miscellaneous Fishery licence holders.
Catch by the RL-quota sector has also increased in recent years, both in the NZ and
SZ. In the NZ, the average catch between 2007 and 2013 (3.8 t) was approximately
double that reported between 2000 and 2006 (2.0 t) and has increased since this time
to 4.0 t in 2012 and 2013. In the SZ, the catch harvested by the RL-quota sector was
less than 1.0 t from 2002 to 2009, after which it increased to a maximum of 2.0 t in
2012. In 2013, the catch from the SZ was 1.5 t (Table 1 and Figure 2A).
In contrast, since 2005 in the NZ and 2002 in the SZ, the RL by-product sector has
harvested <10% of the total annual catch. In 2013, the catch of Giant Crab taken as a
by-product of the RLF in the NZ and SZ was 0.1 and 0.31 t, respectively (Table 1 and
Figure 2A).
The level of effort (potlifts) in the Miscellaneous Fishery sector has remained relatively
stable since 1999 compared to effort in the RL-quota and RL by-product sectors which
has varied (Figure 2B). Since 1999, annual effort in the Miscellaneous Fishery sector
has ranged between 1,737 and 4,600 potlifts.yr-1 (2013: 1,971 potlifts) in the NZ, and
1,684 and 3,290 potlifts.yr-1 (2013: 1,996 potlifts) in the SZ. Since 2009, effort targeting
Giant Crab has been consistently higher in the NZ RL-quota sector compared to the
other two sectors. In contrast for the same time period, effort in the SZ RL-quota sector
has been consistently lower compared to the other two fishing sectors. In 2013, effort
of the RL-quota sector in the NZ was 3,689 potlifts compared to 1,334 potlifts in the SZ
(Figure 2B). Annual effort in the RL by-product sector in both the NZ and SZ has
generally decreased since 2000 and in 2013, was 1,565 and 4,693 potlifts,
respectively. With the exception of the period between 2009 and 2013 in the NZ, and
the 2006 and 2013 seasons in the SZ, the highest annual effort has been recorded in
the RL by-product sector. This is due primarily to the reporting of Giant Crab catch
against all pots used in fishing operations, including all rock lobster pots.
CPUE (kg.potlift-1) in the Miscellaneous Fishery sector has been consistently greater in
both zones compared to that recorded in the other two sectors (Figure 2C). Since
1999, CPUE in the NZ of the Miscellaneous Fishery sector has ranged between 2.2
and 4.3 kg.potlift-1 reaching its peak in 2008. CPUE in the SZ has ranged between 1.8
McLeay, L. (2015) SA Giant Crab Fishery 2013/14
7
and 4.1 kg.potlift-1 with a peak in CPUE also recorded in 2008 (Figure 2C). These
levels of CPUE are generally more than double that of the RL-quota sector and
commonly an order of magnitude greater than that of the RL by-product sector. In
2013, CPUE in the Miscellaneous Fishery sector was 3.21 and 2.50 kg.potlift-1 in the
NZ and SZ, respectively. In the RL-quota sector CPUE has steadily increased in the
NZ since 2005 and in the SZ since 2008. The CPUE recorded by the RL-quota sector
in 2013 was the third highest on record in the NZ (1.10 kg.potlift-1) and second highest
on record in the SZ (1.14 kg.potlift-1).
McLeay, L. (2015) SA Giant Crab Fishery 2013/14
8
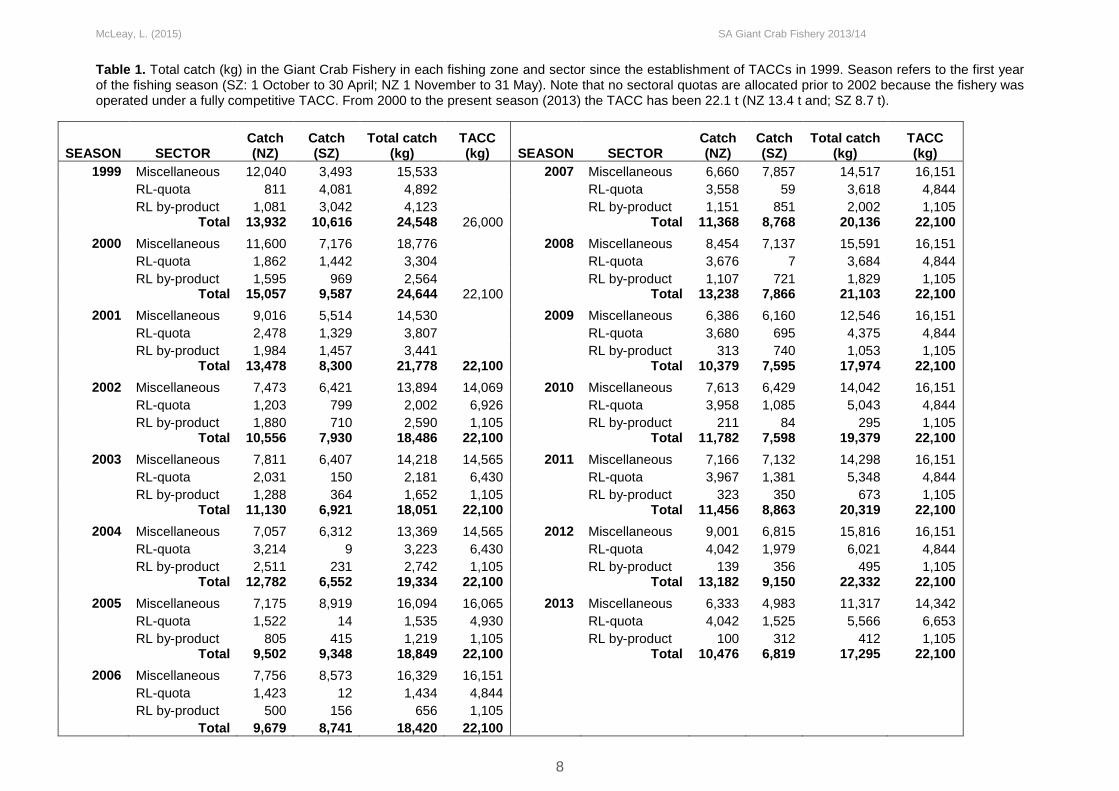
Table 1. Total catch (kg) in the Giant Crab Fishery in each fishing zone and sector since the establishment of TACCs in 1999. Season refers to the first year of the fishing season (SZ: 1 October to 30 April; NZ 1 November to 31 May). Note that no sectoral quotas are allocated prior to 2002 because the fishery was operated under a fully competitive TACC. From 2000 to the present season (2013) the TACC has been 22.1 t (NZ 13.4 t and; SZ 8.7 t).
SEASON SECTOR Catch (NZ)
Catch (SZ)
Total catch (kg)
TACC (kg) SEASON SECTOR
Catch (NZ)
Catch (SZ)
Total catch (kg)
TACC (kg)
1999 Miscellaneous 12,040 3,493 15,533
2007 Miscellaneous 6,660 7,857 14,517 16,151
RL-quota 811 4,081 4,892
RL-quota 3,558 59 3,618 4,844
RL by-product 1,081 3,042 4,123
RL by-product 1,151 851 2,002 1,105
Total 13,932 10,616 24,548 26,000
Total 11,368 8,768 20,136 22,100
2000 Miscellaneous 11,600 7,176 18,776
2008 Miscellaneous 8,454 7,137 15,591 16,151
RL-quota 1,862 1,442 3,304
RL-quota 3,676 7 3,684 4,844
RL by-product 1,595 969 2,564
RL by-product 1,107 721 1,829 1,105
Total 15,057 9,587 24,644 22,100
Total 13,238 7,866 21,103 22,100
2001 Miscellaneous 9,016 5,514 14,530
2009 Miscellaneous 6,386 6,160 12,546 16,151
RL-quota 2,478 1,329 3,807
RL-quota 3,680 695 4,375 4,844
RL by-product 1,984 1,457 3,441
RL by-product 313 740 1,053 1,105
Total 13,478 8,300 21,778 22,100
Total 10,379 7,595 17,974 22,100
2002 Miscellaneous 7,473 6,421 13,894 14,069 2010 Miscellaneous 7,613 6,429 14,042 16,151
RL-quota 1,203 799 2,002 6,926
RL-quota 3,958 1,085 5,043 4,844
RL by-product 1,880 710 2,590 1,105 RL by-product 211 84 295 1,105
Total 10,556 7,930 18,486 22,100
Total 11,782 7,598 19,379 22,100
2003 Miscellaneous 7,811 6,407 14,218 14,565 2011 Miscellaneous 7,166 7,132 14,298 16,151
RL-quota 2,031 150 2,181 6,430
RL-quota 3,967 1,381 5,348 4,844
RL by-product 1,288 364 1,652 1,105 RL by-product 323 350 673 1,105
Total 11,130 6,921 18,051 22,100
Total 11,456 8,863 20,319 22,100
2004 Miscellaneous 7,057 6,312 13,369 14,565 2012 Miscellaneous 9,001 6,815 15,816 16,151
RL-quota 3,214 9 3,223 6,430
RL-quota 4,042 1,979 6,021 4,844
RL by-product 2,511 231 2,742 1,105 RL by-product 139 356 495 1,105
Total 12,782 6,552 19,334 22,100
Total 13,182 9,150 22,332 22,100
2005 Miscellaneous 7,175 8,919 16,094 16,065 2013 Miscellaneous 6,333 4,983 11,317 14,342
RL-quota 1,522 14 1,535 4,930
RL-quota 4,042 1,525 5,566 6,653
RL by-product 805 415 1,219 1,105 RL by-product 100 312 412 1,105
Total 9,502 9,348 18,849 22,100
Total 10,476 6,819 17,295 22,100
2006 Miscellaneous 7,756 8,573 16,329 16,151
RL-quota 1,423 12 1,434 4,844
RL by-product 500 156 656 1,105
Total 9,679 8,741 18,420 22,100
McLeay, L. (2015) SA Giant Crab Fishery 2013/14
9
Figure 2. Annual (fishing season) measures of (A) total catch; (B) fishing effort; and (C) catch per unit effort (CPUE) for each sector in the Northern and Southern Zones of the Giant Crab Fishery.
1999
2000
2001
2002
2003
2004
2005
2006
2007
2008
2009
2010
2011
2012
2013
Catc
h (
t)
0
3
6
9
12
Season
1999
2000
2001
2002
2003
2004
2005
2006
2007
2008
2009
2010
2011
2012
2013
0
1
2
3
4
5
Southern Zone
1999
2000
2001
2002
2003
2004
2005
2006
2007
2008
2009
2010
2011
2012
2013
0
3
6
9
12
Miscellaneous
RL-quota
RL by-product
1999
2000
2001
2002
2003
2004
2005
2006
2007
2008
2009
2010
2011
2012
2013
Eff
ort
(potlifts
x 1
000)
0
3
6
9
12
15
1999
2000
2001
2002
2003
2004
2005
2006
2007
2008
2009
2010
2011
2012
2013
0
3
6
9
12
15 Miscellaneous
RL-quota
RL by-product
A
B
Northern Zone
C
Season
1999
2000
2001
2002
2003
2004
2005
2006
2007
2008
2009
2010
2011
2012
2013
CP
UE
(kg
.potlift-1
)
0
1
2
3
4
5
McLeay, L. (2015)
SA Giant Crab Fishery 2013/14
10
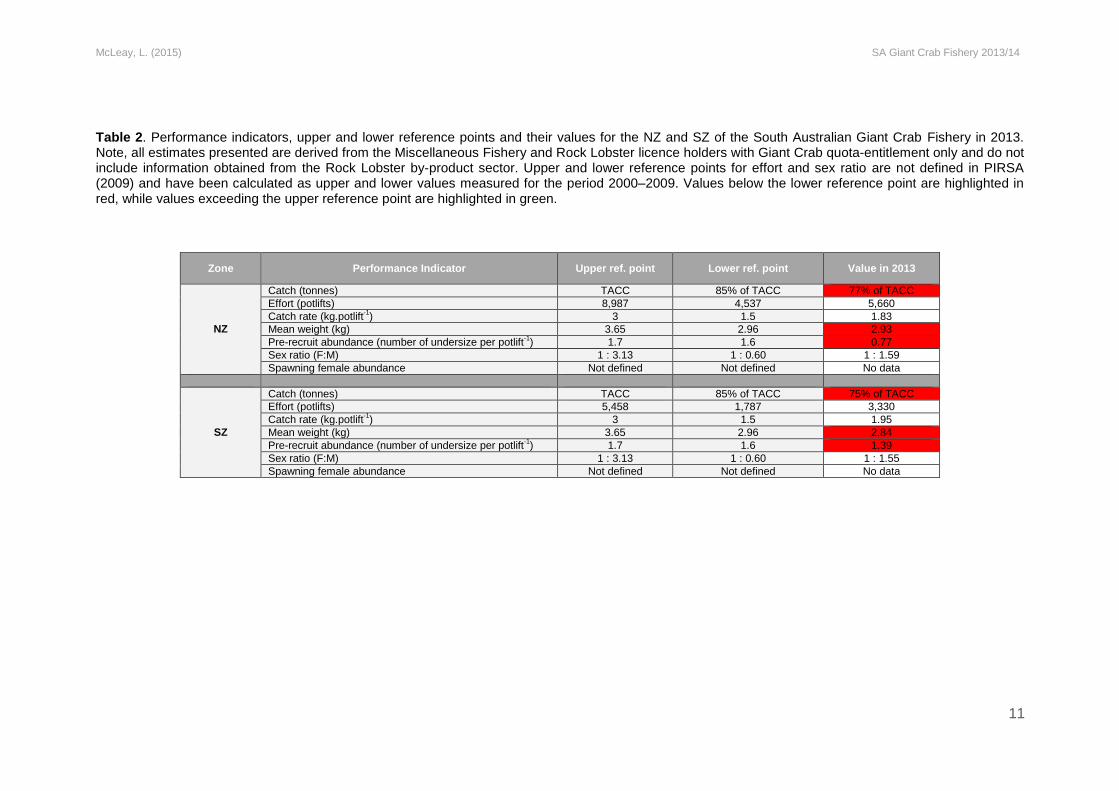
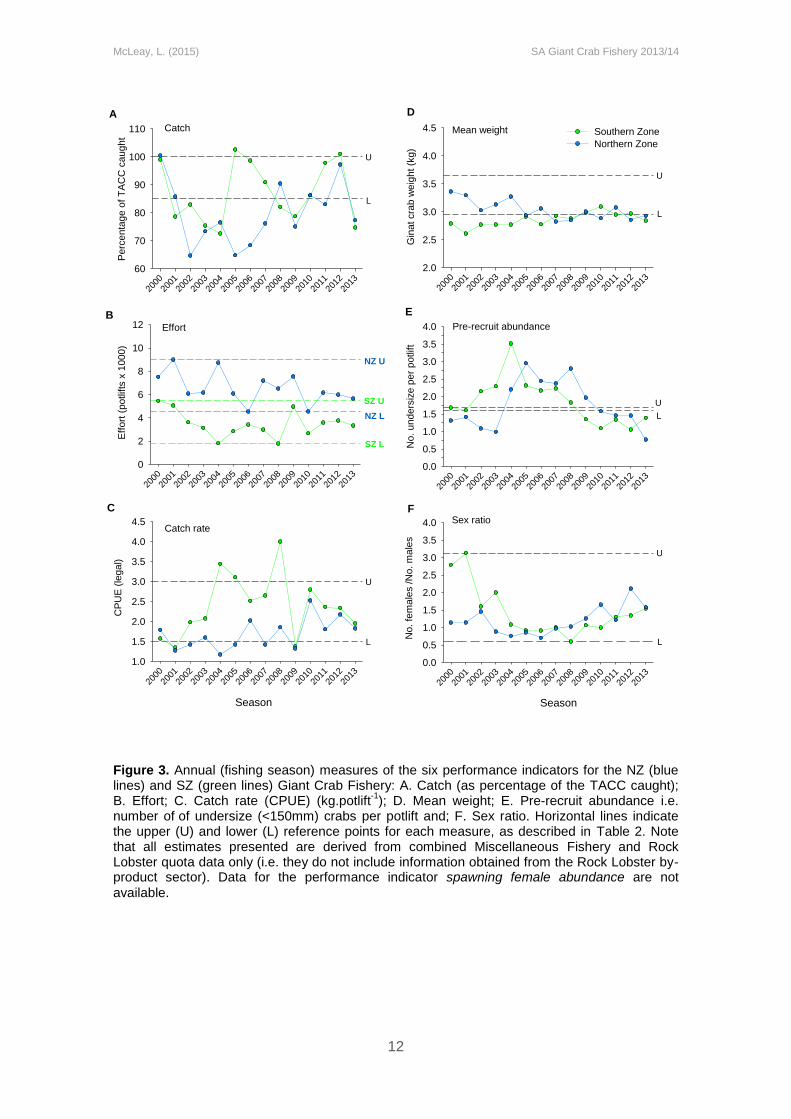
3.5. Performance Indicators
This section provides a report on the performance of the fishery against the interim
performance indicators (PIs) and reference points for the Giant Crab Fishery (see
PIRSA 2009). There are seven biological PIs specified for Giant Crabs in the NZ and
SZ (Table 2; Figure 3). In each zone, data are available to assess fishery performance
against six PIs. Insufficient data are available to assess the abundance of spawning
females. Values of each PI in 2013 were derived from data provided by the
Miscellaneous Fishery and Rock Lobster quota licence holders only. The unit of
measure for the PI on ‘pre-recruit abundance’ is the number of undersize (<150 mm)
Giant Crabs per potlift (number of undersize crabs.potlift-1), where the measure of effort
was the number of Giant Crab pots lifted, not total effort (that includes RL pots). Under
current management arrangements for the fishery, no reference points are defined for
fishing effort (number of potlifts) or sex ratio (Sloan 2003, PIRSA 2009). In line with
previous reporting, provisional upper and lower reference points are calculated and
presented for these two indicators based on maximum and minimum values,
respectively for the period 2000–2009.
3.5.1. Northern Zone
The PIs for effort (potlifts), catch rate (kg.potlift-1) and sex ratio (F:M) in the NZ in 2013
were all within their reference ranges (Table 2). Three performance indicators fell below
their lower reference points. These were catch (percentage of TACC caught: 77%);
mean weight of crabs harvested (kg: 2.93 kg); and pre-recruit abundance (number
of undersize crabs.potlift-1: 0.77) (Table 2).
3.5.2. Southern Zone
Similar trends in performance to those observed in the NZ were seen in the SZ.
Performance indicators for effort (potlifts), catch rate (kg.potlift-1) and sex ratio (F:M) in
the NZ in 2013 were all within their reference ranges (Table 2). Three PIs fell below
their lower reference points. These were catch (percentage of TACC caught: 75%);
mean weight of crabs harvested (kg: 2.84 kg); and pre-recruit abundance (number
of undersize crabs.potlift-1: 1.39; Table 2).
McLeay, L. (2015) SA Giant Crab Fishery 2013/14
11
Table 2. Performance indicators, upper and lower reference points and their values for the NZ and SZ of the South Australian Giant Crab Fishery in 2013. Note, all estimates presented are derived from the Miscellaneous Fishery and Rock Lobster licence holders with Giant Crab quota-entitlement only and do not include information obtained from the Rock Lobster by-product sector. Upper and lower reference points for effort and sex ratio are not defined in PIRSA (2009) and have been calculated as upper and lower values measured for the period 2000–2009. Values below the lower reference point are highlighted in red, while values exceeding the upper reference point are highlighted in green.
Zone Performance Indicator Upper ref. point Lower ref. point Value in 2013
NZ
Catch (tonnes) TACC 85% of TACC 77% of TACC
Effort (potlifts)
8,987 4,537 5,660
Catch rate (kg.potlift-1) 3 1.5 1.83
Mean weight (kg) 3.65 2.96 2.93
Pre-recruit abundance (number of undersize per potlift-1) 1.7 1.6 0.77
Sex ratio (F:M) 1 : 3.13 1 : 0.60 1 : 1.59
Spawning female abundance Not defined Not defined No data
SZ
Catch (tonnes) TACC 85% of TACC 75% of TACC
Effort (potlifts)
5,458 1,787 3,330
Catch rate (kg.potlift-1) 3 1.5 1.95
Mean weight (kg) 3.65 2.96 2.84
Pre-recruit abundance (number of undersize per potlift-1) 1.7 1.6 1.39
Sex ratio (F:M) 1 : 3.13 1 : 0.60 1 : 1.55
Spawning female abundance Not defined Not defined No data
McLeay, L. (2015) SA Giant Crab Fishery 2013/14
12
Figure 3. Annual (fishing season) measures of the six performance indicators for the NZ (blue lines) and SZ (green lines) Giant Crab Fishery: A. Catch (as percentage of the TACC caught); B. Effort; C. Catch rate (CPUE) (kg.potlift
-1); D. Mean weight; E. Pre-recruit abundance i.e.
number of of undersize (<150mm) crabs per potlift and; F. Sex ratio. Horizontal lines indicate the upper (U) and lower (L) reference points for each measure, as described in Table 2. Note that all estimates presented are derived from combined Miscellaneous Fishery and Rock Lobster quota data only (i.e. they do not include information obtained from the Rock Lobster by-product sector). Data for the performance indicator spawning female abundance are not
available.
C
Season
2000
2001
2002
2003
2004
2005
2006
2007
2008
2009
2010
2011
2012
2013
CP
UE
(le
gal)
1.0
1.5
2.0
2.5
3.0
3.5
4.0
4.5
U
L
F
Season
2000
2001
2002
2003
2004
2005
2006
2007
2008
2009
2010
2011
2012
2013
No. fe
male
s /N
o. m
ale
s
0.0
0.5
1.0
1.5
2.0
2.5
3.0
3.5
4.0
U
L
B
2000
2001
2002
2003
2004
2005
2006
2007
2008
2009
2010
2011
2012
2013
Eff
ort
(potlifts
x 1
000)
0
2
4
6
8
10
12
SZ U
NZ U
NZ L
SZ L
E
2000
2001
2002
2003
2004
2005
2006
2007
2008
2009
2010
2011
2012
2013
No. unders
ize p
er
potlift
0.0
0.5
1.0
1.5
2.0
2.5
3.0
3.5
4.0
U
L
A
2000
2001
2002
2003
2004
2005
2006
2007
2008
2009
2010
2011
2012
2013
Perc
enta
ge o
f T
AC
C c
aught
60
70
80
90
100
110
U
L
D
2000
2001
2002
2003
2004
2005
2006
2007
2008
2009
2010
2011
2012
2013
Gin
at cra
b w
eig
ht (k
g)
2.0
2.5
3.0
3.5
4.0
4.5
U
L
Southern Zone
Northern Zone
Sex ratio
Pre-recruit abundance
Catch
Effort
Mean weight
Catch rate
McLeay, L. (2015) SA Giant Crab Fishery 2013/14
13
4. DISCUSSION
4.1. Information, data gaps and uncertainty in the assessment
Assessment of the South Australian Giant Crab Fishery is supported by fishery-
dependent data collected since 1986 and information on the species fisheries biology
and stock structure (Levings et al. 2001). Interpretation of the available data is
complicated by historical inconsistencies in the reporting of data within and among
sectors, especially the RLF prior to 2006. The small number of dedicated Giant Crab
fishers participating in the fishery also means that changes in the behaviour of a single
fisher can have a substantial influence on the data, performance indicators and their
interpretation.
The current PIs for the fishery are all based on fishery-dependent data. The lack of any
PI based on fishery-independent data reflects the small size and relatively low value of
the fishery. The extent to which any of the current PIs reflect a change in stock status of
Giant Crab in South Australia is unclear. PIs for catch rate (CPUE), pre-recruit
abundance and effort may not be reliable proxies for the abundance of Giant Crab due
to (1) the inclusion of data from the RLF that are subject to historical inconsistencies in
reporting of targeted fishing effort; and (2) the limited number of dedicated Giant Crab
fishers which impedes estimation of these indices from this sector of the fishery alone.
As previously recommended in PIRSA (2009) refinements in the methods used to define
and calculate PIs and reference points are required. The PIs described in this report do
not completely align with those listed for Giant Crab under the nationally agreed
framework for assessing fish stock sustainability (Flood et al. 2014) and some of the
current reference points do not reflect the range of temporal variation shown by the PI.
For example, estimates of pre-recruit abundance range from 1.17 to 4.0
undersize.potlift-1 across the fishery between 2000 and 2013. This compares to the
relatively narrow range defined for this indicator’s reference point
(1.6 to 1.7 undersize.potlift-1). Additionally, inclusion of new PIs based on egg production
and proportion of spawning stock protected by minimum size limits could be estimated
through the acquisition of representative length-frequency data. These data would
augment interpretation of other PIs, particularly CPUE, pre-recruit abundance and mean
weight, and increase the reliability of the overall assessment of Giant Crab stock status.
In the absence of this information, the use of a historical reference period, when the
fishery was performing well, may provide a range within which more informative
reference points could be defined. One option would be to generate upper and lower
quantiles (e.g. 10-25%) of the historical data (PIRSA 2012a). Alternatively, triggers could
include measures for PIs describing greatest variation or maximum rates of change
McLeay, L. (2015) SA Giant Crab Fishery 2013/14
14
within the reference period (PIRSA 2012b). Finally, as Giant Crab pots are not always
hauled daily, soak time is likely to have an effect on catch rate. Research into the effect
of soak time on catch rate is being investigated by SARDI and may be built into future
data collection protocols and assessments of the fishery.
4.2. Status of the Giant Crab Fishery
There is no index yet established that unambiguously defines stock status for this
fishery. Consequently, a weight-of-evidence approach is applied which involves
interpretation of data with potentially contrasting inferences of stock status. The contrast
in this assessment lies between (1) the PIs for catch rate (CPUE), effort and sex ratio
lying within the range described by the upper and lower reference points and;
(2) declines in the PIs for catch, mean weight and pre-recruit abundance to levels below
their lower reference points.
In the NZ, the PIs for effort, catch rate (CPUE) and the sex ratio of the catch were within
the ranges prescribed by the upper and lower reference points described in PIRSA
(2009). However, the PIs for catch, mean weight and pre-recruit abundance were below
the lower reference point. The high pre-recruit abundance observed from 2004 to 2008
is likely to have resulted in strong recruitment to the fishery and increases in CPUE to
among the highest levels on record in 2010, 2011, 2012 and 2013. These relatively
higher recruitment levels may also explain the historically low mean weight recorded
between 2005 and 2013. Subsequently, pre-recruit abundance has declined (since
2005) to the lowest level ever recorded in 2013, suggesting recruitment to the fishery
over the next few years may be limited.
In the SZ, PIs for effort, catch rate (CPUE) and sex ratio of the catch were within the
upper and lower reference points range described in PIRSA (2009). However, the PIs
for catch, mean weight and pre-recruit abundance were below their lower reference
points. The PI for pre-recruit abundance has been at historically low levels and below
the lower reference point for the last five fishing seasons, with the value for 2013 among
the lowest on record. Given the similar decline in this PI in the NZ, this trend in the SZ
supports the inference of a fishery-wide reduction in future recruitment to the fishable
stock.
The limitations of the data described in Section 4.1 result in a high level of uncertainty in
the assessment of the current stock status of Giant Crabs in South Australia. Therefore,
under the national framework for reporting of stock status (Flood et al. 2014), the SA
Giant Crab Fishery is classified as an undefined stock1. However, the recent declines in
1 The stock status classification 'undefined stock' is described in Flood et al. (2012) as indicating that not
enough information exists to determine stock status.
McLeay, L. (2015) SA Giant Crab Fishery 2013/14
15
catch, CPUE and pre-recruit abundance, coupled with the low mean weight of crabs
across the fishery, indicate that future assessments of stock status will require careful
consideration. This should include assessing the reliability of CPUE as an index of
abundance and the degree to which the PIs, especially pre-recruit abundance and mean
weight are reflective of stock status.
McLeay, L. (2015) SA Giant Crab Fishery 2013/14
16
5. REFERENCES
Chick, R.C (2013). South Australian Giant Crab (Pseudocarcinus gigas) Fishery. Status Report 2011/2012. Status Report to PIRSA Fisheries and Aquaculture. South Australian Research and Development Institute (Aquatic Sciences), Adelaide. SARDI Publication No. F2011/000332-3. SARDI Research Report Series No. 691. 20p.
Currie, D.R. and Ward, T.M. (2005). South Australian Giant Crab (Pseudocarcinus gigas) Fishery. Fisheries Assessment Report to PIRSA. South Australian Research and Development Institute (Aquatic Sciences), Adelaide. SARDI Publication No. RD04/0215-2. 27p.
Currie, D.R., Mayfield, S., McGarvey, R. and Gardner, C. (2006). South Australian Giant Crab (Pseudocarcinus gigas) Fishery. Fisheries Assessment Report for PIRSA. South Australian Research and Development Institute (Aquatic Sciences), Adelaide. SARDI Publication No. RD04/0215-3. SARDI Research Report Series 137.
Currie, D.R. (2008). South Australian Giant Crab (Pseudocarcinus gigas) Fishery. Status Report for PIRSA Fisheries. South Australian Research and Development Institute (Aquatic Sciences), Adelaide. SARDI Publication No. F2008/000067-1. SARDI Research Report Series 268.
Currie, D.R. and Ward, T.M. (2009). South Australian Giant Crab (Pseudocarcinus gigas) Fishery. Fisheries Assessment Report for PIRSA. South Australian Research and Development Institute (Aquatic Sciences), Adelaide. SARDI Publication No. F2007/000698-2. SARDI Research Report Series 345.
Currie, D.R. (2010). South Australian Giant Crab (Pseudocarcinus gigas) Fishery Status Report 2008/09. Status Report to PIRSA Fisheries. South Australian Research and Development Institute (Aquatic Sciences), Adelaide. SARDI Publication No. F2007/000698-3. SARDI Research Report Series 427.
Currie, D.R. (2011a). South Australian Giant Crab (Pseudocarcinus gigas) Fishery Status Report 2009/10. Fishery Status Report to PIRSA Fisheries and Aquaculture. South Australian Research and Development Institute (Aquatic Sciences), Adelaide. SARDI Publication No. F2011/000332-1. SARDI Research Report Series 568.
Currie, D.R. (2011b). South Australian Giant Crab (Pseudocarcinus gigas) Fishery Status Report 2010/11. Fishery Status Report to PIRSA Fisheries and Aquaculture. South Australian Research and Development Institute (Aquatic Sciences), Adelaide. SARDI Publication No. F2011/000332-2. SARDI Research Report Series 591.
Flood, M., Stobutzki, I., Andrews, J., Begg, G., Fletcher, W., Gardner, C., Kemp, J., Moore, a., O’Brien, A., Quinn, R., Roach, J., Rowling, K., Saunders, T., Ward, T. and Winning, M. (2012). Status of key Australian fish stocks reports 2012. Fisheries Research and Development Corporation, Canberra.
McLeay, L. (2015) SA Giant Crab Fishery 2013/14
17
Levings, A., Mitchell, B.D., McGarvey, R., Mathews, J., Laurenson, L., Austin, C., Heeron, T., Murphy, N., Miller, A., Rowsell, M. and Jones, P. (2001). Fisheries Biology of the Giant Crab Pseudocarcinus gigas. Final report to the Fisheries Research and Development Corporation, Australia, for projects 93/220 & 97/132. Deakin University.
PIRSA. (2009). Ecological Assessment of the South Australian Giant Crab (Pseudocarcinus gigas) Fishery. Re-assessment report prepared for Commonwealth Department of the Environment, Water Heritage and the Arts, for the purposes of part 13 and 13 (A) of the Environment Protection and Biodiversity Conservation Act 1999.
Sloan, S. (2002). A report prepared for Environment Australia on the Management of the South Australian Giant Crab (Pseudocarcinus gigas) Fishery. For the purposes of section 303FN (Approved Wildlife Trade Operation) of the Environment Protection and Biodiversity Conservation Act 1999.
Sloan (2003). Ecological Assessment of the South Australian Giant Crab (Pseudocarcinus gigas) Fishery. Assessment Report Prepared for the Commonwealth Department of the Environment and Heritage, against the ‘Guidelines for the ecologically sustainable management of fisheries’. For the purposes of Part 13 and 13(A) of the Environment Protection and Biodiversity Conservation Act 1999.
Stobart, B. (2014). South Australian Giant Crab (Pseudocarcinus gigas) Fishery Status Report 2012/13. Fishery Status Report to PIRSA Fisheries and Aquaculture. South Australian Research and Development Institute (Aquatic Sciences), Adelaide. SARDI Publication No. F2011/000332-4. SARDI Research Report Series No. 763. 15p.


