IJSRSET17317 | Received : 05 Jan 2017 | Accepted : 16 Jan 2017 | January-February-2017 [(2)1 : 82-91]
© 2017 IJSRSET | Volume 3 | Issue 1 | Print ISSN: 2395-1990 | Online ISSN : 2394-4099
Themed Section: Engineering and Technology
82
Soil Erosion Vulnerability Mapping and Implication on Vegetation in Parts of Oshun River Basin, Nigeria
Samuel A. Samson1*
, Ayansina Ayanlade2, Omowunmi Alabi
3, Abayomi Taofiq Alaga
4, Mustapha
Olayemi Oloko-oba5, Samson A. Ogunyemi
6, Rahmon A. Badru
7
1,4,5,6 ,7 Cooperative Information Network, National Space Research and Development Agency, Obafemi Awolowo University
Campus, Ile-Ife, Nigeria 2Department of Geography, Obafemi Awolowo University, Ile-Ife, Nigeria
3African Regional Centre for Space Science and Technology Education in English (ARCSSTE-E), Obafemi Awolowo
University Campus, Ile-Ife, Nigeria.
Corresponding author: Samuel Samson ([email protected])
ABSTRACT
Soil erosion caused by water has been identified as a threat washing away top soil nutrients needed for healthy plant
growth. It is thus required to identify and map areas vulnerable to erosion for effective conservation of the natural
resources and maintain vegetation health. This research thus analysed soil erosion vulnerability and its implication
on vegetation in parts of Oshun river basin, Nigeria. Data used for this research included: Tropical Rainfall
Measuring Mission (TRMM), LandSat Image, Soil Map, Topographic Map, Small Unmanned Aerial Vehicle and
Global Positioning System. All the dataset were integrated into GIS enabled software where Multi-criteria Analysis
was used to map soil erosion vulnerability. Normalized Difference Vegetation Index was used to assess basin
vegetation. The result showed that 86.38% of the basin soil is moderately vulnerable and soil under dense vegetation
are less vulnerable to erosion.
Keywords: Erosion, GIS, NDVI, Vegetation, Vulnerability
I. INTRODUCTION
Soil erosion is a natural and dynamic process that occurs
when the force of wind, raindrops or runoff on the soil
surface exceeds the cohesive agent that binds the soil
together [10]. It can also be defined as a systematic
washing away of soil plant nutrients from the land
surface by the various agents of denudation which
occurs in several parts of Nigeria under different soil,
climatic and geological formations, although the degree
of occurrence varies considerably from one part of the
country to the other [20].
Soil erosion caused by water is a serious problem in
many parts of the world which causes most of the
degradation of agricultural lands [1]. In Nigeria, soil
erosion is a major environmental problem [20]. where
most of the natural vegetal cover has been degraded. The
soil profile as a whole and topsoil thickness maintained
under undisturbed natural vegetative can be regarded as
being in a steady state [9]. Thus, there is hardly any such
soil under undisturbed vegetation with exception of the
forest reserves in Nigeria. Anthropogenic activities of
man on soil and natural vegetal cover leads to exposing
the soil to agents that accelerate soil erosion and
deterioration, depending on the existence of other
favorable conditions.
Soil erosion is a major environmental threat to the
sustainability and productive capacity of agriculture
causing soil infertility and resulting to productivity
decline [12;13;19].
Nigeria is witnessing increase in prices of foodstuff and
low food crop production coupled with rise in demand
as population keeps increasing [5;8;23]. However, this

International Journal of Scientific Research in Science, Engineering and Technology (ijsrset.com)
83
calls for efficient and sustainable soil management
knowledge as it has major impacts, both positive and
negative, on the properties of the soil that govern its
productivity [4].
Studies on soil erosion have been carried out in many
parts of the world. In Nigeria, such studies include those
of Ibitoye and Adegboyega [15]; Igwe [11]; Ogwo [21];
Fasinmirin [7]. In addition to these is the work of the
ministry of agriculture and food security, ministries of
Agriculture and environment in Nigeria. In the study
conducted so far in this area, the authors were not aware
of studies on soil erosion vulnerability mapping at basin
scale.
It was discovered that none of the studies has been able
to map soil erosion vulnerability areas at basin scale.
Therefore, this study will identify and map areas
vulnerable to soil erosion caused by water and assess
vegetation health over the basin using Normalized
Difference Vegetative Index (NDVI)
A. Study Area
The study area covers some sub-basins in Oshun-Ogun
River Basin. The upper part of the basins originates from
Kwara and Oyo from the east and drains into middle and
lower part of the basins in Osun. The geographical
location of the sub-basins is between Longitudes 4o 23’5”
E to 4o53’ 51” E and Latitudes 7o 44’39” N to 8o 11’45”
N (Figure 1). Some major settlements in the basin
include Offa, Erin-Ile, Ikirun, Okuku, Ilobu Erin Osun,
part of Ede and Oshogbo. The land area of the basin is
about 146621.2 hectares while the basin makes part of
Oshun River Basin [22]. The Oshun River basin is
characterized with basically two seasons: dry and wet
seasons where the dry season runs for November to
March and the wet season is between April to October.
The mean annual rainfall ranges from 900mm to
2000mm with estimated potential evapotranspiration
ranging between 1600 and 1900mm per annum. The
major forested vegetation region is to the south with
shrub land tending towards the north. Agricultural
farmland is found in most zones suitable for cultivation
within the basin.
The soil is predominantly Lixsols luvisols with few
percentages of Fluvisol along the major streams. The
soil permeability ranges from deep to very shallow to
moderately deep well drained soils.
The relief is constituted with low to gently undulation
with gradient from north east to the south. The Erin Dam
receives its source from the Ile Hills with an elevation of
about 625m above the mean sea level. The major rivers
in the basin include Otin River, Ogun River, Alako
River and Erin River.
Figure 1: Study Area Map of the Basins

International Journal of Scientific Research in Science, Engineering and Technology (ijsrset.com)
84
II. METHODS AND MATERIAL
A. Material
The data used for this study include satellite and
analogue achieved data. Satellite data includes the use of
LandSat 8 OLI Imagery for the year 2015, Tropical
Rainfall Measuring Mission (TRMM) for the year 1998
– 2015 and Shuttle Radar Topographic Mission – Digital
Elevation Model (SRTM-DEM v3, 1 ARC SEC). The
analogue archived data includes six Topographic Sheets
of the scale 1:50,000 and Soil map. Other data were
generated from ground truthing were Aerial Photograph
was acquired using small Unmanned Aerial Vehicle
(sUAV) and Ground Control Points was established with
hand held Gobal Positioning System(GPS) for training
the remote sensing data analyses and validation of result.
B. Methods
To delineate the study area, the Shuttle Radar
Topography Mission Digital Elevation Model (SRTM
DEM v3, 1-Arc Sec) covering the study was extracted.
Subsequently, the basin was delineated using ArcSWAT
extension tool in ArcGIS 10.3. The delineated basin was
exported as a shapefile into a working folder from which
it was imported and added to the different software as a
layer. Furthermore, the region of interest (ROI) basin
was used to subset all the participatory spatial dataset
and images used for the project.
The LandSat 8 OLI imagery was imported in Geo-tiff
file format into ERDAS 9.2 software and layer stacked.
The generated basin marking the ROI was used to subset
the satellite images while bands 5(NIR), 4(Red) and 3
(Green) combination was used to generate the False
Colour Composite (FCC) of the individual image. Band
combination is efficient when using LandSat and other
similar image data to study Land use/Land cover
especially if it has to do with vegetation, farmland, water
body, wetland, bare surface and built-up.
Studying soil erosion at basin scale needs data prepared
from primary and secondary sources. In this work, the
thematic layer of interest includes: contour, drainage
network, soil textural layer, landuse/landcover, rainfall,
relief and NDVI.
Topographic and soil map containing the required
thematic dataset were scanned, geo-referenced and
subset using the delineated ROI. Personal geo-database
was created in which all thematic layers were added as
feature classes (point, line and polygon) and
subsequently digitized using on-screen process. Other
surface terrain information generated was Triangulated
Irregular Network (TIN) derived from contour for 3D
visualization and slope map. In addition, sub-watersheds,
stream order and other drainage frequency was
generated from the drainage map. The land use/land
cover was generated from the maximum likelihood
classification of the FCC image covering the study area.
It is important for hydrologists to understand the spatial
distribution of the amount and rate of precipitation [3].
As an input to a hydrological model, the accurate
measurement of rainfall is essential for hydrological
cycle research [27]. The Tropical Rainfall Measuring
Mission (TRMM) dataset was preferred to in-situ
meteorological dataset due to the availability of more
than one station present across the study area. Hence, the
estimated data was further integrated into GIS supported
environment where Inverse Distance Interpolation (IDW)
was applied. The IDW assumes that rainfall at a
measured point compared to an unmeasured point is
inversely proportional to the distance between the two
points [26]. Thus, an exponent of one was used for the
inverse distance relationship. The IDW method was
deployed in GIS enabled software to obtain the mean
annual.
Model building and analysis for mapping potential soil
erosion vulnerable areas within the basins was achieved
using multi-criteria analysis. The aim of soil erosion
potential model is to map out the vulnerability through
pixel or grid based, weighing analysis of influential
factors of erosion and simplify working with them in the
utilized GIS and statistical software. The pixel model
approach was used which is a weighting process or
weighted sum model (WSM), in which weights for each
layer assigned according to its significance in promoting
or reducing soil erosion.
Furthermore, each layer was classified into a number of
classes with each having its own specific weight (Table
3.2). The layer of interest for building the model
includes: rainfall, slope, soil texture, drainage frequency
and land use. These layers were assigned weights in

International Journal of Scientific Research in Science, Engineering and Technology (ijsrset.com)
85
accordance to their contribution to soil erosion which
must sum up to one (1). The assigned weight was
multiplied by its constant class where it is given index
values. Furthermore, the critical index for each pixel was
obtained by the addition of all the computed results of
the spatially overlying pixels for the five (5)
participatory layers. The assignment class weight and
selection of participatory layers was achieved through
pairwise computation techniques [2], field work
evaluation, literature review and expert judgment
[14;18;24]. Geographic Information System (GIS)
supported weighted overlay function was used to
produce the soil erosion vulnerability map.
The implication of soil erosion on vegetal cover was
assessed using NDVI map of the study area. Spatial
analyst tool was used to extract NDVI pixel value
intercepting the various level of vulnerability for
statistical report and assessment.
Table 1.0 : Multi-criteria Decision Analysis Modelling Table.
III. RESULTS AND DISCUSSION
A. Soil Erosion Vulnerability
Using weighted linear combination model to map the
soil erosion vulnerability areas of the basin, the five (5)
factors used for the study includes:
1. Slope
Slope drives erosion in a positive direction and plays
one of the dominant role [25]. Steep land has more
potential to water erosion than flat land in the sense that
erosive forces scour detached transport and deposit soil
particles in a distance place. Therefore, land cover with
slope > 300 are considered to be steep to very steep, 10-
300 are strongly sloping and less than 100 are flat to
gently sloping [6]. The study area is characterized with
varying degrees of slope ranging from flat to gentle to
very steep sloping topography. Region around longitude
4045’E and latitude 80 N are regions with very steep
slope. Erin Osun and its environ is categorized under
steep slope and more than 50% of the basin area are flat
to gentle sloping (Figure 2).
Figure 2 : Slope Map
Name of the
Attribute (j)
Logic behind the attribute Attribute
Weightage
(wj) (Rwj = 1)
Slope Steep slope usually poses greater erosion potentiality 0.2
Soil Texture Coarse texture indicates more propensity to soil erosion 0.23
Landuse Soil under dense vegetal cover are less susceptible to erosion 0.22
Rainfall More raindrop leads to more erosion 0.2
Stream frequency High drainage segment found over relatively elevated and sloppy area
leads to more soil being transported
0.15
International Journal of Scientific Research in Science, Engineering and Technology (ijsrset.com)
86
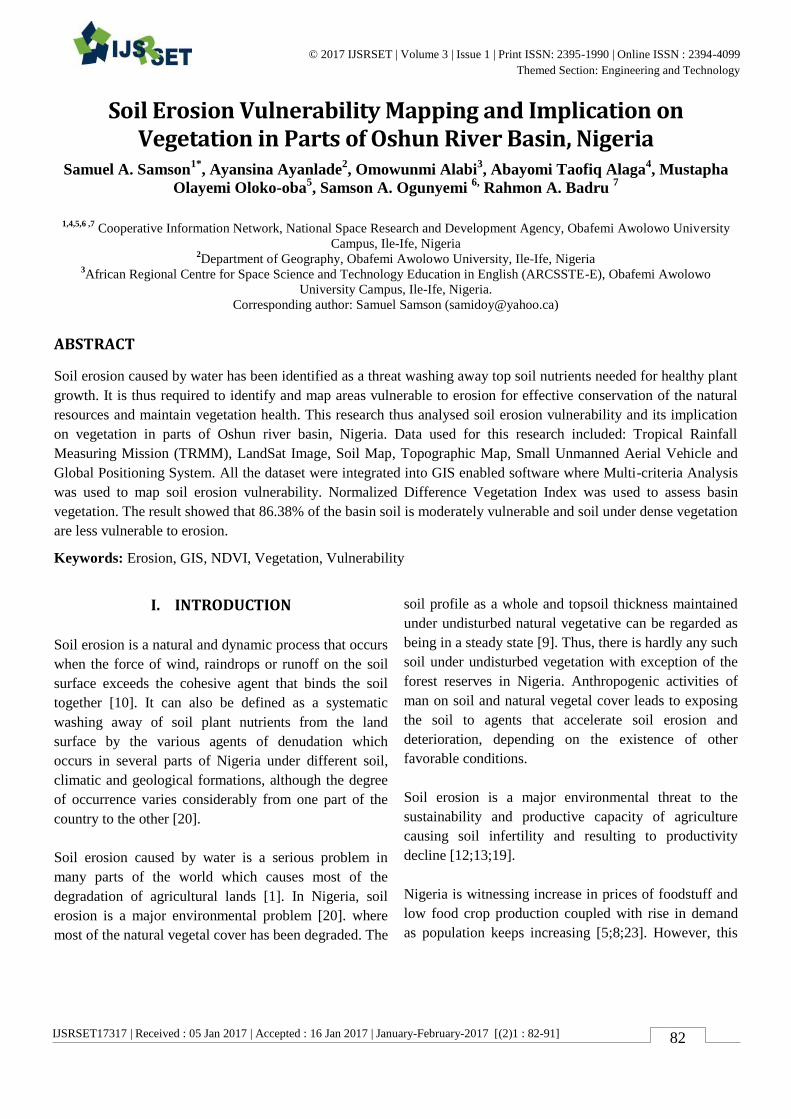
2. Soil
The susceptibility of soil to water erosion is the function
of its erodibility influenced by its physical and chemical
properties. Hence, soil texture inherently determines
erodibility and cohesiveness of soil. Loam soil is highly
susceptible to water erosion in the study area (Figure 3).
Larger percentage of the soil in the study area is sandy
to loamy sand which inspires the weightage value of
0.23.
Figure 3 : Soil Map Extracted from Nigeria Soil Map
.3. Landuse
Land use refers to the current use of the land, whether
for agricultural or non-agricultural purposes. Vegetation
and land use plays a major influence in the rate of soil
erosion. Land cover such as waterbody and rock
outcrops has the least potential to soil erosion.
Vegetation intercept raindrops and influences infiltration
of water. This increases surface soil organic matter,
thereby reducing soil erodibility. Vegetation cover also
slows down soil erosion process while surfaces like open
land agricultural land are more prone to soil erosion by
water. Figure 4 shows the land use/land cover of the
basin.
Figure 4: Land use/land cover Map
4. Rainfall
The rainfall within the study area ranges from 1453 mm
at the southern part of the basin to 1355 mm at the upper
basin (Figure 5). Rainfall as an agent of erosion by water
contributes significantly to soil erosion. Precipitation
within the basin occurs during the wet season (April –
October) which influences the weightage value of 0.2.
Figure 5: Mean Annual Rainfall Map
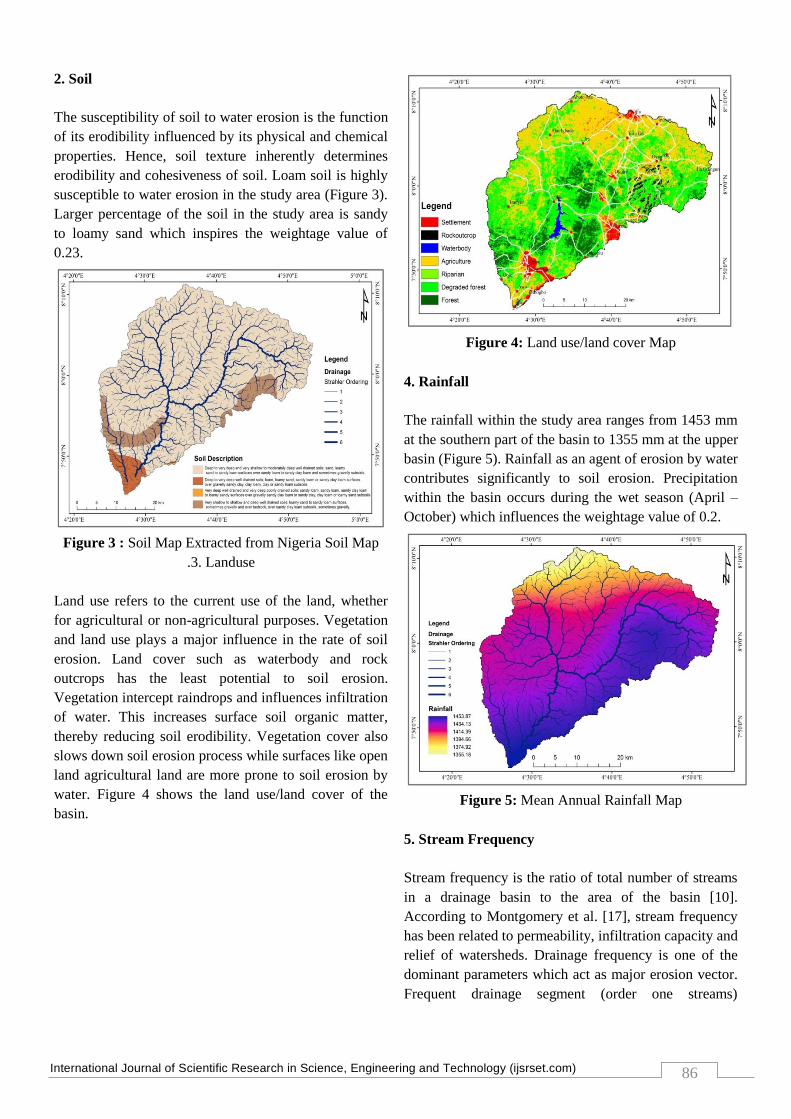
5. Stream Frequency
Stream frequency is the ratio of total number of streams
in a drainage basin to the area of the basin [10].
According to Montgomery et al. [17], stream frequency
has been related to permeability, infiltration capacity and
relief of watersheds. Drainage frequency is one of the
dominant parameters which act as major erosion vector.
Frequent drainage segment (order one streams)
International Journal of Scientific Research in Science, Engineering and Technology (ijsrset.com)
87
influences more erosion and therefore 0.15 weightage
value has been given.
Figure 6: Stream Frequency Map
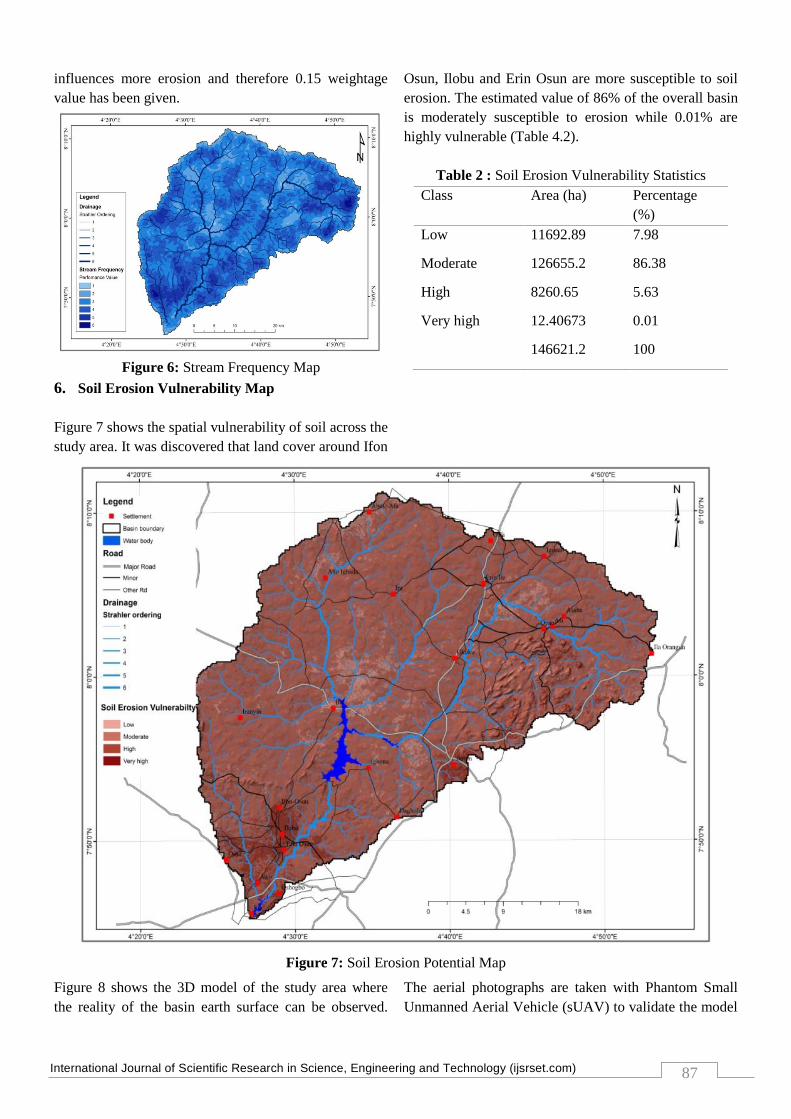
6. Soil Erosion Vulnerability Map
Figure 7 shows the spatial vulnerability of soil across the
study area. It was discovered that land cover around Ifon
Osun, Ilobu and Erin Osun are more susceptible to soil
erosion. The estimated value of 86% of the overall basin
is moderately susceptible to erosion while 0.01% are
highly vulnerable (Table 4.2).
Table 2 : Soil Erosion Vulnerability Statistics
Class Area (ha) Percentage
(%)
Low 11692.89 7.98
Moderate 126655.2 86.38
High 8260.65 5.63
Very high 12.40673 0.01
146621.2 100
Figure 7: Soil Erosion Potential Map
Figure 8 shows the 3D model of the study area where
the reality of the basin earth surface can be observed.
The aerial photographs are taken with Phantom Small
Unmanned Aerial Vehicle (sUAV) to validate the model
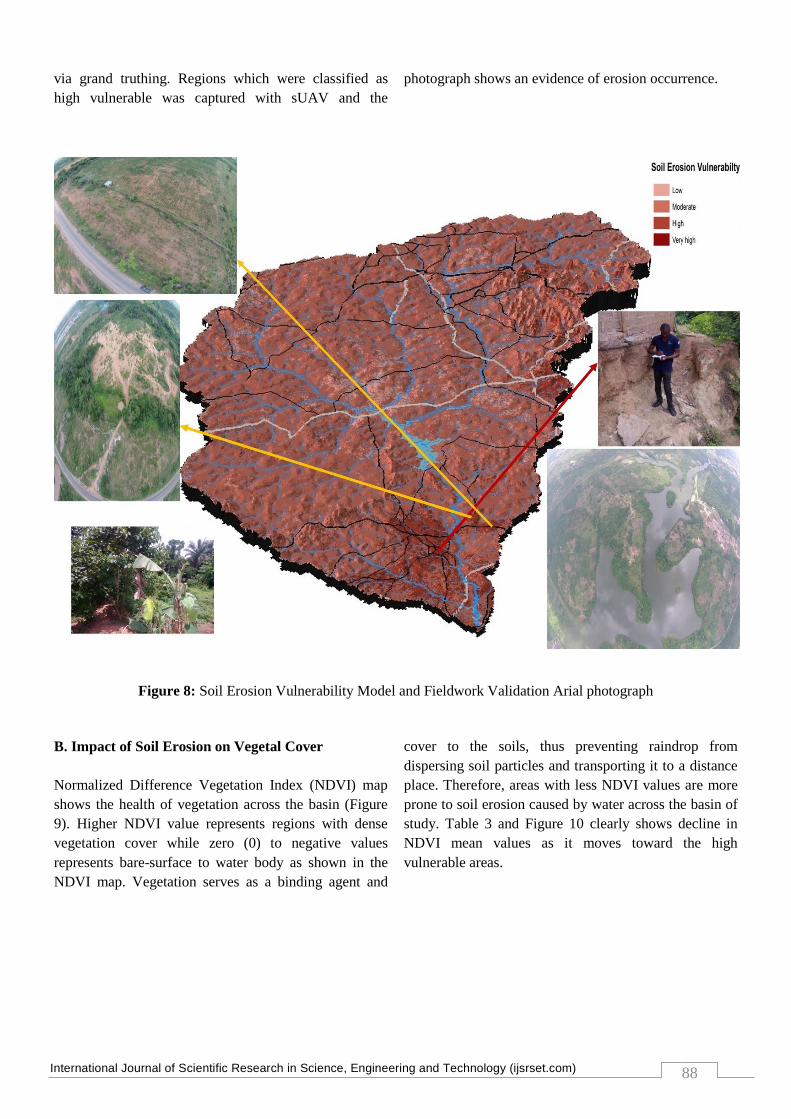
International Journal of Scientific Research in Science, Engineering and Technology (ijsrset.com)
88
via grand truthing. Regions which were classified as
high vulnerable was captured with sUAV and the
photograph shows an evidence of erosion occurrence.
Figure 8: Soil Erosion Vulnerability Model and Fieldwork Validation Arial photograph
B. Impact of Soil Erosion on Vegetal Cover
Normalized Difference Vegetation Index (NDVI) map
shows the health of vegetation across the basin (Figure
9). Higher NDVI value represents regions with dense
vegetation cover while zero (0) to negative values
represents bare-surface to water body as shown in the
NDVI map. Vegetation serves as a binding agent and
cover to the soils, thus preventing raindrop from
dispersing soil particles and transporting it to a distance
place. Therefore, areas with less NDVI values are more
prone to soil erosion caused by water across the basin of
study. Table 3 and Figure 10 clearly shows decline in
NDVI mean values as it moves toward the high
vulnerable areas.

International Journal of Scientific Research in Science, Engineering and Technology (ijsrset.com)
89
Figure 9 : Normalized Difference Vegetation Index Map
Table 3: Soil Erosion Vulnerability Class Across NDVI
Soil Erosion
Vulnerability
NDVI
Mean Value
Standard
Deviation
Low 0.185151 0.070922
Moderate 0.184999 0.042975
High 0.155168 0.04676
Very high 0.143945 0.030818
Figure 10 : Vegetation Change across Soil Erosion
Vulnerability Classes
IV.CONCLUSION
Application of geospatial techniques, remotely sensed
dataset and integrated analogue archived topographic
maps for mapping soil erosion potential areas in part of
Oshun-Ogun River Basins Nigeria has proven to be
efficient with high precision on a basin scale mapping.
The soil erosion vulnerability map shows that 86.38% is
moderate and 0.01% is highly susceptible to soil erosion
caused by water. The highly susceptible areas are found
within the built-up areas where natural vegetal cover has
been altered and/or totally cleared. Although, this high
vulnerable area is very low, awareness programs should
be carried out to those living within these vulnerable
areas in other to educate them on the precautional
measures to carry out incase of the soil erosion.
Considering the NDVI reflectance value plotted across
soil susceptibility to erosion, it was discovered that the
higher the NDVI values, the less the soil is susceptible
to erosion. Hence, there is a significant relationship
between vegetal cover to soil susceptibility for erosion
occurrence. Development of various agricultural
cropping system and soil conservation and management
0
0.05
0.1
0.15
0.2
NDVI Mean Value
Ref
lect
ance
val
ue
Soil Erosion Vulnerability

International Journal of Scientific Research in Science, Engineering and Technology (ijsrset.com)
90
practices should be carried out in various areas to further
cub the effects of soil erosion within the study area.
V. REFERENCES
[1] Angima SD, Stott DE, O’Neill MK, Ong CK,
Weesies GA (2003), Soil erosion prediction using
RUSLE for central Kenya highland conditions.
Agric Ecosyst Environ 97:295–308
[2] Banai R (1993), Fuzziness in geographic
information systems: contributions from the
analytic hierarchy process. Int J Geogr Inform
Syst 7(4):315–329
[3] Browning, K. A. (1990), Rain, rainclouds and
climate. Quarterly Journal of the Royal
Meteorological Society, 116(495), 1025-1051.
doi:10.1002/qj.49711649502]
[4] Christoffel den B., Rattan L., Keith W., Hari E.,
Vince B., and Paul R., (2004): The Global Impact
of Soil Erosion on Productivity II: Effects on Crop
Yields and Production Over Time. Advances in
Agronomy, Volume 81. DOI 10.1016/S0065-
2113(03)81002-7
[5] FAO (2000), Land and Water Constraints to
Sustainable Agriculture.
www.fao.org/waicent/faoinfo/agricult/agl/swl/wpr
/nigeria/e-bright.htm.
[6] FAO (2006), Guidelines for Soil Description.
FOOD AND AGRICULTURE ORGANIZATION
OF THE UNITED NATIONS Rome, 2006
[7] Fasinmirin, J.T., and Olorunfemi, I.E., (2014),
Soil Erodibility Estimation under Different Tillage
Systems Assessment in the Rain Forest Climate of
Osun State, Nigeria. International Journal of Plant
& Soil Science. Article no. IJPSS.2014.002; 3(1):
16-35,
[8] Fresco, L. 0.n (1993), The dynamics of cassava in
Africa: an outline of research issues. COSCA
Working Paper No. 9 Collaborative Study of
Cassava in Africa. IITA. Ibadan, Nigeria.
[9] Grove, A.T., (1956), "Soil Erosion in Nigeria". In
R.W. Steel and C.A. Fisher (eds.): Geographical
Essays on British Tropical Lands, Philip, pp. 77-
111.
[10] Ifabiyi I.P. A. (2004), Reduced Rank Model of
Drainage Basin Response to Runoff in Upper
Kaduna Catchment of Northern Nigeria.
Geostudies Forum. Pp 109-117.
[11] Igwe, C.A. (2012), Gully Erosion in Southeastern
Nigeria: Role of Soil Properties and
Environmental Factors. INTECH.
http://dx.doi.org/10.5772/51020
[12] Isikwue, M.O, Adakole, S.A., (2010), Effect of
Tillage and Soil cover on Soil Erosion in the
Lower Benue River Basin of Nigeria. Dept of
Agricultural and Environmental Engineering
University of Agriculture, Makurdi.
[13] Isikwue, M.O., Idike, F.I., Chukwuma, G.O.,
(2001), Seasonal Nutrient losses from River
Ukoghor Agricultural Watershed. Proc. Nigerian
Inst of AgricEngrs.; 23:229–234.
[14] Kelvin M, Siddique M, Julian S. (2012), Using
multi-criteria evaluation and GIS for flood risk
analysis in informal settlements of Cape Town:
The case of graveyard pond. South African
Journal of Geomatics.
[15] Matthew I., and Adegboyega, S., (2012),
Indigenous Aproach to Soil Erosion Control in the
Southwest Nigeria. FIG Working Week 2012
Knowing to manage the territory, protect the
environment, evaluate the cultural heritage Rome,
Italy 6 -10 May, 2012
[16] May, L., C.J. Place, O’Hea, B., Lee, M.J., Dillane,
M. & McGinnity, P. (2005), Modelling soil
erosion and transport in the Burrishoole catchment,
Newport, Co. Mayo, Ireland. Freshwater Forum
23, 139-154.
[17] Montgomery D.R. and Dietrich W. E, (1989),
“Source areas, drainage density, and channel
initiation,” Water Resources Research, vol. 25, no.
8, pp. 1907–1918.
[18] Nasim Yeganeh, Soheil Sabri. (2014), Flood
vulnerability assessment in Iskandar Malaysia
using multi-criteria evaluation and fuzzy logic.
Research Journal of Applied Sciences,
Engineering and Technology. ;8(16):1794-1806.
[19] Nyakatawa, E.Z., Reddy, K.C., Lemunyon, J.L.,
(2001), Predicting Soil Erosion in Conservation
Tillage Cotton Production System using the
Revised Universal Soil Loss Equation (RUSLE),
Soil and Tillage Research. 57:213–224.
[20] Ofomata G.E.K. (1985), Soil Erosion in Nigeria:
The View of a Geomorphologist. An Innagural
Lecture of the University of Nigeria, Nsukka.
International Journal of Scientific Research in Science, Engineering and Technology (ijsrset.com)
91
[21] Ogwo V., Ogbu K. N., Okoye C. J., Okechukwu
M. E. and Mbajiorgu C. C. (2012), Comparison of
Soil Erosion Models for Application in the Humid
Tropics. Hydrology for Disaster Management,
Special Publication of the Nigerian Association of
Hydrological Sciences.
[22] Oke, M.O., Martins, O., Idowu, O.A. and
Aiyelokun, O. (2015), Comparative Analysis of
Groundwater Recharge Estimation Value
Obtained Using Empirical Methods in Ogun and
Oshun River Basins. Ife Journal of Science. Vol.
17, No. 1.
[23] Oladeebo, J.O., and Adekilekun, S.K. (2013),
Land Use Intensity and Efficiency of Food Crops
Production in Osun State of Nigeria. Journal of
Natural Sciences Research ISSN 2224-3186
(Paper) ISSN 2225-0921 (www.iiste.org) Vol.3,
No.9, 2013
[24] Samson S.A., Eludoyin A.O., Ogbole A.T., Alaga
A.T., Oloko-Oba M., Okeke, U.H., Popoola O.S.,
(2016), Drainage Basin Morphometric Analysis
for Flood Potential Mapping in Owu Using
Geospatial Techniques. Journal of Geography,
Environment and Earth Science International 4(3):
1-8,
[25] Swades P., (2016), Identification of soil erosion
vulnerable areas in Chandrabhaga river basin: a
multi-criteria decision approach. Model. Earth
Syst. Environ. 2:5 DOI 10.1007/s40808-015-
0052-z
[26] Tomczak, M. (1998), Spatial interpolation and its
uncertainty using automated anisotropic inverse
distance weighting (IDW) - Cross-validation /
Jackknife approach, Journal of Geographic
Information and Decision Analysis 2(2): 18-30.
[27] Yu, Z. (2008), The Principle and Application of
Distributed Hydrological Model. Beijing: Science
Press. (in Chinese).


