Wps 3ja¶bPOLICY RESEARCH WORKING PAPER 2920
Social Polarization, Political Institutions,and Country Creditworthiness
Philip Keefer
Stephen Knack
The World BankDevelopment Research GroupInvestment Climate TeamandPublic Services TeamOctober 2002
Pub
lic D
iscl
osur
e A
utho
rized
Pub
lic D
iscl
osur
e A
utho
rized
Pub
lic D
iscl
osur
e A
utho
rized
Pub
lic D
iscl
osur
e A
utho
rized
Pub
lic D
iscl
osur
e A
utho
rized
Pub
lic D
iscl
osur
e A
utho
rized
Pub
lic D
iscl
osur
e A
utho
rized
Pub
lic D
iscl
osur
e A
utho
rized

I POLICY RESEARCH WORKING PAPER 2920
Abstract
The literature argues that the presence of multiple veto the net effect of multiple veto players is positive or
players (government decisionmakers) with polarized negative. Second, though, the authors go beyond the
interests increases the credibility of sovereign existing literature to argue that the net effect of multiple
commitments, but reduces the ability of governments to veto players depends on the nature of social polarization
adjust policies in the event of exogenous shocks that in a country. In particular, they argue that political
jeopardize their ability to honor their commitments. In competition is fundamentally different in countries
the case of sovereign lending, if the first effect prevails, exhibiting ethnic polarization than in countries polarized
countries would be regarded as more creditworthy; if the according to income or wealth. The evidence supports
second, less. the prediction that multiple veto players matter more
Keefer and Knack address two issues. First, using when countries are more ethnically polarized, but less
measures of country creditworthiness, they ask whether when income inequality is greater.
This paper-a joint product of the Investment Climate and Public Services Teams, Development Research Group-is part
of a larger effort in the group to understand the interaction of social polarization and institutions. Copies of the paper are
available free from the World Bank, 1818 H Street NW, Washington, DC 20433. Please contact Paulina Sintim-Aboagye,
room MC3-300, telephone 202-473-7656, fax 202-522-1155, email address [email protected]. Policy
Research Working Papers are also posted on the Web at http://econ.worldbank.org. The authors may be contacted at
[email protected] or [email protected]. October 2002. (35 pages)
The Policy Researcb Working Paper Series disseminates the findings of work in progress to encourage the exchange of ideas about
development issues. An objective of the series is to get the findings out quickly, even if the presentations are less than fully polished. The
papers carry the names of the authors and should be cited accordinigly. The findings, interpretations, and conclusions expressed in this
paper are entirely those of the authors. They do not necessarily represent the view of the World Bank, its Executive Directors, or the
countries they represent.
Produced by the Research Advisory Staff

Social Polarization, Political Institutions,
and Country Creditworthiness
Philip Keefer and Stephen Knack
World Bank, 1818 H St. NW, Washington DC 20433.E-mail: pkeefer(.worldbank.org, [email protected].
(Forthcoming in Collective Choice: Essays in Honor of Mancur Olson, Dennis Coatesand Jac Heckelman (eds.), Springer-Verlag)
The authors are grateful to Christopher Clague and Dennis Coates for helpful commentsand suggestions.

I

1. Introduction
A key issue in political economy and development is, under what conditions can
governments commit themselves credibly to policy promises and respond flexibly to
crisis? The answer to this question should depend on both institutional and societal
characteristics, but the literature generally treats these factors separately. One literature
has found that social polarization (in the form of income inequality, ethnic tensions or
other differences) undermines both the credibility of government promises and the ability
to respond to crisis. This research, however, abstracts from the role of political
institutions and treats all forms of social polarization identically. Another literature finds
that institutions, particularly the number of veto players in a country (or checks and
balances), are key to credibility, but pays less attention to social characteristics such as
polarization. In this paper we revisit these linkages.
We examine the creditworthiness of countries, a variable that is uniquely sensitive
to both the credibility and the ability of governments to respond promptly to shocks, to
illuminate three issues left open in the existing literature. First, it is difficult to draw
conclusions from the literature on the net effect of characteristics of countries that affect
both credibility and flexibility, but in opposite directions. This is particularly important
for institutions such as checks and balances, which have been found to increase the first
at the expense of the second. In a first approximation to this issue we find that checks and
balances have a weak positive effect on creditworthiness - that is, the positive credibility
effects outweigh the negative rigidity effects of multiple veto players.
Second, although many results on polarization depend on assumptions about
institutions, and vice versa, there has been no systematic investigation of how the effects
1
of one depend on the other. This paper examines the effects of social polarization under
different political conditions, including elections and checks and balances. We find that
the effects of polarization depend strongly on the competitiveness of elections and the
number of veto players.
Finally, Mancur Olson's work firmly establishes that the influence of special
interests depends in part on their ability to overcome problems of collective action. The
literature on polarization implicitly assumes that different forms of polarization (e.g.,
income, ethnic, or linguistic) have identical effects on society. We speculate, however,
that the effects of ethnic and linguistic social groupings are likely to differ from those of
income-based groupings. Olson (1982: ch. 6), for example, observed that successful
distributional coalitions are often based on encouragement of ethnic prejudice and
endogamy. In fact, we find that political institutions interact with these two dimensions of
social polarization in opposite ways. Namely, an increase in income or wealth inequality
makes it more likely that countries will default on their debt obligations, but this effect is
strongest when democratic institutions such as checks and balances or competitive
elections are most prevalent. However, although an increase in ethnic or linguistic
polarization also increases the probability of default, this effect is weakest when
democratic institutions are most prevalent.
2. The literature on polarization, institutions, credibility and delay
Creditworthiness is a function both of the credibility of governments - the
likelihood that they will honor their lending agreements - and of their flexibility - the
likelihood that, in response to negative fiscal shocks, they will adapt fiscal policy to new
exigencies and continue servicing their debt. Thus, creditworthiness captures two
2
qualities of government that have been the focus of substantial research. One literature
looks at the security of property and contractual rights, including the risk that government
will expropriate illiquid assets. Svensson (1998) argues that a conflict of interest between
two polarized parties that alternate in office will lead them to under-invest in a secure
legal environment. Easterly and Levine (1997) conclude that ethnic polarization
undermines economic growth, in part through adoption of less efficient economic policies
which presumably contribute to reduced creditworthiness.
Keefer and Knack (2002) appeal to social choice reasoning to argue that increased
polarization among decision makers can produce larger swings among different policies.
Polarization has the effect of expanding the set of alternative policies that decision
makers can propose to replace the current policy (e.g., the current policy to repay a loan
that the government has received). Their argument shows immediately the effects of
institutional assumptions. If multiple polarized groups vote, using majority rule,
increased polarization increases policy instability and makes current government
promises less credible. If multiple polarized groups each have veto power, then no
change in policy can occur unless all agree, and increased polarization has no effect on
policy instability.
North and Weingast (1989) specifically examine the effect of multiple veto
players on the credibility of loan agreements. They show that the risk that the English
Crown would not repay loans extended by Dutch lenders was significantly dampened by
the presence of multiple veto players - the checks and balances introduced by a newly
powerful parliament following the Glorious Revolution. They do not ask what happens
when polarization of preferences increases. Keefer and Stasavage (2000) do consider the
3
interaction of polarization and the number of veto players, but in a specific application,
the credibility of monetary policy.
Another literature has analyzed why governments sometimes respond with
significant delay to crisis. Alesina and Drazen (1991) assume that polarized decision
makers also exercise veto power over government decision making. They find that
polarized interests who are each unsure about the costs delay imposes on the others have
an incentive to delay reform even when doing so leaves everyone worse off. Rodrik
(1999) argues that countries recover faster from inflation shocks if they have "consensus-
building" institutions. However, rather than model such institutions politically - the
extent of elections, checks and balances, etc. - he uses the security of property rights and
similar variables to proxy for consensus-building institutions.
Creditworthiness is also affected by the sheer volume of country borrowing.
Holding constant moral hazard problems and the likely response of countries to fiscal
crisis, countries that have a higher demand for loans, and therefore more debt, are likely
to be less creditworthy. Alesina and Gatti (1995) and Berg and Sachs (1988) both link
polarization to the magnitude of government spending and, by implication, to
indebtedness. Alesina and Gatti (1995) assume, like Svensson (1998), that there are no
checks and balances, but rather two political parties that alternate in power. They show
that if these parties have polarized preferences over government spending, they are likely
to raise spending (or incur debts) in order to reduce the fiscal discretion of their
successors. l Berg and Sachs (1988), on the other hand, argue that in more unequal
1 McGuire and Olson (1996) show formally that the mere presence of instability, independent of preferencedifferences over government spending, encourages governments to take actions in the present with highfuture costs.
4
societies, in which the rich control both economic and political life, pressures for
redistribution are likely to lead to higher borrowing and therefore higher interest rates.2
These different contributions imply that polarization should have little or no effect
on government response to crisis if polarized groups are not also veto players (Svensson
1998, Keefer and Knack 2002, Alesina and Drazen 1991) - in fact, Alesina and Drazen
specifically point to cases where the unified control of government by a singie partisan
interest led to a quick resolution of crisis. Assuming polarization, the literature suggests
that multiple veto players will increase credibility (North and Weingast 1989, Keefer and
Stasavage 2000), but provides arguments both in favor and against the proposition that
they will reduce flexibility. While multiple veto players are a necessary condition for a
delayed response to crisis in Alesina and Drazen (1991), multiple veto players may be
precisely the sort of "consensus-building" institution that yields the faster response to
crisis in polarized countries that Rodrik (1999) predicts. In any case, the literature
provides no prediction as to which effect -- credibility or delay -- will dominate. Finally,
all of these studies treat polarized groups as being identical in their internal
characteristics. The next section asks how predictions about the effects of social
polarization should be modified if the internal characteristics of the polarized groups are
heterogeneous.
2 In their argument, it is not clear why the rich, politically powerful by assumption, would accede to moreredistribution in the first place, and why redistributive pressures, per se, would lead to larger debt.However, in a recent paper, Acemoglu and Robinson (2001) argue that the threat of insurrection leads therich elite to democratize (expand the franchise), leading to more political pressures to redistribute. In moreunequal countries, larger amounts of redistribution are triggered by democratization, giving elites a largerincentive to stage counter-coups. Evidence in support of the theory is mixed: they point effectively to anumber of country case studies, but cross-country evidence reveals little association between eitherredistribution and inequality or between inequality and political violence.
5
3. The effects of polarization when polarized groups are heterogeneous
A substantial literature points to the importance throughout history and across
many cultures of intra-ethnic social and economic exchange, ranging from marriage to
trade. Intra-ethnic exchange may be driven by cultural mores and the prejudices of or
about other ethnic groups, but it is also catalyzed by the greater possibilities of credible
contracting within an ethnic group (Landa 1981, Greif 1989). Not all ethnic groups in all
places and times exhibit dense patterns of social and economic exchange. The point is
only that they are more frequent features of ethnic or linguistic groups than of income
groups (although social exchange is often restricted across classes).
A dense pattern of exchange is likely to support the credibility of intra-group
promises. For example, as Greif (1989) demonstrates, the threat of future exclusion from
these exchanges is a powerful device for the deterrence of reneging. Ethnic groups,
relative to income-based groups, are therefore more likely to overcome obstacles to
collective action since, as Olson (1965) first pointed out, groups that cannot enforce
contribution commitments by all members to the cause of the group are unlikely to be
effective special interests. To the extent that intra-ethnic group ties are stronger than
intra-income group ties, we would therefore expect ethnolinguistic groups to be more
successful "special interests". Therefore, we would expect an increase in ethnolinguistic
polarization to most reduce creditworthiness in those institutional environments that are
most permeable to special interests rather than the interests of the "median voter": where
elections are non-competitive, and where checks and balances are absent that might
otherwise serve to pit competing special interests against each other.
6
If intra-group promises are significantly more credible than inter-group promises
across ethnic groups, but not across income groups, then there are also important
implications for the strategies of politicians. In particular, promises made to a particular
ethnic group by competing candidates from that ethnic group are more credible than
promises made by those candidates to other ethnic groups. The consequences of reneging
on those promises include restricted access to the wide range of interactions that
characterize membership in the ethnic group. Within income groups, in contrast, this
threat is less severe and the credibility of promises of politicians from any one income
group is likely to be similar across interest groups.
Where candidate promises are credible, and there are no information or other
problems, candidates converge on the median voter's preferred outcome. Although the
median voter has no particular reason to prefer high levels of spending that fund current
consumption at the expense of future consumption, this restraint disappears if candidate
promises are only credible to part of the electorate. In that case, Keefer (2002) argues that
candidates will tilt their promises in favor of the group to which credible promises can be
made, at the expense of the remainder of society. Since all of society bears the costs of
low creditworthiness, but the ethnic group gets all of the benefits of increased spending,
the median ethnic group "voter" will prefer high spending, and creditworthiness drops.
This effect should be greatest, however, when:
* only one ethnic group is represented in government - when there are no checks
and balances;
* voters from other ethnic groups have the least influence on selecting government
officials - reducing the penalty that members of non-favored ethnic groups can
7
impose on leaders from other ethnic groups who drive down country
creditworthiness.
Perhaps most importantly, when institutions themselves provide a basis for credible
promises by politicians across all ethnic groups, the incentive for differential treatment of
ethnic groups dissipates. This is most likely to happen when institutions such as multiple
checks and balances are in place, which increase the credibility of all government
decisions, reducing the commitment advantage that some government decision makers or
candidates have because of personal ties to some voters or groups of voters.
When politicians emerge from different income groups, a different dynamic is at
work. In this case, the ability of politicians to make credible promises to specific
constituencies, such as the poor or the rich, depends much more on the institutional
environment. When it does not support credible promises, politicians gain nothing by
pitting the rich against the poor, since the poor do not believe the politicians will help
them, once in office. However, as elections grow more competitive and checks and
balances provide greater assurances about the credibility of government decisions, the
incentives to seek out and develop such constituencies grows. It is in these circumstances,
then, that we expect income and wealth-based polarization to matter most.3
There is substantial, though non-systematic evidence that parties organized
around "class" or income are not common in developing countries. Haggard and
Kaufman (1992), in an examination of many episodes of high inflation in a number of
countries, found very little evidence that parties and political conflict were organized by
income groups. Inflation in most cases was driven by governments that spent excessively
3 Similarly, income polarization slows growth most in democracies in the model of Persson and Tabellini(1994), but for a different reason: in democracies (but not in non-democracies) policymakers act to satisfy
8
on infrastructure and development; independent groups representing the interests of the
poor, whether political parties or not, were weak prior to the shifts in spending strategy.
Only in a few of the countries that they studied, Argentina, Chile and Brazil, were there
well-organized "worker" parties.
4. Summarizing the testable predictions
Taken altogether, the foregoing arguments yield a dense but clear-cut set of
predictions.
* Given multiple veto players, social polarization should reduce the ability of countries
to respond to shocks (Alesina and Drazen), and therefore reduce creditworthiness.
* Provided there is some polarization of veto players, checks and balances should
increase the credibility of agreements to repay loans and therefore'increase
creditworthiness (from North and Weingast).
* The effects of income-based polarization should be greater and the effects of ethno-
linguistic polarization smaller when political promises are more credible - when
there are more checks and balances, and more competitive'elections.
Some of these hypotheses have already received empirical attention. With respect to veto
player type arguments, most evidence has focused on political "fragmentation", defined
in various ways. Haggard and Kaufman (1992) and Veiga (2000) present evidence that
countries with more fragmented political systems are less likely to embrace stabilization
programs after plunging into a period of high inflation. Haggard and Kaufman, in their
case studies, find however that fragmentation affects country responses to hyperinflation,
but not to other high but non-hyperinflationary episodes. These experimental settings
the median-income voter.
9
allow the authors to evaluate the combined effect of polarization and checks and balances
on responsiveness to crises, but do not allow them to disentangle the two effects nor to
examine their influence on government credibility.
Haggard and Kaufmann do not directly take the number of veto players in a
government into account in their analysis, although they do consider polarization,
elections and the policy orientation of the ruling government. Their "polarization"
variable comes closest to the hypotheses above, but does not take into account the
number of veto players. On a three point scale, a one is assigned to countries with
exclusive one party systems; a two to systems with inclusive or corporatist one-party
systems or two-party systems with broad catch-all parties; and a three to polarized or
fragmented party systems. They do not consider whether or not these parties control veto
gates.
Alesina and Drazen or Rodrik type arguments are more plausible when applied to
broad social polarization than to the polarization of elites. Alesina and Drazen rely on
assumptions about information asymmetry that are easier to justify in reference to broad
groups; similarly, Rodrik relies on assumptions about the enforceability of inter-group
agreements that are less plausible when the agreements are between different segments of
the elite. Their arguments are best tested with information both about political or partisan
polarization (the polarization of political parties), and about social polarization. Haggard
and Kaufman seem to rate as "most" polarized those countries in which both parties and
society at large are polarized, where social polarization seems to be captured by the
existence of organized groups in society that seem to be in conflict with each other. In
this sense, their definition of polarization is partially driven by the contentiousness of the
10

policy debate, so that causality is clouded. In the empirical work below, we use only a
priori definitions of polarization (ethno-linguistic or income cleavages), as well as taking
explicit account of the number of institutional veto players.
Veiga pays more attention to the number of veto players and their partisan
affiliations, encapsulated in his "fragmentation" variable, also trichotomous, like Haggard
and Kaufman's "polarization" measure. Fragmentation is "one" if there are no parties or
an exclusive one party system; a two if there is a one-party majority parliamentary
govermnent, or a presidential government with one-party control of the legislature and
presidency; and "greater than two" for other systems. While useful, this variable groups
quite disparate countries into similar categories. For example, legislatures in presidential
systems may act with greater independence, even when the president's party controls
them, than parliaments with a one party majority. This is the case if one compares the US
with Great Britain, for example. The category "greater than two" embraces a large
number of disparate systems, ranging from divided presidential government to highly
fractionalized government coalitions in parliamentary systems. Again, we might expect
differences among these. The empirical work below uses a more fine-grained measure of
veto players, which also takes into account partisan control of the veto gates; we also take
social polarization explicitly into account.
Berg and Sachs (1988), Rodrik (1999) and Quinn and Woolley (2001) are all
concerned with the effect of social polarization, and the latter two papers with the
interactive effects of institutions and social polarization. Berg and Sachs (1988) look at
35 countries for which there was information on sovereign debt discount rates. Unlike
later researchers, their focus is not institutional and they do not consider the differential

effects of inequality under different institutional arrangements. They find that countries
with greater income inequality have a higher likelihood of rescheduling debt, and a
higher rate of discount on the debt. We are able to replicate their results, but for a larger
sample of countries, since our creditworthiness ratings are more widely available. Apart
from considering the institutional dimension, we also use a larger set of polarization
variables, representing not only inequality in income but landholding and also ethnic
fractionalization.
Rodrik (1999) and Quinn and Woolley (2001) are concerned with broader
economic outcomes, growth before and after the oil crisis in the case of Rodrik and the
volatility of economic growth in the case of Quinn and Woolley (2001). Their work
examines indirectly the hypotheses that structure this paper. Rodrik (1999) finds that the
impact of trade shocks on economic performance is worse in the presence of ethnic
fractionalization or income inequality and in the absence of democracy. This supports his
contention that social conflict constitutes a barrier to adapting policy to external shocks
unless there are institutions that moderate conflict and make agreements between
contending groups more credible. This result potentially contradicts the conclusions of
Alesina and Drazen, however, since democracies are characterized in part by their
multiplicity of veto players, which (given social polarization) should delay rather than
accelerate a country's response to growth. Quinn and Woolley (2001) find different
results, however. Democracy (captured, as in Rodrik 1999, by Freedom House indices of
political freedoms and civil liberties) makes economic growth less volatile. Ethnic
fractionalization has neither a direct effect on volatility, nor does it influence the effect of
democracy. Their results thus fail to support either model of bargaining, reform and
12
delay. Unlike Rodrik, they permit democracy and ethnic fractionalization to enter
independently, as well as in a multiplicative term, making theirs a more reliable test.
Persson and Tabellini (1994) examine the effect of income inequality on growth,
conditional on regime type. Building on median voter models of income taxation and
redistribution (e.g., Meltzer and Richard 1981), they argue that inequality should slow
growth more in countries where median voters are more decisive, i.e. in democracies.
Persson and Tabellini present cross-country evidence finding that a significant and
negative relationship between inequality and growth exists only in their sub-sample of
democracies, and not in the non-democracies. Knack and Keefer (1997) show, however,
that these results are an artifact of measurement error in the inequality data and regime
type classifications used by Persson and Tabellini. Using more standard data sources on
inequality and regime type, the link between inequality and growth is equally strong in
democracies and non-democracies. Creditworthiness is more directly linked than
economic growth to the decisions of government. Its use in the work below therefore
provides a more direct test of the different hypotheses surrounding the influence of
institutions and polarization on government credibility and response to crisis. In addition,
we use institutional variables that allow a more fine-grained examination of how
institutions mediate social polarization and growth, and we address a broader range of
institutional conditions that might influence creditworthiness.
5. Data
Our measure of the creditworthiness of nations is based on a survey of leading
international banks conducted every six months by Institutional Investor. Bankers are not
permitted to rate their home countries. The sample ranges from 75 to 100 banks, with
13

responses weighted to give more importance to the views of banks with greater
worldwide exposure and more sophisticated country-analysis systems. It is scored on a 0-
100 basis, with 0 representing the greatest chance of defaulting on the sovereign debt, and
100 assigned to countries with the lowest risk of default. The mean value among the 106
countries included in our empirical analyses is 38.8, with a standard deviation of 25.7.
Ratings exceed 60 for most of the OECD countries, with Japan, Switzerland, Germany
and the US the only nations above 90. The bottom of the distribution is dominated by
conflict-ridden African and Latin America nations such as Sudan, Sierra Leone, Liberia,
Zaire, Haiti and Nicaragua, all scoring below 10. (Data Appendix II lists ratings from
lowest to highest for all countries included in empirical tests.)
The accuracy of this creditworthiness index is supported by two statistical
analyses. A study of 78 Euromarket loans for 34 countries found that the interest rate
spread was strongly and inversely correlated with the creditworthiness ratings,
controlling for maturity and length of the grace period (Feder and Ross 1982). A GAO
study (1994) found that the creditworthiness index was similarly strongly related to the
discount on 38 sovereign debt instruments, owed by 21 countries, traded on secondary
markets.
In contrast to the limited number of countries for which data are available on
interest rate spreads, or on discounts on debt traded in secondary markets, the
Institutional Investor index is available for about 130 countries. Use of this subjective
index is preferable to objective indicators on other grounds. Interest spreads are only a
rough reflection of risk, as low interest rate spreads may be offset by high fees or special
tax concessions, which are difficult to measure. Data are available for a large sample of
14

countries on the debt-service ratio (interest plus repayment obligations relative to export
revenue), or the stock of external debt relative to GDP. However, the debt-service ratio is
a misleading gauge of creditworthiness, and is not a significant predictor of debt
rescheduling (Rahnama-Moghadain and Samavati 1991). Using the stock of debt as our
dependent variable would require attempting to control for various factors that might
affect a country's ability to repay a large debt. The subjective index we use instead
implicitly adjusts for these factors already--and probably far more effectively than we
could using statistical controls.
We use the mean value of the creditworthiness measure over the 1986-95 period.
Using data over the ten-year period ensures that values are not unduly influenced by
business cycle effects or by short-term fluctuations in the prices of petroleum or other key
imported or exported commodities. We control for the log of initial (1985) per capita
income and for growth in per capita income from 1980-85, just prior to the period of
analysis, as higher values of these may improve the ability of governments to finance
their debts. Since larger economies tend to be more diverse, and less subject to terms of
trade or other shocks that can suddenly worsen a government's fiscal position, we also
control for the ratio of a country's aggregate GDP to US GDP. Finally, we control for
shifts in the net barter terms of trade, which represent exogenous changes in a country's
ability to pay back debt denominated in foreign currencies. The terms of trade shift is
constructed as the ratio of the 1986-95 average value, to the 1980-85 average value, of
the ratio of the export price index to the corresponding import price index. Improvements
in the terms of trade over the period for which our dependent variable is measured,
15
relative to the preceding period, are reflected by values exceeding unity.4 Since it is
precisely through their policy decisions about fiscal and monetary policy that countries
influence their creditworthiness, we do not attempt to control for endogenous variables
such as inflation or deficit spending.
We assess the impact of three kinds of polarization and three variables that
describe the political environment. With respect to polarization, we use a measure of
income inequality, inequality in land ownership, and ethno-linguistic polarization.
Although these measures have been used in other contexts in the literature, only Keefer
and Knack (2002) justify their usage in view of the theoretical literature on polarization.
We briefly review that discussion here, especially to explain our use of the ethnic
fractionalization data.
Esteban and Ray (1994: p. 824) point out that commonly used measures of
polarization may not, in fact, capture polarization in society - they may do just the
opposite. They argue that groups in society are polarized with respect to any set of
attributes when they exhibit the following three characteristics: the members of each
group are homogeneous with respect to the set of attributes; different groups are
heterogeneous with respect to these attributes; and the groups are relatively uniform in
size. Esteban and Ray conclude that polarization is greatest when society is divided into
two similarly sized groups, each internally homogeneous but significantly different from
the others on all possible attributes.
As they observe, most measures of income inequality and ethnic fractionalization
do not correspond to these definitions of polarization. Theoretically appropriate measures
4 In most cases, these shifts are unlikely to be unanticipated. To the extent they are anticipated, therelationship of shifts to creditworthiness may weaken as countries expecting improvements (deteriorations)
16
of income-based polarization should be sensitive to the degree of clustering of the
population, which inequality measures derived from the Lorenz curve are not. Similarly,
societies that are completely ethnically fractionalized could be regarded as completely
non-polarized by their definition.
In Keefer and Knack (2002), we justify the use of Gini measures of inequality by
showing that theoretical objections may not be empirically important. Using data
available from a few countries that includes the percentage of the population at each
income level, one could construct a theoretically robust measure of income polarization
that turns out to be strongly correlated with the Gini coefficient calculated from the same
data.
It turns out to be a simpler matter to transform measures of ethno-linguistic
fractionalization into a theoretically adequate measure of ethnic polarization. We use
Sullivan's (1991) measure of the fraction of the population belonging to the largest
ethnic, linguistic or religious group (whichever cleavage is judged by Sullivan to be most
salient in a society).5 As Keefer and Knack (2002) argue, following Horowitz (1985),
polarization ought to be lowest when this fraction is either smallest (reflecting many very
small groups) or highest (reflecting only one group). To capture this non-linearity, we
include a quadratic ethnic fractionalization term in the first sets of regressions below.
The quality of income inequality data is a second concern. As in Keefer and
Knack (2002), we use the income inequality data compiled by Deininger and Squire
may borrow more (less) in the current period.5 An index of "etno-linguistic fractionalization" reported in Taylor and Hudson (1983), has been widelyused in the economics and political science literature. The Sullivan measure has substantially greatercountry coverage, as the fractionalization index is not reported for many African and other countries whichwere not yet independent when the variable was constructed in about 1960. The homogeneity variable andthe fractionalization index are correlated at -.60.
17

(1996). This dataset has greater coverage over time and across countries than any
previous compilation. In addition, and more importantly, they identify a "high quality"
subset of observations. Deininger and Squire conclude that many observations in
previous compilations fail to meet the minimum standards of quality required for
inclusion in their dataset. Because our empirical tests examine inequality's impact on
creditworthiness over the 1986-95 period, we chose inequality observations as close to
1985 as possible. 6 The mean year for observations is 1985, with a standard deviation of
4.8 years.
Societies can also be polarized according to holdings of assets. Land inequality is
the only measure of asset inequality with broad country coverage. Gini coefficients for
land inequality circa 1960 and 1970 are available from Taylor and Jodice (1983); Muller
and Seligson (1987) include some additional values for circa 1970. Jazairy et al. (1992)
report observations for more recent years for many countries. All of the land inequality
observations are based on official agricultural censuses undertaken by the UN Food and
Agriculture Organization, although they have not been subjected to the level of scrutiny
Deininger and Squire (1996) have applied to income inequality data.
Finally, we use two political variables from the Database of Political Institutions
(Beck et al. 2001). The number of veto players is captured by the variable Checks, which
counts as veto players the president and each legislative chamber in a presidential system.
The variable is incremented by one unless the president's party has a majority in the
lower house and there is a closed list system (by which legislative candidates must be
6 Where no measure was available for 1985, a decision rule was consistently applied for selecting betweenavailable observations. This rule treated the possibility of reverse causation introduced from selecting lateryears as a more serious problem than increased measurement error resulting from the selection of earlieryears. Specifically, the rule was to choose the year satisfying the function: min [2(year - 1985); 1985 -
18
selected by party leaders) that weakens legislator autonomy from the president. In
parliamentary systems, the prime minister and each coalition party that is not his or her
own count as veto players. If there is no closed list electoral rule, the prime minister's
party counts as a veto player, and Checks is incremented by one. Checks is set to one
automatically in any country in which presidential elections are not competitive, on the
presumption that formal institutional checks and balances are unlikely to operate in
practice. We use the mean value for each country over the 1986-95 period.
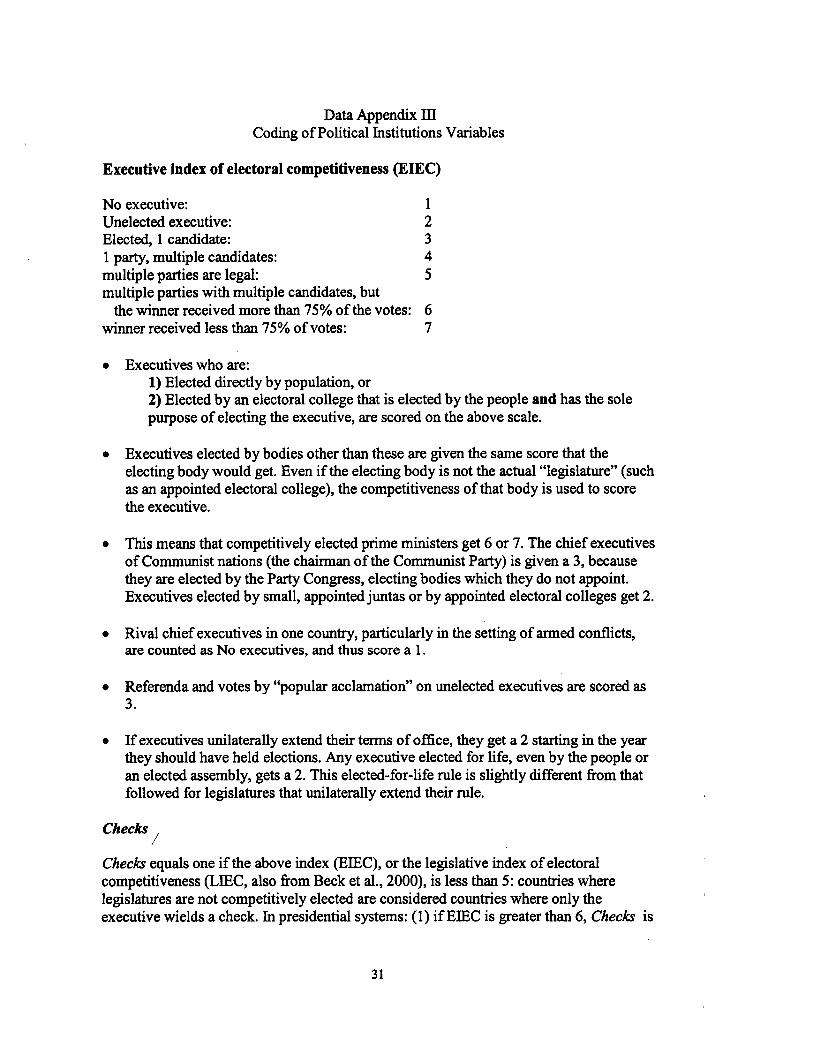
Our second political variable, the competitiveness of executive elections, is based
on another variable from the Database on Political Institutions which is coded from one
to seven. Where there is no functioning executive, countries are coded 1. Where
executives are unelected, they are coded 2. Where elections are not open to multiple
candidates or parties, countries are coded in the 3-5 range (See Data Appendix HI for
details.) Countries in which multiple parties can and do compete and present candidates,
but the winning candidate receives more than 75 percent of the vote are coded 6; a 7 is
assigned if the winner receives less than 75 percent of the vote.
We create a dichotomous variable from this scale, with countries in which
multiple candidates from multiple parties compete classified as having competitive
elections and all other countries classified as non-competitive. Specifically, countries
assigned to either the 6 or 7 category for the majority of years during the 1986-95 period
were classified as competitive and all others as non-competitive.
6. Results
The regressions in Table 1 address whether social polarization reduces
creditworthiness, abstracting from political institutions. The first three regressions
year]. Ties were resolved in favor of selecting the earlier year (for example, 1983 over 1986).
19

examine income polarization (income inequality). All show that income inequality
increases the likelihood of default on debt. In the first equation, the coefficient on income
inequality suggests that each two point increase in Gini is associated with a 1.2 point
decline in the creditworthiness index. Each standard deviation increase in income
inequality (i.e. an increase of 9.5 in Gini) reduces creditworthiness by more than one-fifth
of a standard deviation (beta = .2), or 5 points. This effect is comparable to that of
income growth, and exceeds the effects of higher aggregate income (beta = .12) or
improvements in the terms of trade (beta = .15).7
Equation 2 differs from equation 1 by weighting observations by aggregate GDP,
instead of weighting all observations equally. The relationship between inequality and
creditworthiness is even stronger in this test than in equation 1, indicating that the strong
effect of inequality is not driven merely by a few very small countries.8 Equation 3
differs from equation 1 by using median regression analysis rather than OLS. In median
regression (see Gould and Rogers 1994), observations lying far from the regression line
are weighted less heavily than in OLS. The inequality coefficient is nearly identical to
that in equation 1, indicating that the relationship is not produced by a small number of
extreme cases.
Equations 4-7 report results using the alternative measures of polarization or
specifications. The results for land inequality, in equation 4, exhibit the right sign (more
7 In all regressions, the four control variables are positively and significantly related to creditworthiness.Income per capita is the strongest of the four: each standard deviation increase is associated with anincrease of more than three-fiftis of a standard deviation in creditworthiness in equation 1. Each 4percentage-point increase in aggregate GDP (as a percentage of U.S. GDP) is associated with a 1-pointincrease in the creditworthiness index. Each I percentage-point increase in annual per capita incomegrowth is associated with a 2-point increase in the index. Each 7 percentage-point improvement in thetermns of trade (e.g. from I to 1.07) is associated with a rise of 1.4 points in creditworthiness.
20

land inequality undermines creditworthiness), but the coefficient is not significant at
conventional levels. However, controlling for income inequality, in equation 5, both land
and income inequality are shown to have a significant negative effect on
creditworthiness. Each one-unit increase in the Gini for land inequality reduces
creditworthiness by one-fifth of one point.
Ethnic homogeneity is entered in equation 6 in quadratic form, to better capture
the theoretical relationship between ethnic homogeneity and ethnic polarization, as
discussed above. Consistent with that discussion, both ethnic homogeneity and its square
are significant at the .01 level. Creditworthiness declines as the percent belonging to the
largest group increases, up to about 70 percent, and increases thereafter.
Equation 7 examines all of the polarization measures jointly.9 Income and land
inequality both remain strongly significant. Coefficients on homogeneity and its square
decline somewhat relative to equation 5, and are not statistically significant in this
smaller sample.
Tables 2 and 3 add the two political variables, and their interactions with each of
the three polarization variables. To avoid interacting a variable with another that is
already interacted with itself, we replace the quadratic form of ethnic homogeneity in
these tables with a simple transformation: the deviation in absolute value from 70
percent. This value is chosen based on the results of equation 5 in Table 1, which indicate
8 The aggregate GDP of the U.S. is 20,000 times that of Seychelles. The logic for treating each countryequally is that they each represent a single natural experiment in economic policy making.9 Low correlations among income inequality, land inequality, and ethnic homogeneity suggest thatsocieties are in general polarized in different ways across different dimensions. Income and land inequalityare correlated at only .09 among the 64 nations in our sample with data available on both variables. Ethnichomogeneity is correlated with income and land inequality, respectively, at only -.25 (N = 75) and .03 (N =84). Quadratic associations between inequality and homogeneity are even weaker: homogeneity andhomogeneity squared explain only 7% of the variation in income inequality, and 0.1% of the variation in
21
that creditworthiness is minimized when 70 percent of the population belongs to one
ethnic or linguistic group.1I Because larger deviations from 70% are associated with
higher creditworthiness, we will call this variable "ethnic harmony."
Table 2 tests the hypotheses that social polarization reduces creditworthiness, that
checks and balances increases it, and that the effects of each are dependent upon the
other. The coefficient estimates on Checks (the number of veto players) indicate that the
number of veto players has a positive effect on creditworthiness. In the larger samples
(equations 3 and 5), this effect is marginally significant, with each extra veto player
associated with an improvement of about 2 points in the 100-point creditworthiness
index. That is, the credibility effects of checks and balances appear to outweigh the
responsiveness effects in the assessments of creditworthiness.
The effects of social polarization depend significantly on the number of veto
players. Equation 2 of Table 2 shows that the negative effects of income inequality are
significantly greater when there are more checks and balances. 11 The coefficient of the
interaction between land inequality and Checks is also negative in equation 4, but not
significant. Equation 6, which looks at ethnic polarization and its interaction with
Checks, demonstrates the contrary result: ethnic harmony improves creditworthiness most
when there are fewer veto players, and this beneficial effect diminishes significantly as
the number of veto players increases. This is the first piece of evidence for the final
hypothesis, that the nature of polarized groups influences their effects on policy.
land inequality.10 This value is also very close to the sample mean of 68.5%.11 The interaction terms in equations 2 and 4 are constructed as the deviation of the inequality variablesfrom their sample means, multiplied by the deviation of checks from its mean value of 3.
22
Table 3 pursues this theme, adding the competitiveness of executive elections and
interacting it with the social polarization variables. Electoral competitiveness is
negatively but (generally) not significantly associated with creditworthiness. We would
expect that more organized groups would have a greater effect on policy when voters are
least "empowered", as when elections are non-competitive. If ethnic groups are more
organized than income groups, we would expect the effects of ethnic harnony on
creditworthiness to be greatest when elections are least competitive. In contrast, the
distribution of income should affect creditworthiness more when elections are more
competitive. Equations 2, 4 and 6 provide evidence that this is the case. In equations 2
and 4, the interaction of land or income inequality with electoral competitiveness is
negative and significant, indicating that inequality has a stronger negative effect on
creditworthiness when elections are more competitive. 12 However, the negative
coefficient on the ethnic harmony interaction in equation 6 signifies the opposite: more
ethnic harmony (larger deviations from 70% belonging to the largest group) is less
beneficial to creditworthiness - or, ethnic strife is less damaging -- when elections are
more competitive. This interaction term is significant only at the .12 level, however, for a
two-tailed test.
Table 4 provides a summary of the effect of changes in the social polarization
variables, conditional on different levels of Checks and electoral competitiveness. The
pattern of asterisks underlines the stark differences between ethnic polarization and
income inequality. The impact of ethnic polarization is greatest (i.e. ethnic harmony is
most beneficial, or ethnic divisions most damaging) at low levels of both Checks and
12 The interaction terms in equations 2 and 4 are constructed as the deviation of inequality from theirsample means, multiplied by the electoral competitiveness dummy.
23

electoral competitiveness. It is not significant where elections are competitive or where
there are four or more checks. In contrast, inequality is most damaging at high levels of
both Checks and electoral competitiveness. Both land and income inequality are
significant only where elections are competitive. Income inequality is significant except
where there are no checks on the executive (i.e. Checks equals one). Land inequality is
significant only where checks is less than three.
7. Summary
Our finding that social polarization is associated with reduced creditworthiness is
consistent with the Alesina and Drazen (1991) model of delayed stabilizations. Our
results, using a different dependent variable, corroborate those of Berg and Sachs (1988),
who found inequality was associated with a greater likelihood of defaulting on debt, and
a higher discount on debt in secondary markets. We find that on average, more veto
players are associated with improved creditworthiness, consistent with the analysis by
North and Weingast (1992) of English sovereign borrowing in the 17th and 18th centuries.
This result is somewhat contradictory to those of Veiga (2000) and Haggard and
Kaufman (1992), who find that fragmented political systems slow responses to inflation
crises; however, our dependent variable reflects both credibility and responsiveness to
crisis. Our results also show that the effects of social polarization and institutions are
highly inter-dependent, providing a unifying basis for assessing the implications of these
different strands of the literature.
Finally, results of our interaction tests are consistent with our claim that Olson's
insights regarding the importance of the internal organization of groups are important to
consider in evaluating the effects of social polarization. Where elections are not
24
competitive and there are few checks on executive power, a candidate's promises will be
less credible to members of other ethnic groups, and the candidate will have an incentive
to promise higher spending that benefits his or her own group. Accordingly, ethnic
divisions undermine (or, ethnic harmony enhances) creditworthiness more where checks
are few and elections are less competitive. In contrast to the high social and economic
costs of reneging on promises to one's own ethnic group, the costs to reneging on
promises made to income groups appear to be relatively low. Those promises will be
more credible when competitive elections and checks and balances increase the
predictability of government decision making. Accordingly, inequality undermines
creditworthiness more where checks are more prevalent and elections are competitive.
25

Table 1
Polarization and Creditworthiness
Equation 1 2 3 4 5 6 7
Method OLS WLS Median OLS OLS OLS OLS
Constant -81.25 -88.36 -90.18 -119.44 -82.82 -107.09 -82.55(14.20) (11.39) (21.91) (12.42) (13.31) (11.86) (14.64)
GDP per capita 16.52** 19.00** 17.30** 19.18** 18.17** 19.22** 19.62**1985 (1.43) (1.00) (2.12) (1.36) (1.43) (1.36) (1.47)
Growth 1980- 2.04** 1.47# 2.08** 1.48** 1.56** 1.77** 1.83**85 (0.64) (0.75) (0.72) (0.52) (0.57) (0.46) (0.60)
Aggregate 0.24** 0.09** 0.26# 0.29* 0.26** 0.29* 0.24**GDP 1985 (0.09) (0.02) (0.15) (0.12) (0.09) (0.12) (0.09)
Terms of trade 13.68** 17.73** 15.91** 12.86* 11.06* 15.12** 14.34*shift (4.40) (3.78) (6.21) (5.90) (4.90) (5.51) (5.63)
Gini: income -0.60** -0.94** -0.59** -0.54** 0.49**Inequality (0.16) (0.16) (0.21) (0.16) (0.16
Gini: land -0.12 -0.20** -0.18*inequality (0.08) (0.07) (0.07)
Ethnic -0.70** -0.52homogeneity (0.23) (0.33)
Ethnic .005** .003homog.2 (.002) (.002)
N 76 76 76 84 64 105 64
R 2/PseudoR 2 .83 .94 .60 .80 .87 .79 .87
S.E. of est. 11.0 6.3 -- 12.3 10.2 12.0 10.0
Mean, D.V. 42.4 72.2 42.4 41.2 44.0 39.0 44.0
Dependent variable = International Investor Index of Creditworthiness, averaged over 1986-95. Inequalitymeasures are circa 1985. Standard errors are calculated using White's (1980) heteroskedastic-consistentvariance-covariance matrix. A #, * or ** indicates significance at .10, .05, or .01 level respectively for two-tailed tests. Note R2 does not have its usual interpretation in WLS (equation 2).
26

Table 2
Checks and Balances, Polarization, and Creditworthiness
Equation 1 2 3 4 5 6
Constant -76.21 -69.09 -107.39 -103.60 -120.00 -125.99(15.35) (15.31) (13.25) (13.00) (11.21) (11.48)
GDP per capita 15.21** 14.71** 17.31** 17.02** 17.19** 18.07**1985 (1.80) (1.77) (1.70) (1.63) (1.47) (1.50)
Growth 1980-85 2.11** 2.15** 1.31* 1.27* 1.70** 1.70**(0.66) (0.63) (0.53) (0.52) (0.46) (0.45)
Aggregate GDP 0.23** 0.24** 0.28* 0.31* 0.29** 0.27*1985 (0.08) (0.08) (0.11) (0.12) (0.11) (0.12)
Terms of trade 12.65** 11.42* 9.88# 9.60# 12.23** 12.83**shift (4.45) (4.55) (5.74) (5.59) (4.72) (4.61)
Gini: income -0.55** -0.58**Inequality (0.17) (0.17)
Gini: land -0.13 -0.15 'inequality (0.08) (0.08)
Ethnic harmony 0.24** 0.18*(0.08) (0.09)
Checks (# of veto 1.47 0.96 2.02# 1.98# 1.64# 1.31players) (1.15) (1.40) (1.10) (1.09) (0.92) (0.92)
Inequality* -0.1 8# -0.06Checks (0.11) (0.06)
Ethnic harmony -0.12**Checks (0.06)
N 76 76 84 84 105 105
R2 .84 .85 .81 .81 .80 .81
S.E. of est. 10.9 10.7 12.2 12.1 11.9 11.7.
Mean, D.V. 42.4 42.4 41.2 41.2 39.0 39.0
Dependent variable = International Investor Index of Creditworthiness, averaged over1986-95. Inequality measures are circa 1985. Standard errors are calculated using White's(1980) heteroskedastic-consistent variance-covariance matrix. A ", * or ** indicatessignificance at .10, .05, or .01 level respectively for two-tailed tests. Inequality*Checks =
(deviation of Gini from sample mean)*(deviation of Checks from 3). Ethnicharmony*Checks = (deviation of homogeneity from 70%, in absolute value)*(deviationof Checks from 3).
27

Table 3
Electoral Competitiveness, Polarization, and Creditworthiness
Equation 1 2 3 4 5 6
Constant -99.47 -103.17 -128.90 -135.58 -136.73 -142.76(12.55) (15.04) (13.11) (14.48) (11.31) (11.45)
GDP per capita 18.21** 17.33** 20.28** 19.59** 19.88** 20.22**1985 (1.60) (1.66) (1.54) (1.52) (1.46) (1.42)
Growth 1980-85 2.06** 2.02** 1.65** 1.45** 1.81** 1.80**(0.61) (0.59) (0.56) (0.53) (0.45) (0.45)
Aggregate GDP 0.24** 0.24** 0.27* 0.31* 0.30* 0.29*1985 (0.09) (0.09) (0.12) (0.12) (0.13) (0.13)
Terms of trade 14.81** 15.22** 15.24** 15.88** 16.89** 17.22**shift (4.31) (4.22) (5.67) (5.575 (4.85) (5.01)Gini: income -0.55** -0.19Inequality (0.16) (0.24)Gini: land -0.09 0.13inequality (0.08) (0.12)Ethnic harmony 0.20** 0.32**
(0.08) (0.09)
Electoral -5.94 -4.57 -5.23 -4.95 -5.66# -5.74#competitiveness (3.97) (3.99) (4.03) (3.82) (3.27) (3.23)
Inequality* -0.55* -0.40*competitiveness (0.27) (0.18)
Ethnic harmony -0.23*competitiveness (0.15)
N 76 76 84 84 105 105
R2 .84 .85 .80 .81 .80 .80
S.E. of est. 10.8 10.6 12.3 12.0 11.9 11.9
Mean, D.V. 42.7 42.7 41.2 41.2 39.0 39.0
Dependent variable = International Investor Index of Creditworthiness, averaged over1986-95. Inequality measures are circa 1985. Standard errors are calculated using White's(1980) heteroskedastic-consistent variance-covariance matrix. A #, * or ** indicatessignificance at .10, .05, or .01 level respectively for two-tailed tests.Inequality*competitiveness = (deviation of Gini from sample mean)*(competitiveness).Ethnic harmony*competitiveness = (deviation of homogeneity from 70%, in absolutevalue)*(competitiveness).
28
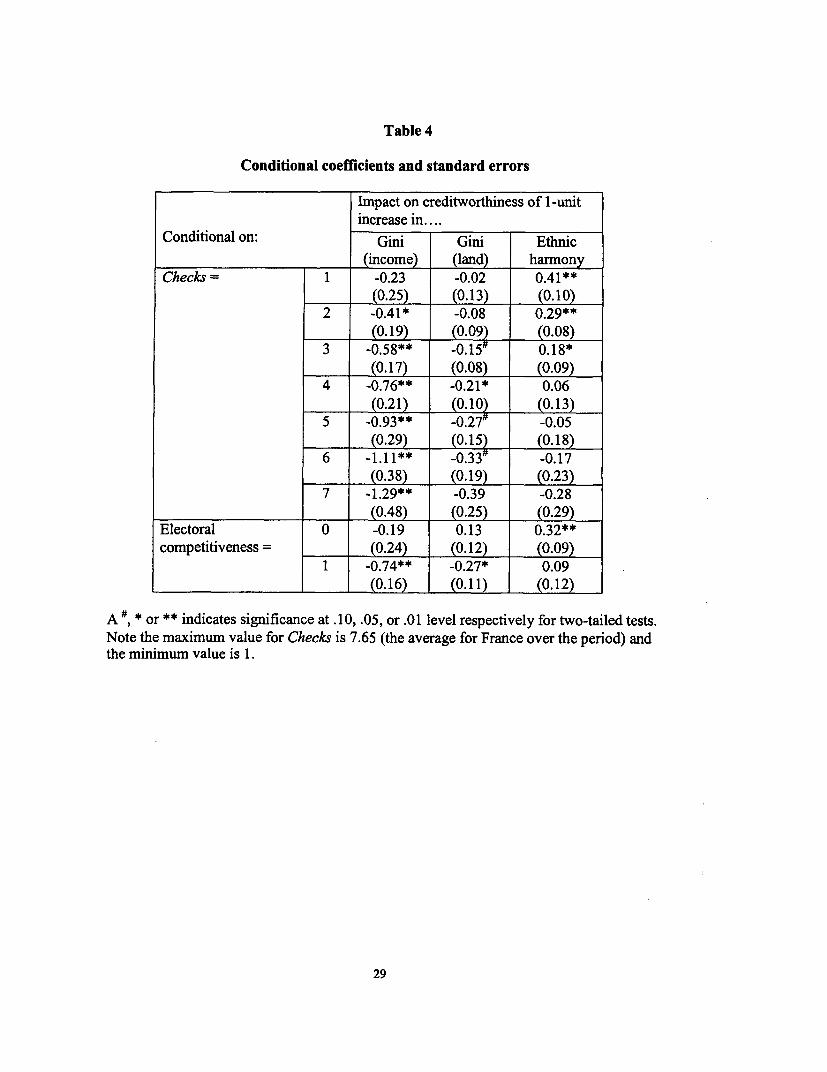
Table 4
Conditional coefficients and standard errors
Impact on creditworthiness of 1-unitincrease in....
Conditional on: Gini Gini Ethnic
(income) (land) harmonyChecks 1 -0.23 -0.02 0.41**
(0.25) (0.13) 0.102 -0.41* -0.08 0.29**
(0.19) (0.09) (0.08)3 -0.58** -0.15# 0.18*
(0.17) (0.08) (0.09)4 -0.76** -0.21* 0.06
(0.21) (0.10) (0.13)5 -0.93** -0.27 -0.05
(0.29) (0.15) (0.18)6 -1.11** -0.33 -0.17
(0.38) (0.19) (0.23)7 -1.29** -0.39 -0.28
_ (0.48) (0.25) (0.29)Electoral 0 -0.19 0.13 0.32**competitiveness = (0.24) (0.12) (0.09)
1 -0.74** -0.27* 0.09(0.16) (0.11) (0.12)
A #, * or ** indicates significance at .10, .05, or .01 level respectively for two-tailed tests.Note the maximum value for Checks is 7.65 (the average for France over the period) andthe minimum value is 1.
29

Data Appendix ISummary Statistics
N Mean Std. Min. Max.dev.
Creditworthiness index 106 38.8 25.7 5.9 93.4Gini income inequality 76 41.7 9.5 25.2 63.2Gini land inequality (N=84) 84 55.1 16.1 8.0 95.6Ethnic homogeneity (N=105) 105 68.5 25.0 17 100Ethnic harmony fN=105) 105 21.0 13.5 0 53Log GDP per capita 1985 106 7.97 1.06 5.70 9.72Per capita annual growth 1980-85 106 -0.1 3.3 -10.7 6.9Aggregate GDP 1985 (% of US) 106 3.5 10.8 .005 100Net barter terms of trade shift 106 0.94 0.27 0.41 1.95Electoral competitiveness (0-1) 106 0.62 0.49 0 1Checks (number of veto players) 106 2.89 1.74 1 7.64
Data Appendix IICountries in sample (with creditworthiness values)
Sudan (5.9), Nicaragua (6.9), Uganda (6.9), Sierra Leone (7.2), Haiti (8.3), Liberia (8.4),Mozambique (8.8), Zaire (9.0), Ethiopia (9.2), Zambia (11.1), Tanzania (11.8), ElSalvador (11.9), Angola (12.3), Iraq (12.8), Guinea (13.7), Bolivia (13.9), Honduras(14.1), Myanmar (14.2), Congo Rep. (14.7), Peru (14.9), Benin (16.2), Mali (16.5),Guatemala (16.5), Togo (16.8), Malawi (16.9), Seychelles (17.1)
Burkina Faso (17.2), Dominican Rep. (17.6), Bangladesh (18.9), Jamaica (19.3), Senegal(19.3), Nigeria (19.7), Syria (20.4), Cote D'Ivoire (20.8), Swaziland (21.5), Ecuador(21.9), Costa Rica (22.1), Panama (23.1), Nepal (23.5), Iran (24.3), Sri Lanka (24.9),Philippines (26.3), Argentina (26.3), Egypt (26.4), Zimbabwe (26.6), Ghana (27.5),Cameroon (27.5), Kenya (27.7), Paraguay (28.2), Jordan (28.2), Morocco (29.1), Pakistan(29.4), Brazil (29.6), Mauritania (30.1)
Gabon (30.3), Uruguay (31.4), Papua New Guinea (32.6), Trinidad & Tobago (33.6),Venezuela (36.1), Algeria (36.1), Barbados (36.3), Guinea-Bissau (36.4), South Africa(37.0), Mexico (37.2), Israel (37.4), Tunisia (38.7), Colombia (39.0), Chile (39.4),Turkey (41.7), Mauritius (43.4), Botswana (43.8), India (44.7), Cyprus (45.9), Greece(48.0), Indonesia (48.5), Oman (51.1), Iceland (54.2), Kuwait (54.2), Saudi Arabia (59.2),Thailand (59.5), Malta (60.1)
Malaysia (61.4), Portugal (61.5), New Zealand (65.2), Korea (66.4), Ireland (67.1),Australia (70.8), Spain (74.2), Denmark (74.3), Finland (75.2), Italy (76.5), Taiwan(77.1), Singapore (78.1), Sweden (78.1), Belgium (78.5), Norway (79.6), Canada (84.0),Austria (84.4), Luxembourg (84.5), UK (86.4), France (86.5), Netherlands (87.8), USA(90.4), Germany (91.9), Switzerland (93.3), Japan (93.4)
30
Data Appendix IIICoding of Political Institutions Variables
Executive index of electoral competitiveness (EIEC)
No executive: 1Unelected executive: 2Elected, 1 candidate: 31 party, multiple candidates: 4multiple parties are legal: 5multiple parties with multiple candidates, but
the winner received more than 75% of the votes: 6winner received less than 75% of votes: 7
* Executives who are:1) Elected directly by population, or2) Elected by an electoral college that is elected by the people and has the solepurpose of electing the executive, are scored on the above scale.
* Executives elected by bodies other than these are given the same score that theelecting body would get. Even if the electing body is not the actual "legislature" (suchas an appointed electoral college), the competitiveness of that body is used to scorethe executive.
* This means that competitively elected prime ministers get 6 or 7. The chief executivesof Communist nations (the chairman of the Communist Party) is given a 3, becausethey are elected by the Party Congress, electing bodies which they do not appoint.Executives elected by small, appointed juntas or by appointed electoral colleges get 2.
* Rival chief executives in one country, particularly in the setting of armed conflicts,are counted as No executives, and thus score a 1.
* Referenda and votes by "popular acclamation" on unelected executives are scored as3.
* If executives unilaterally extend their terms of office, they get a 2 starting in the yearthey should have held elections. Any executive elected for life, even by the people oran elected assembly, gets a 2. This elected-for-life rule is slightly different from thatfollowed for legislatures that unilaterally extend their rule.
Checks /
Checks equals one if the above index (EIEC), or the legislative index of electoralcompetitiveness (LIEC, also from Beck et al., 2000), is less than 5: countries wherelegislatures are not competitively elected are considered countries where only theexecutive wields a check. In presidential systems: (1) if ELEC is greater than 6, Checks is
31
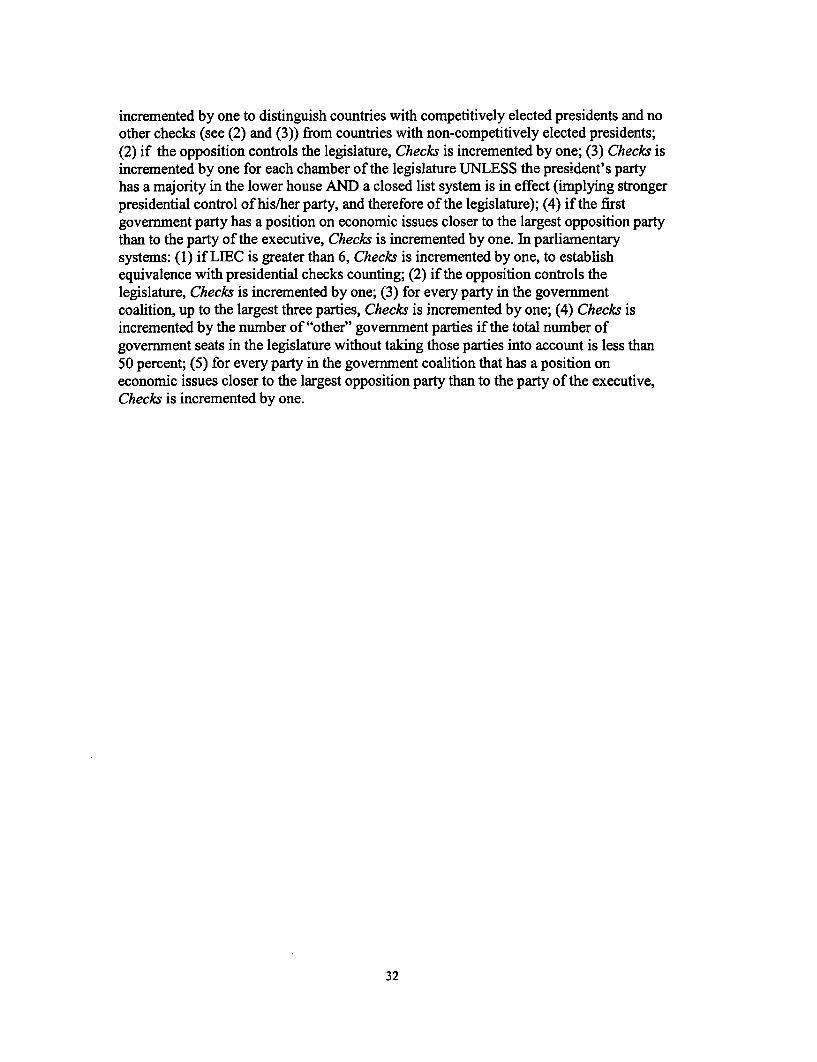
incremented by one to distinguish countries with competitively elected presidents and noother checks (see (2) and (3)) from countries with non-competitively elected presidents;(2) if the opposition controls the legislature, Checks is incremented by one; (3) Checks isincremented by one for each chamber of the legislature UNLESS the president's partyhas a majority in the lower house AND a closed list system is in effect (implying strongerpresidential control of his/her party, and therefore of the legislature); (4) if the firstgovernment party has a position on economic issues closer to the largest opposition partythan to the party of the executive, Checks is incremented by one. In parliamentarysystems: (1) if LIEC is greater than 6, Checks is incremented by one, to establishequivalence with presidential checks counting; (2) if the opposition controls thelegislature, Checks is incremented by one; (3) for every party in the governmentcoalition, up to the largest three parties, Checks is incremented by one; (4) Checks isincremented by the number of "other" government parties if the total number ofgovernment seats in the legislature without taking those parties into account is less than50 percent; (5) for every party in the government coalition that has a position oneconomic issues closer to the largest opposition party than to the party of the executive,Checks is incremented by one.
32
References
Acemoglu, D., Robinson J. (2001) A Theory of Political Transitions. AmericanEconomic Review 91, 938-963
Alesina, A., Drazen, A. (1991) Why are Stabilizations Delayed? American EconomicReview 81(5), 1170-1188
Alesina, A., Gatti, R. (1995) Independent Central Banks: Low Inflation at no Cost?American Economic Review Papers and Proceedings 85(2), 196-200
Beck, T., Clarke, G., Groff, A., Keefer, P., Walsh, P. (2001). New Tools in ComparativePolitical Economy: The Database of Political Institutions. World Bank EconomicReview 15(1), 165-176
Berg, A., Sachs, J. (1988). The Debt Crisis: Structural Explanations of CountryPerformance." Journal of Development Economics 29, 271-306
Deininger, K., Squire, L. (1996). Measuring Income Inequality: A New Data Set. WorldBank Economic Review 10(3), 565-91
Easterly, W., Levine, R. (1997). Africa's Growth Tragedy: Policies and EthnicDivisions. Quarterly Journal of Economics 112(4), 1203-50
Esteban, J-M., Ray, D. (1994). On the Measurement of Polarization. Econometrica,62(4), 819-851
Feder, G., Ross, K (1982). Risk Assessments and Risk Premiums in the Eurodollar Market.Journal of Finance 37(3), 679-91
GAO (1994) Crrdit Reform: U.S. Needs BetterMethodfor Estimating Cost of Foreign Loans andGuarantees. Washington, DC: U.S. General Accounting Office
Gould, W., Rogers, W. H. (1994) Quantile Regression as an Alternative to RobustRegression. Proceedings of the Statistical Computing Section. Alexandria, VA:American Statistical Association
Greif, A. (1989) Reputation and Coalitions in Medieval Trade: Evidence on theMaghribi Traders. Journal of Economic History 49(4), 857-82
Haggard, S., Kaufman, R. eds. (1992) The Politics of Economic Adjustment:International Constraints, Distributive Conflicts and the State. Princeton:Princeton University Press
Horowitz, D. L. (1985) Ethnic Groups in Conflict. Berkeley, CA: University ofCalifornia Press
33
Jazairy, I., Alamgir, M., Panuccio, T. (1992) State of World Rural Poverty: An Inquiryinto its Causes and Consequences. International Fund for AgriculturalDevelopment.
Keefer, P. (2002) Clientelism and Credibility. Presented at the meetings of theInternational Society for New Institutional Economics, Boston, September 2002
, Knack, S. (2002) Polarization, Property Rights and the Links between Inequalityand Growth. Public Choice, 111, 127-154
, Stasavage, D. (2000) Bureaucratic Delegation and Political Institutions: When areIndependent Central Banks Irrelevant? World Bank Policy Research WorkingPaper 2356.
Knack, S., Keefer, P. (1997) Does Inequality Harm Growth Only in Democracies? AReplication and Extension. American Journal of Political Science 41(1), 323-32
Landa, J. (1981) A Theory of the Ethnically Homogeneous Middleman Group: AnInstitutional Alternative to Contract Law. Journal of Legal Studies 10, 349-362
McGuire, M.C., Olson, M. Jr. (1996) The Economics of Autocracy and Majority Rule:The Invisible Hand and the Use of Force. Journal of Economic Literature 34(1),72-96
Meltzer, A.H., Richard, S. F. (1981) A Rational Theory of the Size of Government.Journal of Political Economy 89, 914-27
Muller, E. N., Seligson, M. (1987) Inequality and Insurgency. American Political ScienceReview 81(2), 425-451
North, D., Weingast, B. (1992) Constitutions and Commitment: The Evolution ofInstitutions Governing Public Choice in Seventeenth-Century England. Journal ofEconomic History 49(4), 803-32
Olson, Jr., M. (1982) The Rise and Decline of Nations: Economic Growth, Stagflationand Social Rigidities. New Haven: Yale University Press
Olson, Jr., M. (1965) The Logic of Collective Action: Public Goods and the Theory ofGroups. Cambridge, Mass.: Harvard University Press.
Persson, T., Tabellini, G. (1994) Is Inequality Harmful for Growth? American EconomicReview 84, 600-21
Quinn, D. R., Woolley, J. T. (2001) Democracy and National Economic Performance:The Preference for Stability. American Journal of Political Science 45(3), 634-57
Rahnama-Moghadam, M., Samavati, H. (1991) Predicting Debt Rescheduling by Less-Developed Countries: A Probit Model Approach. Quarterly Review of Economics
34
and Business 31(1), 3-14
Rodrik, D. (1999) Where did all the growth go? External shocks, social conflict, andgrowth collapses. Journal of Economic Growth 4(4), 385-412
Sullivan, M. J. (1991) Measuring Global Values. New York: Greenwood
Svensson, J. (1998) Investment, Property Rights and Political Instability: Theory andEvidence. European Economic Review 42(7), 1317-42
Taylor, C., Jodice, D. (1983) World Handbook of Political and Social Indicators, 3rd ed.New Haven: Yale University Press
Veiga, F. J. (2000) Delays of Inflation Stabilizations. Economics and Politics 12(3), 275-95
White, H. L. (1980) A Heteroskedasticity-consistent Covariance Matrix Estimator and aDirect Test for Heteroskedasticity. Econometrica 48, 817-38
35


I


Policy Research Working Paper Series
ContactTitle Author Date for paper
WPS2895 Telecommunications Reform in Jean-Jacques Laffont September 2002 P. Sintim-AboagyeC6te d'lvoire Tchetche N'Guessan 38526
WPS2896 The Wage Labor Market and John Luke Gallup September 2002 E. KhineInequality in Vietnam in the 1990s 37471
WPS2897 Gender Dimensions of Child Labor Emily Gustafsson-Wright October 2002 M. Correiaand Street Children in Brazil Hnin Hnin Pyne 39394
WPS2898 Relative Returns to Policy Reform: Alexandre Samy de Castro October 2002 R. YazigiEvidence from Controlled Cross- Ian Goldin 37176Country Regressions Luiz A. Pereira da Silva
WPS2899 The Political Economy of Fiscal Benn Eifert October 2002 J. SchwartzPolicy and Economic Management Alan Gelb 32250in Oil-Exporting Countries Nils Borje Tallroth
WPS2900 Economic Structure, Productivity, Uwe Deichmann October 2002 Y. D'Souzaand Infrastructure Quality in Marianne Fay 31449Southern Mexico Jun Koo
Somik V. Lall
WPS2901 Decentralized Creditor-Led Marinela E. Dado October 2002 R. VoCorporate Restructuring: Cross- Daniela Klingebiel 33722Country Experience
WPS2902 Aid, Policy, and Growth in Paul Collier October 2002 A. Kitson-WaltersPost-Conflict Societies Anke Hoeffler 33712
WPS2903 Financial Globalization: Unequal Augusto de la Torre October 2002 P. SotoBlessings Eduardo Levy Yeyati 37892
Sergio L. Schmukler
WPS2904 Law and Finance: Why Does Legal Thorsten Beck October 2002 K. LabrieOrigin Matter? Asl1 Demirguc-Kunt 31001
Ross Levine
WPS2905 Financing Patterns Around the World: Thorsten Beck October 2002 K. LabrieThe Role of Institutions Aslh DemirgLi,-Kunt 31001
Vojislav Maksimovic
WPS2906 Macroeconomic Effects of Private Lourdes Trujillo October 2002 G. Chenet-SmithSector Participation in Latin Noelia Martin 36370America's Infrastructure Antonio Estache
Javier Campos
WPS2907 The Case for International Antonio Estache October 2002 G. Chenet-SmithCoordination of Electricity Regulation: Martin A. Rossi 36370Evidence from the Measurement of Christian A. RuzzierEfficiency in South America
WPS2908 The Africa Growth and Opportunity Aaditya Mattoo October 2002 P. FlewittAct and its Rules of Origin: Devesh Roy 32724Generosity Undermined? Arvind Subramanian
WPS2909 An Assessment of Carsten Fink October 2002 P. FlewittTelecommunications Reform in Aaditya Mattoo 32724Developing Countries Randeep Rathindran
Policy Research Working Paper Series
ContactTitle Author Date for paper
WPS2910 Boondoggles and Expropriation: Philip Keefer October 2002 P. Sintim-AboagyeRent-Seeking and Policy Distortion Stephen Knack 38526when Property Rights are Insecure
WPS2911 Micro-Level Estimation of Welfare Chris Elbers October 2002 P. SaderJean 0. Lanjouw 33902Peter Lanjouw
WPS2912 Short-Run Pain, Long-Run Gain: Graciela Laura Kaminsky October 2002 E. KhineThe Effects of Financial Sergio L. Schmukler 37471Liberalization
WPS2913 Financial Development and Dynamic Inessa Love October 2002 K. LabrieInvestment Behavior: Evidence from Lea Zicchino 31001Panel Vector Autoregression
WPS2914 The Impact of Cash Budgets on Hinh T. Dinh October 2002 D. SidibePoverty Reduction in Zambia: A Case Abebe Adugna 35074Study of the Conflict between Well- Bernard MyersIntentioned Macroeconomic Policyand Service Delivery to the Poor
WPS2915 Federal Politics and Budget Deficits: Stuti Khemani October 2002 H. SladovichEvidence from the States of India 37698
WPS2916 Ex-ante Evaluation of Conditional Fran,ois Bourguignon October2002 P. SaderCash Transfer Programs: The Case Francisco H. G. Ferreira 33902of Bolsa Escola Phillippe G. Leite
WPS2917 Economic Development, Competition Bernard Hoekman October 2002 R. MartinPolicy, and the World Trade Petros C. Mavroidis 39065Organization
WPS2918 Reducing Agricultural Tariffs versus Bernard Hoekman October 2002 R. MartinDomestic Support: What's More Francis Ng 39065Important for Developing Countries? Marcelo Olarreaga
WPS2919 Financial Regulatory Harmonization Cally Jordan October 2002 H. Issaand the Globalization of Finance Giovanni Majnoni 30154


