
Smillie, Ian R.A. (2012) Analysis of leaf morphology and photosynthesis in deletion mutants of rice (Oryza sativa L.). PhD thesis, University of Nottingham.
Access from the University of Nottingham repository: http://eprints.nottingham.ac.uk/12569/1/Ian_Smillie_Thesis.pdf
Copyright and reuse:
The Nottingham ePrints service makes this work by researchers of the University of Nottingham available open access under the following conditions.
This article is made available under the University of Nottingham End User licence and may be reused according to the conditions of the licence. For more details see: http://eprints.nottingham.ac.uk/end_user_agreement.pdf
For more information, please contact [email protected]
ANALYSIS OF LEAF MORPHOLOGY AND PHOTOSYNTHESIS IN
DELETION MUTANTS OF RICE (Oryza sativa L.)
IAN R.A. SMILLIE, BSc. (Hons.)
Thesis submitted to the University of Nottingham for the degree of Doctor of Philosophy
University of Nottingham Sutton Bonington Campus
Loughborough Leicestershire
LE12 5RD
JUNE 2012

i
ABSTRACT
Analysis of leaf morphology and photosynthesis in deletion
mutants of rice (Oryza sativa L.)
I. Smillie
As a plant operating the C3 photosynthetic pathway and commonly
grown under tropical conditions of high light intensity and
temperature, rice (Oryza sativa) displays high levels of
photorespiration, to the detriment of photosynthetic efficiency. For
this reason it is thought that improvements to net photosynthesis
via an increased photosynthetic efficiency could provide significant
gains in terms of grain yield. There is great interest in 1.
Introducing CO2 concentrating mechanisms into C3 crop plants such as
the C4 photosynthetic pathway in order to facilitate enhanced
photosynthetic efficiency. This requires an understanding of C3 and C4
leaf development and establishing whether there is sufficient plasticity in
the rice genome to produce plants with C4-like properties. 2. Improving
existing C3 photosynthesis by means of increasing leaf thickness, vein
density and investigation of the impacts of mesophyll cell size.
It is in this context that a forward screen of approximately 100
mutant lines of the indica rice variety IR64 was developed at
Nottingham to search for relevant changes in leaf morphology.
Mutant seed produced using chemical mutagenesis (diepoxybutane
and ethylmethanesulfonate) and irradiation (gamma and fast
neutron) was supplied by the International Rice Research Institute
(IRRI) in the Philippines. A rapid low resolution screen was devised
using light microscopy of fresh, untreated hand cut leaf sections of
plants at the leaf six stage. Seven mutant lines were identified as
showing altered leaf morphologies and were termed alm mutants.

ii
alm1, alm5 and alm6 displayed a reduced interveinal distance
between neighbouring veins, a common feature of C4 plants with
Kranz anatomy, whilst alm1 and alm5 also displayed a reduction in
the size of minor veins. alm3 and alm4 produced significantly
thicker leaves than wild type plants, whilst the leaves of alm7 were
significantly thinner.
A detailed anatomical characterisation of leaf structure revealed
that alm3, alm4 and alm5 plants all displayed a significant
reduction in the size of mesophyll cells and that for all the mutant
lines, the distance between veins was strongly correlated with
mesophyll cell size rather than the number of mesophyll cells
spanning the interveinal regions.
Physiological properties of the alm lines were investigated using
infra-red gas analysis (IRGA) measurements of gas exchange and
chlorophyll fluorescence. It was shown that none of the mutant
lines displayed an increase in photosynthetic capacity when
compared to wild type plants, even in lines which were shown to
possess what was thought to be a favourable leaf anatomy, quite
possibly a result of widespread effects of the mutation process. The
alm1 line was shown to display interesting physiological responses,
with almost no transpiration and a severely reduced photosynthetic
capacity, yet functioning stomata and an unimpaired stomatal
conductance.
In conclusion, the future success of photosynthetic improvement in
rice will rely on the screen of much larger numbers of mutant lines
of rice and C4 plants in order to identify the genes determining key
conserved morphological features such as interveinal cell number,
cell size and the degree to which rice mesophyll cells are lobed.

iii
ACKNOWLEDGEMENTS
I would like to thank my supervisors, Dr Erik Murchie and Dr Kevin Pyke,
for giving me the opportunity to carry out this work, and their huge
efforts, enthusiasm and support throughout the duration of the project.
I would also like the various people who helped me throughout this
project, with special thanks to Stella Hubbart, Fiona Wilkinson, Duncan
Scholefield, Gema Vizcay-Barrena and Olubukola Ajigboye for all their
assistance with various experiments.
Thanks also to the various members of Dr. Murchie‟s lab and office 321
over the past four years. There are too many to name individually, but
thank you all for your support, friendship, many fond memories and
many holiday sweets shared!
Finally I would like to thank my family, those with us and those sadly
departed. You provided fantastic support and inspiration throughout the
duration of this project, and without you all this would never have been
possible.

iv
TABLE OF CONTENTS
Page
Abstract i
Acknowledgements iii Table of Contents iv
List of Figures vii List of Tables xii Abbreviations xiii
CHAPTER 1: INTRODUCTION AND LITERATURE REVIEW 1
1.1 Rice as a crop 3 1.2 Improving production 3
1.3 Physiological traits determining yield potential 4 1.3.1 Harvest index 5 1.3.2 Remobilisation of stem reserves 7
1.3.3 Prolonged grain filling and green leaf area duration 7 1.3.4 PAR 8
1.3.5 Increased sink size 8 1.4 Photosynthesis as a limiting factor 9 1.5 Potential improvements to rice photosynthesis 10
1.6 Characteristics of C4 photosynthesis 13 1.6.1 The C4 pathway 13
1.6.2 Anatomical adaptations for C4 photosynthesis 16 1.6.3 Physiological consequences of C4
photosynthesis 19
1.7 Leaf development 21 1.8 Previous work 24
1.9 Screening for indicators of C4 photosynthesis 28 Chapter 2: METHODS 32
2.1 Seeds used 33 2.2 Growth of plants 33
2.2.1 Seed germination 33 2.2.2 Plant establishment 34
2.3 Screening 38
2.3.1 Leaf numbering 38 2.3.2 SPAD measurements 38
2.3.3 Gross morphology 38 2.3.4 Microscopy 38 2.3.5 Tissue storage 41
2.4 Detailed anatomical methods 41 2.4.1 Tissue fixation, resin embedding and staining 41
2.4.2 Leaf surface impressions 42 2.4.3 Cleared hand cut sections 43 2.4.4 Cell separations and chloroplast counting 44
2.4.5 Confocal microscopy 44 2.5 Gas exchange and chlorophyll fluorescence 45
2.5.1 Response to ambient CO2 concentration 45 2.5.2 Response to light intensity in terms of gas
exchange and chlorophyll fluorescence 45

v
2.6 Statistical analyses 46
Chapter 3: SCREENING THE MUTANT POPULATION 48 3.1 Introduction 49
3.1.1 Genetic background of lines used 50
3.1.2 Anatomical traits related to C4 photosynthesis 50 3.2 Methodology 51
3.2.1 Vein distribution 51 3.2.2 Vein spacing and size 51 3.2.3 Leaf thickness 52
3.3 Leaf morphology of rice 52 3.4 Screening the mutant population 57
3.4.1 Vein arrangement 57 3.4.2 Veins mm-1 leaf width 63
3.4.3 Vein spacing 65 3.4.4 Vein size 69 3.4.5 Leaf thickness 71
3.5 Altered leaf morphology mutants 74 3.5.1 alm1 (83-18-1-7G) 75
3.5.2 alm2 (111-16-1-1G) 76 3.5.3 alm3 (233-7-1-1D) 77 3.5.4 alm4 (1536-6-1-6D) 78
3.5.5 alm5 (3965-1-1-6G) 79 3.5.6 alm6 (3965-1-1-7G) 80
3.5.7 alm7 (7820-1-1-3G) 81 3.6 Discussion 82
Chapter 4: DETAILED MORPHOLOGY OF CANDIDATE LINES 84 4.1 Introduction 85
4.2 Methodology 85 4.2.1 Fixed and stained leaf sections 85 4.2.2 Confocal microscopy 86
4.2.3 Cleared and stained hand cut sections 86 4.2.4 Separated cell preparations 87
4.2.5 Leaf surface impressions 87 4.3 Detailed leaf sections 87
4.3.1 Fixed and resin embedded tissue 87
4.3.2 Confocal microscopy 89 4.3.3 Cleared and stained hand cut sections 90
4.3.4 Separated cell preparations 92 4.4 Interveinal Spacing 93
4.4.1 Distance 93
4.4.2 Cell number 95 4.4.3 Cell size 98
4.4.4 Mesophyll cell morphology and chloroplast distribution 105
4.4.5 Stomata 110
4.5 Discussion 113 4.5.1 Interveinal distance and cell number 113
4.5.2 Genetics 114 4.5.3 Chloroplast number and cell size 114
4.5.4 Stomata 115
vi
Chapter 5: PHYSIOLOGICAL RESPONSES OF CANDIDATE
LINES 117 5.1 Introduction 118
5.1.1 Response to carbon dioxide 118
5.1.2 Light response 119 5.1.3 Fluorescence 120
5.2 Methods 121 5.2.1 CO2 response measurement 121 5.2.2 Light response measurements 122
5.3 Plant response to CO2 123 5.4 Response to PAR 130
5.4.1 Gas exchange response to varying PAR 133 5.4.2 Electron transport in photosynthesis 138
5.4.3 Photoprotection 140 5.5 Discussion 142
Chapter 6: GENERAL DISCUSSION 146 6.1 Introduction 147
6.2 Conserved anatomical features of the rice leaf 147 6.2.1 Photorespiratory scavenging 148 6.2.2 Mesophyll conductance to CO2 148
6.2.3 Implications of the conserved nature of cell size, lobing and chloroplast distribution 149
6.3 Alterations displayed by the alm lines 151 6.3.1 alm1 151
6.3.1.1 Possible limitations in hydraulic
conductance in alm1 plants 153 6.3.1.2 Possible inhibitors of PSII in alm1 rice
plants 154 6.3.2 alm2 157 6.3.3 alm3 and alm4 157
6.3.4 alm5 and alm6 160 6.4 Potential alterations in leaf development 162
6.5 Implications for the integration of C4 pathway into rice 163 6.6 Future Work 164
Chapter 7: Bibliography 168
vii
LIST OF FIGURES
Page
Chapter 1: INTRODUCTION AND LITERATURE REVIEW 1.1 Trends in area harvested of Asian rice (source: FAOSTAT database,
2011). 4 1.2 Trend in rice global grain production (source: FAOSTAT database,
2011). 6
1.3 Trend in global rice average yield (source: FAOSTAT database, 2011). 7
1.4 Schematic showing the photorespiratory cycle. Taken from von Caemmerer and Evans (2010). 10
1.5 Histochemical staining of GUS activity showing blue appearance in cells expressing PEP carboxylase in the C4 plant Flaveria bidentis. Taken from Stockhaus et al. (1997). 14
1.6 Simplified schematic of the C4 pathway demonstrating the fixation of atmospheric CO2 in the mesophyll cell chloroplasts by PEP
carboxylase before transfer of the 4 carbon compound to the bundle sheath chloroplasts. Decarboxylation occurs and CO2 enters into the Calvin cycle, whilst PEP is returned to the mesophyll
cells. 16 1.7 Representation of differences between C3 and C4 plant anatomy.
Taken from Leegood et al. (2000). A) Demonstrates the increase in vein density in C4 plants compared to C3, B) shows the close arrangement of mesophyll and bundle sheath cells in C4 leaves,
and C) demonstrates the centrifugal positioning and increase in number of chloroplasts within the C4 bundle sheath. 17
1.8 Typical A/Ci curve for C3 and C4 plants showing the three major points of variance outlined above. Taken from Sage and Pearcy (2000). 1) demonstrates the lower CO2 compensation point
displayed by C4 plants, 2) shows the sharp increase in A as [CO2] rises and 3) shows the elevated maximum A (Amax) demonstrated
by C3 plants at high [CO2]. 20 1.9 A) young rice plant. The leaf sheath forms around the culm, with
the leaf blade emerging at the collar. B) li, ligule; au, auricle of a
rice plant at 70 days post germination, taken from Lee et al. (2007). 22
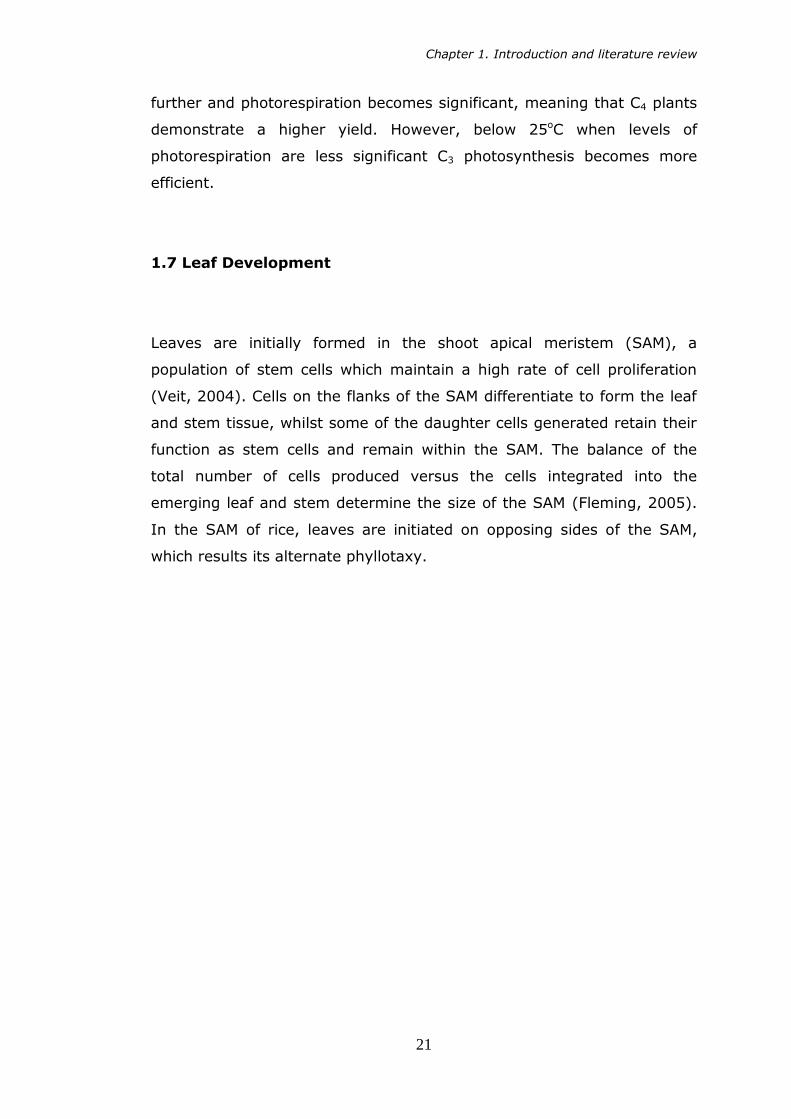
1.10 A) The emerging leaf primordium (P1) forming from the shoot apical meristem (SA) as the P2 primordium forms a hood over the SAM. B) Extending P1 primordium forming a crescent shape. C)
Cross section of P2 showing early procambial strand (PS) (Itoh et al., 2005) 23
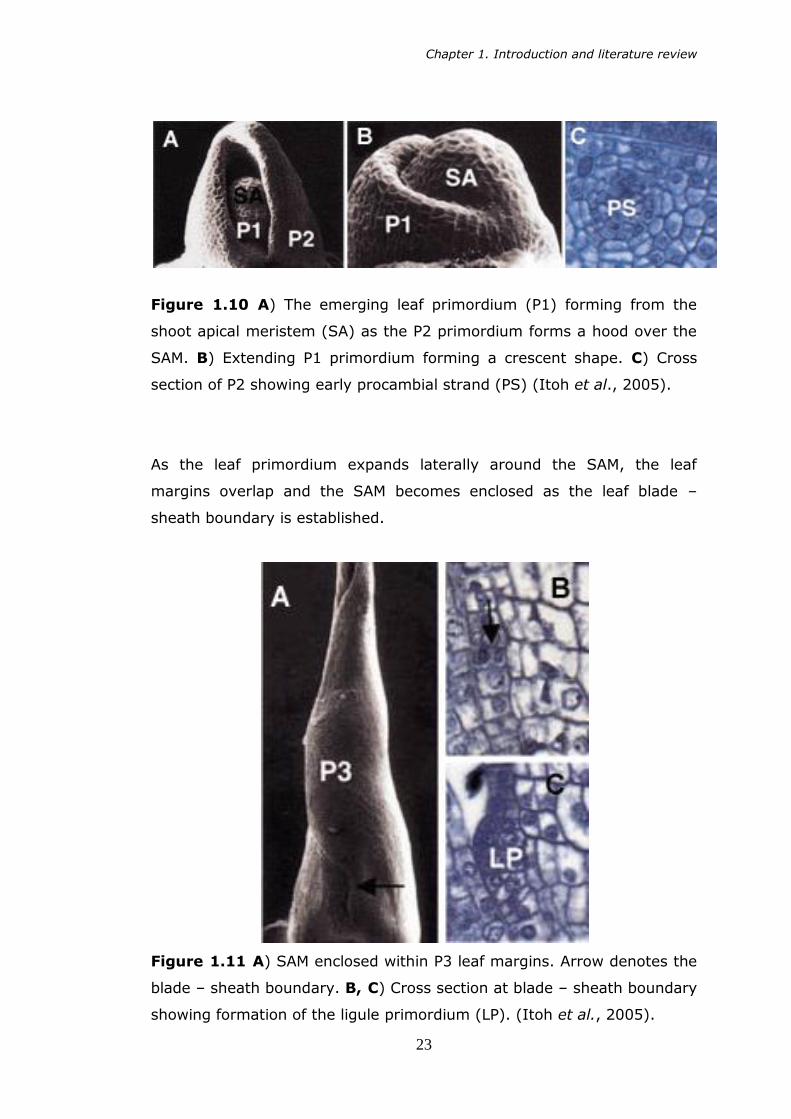
1.11 A) SAM enclosed within P3 leaf margins. Arrow denotes the blade – sheath boundary. B, C) Cross section at blade – sheath boundary showing formation of the ligule primordium (LP). 23
1.12 Transverse sections of A) wild type B) and tan-1 adult maize leaves. m, mesophyll cell; v, vascular bundle; bs, bundle sheath
cell. Adapted from Smith et al. (1996). 27 1.13 Transverse sections through A) wild type and B) ral1 leaves
adapted from Scarpella et al. (2003). 28
viii
Chapter 2: METHODS 2.1 A Young rice seedlings floating in a polystyrene rack. B An open
bottomed centrifuge tube. The lid and base removed used to support seedlings in the rack. 36
2.2 A Wild type and mutant plants growing in hydroponic tanks. B WT
plant in the lightproof support held with foam. 37 2.3 Examples of hand-cut leaf sections from the mutant screen 40
Chapter 3: SCREENING THE MUTANT POPULATION 3.1 Untreated hand cut transverse section of a wild type rice plant
showing the full width of a wild type leaf imaged at 10x magnification. 54
3.2 Enlarged transverse section of the wild type leaf showing the region between the two adjacent major veins. 54
3.3 Typical wild type plant produced under hydroponic growth
conditions. 56 3.4 Diagram of the vein arrangement in the 6th leaf of wild type and
mutant rice lines. 58 3.5 Mean total number of veins present transverse section of the
widest part of leaf 6 in rice plants. Bars denote standard error of
the mean (n>3). 60 3.6 Mean width of leaf 6 of rice plants at the widest part of the leaf.
Bars denote standard error of the mean (n>3). 61 3.7 Mean number of veins per mm leaf width across the whole leaf
width of leaf 6 in rice plants. Bars denote standard error of the
mean (n>3). 63 3.8 The relationship between the mean width of the 6th leaf of rice
plants at the widest point and the number of veins it contains. 64 3.9 Average distance between neighbouring major veins in the 6th leaf
of rice. Bars denote standard error of the mean (n>3). 66
3.10 Average distance between adjacent minor and major veins of the mean (n>3). 67
3.11 Average distance between adjacent minor veins of the mean (n>3). 68
3.12 Mean major vein diameter as observed in transverse sections of
leaf 6 of rice plants. Bars denote standard error of the mean (n>3). 69
3.13 Mean minor vein diameter as observed in transverse sections of leaf 6 of rice plants. Bars denote standard error of the mean (n>3). 70
3.14 Leaf thicknesses at the major vein. Bars denote standard error of the mean (n>3). 71
3.15 Leaf thickness at the minor vein. Bars denote standard error of the mean (n>3). 72
3.16 Leaf thickness at the bulliform cells. Bars denote standard error of
the mean (n>3). 73 3.17 Plants of the alm1 mutant line of rice, schematic map of vein
arrangement and corresponding leaf section taken from the fully expanded leaf 6th leaf. 75
ix
3.18 Plants of the alm2 line, along with the relevant section of the vein map for those plants, showing that the leaves display a rough
symmetry in vein distribution about the midrib. 76 3.19 Plants of the alm3 mutant line of rice, schematic map of vein
arrangement and corresponding leaf section taken from the fully
expanded leaf 6th leaf. 77 3.20 Plants of the alm4 mutant line of rice, schematic map of vein
arrangement and corresponding leaf section taken from the fully expanded leaf 6th leaf. 78
3.21 Whole plants of the alm5 mutant line of rice, schematic map of
vein arrangement and corresponding leaf section taken from the fully expanded leaf 6th leaf. 79
3.22 Plants of the alm6 mutant line of rice, schematic map of vein arrangement and corresponding leaf section taken from the fully
expanded leaf 6th leaf. 80 3.23 Plants of the alm7 mutant line of rice, schematic map of vein
arrangement and corresponding leaf section taken from the fully
expanded leaf 6th leaf. 81
Chapter 4: DETAILED MORPHOLOGY OF CANDIDATE LINES
4.1 Fixed and stained section of leaf 5 of an alm3 rice mutant, stained with toluidine blue. 88
4.2 Confocal micrograph of tissue taken from leaf 5 of a wild type rice plant. Cell walls are coloured green, and chlorophyll is coloured red. 89
4.3 Cleared and stained transverse sections of leaf 5 of wild type rice and alm lines 1-6. 91
4.4 Isolated mesophyll cells from leaf 5 of wild type IR64 rice plants. Individual groups of chloroplasts are highlighted with red broken line. 93
4.5 Mean distance between two adjacent minor veins in the fully extended fifth leaf. Each bar represents the mean distance for one
plant. 94 4.6 Mean number of mesophyll cells present between two adjacent
minor veins in the fully extended fifth leaf. Each bar represents the
mean number for one plant. 96 4.7 Longitudinal section of wild type rice leaf showing intercellular
airspaces (IC); mesophyll cells (M) and the junctions between mesophyll cells (arrowheads). Bar = 10µm. Taken from Sage and Sage (2009). 98
4.8 Comparison of A wild type IR64 rice mesophyll cell and B Arabidopsis thaliana. Note that plan area of rice mesophyll cells
are typically 20 -30% of those of Arabidopsis. The high degree of lobing displayed by the rice mesophyll cell is also apparent. 99
4.9 Average plan area of mesophyll cells present between two adjacent
minor veins in the fully extended fifth leaf. Each bar represents the mean plan area of cells of one individual plant. 99
4.10 The relationship between mesophyll cell area and mean interveinal distance in the fully expanded leaf 5 of rice plants. 100

x
4.11 Schematic showing the position of the major groups of individual plants for mean cross sectional cell area versus interveinal distance
for each alm line. 101 4.12 The relationship between the number of cells present and the
interveinal distance in the fully expanded leaf 5 of rice plants. 102
4.13 Interveinal cell number versus interveinal distance in individual plants demonstrating an interveinal distance of 90µm or less. 103
4.14 Cross sectional cell area versus interveinal distance in individual plants demonstrating an interveinal distance of less than 90µm 104
4.15 Comparison of separated mesophyll cells of the alm mutant lines and wild type (WT) rice plants. Note the consistent degree of
lobing displayed by each line. 106 4.16 The mean number of lobes per mesophyll cell. Bars denote
standard error of the means. 107 4.17 Mean number of chloroplasts per mesophyll cell. Bars denote
standard error of the means. 108
4.18 Relationship between the mean number of chloroplasts per mesophyll cell and the mean number of lobes per mesophyll cell in
the fully expanded 5th leaf of rice plants. 109 4.19 Leaf surface impressions taken from A) alm3 adaxial surface, B)
wild type rice adaxial surface, C) alm3 abaxial surface and D) wild
type abaxial surface. 111 4.20 The relative stomatal density across different sections of the
abaxial surface of 5th leaf of rice plants. A represents the field of view nearest to the midrib, moving out through successive fields of view out to D at the leaf margin. 112
4.21 The relative stomatal density across different sections of the adaxial surface of 5th leaf of rice plants. A represents the field of
view nearest to the midrib, moving out through successive fields of view out to D at the leaf margin. 113
Chapter 5: PHYSIOLOGICAL RESPONSES OF CANDIDATE LINES 5.1 Schematic showing the pathways of energy release from the
excited chlorophyll molecule following capture of a photon of light.
(LiCor 6400 XT user manual v6.4) 120 5.2 A) LiCor 6400 XT IRGA with cuvette open. B) Rice leaf in LiCor
cuvette for gas analysis. 122 5.3 Example A/Ci curve. Net assimilation (A) versus substomatal
carbon dioxide concentration (Ci) in a wild type IR64 rice
plant. 124 5.4 Sample output from the curve fitting tool. Blue circles (Aobs)
denote the observed values of A at a known Cc. The red line represents the portion of photosynthesis described by the Rubisco-limited state, the green line the RuBP-regeneration state and the
yellow line the TPU state. A, WT; B, alm1; C, alm2; D, alm3; E, alm4; F, alm5; G, alm6. 125

xi
5.5 Values determined from fitted A Ci curves, measured at leaf temperature (Tleaf). A, Maximum rate of carboxylation (VCmax); B,
Triose phosphate utilisation (TPU); C, Rate of electron transport (J); D, Dark respiration rate (Rd); E, Mesophyll cell conductance (gm). Bars denote standard error of the mean (n=5). 126
5.6 Values determined from fitted A Ci curves, normalised to a leaf temperature of 25oC. A, Maximum rate of carboxylation (VCmax);
B, Triose phosphate utilisation (TPU); C, Rate of electron transport (J); D, Dark respiration rate (Rd); E, Mesophyll conductance (gm). Bars denote standard error of the mean (n=5). 128
5.7 Quantum yield (Fv/Fm) of alm mutants of rice. Bars denote standard error of the mean (n=5). 131
5.8 Net photosynthesis (A) in response to varying photosynthetically active radiation (PAR). Bars denote standard error of the mean
(n=5) 132 5.9 Levels of transpiration (E), in response to varying PAR. Bars
denote standard error of the mean (n=5). 134
5.10 Substomatal CO2 concentration (Ci) versus PAR. Bars denote standard error of the mean (n=5). 136
5.11 Stomatal conductance (gs) versus PAR. Bars denote standard error of the mean (n=5). 137
5.12 Quantum yield of photosystem II (ΦPSII) in response to varying
PAR. Bars denote standard error of the mean. 138 5.13 Electron transport rate (ETR) in response to varying PAR. Bars
denote standard error of the mean (n=5). 139 5.14 Response in photochemical quenching (qP) in varying levels of PAR.
Bars denote standard error of the mean (n=5). 140
5.15 Response in non-photochemical quenching (NPQ) in varying levels of PAR. Bars denote standard error of the mean (n=5). 141
5.16 Schematic diagram of the major protein complexes of the thylakoid membrane. Taken from Pyke (2009). 145
Chapter 6: GENERAL DISCUSSION 6.1 Comparison of A) rice mesophyll cell with B) mesophyll cell
Borszczowia aralocaspica employing single celled C4 photosynthesis. Borszczowia aralocaspica confocal image
reproduced from Edwards et al. (2004). 151 6.2 Schematic of the thylakoid membrane proteins. 155 6.3 Partially separated tissue from the fully expanded 6th leaf of wild
type rice showing mesophyll cells in perpendicular arrangement to the bundle sheath. 166
xii
LIST OF TABLES
Page
Chapter 1: INTRODUCTION AND LITERATURE REVIEW
1.1 Comparison of CO2 assimilation rates (A) between species (von Caemmerer, 2003). 12
1.2 Radiation Use Efficiency (RUE) for above ground biomass production in crop plants (adapted from Kiniry et al. 1989). 13
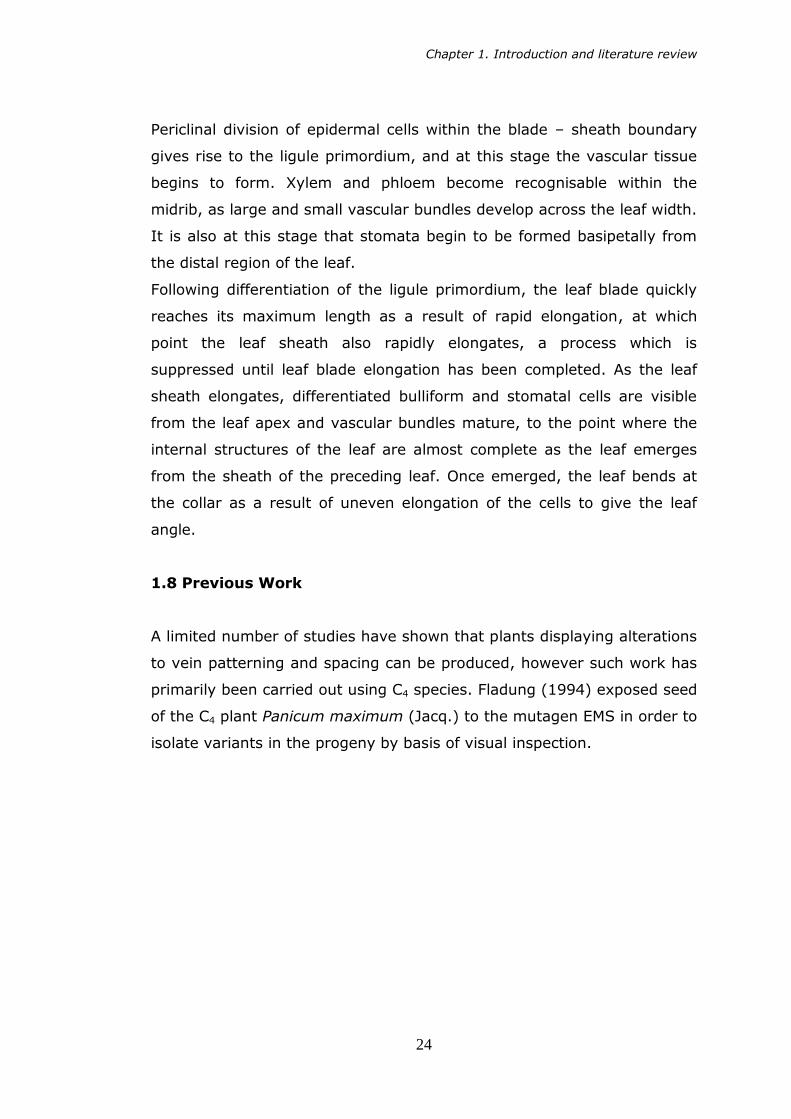
1.3 Morphological characterisics of P. maximum compared with
wildtype (mean ± S.E) adapted from Fladung (1994). 25 1.4 The frequency of visible mutations of IR64 produced by different
mutagens (Wu et al. 2005). 30
Chapter 2: METHODS
2.1 Ingredients of the hyroponic medium. 35 Chapter 3: SCREENING THE MUTANT POPULATION
3.1 Anatomical characteristics of the 5th leaf of wild type IR64. 56 3.2 Summary of mutant lines possessing a significantly reduced mean
total number of veins observed in the sixth leaf and / or a
significantly reduced mean width of leaf six when compared to wild type IR64 plants (n>3). 62
Chapter 5: PHYSIOLOGICAL RESPONSES OF CANDIDATE LINES
5.1 Range and order of CO2 concentrations used in the production of CO2 response curves. 122
5.2 Range and order of light intensities used in the determination of light CO2 responses. 123
Chapter 6: GENERAL DISCUSSION
6.1 Significantly altered physiological and anatomical characteristics displayed by plants of the alm1 mutant line of rice compared to wild type rice plants. 152
6.2 Significantly altered physiological and anatomical characteristics displayed by plants of the alm2 mutant line of rice compared to
wild type rice plants. 157 6.3 Significantly altered physiological and anatomical characteristics
displayed by plants of the alm3 mutant line of rice compared to
wild type rice plants. 158 6.4 Significantly altered physiological and anatomical characteristics
displayed by plants of the alm4 mutant line of rice compared to wild type rice plants. 158
6.5 Significantly altered physiological and anatomical characteristics
displayed by plants of the alm5 mutant line of rice compared to wild type rice plants. 160
6.6 Significantly altered physiological and anatomical characteristics displayed by plants of the alm6 mutant line of rice compared to wild type rice plants. 160

xiii
ABBREVIATIONS
A Net carbon dioxide assimilation
ABA Abscisic acid
alm Altered leaf morphology mutant
AT Adenine-thymine
ADP Adenosine diphosphate
ANOVA Analysis of variance
ATP Adenosine triphosphate
BF Bulliform cells
BS Bundle sheath cell
CAM Crassulacean acid metabolism
Ca Atmospheric carbon dioxide concentration
Cc Chloroplast carbon dioxide concentration
Ci Substomatal carbon dioxide concentration
CO2 Carbon dioxide
Cyt Cytochrome
DEB Diepoxybutane
E Transpiration rate
EMS Ethyl methanesulphonate
ETR Electron transport rate
F Fluorescence
GALP Glycerate 3-phosphate
GC Guanine-Cytosine
gm Mesophyll conductance
gs Stomatal conductance
H Heat
Ha Hectare
HCl Hydrochloric acid
HI Harvest index
IRGA Infra-red gas analyser
IRRI International Rice Research Institute
J Rate of electron transport
M Mesophyll cell
xiv
NADH Nicotinamide adenine dinucleotide
NAD-ME Nicotinamide adenine dinucleotide malic enzyme
NADP Nicotinamide adenine dinucleotide phosphate
NADPH Nicotinamide adenine dinucleotide phosphate
(reduced)
NADP-ME Nicotinamide adenine dinucleotide phosphate malic
enzyme
NaEDTA Disodium ethylene diamine tetra acetate
NPQ Non-photochemical quenching
OAA Oxaloacetic acid
P Photochemical reaction
PAR Photosynthetically active radiation
PBS Phosphate Buffer Solution
PCK Phosphoenolpyruvate carboxykinase
PEP Phosphoenolpyruvate
PSI Photosystem I
PSII Photosystem II
qp Photochemical quenching
R Resistance
Rd Dark respiration rate
ROS Reactive oxygen species
Rubisco Ribulose-1,5-bisphosphate carboxylase oxygenase
RUBP Ribulose bisphosphate
RUE Radiation use efficiency
SA Salicylic acid
SAM Shoot apical meristem
TPU Triose phosphate utilisation
VCmax Maximum rate of carboxylation
Vmax Maximum rate of enzyme activity
WT Wild type
ΦPSII Quantum yield of photosystem II

1
Chapter 1
INTRODUCTION AND
LITERATURE REVIEW

Chapter 1. Introduction and literature review
2
Chapter 1: INTRODUCTION AND LITERATURE REVIEW
It is thought that Asian rice (Oryza sativa L.) was first cultivated as early
as the year 10,000 BC, with relics suggesting it was grown in Eastern
India, China, northern Thailand and Burma. Rice cultivation spread along
the Ganges and Indus rivers between 2,500- 1,500 and was introduced
through the Near East and into Europe on a small scale before Christ,
although the drier climate present there favoured wheat and barley
production. It was introduced into East Africa and Madagascar around the
5th century, before arriving in South America in 16th century. Rice
cultivation began in North America and Australia in the 20th century
(Hoshikawa, 1989). African rice (Oryza glaberrima Steud.) has been
grown since early times, although cultivation of O. sativa has become
more common as although generally hardier, productivity of the
glaberrima species is low. More recently O. sativa and O. glaberrima have
been crossed to produce NERICA (New Rice for Africa) varieties, which
aim to give Asian rice yields in a plant which is better adapted to the
harsher African conditions.
There are five subspecies of Oryza sativa L.; indica (commonly known
as long grain rice) and japonica (short grain rice) are the major
subspecies, but the aus, tropical japonica, temperate japonica and
aromatic groups have also been discovered (Garris et al., 2005). Of the
major subspecies, japonica produces short plants with many tillers and
short, round grains which are glutinous when cooked. Plants of the indica
subspecies are taller, though the introduction of semi-dwarf varieties has
reduced plant height. They too produce many tillers, with long thin grains
which are less glutinous when cooked. There are both upland and paddy
rice cultivars of both major subspecies, and also floating cultivars of
indica have been produced (Hoshikawa, 1989).

Chapter 1. Introduction and literature review
3
1.1 Rice as a crop
In terms of economic value, rice is one of the world‟s most important
crops. Paddy rice is grown on approximately 161 million ha of land
worldwide (FAOSTAT, 2009), primarily in Asia in a band flanked by
Pakistan to the east and Japan to the west, and provides the primary
source of calories for a large proportion of the population residing in this
area. Rice forms over 70% of caloric uptake in Myanmar and Bangladesh,
dropping to approximately 50% in relatively wealthy countries such as
Thailand (Dawe, 2000). The most recent United Nations (UN) figures
suggest that, as of 2010, the Asian population stands at 4.2 billion
people. Given current rates of population growth, this figure is predicted
to rise to almost 6.5 billion by the year 2050, although, allowing for
current trends in decreasing fertility levels, the UN perceives a figure of
around 5.2 billion to be more likely (UN data, 2008). Due to the rapid
rate of increase in the population of Asia, it has been suggested that a
50% increase in Asian rice yields is required by 2050 in order to avoid
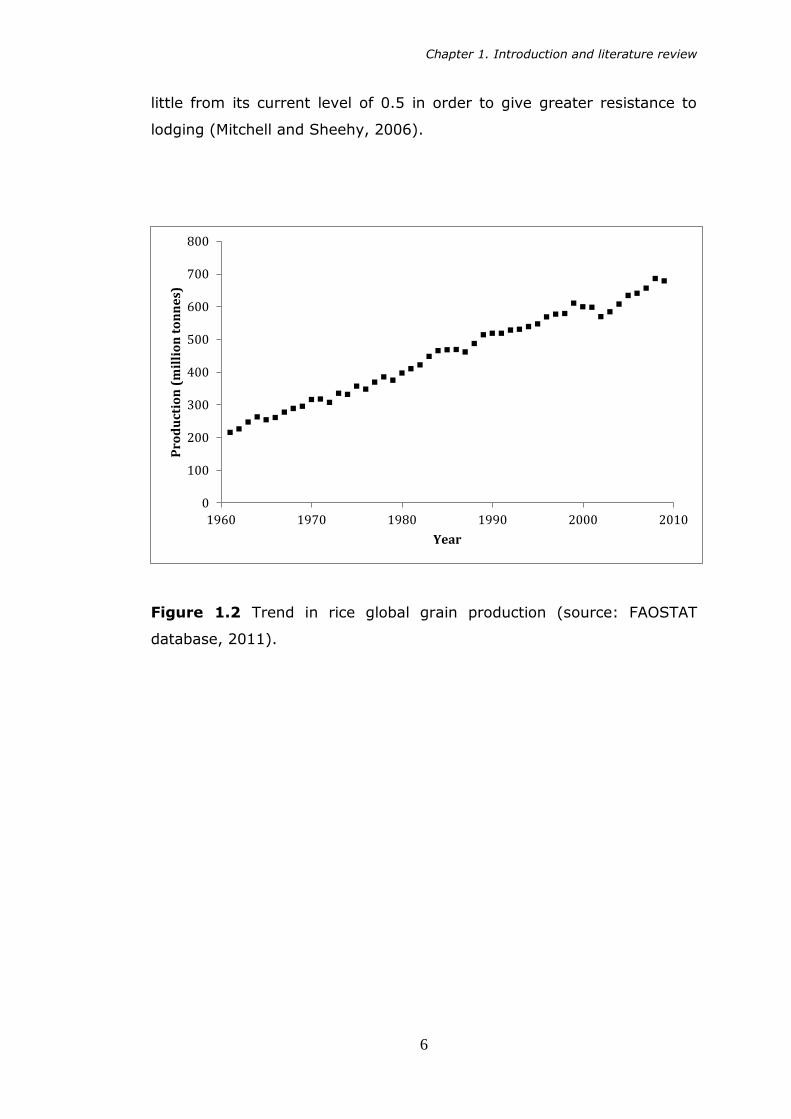
“misery for hundreds of millions” (Cantrell 2000). Current annual global
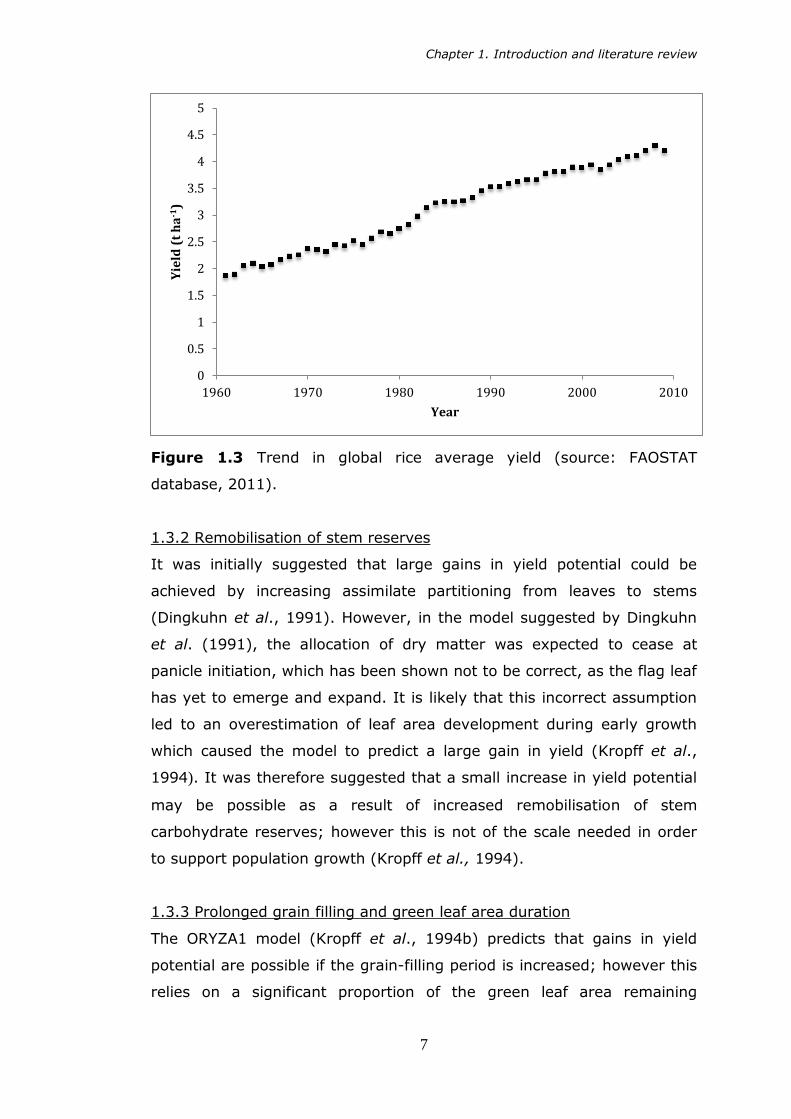
rice production is almost 679 million tonnes and average yield is 4.2
tonnes ha-1 (FAOSTAT, 2009).
1.2 Improving Production
There are numerous possible strategies that may be taken in order to
improve food production from crops, including the reduction of pre- and
post-harvest losses, increasing the area of land under cultivation and,
perhaps most challengingly, increasing crop yield per hectare. Increases
in workable arable land area provided the basis of increases in production
as the world population rose toward the three billion mark around 1960
(Evans, 1998). However, currently the area of cultivated land is fairly
stationary (Figure 1.1) due to increasing urbanisation so this no longer
represents a strategy permissible to further agricultural production.
Increasing levels of erosion and competition for land from biofuels may
Chapter 1. Introduction and literature review
4
also contribute to a reduction in available agricultural land (Hibberd et
al., 2008).
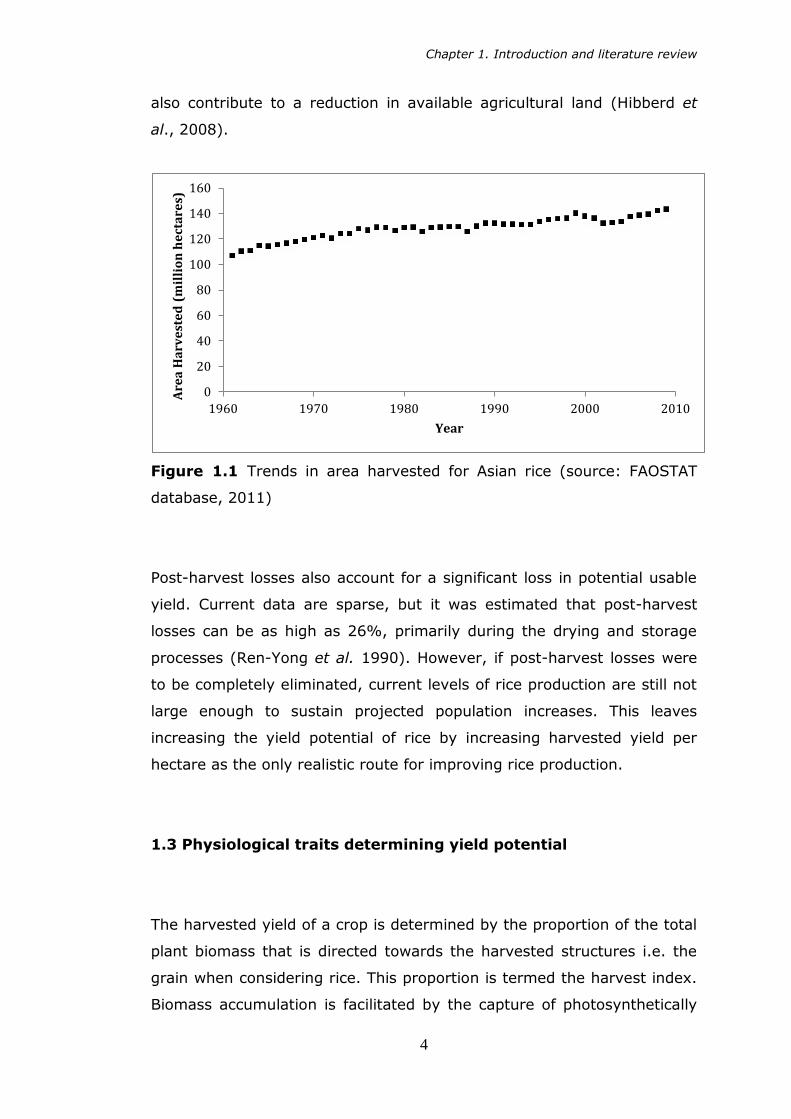
Figure 1.1 Trends in area harvested for Asian rice (source: FAOSTAT
database, 2011)
Post-harvest losses also account for a significant loss in potential usable
yield. Current data are sparse, but it was estimated that post-harvest
losses can be as high as 26%, primarily during the drying and storage
processes (Ren-Yong et al. 1990). However, if post-harvest losses were
to be completely eliminated, current levels of rice production are still not
large enough to sustain projected population increases. This leaves
increasing the yield potential of rice by increasing harvested yield per
hectare as the only realistic route for improving rice production.
1.3 Physiological traits determining yield potential
The harvested yield of a crop is determined by the proportion of the total
plant biomass that is directed towards the harvested structures i.e. the
grain when considering rice. This proportion is termed the harvest index.
Biomass accumulation is facilitated by the capture of photosynthetically
0
20
40
60
80
100
120
140
160
1960 1970 1980 1990 2000 2010
Are
a H
arv
est
ed
(m
illi
on
he
cta
res)
Year
Chapter 1. Introduction and literature review
5
active radiation (PAR, 400-700nm), which is then used in photosynthesis.
The effectiveness of the use of radiation is quantified as the radiation use
efficiency (RUE), the amount of dry matter produced per unit of PAR
intercepted (Monteith, 1977). Summarizing this, Mitchell and Sheehy,
(2006) produced the following equation:
Equation 1.1
∑
where Y the grain yield (g m-2), HI is the harvest index, ε is RUE (g MJ-1),
n is the duration of growth (days), Qi is the PAR on the crop on the ith
day (MJ m-2) and fi is the fraction of incident PAR intercepted on the ith
day. Increasing any of the terms in this equation can increase
harvestable yield.
1.3.1 Harvest index
During the 20th century, major advances in the production of crops with
high yield potentials were brought about with the production of semi-
dwarf varieties, which had reduced plant height and increased harvest
index (HI) i.e. the ratio of above ground dry matter to grain yield. This
period of crop improvement during 1960s and 1970s became known as
the „Green Revolution‟, and the cultivars produced during this period
have come to dominate Asian rice production. The Green Revolution
allowed rapid increases in production and yield throughout the late 20th
century (Figures 1.2 and 1.3). However it is now thought that harvest
index in rice is approaching an optimal level, and Green Revolution
related gains have all but ceased (Kropff et al., 1994, Mitchell and
Sheehy, 2006, Hibberd et al., 2008), or may even have to decrease a
Chapter 1. Introduction and literature review
6
little from its current level of 0.5 in order to give greater resistance to
lodging (Mitchell and Sheehy, 2006).
Figure 1.2 Trend in rice global grain production (source: FAOSTAT
database, 2011).
0
100
200
300
400
500
600
700
800
1960 1970 1980 1990 2000 2010
Pro
du
ctio
n (
mil
lio
n t
on
ne
s)
Year
Chapter 1. Introduction and literature review
7
Figure 1.3 Trend in global rice average yield (source: FAOSTAT
database, 2011).
1.3.2 Remobilisation of stem reserves
It was initially suggested that large gains in yield potential could be
achieved by increasing assimilate partitioning from leaves to stems
(Dingkuhn et al., 1991). However, in the model suggested by Dingkuhn
et al. (1991), the allocation of dry matter was expected to cease at
panicle initiation, which has been shown not to be correct, as the flag leaf
has yet to emerge and expand. It is likely that this incorrect assumption
led to an overestimation of leaf area development during early growth
which caused the model to predict a large gain in yield (Kropff et al.,
1994). It was therefore suggested that a small increase in yield potential
may be possible as a result of increased remobilisation of stem
carbohydrate reserves; however this is not of the scale needed in order
to support population growth (Kropff et al., 1994).
1.3.3 Prolonged grain filling and green leaf area duration
The ORYZA1 model (Kropff et al., 1994b) predicts that gains in yield
potential are possible if the grain-filling period is increased; however this
relies on a significant proportion of the green leaf area remaining
0
0.5
1
1.5
2
2.5
3
3.5
4
4.5
5
1960 1970 1980 1990 2000 2010
Yie
ld (
t h
a-1
)
Year
Chapter 1. Introduction and literature review
8
photosynthetically active throughout this stage, a situation that does not
naturally occur. Senescence would need to be considerably delayed and
leaf nitrogen status maintained throughout this period to be effective
(Kropff et al., 1994). Further to this, and perhaps more importantly,
there is generally little interest in increasing the growth duration as
current durations are timed to coincide with suitable weather conditions
or to allow multiple crops per year (Mitchell and Sheehy, 2006).
1.3.4 PAR
Increasing the incident PAR is obviously not possible without selecting
sunnier locations or growing seasons or reliance on artificial lighting
(which is impractical and most often impossible). It is also thought that
intensively grown rice is as close to intercepting as large a fraction of the
incident PAR as is possible, given the constraints of being an annual crop
and so establishing from bare ground (Mitchell and Sheehy, 2006).
1.3.5 Increased sink size
Using both new plant types of the japonica germplasm of rice and current
high yielding rice varieties, Sheehy et al. (2001) investigated the effects
of increasing sink size on yield in rice. In both cases, the model predicted
that if all juvenile spikelets had been converted to filled grains a yield
potential more than double the observed yield would be reached.
However, many juvenile spikelets were lost and grains were not filled.
This reduction in observed yield compared to yield potential was still
demonstrated even in well fertilised crops grown at current atmospheric
CO2 concentrations, therefore suggesting that grain yield is limited by the
supply of resources necessary for its production, rather than any lack of
sink capacity. As well fertilised plants showed the same effect, it seems
reasonable that photosynthesis is the limiting factor in resource supply.
Chapter 1. Introduction and literature review
9
1.4 Photosynthesis as a limiting factor
In C3 species such as rice, carbon fixation occurs in a cyclical process
known as the Calvin cycle. The primary fixation of carbon dioxide in the
Calvin cycle occurs when CO2 is conjugated with the five carbon sugar
ribulose bisphosphate (RUBP), forming a highly unstable six carbon
intermediate, which undergoes almost immediate spontaneous
decomposition to form two molecules of phosphoglycerate, which in turn
are converted to glycerate 3-phosphate (GALP). GALP is reduced using
NADH and ATP to regenerate RUBP, and thus the Calvin cycle continues.
This conjugation of CO2 and RUBP is catalysed by the enzyme Rubisco
(ribulose 1,5, bisphosphate carboxylase / oxygenase), and it is the
inefficiency of this enzyme that has promoted the evolution of C4
photosynthesis within plants.
Rubisco is one of the great enigmas of evolutionary biology. Firstly, it
is a very slow acting enzyme, which means that Rubisco is present in
extremely high concentrations in the chloroplast stroma at approximately
1.68g m-2 leaf tissue (Jin et al., 2006). Secondly, Rubisco also has the
ability to fix oxygen, as well as carbon dioxide; thus Rubisco is regarded
as an oxygenase as well as a carboxylase. Oxygenase activity is favoured
over carboxylase activity at higher temperatures and oxygen
concentrations. The fixation of oxygen results in the production of
phosphoglycolate, an apparently functionless substance that is entered
into the photorespiration cycle to recover some of the carbon wasted
within the molecule (Muhaidat et al., 2007).
Chapter 1. Introduction and literature review
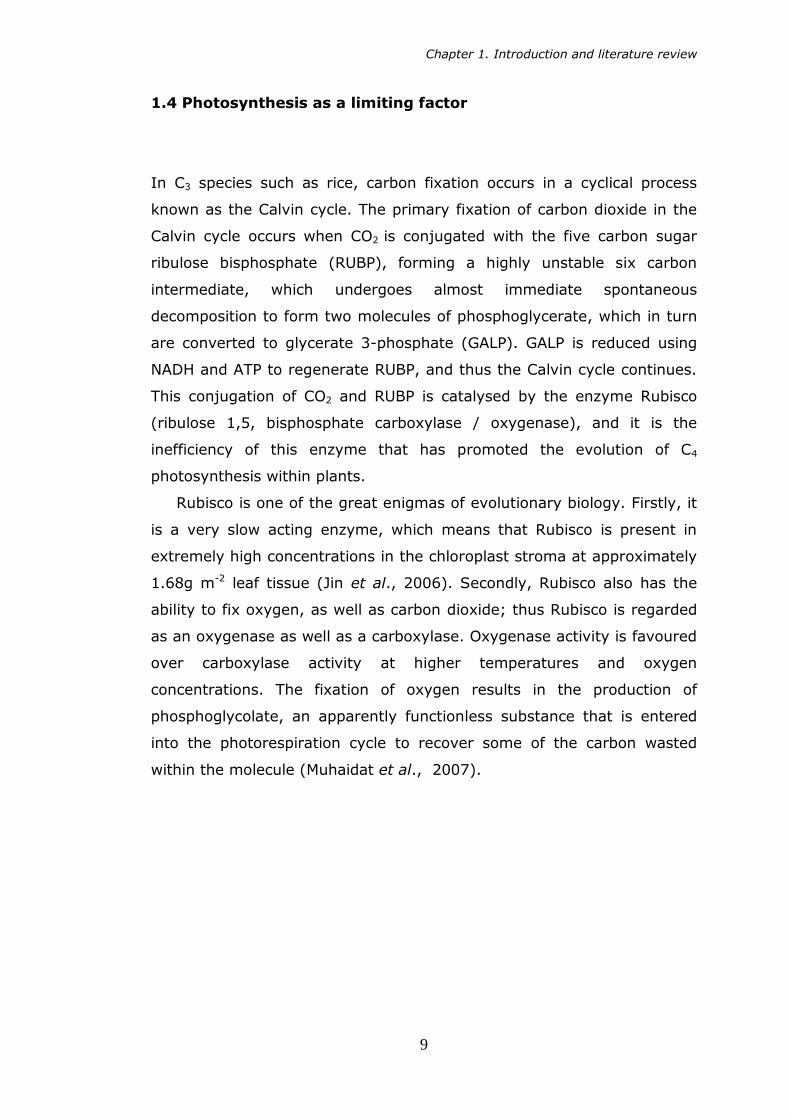
10
Figure 1.4 Schematic showing the photorespiratory cycle. C, chloroplast;
M, mitochondrion; P, peroxisome. Taken from von Caemmerer and Evans
(2010).
As a C3 plant grown under tropical conditions, Asian rice has
significant level of photorespiration due to the high temperatures at
which it grows. Given current atmospheric CO2 concentrations, at a
temperature of 30oC, approximately 33% of the total level of Rubisco
within a photosynthesising rice plant may be functioning as an
oxygenase, thus representing a significant loss of CO2 fixation to the
plant and major limiting factor of photosynthesis (Evans and von
Caemmerer, 2000). This correlates to an estimated reduction in the
productivity of C3 crops by over 30% (Ogren, 1984; Zhu et al. 2004).
1.5 Potential Improvements to Rice Photosynthesis
As Rubisco appears to be a major limiting factor to photosynthesis in C3
plants grown under tropical conditions, and there is no known alternative

Chapter 1. Introduction and literature review
11
to this enzyme in the fixation of CO2 in the Calvin cycle (Sage, 2004), the
options for the improvement of photosynthesis appear somewhat limited.
Increasing the level of Rubisco in leaves could provide a method for
increasing photosynthetic capacity; however this would not represent any
gain in efficiency so improvements would still be severely limited by
photorespiration. Also given that Rubisco already accounts for up to 50%
of the soluble protein within leaves, further increases would require
greater inputs of soil nitrogen. As improvements to rice yield would be of
benefit to some of the world‟s poorest people, yield improvements
requiring large amounts of nitrogen fertiliser would be inappropriate in
terms of both economic and environmental sustainability (Mitchell and
Sheehy, 2006). Further to this, leaves may be lacking the physical
capacity for increased levels of Rubisco without some redesigning of leaf
anatomy, as it has been shown in wheat that chloroplast number is
closely correlated to cell size (Pyke and Leech, 1987).
There are species of red algae that produce a Rubisco which displays
a much greater specificity for CO2 relative to O2. Unfortunately this
improvement in specificity comes at a cost to the maximum rate of
Rubisco activity (Vmax), thus limiting the effect that expressing foreign
Rubisco may have on C3 plants (Zhu et al., 2004).
In an attempt to combat the problem of photorespiration, the C4
photosynthetic pathway has evolved many times, with at least 45
independent cases known, with over 30 lineages displayed by dicots and
15 in monocots (Sage, 2004).
C4 photosynthesis functions by concentrating CO2 around the active
sites of Rubisco, thus almost eliminating photorespiration by competitive
exclusion of O2 (Muhaidat et al., 2007). Some systems are known
whereby a modified version of C4 photosynthesis takes place within single
cells such as Hydrilla verticallata (Reiskind et al., 1997) and Egeria densa
(Casati et al., 2000). However, the low assimilation rate displayed by
such species (Table 1.1) has been highlighted as a cause for concern
(von Caemmerer, 2003). It is therefore suggested that single-celled C4
photosynthesis is capable of permitting some photosynthetic gain under
conditions of extreme favourability towards photorespiration; however, it
appears unsuitable as a system for improving C3 crop productivity.

Chapter 1. Introduction and literature review
12
Table 1.1 Comparison of CO2 assimilation rates (A) between species,
taken from von Caemmerer (2003)
Thus incorporating C4 photosynthesis with a traditional Kranz leaf
anatomy (Section 1.6) into rice appears the most attractive option for the
improvement of rice potential yield. This option becomes even more
attractive given that C4 species often display a highly economic usage of
water and nitrogen. The addition of an entirely new leaf anatomy into rice
represents an enormous challenge; however, it is thought that the risks
of such a project are well outweighed by the possible rewards (Mitchell
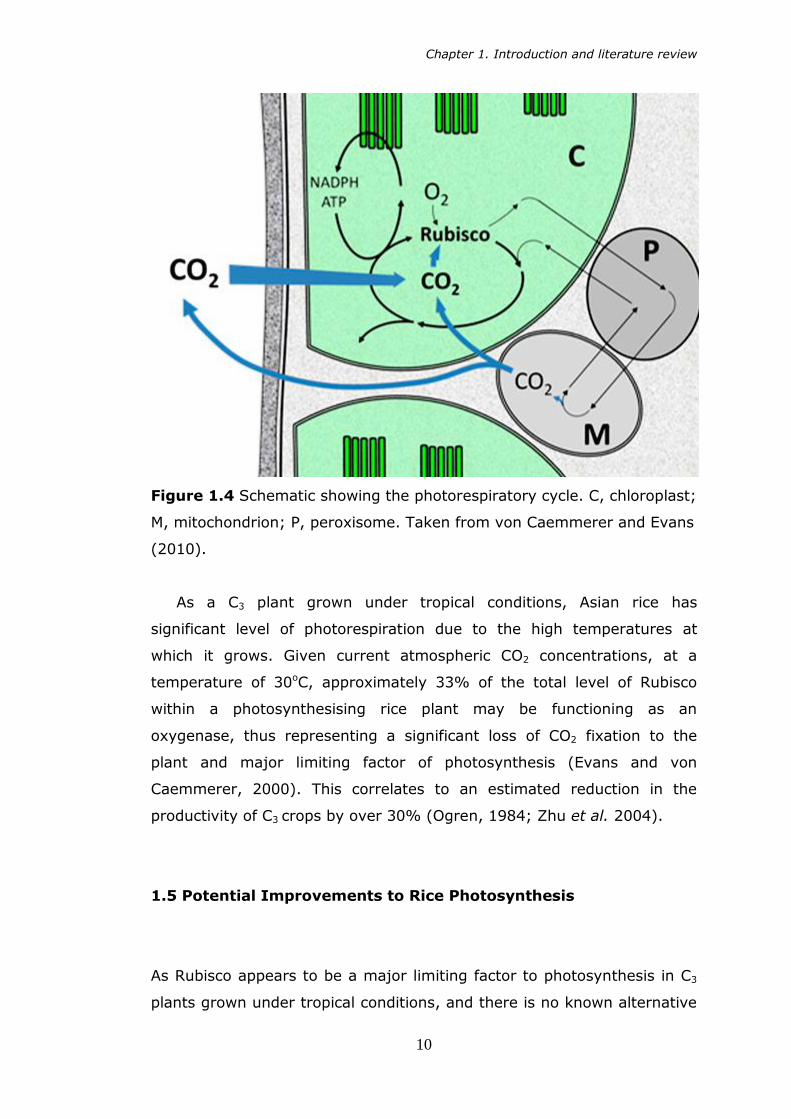
and Sheehy, 2007). Table 1.2 shows the radiation use efficiency (RUE) of
rice compared to C3 (wheat) and C4 (maize, sorghum) crops. This
highlights the poor RUE of rice, and the potential gains that could be
achieved if a C4 system similar to that in maize was to be introduced into
rice leaves.
Chapter 1. Introduction and literature review
13
Table 1.2 Radiation Use Efficiency (RUE) for above ground biomass
production in crop plants (adapted from Kiniry et al. 1989).
Crop RUE (g MJ-1) RUE/ RUE rice
Maize 3.5 1.59
Sorghum 2.8 1.27
Wheat 2.8 1.27
Rice 2.2
1.6 Characteristics of C4 Photosynthesis
1.6.1 The C4 pathway
The bundle sheath is a layer of parenchyma tissue surrounding the
vascular bundles, which acts as a conduit between the mesophyll cells
and the vasculature system of a plant (Leegood, 2008). Amongst their
many functions, the bundle sheath cells are required to maintain
hydraulic integrity in order to prevent air entering the xylem, as well as
regulating the fluxes of compounds into and out of the leaf.
In C3 plants, despite the bundle sheath cells typically containing fewer
and smaller chloroplasts (Kinsman and Pyke, 1998), both mesophyll and
bundle sheath cells are equivalent in terms of photosynthetic pathway, in
that atmospheric CO2 is assimilated using Rubisco and reduced within the
Calvin cycle (Dengler and Taylor, 2000). It is this exposure of the
Rubisco to atmospheric oxygen that provides opportunity for
photorespiration. By spatially separating C3 activity into the bundle
sheath cells using the mesophyll cells to provide CO2 via the C4 pathway,
a ten-fold rise in [CO2] over atmospheric [CO2] can be produced in the
bundle sheath cell chloroplasts (Figure 1.5, 1.6), providing an effective
method of suppressing photorespiration (Edwards and Walker, 1983).
C4 photosynthesis is thought to have evolved independently more
than 45 times in 19 families of angiosperms (Sage, 2004), and therefore
there is some variation in the pathway from species to species, although
in all cases the primary fixation of inorganic carbon involves

Chapter 1. Introduction and literature review
14
carboxylation of phosphoenolpyruvate (PEP) by the enzyme PEP
carboxylase in the mesophyll cells. PEP carboxylase is expressed in all
plants, but levels in C4 plants may be twenty-fold those observed in C3
species. Further to this, Stockhaus et al. (1997) were able to show that
this increase in expression is localised only to the mesophyll cells by use
of transgenic plants containing the β-glucuronidase reporter gene (Figure
1.5). In C3 species PEP carboxylase is known to be involved in a variety
of different functions, including stomatal opening, seed maturation and
fruit ripening (Miyao and Fukayama, 2003).
Figure 1.5 Histochemical staining of GUS activity showing the blue
appearance of cells expressing PEP carboxylase in the C4 plant Flaveria
bidentis. e, epidermis; bs, bundle sheath; m, mesophyll; sp, spongy
parenchyma. Bar denotes 500µm. Taken from Stockhaus et al. (1997).
Following carboxylation of PEP, oxaloacetic acid (OAA) is formed. OAA is
highly unstable and
therefore does not usually accumulate in significant quantities, so for this
reason is converted to other substances for transport to the bundle
sheath cells. Three variants of this transport system have evolved,
although all are similar in concept:

Chapter 1. Introduction and literature review
15
1. Nicotinamide adenine dinucleotide phosphate malic enzyme (NADP
– ME), where OAA is converted to malate, which undergoes
decarboxylation by NADP – ME in the bundle sheath chloroplasts.
2. Nicotinamide adenine dinucleotide malic enzyme (NAD – ME),
where malate undergoes decarboxylation by NAD – ME in the
bundle sheath mitochondria
3. Phosphoenolpyruvate carboxykinase (PCK), where decarboxylation
occurs in the bundle sheath cytosol (as well as some NAD – ME
activity in the mitochondria.
In all cases, C4 acids freely diffuse from the mesophyll cells where they
are produced into the bundle sheath cells (via the plasmodesmata) where
they undergo decarboxylation. The released CO2 is reassimilated by
Rubisco and entered into the Calvin cycle. Pyruvate (in the NADP-ME
subtype) or alanine (in the NAD-ME subtype) produced following
decarboxylation of the C4 acids diffuses back to the mesophyll cells where
they are converted back to PEP and recycled.

Chapter 1. Introduction and literature review
16
Figure 1.6 Simplified schematic of the C4 pathway demonstrating the
fixation of atmospheric CO2 in the mesophyll cell chloroplasts by PEP
carboxylase before transfer of the 4 carbon compound to the bundle
sheath chloroplasts. Decarboxylation occurs and CO2 enters into the
Calvin cycle, whilst PEP is returned to the mesophyll cells.
1.6.2 Anatomical adaptations for C4 photosynthesis
Although single celled C4 photosynthetic systems do exist, as stated in
Section 1.5, these does not appear to be of much benefit within a crop
system, so for this reason this section will focus on the more typical
Kranz anatomy (Hatch, 1987). There is significant variation in basic
Kranz leaf architecture between various C4 plant families, although there
are a number of features that can be considered essential to the process
of C4 photosynthesis and are invariably present in C4 species (Sage,
2004). These are the structural specialisation of two separate
photosynthetic cell types (bundle sheath cells and mesophyll cells),
maximised contact between these two cell types, and limited CO2 leakage
from the bundle sheath cells. In C4 plants, the bundle sheath is typically
enlarged compared to C3 plants and contains a greater number of
chloroplasts. Chloroplasts are centrifugally positioned, as shown in Figure

Chapter 1. Introduction and literature review
17
1.7C (Dengler and Taylor, 2000). This increase in the number of
chloroplasts present in the bundle sheath (and hence the increase in size
of the cells as a whole) is required to facilitate the increased levels of
photosynthesis taking place within the tissue. An asymmetric distribution
of chloroplasts throughout the cytosol ensures that chloroplasts are
located where the CO2 concentration is highest (i.e. next to the
mesophyll cells), helping to further minimise photorespiration and speed
up CO2 uptake by minimising the distance that it is required to diffuse
across (Kobayashi et al., 2009)
Figure 1.7 Representation of differences between C3 and C4 plant
anatomy. Taken from Leegood et al. (2000). A) Demonstrates the
increase in vein density in C4 plants compared to C3, B) shows the close
arrangement of mesophyll and bundle sheath cells in C4 leaves, and C)
demonstrates the centrifugal positioning and increase in number of
chloroplasts within the C4 bundle sheath.
Chapter 1. Introduction and literature review
18
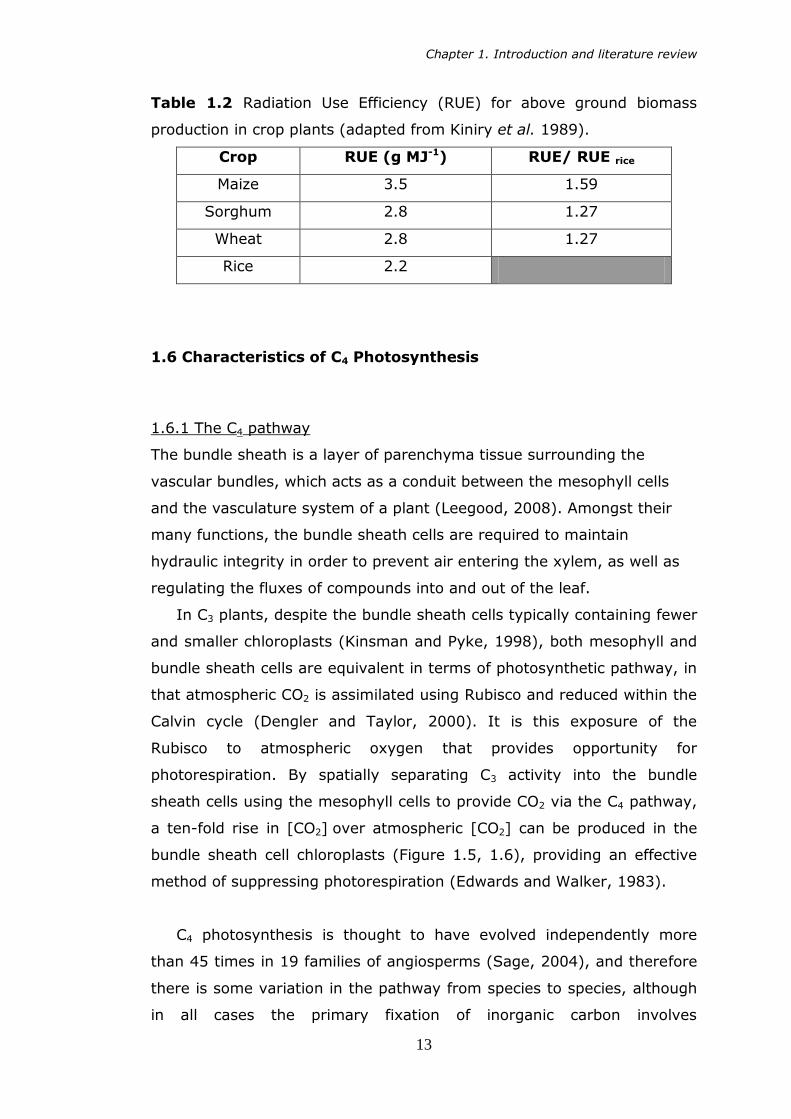
In order to maximise the rate of diffusion of C4 acids between mesophyll
and bundle sheath cells, contact between the two cell types is
maximised. Mesophyll cells are often in a radial arrangement around the
bundle sheath, typically allowing each mesophyll cell to be in contact with
a bundle sheath cell. There are also large numbers of plasmodesmata
crossing the bundle sheath / mesophyll cell wall, providing an easy route
for the diffusion of metabolites. As each mesophyll cell is in contact with
a bundle sheath cell, and bundle sheath cells are located around the
vascular tissue, there are typically very few mesophyll cells between each
vascular bundle and veins are closer together in C4 species (Leegood et
al., 2000).
In order to prevent a drop in [CO2] within the bundle sheath cell, and
thus potentially risk elevated levels of photorespiration, carbon dioxide
leakage from the bundle sheath is minimised. Many C4 species have a
layer of suberin in the lamella of the bundle sheath cell wall, which is
thought to make it impermeable to CO2. Although often observed, this
cannot be considered a requirement of C4 leaf structure, as this
suberinised layer is not present in all C4 species (Sage, 2004). The total
volume of intercellular airspace is also reduced in C4 plants, as is the
exposure of the bundle sheath to the intercellular airspace. This
minimises the risk of diffusion of CO2 out through the cell walls of the
bundle sheath, as a reduced cellular [CO2] compared to the surrounding
cells is maintained by consuming it in the Calvin cycle (Dengler et al.
1994).

Chapter 1. Introduction and literature review
19
1.6.3 Physiological consequences of C4 photosynthesis
There is such a different response to varying concentration of CO2
between C3 and C4 species that it is a useful indicator when trying to
identify C4 photosynthesis (Downton and Tregunna, 1968). There are
three major points where C3 and C4 responses differ (Edwards and
Walker, 1983):
1. CO2 compensation point. This is defined as the [CO2] where gross
photosynthesis is equal to respiration, thus net photosynthesis is
zero. In C4 plants the CO2 compensation point is almost zero
across all temperatures, as the C4 mechanism is able to
concentrate even low levels of atmospheric CO2 to such an extent
that photosynthesis can continue. However the compensation point
for C3 species is typically around 50µmol CO2 mol-1 air at moderate
temperatures, rising to 70µmol mol-1 at 35oC as the effects of
photorespiration become more pronounced (Sage et al., 1990).
2. As [CO2] increases, the rate of increase in assimilation initially
increases more sharply in C4 plants than C3, due to the higher
activity of PEP carboxylase at cellular pH than Rubisco (Edwards
and Walker, 1983)
3. At temperatures around 15OC or higher, CO2 saturation of Rubisco
occurs at much lower concentrations in C4 plants than C3, and is
sharply delineated, whereas in C3 it is not. This is due to limitations
in either the activity of Rubisco or PEP carboxylase, the
regeneration of these enzymes or any combination of these
factors. Examples of all four have been described (von Caemmerer
and Furbank, 1999). This response is also shown by plants grown
in CO2 rich environments, such as during the initial evolution of
higher plants, which favoured C3 species at a time when
atmospheric [CO2] was significantly greater than the present
(Sage, 2004).

Chapter 1. Introduction and literature review
20
These responses are demonstrated in the form of an A/Ci curve in Figure
1.8, which plots net CO2 assimilation (A) versus sub-stomatal CO2
concentration (Ci).
Figure 1.8 Typical A/Ci curve for C3 and C4 plants showing the three
major points of variance outlined above. Taken from Sage and Pearcy
(2000). 1) demonstrates the lower CO2 compensation point displayed by
C4 plants, 2) shows the sharp increase in A as [CO2] rises and 3) shows
the elevated maximum A (Amax) demonstrated by C3 plants at high [CO2].
There are also large differences in quantum yield between C3 and C4
species. Quantum yield is the ratio of fixed CO2 to absorbed photons.
Maximum quantum yield is generally measured because it allows direct
comparison of the energy costs of C3 and C4 photosynthetic systems. In
the absence of oxygen, when photorespiration is eliminated, the quantum
yield of C4 plants is 20 – 30% of the level in their C3 counterparts due to
the extra ATP cost of regenerating PEP. However, under normal
atmospheric conditions, quantum yield is approximately equal between
25-30oC. Above 30oC the oxygenase activity of Rubisco is increased
Chapter 1. Introduction and literature review
21
further and photorespiration becomes significant, meaning that C4 plants
demonstrate a higher yield. However, below 25oC when levels of
photorespiration are less significant C3 photosynthesis becomes more
efficient.
1.7 Leaf Development
Leaves are initially formed in the shoot apical meristem (SAM), a
population of stem cells which maintain a high rate of cell proliferation
(Veit, 2004). Cells on the flanks of the SAM differentiate to form the leaf
and stem tissue, whilst some of the daughter cells generated retain their
function as stem cells and remain within the SAM. The balance of the
total number of cells produced versus the cells integrated into the
emerging leaf and stem determine the size of the SAM (Fleming, 2005).
In the SAM of rice, leaves are initiated on opposing sides of the SAM,
which results its alternate phyllotaxy.

Chapter 1. Introduction and literature review
22
Figure 1.9 A) young rice plant. The leaf sheath forms around the culm,
with the leaf blade emerging at the collar. B) li, ligule; au, auricle of a
rice plant at 70 days post germination, taken from Lee et al. (2007)
The production of leaves in rice was described by Itoh et al., (2005) and
is summarised here. In rice, the emerging leaf primordium is first
observed as a small bulge on the flank of the SAM and then extends
above the apex of the SAM and around the side of it, giving the
primordium a crescent shaped appearance. As cells of the primordium
proliferate, it forms a hood over the SAM, and it is at this stage that the
procambial strand is formed (Figure 1.10).
Chapter 1. Introduction and literature review
23
Figure 1.10 A) The emerging leaf primordium (P1) forming from the
shoot apical meristem (SA) as the P2 primordium forms a hood over the
SAM. B) Extending P1 primordium forming a crescent shape. C) Cross
section of P2 showing early procambial strand (PS) (Itoh et al., 2005).
As the leaf primordium expands laterally around the SAM, the leaf
margins overlap and the SAM becomes enclosed as the leaf blade –
sheath boundary is established.
Figure 1.11 A) SAM enclosed within P3 leaf margins. Arrow denotes the
blade – sheath boundary. B, C) Cross section at blade – sheath boundary
showing formation of the ligule primordium (LP). (Itoh et al., 2005).
Chapter 1. Introduction and literature review
24
Periclinal division of epidermal cells within the blade – sheath boundary
gives rise to the ligule primordium, and at this stage the vascular tissue
begins to form. Xylem and phloem become recognisable within the
midrib, as large and small vascular bundles develop across the leaf width.
It is also at this stage that stomata begin to be formed basipetally from
the distal region of the leaf.
Following differentiation of the ligule primordium, the leaf blade quickly
reaches its maximum length as a result of rapid elongation, at which
point the leaf sheath also rapidly elongates, a process which is
suppressed until leaf blade elongation has been completed. As the leaf
sheath elongates, differentiated bulliform and stomatal cells are visible
from the leaf apex and vascular bundles mature, to the point where the
internal structures of the leaf are almost complete as the leaf emerges
from the sheath of the preceding leaf. Once emerged, the leaf bends at
the collar as a result of uneven elongation of the cells to give the leaf
angle.
1.8 Previous Work
A limited number of studies have shown that plants displaying alterations
to vein patterning and spacing can be produced, however such work has
primarily been carried out using C4 species. Fladung (1994) exposed seed
of the C4 plant Panicum maximum (Jacq.) to the mutagen EMS in order to
isolate variants in the progeny by basis of visual inspection.
Chapter 1. Introduction and literature review
25
Chapter 1. Introduction and literature review
26
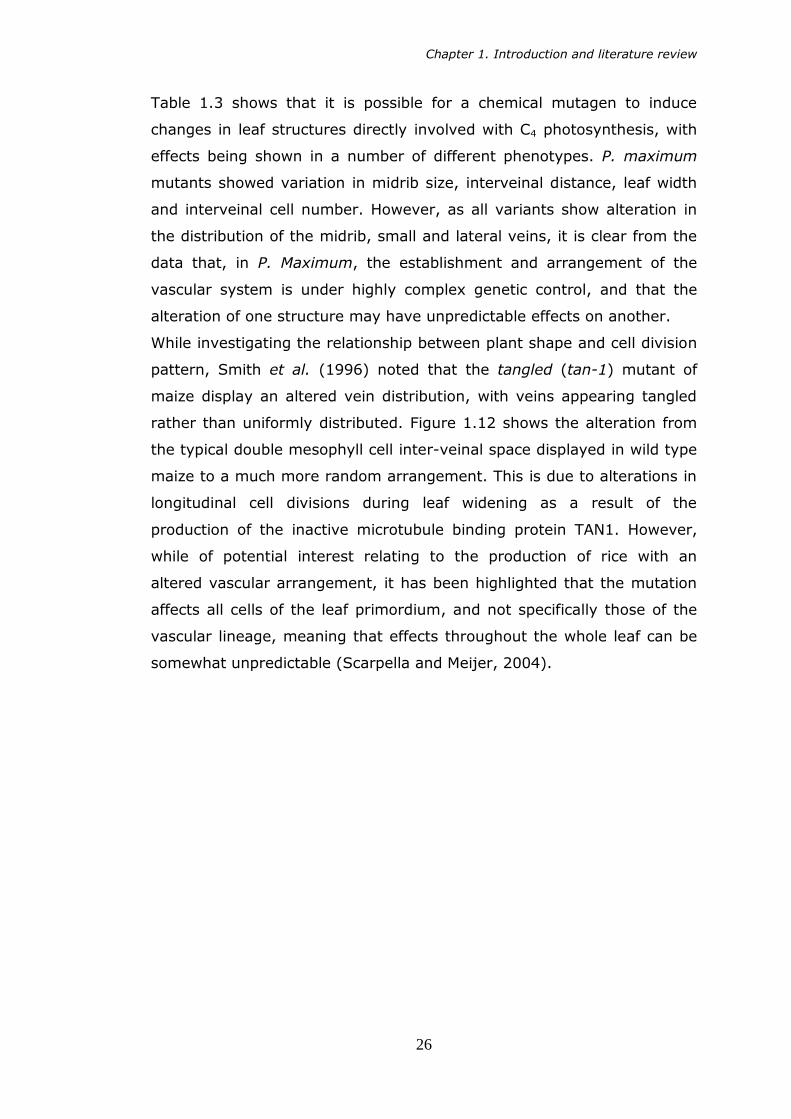
Table 1.3 shows that it is possible for a chemical mutagen to induce
changes in leaf structures directly involved with C4 photosynthesis, with
effects being shown in a number of different phenotypes. P. maximum
mutants showed variation in midrib size, interveinal distance, leaf width
and interveinal cell number. However, as all variants show alteration in
the distribution of the midrib, small and lateral veins, it is clear from the
data that, in P. Maximum, the establishment and arrangement of the
vascular system is under highly complex genetic control, and that the
alteration of one structure may have unpredictable effects on another.
While investigating the relationship between plant shape and cell division
pattern, Smith et al. (1996) noted that the tangled (tan-1) mutant of
maize display an altered vein distribution, with veins appearing tangled
rather than uniformly distributed. Figure 1.12 shows the alteration from
the typical double mesophyll cell inter-veinal space displayed in wild type
maize to a much more random arrangement. This is due to alterations in
longitudinal cell divisions during leaf widening as a result of the
production of the inactive microtubule binding protein TAN1. However,
while of potential interest relating to the production of rice with an
altered vascular arrangement, it has been highlighted that the mutation
affects all cells of the leaf primordium, and not specifically those of the
vascular lineage, meaning that effects throughout the whole leaf can be
somewhat unpredictable (Scarpella and Meijer, 2004).

Chapter 1. Introduction and literature review
27
Figure 1.12 Transverse sections of A) wild type B) and tan-1 adult
maize leaves. m, mesophyll cell; v, vascular bundle; bs, bundle sheath
cell. Adapted from Smith et al. (1996).
In monocots there are very few mutations known to produce specific
vascular pattern defects (Scarpella and Meijer, 2004); however, of the
few found, one has been identified in rice. Scarpella et al. (2003)
described the radicleless1 (ral1) mutant as displaying a defective auxin
response with an enhanced cytokinin sensitivity. This causes defects in
the procambium and results in a reduced distance between veins (Figure
1.13). However, the number of large veins, and the continuity and
frequency of transverse veins is reduced, the effects of which are not
stated.

Chapter 1. Introduction and literature review
28
Figure 1.13 Transverse sections through A) wild type and B) ral1 leaves
adapted from Scarpella et al. (2003). bs, bundle sheath cell; lv, large
vascular bundle; sv, small vascular bundle. Scale bars represent 50µm.
1.9 Screening for Indicators of C4 Photosynthesis
As mentioned earlier, the creation of C4 rice represents a huge challenge.
The initial studies described in this thesis involve searching for small
changes to the rice leaf anatomy which may be utilised in the creation of
a typical Kranz anatomy. Rice shows great potential as a model organism
for monocotyledonous plants, especially given the publication of the draft
rice genome sequence (Yu et al., 2002). As a species, it has a small
genome compared to other cereals of approximately 430Mb and it is
relatively easy to transform, both classic indicators of a model species
(Hirochika et al., 2004). Coupled with this, the huge economic
importance of rice make it an ideal species to work with. Also, the rice
genome seems particularly able to withstand large numbers of genetic
lesions without proving fatal for the plant, thus allowing genome wide
saturation of mutations in a relatively small number of lines (Wu et al.,
2005).
This study aimed to identify mutant lines of the indica rice IR64 which
display characteristics tending towards a typical Kranz anatomy in a
forward screen to identify anatomical and physiological mutations after
which molecular approaches can be employed to search for the altered
Chapter 1. Introduction and literature review
29
genes causing the new phenotype. IR64 represents an ideal model rice
line to work with as it is one of the most widely grown cultivars in South
and South East Asia, owing mainly to its many positive agronomic
qualities such as high yield potential, good eating quality and disease
resistance. The mutant lines were produced as described in Wu et al.
(2005) by the use of four mutational agents selected on the basis of
producing a spectrum of genetic lesions. Gamma ray radiation induced
mutation was used to produce lines displaying small deletions and point
mutations, fast neutron radiation produced large deletions and
chromosomal rearrangements, diepoxybutane (DEB) gave small deletions
and point mutations and ethyl methanesulphonate (EMS) – GC to AT
transitions.
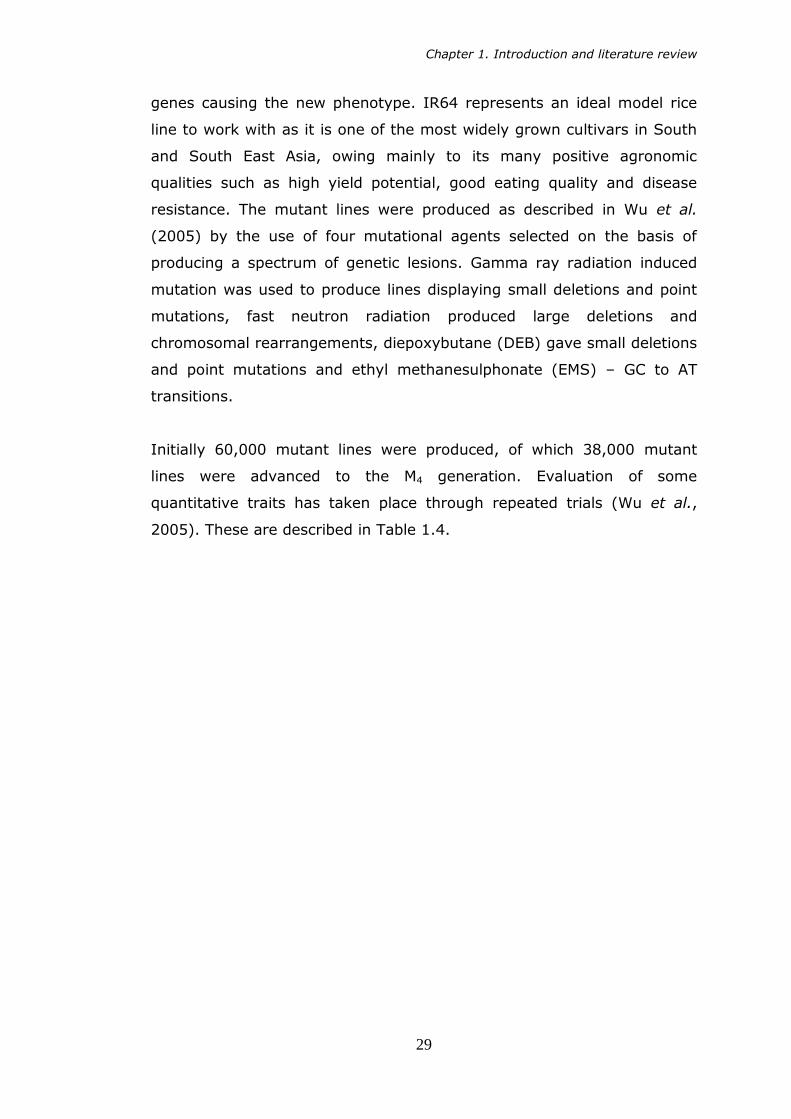
Initially 60,000 mutant lines were produced, of which 38,000 mutant
lines were advanced to the M4 generation. Evaluation of some
quantitative traits has taken place through repeated trials (Wu et al.,
2005). These are described in Table 1.4.

Chapter 1. Introduction and literature review
30
Table 1.4 The frequency of visible mutations of IR64 produced by
different mutagens (Wu et al., 2005)
The seed used in this study was taken from plants identified in the pre-
screening process as possessing either broad or narrow leaves. The
rationale behind this was that lines displaying an altered leaf type such as
broad or narrow leaves have undergone some obvious change in the leaf
structure and may be more likely to reveal novel vein patterns than other
phenotypic groups, for example the low density spikelet group (Erik
Murchie, personal communication).
As suggested earlier, the typical Kranz anatomy is very complex, so it
would be unlikely to find a mutant line displaying it in full. For this
reason, and coupled with the need to screen as many different lines as
Chapter 1. Introduction and literature review
31
possible in the time available, screening was done on the basis of the
most visible characteristics of C4 photosynthesis – primarily vein spacing.
By taking simple hand cut sections and visualising them under a
microscope it was possible to rapidly process large numbers of mutant
lines and compare them in terms of vein spacing to characterised wild
type plants (Chapter 3). Those showing significant variation in vein
spacing and notable morphological features were then regrown and
studied at a later date to characterise the morphological variation at the
cellular level (Chapter 4) and the functional consequences of these
changes (Chapter 5).
Typically, the procambium can be recognised within a developing leaf
primordium very shortly after initiation (Esau, 1965). These then extend
toward the leaf apex so as to form the major and larger minor veins,
whilst the smaller veins (initially discontinuous from the surrounding
vascular tissue) form later (Nelson and Dengler, 1992). As major vein
positioning is set very early in leaf development, it seems likely that this
factor is under a strong genetic control, and that any alteration of
venation patterning may arise as a result of mutation of these genes.
Specific hypotheses to be tested were that lines within the mutant
population display statistically significant variation in vein spacing and in
the number of veins per mm leaf width, and that this is correlated with a
significant alteration in the number of mesophyll cells making up the
interveinal space.
The objectives of this study were to identify mutant lines of rice which
displayed an alteration in vascular spacing and arrangement and identify
the role of the mesophyll cells in determining the observed vascular
anatomy. These lines were then to undergo physiological characterisation
in order to determine the implications of this altered anatomy. The final
aim was to assess the conserved and readily altered features of rice
leaves in order to assess the implications of the potential introduction of
a C4 photosynthetic system into rice plants.

32
Chapter 2
METHODS

Chapter 2. Methods
33
Chapter 2: METHODS
2.1 Seeds used
M4 seeds of mutant lines of the IR64 indica rice cultivar were supplied by
Hei Leung of IRRI and their production is described by Wu et al. (2005).
Prior to dispatch from IRRI, seeds were treated with a post-harvest seed
dressing to prevent fungal infection. Upon arrival at Nottingham seeds
were stored in a cool, darkened room in air-tight containers. Details of
the genetic background of the lines used and the reasons they were
selected are given in Section 3.1.1.
2.2 Growth of plants
All stages of plant growth took place in a growth room maintained at an
air temperature of 27oC with a 12/12 hour dark / light cycle. Day
temperatures reached 35oC under the light source. 400W metal halide
lamps (lamps Siemens, UK; bulbs Osram, Germany) were used to
provide lighting. Prior to each experiment, the growth room was divided
into a grid and quantum sensor (SKP 200, Skye Instruments, UK)
measurements were taken to identify and minimise variation in
irradiance. The position of each container of plants was altered on a daily
basis to minimise the effects of uneven light distribution, with those at
the edge of the room where irradiance was lowest being moved to the
centre, and vice versa.
2.2.1 Seed germination
Seeds were thoroughly washed in distilled water to remove the post-
harvest seed treatments and germinated in 60mm tissue culture dishes
(Greiner Bio-One, UK) on damp filter paper in the growth room under the
above conditions. Tissue culture dishes were sealed with paraffin film
(Parafilm M, Alcan Packaging, UK) in order to prevent fungal
contamination of the seeds and to reduce water loss.
Chapter 2. Methods
34
2.2.2 Plant establishment
Previous preliminary studies had shown that rice plants grown in various
potting media are prone to display significant variation in growth and
rates of development, as well as displaying a greatly increased rate of
seedling mortality (E. Murchie, personal communication). For this reason,
plants were grown hydroponically in 20l plastic containers (pH of
approximately 5.5 adjusted with 8% HCl) using a hydroponic solution
adapted from Murchie et al., (2005). The nutrient solution is shown in
Table 2.1. Stock solutions of nutrients used in the hydroponic mixture
were first prepared from the raw compounds, and were then combined to
make three separate concentrated nutrient solutions. The three separate
solutions were added to the 20l containers as required, but were kept
separate until this point to minimise precipitation of the nutrient
compounds. Concentrated solutions were created rather than simply
adding the stock solutions to the containers to aid with the ease of
measuring, as the amounts of some stock solutions added would be
minute (as little as 0.09ml per 20l).

Chapter 2. Methods
35
Chapter 2. Methods
36
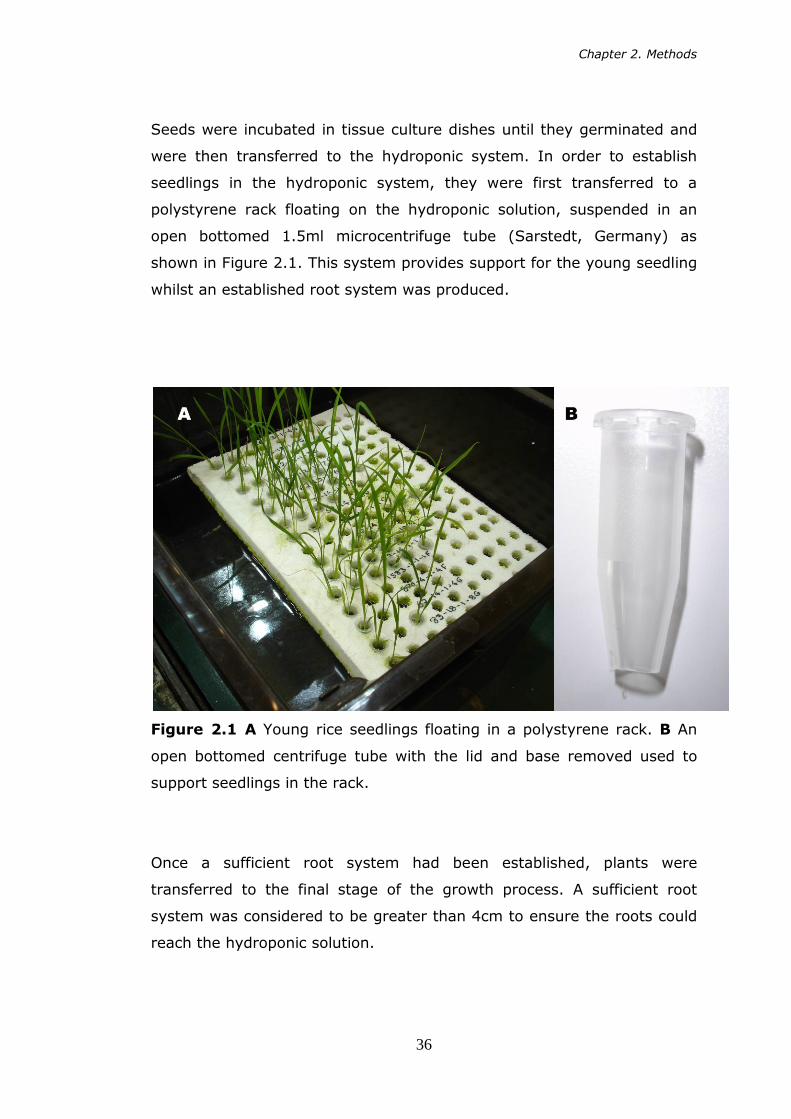
Seeds were incubated in tissue culture dishes until they germinated and
were then transferred to the hydroponic system. In order to establish
seedlings in the hydroponic system, they were first transferred to a
polystyrene rack floating on the hydroponic solution, suspended in an
open bottomed 1.5ml microcentrifuge tube (Sarstedt, Germany) as
shown in Figure 2.1. This system provides support for the young seedling
whilst an established root system was produced.
Figure 2.1 A Young rice seedlings floating in a polystyrene rack. B An
open bottomed centrifuge tube with the lid and base removed used to
support seedlings in the rack.
Once a sufficient root system had been established, plants were
transferred to the final stage of the growth process. A sufficient root
system was considered to be greater than 4cm to ensure the roots could
reach the hydroponic solution.

Chapter 2. Methods
37
Holes 2cm in diameter were drilled in a lightproof plastic support, and
this was rested directly above the hydroponic solution (adapted from
Murchie et al., 2005). A small piece of foam was then wrapped around
the stem of each seedling just above the root in order to hold it in place
within the hole in the plastic support (Figure 2.2).
Figure 2.2 A Wild type and mutant plants growing in hydroponic tanks.
B WT plant in the lightproof support supported with foam.
Each day containers were refilled to their 20l capacity to replace liquid
lost. The amount of solution replaced varied according to the size of the
plants.
Plants were not treated with chemical sprays; however, previous
experiments indicated a slight risk to plants from red spider mite
(Tetranychus urticae). Phytoseiulus persimilis (Syngenta, UK) were
routinely applied as a natural predator to eliminate the red spider mites.
P. persimilis treatment was applied at approximately 4 mites per m-2 in
Chapter 2. Methods
38
accordance with the retailer‟s instructions, which was sufficient to ensure
that no red spider mites were observed.
2.3 Screening
2.3.1 Leaf numbering
Leaf 6 was used for all measurements. This is the sixth leaf to emerge on
the primary tiller, ignoring the seed leaf. Preliminary studies identified
this as a suitable leaf for measurements as it was produced relatively
quickly after germination, is of a suitable width for sampling and rarely
displays chlorotic lesions, unlike leaf 5, which is a likely stress effect as a
result of being transplanted from tissue culture dish to hydroponic
solution.
2.3.2 SPAD measurements
Upon full elongation of leaf 6, SPAD measurements were taken in the
growth room using a SPAD-502 chlorophyll meter (Konica Minolta, UK).
The recorded value was taken as the average of four SPAD
measurements made along the leaf taking care to avoid the midrib. SPAD
is a device which measures absorption of the leaf at wavelengths
corresponding to chlorophyll and is referred to as a chlorophyll meter.
2.3.3 Gross morphology
Observations based upon the whole plant morphology were made,
including the degree of tillering exhibited, leaf size and leaf shape. The
whole plant was photographed and leaf 6 was harvested and scanned
using a flatbed scanner (PCLine, UK) to provide a record of leaf area and
shape.
2.3.4 Microscopy
Fresh transverse sections of rice leaf were cut by hand from the widest
part of the freshly excised sixth leaf in distilled water using a sharp one-
sided razor blade. The leaf was first cut across the widest part in order to
create a clean edge and leaf width at this point was recorded. The cut

Chapter 2. Methods
39
leaf was then held in place with the thumb of one hand and submerged in
a shallow covering of distilled water. Holding a fresh one-sided razor
blade in the other hand, transverse sections were then taken as thinly as
possible from the cut end of the leaf, using the thumb nail as a guide but
ensuring to keep the blade clear of the thumb itself. Blades were replaced
regularly as contact with the water quickly caused them to tarnish.
The cut sections were then placed on a glass slide, mounted in a drop of
distilled water and covered with a cover slip. Once mounted sections
were examined using a light microscope at 10x magnification (Vickers
Instruments, UK) and imaged using an Infinity2 digital camera
(Lumenera Corporation, Canada). Images were stored as JPEG files and
analyzed using the computer programme Infinity Analyze (Lumenera
Corporation, Canada).
From the transverse sections the numbers of minor and major veins were
counted and their arrangement was recorded. The distinction between
major and minor vein was predominantly based on size, with major veins
appearing significantly larger than minor veins (Figure 2.3 C). After
calibration of the Infinity Analyze software using an image of a graticule,
the vein spacing was measured in the region between the two major
veins closest to the midrib. This region was chosen to allow direct
comparison of vascular spacing in the different mutant lines as a
compromise between throughput of the mutant screen and resolution.
Preliminary work revealed taking measurements across the whole leaf
width to be extremely time consuming, and had the full width of leaves
been sampled it would not have been possible to sample as many
different lines. Leaf thickness was also measured in this region, taking
average measurements across bulliform cells, minor veins and major
veins to give three measurements of leaf thickness.

Chapter 2. Methods
40
Figure 2.3 Examples of hand-cut leaf sections from the mutant screen.
A Wild type rice leaf transverse section showing gross anatomy. BF,
bulliform cells; MN, minor vascular bundle; MJ, major vascular bundle. B
Arrows denote measurements of interveinal distance and vascular bundle
size. C Arrows denote measurements taken of leaf thickness, at the
major vascular bundle, minor vascular bundle and bulliform cells.

Chapter 2. Methods
41
2.3.5 Tissue storage
Leaf samples of approximately 1cm in length were stored in 2.5% (w/v)
gluteraldehyde solution (Sigma-Aldrich, UK) and kept at 4oC in
microcentrifuge tubes, thus preserving the tissue for future reference.
2.4 Detailed anatomical methods
Following the identification of several interesting mutant rice lines in the
screening portion of the study, it was important for them to undergo a
more detailed characterisation than was permitted initially, to quantify
the changes undergone in each line. This was done using a number of
methods.
2.4.1 Tissue fixation, resin embedding and staining
Tissue was taken from the widest portion of the fully expanded 5th leaf of
rice plants cut into strips roughly 10mm long and 5mm wide. Tissue was
then fixed using 4% paraformaldehyde (Sigma-Aldrich, UK) in 100ml of
phosphate buffer solution (PBS). The PBS consisted of 7.4g NaCl, 0.994g
Na2HPO4 and 0.414g NaH2PO4 per l distilled water (chemicals supplied by
Fisher Scientific, UK). For ease PBS was stored as a 10x concentrated
solution, i.e. a 10-fold increase in the concentration of each compound,
and then diluted prior to mixture with the fixative. A small quantity
(0.1% w/v) of each of the detergents Triton X-100 and Tween 20
(supplied by Sigma-Aldrich, UK) was also added to the fixative in order to
ensure full permeation of the fixative into the leaf tissue. Fixation was
initially for a period of 30 minutes under vacuum infiltration. The fixative
was then replaced with fresh fixative solution and the samples left
overnight at 4oC on a rotator at 30rpm (Weiss-Gallenkamp, UK).
The following day, samples were brought back to room temperature
before being washed twice in PBS for a period of 30 minutes each. The
fixed tissue was then dehydrated in an ethanol series (30%, 50%, 70%,
Chapter 2. Methods
42
90%, 100%, 100%) for at least 1 hour at each concentration before resin
infiltration.
The resin embedding technique was adapted from personal
communication with Gema Vizcay-Barrena, University of Nottingham.
Tissue was embedded in TAAB Technovit 7100 (TAAB Laboratories, UK),
which was prepared in accordance with the manufacturer‟s instructions.
Leaf samples were placed into a gelatine capsule mould (TAAB
Laboratories, UK), which were then filled with the resin and allowed to
harden overnight. Once hardened the gelatine mould was dissolved by
placing the resin capsule in warm water for several hours on a magnetic
stirrer. The resin block was then attached to a plastic block using
Technovit 3040 adhesive (TAAB Laboratories, UK) prior to microtome
cutting using a Bright 5040 microtome (Bright Instruments, UK).
5µm thick sections were cut after careful orientation of the block to
ensure that the tissue was cut perpendicular to the leaf surface. Cut
sections were dried onto slides at 30oC and stained using 1% toluidine
blue in 1% disodium tetraborate solution (both supplied by Sigma-
Aldrich, UK) as described by Jellings and Leech (1982) for a period of 15
seconds. Stained sections were then observed at 25x magnification using
a light microscope (Nikon, UK) and imaged using a Leica DFC 320 digital
camera (Leica Microsystems, Germany) using the computer programme
Im50 (Leica Microsystems, Germany). These images were stored as JPEG
files and analyzed using Infinity Analyze as described in Section 2.3.4.
2.4.2 Leaf surface impressions
Leaf surface impressions were taken using the silicon-based impression
resin Coltene President Plus Jet (Colténe Whaledent, Switzerland).
Impressions were taken from the adaxial and abaxial surface of the 5th
leaf at the widest point.
The two components of the resin were mixed in a Petri dish, applied
smoothly to the leaf surface using a spatula and allowed to set
completely before removal. Setting time was approximately 10 minutes

Chapter 2. Methods
43
at room temperature. The resin impressions were then painted with a
layer of clear nail varnish (Rimmel, UK), which once dry, was peeled off
to reveal a replica of the leaf surface. Stomatal density was then
calculated by placing the leaf impression onto a glass slide and observing
it under a light microscope at 20x magnification (Nikon, UK).
The midrib was first located and positioned at the edge of the field of
view. The number of stomata and the number of stomatal rows were
then counted in four adjacent fields of view, starting at the midrib, and
moving out to the leaf margin. Using a graticule, the area of the field of
view was calculated, and the number of stomata per field of view was
converted to stomatal density.
2.4.3 Cleared hand cut sections
In order to observe more detail of leaf structure than was present in the
initial hand cut sections it became apparent that leaf clearing was
required to enable the measurement and quantification of individual
mesophyll or bundle sheath cells. This was because the highly lobed
structure and very dense arrangement of the rice mesophyll cells gave a
continuous green appearance whereby individual cell walls could not be
easily visualised.
Sections were cut by hand as previously described and placed on a
microscope slide in a drop of water. The water was then partially
absorbed by tissue paper and a clearing solution of 85% lactic acid
solution saturated with chloral hydrate (both supplied by Sigma-Aldrich)
was added to the section (Lux et al., 2005). The slide was then heated in
a water bath at 70oC in a covered Petri dish for approximately 45 minutes
before being removed and allowed to return to room temperature in a
fume hood so as to allow dissipation of chloral hydrate fumes. The
clearing solution was then removed using a pipette and the section
washed several times with distilled water.
The cleared sections were then stained using 1% toluidine blue in 1%
sodium tetraborate solution for 15 seconds and washed thoroughly in
Chapter 2. Methods
44
distilled water. Stained sections were then viewed under a light
microscope and imaged and analyzed as described in Section 2.4.1.
2.4.4 Cell separations and chloroplast counting
Cell separations were produced using a method adapted from Pyke and
Leech (1987). Leaf tissue was taken from the widest section of the 5th
leaf of rice mutant plants, and cut into strips approximately 1cm long.
The tissue was then fixed in 4% paraformaldehyde overnight at 4oC. The
fixative was removed and 0.1M NaEDTA (pH 9) added and the tissue was
heated at 60oC for a minimum of 6 hours in a heating block. A reduced
time of 2 hours was used for Arabidopsis samples to avoid causing
complete disintegration of the tissue. Once heated, the pieces of leaf
tissue were placed onto a microscope slide and mounted in the NaEDTA
solution before being mechanically broken up using a pair of forceps until
separation of the tissue was visible. The tissue was imaged using a light
microscope with a Nomarski prism (Nikon, UK) at x40 magnification.
Images were captured as described previously.
Images were analysed using the computer program Infinity Analyze
(Lumenera Corporation, Canada). The software was first calibrated for
measurement using an image taken of a graticule, and then cell
circumference and plan area were calculated by tracing the cell outline
within the software.
2.4.5 Confocal microscopy
Tissue was collected from the widest part of fully expanded 5th leaf of rice
plants and cut into sections approximately 15mm in length. These were
then fixed overnight in 4% paraformaldehyde (Sigma-Aldrich) at 4oC.
Once fixed, tissue was treated with NaEDTA and separated cell
preparations were produced as described previously. Once separated,
cells were imaged using an argon laser and Leica SP2 confocal
microscope (Leica Microsystems, Germany). Excitation was performed at
405nm and fluorescence was detected at 510-252nm and 645-655 to
show autofluorescence of the cell wall and of chlorophyll respectively

Chapter 2. Methods
45
(Furbank et al., 2009). Images were captured using the computer
program Leica Confocal Software (Leica Microsystems, Germany).
2.5 Gas exchange and chlorophyll fluorescence
2.5.1 Response to ambient CO2 concentration
The effects of alteration in atmospheric [CO2] on rice leaf photosynthesis
were measured using a LiCor 6400 XT Infra Red Gas Analyser (IRGA)
(LiCor Biosciences, USA). Photosynthetically active radiation (PAR) was
supplied at 1000µmol m-2. Blue light was provided at 10% of the total
PAR so as to avoid stomatal closure. Block temperature within the LiCor
unit was set at 30oC, and the flow rate of gases was set to 500µm s-1.
The chamber fan was set at “Fast”. CO2 was initially supplied at near
atmospheric concentration (400µmol) before a reduction to low levels
and then rapid elevation. This was done to minimise stomatal responses
during the period of measurement. Measurements were taken in
controlled environment room conditions to avoid causing effects by
moving the plants to the laboratory. Leaves were exposed to each CO2
concentration for a minimum period of one minute and maximum of
three minutes to allow the rate of photosynthesis to stabilise. Reference
and analysis gases from the IRGA were equilibrated (matched) prior to
the recording being taken.
Measurements were taken from the widest section of the fully
expanded 6th leaf of rice plants, and the width of the leaf was noted so
that the area of leaf contained within the cuvette could be calculated at a
later date. More details of the measurement principles and the
atmospheric CO2 concentrations used are provided in Section 5.2.1.
2.5.2 Response to PPFD in terms of gas exchange and chlorophyll
fluorescence
Measurements were taken from the widest section of the fully
expanded 6th leaf of rice plants, and the width of the leaf was noted so

Chapter 2. Methods
46
that the area of leaf contained within the cuvette could be calculated.
Before photosynthetic measurements commenced, the leaves were first
dark adapted. This was done by carefully wrapping catering foil (Terinex,
UK) around the leaf to be sampled to exclude light for a period of one
hour. Measurements of gas exchange and leaf fluorescence were taken
simultaneously using a LiCor 6400 XT (LiCor Biosciences, USA) with leaf
chamber fluorometer attachment. Plants were dark adapted to ensure
that chlorophyll molecules within photosystem II are fully oxidised.
After one hour had elapsed, the leaf was then placed into the cuvette
of the LiCor 6400 XT and the foil cover slipped off the leaf. The leaf was
kept in darkness for a further 15 minutes within the cuvette. CO2 was
supplied to the leaf at 400µmol (near atmospheric levels), block
temperature was set at 30oC, and the flow rate of gases was set to
500µm s-1. The chamber fan was set at “Fast”.
Following dark adaption, the leaf was exposed to a strong pulse of light
to allow calculation of quantum yield, before the leaf was exposed to a
range of PPFD (Table 5.2). Blue light was provided at 10%.
Measurements were taken in controlled environment room conditions to
avoid causing effects by moving the plants to the laboratory. Leaves were
exposed to each PPFD for a minimum period of one minute and maximum
of three minutes in order to allow photosynthetic rates to stabilise.
Reference and analysis gasses from the IRGA were equilibrated
(matched) prior to the recording being taken. More details of the
measurement principles and light intensities used are provided in Section
5.2.2.
2.6 Statistical analysis
Statistical analyses were primarily carried out using analysis of variance
(ANOVA) using the computer program GenStat 12th Edition (VSN
International, UK). In order to check for normality of distribution of the
raw data, residual plots were created and the assumption of normality

Chapter 2. Methods
47
was retained if the plot appeared scattered, with no relationship between
fitted values and residuals. Significance of the difference between means
of groups was reported by the F statistic of the ANOVA test, and P values
of <0.05 were taken as significant.
Where the assumption of normality failed, GenStat was used to
perform regression analysis to compare mutant lines with plants of the
wild type and produce values for mean and standard error of the
difference between means (SED). Dunnett‟s test was then performed
using this data to compare each mutant line with the wild type.

48
Chapter 3
SCREENING THE MUTANT
POPULATION

Chapter 3. Screening the mutant population
49
Chapter 3: SCREENING THE MUTANT POPULATION
3.1 Introduction
The dicotyledonous plant Arabidopsis thaliana has provided a useful
model for plant biologists. This arose as a model species as there is a
large collection of accumulated mutants and genes can be isolated with
relative ease, especially since the publication of its genome sequence
(The Arabidopsis Genome Initiative, 2000). However, the majority of our
staple foods come from cereals – i.e. monocotyledonous plants, which
are significantly different in many aspects of development, and for this
reason a monocotyledonous model plant is highly desirable (Izawa and
Shimamoto, 1996).
As the first crop species with a complete genome sequence (Yu et al.,
2002), rice represents an ideal model plant. Much work has been done to
determine gene function by producing rice mutants using T-DNA and
transposons as these allow relatively easy identification of the target
gene, while chemical and irradiation based mutagenesis have typically
been avoided (Wu et al. 2005). The reason for this is that mutations are
not physically tagged, meaning that once a phenotype has been identified
the effort to isolate the affecting gene(s) has traditionally been
considerable. However high throughput genotyping such as the use of
oligonucleotide arrays has greatly helped to improve the detection of
polymorphisms (Winzeler et al., 2003) and helped to improve the viability
of using deletion mutants in a forward genetic screen. Chemical or
irradiation based mutagenesis can provide genome-wide saturation of
mutations using a relatively small population (Henikoff and Comai,
2003). Further to this, the relative ease with which deletion mutants can
be produced allowed for greater availability of seed, allowing the
possibility of a high throughput forward screen. It is in this context that
the forward screen described in this chapter was conceived.
Chapter 3. Screening the mutant population
50
3.1.1 Genetic background of lines used
Mutant lines of the IR64 indica rice cultivar were supplied by Hei Leung of
IRRI. IR64 was chosen for the creation of an indica rice mutant collection
as it is the most widely grown cultivar in Southeast Asia and possesses a
large number of agronomic traits including high yield potential and
durable disease resistance, along with a large degree of adaptability (Wu
et al., 2005). Mutagenesis was performed using four mutational agents;
gamma ray radiation, fast neutron radiation, diepoxybutane (DEB) and
ethyl methanesulphonate (EMS). Details of the mutagens can be found in
Section 1.7. As outlined in Chapter 1, the mutant collection numbered
approximately 60,000 lines which were pre-screened at IRRI. Of the
entire mutant collection, lines displaying pale, broad or narrow leaves
were selected to work with. The reason for this was that lines displaying
an obvious alteration to leaf structure may be more likely to reveal novel
leaf cellular morphologies than other classes of mutant lines, such as the
low density spikelet group, or those producing broad grain.
When referring to the mutants, numbers are used to represent the
plant number of each generation used to produce the seed, while a letter
is used as a suffix to denote the mutagen used in its production. The
letter D represents DEB, G for gamma ray, F for fast neutron and E for
EMS. For example, the line 233-7-1-1D is seed from plant 1 of the M3
family, which in turn is seed from plant 1 of the M2 family, which was
taken from a plant designated to be number 233 of the M1 family
produced by DEB mutagenesis.
3.1.2 Anatomical traits related to C4 photosynthesis
As previously mentioned, single celled C4 photosynthetic systems have
been identified in plant species such as Borszczowia aralocaspica
(Voznesenskaya et al., 2001); however, these are associated with the
survival of plants grown under extreme photorespiratory pressures,
rather than the high productivity displayed by crops, which utilise a
traditional Kranz-type anatomy (von Caemmerer, 2003).

Chapter 3. Screening the mutant population
51
The primary adaptations seen in a leaf displaying Kranz anatomy are an
increased vein density, increased level of contact between the mesophyll
and bundle sheath cells, with few mesophyll cells present between
adjacent vascular bundles, and an increase in the number of bundle
sheath chloroplasts, which are centrifugally positioned away from the
vascular bundle (Leegood et al., 2000). It was suggested by Sage (2004)
that general anatomical preconditioning such as the reduction of
interveinal distance was one of the earliest phases in the evolution of the
C4 photosynthetic system. As vascular arrangement appears to be one of
the key determinants in the viability of a C4 system, this characteristic
was used as a focus of the screening process.
3.2 Methodology
The production and growth conditions of the plants up to sampling date
are discussed in detail in Chapter 2. Specific methodologies related to the
screening of the mutant population are described below.
3.2.1 Vein distribution
Transverse sections of the rice leaves were hand cut from the widest
section of the 6th leaf of each plant and the width of the leaf at this point
was recorded. The leaf sections were observed using a light microscope
at 10x magnification and veins were categorised as minor, major or the
midrib (Figure 3.2). This information was stored in a schematic diagram
(Figure 3.4) in order to investigate the relative positions of veins in the
wild type rice plants and observe whether there was variation in vascular
patterning between the different mutant lines.
3.2.2 Vein spacing and size
Transverse sections were taken from the 6th leaf of rice plants at the
widest point. These were imaged under a light microscope at 20x
magnification using the software program Infinity Capture (Lumenera

Chapter 3. Screening the mutant population
52
Corporation, Canada). The software program Infinity Analyze (Lumenera
Corporation, Canada) was then calibrated using a graticule and
measurements of the interveinal distance were taken. In order to
quantify relative changes in interveinal distance in the different regions of
the leaf, the spacing between adjacent minor veins, adjacent major veins
and adjacent minor and major veins was measured.
3.2.3 Leaf thickness
Leaf thickness was also measured using transverse sections of the 6th leaf
of rice plants imaged and analysed using Infinity Capture and Infinity
Analyze. As the surface of the rice leaf undulates according to which
structures are directly present under the surface (Figure 3.2), three
separate measurement of leaf thickness were taken. These were the
thickness at the bulliform cells, thickness at the minor vein and thickness
at the major vein. Thickness at the midrib was not measured as the
sectioning process often resulted in the midrib collapsing and reliable
data could not be obtained.
3.3 Leaf morphology of rice
Transverse sectioning of the rice leaves reveals four primary types of
tissue – the vascular tissue, chlorenchyma, bulliform cells and epidermis;
of these the vascular tissue and chlorenchyma are of particular interest
to this study (Figure 3.2).
The vascular bundles can be categorised into three distinct types, the
midrib, major veins and minor veins (Figure 3.1, 3.2). The distinction
between each group is essentially one of size, with the midrib typically
being the largest vascular bundle by far, then the major and minor veins
which are in turn smaller than the midrib. In wild type leaves the midrib
is present in the centre of the leaf, and a pattern of minor and major
veins parallel to the midrib can be observed extending towards both leaf
margins (Figure 3.3).
Chapter 3. Screening the mutant population
53
In wild type rice plants, the relative pattern of minor and major veins
is mostly symmetrical about the midrib and well conserved with deviation
away from this pattern generally only observed at the leaf margins.
Typically two minor veins are present adjacent to and on either side of
the midrib, after which the first major vein may observed (Figure 3.3).
There then follows a repeating pattern of four minor veins between each
major vein until the final major vein is reached close to the leaf margin,
after which a varying number of minor veins may be observed before
reaching the leaf margin.
The chlorenchyma cells are defined as parenchyma cells containing
chloroplasts, and make up part of the mesophyll of the leaves.
Chlorenchyma cells are the primary sites of photosynthesis. In rice, the
chlorenchyma cells are small compared to other grass species,
approximately half the size of those in wheat, and are extensively lobed
in the transverse orientation. Chlorenchyma cells have a length to width
ratio of approximately 2:1 and are orientated so that the long axis of the
cell is perpendicular to the vascular tissue. When observed transversally,
they are present in rows between the vascular bundles and are
somewhat densely packed, with few visible airspaces. The bulliform cells
are present at the adaxial side of the leaf, interrupting the rows of
chlorenchyma cells between each pair of veins. This leaf morphology was
also described by Hoshikawa (1989).

Chapter 3. Screening the mutant population
54

Chapter 3. Screening the mutant population
55

Chapter 3. Screening the mutant population
56
Table 3.1 Anatomical characteristics of the 5th leaf of wild type IR64.
N=5
Characteristic Mean Standard Error
Leaf thickness (major vein, µm) 133.5 8.77
Leaf thickness (minor vein, µm) 87.3 4.79
Leaf thickness (bulliform cells, µm) 84.8 1.75
Total veins per unit width (veins mm-1) 4.8 0.35
Minor vein width (µm) 41.8 1.79
Major vein width (µm) 104.5 8.77
Interveinal distance (adjacent
minor veins, µm) 152.3 7.67
Interveinal distance (adjacent
major and minor veins, µm) 146.0 13.82
Interveinal distance (adjacent
major veins, µm) 850.6 43.96
Figure 3.3 Typical wild type plant produced under hydroponic growth
conditions.
Chapter 3. Screening the mutant population
57
3.4 Screening the mutant population
3.4.1 Vein arrangement
By observing the organisation of veins on either side of the midrib, it
easy to see the large variation in vein development present in rice leaves
within the population of mutant lines, and this may help to identify
interesting mutant lines. In wild type plants, the leaves are broadly
symmetrical with approximately the same number of minor and major
veins present on either side of the midrib arranged in almost identical
patterns. However, vein arrangement within the mutant population
shows great diversity, both between and within individual mutant lines. A
schematic diagram of this variation is given in Figure 3.4, and displaying
the vein arrangement data in this way helps to make quick visual
comparisons of wild type and mutant lines.
Whilst wild type plants typically produce two minor veins directly
adjacent to the midrib before any major veins are observed, some
mutant lines such as 64-14-1-2G and 83-18-1-1G produce major veins
adjacent to the midrib and the intervening minor veins are absent.
Some lines possessed an altered ratio of minor to major veins. For
example 3315-1-1-3F produced only two major veins for every 15 minor
veins, whereas the wildtype plants possessed a ratio of 13:3.
Many lines displayed an increased asymmetry of vascular patterning
about the midrib and in some mutant lines the midrib was not located in
the centre of the leaf.
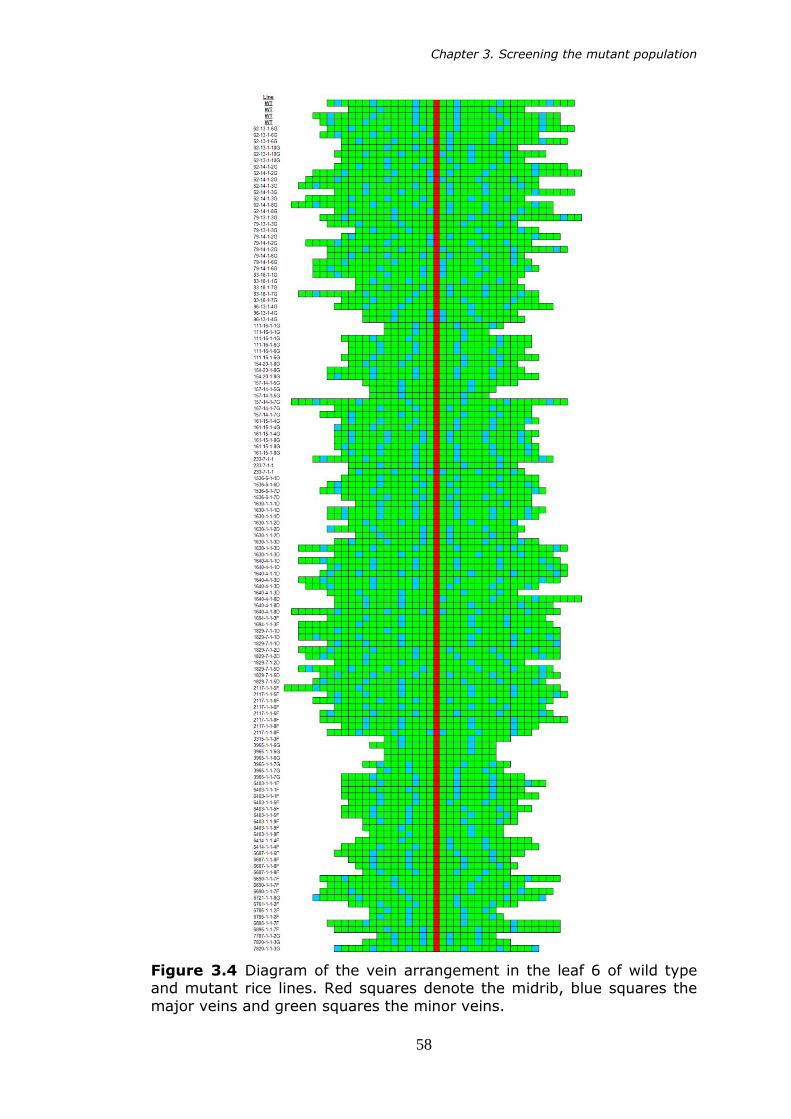
Chapter 3. Screening the mutant population
58
Figure 3.4 Diagram of the vein arrangement in the leaf 6 of wild type and mutant rice lines. Red squares denote the midrib, blue squares the
major veins and green squares the minor veins.

Chapter 3. Screening the mutant population
59
There was also variation in the total number of veins present in the leaf
(Figure 3.5). This ranged from an average of approximately 17 veins in
the line 7787-1-1-2G to 36 veins in the 1829-7-1-1D line. The wild type
mean was 29. Analysis of variance (ANOVA) showed that the data was
normally distributed and that six lines produced a significantly reduced
number of veins in leaf 6 when compared with the wild type plants. 111-
16-6G produced a mean number of 26.3 veins (P<0.05), 157-14-1-5G
produced a mean total of 19.0 veins per leaf (P<0.01) and 3965-1-1-6G
produced a mean number of 17.0 veins per leaf (P<0.01). The sister line
of 3965-1-1-6G, 3965-1-1-7G also displayed a significantly reduced vein
number with 21.67 (P<0.05), along with the lines 6403-1-1-9F and
6761-1-1-7F with 20.3 and 22.3 veins per leaf respectively (P<0.01 and
P<0.05). No lines displayed a total veins per leaf six that was
significantly greater than the value demonstrated by the wild type plants.
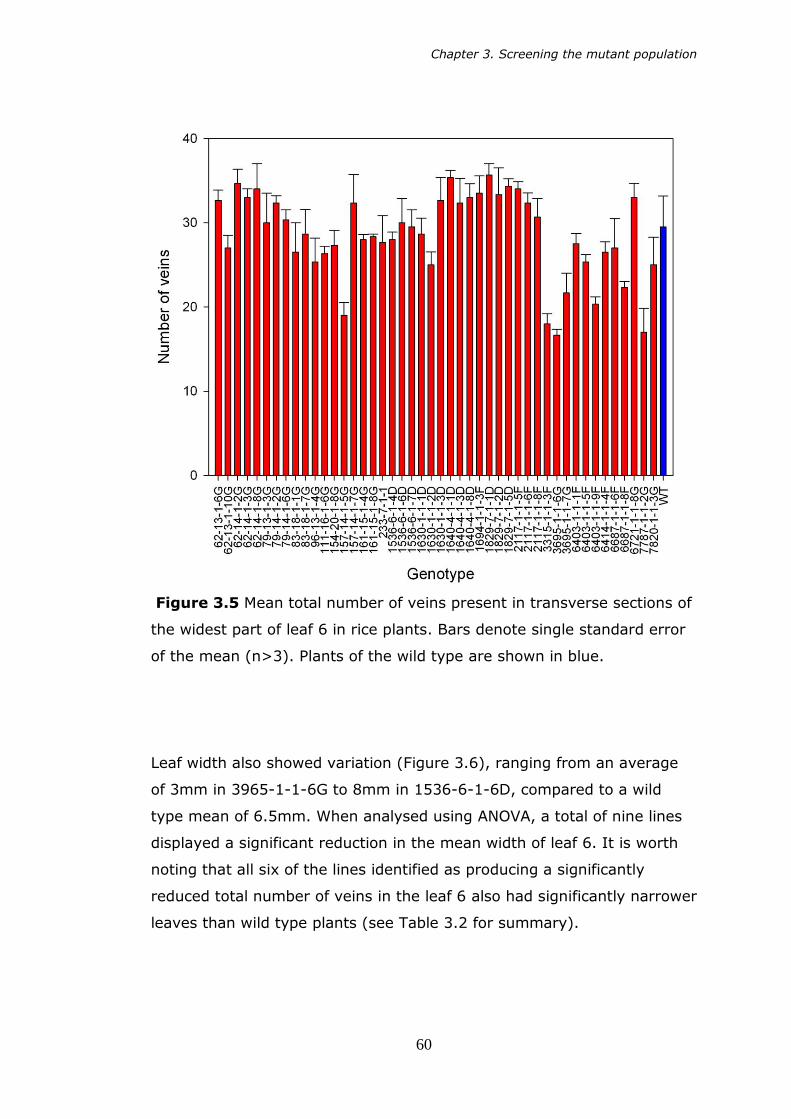
Chapter 3. Screening the mutant population
60
Figure 3.5 Mean total number of veins present in transverse sections of
the widest part of leaf 6 in rice plants. Bars denote single standard error
of the mean (n>3). Plants of the wild type are shown in blue.
Leaf width also showed variation (Figure 3.6), ranging from an average
of 3mm in 3965-1-1-6G to 8mm in 1536-6-1-6D, compared to a wild
type mean of 6.5mm. When analysed using ANOVA, a total of nine lines
displayed a significant reduction in the mean width of leaf 6. It is worth
noting that all six of the lines identified as producing a significantly
reduced total number of veins in the leaf 6 also had significantly narrower
leaves than wild type plants (see Table 3.2 for summary).

Chapter 3. Screening the mutant population
61
A further five mutant lines also produced a significantly narrower sixth
leaf than the wild type IR64 plants with no significant reduction in total
vein number. However it is perhaps unsurprising that a number of lines
would produce leaves which are significantly narrower than the wild type
given that mutant lines were pre-selected for this study on the basis of
altered leaf shape (see Section 3.1.1).
Figure 3.6 Mean width of leaf 6 of rice plants at the widest part of the
leaf. Bars denote single standard error of the mean (n>3). Plants of the
wild type are shown in blue.

Chapter 3. Screening the mutant population
62

Chapter 3. Screening the mutant population
63
3.4.2 Veins mm-1 leaf width
Figure 3.7 Mean number of veins mm-1 leaf width in leaf 6 of rice plants.
Bars denote single standard error of the mean (n>3). Plants of the wild
type are shown in blue.
Variation in both leaf width and the total number of veins present were
used to calculate total vein density in leaf 6, expressed as veins mm-1
leaf width (Figure 3.7). Total vein density varied from 3.75±0.24 veins
mm-1 leaf width in the mutant line 1536-6-1-6D to 6.1±0.38 veins mm-1
in mutant 157-14-1-5G, compared to a density of 4.8±0.3 veins mm-1 in
wild type plants. However, although variation in total vein density was
observed, it was not large enough to prove statistically significant. This is
reflected by the fact that a strong correlation between the total number
of veins observed and leaf width was calculated (R2=0.76) (Figure 3.8).

Chapter 3. Screening the mutant population
64
Figure 3.8 Relationship between the mean width of leaf 6 of rice plants
at the widest point and the number of veins present.
The strong correlation between the total number of veins present in leaf
6 and its width, coupled with the fact that all lines displaying an altered
number of veins also possessed an altered leaf, width suggests that vein
number mm-1 is predominantly a function of leaf width.
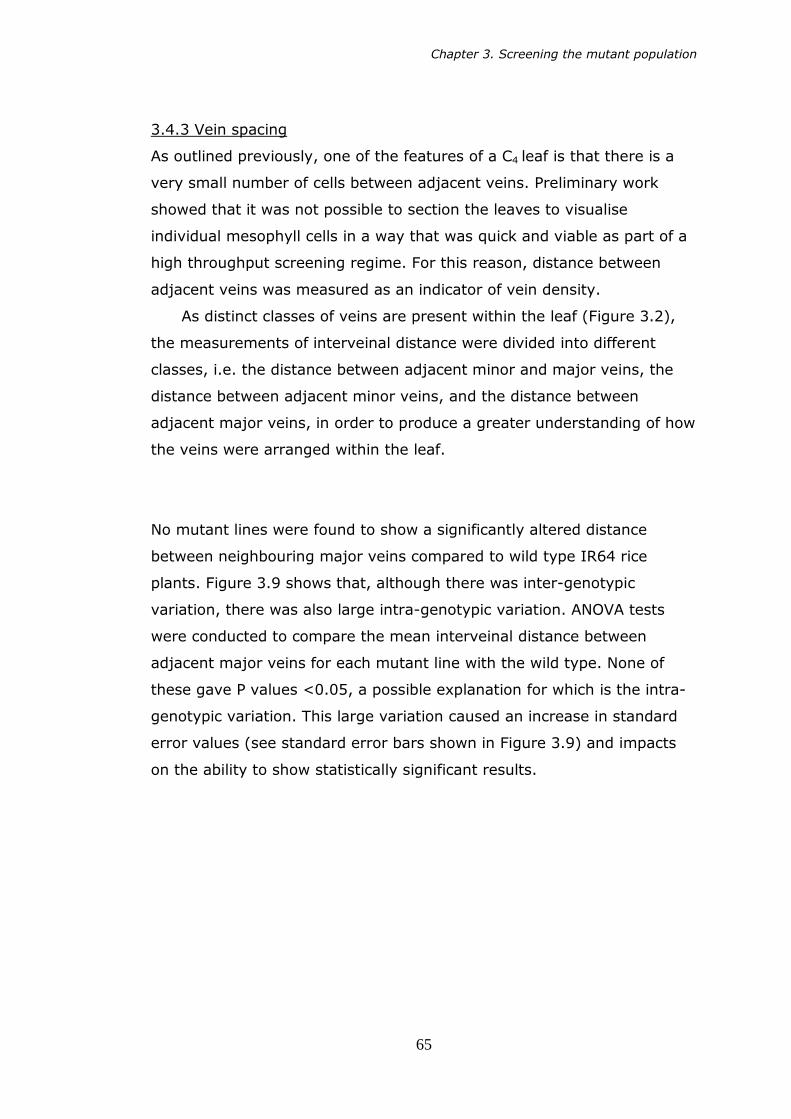
Chapter 3. Screening the mutant population
65
3.4.3 Vein spacing
As outlined previously, one of the features of a C4 leaf is that there is a
very small number of cells between adjacent veins. Preliminary work
showed that it was not possible to section the leaves to visualise
individual mesophyll cells in a way that was quick and viable as part of a
high throughput screening regime. For this reason, distance between
adjacent veins was measured as an indicator of vein density.
As distinct classes of veins are present within the leaf (Figure 3.2),
the measurements of interveinal distance were divided into different
classes, i.e. the distance between adjacent minor and major veins, the
distance between adjacent minor veins, and the distance between
adjacent major veins, in order to produce a greater understanding of how
the veins were arranged within the leaf.
No mutant lines were found to show a significantly altered distance
between neighbouring major veins compared to wild type IR64 rice
plants. Figure 3.9 shows that, although there was inter-genotypic
variation, there was also large intra-genotypic variation. ANOVA tests
were conducted to compare the mean interveinal distance between
adjacent major veins for each mutant line with the wild type. None of
these gave P values <0.05, a possible explanation for which is the intra-
genotypic variation. This large variation caused an increase in standard
error values (see standard error bars shown in Figure 3.9) and impacts
on the ability to show statistically significant results.

Chapter 3. Screening the mutant population
66
Figure 3.9 Average distance between neighbouring major veins in the
leaf 6 of rice. Bars denote standard error of the mean (n>3). Plants of
the wild type are shown in blue.
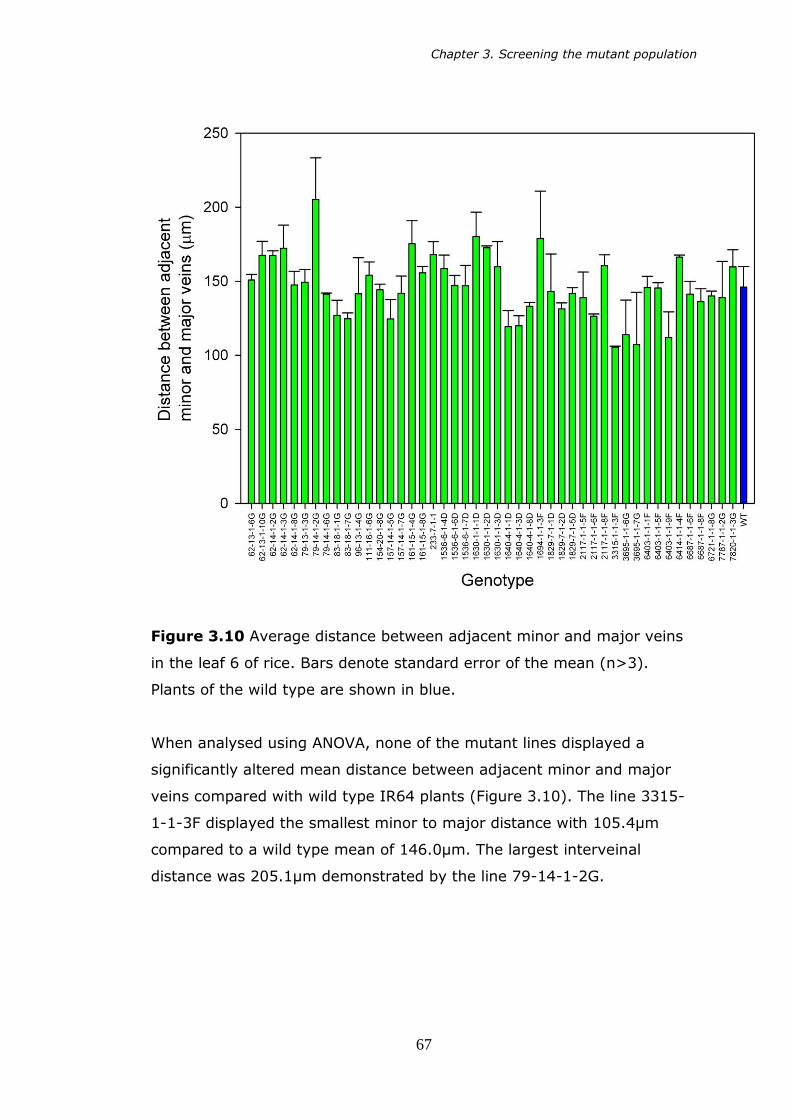
Chapter 3. Screening the mutant population
67
Figure 3.10 Average distance between adjacent minor and major veins
in the leaf 6 of rice. Bars denote standard error of the mean (n>3).
Plants of the wild type are shown in blue.
When analysed using ANOVA, none of the mutant lines displayed a
significantly altered mean distance between adjacent minor and major
veins compared with wild type IR64 plants (Figure 3.10). The line 3315-
1-1-3F displayed the smallest minor to major distance with 105.4µm
compared to a wild type mean of 146.0µm. The largest interveinal
distance was 205.1µm demonstrated by the line 79-14-1-2G.

Chapter 3. Screening the mutant population
68
Figure 3.11 Average distance between adjacent minor veins in the leaf 6
of rice. Bars denote standard error of the mean (n>3). Plants of the wild
type are shown in dark blue.
Figure 3.11 shows that there was extensive variation in terms of average
spacing between two adjacent minor veins. Three lines have been shown
to exhibit a significantly altered vein spacing - 83-18-7G (P<0.05), 3965-
1-1-6G (P<0.05) and 3965-1-1-7G (P<0.01). Significance was shown
using ANOVA tests comparing the mean distance between adjacent veins
for each line against the mean distance demonstrated by wild type
plants.

Chapter 3. Screening the mutant population
69
3.4.4 Vein Size
Figure 3.12 Mean major vein diameter as observed in transverse
sections of leaf 6 of rice plants. Bars denote standard error of the mean
(n>3). Plants of the wild type are shown in blue.
No significant variation between the size of the major veins displayed by
the mutant lines and the wild type IR64 plants was observed (Figure
3.12). There was a large range of values observed, with the line 157-14-
1-5G producing the smallest major veins with a mean diameter of
64.8µm, and 2117-1-1-5F the largest at 117.4µm diameter. The wild
type IR64 mean was 104.6µm. Whilst ANOVA testing showed there was a
significant difference between those lines displaying the largest and
smallest major veins (P<0.05), this was of little importance as the aim of
the screen was to identify those lines which are significantly altered
compared to wild type plants.
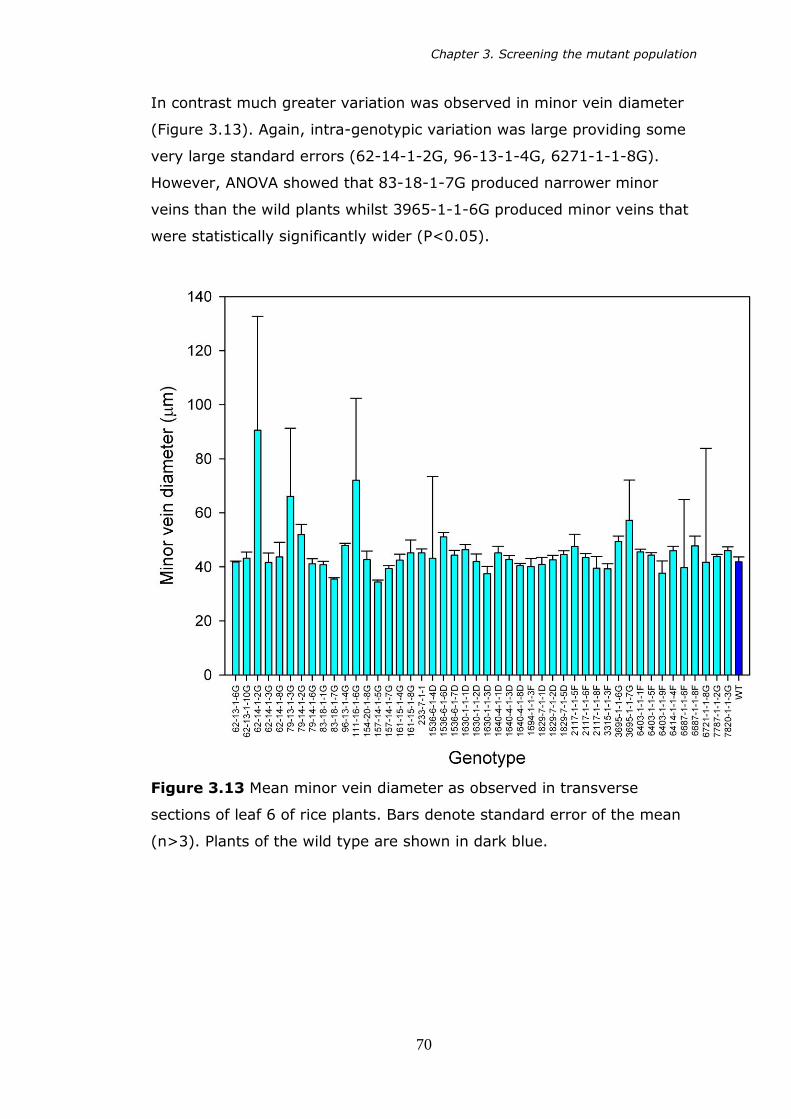
Chapter 3. Screening the mutant population
70
In contrast much greater variation was observed in minor vein diameter
(Figure 3.13). Again, intra-genotypic variation was large providing some
very large standard errors (62-14-1-2G, 96-13-1-4G, 6271-1-1-8G).
However, ANOVA showed that 83-18-1-7G produced narrower minor
veins than the wild plants whilst 3965-1-1-6G produced minor veins that
were statistically significantly wider (P<0.05).
Figure 3.13 Mean minor vein diameter as observed in transverse
sections of leaf 6 of rice plants. Bars denote standard error of the mean
(n>3). Plants of the wild type are shown in dark blue.

Chapter 3. Screening the mutant population
71
3.4.5 Leaf thickness
Although not primarily related to C4 photosynthesis, leaf thickness was
also measured to give a greater understanding of the impact of
alterations in mesophyll thickness and vein size. As the rice leaf does not
have a level surface (Figure 3.2), measurements of leaf thickness were
taken in different distinct regions of the leaf, i.e. major veins, minor veins
and across the bulliform cells.
Figure 3.14 Leaf thickness at major veins. Bars denote standard error of
the mean (n>3). Plants of the wild type are shown in blue.
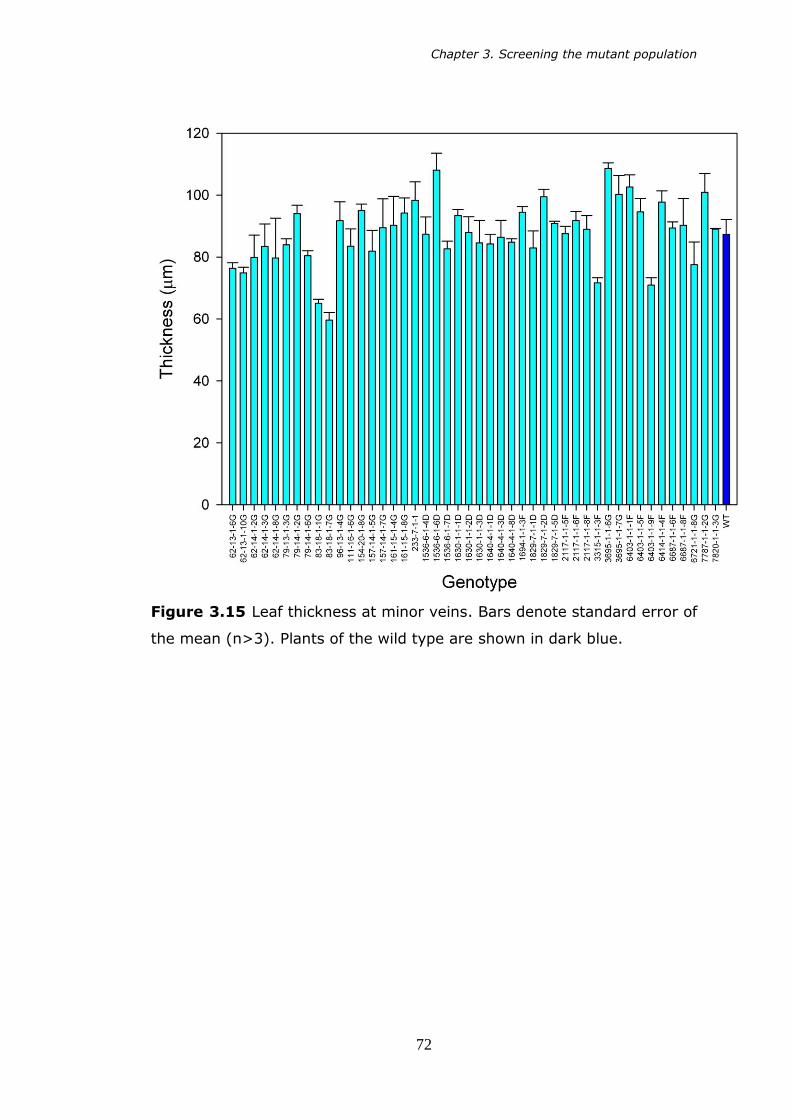
Chapter 3. Screening the mutant population
72
Figure 3.15 Leaf thickness at minor veins. Bars denote standard error of
the mean (n>3). Plants of the wild type are shown in dark blue.
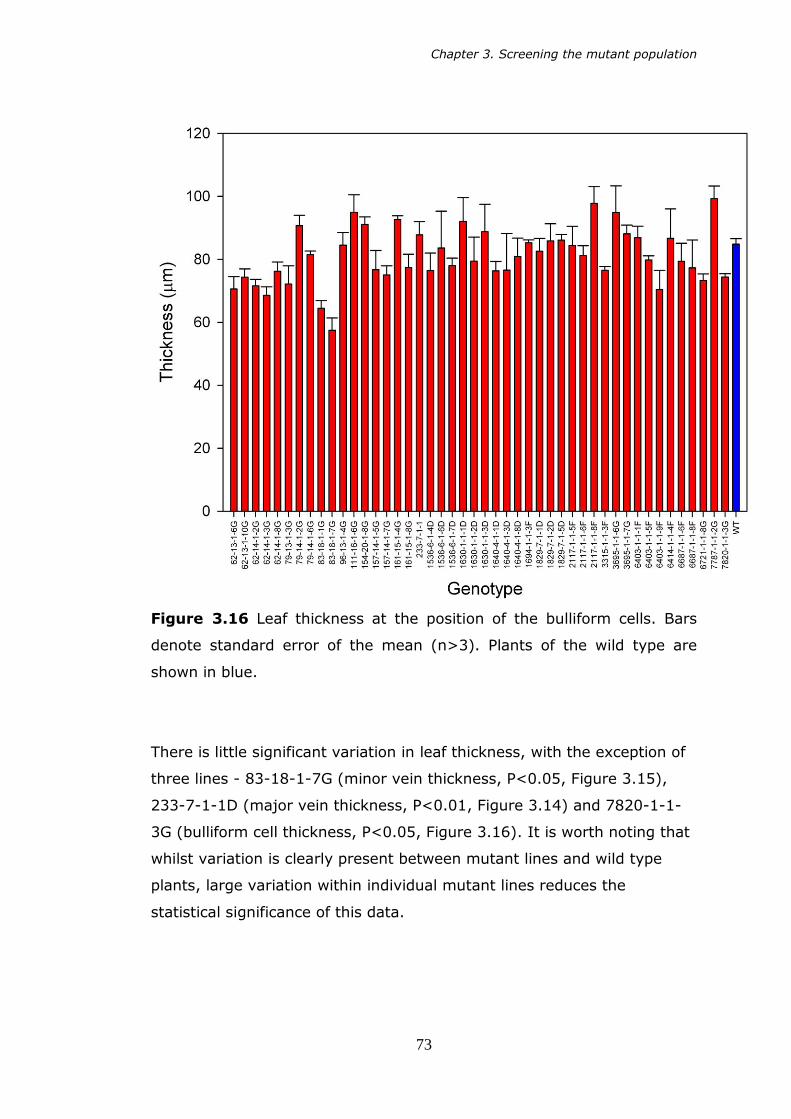
Chapter 3. Screening the mutant population
73
Figure 3.16 Leaf thickness at the position of the bulliform cells. Bars
denote standard error of the mean (n>3). Plants of the wild type are
shown in blue.
There is little significant variation in leaf thickness, with the exception of
three lines - 83-18-1-7G (minor vein thickness, P<0.05, Figure 3.15),
233-7-1-1D (major vein thickness, P<0.01, Figure 3.14) and 7820-1-1-
3G (bulliform cell thickness, P<0.05, Figure 3.16). It is worth noting that
whilst variation is clearly present between mutant lines and wild type
plants, large variation within individual mutant lines reduces the
statistical significance of this data.

Chapter 3. Screening the mutant population
74
3.5 Altered leaf morphology mutants
Individual mutant lines showing the greatest consistent variation in leaf
morphology compared to the wild type were retained for further study.
These individual lines were renamed as altered leaf morphology (alm)
mutants, and are categorised as alm1 – alm7. ANOVA tests were used to
compare data for each individual parameter (minor vein thickness, major
to major vein distance etc.) for each line with those of the wild type, and
lines showing significant differences were classed as being of interest.
Further to this, a small number of lines were chosen on the basis of being
anatomically interesting in that they displayed characteristics which are
generally not seen in wild type plants, even though these characteristics
may not be quantifiable (such as an altered gross morphology) or shown
to be statistically significant.
The following sections describe the general leaf morphology displayed by
the alm lines taken from the fresh sections used in the screening process.
Subsequent Chapters will characterise these lines physiologically and
anatomically in greater detail.

Chapter 3. Screening the mutant population
75
3.5.1 alm1 (83-18-1-7G)
Figure 3.17 Plants of the alm1 mutant line of rice, schematic map of
vein arrangement and corresponding leaf section taken from the fully
expanded leaf 6. In the vein map, red squares denote the midrib, blue
the major veins and green the minor veins.
The alm1 line demonstrates several features that make it of significant
interest. The first is that the average distance between each minor vein
was 116.8µm compared to 152.4µm for wild type plants (P<0.05).
Secondly the minor veins were significantly narrower (P<0.05) than the
wild type plants, with a value of 35.5µm compared with 41.9µm. Finally,
the general morphology of the plants tended to be greatly altered, with
leaves tending to be spiky in appearance (Figure 3.17) and possessing an
erratic vein distribution with vein patterning showing very little symmetry
around the midrib.

Chapter 3. Screening the mutant population
76
3.5.2 alm2 (111-16-1-1G)
Figure 3.18 Plants of the alm2 line, along with the relevant section of
the vein map for those plants, showing that the leaves display a rough
symmetry in vein distribution about the midrib (red denotes the midrib,
green a minor vein and blue a major vein). The leaf section shows no
major alterations to microscopic anatomy.
Whilst plants of the alm2 line showed no significant changes in mean
values for vein size or spacing, the line was of interest due the fact that
the midrib of the leaf tended to be visibly off-centre. This caused a
„bunching‟ effect of veins to one side, whilst the other remained relatively
well spaced. For this reason, it was believed that it would be useful to
accurately visualise and quantify the changes occurring in the „bunched‟
portion of the leaf and investigate the effect of this on the plant. The
whole plant photographs in Figure 3.18 show that the plants visually
appear much healthier than those of other mutant lines.

Chapter 3. Screening the mutant population
77
3.5.3 alm3 (233-7-1-1D)
Figure 3.19 Plants of the alm3 mutant line of rice, schematic map of
vein arrangement and corresponding leaf section taken from the fully
expanded leaf 6. In the vein map, red squares denote the midrib, blue
the major veins and green the minor veins.
Plants of the alm3 line demonstrated a significantly (P<0.01) increased
thickness at the major vein (P<0.01, 173.7µm) compared to those of the
wild type IR64 (133.5µm). Other than this, the gross morphology
remained largely unchanged.

Chapter 3. Screening the mutant population
78
3.5.4 alm4 (1536-6-1-6D)
Figure 3.20 Plants of the alm4 mutant line of rice, schematic map of
vein arrangement and corresponding leaf section taken from the fully
expanded leaf 6. In the vein map, red squares denote the midrib, blue
the major veins and green the minor veins.
alm4 plants typically showed very low germination / survival rates (<
9%), but plants which survived to sampling age produced very thick
leaves. Average leaf thicknesses of alm4 plants were 191.5µm at the
major vein and 108.1µm at the minor vein compared with values of
133.3µm and 108.1µm for the wild type plants respectively. This showed
a drastic and significant alteration in vein size.

Chapter 3. Screening the mutant population
79
3.5.5 alm5 (3965-1-1-6G)
Figure 3.21 Whole plants of the alm5 mutant line of rice, schematic map
of vein arrangement and corresponding leaf section taken from the fully
expanded leaf 6. In the vein map, red squares denote the midrib, blue
the major veins and green the minor veins.
As seen in the Figure 3.21, alm5 plants appear very different to those of
wild type IR64, generally appearing smaller and having notably „spiky‟
leaves. The leaf sections show that 3965-1-1-6G leaves tend to have a
very small midrib and far fewer veins than the wild type. 3965-1-1-6G
displays a significantly reduced minor to minor vein distance when
compared to wild type, with 113.9µm versus 152.4µm (P < 0.05), and
minor veins are also significantly wider at 49.4µm versus 41.9µm (P <
0.05).
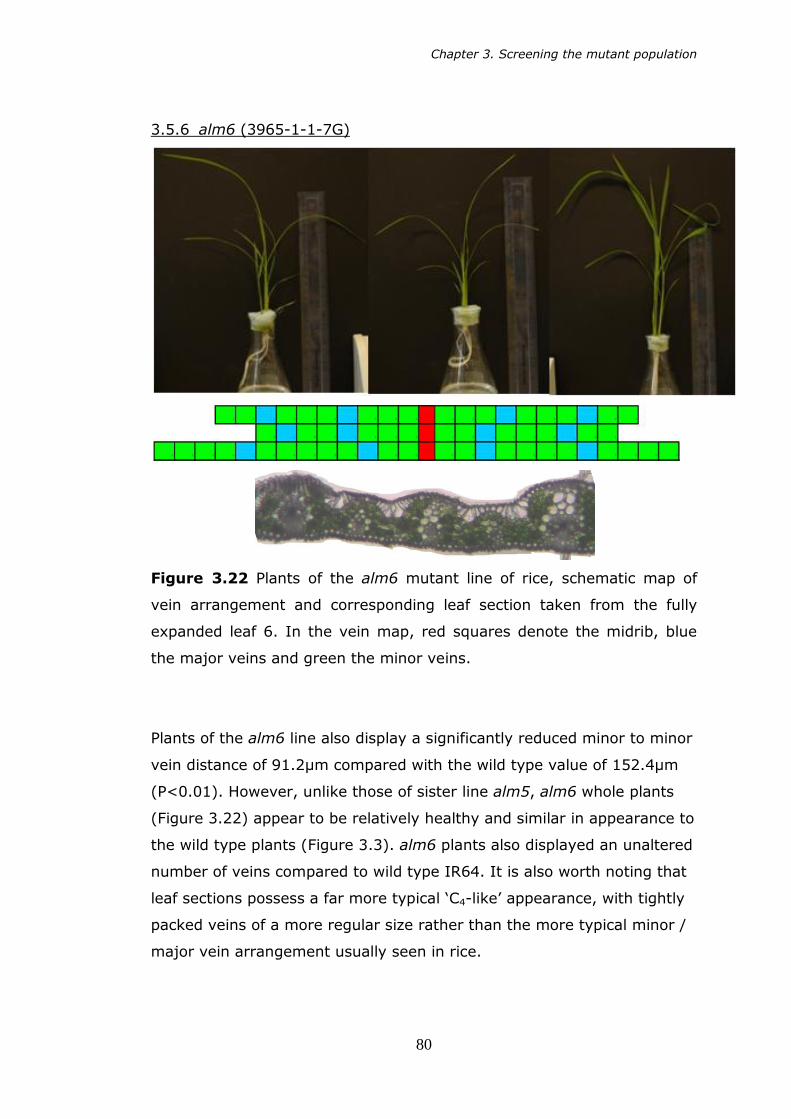
Chapter 3. Screening the mutant population
80
3.5.6 alm6 (3965-1-1-7G)
Figure 3.22 Plants of the alm6 mutant line of rice, schematic map of
vein arrangement and corresponding leaf section taken from the fully
expanded leaf 6. In the vein map, red squares denote the midrib, blue
the major veins and green the minor veins.
Plants of the alm6 line also display a significantly reduced minor to minor
vein distance of 91.2µm compared with the wild type value of 152.4µm
(P<0.01). However, unlike those of sister line alm5, alm6 whole plants
(Figure 3.22) appear to be relatively healthy and similar in appearance to
the wild type plants (Figure 3.3). alm6 plants also displayed an unaltered
number of veins compared to wild type IR64. It is also worth noting that
leaf sections possess a far more typical „C4-like‟ appearance, with tightly
packed veins of a more regular size rather than the more typical minor /
major vein arrangement usually seen in rice.

Chapter 3. Screening the mutant population
81
3.5.7 alm7 (7820-1-1-3G)
Figure 3.23 Plants of the alm7 mutant line of rice, schematic map of
vein arrangement and corresponding leaf section taken from the fully
expanded leaf 6. In the vein map, red squares denote the midrib, blue
the major veins and green the minor veins.
Whilst whole plants of the alm7 line do not appear to be differ greatly
from those of the wild type, they have been shown to produce
significantly (P < 0.05) thinner leaves when measured at the bulliform
cell location (74.4µm versus 82.8µm average thickness in wild type), the
effect of this is unknown. As seed stocks held at Sutton Bonington aged
(approximately 5 years post harvest), germination percentage of alm7
decreased to such an extent that the entire stock held was deemed to be
unviable. Further seed stock was requested from IRRI, but they too were
unable to germinate their seed stock so the line is no longer available for
study.
Chapter 3. Screening the mutant population
82
3.6 Discussion
This chapter makes use of a forward genetic screen; that is mutations
were induced in the population of IR64 rice plants, and the effects were
observed. The underlying genetic changes responsible for these changes
are unknown.
Mutagenesis by means of chemical agents and ionizing radiation have
long been used to induce genetic variation in populations for crop
breeding purposes, with over 2200 crop varieties produced during the
20th century by means irradiation mutagenesis (Maluszynski et al.,
2000). However mutation in this manner has traditionally not been used
as a genetic identification tool as the mutation is not physically tagged,
meaning that once an altered phenotype has been identified,
identification of the altered gene(s) may take considerable effort.
However, more recently the field of high throughput genotyping has
improved greatly, allowing the detection of polymorphisms such as point
mutations or deletions (Borevitz et al., 2003; Mockler et al., 2005; Arora
et al., 2007).
It is in this context that the rice deletion screen is considered. As stated
previously, it is thought that anatomical preconditioning of the vascular
arrangement and density was essential in the early phases of C4
evolution (Sage, 2004). This screen has been successful in the
identification of a number of mutant lines which potentially altered leaf
morphologies which could be exploited in the manipulation of
photosynthesis. This is not the first study to demonstrate that rice is
amenable to producing an altered vascular arrangement, as a similar
effect was also noted by Scarpella et al. (2003) in the radicleless1 (ral1)
rice mutant. In that case a defect in auxin response was responsible for a
reduction in interveinal distance.
However, although significantly altered leaf morphologies have been
observed in this screening process, the nature of screening is such that, a
compromise must be made between resolution of the screen and the
throughput of individuals. It is therefore necessary for the candidate lines
outlined here to undergo a detailed characterisation before it is possible

Chapter 3. Screening the mutant population
83
to describe the responses that they display in definite terms, and also to
check that the alterations described in this chapter are heritable and
repeatedly produced. Therefore detailed characterisation of the mutant
lines will allow for a firm understanding of the changes observed in this
chapter and allow discussion of potential causes and implications of these
changes. Also, the genes responsible for the production of Kranz anatomy
are not yet known, and although not part of this project, any lines
confirmed as displaying a leaf morphology of significant interest can be
returned to IRRI for genetic characterisation (Hei Leung, IRRI, personal
communication).

84
Chapter 4
DETAILED MORPHOLOGY
OF CANDIDATE LINES
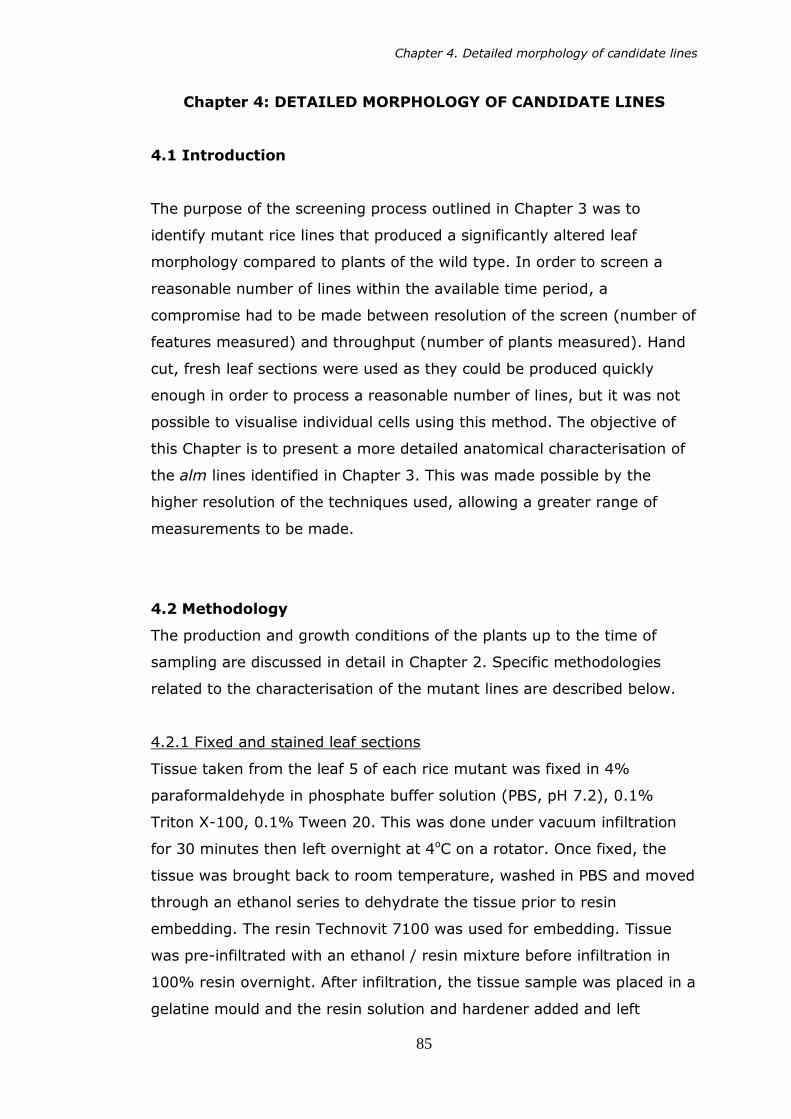
Chapter 4. Detailed morphology of candidate lines
85
Chapter 4: DETAILED MORPHOLOGY OF CANDIDATE LINES
4.1 Introduction
The purpose of the screening process outlined in Chapter 3 was to
identify mutant rice lines that produced a significantly altered leaf
morphology compared to plants of the wild type. In order to screen a
reasonable number of lines within the available time period, a
compromise had to be made between resolution of the screen (number of
features measured) and throughput (number of plants measured). Hand
cut, fresh leaf sections were used as they could be produced quickly
enough in order to process a reasonable number of lines, but it was not
possible to visualise individual cells using this method. The objective of
this Chapter is to present a more detailed anatomical characterisation of
the alm lines identified in Chapter 3. This was made possible by the
higher resolution of the techniques used, allowing a greater range of
measurements to be made.
4.2 Methodology
The production and growth conditions of the plants up to the time of
sampling are discussed in detail in Chapter 2. Specific methodologies
related to the characterisation of the mutant lines are described below.
4.2.1 Fixed and stained leaf sections
Tissue taken from the leaf 5 of each rice mutant was fixed in 4%
paraformaldehyde in phosphate buffer solution (PBS, pH 7.2), 0.1%
Triton X-100, 0.1% Tween 20. This was done under vacuum infiltration
for 30 minutes then left overnight at 4oC on a rotator. Once fixed, the
tissue was brought back to room temperature, washed in PBS and moved
through an ethanol series to dehydrate the tissue prior to resin
embedding. The resin Technovit 7100 was used for embedding. Tissue
was pre-infiltrated with an ethanol / resin mixture before infiltration in
100% resin overnight. After infiltration, the tissue sample was placed in a
gelatine mould and the resin solution and hardener added and left
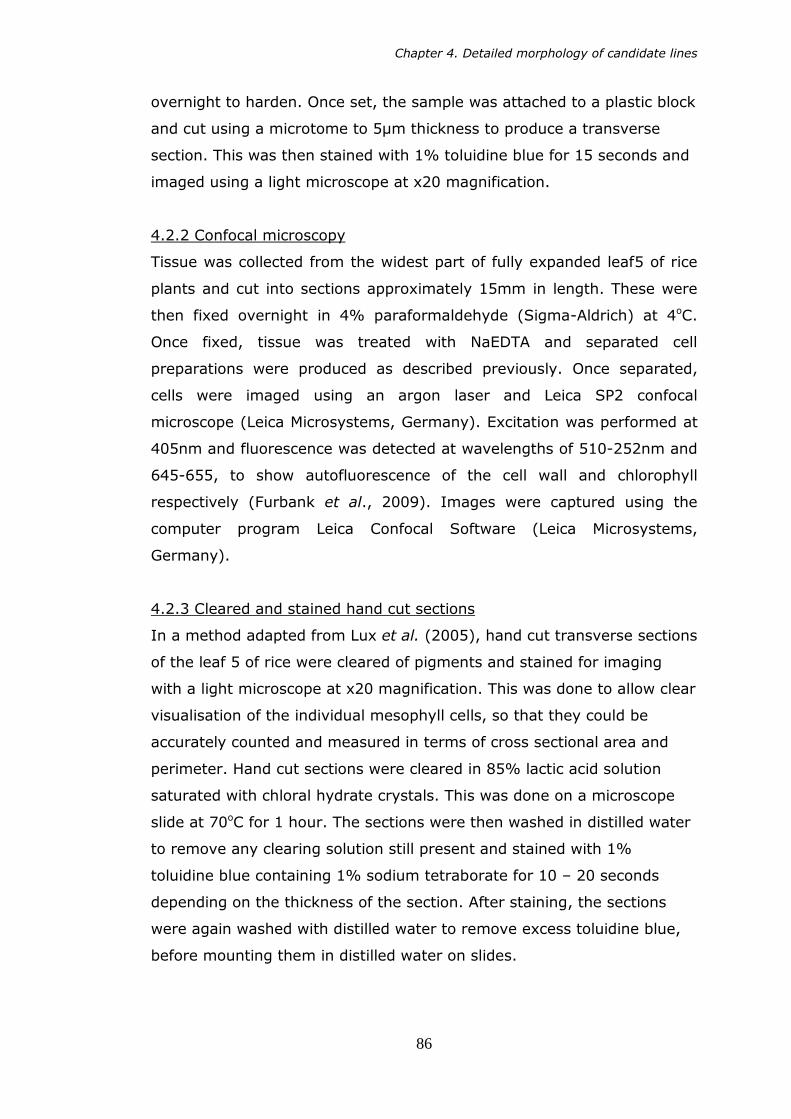
Chapter 4. Detailed morphology of candidate lines
86
overnight to harden. Once set, the sample was attached to a plastic block
and cut using a microtome to 5µm thickness to produce a transverse
section. This was then stained with 1% toluidine blue for 15 seconds and
imaged using a light microscope at x20 magnification.
4.2.2 Confocal microscopy
Tissue was collected from the widest part of fully expanded leaf5 of rice
plants and cut into sections approximately 15mm in length. These were
then fixed overnight in 4% paraformaldehyde (Sigma-Aldrich) at 4oC.
Once fixed, tissue was treated with NaEDTA and separated cell
preparations were produced as described previously. Once separated,
cells were imaged using an argon laser and Leica SP2 confocal
microscope (Leica Microsystems, Germany). Excitation was performed at
405nm and fluorescence was detected at wavelengths of 510-252nm and
645-655, to show autofluorescence of the cell wall and chlorophyll
respectively (Furbank et al., 2009). Images were captured using the
computer program Leica Confocal Software (Leica Microsystems,
Germany).
4.2.3 Cleared and stained hand cut sections
In a method adapted from Lux et al. (2005), hand cut transverse sections
of the leaf 5 of rice were cleared of pigments and stained for imaging
with a light microscope at x20 magnification. This was done to allow clear
visualisation of the individual mesophyll cells, so that they could be
accurately counted and measured in terms of cross sectional area and
perimeter. Hand cut sections were cleared in 85% lactic acid solution
saturated with chloral hydrate crystals. This was done on a microscope
slide at 70oC for 1 hour. The sections were then washed in distilled water
to remove any clearing solution still present and stained with 1%
toluidine blue containing 1% sodium tetraborate for 10 – 20 seconds
depending on the thickness of the section. After staining, the sections
were again washed with distilled water to remove excess toluidine blue,
before mounting them in distilled water on slides.
Chapter 4. Detailed morphology of candidate lines
87
4.2.4 Separated cell preparations
Cell separations were produced using a method adapted from Pyke and
Leech (1987). Leaf tissue was taken from the widest section of leaf 5 of
rice mutant plants, and cut into strips approximately 1cm long. The
tissue was then fixed in 4% paraformaldehyde overnight at 4oC. The
fixative was removed, 0.1M NaEDTA (pH 9) added and the tissue was
heated at 60oC for a minimum of 6 hours in a heating block. To allow
comparison of rice mesophyll cells with those of a well categorised
species, a reduced time of 2 hours was used for Arabidopsis samples so
as not to cause complete disintegration of the tissue. Once heated, the
pieces of leaf tissue were placed onto a microscope slide and mounted in
the NaEDTA solution. These were then mechanically broken up using a
pair of forceps. The tissue was imaged using a Nomarski prism at x40
magnification.
4.2.5 Leaf surface impressions
Impressions were taken of the adaxial and abaxial surfaces of the fully
extended leaf 5 of rice mutants at the widest point. This was done by
applying Coltene President Plus Jet dental resin, (Colténe Whaledent,
Switzerland) onto the leaf surface with a spatula and for it to fully set,
approximately 10 minutes at room temperature. Once set the resin was
peeled off and no further measurements were taken from the leaf. To
visualise the leaf surface, the resin impression was painted with clear nail
varnish (Rimmel, UK) and observed under a light microscope at x20
magnification.
4.3 Detailed leaf sections
Several methods were used in order to visualise the arrangement of
mesophyll cells within rice leaves.
4.3.1 Fixed and resin-embedded tissue
Initial experiments to produce clear images for detailed characterisation
involved fixation of leaf tissue in paraformaldehyde and embedding it in
resin. These samples were then cut using a microtome and visualised
using a light microscope (Figure 4.1).

Chapter 4. Detailed morphology of candidate lines
88
Figure 4.1 Fixed and stained section of leaf 5 of an alm3 rice mutant,
stained with toluidine blue. LV, large vascular bundle; M, mesophyll; SV,
small vascular bundle; BF, bulliform cells.
Whilst the resin-embedded sections provided more detail than the hand
cut sections reported in Chapter 3, it was not possible in all cases to
clearly visualise individual mesophyll cells, perhaps because the cells
were small and densely packed and extensive lobing caused them to be
indistinct in appearance. These features seem to be typical of rice leaves
and are discussed later in this chapter. Furthermore, dehydration of the
tissue during the embedding process caused it to pull away from the
surrounding resin, causing it to no longer be held firmly in place. As it
was not possible to take accurate measurements of individual mesophyll
Chapter 4. Detailed morphology of candidate lines
89
and bundle sheath cells, the technique was not used in detailed
characterisation and alternatives were found.
4.3.2 Confocal microscopy
It was hypothesised that by using confocal microscopy, it would be
possible to visualise both individual cells and the chloroplasts within them
at the same time, thus providing much more information than resin
embedded stained sections.
Figure 4.2 Confocal micrograph of tissue taken from leaf 5 of a wild type
rice plant. Cell walls are coloured green and chlorophyll is coloured red.
BS, bundle sheath cell; M, mesophyll cell.
Chapter 4. Detailed morphology of candidate lines
90
The initial results were promising and Figure 4.2 shows adjacent
mesophyll and bundle sheath cells attached to the remnants of a vascular
bundle, whilst the chloroplasts (shown in red) can also be visualised. This
technique was suitable for allowing comparison between the mesophyll
and bundle sheath cells and quantification of the chloroplast number
present within each cell type. However, because of the high cell density,
the tissue needed to be broken up before it could be imaged. As the
extent of separation of the cells was highly variable from sample to
sample, it was not possible to consistently produce images such as Figure
4.2, with direct comparison between bundle sheath and mesophyll cells.
Furthermore, because the tissue had to be broken up, there was a degree
of tissue loss, and it was impossible to count the number of cells present
or measure the distance between adjacent vascular bundles. For these
reasons, the technique was not used in the detailed characterisation of
the alm lines. However, the few images obtained show some interesting
features such as the number and orientation of the mesophyll cells
around the bundle sheath, as will be discussed later.
4.3.3 Cleared and stained hand cut sections
A problem with the hand cut sections used in Chapter 3 was that the high
cell density and small size of rice mesophyll cells make visualisation of
individual cells extremely difficult. To try to overcome this problem, fresh
hand cut transverse leaf sections were treated with chloral hydrate to
remove leaf pigments in an adaption of the protocol outlined by Lux et al.
(2005). Following treatment, the cleared leaf sections were stained with
toluidine blue (Figure 4.3).
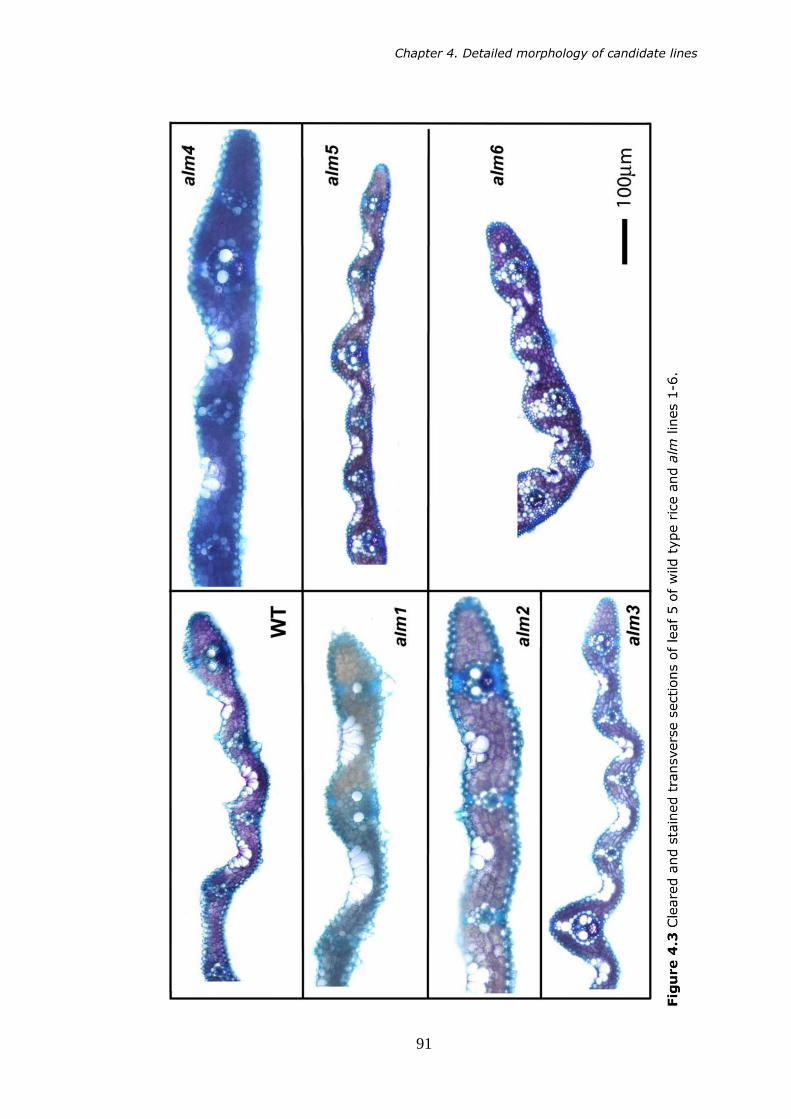
Chapter 4. Detailed morphology of candidate lines
91

Chapter 4. Detailed morphology of candidate lines
92
It became evident that the cleared and stained hand cut fresh leaf
sections enabled visualisation of the individual mesophyll cells within the
leaf, as these can be seen in Figure 4.3. This technique was therefore
used extensively throughout the detailed characterisation process.
However, removal of leaf pigments with chloral hydrate, and staining
with toluidine blue meant that it was impossible to quantify and measure
the chloroplasts within individual mesophyll cells, meaning that another
technique was required to characterise these features.
4.3.4 Separated cell preparations
Although the confocal microscopy technique previously outlined was
capable of visualising individual chloroplasts, its time-consuming nature
meant that the use of separated cell preparations was a preferred option
for the identification of chloroplasts.

Chapter 4. Detailed morphology of candidate lines
93
Figure 4.4 Isolated mesophyll cells from leaf 5 of wild type IR64 rice
plants. Individual groups of chloroplasts are highlighted with red broken
line.
4.4 Interveinal Spacing
Having established working methods for the anatomical analysis of these
leaves and cells, detailed analyses of the rice mutants were undertaken.
4.4.1 Distance
Using the cleared and stained transverse leaf sections described in
Section 4.2.3, interveinal distance was again measured (Figure 4.5).

Chapter 4. Detailed morphology of candidate lines
94
Figure 4.5 Mean distance between two adjacent minor veins in the fully
extended fifth leaf. Each histogram represents the mean distance for one
plant.
As in Chapter 3, ANOVA tests showed that alm5 and alm6 produced
minor veins which were significantly closer together than those of wild
type plants (P<0.05). As the reduction in interveinal distance was
observed in different generations and batches of plants, this suggests
that the phenotypes are persistent, and not simply observed in the single
generation of plants used in the screening process. A reasonably large
variation can again be observed within the lines (for example values for
alm3 ranged from 86.6 to 171.9µm). Interestingly, alm3, alm5 and alm6
all produced a single plant which differed greatly in interveinal distance
from the others, which were relatively closely clustered together. If
interveinal distance had been shown to be consistent between all the
individuals within a line, it would be likely that a dominant gene was
responsible for the observed phenotype. Speculatively, this is consistent
Chapter 4. Detailed morphology of candidate lines
95
with a Mendelian pattern of inheritance for interveinal distance, and
suggests that a reduced interveinal distance could be the result of
expression of a recessive gene. The study was not designed to
investigate the presence of Mendelian inheritance, and insufficient plants
were sampled to confirm statistically the presence of unique individuals in
a 3:1 ratio. It is therefore impossible to confirm or deny the presence of
Mendelian ratios of inheritance, this is, however, perhaps unlikely to be
present as such a ratio would be expected from a cross between
heterozygotes, rather than a selfing line which is assumed to be
homozygous. It is also a possibility that the observed variation is an
effect of non-Mendelian segregation; however, this is possibly a less
likely cause due to the clustering of similar interveinal distances
displayed by the majority of the individuals sampled. If segregation were
the primary cause, potentially more variation between all of the
individuals would be expected.
4.4.2 Cell number
As mentioned in Section 1.6.2, although Kranz-anatomy C4 plants often
display a reduced interveinal distance compared to C3 species, an
important factor in Kranz anatomy is the number of cells present
between neighbouring vascular bundles. This feature is designed to
maximise the rate of diffusion of C4 metabolites between mesophyll and
bundle sheath cells by reducing the number of membranes which have to
be crossed. For this reason, interveinal cell number is an important factor
to consider when looking for C4-like characteristics (Figure 4.6).
The number of individual mesophyll cells in a single row was counted
between the adjacent vascular bundles. Bundle sheath cells were
considered to be part of the vascular bundle and not included in the
count.
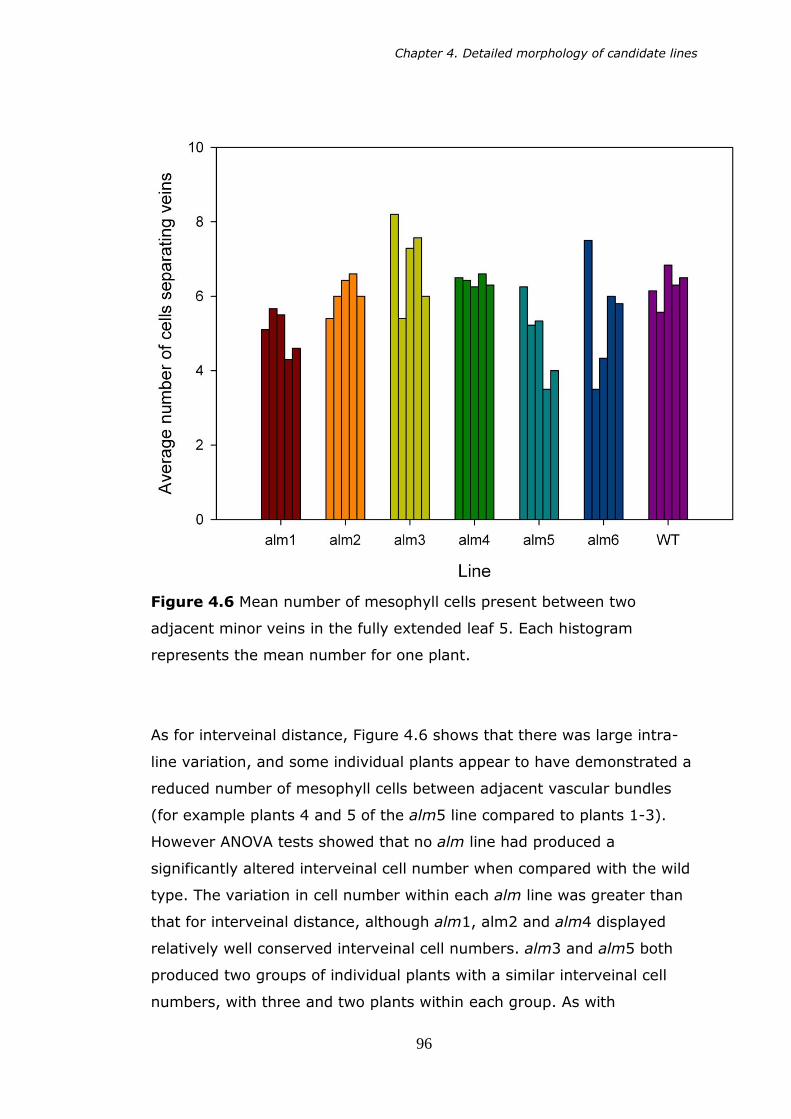
Chapter 4. Detailed morphology of candidate lines
96
Figure 4.6 Mean number of mesophyll cells present between two
adjacent minor veins in the fully extended leaf 5. Each histogram
represents the mean number for one plant.
As for interveinal distance, Figure 4.6 shows that there was large intra-
line variation, and some individual plants appear to have demonstrated a
reduced number of mesophyll cells between adjacent vascular bundles
(for example plants 4 and 5 of the alm5 line compared to plants 1-3).
However ANOVA tests showed that no alm line had produced a
significantly altered interveinal cell number when compared with the wild
type. The variation in cell number within each alm line was greater than
that for interveinal distance, although alm1, alm2 and alm4 displayed
relatively well conserved interveinal cell numbers. alm3 and alm5 both
produced two groups of individual plants with a similar interveinal cell
numbers, with three and two plants within each group. As with

Chapter 4. Detailed morphology of candidate lines
97
interveinal distance, this may indicate that interveinal cell number is not
under the control of a single dominant gene. Again it is impossible to
confirm or deny the presence of Mendelian ratios of phenotypes with this
experiment, but it remains a possibility.
The variation demonstrated by the alm6 line appears to differ slightly
from the others in that there two individuals showed a mean interveinal
cell number of approximately six cells, two individuals with approximately
four cells and one individual with seven cells. The presence of three
different observed cell numbers again suggests that alteration in mean
cell number is not due to change in a single dominant gene. It is again
possible that this effect resulted from a single recessive gene, but it is
impossible to confirm or deny the presence of a Mendelian ratio using
homozygous lines.
The airspaces within leaves were primarily observed to follow a
longitudinal orientation (Figure 4.7), and the lines demonstrated minimal
variation in the volume of air space seen in transverse sections. It can
therefore be said that the interveinal region in transverse section consists
primarily of mesophyll cells, and thus an alteration of the size of this
region should demonstrate an alteration in either the number, or the size
of these cells.
As two of the lines have shown a reduced interveinal distance but no
reduction in cell number, mesophyll cell size was studied in order to
establish whether significant variation could be observed.

Chapter 4. Detailed morphology of candidate lines
98
Figure 4.7 Longitudinal section of wild type rice leaf showing intercellular
airspaces (IC); mesophyll cells (M) and the junctions between mesophyll
cells (arrowheads). Bar = 10µm. Taken from Sage and Sage (2009).
4.4.3 Cell size
Although individual mesophyll cells can be visualised and counted using
the cleared and stained sections discussed previously, the combination of
the high density and extensive lobing of the cells can make it difficult to
accurately determine where one ends and the next begins. The small size
of the mesophyll cells also contributes to this problem (Figure 4.8). For
this reason, the plan area of isolated mesophyll cells produced using the
cell separation method outlined in Section 4.2.4 was used to determine
mesophyll cell size (Figure 4.9, Figure 4.15). Once cells had been
separated and imaged, plan area was measured by tracing the individual
cell outline in the computer software package Infinity Analyze and using
this information to calculate the enclosed area of the outline.

Chapter 4. Detailed morphology of candidate lines
99
Figure 4.8 Comparison of A wild type IR64 rice mesophyll cell and B
Arabidopsis thaliana. Note that plan area of rice mesophyll cells is
typically 20 -30% of that for Arabidopsis. The extensive lobing displayed
by the rice mesophyll cells is also apparent.
Figure 4.9 Average plan area of mesophyll cells present between two
adjacent minor veins in the fully extended leaf 5. Each histogram
represents the mean plan area of cells of one plant.
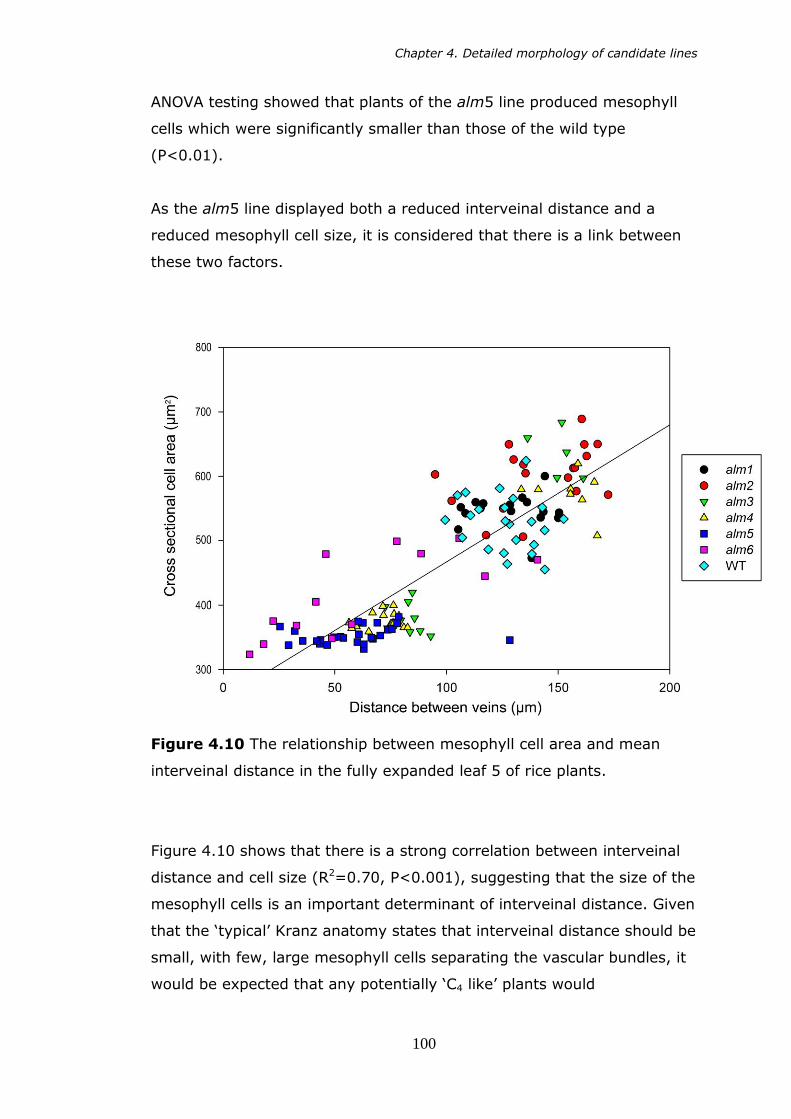
Chapter 4. Detailed morphology of candidate lines
100
ANOVA testing showed that plants of the alm5 line produced mesophyll
cells which were significantly smaller than those of the wild type
(P<0.01).
As the alm5 line displayed both a reduced interveinal distance and a
reduced mesophyll cell size, it is considered that there is a link between
these two factors.
Figure 4.10 The relationship between mesophyll cell area and mean
interveinal distance in the fully expanded leaf 5 of rice plants.
Figure 4.10 shows that there is a strong correlation between interveinal
distance and cell size (R2=0.70, P<0.001), suggesting that the size of the
mesophyll cells is an important determinant of interveinal distance. Given
that the „typical‟ Kranz anatomy states that interveinal distance should be
small, with few, large mesophyll cells separating the vascular bundles, it
would be expected that any potentially „C4 like‟ plants would
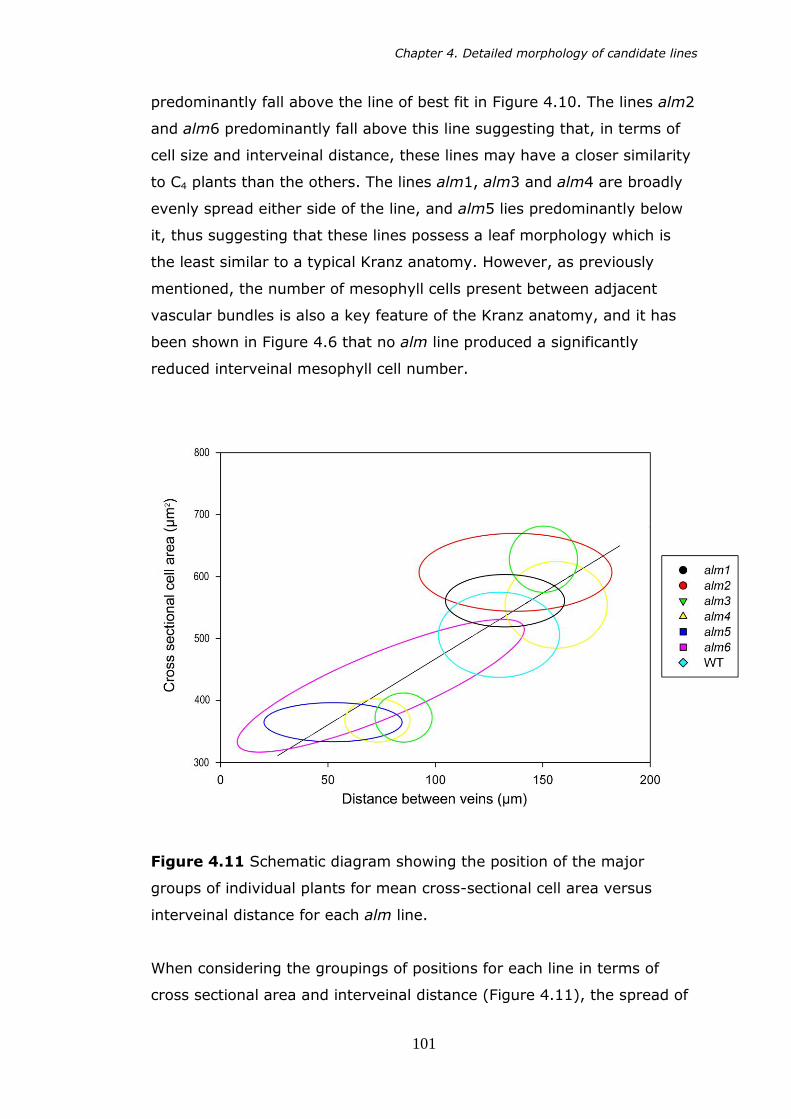
Chapter 4. Detailed morphology of candidate lines
101
predominantly fall above the line of best fit in Figure 4.10. The lines alm2
and alm6 predominantly fall above this line suggesting that, in terms of
cell size and interveinal distance, these lines may have a closer similarity
to C4 plants than the others. The lines alm1, alm3 and alm4 are broadly
evenly spread either side of the line, and alm5 lies predominantly below
it, thus suggesting that these lines possess a leaf morphology which is
the least similar to a typical Kranz anatomy. However, as previously
mentioned, the number of mesophyll cells present between adjacent
vascular bundles is also a key feature of the Kranz anatomy, and it has
been shown in Figure 4.6 that no alm line produced a significantly
reduced interveinal mesophyll cell number.
Figure 4.11 Schematic diagram showing the position of the major
groups of individual plants for mean cross-sectional cell area versus
interveinal distance for each alm line.
When considering the groupings of positions for each line in terms of
cross sectional area and interveinal distance (Figure 4.11), the spread of
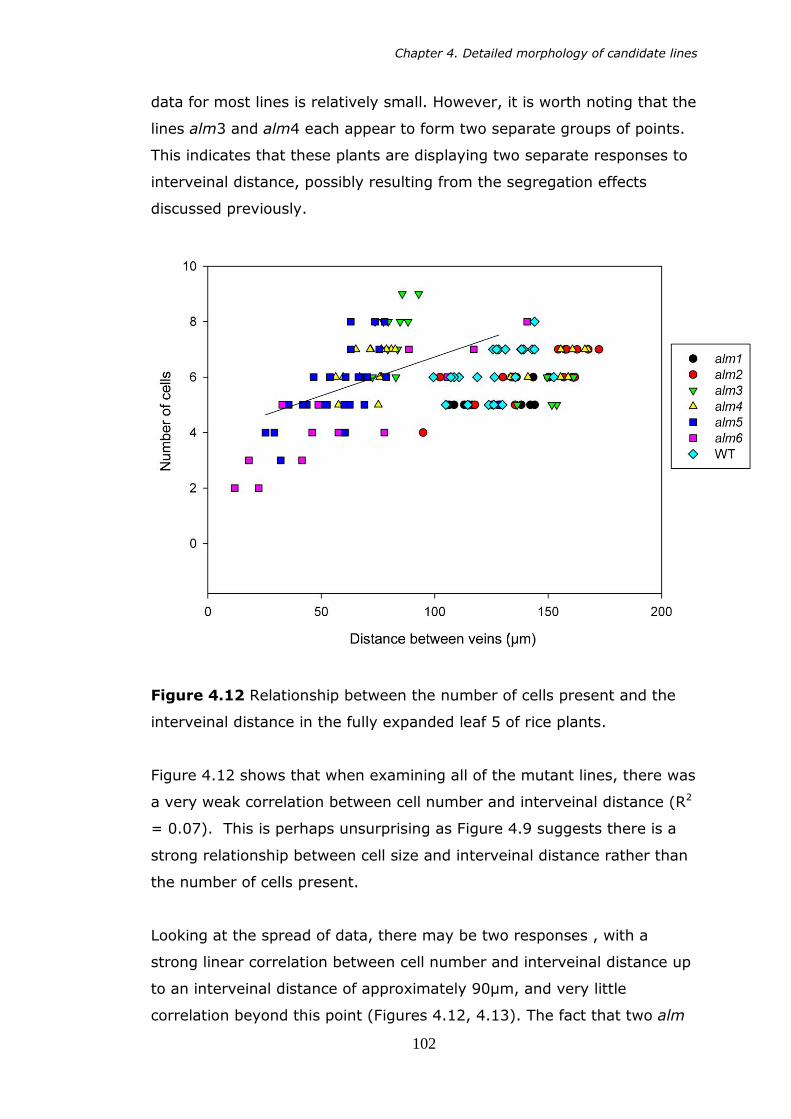
Chapter 4. Detailed morphology of candidate lines
102
data for most lines is relatively small. However, it is worth noting that the
lines alm3 and alm4 each appear to form two separate groups of points.
This indicates that these plants are displaying two separate responses to
interveinal distance, possibly resulting from the segregation effects
discussed previously.
Figure 4.12 Relationship between the number of cells present and the
interveinal distance in the fully expanded leaf 5 of rice plants.
Figure 4.12 shows that when examining all of the mutant lines, there was
a very weak correlation between cell number and interveinal distance (R2
= 0.07). This is perhaps unsurprising as Figure 4.9 suggests there is a
strong relationship between cell size and interveinal distance rather than
the number of cells present.
Looking at the spread of data, there may be two responses , with a
strong linear correlation between cell number and interveinal distance up
to an interveinal distance of approximately 90µm, and very little
correlation beyond this point (Figures 4.12, 4.13). The fact that two alm

Chapter 4. Detailed morphology of candidate lines
103
lines demonstrated two distinct responses to interveinal distance (Figure
4.11) provides further evidence that the relationship between interveinal
distance and cell number may be biphasic.
Figure 4.13 Relationship between interveinal cell number and interveinal
distance in individual plants demonstrating interveinal distances of 90µm
or less. R2 = 0.64, P < 0.01.
One explanation for this may be that cell size is normally an important
determinant of interveinal distance, but at extremely small interveinal
distances the mesophyll cells have become as small as they possibly can
whilst still remaining functional. This physical constraint means that, as
the cells have reached their minimum size, any further reduction in
interveinal distance would have to be due to a reduction in cell number.
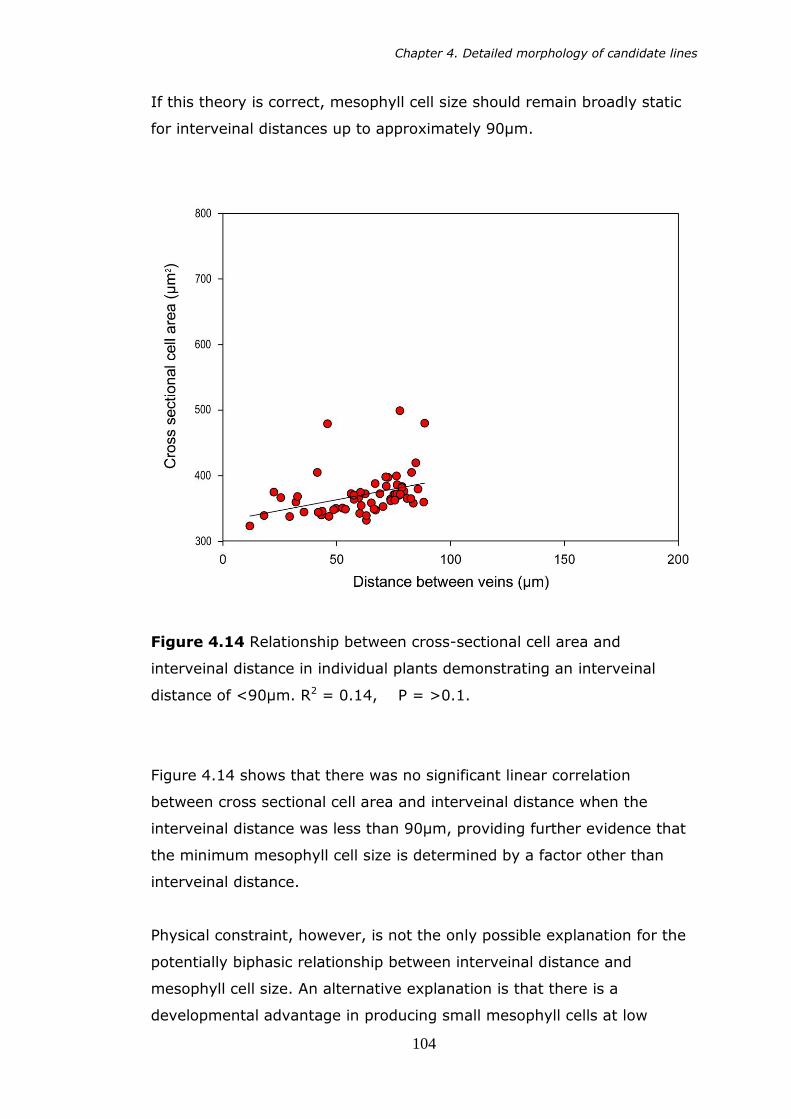
Chapter 4. Detailed morphology of candidate lines
104
If this theory is correct, mesophyll cell size should remain broadly static
for interveinal distances up to approximately 90µm.
Figure 4.14 Relationship between cross-sectional cell area and
interveinal distance in individual plants demonstrating an interveinal
distance of <90µm. R2 = 0.14, P = >0.1.
Figure 4.14 shows that there was no significant linear correlation
between cross sectional cell area and interveinal distance when the
interveinal distance was less than 90µm, providing further evidence that
the minimum mesophyll cell size is determined by a factor other than
interveinal distance.
Physical constraint, however, is not the only possible explanation for the
potentially biphasic relationship between interveinal distance and
mesophyll cell size. An alternative explanation is that there is a
developmental advantage in producing small mesophyll cells at low

Chapter 4. Detailed morphology of candidate lines
105
interveinal cell numbers, or that the production of large numbers of
interveinal mesophyll cells somehow promotes cell expansion. If this is
correct, signalling would be required during leaf development in order to
promote mesophyll cell expansion in response to an increased interveinal
distance.
4.4.4 Mesophyll cell morphology and chloroplast distribution
So far it has been shown that some of the alm lines produce leaves with
a reduced mean interveinal distance. It has also been shown that this
reduction is primarily due to a reduction in mesophyll cell size. To
investigate the effects on photosynthesis resulting from altered
mesophyll cell morphology, it is necessary to characterise the mesophyll
cells in terms of their shape and how this impacts on chloroplast
distribution. Apart from their small size, one striking feature of the rice
mesophyll cells is the degree to which they are lobed (Figure 4.15).
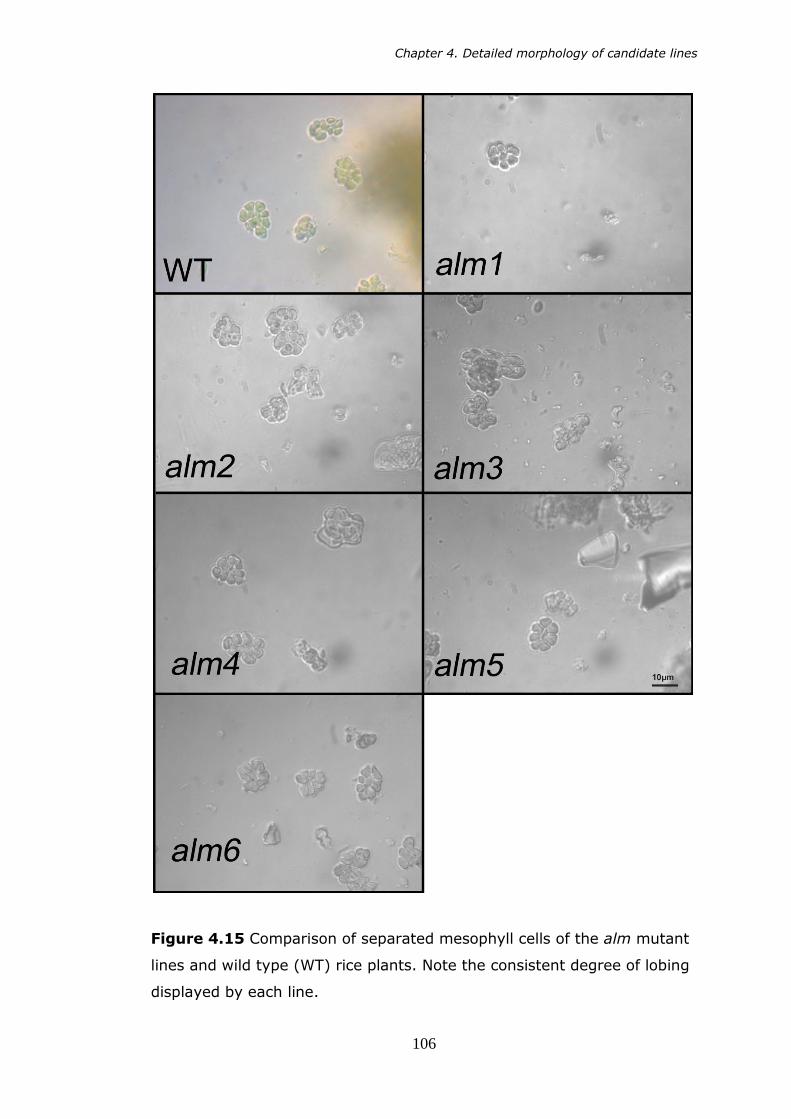
Chapter 4. Detailed morphology of candidate lines
106
Figure 4.15 Comparison of separated mesophyll cells of the alm mutant
lines and wild type (WT) rice plants. Note the consistent degree of lobing
displayed by each line.

Chapter 4. Detailed morphology of candidate lines
107
Figure 4.16 The mean number of lobes per mesophyll cell. Bars denote
single standard error of the means.
Typically the number of lobes per cell ranged from 6 to 8, with as many
as 10 lobes not being uncommon, although most of the cells observed
were towards the lower end of this range. The maximum number of lobes
observed was 12, although this was rare. Figure 4.16 shows that there
was very little variation in the extent of mesophyll cell lobing either
within or between lines, suggesting that this feature of the cells in these
mutant lines is highly conserved.

Chapter 4. Detailed morphology of candidate lines
108
Figure 4.17 Mean number of chloroplasts per mesophyll cell. Bars
denote single standard error of the means.
Chloroplasts were identified as green areas within each lobe, visualised
as outlined in Section 4.2.4. As with the number of lobes per cell, Figure
4.17 shows that the number of chloroplasts per cell was well conserved.
Residual plots showed that the number of chloroplasts per cell was not
normally distributed, following a poisson distribution instead. Regression
analysis and Dunnett‟s test showed that none of the alm lines differed
significantly compared with wild type plants.
When compared to other species, the number of chloroplasts observed
appears to be low (Figure 4.8). However, Figure 4.8 also shows that the
mesophyll cells are also extremely small in comparison to Arabidopsis
and it is possible that the maximum number of chloroplasts present
cannot be increased due to physical constraints.

Chapter 4. Detailed morphology of candidate lines
109
Figure 4.18 Relationship between the mean number of chloroplasts per
mesophyll cell and the mean number of lobes per mesophyll cell in the
fully expanded leaf 5 of rice plants.
There was a strong correlation between the mean number of chloroplasts
per mesophyll cell and the mean number of lobes (R2=0.50, P < 0.0001).
Figure 4.18 shows that the ratio of chloroplasts to lobes was
approximately 2.8:1. Although correlation may initially appear to be
weak, a huge number of values fall directly on top of one another due to
the discrete nature of number of chloroplasts and number of lobes as
characteristics and the very small range of values shown in Figures 4.16
and 4.17.
This strong correlation between chloroplast number and mesophyll cell
size indicates that there is a very strong and conserved link between
chloroplast number and the number of lobes present within mesophyll
cells. One possible explanation for this would be that during cell initiation,
mesophyll cells contain very few proplastids. Due to the small size of the

Chapter 4. Detailed morphology of candidate lines
110
mesophyll cells, these proplastids had insufficient space to divide
repeatedly, preventing an increase in plastid number. As the plastids
enlarge, the only space available within the cell is in the lobes, causing
the chloroplasts to be closely associated with the lobes, with the result
that lobe number has a large effect in determining chloroplast number.
4.4.5 Stomata
The final feature of leaf anatomy studied was the stomata. The reason for
this was that the stomata often form rows between the vascular bundles,
and therefore an alteration in vascular positioning could have an effect on
the stomata (Figure 4.19).
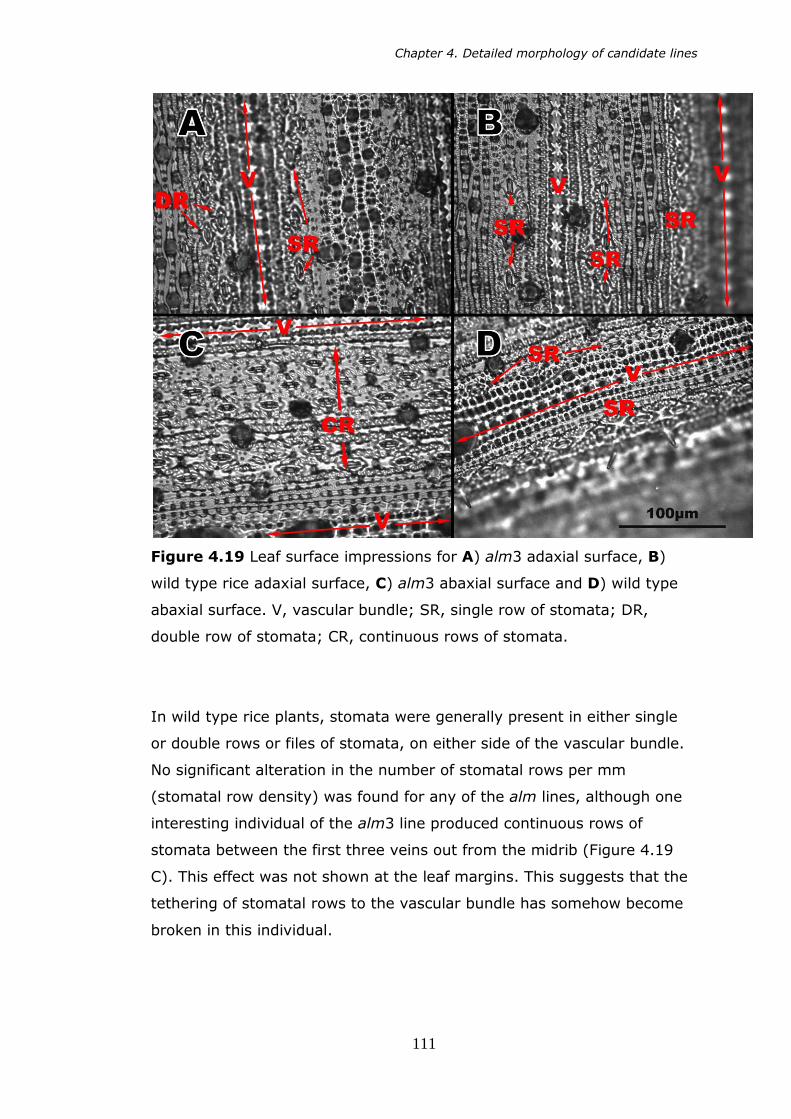
Chapter 4. Detailed morphology of candidate lines
111
Figure 4.19 Leaf surface impressions for A) alm3 adaxial surface, B)
wild type rice adaxial surface, C) alm3 abaxial surface and D) wild type
abaxial surface. V, vascular bundle; SR, single row of stomata; DR,
double row of stomata; CR, continuous rows of stomata.
In wild type rice plants, stomata were generally present in either single
or double rows or files of stomata, on either side of the vascular bundle.
No significant alteration in the number of stomatal rows per mm
(stomatal row density) was found for any of the alm lines, although one
interesting individual of the alm3 line produced continuous rows of
stomata between the first three veins out from the midrib (Figure 4.19
C). This effect was not shown at the leaf margins. This suggests that the
tethering of stomatal rows to the vascular bundle has somehow become
broken in this individual.
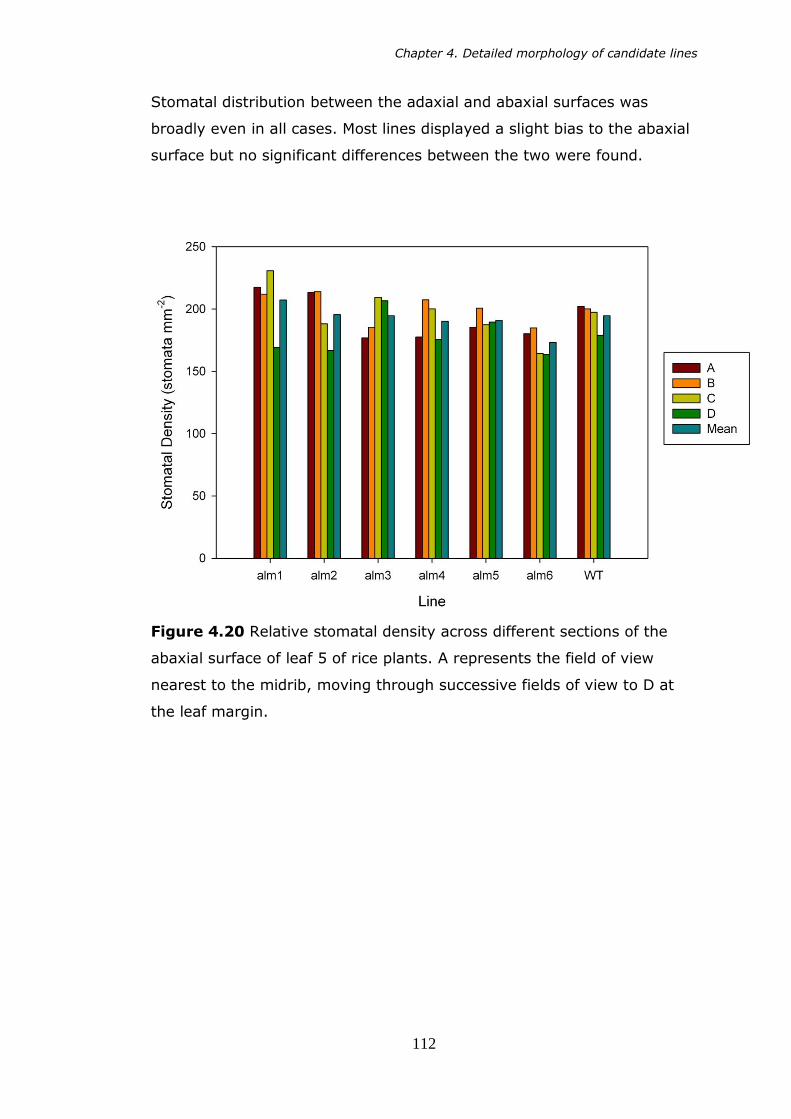
Chapter 4. Detailed morphology of candidate lines
112
Stomatal distribution between the adaxial and abaxial surfaces was
broadly even in all cases. Most lines displayed a slight bias to the abaxial
surface but no significant differences between the two were found.
Figure 4.20 Relative stomatal density across different sections of the
abaxial surface of leaf 5 of rice plants. A represents the field of view
nearest to the midrib, moving through successive fields of view to D at
the leaf margin.

Chapter 4. Detailed morphology of candidate lines
113
Figure 4.21 The relative stomatal density across different sections of the
adaxial surface of 5th leaf of rice plants. A represents the field of view
nearest to the midrib, moving out through successive fields of view out to
D at the leaf margin.
4.5 Discussion
4.5.1 Interveinal distance and cell number
During the screening process outlined in Chapter 3, interveinal distance
was used in an attempt to identify mutant lines which were displaying a
slight shift towards a C4-like leaf anatomy. This was done to provide a
rapid screening process under the assumption that interveinal distance
would be a good indicator of interveinal cell number, and was chosen
because a key feature of the Kranz anatomy is a reduced number of
mesophyll cells between vascular bundles. However, Figures 4.10 and
4.12 show that in the majority of cases this assumption was not correct,
Chapter 4. Detailed morphology of candidate lines
114
and alterations in interveinal distance were instead coupled with
alterations in mesophyll cell size rather cell number. In spite of this,
however, Figure 4.13 shows that there was a good correlation between
cell number and interveinal distance at very small interveinal distances.
This observation suggests that, although not accurate in many cases,
screening for a reduced interveinal distance may be an appropriate
method for identifying plants which possess a reduced interveinal cell
number, providing that the reduction in interveinal distance is large
enough.
4.5.2 Genetics
As the lines were from selfed M4 seed, it was expected that the lines
would be broadly homozygous and that the variation which was apparent
within individual lines would be not be observed. For this reason, the
focus of the experimental design was to study a larger number of lines
with fewer replicates than would be required for a genetic assessment of
the lines. For this reason, although it is possible to suggest the presence
of Mendelian ratios of inheritance, it is not possible to prove their
existence within this study.
However, if Mendelian ratios of inheritance were to be demonstrated,
this would require the inactivation of a dominant gene involved in
determining interveinal spacing during the mutagenesis process, allowing
expression of a recessive gene. If this were the case, it would not be the
first example of mutation resulting in the loss of function, providing a
potentially useful new phenotype from a crop improvement perspective.
In studies involving disease resistance in Arabidopsis, it was shown by
Zhang et al. (2003) that point mutation of the dominant SNC1 gene
resulted in the production of an inactive repressor molecule. The removal
of this repressor results in the constituent expression of R (resistance)
genes and ultimately causes the activation of both salicylic acid (SA)
dependent and independent disease resistance pathways.
4.5.3 Chloroplast number and cell size
Plastids develop from proplastids, which are present in meristematic cells
and divide prior to meristem cell division (Pyke, 1994). Owing to their
Chapter 4. Detailed morphology of candidate lines
115
small size and colourless appearance, it was not within the scope of this
investigation to investigate the numbers of proplastids present within
cells. However, other studies have shown that meristematic cells typically
contain between 10 and 20 proplastids in a variety of monocotyledonous
and dicotyledonous species (Juniper and Clowes, 1965; Cran and
Possingham, 1972; Lyndon and Robertson, 1976).
Figure 4.16 shows that the number of chloroplasts per mesophyll cell
is typically less than 17, and is strongly correlated with cell size and the
number of lobes present. Numerous other studies of various species have
also shown that mesophyll cell size is a primary determinant in
chloroplast number, suggesting that available space within the mesophyll
cell may be one of the key limiting factors in determining chloroplast
number (Ellis and Leech, 1985; Pyke and Leech, 1992, Pyke, 1999).
Assuming that the above estimate of 10 to 20 proplastids per
meristematic cell also applies to rice, this would suggest that newly
formed rice mesophyll cells already contain all of the proplastids required
for chloroplast production when they are created. This would mean that
any proplastid division within the cell is minimal, if it occurs at all. An
orthologue of the ARC3 gene identified in Arabidopsis thaliana as being
involved in the initiation of chloroplast division has been identified in rice
(Miyagishima, 2005), but little appears to be known about its role in rice.
It is also possible that, if larger rice mesophyll cells were produced, a
corresponding increase in the number of chloroplasts may be observed,
which would therefore require an increase in proplastid division to
provide the greater chloroplast numbers.
4.5.4 Stomata
It has been shown here, and was noted also by Hoshikawa (1989) that
the stomata of the wild type rice plant form in either single or double
rows adjacent to the vascular bundles. The presence of continuous rows
of stomata between adjacent veins suggests that stomatal development
had been disrupted in plants of the alm3 line.
The SCARECROW (SCR) gene was reported to regulate asymmetric
division in cells of Arabidopsis roots (Di Laurenzio et al., 1996). An

Chapter 4. Detailed morphology of candidate lines
116
orthologue of this gene has been identified in rice, OsSCR, which is
believed to play an important role in the determination of stomatal
formation (Kamiya et al., 2003). It is believed that the position of rows
where stomata are to be formed is determined before any stomata-
specific cells are produced as cells in this region uniformly express
OsSCR. OsSCR expression is then down-regulated as guard cell mother
cells are formed. The means by which OsSCR expression is limited only to
the regions flanking the vascular bundles is unknown, although it may be
hypothesised that the formation of additional rows of stomata is an effect
of OsSCR expression outside of this region.

117
Chapter 5
PHYSIOLOGICAL
RESPONSES OF THE
CANDIDATE LINES

Chapter 5. Physiological responses of the candidate lines
118
Chapter 5: PHYSIOLOGICAL RESPONSES OF CANDIDATE LINES
5.1 Introduction
Having identified mutant rice lines which are significantly altered
compared to wild type plants (Chapter 3) and then carried out a more
detailed morphological and anatomical characterisation of the mutants
(Chapter 4), the next step was to investigate the effects of mutation from
a physiological standpoint to allow correlations to be established between
the observed anatomical features and the resulting physiologies. Of
particular interest were (a) the effects of alterations in cell size on
photosynthesis and (b) the impact of changes in vein density on the
physiological responses of the plants.
5.1.1 Response to carbon dioxide
The photosynthetic response to carbon dioxide concentration provides
information regarding a variety of parameters important to leaf
physiology. The availability of carbon dioxide is a key factor in
determining the net rate of assimilation of CO2 (A) during photosynthesis,
although the relationship between CO2 concentration and A is not linear
and can be limited by a number of different factors. Farquhar, von
Caemmerer and Berry (1980) stated that increasing [CO2] will initially
result in an increase in A because CO2 is the substrate for this reaction,
and the competitive exclusion of O2 from the active sites of Rubisco gives
a reduction in levels of photorespiration (see Section 1.4 for details). The
initial linear increase in the rate of A is limited by the quantity of active
Rubisco to fix more CO2 and photosynthesis is then said to be in a
Rubisco-limited state.
As [CO2] increases, all of the available Rubisco active sites become
saturated with CO2, and A is then limited by the regeneration of the
substrate RuBP. A can no longer increase until RuBP is regenerated within
the Calvin cycle. Photosynthesis is said to be in the RuBP – regeneration
limited state.

Chapter 5. Physiological responses of the candidate lines
119
At very high [CO2], a third state may be observed whereby no further
increase in A may be observed because the leaf is unable to utilise the
products of photosynthesis (primarily triose phosphate) as fast as the
chloroplasts can supply them. This is called the triose phosphate use
(TPU) limitation, and often represents the maximum possible A (Amax)
(Sharkey et al., 2007).
Each of the three states outlined above displays a recognisable response
of A to an alteration in [CO2] which can be visualised by plotting these
parameters against one another. Using the curve fitting model produced
by Sharkey et al. (2007) and based upon the original model of Farquhar
et al. (1980), it is possible to calculate the various biochemical capacities
of photosynthesis.
5.1.2 Light response
For photosynthesis to occur, light must be absorbed by chlorophyll. The
light harvesting complexes of photosystem II and photosystem I (PSII
and PSI) are located on within the thylakoid membrane of chloroplasts.
The quanta of energy absorbed by chlorophyll cause excitation of the
chlorophyll molecule, and this energy is passed into the PSII and PSI
reaction centres where electron transport is initiated from the photolysis
of water. Electron transport is then used in the reduction of NADP+ as
well as enabling ATP synthesis. Both NADPH and ATP are then consumed
in the Calvin cycle (see Chapter 1: Introduction for more details).
Light is therefore a potentially limiting factor to photosynthesis and an
increase in absorbed light may increase photosynthetic activity. However,
there are many other factors which may also limit photosynthesis,
including environmental factors such as temperature, water or nutrient
deficiency, or genetic. In some situations, light is provided in excess of
what is required for photosynthesis (Murchie and Niyogi, 2011). In the
presence of excess light, singlet oxygen evolution can occur, which is
potentially damaging to membranes. For this reason, plants have evolved
methods of photoprotection, i.e. methods of dissipating excess energy
absorbed by chlorophyll (photochemical quenching, qp), or preventing it
from being absorbed in the first place (non-photochemical quenching,

Chapter 5. Physiological responses of the candidate lines
120
NPQ). As photoprotection involves reduction of quantum yield, it can be
considered that there is a compromise between photoprotection and
maximum photosynthetic rate. It has been shown that there can be a
level of „over-protection‟ displayed in some cases, and that a reduction in
the level of photoprotection is predicted to result in an increase in
maximum productivity without causing harm to the plant (Murchie et al.,
2009).
5.1.3 Fluorescence
As light is absorbed by chlorophyll within the chloroplasts, the energy of
the absorbed light is used to raise electrons within the chlorophyll
molecule to an excited state. As electrons are restored to their ground
state, energy is released into one of three pathways; the electron
transport chain, heat loss or fluorescence (Figure 5.1).
Figure 5.1 Schematic showing the pathways of energy release from the
excited chlorophyll molecule following capture of a photon of light. (LiCor
6400 XT user manual v6.4).
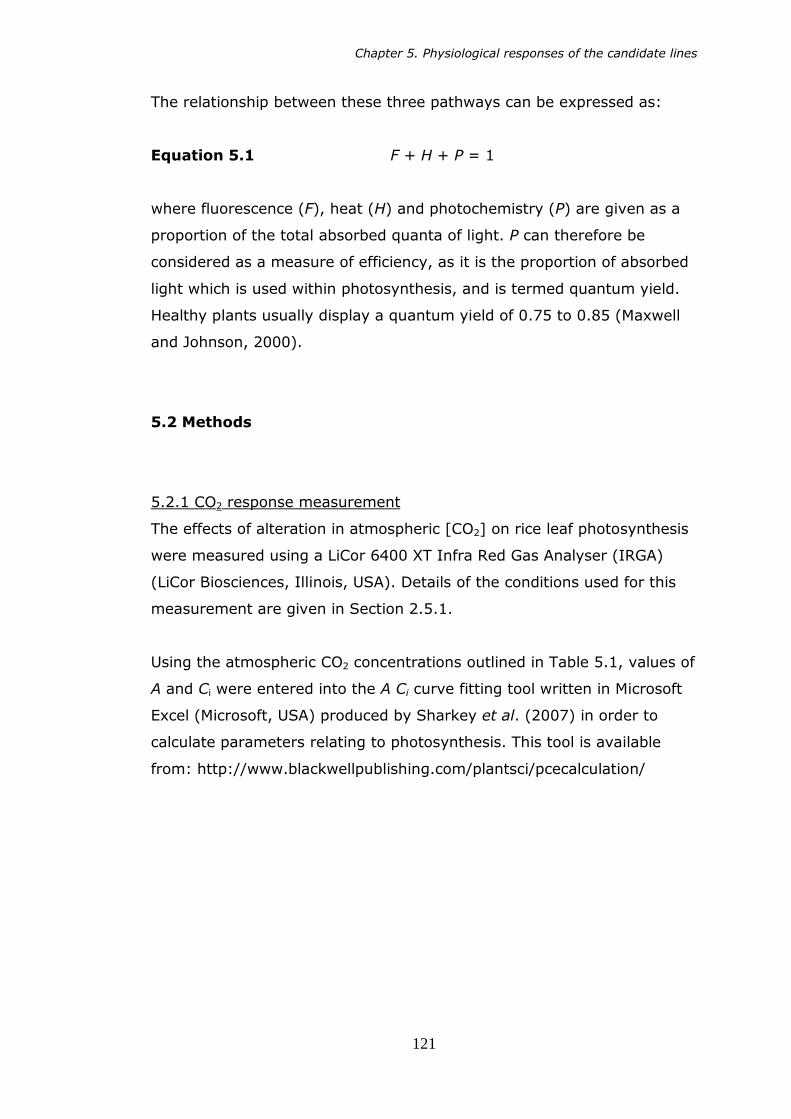
Chapter 5. Physiological responses of the candidate lines
121
The relationship between these three pathways can be expressed as:
Equation 5.1 F + H + P = 1
where fluorescence (F), heat (H) and photochemistry (P) are given as a
proportion of the total absorbed quanta of light. P can therefore be
considered as a measure of efficiency, as it is the proportion of absorbed
light which is used within photosynthesis, and is termed quantum yield.
Healthy plants usually display a quantum yield of 0.75 to 0.85 (Maxwell
and Johnson, 2000).
5.2 Methods
5.2.1 CO2 response measurement
The effects of alteration in atmospheric [CO2] on rice leaf photosynthesis
were measured using a LiCor 6400 XT Infra Red Gas Analyser (IRGA)
(LiCor Biosciences, Illinois, USA). Details of the conditions used for this
measurement are given in Section 2.5.1.
Using the atmospheric CO2 concentrations outlined in Table 5.1, values of
A and Ci were entered into the A Ci curve fitting tool written in Microsoft
Excel (Microsoft, USA) produced by Sharkey et al. (2007) in order to
calculate parameters relating to photosynthesis. This tool is available
from: http://www.blackwellpublishing.com/plantsci/pcecalculation/
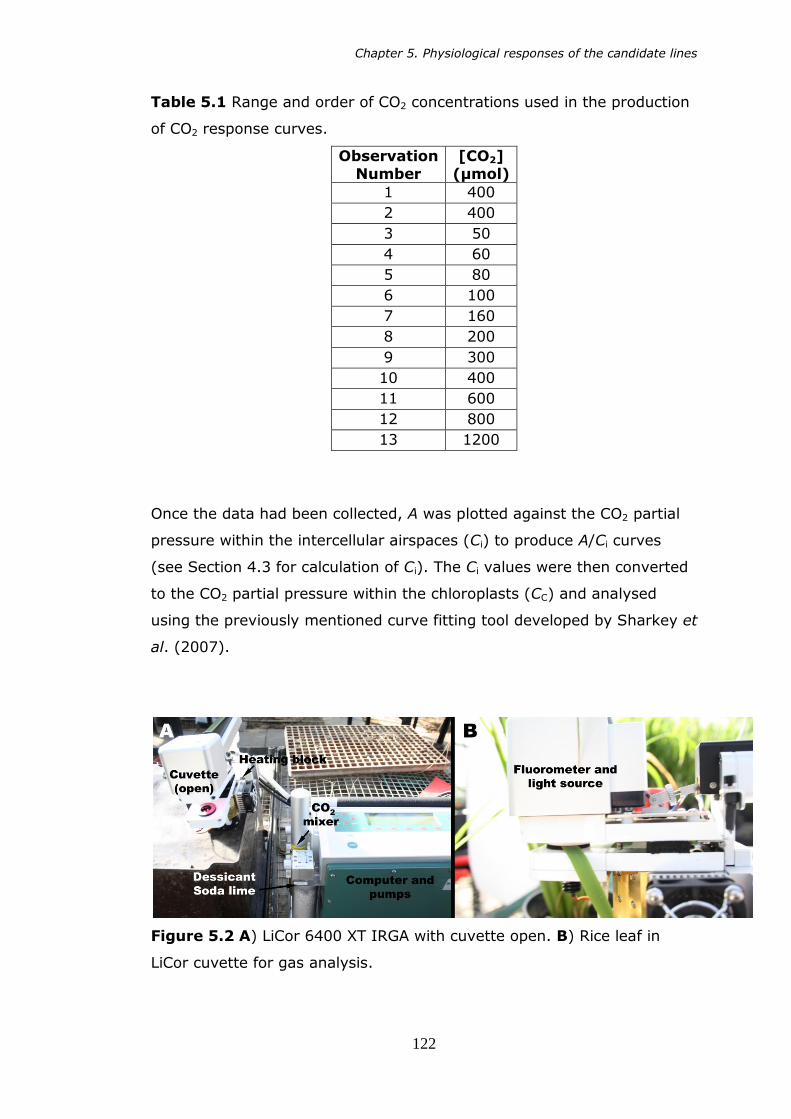
Chapter 5. Physiological responses of the candidate lines
122
Table 5.1 Range and order of CO2 concentrations used in the production
of CO2 response curves.
Observation
Number
[CO2]
(µmol)
1 400
2 400
3 50
4 60
5 80
6 100
7 160
8 200
9 300
10 400
11 600
12 800
13 1200
Once the data had been collected, A was plotted against the CO2 partial
pressure within the intercellular airspaces (Ci) to produce A/Ci curves
(see Section 4.3 for calculation of Ci). The Ci values were then converted
to the CO2 partial pressure within the chloroplasts (CC) and analysed
using the previously mentioned curve fitting tool developed by Sharkey et
al. (2007).
Figure 5.2 A) LiCor 6400 XT IRGA with cuvette open. B) Rice leaf in
LiCor cuvette for gas analysis.

Chapter 5. Physiological responses of the candidate lines
123
5.2.2 Light response measurements
Measurements were taken using the LiCor 6400 XT IRGA and details of
the atmospheric conditions used in this experiment are outlined in
Section 2.5.2. The range of PPFD values used in this experiment are
given in table 5.2.
Table 5.2 Range and order of light intensities used in the determination
of light CO2 responses
Observation Number
PAR (µmol m-2)
1 0
2 100
3 200
4 300
5 400
6 600
7 800
8 1000
9 1200
10 1500
11 2000
5.3 Plant response to CO2
As outlined in Section 5.2.1, IRGA measurements were made to
determine the response of the mutant lines to varying levels of
atmospheric CO2. However, whilst atmospheric CO2 concentration is
important, the concentration of CO2 within the leaf (Ci) has a greater
bearing on photosynthesis. Ci is calculated as follows:
Equation 5.2 (
)
where gtc is the total conductance to CO2, E is transpiration rate, Cs is the
atmospheric concentration of CO2 and A is net photosynthesis (von
Caemmerer and Farquhar, 1981). When an A/Ci curve (net
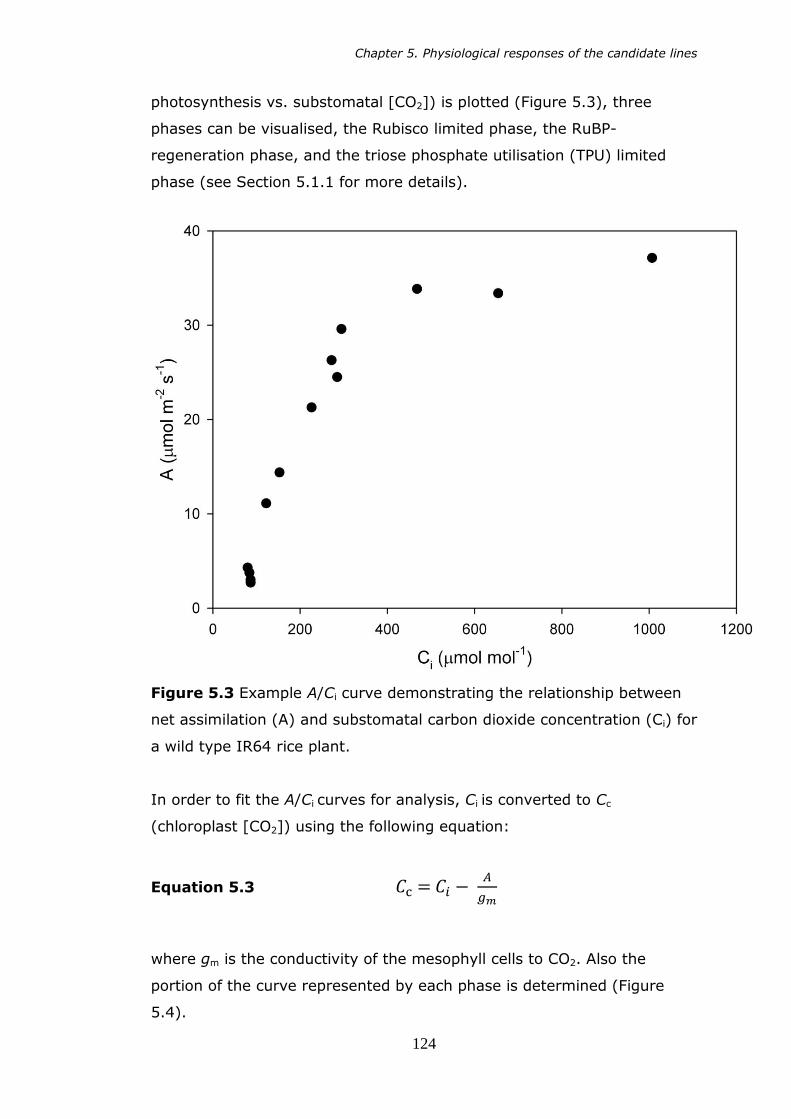
Chapter 5. Physiological responses of the candidate lines
124
photosynthesis vs. substomatal [CO2]) is plotted (Figure 5.3), three
phases can be visualised, the Rubisco limited phase, the RuBP-
regeneration phase, and the triose phosphate utilisation (TPU) limited
phase (see Section 5.1.1 for more details).
Figure 5.3 Example A/Ci curve demonstrating the relationship between
net assimilation (A) and substomatal carbon dioxide concentration (Ci) for
a wild type IR64 rice plant.
In order to fit the A/Ci curves for analysis, Ci is converted to Cc
(chloroplast [CO2]) using the following equation:
Equation 5.3
where gm is the conductivity of the mesophyll cells to CO2. Also the
portion of the curve represented by each phase is determined (Figure
5.4).

Chapter 5. Physiological responses of the candidate lines
125
Figure 5.4 Sample output from the curve fitting tool. Blue circles (Aobs)
denote the observed values of A at a known Cc. The red line represents
the portion of photosynthesis described by the Rubisco-limited state, the
green line the RuBP-regeneration state and the yellow line the TPU state.
A, WT; B, alm1; C, alm2; D, alm3; E, alm4; F, alm5; G, alm6.
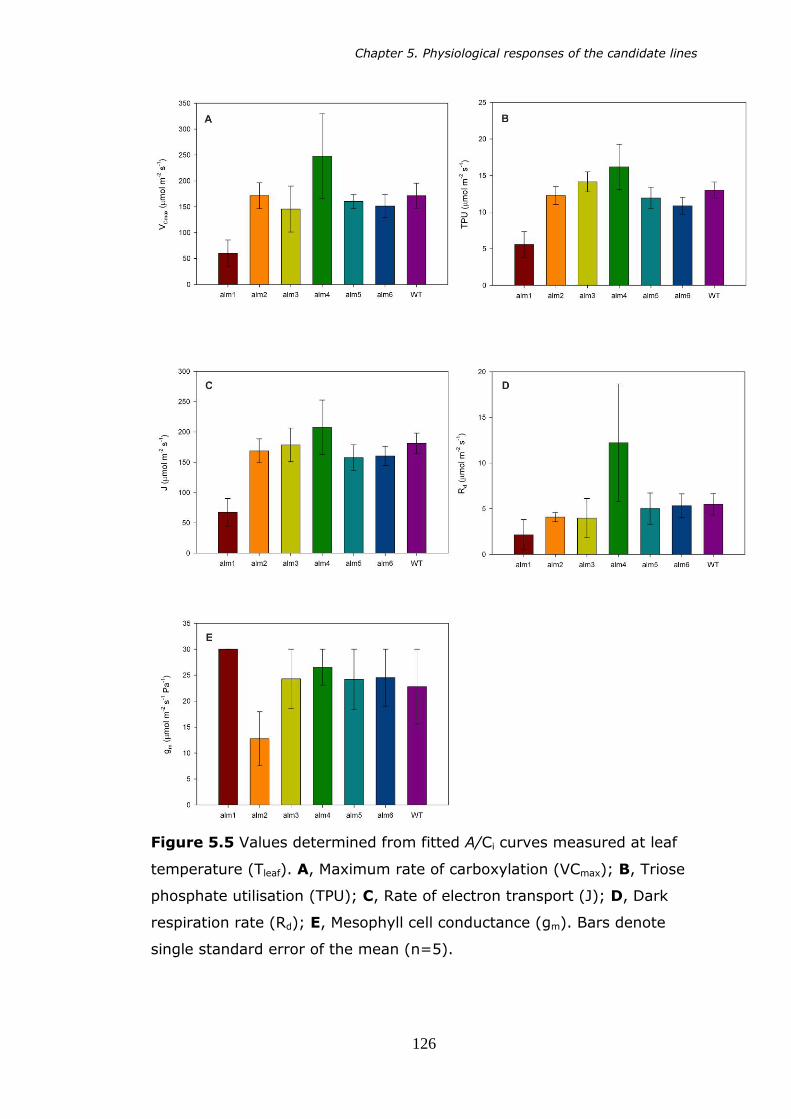
Chapter 5. Physiological responses of the candidate lines
126
Figure 5.5 Values determined from fitted A/Ci curves measured at leaf
temperature (Tleaf). A, Maximum rate of carboxylation (VCmax); B, Triose
phosphate utilisation (TPU); C, Rate of electron transport (J); D, Dark
respiration rate (Rd); E, Mesophyll cell conductance (gm). Bars denote
single standard error of the mean (n=5).
Chapter 5. Physiological responses of the candidate lines
127
Figure 5.5 shows that the alm lines displayed a variety of different
responses to CO2 in terms of maximum rate of carboxylation by Rubisco
(VCmax), triose phosphate utilisation (TPU), rate of electron transport (J)
dark respiration rate (Rd) and mesophyll cell conductance. However,
these observations are based on the measured values at leaf
temperature. As all measurements were taken in the controlled
environment room the variation in leaf temperature was small (29.0oC –
30.2oC); however it was still necessary to normalise these values to an
equal temperature, within the curve fitting model to account for
temperature dependant differences in enzyme kinetics and allow accurate
direct comparison between the lines (Figure 5.6).

Chapter 5. Physiological responses of the candidate lines
128
Figure 5.6 Values determined from fitted A/Ci curves, normalised to a
leaf temperature of 25oC. A, Maximum rate of carboxylation (VCmax); B,
Triose phosphate utilisation (TPU); C, Rate of electron transport (J); D,
Dark respiration rate (Rd); E, Mesophyll conductance (gm). Bars denote
single standard error of the mean (n=5).
Chapter 5. Physiological responses of the candidate lines
129
Figure 5.6 shows that although variation was present, there were few
significant differences were detected when the alm lines were compared
to wild type plants. ANOVA testing showed that plants of the alm1 line
displayed a significantly reduced maximum rate of carboxylation (VCmax)
compared with wild type rice plants (P<0.05, Figure 5.6 A). No other alm
line displayed a significant alteration. Carboxylation is carried out by
Rubisco and the observed reduction in VCmax could be due to a number of
factors including a reduction in the quantity of Rubisco present within the
leaf, reduced specificity of Rubisco to CO2, or an increased affinity for O2.
As the kinetic properties of Rubisco such as O2 and CO2 affinity are highly
conserved between higher plant species, the most likely explanations are
a reduced amount of Rubisco protein, or an inhibition of its activity. This
could potentially be caused by reduced Rubisco activase activity or
inhibition through abiotic stress, which is itself unlikely under the
controlled growth conditions.
Figure 5.6B shows that alm1 plants demonstrated a low triose
phosphate utilisation (TPU) compared to wild type IR64 rice plants.
Despite the large standard error demonstrated, ANOVA showed that TPU
was lower in alm1 plants than in wild type plants (P < 0.05). TPU in the
other alm lines was not significantly altered compared to wild type plants.
alm1 plants also demonstrated a lower rate of electron transport (J)
than those of the wild type (Figure 5.6 C) when compared using ANOVA
(P < 0.01). Although variation in J was observed in the other alm lines,
this was not significant (P > 0.05 in all cases).
Although alm3 plants displayed a large elevation in dark respiration
rate (Rd) compared to wild type plants and alm1 plants a slightly reduced
rate, ANOVA testing showed neither to be significantly altered (P= 0.60
and 0.16 respectively). Rd specifically relates to the dark respiratory
release of CO2 and does not include photorespiration. This would suggest
that no alm line displayed a significant alteration in terms of
mitochondrial activity or number.
No alm line showed significant alteration in mesophyll conductance
(gm) compared to wild type plants.
Chapter 5. Physiological responses of the candidate lines
130
5.4 Response to PAR
As stated in Section 5.1.3, quantum yield can be considered as the
fraction of absorbed PAR which is consumed in photochemistry, and is a
measure of photosynthetic efficiency. Quantum yield of photosynthesis
can be derived from the light-limited, linear, portion of light response
curves. However, quantum yield can also be calculated using
fluorescence measurements from dark adapted plants.
Equation 5.1 states that the energy from PAR wavelengths absorbed
by chlorophyll may be released as heat (H), fluorescence (F) or in the
photochemical reactions (P). At saturating PPFD levels no further increase
in P is possible with increasing PPFD, so P becomes zero and de-
excitation of electrons is assumed to be due to H and F, which are at
their maximal values (Hm and Fm) respectively. This gives the equations:
Equation 5.4
so
Equation 5.5
It is assumed that the ratio of heat to fluorescence does not change
during a short pulse of saturating light, therefore:
Equation 5.6
By substitution of Equation 5.5, this can be re-written as
Equation 5.7 ( )
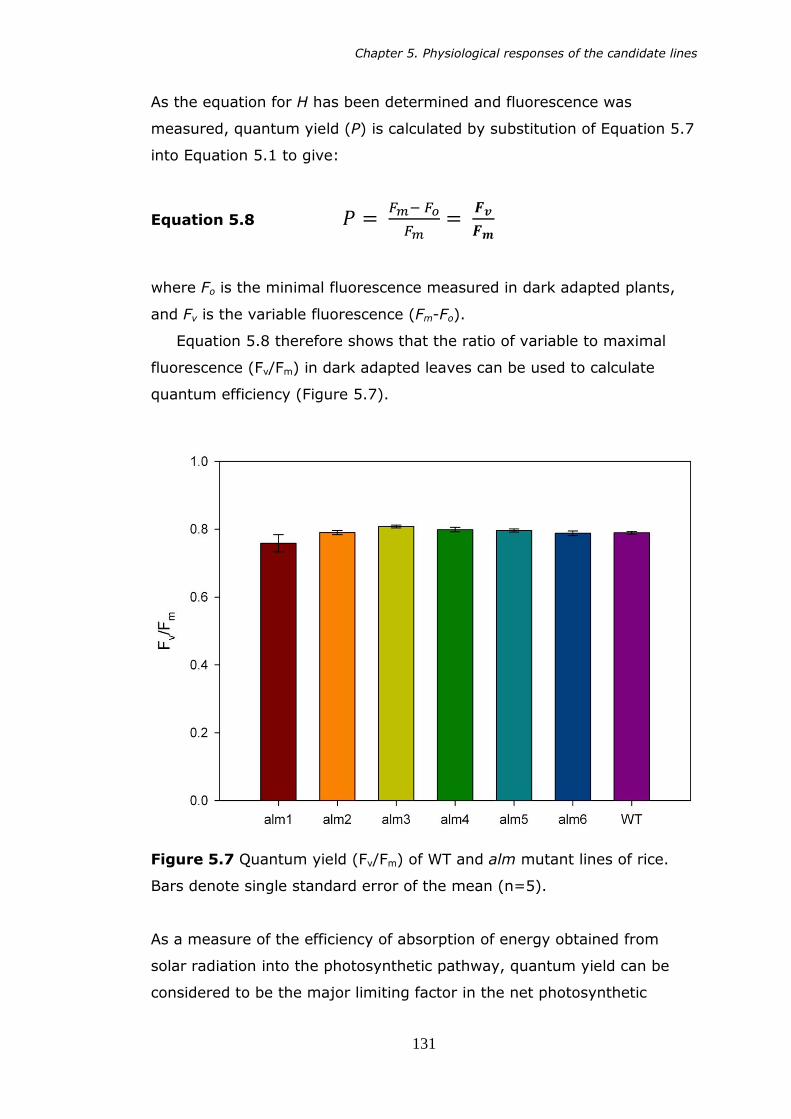
Chapter 5. Physiological responses of the candidate lines
131
As the equation for H has been determined and fluorescence was
measured, quantum yield (P) is calculated by substitution of Equation 5.7
into Equation 5.1 to give:
Equation 5.8
where Fo is the minimal fluorescence measured in dark adapted plants,
and Fv is the variable fluorescence (Fm-Fo).
Equation 5.8 therefore shows that the ratio of variable to maximal
fluorescence (Fv/Fm) in dark adapted leaves can be used to calculate
quantum efficiency (Figure 5.7).
Figure 5.7 Quantum yield (Fv/Fm) of WT and alm mutant lines of rice.
Bars denote single standard error of the mean (n=5).
As a measure of the efficiency of absorption of energy obtained from
solar radiation into the photosynthetic pathway, quantum yield can be
considered to be the major limiting factor in the net photosynthetic
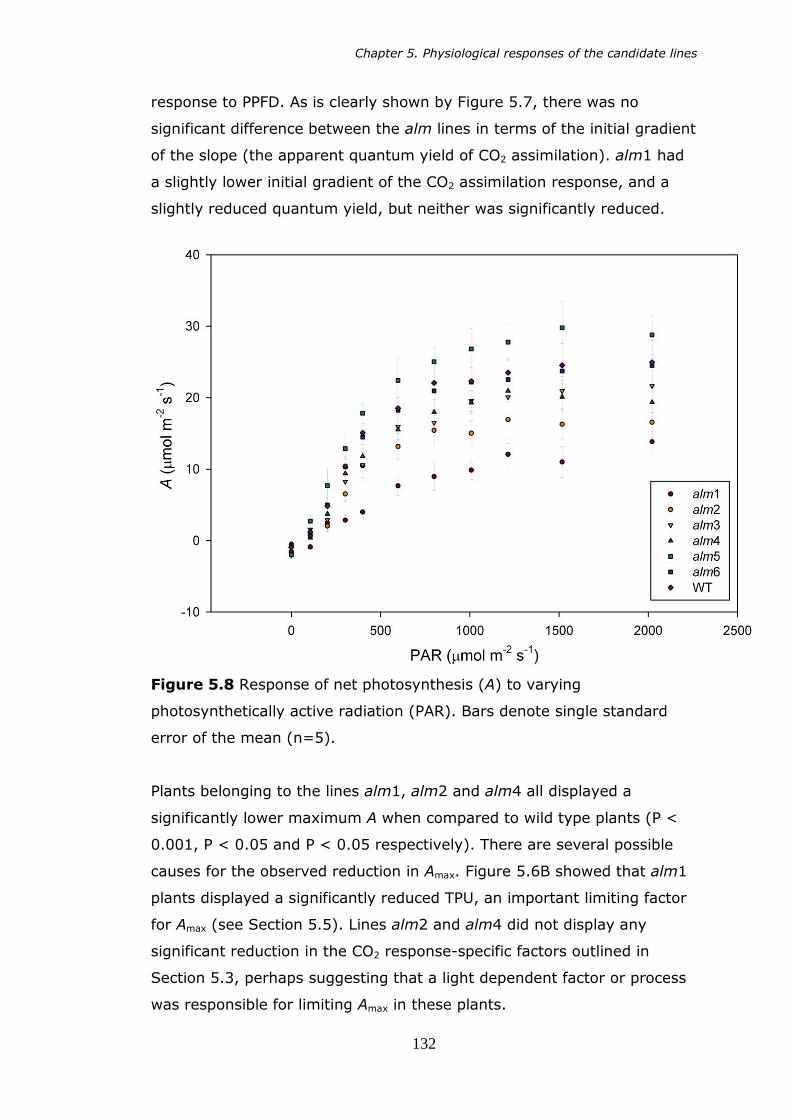
Chapter 5. Physiological responses of the candidate lines
132
response to PPFD. As is clearly shown by Figure 5.7, there was no
significant difference between the alm lines in terms of the initial gradient
of the slope (the apparent quantum yield of CO2 assimilation). alm1 had
a slightly lower initial gradient of the CO2 assimilation response, and a
slightly reduced quantum yield, but neither was significantly reduced.
Figure 5.8 Response of net photosynthesis (A) to varying
photosynthetically active radiation (PAR). Bars denote single standard
error of the mean (n=5).
Plants belonging to the lines alm1, alm2 and alm4 all displayed a
significantly lower maximum A when compared to wild type plants (P <
0.001, P < 0.05 and P < 0.05 respectively). There are several possible
causes for the observed reduction in Amax. Figure 5.6B showed that alm1
plants displayed a significantly reduced TPU, an important limiting factor
for Amax (see Section 5.5). Lines alm2 and alm4 did not display any
significant reduction in the CO2 response-specific factors outlined in
Section 5.3, perhaps suggesting that a light dependent factor or process
was responsible for limiting Amax in these plants.
Chapter 5. Physiological responses of the candidate lines
133
Curves fitted to the light response graphs using the statistical
program Photosyn Assistant (Dundee Scientific, Scotland) showed that A
at light respiration (mitochondrial respiration plus photorespiration) was
in the range -2.15 to -2.39 µmol m-2 s-1 in plants of the alm2-6 lines and
the wild type. Assimilation under light respiration conditions in alm1
plants was much higher at -1.30 µmol m-2 s-1. Dark respiration was
unchanged in plants of the alm1 line (Figure 5.6D), suggesting that alm1
plants displayed a reduction in photorespiration compared to the other
alm lines.
Curve fitting also showed variation in the light compensation point
(the PPFD at which net assimilation is 0). The light compensation point
was reasonably well conserved in lines alm5 and alm6 and wild type
plants, at 45 – 50µmol m-2 s-1, but was much greater in the alm4, alm3,
alm2 and alm1 lines, at 65.4, 68.0, 76.9 and 82.4 µm-2 s-1 respectively.
This suggests that plants of these lines displayed an increasingly
compromised photosynthetic response to light, as is reflected by the
lower values for Amax displayed in Figure 5.8.
5.4.1 Gas exchange response to varying PAR
As the rate of photosynthesis (A) increases, it is expected that the rate of
transpiration will also increase due to the increase in stomatal aperture
which is required in plants which do no possess the crassulacean acid
metabolic (CAM) pathway in order to increase CO2 supplies to support the
increasing rate of photosynthesis. However, transpiration is often limited
by partial or complete stomatal closure when water supply is restricted,
as an increasing rate of water loss causes the risk of water stress.
Therefore photosynthetic rates are closely linked to stomatal aperture to
prevent unwanted water loss by transpiration (Figure 5.9).

Chapter 5. Physiological responses of the candidate lines
134
Figure 5.9 Response of transpiration rate (E), to varying PAR. Bars
denote single standard error of the mean (n=5).
Figure 5.9 shows that the majority of the alm lines displayed no
significant difference in levels of transpiration when compared to wild
type plants. alm1 displayed almost zero transpiration, this would suggest
that plants of the alm1 line either do not produce stomata, or produce
stomata which are predominantly closed. As it was shown in Chapter 4
that plants of the alm1 line possessed a stomatal density which was not
significantly different to wild type plants, this suggests that although
stomata are present, they remain closed to give an extremely low
stomatal conductance. This would also explain the relatively low levels of
net photosynthesis displayed even at high light intensities shown by alm1
plants in Figure 5.8. alm2 did not display a statistically altered
transpiration rate until very high PPFD levels were reached. Transpiration
in alm2 plants was significantly lower than in the wild type at a PPFD of
2000µmol m-2 suggesting either that alm2 plants produced a reduced

Chapter 5. Physiological responses of the candidate lines
135
number of stomata or stomatal conductance is being limited at high PPFD
levels. As with alm1, alm2 plants displayed no significant reduction in
stomatal density (Chapter 4), suggesting that stomatal conductance was
limited. It is possible that the stomata of alm2 plants were smaller than
those of the wild type, giving a reduced maximum stomatal aperture and
in turn a reduced stomatal conductance, or stomatal size may be
unchanged but signalling within the plant could be causing their partial
closure. Alternatively, water uptake may have been limited in alm1 and
alm2 plants, which would have reduced transpiration even if stomata
were fully open. Drought conditions would have also given this effect,
although this was not the case in the present study as the plants were
grown in a hydroponic system with ample available water (see Chapter 2
for methods relating to plant production).

Chapter 5. Physiological responses of the candidate lines
136
Figure 5.10 Response of substomatal CO2 concentration (Ci) to PAR flux.
Bars denote single standard error of the mean (n=5).
The shape of the curves shown in Figure 5.10 can be explained as
follows. As the rate of photosynthesis increases, the demand for CO2 also
increases. As PPFD is increased and high rates of photosynthesis are
reached CO2 cannot diffuse into the leaf as fast as it is consumed even
when the stomata are fully open and this causes Ci to decrease. If Ci
becomes limited to such an extent that photosynthesis is inhibited, a
slight rise in Ci may be observed as CO2 is released by respiration.
ANOVA testing showed that alm1 plants displayed a significantly
higher Ci at the PPFD values >400µmol m-2s-1 compared to the wild type
plants (P < 0.01). This would suggest either that photosynthesis was
consuming less carbon dioxide than wild type plants, or that CO2 was
able to diffuse into the leaf to maintain higher levels of Ci. The previously
mentioned limitations on TPU and Amax displayed by plants of the alm1
line suggest that photosynthesis was limited and did not consume CO2 at
the same rate as wild type plants.
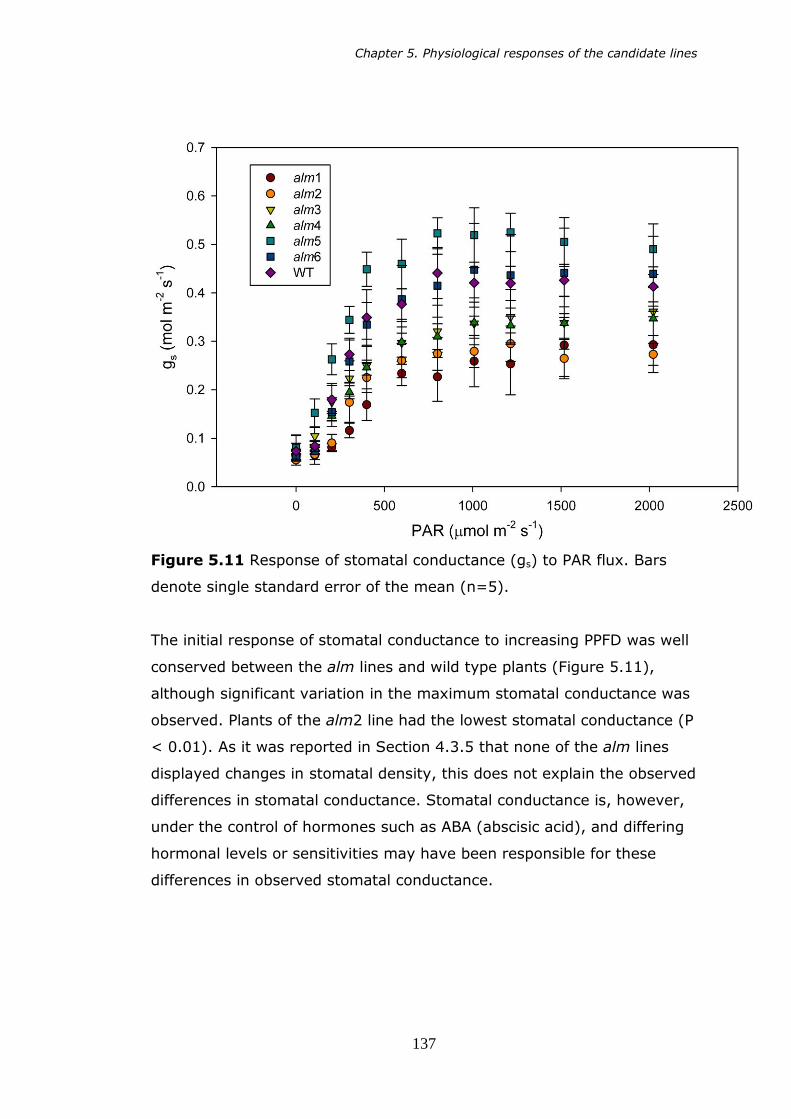
Chapter 5. Physiological responses of the candidate lines
137
Figure 5.11 Response of stomatal conductance (gs) to PAR flux. Bars
denote single standard error of the mean (n=5).
The initial response of stomatal conductance to increasing PPFD was well
conserved between the alm lines and wild type plants (Figure 5.11),
although significant variation in the maximum stomatal conductance was
observed. Plants of the alm2 line had the lowest stomatal conductance (P
< 0.01). As it was reported in Section 4.3.5 that none of the alm lines
displayed changes in stomatal density, this does not explain the observed
differences in stomatal conductance. Stomatal conductance is, however,
under the control of hormones such as ABA (abscisic acid), and differing
hormonal levels or sensitivities may have been responsible for these
differences in observed stomatal conductance.

Chapter 5. Physiological responses of the candidate lines
138
5.4.2 Electron transport in photosynthesis
The majority of rice alm lines displayed no significant alteration in the
quantum yield of photosystem II (ΦPSII) compared with wild type plants.
However, plants of the alm1 line displayed a significantly reduced ETR (P
< 0.001) at all PPFD levels except darkness.
Figure 5.12 Response of quantum yield of photosystem II (ΦPSII) to
varying PAR flux. Bars denote single standard error of the mean.
Electron transport rate is a function of ΦPSII and can be described by the
following equation:
Equation 5.9 (
)
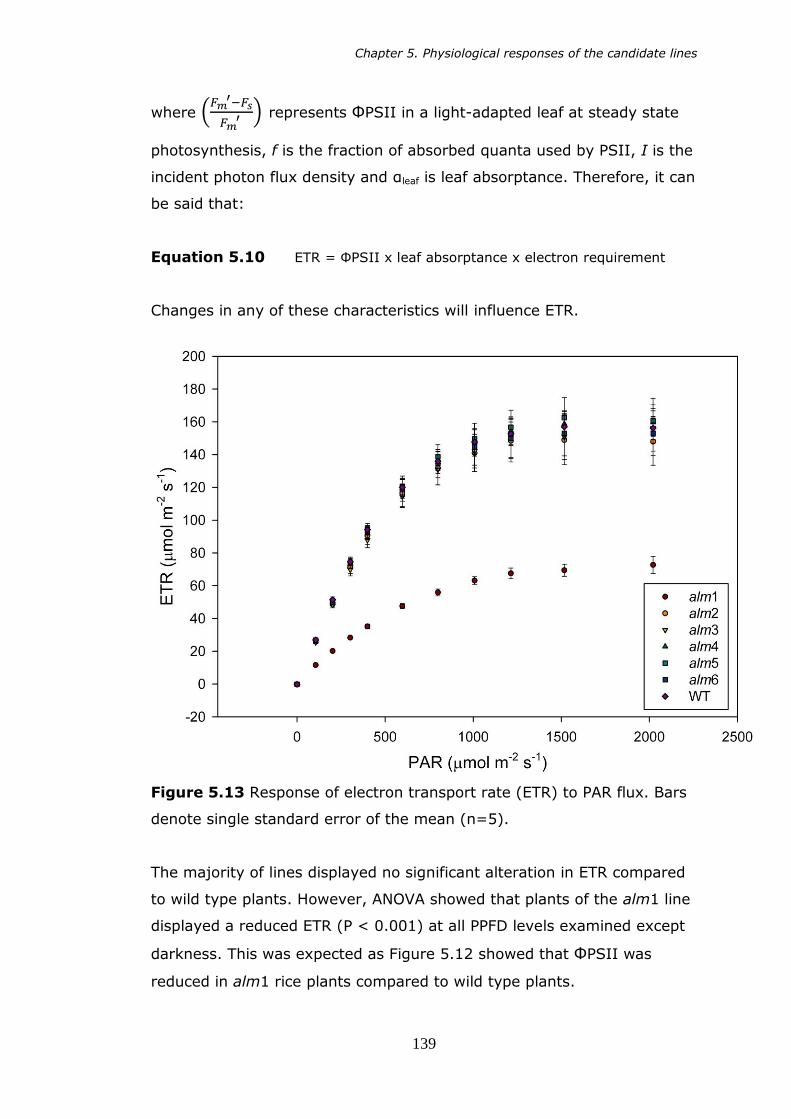
Chapter 5. Physiological responses of the candidate lines
139
where (
) represents ΦPSII in a light-adapted leaf at steady state
photosynthesis, f is the fraction of absorbed quanta used by PSII, I is the
incident photon flux density and αleaf is leaf absorptance. Therefore, it can
be said that:
Equation 5.10 ETR = ΦPSII x leaf absorptance x electron requirement
Changes in any of these characteristics will influence ETR.
Figure 5.13 Response of electron transport rate (ETR) to PAR flux. Bars
denote single standard error of the mean (n=5).
The majority of lines displayed no significant alteration in ETR compared
to wild type plants. However, ANOVA showed that plants of the alm1 line
displayed a reduced ETR (P < 0.001) at all PPFD levels examined except
darkness. This was expected as Figure 5.12 showed that ΦPSII was
reduced in alm1 rice plants compared to wild type plants.

Chapter 5. Physiological responses of the candidate lines
140
As none of the other alm lines demonstrated an alteration in ΦPSII or
ETR, it can be assumed that absorptance of the leaf and the electron
requirement of photosynthesis also remain unchanged in these lines.
5.4.3 Photoprotection
Figure 5.14 Response of photochemical quenching (qP) to PAR flux. Bars
denote single standard error of the mean (n=5).
alm1 demonstrated extremely low levels of photochemical quenching
(qp), with values of less than 0.4 even at low PPFD levels (Figure 5.14).
ANOVA testing showed this was lower than wild type rice plants
(P<0.001). This observation suggests that alm1 plants were very highly
photoinhibited at PPFD levels which were not saturating to wild type
plants. Given the observed lack of activity at low PPFD levels
demonstrated by plants of the alm1 line, it can be assumed that PSII
electron transport was greatly inhibited. This theory also explains the

Chapter 5. Physiological responses of the candidate lines
141
observed low ETR displayed by alm1 plants (Figure 5.13) and the
reduction in assimilation (Figure 5.8) compared to wild type rice plants.
Non-photochemical quenching (NPQ) in the alm lines was largely
unchanged compared to wild type plants (Figure 5.15).
Figure 5.15 Response of non-photochemical quenching (NPQ) to PAR
flux. Bars denote single standard error of the mean (n=5).
At low PPFD levels NPQ was initially present at lower levels in plants of
the alm1 line than in wild type rice plants, however NPQ became more
extensive at higher light intensities in alm1 than the wild type. However,
ANOVA testing did not show the difference in levels of NPQ to be
significant (P = 0.08 at 2000 µmol m-2 s-1 PAR). The low levels of
assimilation demonstrated by alm1 plants (Figure 5.8) suggest that much
of the quanta absorbed by the leaf is not used to drive photosynthesis,
and would therefore require elevated levels of NPQ to dissipate excess
energy and prevent damage to the leaf.
Chapter 5. Physiological responses of the candidate lines
142
5.5 Discussion
It was hypothesised that the anatomical responses described previously
may influence the physiological responses displayed in this chapter for a
number of reasons. It was shown in Chapter 4 that several of the alm
lines produced mesophyll cells which were significantly smaller than in
wild type rice. Dunstone and Evans (1974) noted that the mesophyll cells
of diploid wheat species were significantly smaller than the more
commonly grown hexaploid species and it was shown that photosynthetic
rate in the Triticum species was negatively correlated with mesophyll cell
size. This phenomenon was also observed in Lolium perenne (Wilson and
Cooper, 1969), and was shown to exist in fifteen species including
sorghum, cotton, soybean, sunflower and maize by El-Shakawy and
Hesketh (1965). The observed increased in A may be the result of an
increased mesophyll conductance to CO2 due to the increased surface
area to volume ratio of smaller mesophyll cells, although this is
speculation. It was therefore hypothesised that alm lines producing
mesophyll cells with a significantly reduced plan area compared to wild
type plants may display an improved photosynthetic response.
A number of alm lines also displayed a significantly reduced
interveinal distance, i.e. vein density was increased. It was hypothesised
that increased vein density may increase hydraulic conductance, with
which A is known to be positively correlated. It was stated by Roth-
Nebelsick et al. (2001) that the arrangement and density of vascular
architecture affect the transport of water and carbohydrates by
influencing hydraulic conductance. Furthermore, it was shown by
Brodribb et al. (2007) that vein density, leaf thickness and cell shape
were strongly correlated with hydraulic conductance and maximum
photosynthetic rate. It was later stated by Brodribb and Feild (2010) that
increasing hydraulic conductance allowed the evolution of increased
photosynthetic capacity. The reasoning for this was that increased
hydraulic conductance allows more rapid transport of water throughout
the plant, meaning that stomatal aperture can increase without risking
water stress through increased transpiration, providing water is available
to the root system. Increases in stomatal aperture cause an increase
Chapter 5. Physiological responses of the candidate lines
143
stomatal conductance, thereby enhancing diffusion of CO2 into the leaf
and providing necessary substrate to support an increase in A.
However, although these factors would potentially allow an increase in A,
no alm line showed any increase in photosynthetic capacity. Figure 5.6D
shows that dark respiration remained unchanged in the alm lines, which
shows that these lines displayed a reduction in A compared to wild type
rice plants.
Plants belonging to the alm1 line especially were highly stressed, as is
clearly shown by the extreme reduction in qp compared to the wild type
(Figure 5.14). Physically, alm1 plants were smaller than wild-type plants
at sampling age and were also wilty in appearance. When growth is
restricted, large levels of excess excitation energy may occur (Demmig–
Adams and Adams, 2006), which can cause the formation of reactive
oxygen species (ROS) which are potentially harmful to the leaf (Ledford
and Niyogi, 2005). This effect is avoided by the slightly elevated levels of
NPQ displayed by alm1 (Figure 5.15). However, plants of the alm2 and
alm4 lines also demonstrated a significant reduction in photosynthetic
rate. Possible explanations for the physiological responses displayed by
each of the alm lines in relation to their displayed anatomy are
considered in the General Discussion. However, as previously mentioned,
photosynthesis is a substantial and intricate process. Figure 5.16 shows a
schematic diagram of the major protein complexes found in the thylakoid
membrane. Modification of these as a result of mutation can cause their
inactivation and ultimately inhibit photosynthesis, making it impossible to
suggest what may cause a reduction in photosynthetic activity from
physiological and anatomical data alone.
Yamori et al. (2011) showed that reductions in either the cytochrome
(Cyt) b6f complex or ATP synthase reduced electron transport rate and
acted as a limiting factor to photosynthesis in transgenic tobacco leaves.
This study was carried out using antisense constructs designed to target
the Rieske iron-sulphur protein of the Cyt b6f complex or the δ-subunit of
chloroplast ATP synthase. It was shown that reduction of the Cyt b6f
complex gave a larger decrease in ETR than a reduction in ATP synthase,
Chapter 5. Physiological responses of the candidate lines
144
suggesting that Cyt b6f is a more likely limiting factor for photosynthesis
than ATP synthase.
The effects of damage to the photosystem II complex were discussed
by Takahashi and Badger (2011), who stated that, as PSII absorbs light,
it is in a constant flux of damage and repair, with photoinhibition only
occurring if damage is greater than repair. It was shown that
photodamage occurred primarily in the oxygen-evolving complex of PSII,
suggesting that this area of the molecule is particularly sensitive to
disruption, either through photodamage or possibly through mutation.
Inhibition of the repair process of PSII can also result in the observation
of reduced qp values.
Inhibition of any of the sensitive processes outlined above may result in
the reductions in A displayed by plants of the alm1, alm2 and alm4 lines,
or limit any expected gains resulting from the potentially favourable
morphologies of plants of the alm3, alm5 or alm6 lines.
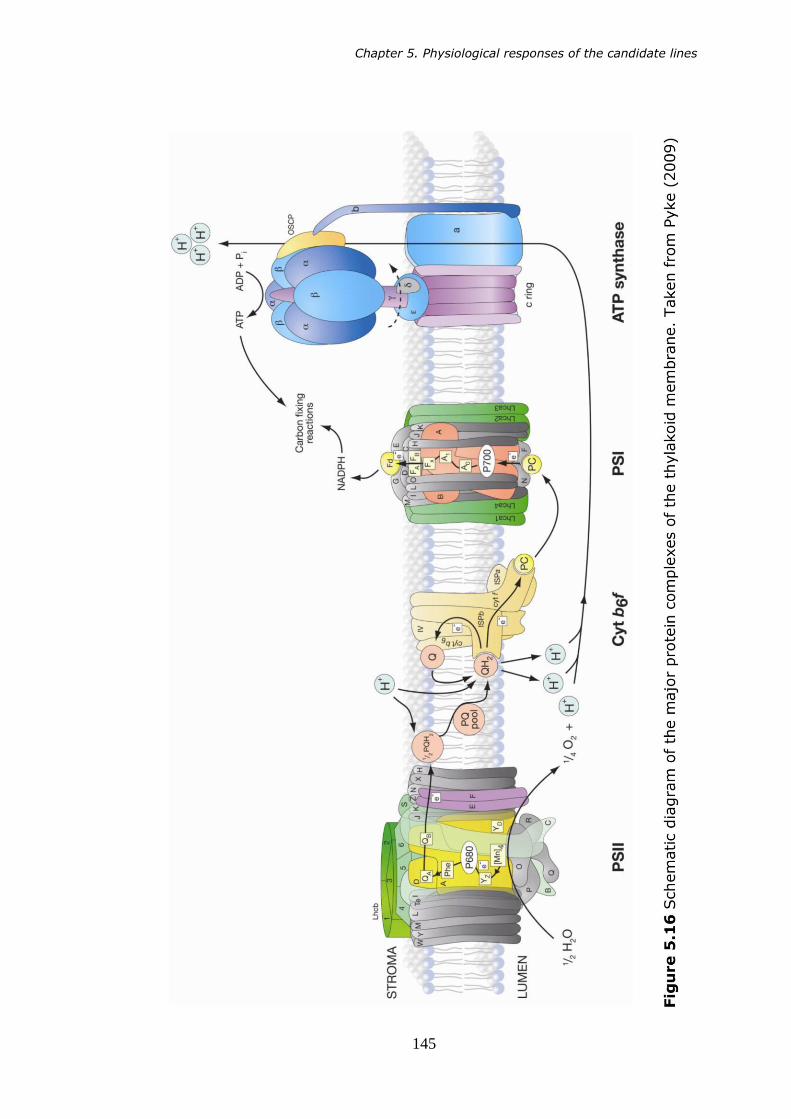
Chapter 5. Physiological responses of the candidate lines
145

146
Chapter 6
GENERAL DISCUSSION
Chapter 6. General discussion
147
Chapter 6: GENERAL DISCUSSION
6.1 Introduction
Chapter 3 introduced the mutant screen, which was responsible for the
identification of interesting mutagenised lines of IR64 rice plants. In total,
100 lines were screened to identify alterations in leaf morphological traits
compared to wild type plants. Of the 100 lines screened, seven were
found to be of interest and termed altered leaf morphology (alm)
mutants. Six of these lines were retained for further study.
The screen outlined in Chapter 3 was designed to have a high-
throughput (lines screened / unit time) and, as such, required a
compromise in terms of resolution, even though this was several-fold
higher than in ongoing morphology screens at IRRI, which measured only
vein density. An even higher resolution characterisation of the anatomy
of the alm lines was discussed in Chapter 4 to provide a better
understanding of the anatomical changes displayed by each mutant line.
Chapter 5 was concerned with the physiological characterisation of the
alm lines, primarily in terms of photosynthetic response.
This chapter considers the consequences of producing altered leaf
morphologies in rice plants in terms of leaf function, and aims to evaluate
the prospects for the production of rice plants capable of C4
photosynthesis.
6.2 Conserved anatomical features of the rice leaf
It was shown in Chapter 3 that the mesophyll cells of the rice leaves were
consistently small and highly lobed compared to those of other species. It
has also been noted by Burundukova et al. (2003) and Chonan (1970)
that rice mesophyll cells are amongst the smallest in crop plants. The
combination of these factors causes the chloroplasts to be pushed to the
cell periphery, resulting in a cell peripheral cover by chloroplasts of over
97% (Sage and Sage, 2009). It is thought that this high level of

Chapter 6. General discussion
148
peripheral cover has evolved in rice as a response to the high
photorespiratory potential it is typically subject to as a result of high
irradiance, high temperatures and high photosynthetic capacity. This is
thought to aid photorespiratory CO2 scavenging and / or maximisation of
CO2 diffusion into the chloroplast stroma.
6.2.1 Photorespiratory scavenging
It has been shown in C3-C4 intermediate plants that the oxygenation of
RuBP in photorespiration results in the production of P-glycollate which is
converted to glycine in the peroxisome (Monson, 1999), as in C3
photorespiration. However, this is then allowed to diffuse from the
mesophyll cells into the bundle sheath, where decarboxylation takes
place within the mitochondria. The resulting release of CO2 within the
enlarged, organelle-rich bundle sheath has the effect of increasing CO2
concentration within the bundle sheath chloroplasts (von Caemmerer,
1989).
It was suggested by Sage and Sage (2009) that rice makes use of a
similar, single celled photorespiratory CO2 scavenging system.
Mitochondria are located within the centre of the mesophyll cells and are
closely associated with the chloroplasts as a lack of available space
ensures that all of the organelles are closely associated. This ensures that
photorespiratory metabolites are easily able to diffuse into the
mitochondria. The positioning of chloroplasts along the cell periphery and
the extent to which it is covered ensures that, for photorespired CO2 to
leave the mesophyll cell, it must first pass through the chloroplast
stroma. This should therefore result in an increase in stromal CO2
concentration and improvement of the carboxylation capacity of Rubisco,
depending on the rate of photorespiration. It has been shown that the C3
species Flaveria cronquestii employs a similar system of photorespiratory
scavenging, and refixes 48% of photorespired CO2 at 28oC (Bauwe et al.
1987).
6.2.2 Mesophyll conductance to CO2
For photosynthesis to occur, CO2 must diffuse from the atmosphere (Ca),
through the substomatal airspaces (Ci) to the chloroplast (Cc). The latter
Chapter 6. General discussion
149
step is determined by the mesophyll conductance to CO2 (gm), which is
large enough to represent a limiting factor for photosynthesis (Flexas et
al., 2008). Under high light conditions it was estimated that gm was
responsible for a 30% reduction in Cc (Evans and von Caemmerer, 1996).
Mesophyll conductance is primarily limited by the permeability of the
membranes to CO2 and the likelihood of CO2 to reach the chloroplast
(Evans and Loreto, 2000). The latter is greatly increased by the enlarged
surface area of chloroplasts exposed to intercellular airspaces provided by
the small mesophyll cell size, increased mesophyll cell surface area and
localisation of chloroplasts to the cell periphery.
6.2.3 Implications of the conserved nature of cell size, lobing and
chloroplast distribution
None of the lines observed during the mutant screen displayed obviously
enlarged mesophyll cells, and the fact that the small mesophyll cell size
compared to other species, deep lobing and chloroplast localisation to the
periphery of the cells occurred in all of the alm lines and the wild type
rice plants suggests that these characteristics are highly conserved.
Sections 6.2.1 and 6.2.2 suggest possible evolutionary reasons for this to
be the case and provide suggestions as to why these characteristics are
desirable. Although introduction of a Kranz anatomy system of C4
photosynthesis would represent a potential area for improvement in
photosynthetic efficiency for rice under tropical conditions (Mitchell and
Sheehy, 2006), this strong adaptation to minimisation of and recovery
from photorespiration potentially explains why the C4 photosynthetic
pathway has never evolved in the Oryza genus of grasses.
This high degree of specialisation in minimising the impact of
photorespiration may complicate any attempt to introduce the C4
pathway into rice. The small mesophyll cell size and high degree of lobing
in rice are inconsistent with C4 grasses (Chonan, 1970), in which
mesophyll cells exhibiting the typical Kranz anatomy are much larger
than those of rice. If Kranz anatomy was to be introduced into rice with a
typical interveinal mesophyll cell number of two and mesophyll cell size
Chapter 6. General discussion
150
remained as small as it currently is then either vein density would
actually be higher than a typical C4 leaf or if vein number were
maintained, the leaf width would be very small.
The potential implications of the introduction of single celled C4
photosynthesis into rice are more difficult. In recently discovered
terrestrial single celled C4 species such as Bienertia cycloptera and
Borszczowia aralocaspica, Rubisco is spatially separated from intercellular
airspaces to minimise its exposure to oxygen, whilst PEP carboxylation
occurs in the cytosol at the cell periphery (Edwards et al., 2004). This
has been achieved in such species by the evolution of large, columnar
cells to permit spatial separation of the different reactions and processes.
In rice the inverse is true, with chloroplasts located at the cell periphery
whilst any PEP carboxylase would be located in the central cytosol and
only have access to CO2 released from photorespiration or that which had
succeeded in bypassing the chloroplast barrier (Sage and Sage, 2009).
Any attempt to introduce single celled C4 photosynthesis into rice would
require the inversion of the chloroplast and cytosol arrangement within
the mesophyll cell, which in turn would require a significant alteration in
mesophyll cell size and shape to accommodate the chloroplasts (Figure
6.1).

Chapter 6. General discussion
151
Figure 6.1 Comparison of A) rice mesophyll cell with B) mesophyll cell
of Borszczowia aralocaspica which employs single celled C4
photosynthesis. In B) the chloroplasts are coloured red and the cell
outline is shown by the broken white line. Note the scale differs between
images, and the Borszczowia aralocaspica mesophyll cell is significantly
larger than that of rice. Borszczowia aralocaspica confocal image
reproduced from Edwards et al. (2004).
6.3 Alterations displayed by the alm lines
6.3.1 alm1
Table 6.1 shows that plants of the alm1 mutant line of rice demonstrated
significant differences in anatomical and physiological characteristics
compared to wild type plants. alm1 plants were shown to display
extensive and significant photoinhibition and an underdeveloped
morphology.

Chapter 6. General discussion
152
Table 6.1 Significantly altered physiological and anatomical
characteristics displayed by plants of the alm1 mutant line of rice
compared to wild type rice plants.
Anatomical Physiological
Slightly reduced interveinal
distance
Reduced maximum rate of
carboxylation by Rubisco (VCmax)
Small minor veins Reduced triose phosphate utilisation
(TPU)
Short, narrow, pale leaves Reduced electron transport rate
(ETR)
Erratic vascular distribution Reduced net assimilation (A)
response to photosynthetically
active radiation (PAR)
Reduced light compensation point
Reduced photorespiration
Reduced substomatal CO2
concentration (Ci)
Reduced quantum yield of
photosystem II (ΦPSII)
Reduced photochemical quenching
(qp)
Slightly increased non-
photochemical quenching (NPQ)
Transpiration (E) almost zero
It is hypothesised that the weak establishment of alm1 plants is the
result of their significantly reduced A, which in turn is an effect of the
inhibition of PSII. This is coupled with a presumed extremely low
hydraulic conductance in alm1 plants.

Chapter 6. General discussion
153
6.3.1.1 Possible limitations in hydraulic conductance in alm1 plants
the physiological data presented in Chapter 5 showed that transpiration
was reduced almost to zero in plants of the alm1 line, but gs was
maintained. As the anatomical data in presented Chapter 4 indicated that
stomatal density was unaltered it is clear that stomata were present and
functional. As stomata were open and gas exchange was presumably
unimpaired, it is suggested that water supply was highly limited and
insufficient to supply transpiration. This theory is also supported by the
observation of a wilty phenotype in plants of the alm1 line (Chapter 3).
Table 6.1 shows that plants of the alm1 line showed a significant
reduction in the size of the minor vascular bundles compared to the wild
type. This situation closely resembles that described by Koizumi et al.
(2007) when studying the CM2088 mutant of rice. In their study a
reduction in the diameter of xylem vessels in large vascular bundles of
leaves gave a significantly increased resistance to water transport. There
was also an increased number of narrowed or scalariform plates present
compared to wild type plants and many xylem vessels were occluded.
This effect was not noted in the roots or stems of the CM2088 population.
Similarly, the roots and stems of alm1 plants appeared to be healthy, if
somewhat smaller than those of the wild type. The additive effects of the
decreased diameter of xylem vessels displaying poor hydraulic
conductivity and increased cavitation in the CM2088 population were
such that transpiration was almost eliminated, despite the fact that
stomata were able to function as normal. Due to the similarities in both
anatomical (reduced vascular bundle size) and physiological (minimal
transpiration, maintained stomatal conductance) responses, and the fact
that, despite serious functional impairment, neither alm1 nor the CM2088
mutations are lethal, it is hypothesised that a similar reduction in
hydraulic conductivity following xylem disruption causes the observed
lack of transpiration in alm1 plants.
Hydraulic conductance through the vascular system does not
represent the only potential resistance to water transport through the
plant however. Aquaporins are the proteins primarily responsible for

Chapter 6. General discussion
154
facilitating water transport across cell membranes. It has been shown in
tobacco that a defect in the NtAQP1 gene caused inactivation of a root
aquaporin and resulted in a decreased root hydraulic conductivity
(Siefritz et al. 2002). However, this is not thought to be the case for the
alm1 line, as its roots appeared to be healthy rather than water stressed.
In anycase, water flow through the roots of rice plants is dominated by
the apoplastic pathway (Ranathunge et al. 2003), reducing reliance on
root aquaporins. It has been shown that the OsPIP2;7 gene is
predominantly expressed in the mesophyll cells of rice and encodes an
aquaporin protein. It has been shown that upregulation of the OsPIP2;7
gene results in an increased rate of transpiration (Li et al., 2008); and
downregulation or inactivation of such genes may therefore result in an
impaired transpiration rate such as that displayed by the alm1 line.
However, whilst this scenario is possible, it is thought that a response
similar to that described by Koizumi et al. (2007) is the more likely cause
of the physiological effects displayed by the alm1 line, due to the
similarity in both observed anatomy and physiology with the alm1 and
CM2088 mutants.
6.3.1.2 Possible inhibitors of PSII in alm1 rice plants
Although transport of water within the alm1 plants appears to be highly
limited, it is considered impossible for water to be so limited that there is
insufficient present to permit photolysis. Because the water requirement
of photolysis is extremely small relative to the quantity required to
maintain cell turgidity, it is unfeasible that water supplies could be limited
to such an extent without severe tissue dehydration. As the chloroplast
stroma is predominantly composed of water, the chloroplasts would
appear visibly shrunken, if not desiccated to the point where they were
no longer visible, if water supplies were so limited as to prevent
photolysis. This suggests that the observations of reduced activity of PSII
and reduced transpiration were not linked and raises the question of what
is causing the inhibition of PSII in alm1 plants.

Chapter 6. General discussion
155
As stated, transpiration in alm1 plants was almost completely eliminated,
which could have had the effect of raising leaf temperature due to the
reduction in transpirational cooling. High temperatures could potentially
cause denaturation of the PSII protein complex. However, no significant
increase in leaf temperature was observed in alm1 plants compared to
wild type plants (LiCor cuvette data), so inhibition of PSII cannot be
considered to be an effect of increased leaf temperature in this case.
Photochemical quenching (qp) was consistently reduced in alm1 plants
compared to those of the other lines. It is known that the NPQ response
is regulated by the pH gradient across the thylakoid membrane (ΔpH)
which arises when net efflux of hydrogen ions from the thylakoid lumen
in photolysis, exceeds the influx of H+ powering ATP synthesis (Figure
6.2) (Rees and Horton, 1990; Horton et al. 1996; Li et al. 2000;
Demmig-Adams and Adams, 2006). As the levels of NPQ were unchanged
in the alm1 line compared to wild type rice, it is concluded that a pH
gradient was able to form and PSII was active. This conclusion is
supported by the unchanged Fv/Fm value in alm1 plants compared to wild
type plants.
Figure 6.2 Schematic of the thylakoid membrane proteins.
The low value of qp observed in the alm1 line indicated that a high
proportion of the reaction centres of PSII were closed, that is they have
accepted extra electrons, but are unable to pass them on and centres are
therefore reduced. However, it is known that PSII was functional as ΔpH
was established (shown by NPQ induction); and if this were not the case,

Chapter 6. General discussion
156
a complete blockage of PSII would result in plant death, as shown by the
application of the herbicide diuron (Matoo et al., 1981). A reduction in
the number of electron carriers between PSII and PSI would be expected
to result in a severely impaired NPQ and is therefore inconsistent with the
results obtained. It is therefore suggested that a reduction in the number
of PSII reaction centres relative to the number of light harvesting
complexes might be the cause of greater reduction of PSII and low
observed qp in alm1 plants, as electrons would be passed to PSII reaction
centres faster than they could enter the electron transport chain. This
reduction in the number of active PSII reaction centres would therefore
result in a reduction of net output of electrons into the electron transport
chain.
Reduced activity of PSII in alm1 plants also explains many of the
other observed physiological deficiencies. With reduced electron transport
from PSII, it is expected that ATP synthesis would be limited, which in
turn limits activity of the Calvin cycle reactions, reducing A and even
photorespiration. Although the effects of mutation in the alm1 line are
detrimental to the productivity of the plants, if it were shown definitively
that the physiological response displayed was resulted from a reduction
in the number of PSII complexes present, this line may be of use in the
introduction of the C4 pathway into rice. This is because chloroplasts
deficient in PSII has been noted before, primarily in the bundle sheath
cells of C4 plants. If the hypotheses outlined here were shown to be
correct, this would suggest that the production of C4-like chloroplasts in
rice is indeed possible. The next challenge would be to target their
localisation to the bundle sheath.
It may seem an unsatisfactory explanation that two separate
mutations are responsible for the appearance of two significant inhibitions
in the same mutant line. However as stated in Chapter 3, alm1 is a
mutant produced by gamma ray irradiation, which is is expected to cause
numerous large deletions within the genome (Wu et al. 2005). These, in
turn might conceivably cause multiple effects such as those
demonstrated by plants of the alm1 line.

Chapter 6. General discussion
157
6.3.2 alm2
Table 6.2 shows that plants of the alm2 line displayed moderate
anatomical and physiological disruption compared to wild type plants. It
was shown that stomatal conductance was significantly reduced in the
alm2 population and it is likely that this had the effect of limiting
transpiration. It is also possible that an alteration in vascular
arrangement could limit hydraulic conductance and therefore
transpiration as with plants of the alm1 line. However, as alm2 rice plants
displayed no net reduction in vascular size this is considered unlikely.
Beyond this, it is difficult to infer too much about the responses
displayed by plants of the alm2 line, as the anatomical alterations
displayed were somewhat unspecific and the number of potential
inhibitors to processes as complicated as photosynthesis is substantial
(see Chapter 5).
Table 6.2 Significantly altered physiological and anatomical
characteristics displayed by plants of the alm2 mutant line of rice
compared to wild type plants.
Anatomical Physiological
Altered vascular arrangement Reduced (A) response to PAR
Visibly off centre mid-rib Reduced light compensation point
Reduced E
Reduced stomatal conductance (gs)
6.3.3 alm3 and alm4
Tables 6.3 and 6.4 show that leaf 5 of plants of lines alm3 and alm4 was
significantly thicker than in wild type plants. It has been shown
previously that there is a direct correlation between leaf thickness and
Rubisco content in rice leaves (Murchie et al., 2005). As A is expressed as
a function of leaf area, it was hypothesised that an increase in leaf
thickness increase Rubisco content per unit leaf area, thereby causing an
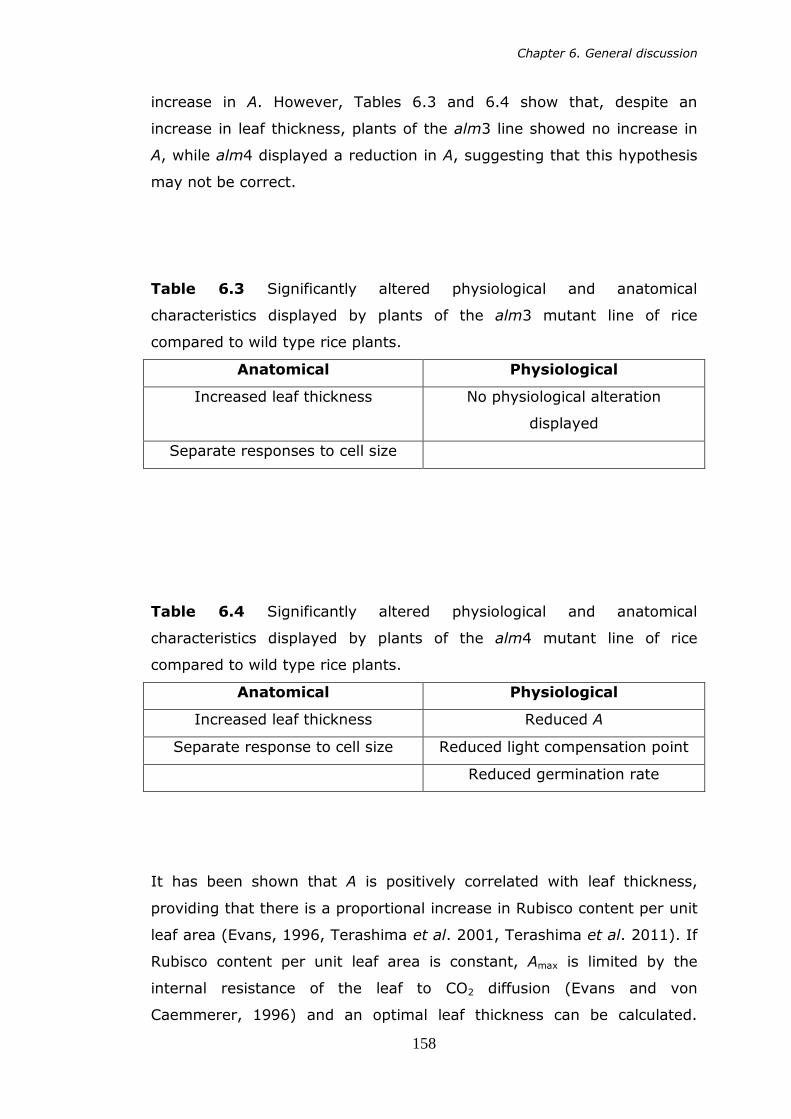
Chapter 6. General discussion
158
increase in A. However, Tables 6.3 and 6.4 show that, despite an
increase in leaf thickness, plants of the alm3 line showed no increase in
A, while alm4 displayed a reduction in A, suggesting that this hypothesis
may not be correct.
Table 6.3 Significantly altered physiological and anatomical
characteristics displayed by plants of the alm3 mutant line of rice
compared to wild type rice plants.
Anatomical Physiological
Increased leaf thickness No physiological alteration
displayed
Separate responses to cell size
Table 6.4 Significantly altered physiological and anatomical
characteristics displayed by plants of the alm4 mutant line of rice
compared to wild type rice plants.
Anatomical Physiological
Increased leaf thickness Reduced A
Separate response to cell size Reduced light compensation point
Reduced germination rate
It has been shown that A is positively correlated with leaf thickness,
providing that there is a proportional increase in Rubisco content per unit
leaf area (Evans, 1996, Terashima et al. 2001, Terashima et al. 2011). If
Rubisco content per unit leaf area is constant, Amax is limited by the
internal resistance of the leaf to CO2 diffusion (Evans and von
Caemmerer, 1996) and an optimal leaf thickness can be calculated.

Chapter 6. General discussion
159
Beyond this optimal thickness, no net gain to A is observed but
construction and maintenance costs of to the leaf are increased
(Terashima et al., 2001). Although it may be unusual to observe an
increase in leaf thickness without a corresponding increase in Rubisco
content, then this would potentially explain why no increase in A was
noted in plants of the alm3 and alm4 lines. The reduced gs and increased
resistance to internal CO2 diffusion (i.e. mesophyll conductance) resulting
from the increased leaf thickness in alm3 plants would help to compound
this problem. The LiCor data do not suggest that there was an increase in
mesophyll conductance in alm3 and alm4 plants.
Whilst the above scenario outlined is possible, it is impossible to
establish its likelihood given the genetic background of the mutants. As
with the alm2 line, A may in fact be limited by a range of potential
inhibitors of photosynthesis, cancelling out any potential gains resulting
from an increase in leaf thickness.
Although the mutant lines which displayed an increased leaf thickness in
this study did not exhibit an increase in A, leaf thickness mutants may
still represent an area of interest for the improvement of A in rice. It was
noted by Terashima et al. (2001) that leaves containing high
concentrations of Rubisco required a high mesophyll cell and chloroplast
surface area to be exposed to intercellular airspaces to avoid limitation of
the diffusion of CO2 and realise high values of A. To satisfy these
conditions, not only is an increase in leaf thickness required, but also
small mesophyll cells. As outlined previously, rice mesophyll cells are
consistently small and have a high conductivity to CO2, suggesting that
rice may be amenable to an increase in photosynthetic capacity in this
way. Whilst potential increases to photosynthetic capacity would be
welcomed, it is important to note that such increases represent an
increase in capacity rather than efficiency. Increasing leaf thickness in
the absence of any alteration in Rubisco to chlorophyll ratios may lead to
a high level of intra-leaf shading, reducing photosynthetic rate per of unit
Rubisco. Furthermore, increasing leaf thickness in the absence of
reduction in leaf area index has a clear resource cost in terms of nitrogen
and carbon allocation (Mediavilla et al., 2001; Terashima et al., 2001).

Chapter 6. General discussion
160
Internal leaf anatomy is important in determining resource use efficiency,
meaning that potential yield gains from exploiting leaf thickness may not
be available to the large numbers of subsistence farmers who lack the
resources to apply significant quantities of fertilisers to crops (Sheehy et
al., 2008)
6.3.4 alm5 and alm6
alm5 and alm6 were unique in that they were the only lines to
demonstrate a significantly altered leaf architecture and no significant
physiological impairment.
Table 6.5 Significantly altered physiological and anatomical
characteristics displayed by plants of the alm5 mutant line of rice
compared to wild type rice plants.
Anatomical Physiological
Small midrib None
Increased vascular size
Reduced interveinal distance
Reduced mesophyll cell size
Table 6.6 Significantly altered physiological and anatomical
characteristics displayed by plants of the alm6 mutant line of rice
compared to wild type rice plants.
Anatomical Physiological
Reduced interveinal distance None
Little distinction between major and
minor veins
The alm5 and alm6 lines provide some encouragement for the prospects
of introducing the C4 photosynthetic pathway into rice utilising a Kranz
anatomy as they lines demonstrate that vascular density can be
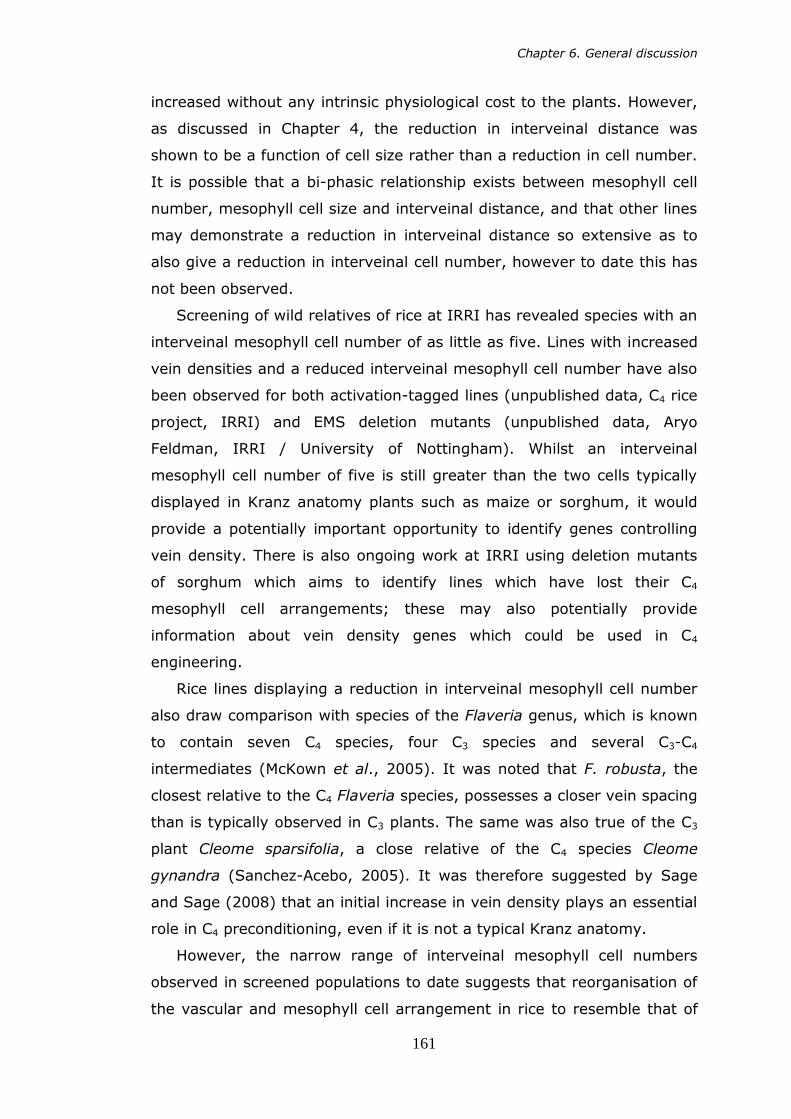
Chapter 6. General discussion
161
increased without any intrinsic physiological cost to the plants. However,
as discussed in Chapter 4, the reduction in interveinal distance was
shown to be a function of cell size rather than a reduction in cell number.
It is possible that a bi-phasic relationship exists between mesophyll cell
number, mesophyll cell size and interveinal distance, and that other lines
may demonstrate a reduction in interveinal distance so extensive as to
also give a reduction in interveinal cell number, however to date this has
not been observed.
Screening of wild relatives of rice at IRRI has revealed species with an
interveinal mesophyll cell number of as little as five. Lines with increased
vein densities and a reduced interveinal mesophyll cell number have also
been observed for both activation-tagged lines (unpublished data, C4 rice
project, IRRI) and EMS deletion mutants (unpublished data, Aryo
Feldman, IRRI / University of Nottingham). Whilst an interveinal
mesophyll cell number of five is still greater than the two cells typically
displayed in Kranz anatomy plants such as maize or sorghum, it would
provide a potentially important opportunity to identify genes controlling
vein density. There is also ongoing work at IRRI using deletion mutants
of sorghum which aims to identify lines which have lost their C4
mesophyll cell arrangements; these may also potentially provide
information about vein density genes which could be used in C4
engineering.
Rice lines displaying a reduction in interveinal mesophyll cell number
also draw comparison with species of the Flaveria genus, which is known
to contain seven C4 species, four C3 species and several C3-C4
intermediates (McKown et al., 2005). It was noted that F. robusta, the
closest relative to the C4 Flaveria species, possesses a closer vein spacing
than is typically observed in C3 plants. The same was also true of the C3
plant Cleome sparsifolia, a close relative of the C4 species Cleome
gynandra (Sanchez-Acebo, 2005). It was therefore suggested by Sage
and Sage (2008) that an initial increase in vein density plays an essential
role in C4 preconditioning, even if it is not a typical Kranz anatomy.
However, the narrow range of interveinal mesophyll cell numbers
observed in screened populations to date suggests that reorganisation of
the vascular and mesophyll cell arrangement in rice to resemble that of
Chapter 6. General discussion
162
C4 plants with Kranz anatomy will pose a significant challenge. To date,
none of the genes controlling C4 leaf anatomy have been identified
(Kajala et al., 2011), although it is hoped that the previously mentioned
activation-tagged rice lines and sorghum deletion mutants may provide
valuable information regarding this.
6.4 Potential alterations in leaf development
The process of rice leaf development was described by Itoh et al. (2005)
and summarised in Chapter 1. It was shown that vascular arrangement
was determined during early leaf development and differentiation of
vascular tissue may first be observed in the P2 leaf primordium, which
suggests that the altered morphologies displayed by plants of the alm1,
alm5 and alm6 lines are the result of changes during this stage of
development. It was noted by Nishimura et al. (2002) that the expression
of OsPNH1 always preceded the morphological development of vascular
tissue by approximately one plastochron (the interval of time between
which two leaves are produced from the shoot apical meristem, SAM),
and was strongly expressed in the pro-vascular regions. It was also noted
expression of an antisense transcript of OsPNH1 caused incomplete
vascular development and disordered arrangement of vascular bundles
within the leaf primordium, providing strong evidence that OsPNH1 plays
a significant role in leaf vascular development. Furthermore, it was also
noted that antisense plants displayed vascular defects only in the leaves
and not in the stem or root tissue, suggesting that OsPNH1 functions only
in leaves. The molecular function of OsPNH1 is not known.
Interveinal spacing in the alm lines was shown to be correlated with
mesophyll cell size, suggesting that the reductions observed in the
present study were not due to changes in OsPNH1 expression as the
relative position of the vascular bundles had not changed, although the
size of the cells separating them had. However, it is possible that
production of a Kranz type anatomy displaying a low interveinal

Chapter 6. General discussion
163
mesophyll cell number will require alteration in the localisation of OsPNH1
expression during production of the P1 leaf primordium.
6.5 Implications for the integration of C4 pathway into rice
It is not thought that rice lacks any genes associated with the C4 pathway
(Kajala et al., 2011), as all enzymes of the C4 cycle are found in C3
plants, albeit at low levels in many cases. In fact it was shown by
Bräutigam et al. (2011) that there is as little as 3% difference in the
transcriptome of mature leaves of the closely related C3 plant Cleome
spinosa and its C4 relative Cleome gynandra. Brown et al., (2011)
showed that a small cis-element of the CgNAD-ME of C. gynandra (a C4
relative of the model plant species Arabidopsis thaliana) is essential in
conferring cell-specific expression of the enzyme NAD-ME, and that the
removal of this region causes NAD-ME to be expressed in both mesophyll
and bundle sheath cells. It was hypothesised that modification of
transcription factors to recognise the pre-existing cis-elements of the
Oryza sativa NAD-ME gene in rice would limit NAD-ME expression solely
to the bundle sheath cells. This would therefore allow the cell-specific
accumulation of proteins such as the enzyme NAD-ME to be generated
without alteration of the genes which encode them. These discoveries
provide grounds for cautious optimism for the prospects of the
introduction of a C4-like pathway into rice.
However, as previously mentioned, rice plants display a highly
conserved mesophyll cell size, degree of lobing of the mesophyll cells and
a strong relationship between interveinal distance and mesophyll cell
size. It may prove that the highly adapted anatomy of rice to cope with
the photorespiratory pressures that it faces may pose a significant
obstacle in the introduction of Kranz anatomy. Without reduction of the
interveinal mesophyll cell number, it is hard to see how diffusion of C4
metabolites can occur sufficiently rapidly to power C4 photosynthesis. The
effects of deep lobing on potential C4 mesophyll cells are also unknown;
however, C4 grasses do not exhibit lobing to the extent displayed by rice
(Chonan, 1978). This suggests that some of the specificity in rice
mesophyll cell morphology may need to be undone to allow the

Chapter 6. General discussion
164
introduction of C4 photosynthesis, the feasibility of which is unknown.
however it is likely that creating a leaf anatomy in rice amenable to C4
photosynthesis will be difficult.
Discoveries of the type made by Brown et al. (2011) provide great
encouragement that a Kranz anatomy-like system can be introduced into
rice, and were made possible because many of the genes relating to the
biochemical pathways of C4 photosynthesis are known. However, this is
not the case for the genes controlling the C4 leaf anatomy and, without
knowledge of these, it may be impossible to engineer the anatomical
changes required to utilise the C4 biochemistry. The outcomes of the
tagged activation line and sorghum deletion revertant mutant screening
being carried out at IRRI may well prove crucial in the search for these
genes. If screening techniques such as these are unable to identify
essential genes relating to leaf anatomy, the endeavour to engineer C4
rice will remain extremely challenging; however, if they were to be
discovered, this would certainly suggest that there is potential for
success.
6.6 Future Work
The effects of deep lobing on a C4 system are unknown, although C4
plants typically do not produce mesophyll cells which are lobed to the
same degree as rice. For this reason, it has been suggested that the
deeply lobed cells of rice may be incompatible with a C4 system. Whilst
the evolutionary benefits of lobing have been outlined in this chapter, the
genetic causes of this trait remain unknown. The actual mechanism by
which lobing is achieved in both mesophyll and pavement epidermal cells
is thought to involve the control of microtubule and / or actin filament
organisation within the cell wall, causing localised inhibition of cell growth
and the formation of lobes and constrictions (Panteris and Galatis, 2005).
However the exact methods for intercellular signalling, perception and
localisation within the cell remain unknown. The identification of rice
lobing mutants could potentially prove very useful in understanding these
functions, as well as the potential benefit of being more amenable to
inclusion in a C4 system. Several genes have been identified which

Chapter 6. General discussion
165
influence the cytoskeleton for lobed cell morphogenesis, although work is
primarily based on pavement epidermal cells rather than mesophyll cells,
and rice orthologues have not been identified. In maize, the BRICK
protein is required for pavement cell waviness and defective plants lack
radial microtubule arrays resulting in a lack of waviness in the pavement
cells (Frank et al., 2003). The Arabidopsis mutants spike1, quasimodo1
and scd1 display „gaps‟ in the epidermis where the lobes of adjacent
mesophyll cells do not match together (Qiu et al., 2002; Bouton et al.,
2002; Falbel et al., 2003), and it has been suggested that the SPIKE1
gene in particular is involved in the alteration of cytoskeletal organisation
in response to the perception of as yet unknown extracellular signals. It
may be useful to aim to elucidate rice orthologues of the above genes in
order to identify potential mechanisms for cytoskeletal organisation
before any attempt to reduce the degree of mesophyll cell lobing is
made.
The present study has shown that the other major feature of rice
mesophyll cells that is incongruous to C4 anatomy is cell size. The small
size and orientation of the mesophyll cells and comparatively large size of
the bundle sheath cells provides limited contact through which C4
metabolites could be exchanged in a C4 system (Figure 6.3).
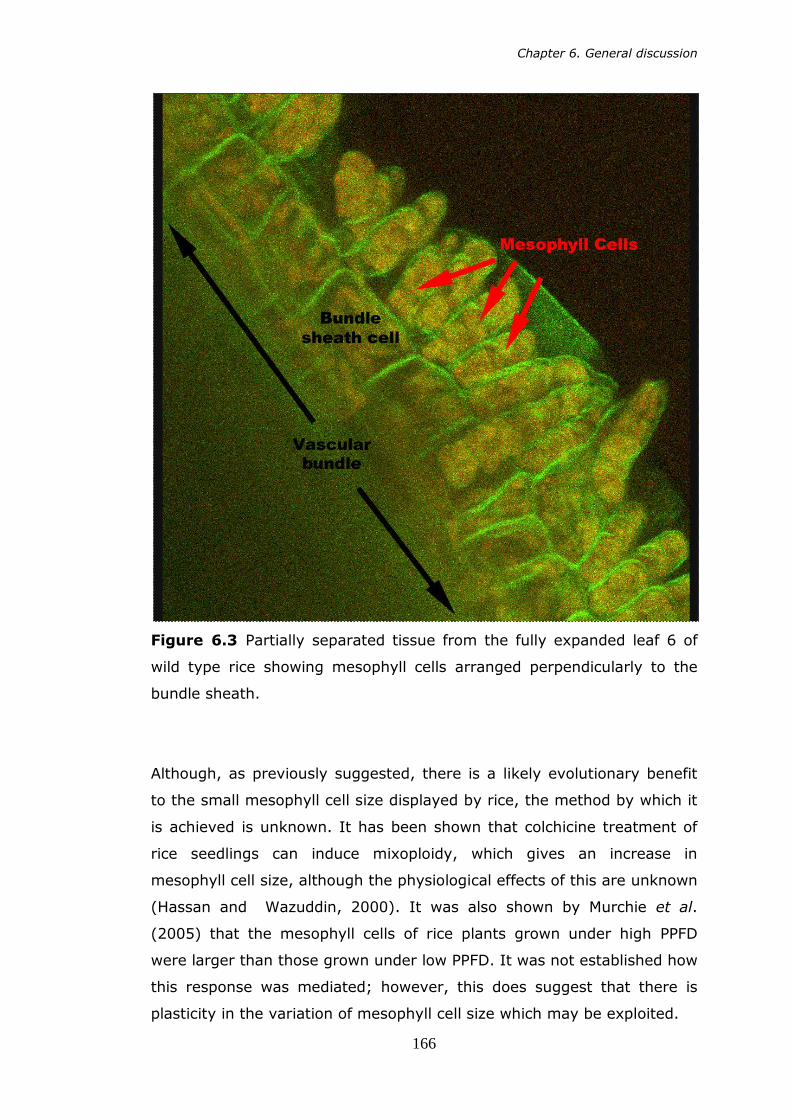
Chapter 6. General discussion
166
Figure 6.3 Partially separated tissue from the fully expanded leaf 6 of
wild type rice showing mesophyll cells arranged perpendicularly to the
bundle sheath.
Although, as previously suggested, there is a likely evolutionary benefit
to the small mesophyll cell size displayed by rice, the method by which it
is achieved is unknown. It has been shown that colchicine treatment of
rice seedlings can induce mixoploidy, which gives an increase in
mesophyll cell size, although the physiological effects of this are unknown
(Hassan and Wazuddin, 2000). It was also shown by Murchie et al.
(2005) that the mesophyll cells of rice plants grown under high PPFD
were larger than those grown under low PPFD. It was not established how
this response was mediated; however, this does suggest that there is
plasticity in the variation of mesophyll cell size which may be exploited.
Chapter 6. General discussion
167
The limitation on cell size due to the extent of lobing is also unknown.
As lobing appears to be produced by the inhibition of growth within large
sections of the cell wall, it would seem possible that an increase in cell
size may be induced if the degree of lobing could be inhibited.
It is therefore suggested that the control of mesophyll cell size and the
degree of mesophyll cell lobing are key areas where our understanding
needs to be improved if the C4 photosynthetic pathway is to be
successfully integrated into rice. These two features are highly conserved
amongst the rice mutant lines examined here as part of successful
adaptation in coping with photorespiratory stress, although there is
reason to believe that this specialisation can be undone. Current
screening projects of rice and sorghum populations at IRRI may well yield
information regarding genes involved in the production of Kranz type
anatomy. However, if the specificity in mesophyll cell size and lobing are
not overcome, it is questionable whether C4 rice plants would be able to
utilise Kranz anatomy efficiently.

168
Chapter 7
BIBLIOGRAPHY
Chapter 7. Bibliography
169
Chapter 7: BIBLIOGRAPHY
Arora, R., Agarwal, P., Ray, S., Kumar Singh, A., Pal Singh, V.,
Tyagi, A.K., Kapoor, S. 2007. MADS-box gene family in rice:
genome-wide identification, organization and expression profiling
during reproductive and developmental stress. BMC Genomics 8, 242-
263.
Bauwe, H., Keerberg, O., Bassüner, R., Pärnik, T., Bassüner, B.
1987. Reassimilation of carbon dioxide by Flaveria (Asteraceae)
species representing different types of photosynthesis. Planta 172,
214–218.
Borevitz, J., Liang, D., Plouffe, D., Chang, H., Zhu, T.,
Weigel, D., Berry, CC., Winzeler, E., Chory, J. 2003. Large-scale
identification of single-feature polymorphisms in complex genomes.
Genome Research 13 513-523.
Bouton, S., Leboeuf, E., Mouille, G., Leydecker, M.T., Talbotec, J.,
Granier, F., Lahaye, M., Höfte, H., Truong, H. 2002. QUASIMODO 1
encodes a putative membrane-bound glycotransferase required for
normal pectin synthesis and cell adhesion in Arabidopsis. The Plant Cell
14, 2577–2590.
Bräutigam, A., Kajala, K., Wullenweber, J., Sommer, M., Gagneul,
D., Weber, K.L., Carr, K.M., Gowik, U., Maß, J., Lercher, M.J.,
Westhoff, P., Hibberd, J.M., Weber, A.P.M. 2011. An mRNA
blueprint for C4 photosynthesis derived from comparative
transcriptomics of closely related C3 and C4 species. Plant Physiology
155, 142-156.

Chapter 7. Bibliography
170
Brodribb, T.J., Feild, T.S. 2010. Leaf hydraulic evolution led a surge in
leaf photosynthetic capacity during early angiosperm diversification.
Ecology Letters 13, 175-183.
Brodribb, T.J., Feild, T.S., Jordan, G.J. 2007. Leaf maximum
photosynthetic rate and venation are linked by hydraulics. Plant
Physiology 144, 1890-1898.
Brown, N.J., Newell, C.A., Stanley, S., Chen, J.E., Perrin, A.J.,
Kajala, K., Hibberd, J.M. 2011. Independent and parallel recruitment
of preexisting mechanisms underlying C4 photosynthesis. Science 331,
1436-1439.
Burundukova, O.L., Zhuravlev, Y.N., Solopov, N.V., P’yankov, V.I.
2003. A method for calculating the volume and surface area in rice
mesophyll cells. Russian Journal of Plant Physiology 50, 133-139.
Cantrell, R. 2000. Foreward in Redesigning Rice Photosynthesis to
Increase Yield, eds. Sheehy, J., Mitchell, P.L., Hardy, B. Elsevier
Science publishing, Amsterdam. pp. 5-6.
Casati, P., Lara, M.V., Andreo, C.S. 2000. Induction of a C4-like
mechanism of CO2 fixation in Egeria densa, a submersed aquatic
species. Plant Physiology 123, 1611-1621.
Chonan, N. 1970. Studies on the photosynthetic tissues in the leaves
of cereal crops. V. Comparison of the mesophyll structure among
seedling leaves of cereal crops. Proceedings of the Crop Science
Society of Japan 39, 418 – 425.
Chonan, N. 1978. Comparative anatomy of mesophyll among the
leaves of gramineous crops. Japan Agricultural Research Quarterly 12,
128 – 131.

Chapter 7. Bibliography
171
Cran, D.G., Possingham, J.V. 1972. Variation of plastid types in
spinach. Protoplasma 74, 197-213.
Dawe, D. 2000. The contribution of rice research to poverty alleviation in
Redesigning Rice Photosynthesis to Increase Yield, eds. Sheehy, J.,
Mitchell, P.L., Hardy, B. Elsevier Science Publishing, Amsterdam. pp.3-
12.
Demmig-Adams , B., Adams, W.W. 2006. Photoprotection in an
ecological context: the remarkable complexity of thermal energy
dissipation. New Phytologist 172, 11-21.
Dengler, N.G., Dengler, R.E., Donelly, P.M., Hattersley, P.W. 1994.
Quantitative leaf anatomy of C3 and C4 grasses (Poaceae): Bundle
sheath and mesophyll surface area relationships. Annals of Botany 73,
241 – 255.
Dengler, N.G., Taylor, W.C. 2000. Developmental aspects of C4
photosynthesis in Photosynthesis: Physiology and Metabolism, eds.
Leegood, R., Sharkey, T., von Caemmerer, S. Kluwer Academic
Publishing, Netherlands pp. 471-491.
Di Laurenzio, L., Wysocka-Diller, J., Malamy, J.E., Pysh, L.,
Helariutta, Y., Freshour, G., Hahn, M.G., Feldmann, K.A., Benfey,
P.N. 1996. The SCARECROW gene regulates an asymmetric cell
division that is essential for generating the radial organisation of the
Arabidopsis root. Cell 86, 423-433.
Dingkuhn, M., Farquhar, G.D., De Datta, S.K., O’Toole, J.C. 1991.
Discrimination of 13C among upland rices having different water use
efficiencies. Australian Journal of Agricultural Research 42, 1123-1131.

Chapter 7. Bibliography
172
Downton, W.J.S., Tregunna, E.B. 1968. Carbon dioxide compensation
– its relation to photosynthesis carboxylation reactions, systematic of
the Graminae and leaf anatomy. Canadian Journal of Botany 46, 207 –
215.
Dunstone, R.L., Evans, L.T. 1974. Role of changes in cell size in the
evolution of wheat. Australian Journal of Plant Physiology 1, 157-165.
Edwards, G.E., Franceschi, V.R., Voznesenskaya, E.V. 2004. Single –
cell C4 photosynthesis versus the dual-cell (Kranz) paradigm. Annual
Review of Plant Biology 55, 173-196.
Edwards, G.E., Walker, D.A. 1983. C3, C4: Mechanism and Cellular and
Environmental Regulation of Photosynthesis. Blackwell Scientific
Publications, Oxford.
Ellis, J.R., Leech, R.M. 1985. Cell size and chloroplast size in relation to
chloroplast replication in light-grown wheat leaves. Planta 165, 120-
125.
El-Sharkawy, M., Hesketh, J. 1965. Photosynthesis among species in
relation to characteristics of leaf anatomy and CO2 diffusion resistance.
Crop Science 5, 517-521.
Esau , K. 1965. Plant Anatomy 2nd edn. Wiley , New York.
Evans, J.R. 1996. Developmental constraints on photosynthesis: effects
of light and nutrition. In Photosynthesis and the Environment. ed.
Baker, N. Kluwer Academic, Dordrecht. pp. 281-304.
Evans, J.R., Loreto, F. 2000. Acquisition and diffusion of CO2 in higher
plant leaves. In Photosynthesis: Physiology and Metabolism. eds.
Leegood, R.C., Sharkey, T.D., von Caemmerer, S. Kluwer Academic,
Dordrecht. pp 321–351.
Chapter 7. Bibliography
173
Evans, J.R., von Caemmerer, S. 1996. Carbon dioxide diffusion inside
leaves. Plant Physiology 110, 339-346.
Evans, J.R., von Caemmerer, S. 2000. Would C4 rice produce more
biomass than C3 rice in Redesigning Rice Photosynthesis to Increase
Yield, eds. Sheehy, J., Mitchell, P.L., Hardy, B. Elsevier Science
publishing, Amsterdam. pp. 53-73.
Evans, L.T. 1998. Feeding the Ten Billion: Plants and population growth.
Cambridge University Press, Cambridge. pp. 196 – 227.
Falbel, T.C., Koch, L.M., Nadeau, J.A., Swgui-Simarro, J.M., Sack,
F.D., Bednarek, S.Y. 2003. SCD1 is required for cytokinesis and
polarized cell expansion in Arabidopsis thaliana. Development 130,
4011-4024.
FAOSTAT, Food and Agriculture Organisation of the United Nations. Crop
production statistics 2009.
http://faostat.fao.org/site/567/default.aspx#ancor
Farquhar, G.D., von Caemmerer S., Berry, J.A. 1980. A biochemical-
model of photosynthetic CO2 assimilation in leaves of C3 species.
Planta 149, 78-900.
Fladung, M. 1994. Genetic variants of Panicum maximum (Jacq.) in C4
photosynthetic traits. Journal of Plant Physiology 143, 165-172.
Fleming, A.J. 2005. The control of leaf development. New Phytologist
166, 9-20.
Flexas, J., Ribas-Carbo, M., Diaz-Espejo, A., Galmés, J., Medrano,
H. 2008. Mesophyll conductance to CO2 current knowledge and future
prospects. Plant, Cell and Environment 31, 602-621.
Chapter 7. Bibliography
174
Frank, M.J., Cartwright, H.N., Smith, L.G. 2003. Three Brick genes
have distinct functions in a common pathway promoting polarized cell
division and cell morphogenesis in the maize leaf epidermis.
Development 130, 753-762.
Furbank, R.T., von Caemmerer, S., Sheehy, J., Edwards, G. 2009.
C4 rice: a challenge for plant phenomics. Functional Plant Biology 36,
845-856.
Garris, A.J., Tai, T.H., Coburn, J., Kresovich, S., McCouch, S. 2005.
Genetic structure and diversity in Oryza Sativa L. Genetics 169, 1631-
1638.
Hassan, L., Wazuddin, M. 2000. Colchicine-induced variation of cell
size and chloroplast number in leaf mesophyll of rice. Plant Breeding
119, 531-533.
Hatch, M.D. 1987. C4 photosynthesis: A unique blend of modified
biochemistry, anatomy and ultrastructure. Biochimica et Biophysica
Acta 895, 81-106.
Henikoff, S., Comai, L. 2003. Single-nucleotide mutations for plant
functional genomics. Annual Review of Plant Biology 54, 375-401.
Hibberd, J.M., Sheehy, J.E., Langdale, J.A. 2008. Using C4
photosynthesis to increase the yield of rice – rationale and feasibility.
Current Opinion in Plant Biology 11, 228-231.
Hirochika, H., Guiderdoni, E., An, G., Hsing, Y., Young Eun, M.,
Han, C., Upadhyaya, N., Ramachandran, S., Zhang, Q., Pereira,
A., Sundaresan, V., Leung, H. 2004. Rice mutant resources for gene
discovery. Plant Molecular Biology 54, 325-334.

Chapter 7. Bibliography
175
Hirochika, H., Guideroni, E., An, G., Hsing, Y., Eun, M.Y., Han, C.,
Upadhyaya, N., Ramachandran, S., Zhang, Q., Pereira, A.,
Sundaresan, V., Leung, H. Rice mutant genes for discovery. Plant
Molecular Biology 54, 325-334.
Horton, P., Ruban, A.V., Walters, R.G. 1996. Regulation of light
harvesting in green plants. Annual Review of Plant Physiology and
Plant Molecular Biology 47, 655-684.
Hoshikawa, K. 1989. The Growing Rice Plant. Nosan Gyoson Bunka
Kyokai (Nobunkyo), Tokyo.
Itoh, J., Nonomura, K., Ikeda, K., Yamaki, S., Inukai, Y.,
Yamagishi, H., Kitano, H., Nagato, Y. 2005. Rice plant
development: from zygote to spikelet. Plant Cell Physiology 46, 23-47.
Izawa, T., Shimamoto, K. 1996. Becoming a model plant: the
importance of rice to plant science. Trends in plant science 1, 95-99.
Jellings, A.J., Leech, R.M. 1982. The importance of quantitative
anatomy in the interpretation of whole leaf biochemistry in species of
Triticum, Hordeum and Avena. New Phytologist 92, 39-48.
Jin, S., Hong, J., Li, X., Jiang, D. 2006. Antisense inhibition of Rubisco
activase increases Rubisco content and alters the proportion of Rubisco
activase in stroma and thylakoids in chloroplasts of rice leaves. Annals
of Botany 97, 739-744.
Juniper, B.E., Clowes, F.A.L. 1965. Cytoplasmic organelles and cell
growth in root caps. Nature 208, 864-865.

Chapter 7. Bibliography
176
Kajala, K., Covshoff, S., Karki, S., Woodfield, H., Tolley, B.J.,
Dionora, M.J.A., Mogul, R.T., Mabilangan, A.E., Danila, F.R.,
Hibberd, J.M., Quick, W.P. 2011. Strategies for engineering a two-
celled C4 photosynthetic pathway into rice. Journal of Experimental
Botany 62, 3001-3010.
Kamiya, N., Itoh, J., Morikami, A., Nagato, Y., Matsuoka, M. 2003.
The SCARECROW gene‟s role in asymmetric cell divisions in plants. The
Plant Journal 36, 45-54.
Kiniry, J.R., Jones, C.A., O’Toole, J.C., Blanchet, R., Cabelguenne,
M., Spanel, D.A. 1989. Radiation-use efficiency in biomass
accumulation prior to grain-filling for five grain-crop species. Field
Crops Research 20, 51-64.
Kinsaman, E.A., Pyke, K.A. 1998. Bundle sheath cells and cell-specific
plastid development in Arabidopsis leaves. Development 125, 1815-
1822.
Kobayashi, H., Yamada, M., Taniguchi, M., Kawasaki, M.,
Sugiyama, T., Miyake, H. 2009. Differential positioning of C4
mesophyll and bundle sheath chloroplasts: recovery of chloroplast
positioning requires the actomyosin system. Plant Cell Physiology 50,
129-140.
Koizumi, K., Ookawa, T., Satoh, H., Hirasawa, T. 2007. A wilty
mutant of rice has impaired hydraulic conductance. Plant and Cell
Physiology 48, 1219-1228.
Kropff, M.J., Cassman, K.G., Peng, S., Matthews, R.B., Setter, T.L.
1994a. Quantitive understanding of yield potential. In Breaking the
yield barrier. Proceedings of a workshop on rice yield potential in
favourable environments, ed. Cassman, K.G. International Rice
Research Institute, Manila. pp. 21-38.

Chapter 7. Bibliography
177
Kropff, M.J., van Laar, H.H., Matthews, R.B. 1994b. ORYZA1: an
ecophysiological model for irrigated rice production. SARP Research
Proceedings, Wageningen (The Netherlands).
Ledford, H.K., Niyogi, K.K. 2005. Singlet oxygen and photo-oxidative
stress management in plants and algae. Plant, Cell and Environment
28, 1037–1045.
Leegood, R.C. 2008. Roles of bundle sheath cells in C3 plants. Journal of
Experimental Botany 59, 1663-1673.
Leegood, R.C., Sharkey, T., von Caemmerer, S. 2000.
Photosynthesis: Physiology and Metabolism. Elsevier Science
Publishing, Amsterdam.
Li, G., Zhang, M., Cai, W., Sun, W., Su, W. 2008. Characterization of
OsPIP2;7, a water channel protein in rice. Plant and Cell Physiology
49, 1851-1858.
Li, X., Björkman, O., Shih, C., Grossman, A.R., Rosenquist, M.,
Jansson, S., Niyogi, K.K. 2000. A pigment-binding protein essential
for regulation of photosynthetic light harvesting. Nature 403, 391-395.
Lux, A., Morita, S., Abe, J., Ito, K. 2005. An improved method for
clearing and staining free-hand sections and whole-mount samples.
Annals of Botany 96, 989-996.
Lyndon, R.F., Robertson, E.S. 1976. The quantitative ultrastructure of
the pea shoot apex in relation to leaf initiation. Protoplasma 87, 387-
402.
Maluszynski, M., Nichterlein, K., van Zanten, L., Ahloowalia, B.S.
2000. Officially released mutant varieties-the FAO/IAEA Database.
Mutation Breeding Review 12, 1-84

Chapter 7. Bibliography
178
Matoo, A.K., Pick, U., Hoffman-Falk, H., Edelman, M. 1981. The
rapidly metabolised 32,000-dalton polypeptide of the chloroplast is the
“proteinaceous shield” regulating photosystem II electron transport
and mediating diuron herbicide sensitivity. Proceedings of the National
Academy of Science 78, 1572-1576.
Maxwell, K., Johnson, G. 2000. Chlorophyll fluorescence – a practical
guide. Journal of Experimental Botany 51, 659-668.
McKown, A.D., Moncalvo, J.M., Dengler, N.G. 2005. Phylogeny of
Flaveria (Asteraceae) and inference of C4 photosynthesis evolution.
American Journal of Botany 92, 1911-1928.
Mediavilla, S., Escudero, A., Heilmeier, H. 2001. Internal leaf
anatomy and photosynthetic resource-use efficiency: interspecific and
intraspecific comparisons. Tree Physiology 21, 251-259.
Mitchell, P.L., Sheehy, J.E. 2006. Supercharging rice photosynthesis to
increase yield. New Phytologist 171, 688-693.
Mitchell, P.L., Sheehy, J.E. 2007. pp. 27-37 in Charting New Pathways
to C4 Rice. eds. Sheehy, J., Mitchell, P.L., Hardy, B. World Scientific
Publishing, Singapore.
Miyagishima, S. 2005. Origin of the chloroplast division machinery.
Journal of Plant Research 118, 295-306.
Miyao, B., Fukayama, H. 2003. Metabolic consequences of
overproduction of phosphoenolpyruvate carboxylase in C3 plants.
Archives of Biochemistry and Biophysics 414, 197-203.
Mockler, T.C., Chan, S., Sundaresan, A., Chen, H., Jacobsen, S.E.,
Ecker, J.R. 2005. Applications of DNA tiling arrays for whole genome
analysis. Genomics 85, 1-15.

Chapter 7. Bibliography
179
Monson, R.K. 1999. The origins of C4 genes and evolutionary pattern in
the C4 metabolic phenotype. In C4 Plant Biology. eds. Sage, R.F.,
Monson, R.K. Academic Press , San Diego. pp. 377 – 410.
Monteith, J.L. 1977. Climate and the efficiency of crop production in
Britain. Philosophical Transactions of the Royal Society 281, 277-294.
Muhaidat, R., Sage, R.F., Dengler, N.G. 2007. Diversity of Kranz
Anatomy and Biochemistry in C4 Eudicots. American Journal of Botany
94, 362-381.
Murchie, E.H., Hubbart, S., Peng, S., Horton, P. 2005. Acclimation of
photosynthesis to high irradiance in rice: gene expression and
interactions with leaf development. Journal of Experimental Botany 56,
449-460.
Murchie, E.H., Niyogi, K.K. 2011. Manipulation of photoprotection to
improve plant photosynthesis. Plant Physiology 155, 86-92.
Murchie, E.H., Pinto, M. Horton, P. 2009. Agriculture and the new
challenges for photosynthesis research. New Phytologist 181, 532-
552.
Nelson, T., Dengler, N.G. 1992. Photosynthetic differentiation in C4
plants. International Journal of Plant Science 153, 93-105.
Nishimura, A,. Ito, M., Kamiya, N., Sato, Y., Matsuoka, M. 2002.
OsPNH1 regulates leaf development and maintenance of the shoot
apical meristem in rice. The Plant Journal 30, 189-201.
Ogren, W.L. 1984. Photorespiration: pathways, regulation and
modification. Annual Review of Plant Physiology 35, 415-442.
Chapter 7. Bibliography
180
Panteris, E., Galatis, B. 2005. The morphogenesis of plant cells in the
mesophyll and epidermis: organisation and distinct roles of cortical
microtubules and actin filaments. New Phytologist 167, 721-732.
Pyke, K.A. 1994. Arabidopsis – its use in the genetic and molecular
analysis of plant morphology. New Phytologist 128, 19-37.
Pyke, K.A. 1999. Plastid division and development. The Plant Cell 11,
549-556.
Pyke, K.A. 2009. Plastid Biology p. 64. Cambridge University Press,
Cambridge.
Pyke, K.A., Leech, R.M. 1987. The control of chloroplast number in
wheat mesophyll cells. Planta 170, 416-420.
Pyke, K.A., Leech, R.M. 1992. Nuclear mutations radically alter
chloroplast division and expansion in Arabidopsis thaliana. Plant
Physiology 99, 1005-1008.
Qiu, J.L., Jilk, R., Marks, M.D., Szymanski, D.B. 2003. The
Arabidopsis SPIKE1 gene is required for normal cell shape control and
tissue development. The Plant Cell 14, 101-118.
Ranathunge, K., Steudle, E., Lafitte, R. 2003. Control of water uptake
by rice (Oryza sativa L.): role of the outer part of the root. Planta 217,
193-205.
Rees, D., Horton, P. 1990. The mechanism of changes in photosystem
II efficiency in spinach thylakoids. Biochemica et Biophysica Acta
1016, 219-227.

Chapter 7. Bibliography
181
Reiskind, J.B., Madsen, T.V., van Ginkel, L.C., Bowes, G. 1997.
Evidence that inducible c4-type photosynthesis is a chloroplastic CO2-
concentrating mechanism in Hydrilla, a submersed monocot. Plant, Cell
and Environment 20, 211-220.
Ren-Yong, C., Zhuge, G., Wan, S. 1990. pp. 370-392 Loss
assessments and factor-finding analysis of grain post-production
systems in China. In Proceedings of the Thirteenth ASIAN Seminar on
Grain Postharvest Technology, Brunei Darussalam, 4-7 Sept. 1990. ed.
Naewbanij, J.O. ASIAN grain post-harvest programme, Bangkok.
Roth-Nebelsick, A., Uhl, D., Mosbrugger, V., Kerp, H. 2001.
Evolution and function of leaf venation architecture: a review. Annals
of Botany 87, 553-566.
Sage, R. 2004. The Evolution of C4 photosynthesis. New Phytologist 161,
341-370.
Sage, R., Pearcy, R. 2000. pp. 497-532 In Photosynthesis: Physiology
and Metabolism, eds. Leegood, R., Sharkey, T., von Caemmerer, S.
Kluwer Academic Publishing, Netherlands.
Sage, R., Sage, T.L. 2008. Learning from nature to develop strategies
for the directed evolution of C4 rice. In Charting Pathways to C4 Rice.
eds. Sheehy, J.E., Mitchell, P.L., Hardy, B. World Scientific, Singapore.
pp. 195-216.
Sage, T.L., Sage, R. 2009. The functional anatomy of rice leaves:
implications for refixation of photorespiratory CO2 and efforts to
engineer C4 photosynthesis into rice. Plant Cell Physiology 50, 756-
772.
Chapter 7. Bibliography
182
Sage, R., Sharkey, T., Pearcy, R. 1990. The effect of leaf nitrogen and
temperature on the CO2 response of photosynthesis in the C3 dicot
Chenopodium album. Australian Journal of Plant Physiology 17, 135-
148.
Sánchez-Acebo, L. 2005. A phylogenetic study of the New World
Cleome (Brassicaceae, Cleomoideae). Annals of the Missouri Botanical
Garden 92, 179–201.
Scarpella, E., Rueb, S., Meijer, A. 2003. The RADICLELESS1 gene is
required for vascular pattern formation in rice. Development 130, 645-
658.
Scarpella, F., Meijer, A. 2004. Pattern formation in the vascular system
of monocot and dicot plant species. New Phytologist 164, 209-242.
Sharkey, T.D., Bernacchi, C.J., Farquhar, G.D., Singsaas, E.L. 2007.
Fitting photosynthetic carbon dioxide response curves for C3 leaves.
Plant, Cell and Environment 30, 1035-1040.
- Curve fitting tool produced by Sharkey et al. can be found at
http://www.blackwellpublishing.com/plantsci/pcecalculation/
Sheehy, J.E., Ferrer, A.B., Mitchell, P.L., Elmido-Mabilangan, A.,
Pablico, P., Dionora, M.J.A. 2008. How the rice crop works and why
it needs a new engine. In Charting Pathways to C4 Rice. eds. Sheehy,
J.E., Mitchell, P.L., Hardy, B. World Scientific, Singapore. pp. 3-26.
Sheehy, J.E., Dionora, M.J.A., Mitchell, P.L. 2001. Spikelet numbers,
sink size and potential yield in rice. Field Crops Research 71, 77-85.
Siefritz, F., Tyree, M.T., Lovisolo, C., Schubert, A., Kaldenhoff, R.
2002. PIP1 plasma membrane aquaporins in tobacco: from cellular
effects to function in plants. The Plant Cell 14, 869-876.
Chapter 7. Bibliography
183
Smith, L.G., Hake, S., Sylvester, A.W. 1996. The tangled-1 mutation
alters cell division orientations throughout maize leaf development
without altering leaf shape. Development 122, 481-489.
Stockhaus, J., Schlue, U., Koczor, M., Chitty, J., Taylor, W.,
Westhoff, P. 1997. The promoter of the gene encoding the C4 form of
phosphoenolpyruvate carboxylase directs mesophyll-specific
expression in transgenic C4 Flaveria spp. The Plant Cell 9, 479-489.
Takahasi, S., Badger, M.R. 2011. Photoprotection in plants: a new light
on photosystem II damage. Trends in Plant Science 16, 53-60.
Terashima, I., Hanba, Y.T., Tholen, D., Niinemets, Ü. 2011. Leaf
functional anatomy in relation to photosynthesis. Plant Physiology
155, 108-116.
Terashima, I., Miyazawa, S.I., Hanba, Y.T. 2001. Why are sun leaves
thicker than shade leaves? Consideration based on analyses of CO2
diffusion in the leaf. Journal of Plant Research 114, 93–105.
The Arabidopsis Genome Initiative. 2000. Analysis of the genome
sequence of the flowering plant Arabidopsis thaliana. Nature 408, 796-
815.
United Nations – Department of Economic and Social Affairs Population
Division. 2005. World Population Prospects, The 2004 revision.
www.un.org/esa/population/publications/WPP2004/2004Highlights_finf
finfinal.pdf
Veit, B. 2004. Determination of cell fate in apical meristems. Current
Opinion in Plant Biology 7, 57-64.
von Caemmerer, S. 1989. A model of photosynthetic CO2 assimilation
and carbon-isotope discrimination in leaves of certain C3-C4
intermediates. Planta 178, 463-474.
Chapter 7. Bibliography
184
von Caemmerer, S. 2003. C4 Photosynthesis in a single C3 cell is
theoretically inefficient but may ameliorate internal CO2 diffusion
limitations of C3 Leaves. Plant, Cell and Environment 26, 1191-1197.
Von Caemmerer, S., Evans, J.R. 2010. Enhancing C3 photosynthesis.
Plant Physiology 154, 589-592.
von Caemmerer, S., Furbank, R. 1999. Modelling C4 photosynthesis. In
C4 Plant Biology. eds. Sage, R., Monson, R. Academic Press, San
Diego. pp. 89-131.
von Caemmerer, S., Farquhar, G.D. 1981. Some relationships between
the biochemistry of photosynthesis and the gas-exchange of leaves.
Planta 153, 376–387.
Voznesenskaya, E.V., Franceschi, V.R., Kiirats, O., Freitag, H.,
Edwards, G.E. 2001. Kranz anatomy is not essential for terrestrial C4
plant photosynthesis. Nature 414, 543-546.
Wilson, D., Cooper, J.P. 1969. Effect of temperature during growth on
leaf anatomy and subsequent light-saturated photosynthesis among
contrasting Lolium genotypes. New Phytologist 68, 1115-1123.
Winzeler, E.A., Castillo-Davis, C.I., Oshiro, G., Liang, D., Richards,
D.R., Zhou, Y., Hartl, D.L. 2003. Genetic diversity in yeast assessed
with whole-genome oligonucleotide arrays. Genetics 163, 79-89.
Wu, J.L., Wu, C., Lei, C., Baraoidan, M., Bordeos, A., Suzette, M.R.,
Madamba, Ramos-Pamplona, M., Mauleon, R., Portugal, A., Jun
Ulat, V., Bruskiewich, R., Wang, G., Leach, J., Khush, G., Leung,
H. 2005. Chemical and irradiation induced mutants of indica rice IR64
for forward and reverse genetics. Plant Molecular Biology 59, 85 – 97.

Chapter 7. Bibliography
185
Yamori, W., Takahashi, S., Makino, A., Price, G.D., Badger, M.R.,
von Caemmerer, S. 2011. The roles of ATP synthase and the
cytochrome B6/f complexes in limiting chloroplast electron transport
and determining photosynthetic capacity. Plant Physiology 155, 956-
962.
Yu, J., Hu, S., Wang, J., Wong, G.K., Li, S., Liu, B., Deng, Y., Dai,
L., Zhou, Y., Zhang, X., Cao, M., Liu, J., Sun, J., Tang, J., Chen,
Y., Huang, X., Lin, W., Ye, C., Tong, W., Cong, L., Geng, J., Han,
Y., Li, L., Li, W., Hu, G., Huang, X., Li, W., Li, J., Liu, Z., Li, L.,
Liu, J Qi, Q., Liu, J., Li, L., Li, T., Wang, X., Lu, H., Wu, T., Zhu,
M., Ni, P., Han, H., Dong, W., Ren, X., Feng, X., Cui, P., Li, X.,
Wang, H., Xu, X., Zhai, W., Xu, Z., Zhang, J., He, S., Zhang, J.,
Xu, J., Zhang, K., Zheng, X., Dong, J., Zeng, W., Tao, L., Ye, J.,
Tan, J., Ren, X., Chen, X., He, J., Liu, D., Tian, W., Tian, C., Xia,
H., Bao, Q., Li, G., Gao, H., Cao, T., Wang, J., Zhao, W., Li, P.,
Chen, W., Wang, X., Zhang, Y., Hu, J., Wang, J., Liu, S., Yang, J.,
Zhang, G, Xiong, Y., Li, Z., Mao, L., Zhou, C., Zhu, Z., Chen, R.,
Hao, B., Zheng, W., Chen, S., Guo, W., Li, G., Liu, S., Tao, M.,
Wang, J., Zhu, L., Yuan, L., Yang, H. 2002. A draft sequence of the
rice genome (Oryza sativa L. ssp. Indica). Science 296, 79-92.
Zhang, C., Halsey, L.E., Szymanski, D.B. 2011. The development and
geometry of shape change in Arabidopsis thaliana cotyledon pavement
cells. BMC Plant Biology 11, 27-40.
Zhang, Y., Goritschnig, S., Dong, X., Li, X. A gain-of-function
mutation in a plant disease resistance gene leads to constitutive
activation of downstream signal transdusction pathways in suppressor
of npr1-1, constitutive 1. The Plant Cell 15, 2636-3646.
Zhu, X.G., Portis JR, A.R., Long, S.P. 2004. Would transformation of
C3 crop plants with foreign Rubisco increase productivity? A
computational analysis extrapolating from kinetic properties to canopy
photosynthesis. Plant, Cell and Environment 27, 155-165.


