
1
Small and Medium Size Enterprise Financing: a note on
some of the empirical implications of a pecking order
by
ROBERT WATSONDepartment of Accounting & Finance,
University of Glasgow,Glasgow G12 8LE
&
NICK WILSONLeeds University Business School,
University of Leeds,Leeds LS2 9JT
AcknowledgementBoth authors contributed equally to this paper.
Address for correspondence: R. Watson, Department of Accounting & Finance,University of Glasgow, Glasgow G12 8LE, UKE-mail: [email protected]

2
Small and Medium Size Enterprise Financing: a note onsome of the empirical implications of a pecking order
ABSTRACT
Asymmetric information models predict a “pecking order” which reflects a combination ofowner-manager preferences and external capital supply constraints whenever insiders knowmore about the true value of the firm’s prospects than outsiders. The pecking order results inretained earnings being the most preferred source of finance, then debt and finally the issue ofnew shares to outsiders. Using a sample of 629 UK SMEs over the five-year period from1990 to 1995 we find evidence consistent with a pecking order in which retained equity ispreferred over debt. As expected, the evidence of a pecking order was particularly strong inrespect of the closely-held firms in our sample.
Key Words: Asymmetric information, pecking order, capital structure, SME finance

3
Small and Medium Size Enterprise Financing: a note onsome of the empirical implications of a pecking order
INTRODUCTION
It is now widely recognised that information asymmetries can give rise to significant financial
contracting and agency costs with the potential to influence the riskiness and size (and not, as
in the Modigliani and Miller (1958 and 1963) framework, merely the distribution) of a
company’s future cash-flows. Essentially, the financial claims underpinning any particular
capital structure are seen as capable of influencing corporate value via the impact upon
managerial incentives and therefore operational and financial decision making (see Brennan,
1995 and Harris and Raviv, 1991, for reviews). Capital structure models, such as Myers
(1984), focus on information asymmetries between insiders (i.e., managers, who are assumed
to always act in current shareholder interests) and outsiders, primarily potential new debt and
equity suppliers. Insider’s superior knowledge regarding the “true” worth of the business and
the additional contracting costs associated with credibly signalling this proprietary
information to outsiders reduces both the demand for and supply of external debt and equity
finance. The demand from owner-managers will be adversely affected because the higher
perceived risks and monitoring costs will lead potential external suppliers to demand an
‘unreasonably high’ premium on any funds advanced. By making all forms of external
finance, particularly new share issues, appear excessively expensive, the Myers (1984) and
Myers and Majluf (1984) models predict the existence of a ‘pecking order’ whereby internal
cash flows (i.e., retained earnings) are the preferred form of financing new investments. Of
course, in the absence of cost-effective risk assessment, monitoring and intervention
technology, external suppliers of debt finance may also be reluctant to finance some forms of
risky investments if they are unable to raise interest rates sufficiently without encountering
severe “adverse selection” problems (Stiglitz and Weiss, 1981). Thus, financial pecking
orders may also arise due to external debt finance being subject to rationing and other supply
constraints.
This suggests that, in practice, the interaction of owner-manager and external suppliers
preferences can be expected to produce firm-level financial structure decisions consistent with
a “pecking order” whereby internally-generated sources of finance will be preferred over
external sources. In this paper we empirically test some of the implications of the pecking
order model using a sample of UK small and medium size enterprises (SMEs). One of the
main empirical implications of the pecking order models is that any pecking order will be
positively related to both the commonality of interests between current shareholders and

4
corporate decision makers (managers) and the degree of information asymmetry between
insiders and outsiders. In order to investigate these issues empirically, our analyses of the
pecking order hypotheses includes separate estimates and comparisons based on a partitioning
of the sample into closely-held (i.e., owner-managed) and other companies.1
The remainder of the paper is structured as follows. The next section examines the existing
theoretical and empirical literature with respect to SME capital structure decisions. This is
followed by a section which details our main empirical hypotheses and the empirical model
used in the analyses. The fourth section describes the sample and data and the fifth section
presents the main empirical findings of the paper. The final section summarises the paper,
examines the implications of the findings and suggests some further areas of research into the
topic.
CAPITAL STRUCTURE THEORY AND EMPIRICAL RESEARCH
The Modigliani and Miller (1958 and 1963) capital structure model shows that in a perfect
and complete market setting, how the firm is financed will have no effect upon its value.
What determines firm value is the size and riskiness of the cash-flows arising from its
investment and operating activities. As these cashflows are deemed to be independent of the
financing decision, with the exception of tax effects, capital structure will therefore be
irrelevant for determining firm value. In the intervening period, there have been many
attempts to show that the MM result is itself irrelevant to understanding the capital structure
choices of actual firms operating in realistic market settings. The risk characteristics of
different types of debt and the nature of the firms assets, the increasing financial
distress/failure costs and agency-induced value losses at high debt levels have all been
suggested as creating firm-specific optimal capital structure (see chapter 13 of Grinblatt and
Titman, 1998, for a review). Thus, many of the early post MM models of optimal capital
structure, because they modified the MM propositions to reflect increasing agency costs and
bankruptcy/distress costs at higher debt levels, are often referred to as (static) “trade-off”
models (Jensen and Meckling, 1976).
These models suggest that the optimal capital structure for any particular firm will reflect the
balance (at the margin) between the tax shield benefits of debt and the increasing agency and
financial distress costs associated with high debt levels. The trade-off models have intuitive
appeal because they confirm casual observations of actual corporate policies, namely, as the
vast majority of firms have some debt, it is clear that that for most firms both no debt and all-
debt cannot be value-maximising, while a “moderate” amount of debt is probably optimal.
Empirically then, as each firm will have an optimal “target” debt ratio which maximises its

5
value, in the absence of changes in the firms’ business risk characteristics, empirically the
“best” predictor of time t capital structure will be the t-1 capital structure, i.e.,
Debt/Total Assetst = α + β(Debt/Total Assetst-1 ) + ut (1)
where α = 0 and β = 1.
Generally however, despite their intuitive appeal, the empirical testing of some of the more
interesting implications of the trade-off models has been disappointing since their explanatory
power is typically low and the results in respect of specific propositions, such as the tax rate
relationship, are not always supportive. Miller (1977), also declared himself to be
unimpressed by these types of model. Indeed, he dismissed them as a recipe for a “horse and
rabbit stew, namely one horse and one rabbit” because the estimated financial distress/failure
costs were simply far too small to account for the significant trade-off with corporate tax
gains implied by these models.
Nevertheless, in the words of Brennan (1995), the theoretical focus had undoubtedly shifted
“from exploring the valuation of alternative ways of allocating given cash flow streams to
exploring the implications for the cash flow stream itself of the allocation mechanism used to
distribute it.” Empirical studies have continued to be published which are based on the idea of
some increasing cost component which is associated with high levels of debt to counter the
corporate tax shield benefits of debt, e.g., the amount of debt a firm carries is related to
business risk characteristics, the nature of the assets the firm invests in and the firm’s tax rate
(see Jordan et al (1998) for a recent example using UK SME data). More recently, empirical
researchers have tended to focus on what causes changes in a firm’s capital structure over
time. In first-difference form, which overcomes many of the problems associated with
unobservable firm-level fixed effects, the dependent variable is normally some measure of the
change in capital structure over the relevant time period and the right-hand-side variables
usually consist of factors which capture changes in firm-level risk over the same period.
Dhawan (1997), is a good recent example of this empirical approach, which also reflects the
contribution of finance theorists to the continued relaxation of some of the ceteris paribus
assumptions of the Modigliani and Miller model. The new theories of capital structure have
tended to emphasize the effect that the structure of financial claims has upon the incentives
and behaviour of the decision makers that determine the income stream. Myers (1984) and
Myers and Majluf (1984) developed a “pecking order” theory which was derived by assuming

6
a commonality of interests between current shareholders and managers (insiders) but
asymmetric information and therefore heterogeneous expectations between insiders and
potential new investors (outsiders). The basic idea here is that, due to information
asymmetries, outsiders know less about the firms’ prospects than the owner-manager. The
owner-managers will attempt to maximise their (i.e., the current shareholders) value, not the
value of new investors. Thus, if the firm has good investment prospects, the owner-manager
will not want to issue new shares because some of the benefits of the investment projects will
have to be shared with the new shareholders.2 The conclusion is that retaining internally
generated earnings will be the preferred option, followed by raising debt finance for any
additional funding needs, since this ensures that the increased value from the future
investment projects accrue only to the existing shareholders.
If, however, prospects are poor, the owner-manager will wish to issue new equity since this
would benefit existing shareholders. Apart from the case of new and rapidly growing firms,
new share issues are, therefore, seen by outside investors as a signal of poor prospects. As a
result, share prices tend to decline when new share issues are announced, which makes new
issues an extremely expensive method of obtaining additional equity finance. It is worth
noting that both the Myers (1984) and Myers and Majluf (1984) models assume that the
decision makers (i.e., the corporate board) always act in current shareholders’ interests. Such
an assumption is uncontentious in the context of an owner-managed or closely held firm. In
the case of widely-held firms, however, where managers have discretionary decision making
powers and where governance and incentive mechanisms may not succeed wholly in aligning
shareholder and manager interests, managers may exploit their information advantage to the
detriment of the shareholders.
Another issue that the pecking order model does not address is that capital structure choices
are themselves typically constrained by information asymmetries and other market
“imperfections” which influence the supply-side, i.e., availability and costs of different types
of financial arrangement (Stiglitz and Weiss, 1981). The inability of potential lenders to
reliably distinguish between good and bad credit risks and the “optimistic” bias typically
associated with owner-manager assessments of their projects, exposes them to the danger of
“over-investment”, that is, investing in firms which subsequently default or otherwise
generate a negative net present value return to the lender (De Meza and Webb, 1990).
Outside investors’ fears regarding possible over-investment can be expected to raise the cost
of capital in sectors where it is particularly difficult to distinguish between good and bad
credit risks. As Akerlof (1970) has argued, in the extreme, information sensitive markets may
collapse altogether in the absence of credible commitments/signalling mechanisms. In the

7
case of corporate credit markets, whereby SME owner-managers are unable to convincingly
signal their inside information to potential new investors, systematic under-investment (i.e.,
credit rationing whereby some firms with positive net present value projects are unable to
obtain finance) may result. Thus, empirically a firm’s capital structure is likely to reflect
trade-offs between external financing constraints and owner-manager preferences. Once
made, capital structure decisions are important determinants of firm value through their
impact on the incentive structures, managerial behaviour and financial risk exposure of the
enterprise (Keasey and Watson, 1995). Hence, unlike in the (symmetrically distributed
information) Modigliani and Miller model, in which capital structure decisions are only of
“second-order” distributional and/or tax-related importance, in an asymmetric information
framework capital structure decisions may have far reaching economic consequences.
To date, the evidence regarding the relative explanatory power of the static trade-off and
pecking order models is somewhat weak, not least because the trade-off model will often fail
to be empirically rejected even when false (see Shyam-Sunder and Myers, 1999). Helwege
and Liang (1996), using a US sample of (post) IPO firms found limited evidence of a pecking
order, though arguably the asymmetric information problem that gives rise to pecking order
preferences may be less severe in the case of post IPO firms. However, a study by Griner and
Gordon (1995), also based on US data, examined the alternative empirical predictions of the
pecking order and managerial (self-interest) hypotheses and uncovered evidence in favour of
the pecking order. Jordan et al (1998), using a capital structure levels model on data from,
what appeared to be, a fairly representative sample UK SME’s, also reported that they had
found evidence consistent with a pecking order.
HYPOTHESES AND EMPIRICAL MODELLING
The static trade-off models that focus on the determinants of optimal capital structure usually
make the simplifying assumption that there are only two types of finance: equity and debt. In
empirical work, such as the recent Jordan et al (1998) study, this allows for the construction
of a dependent variable such as the debt to equity ratio or the ratio of debt to total assets.
With the pecking order model, finer distinctions between different sources of finance are
required to test predictions such as that retained earnings are preferred to new share issues
(even though both are classed as equity). Thus, the full range of pecking order predictions are
difficult to test using a single financial leverage dependent variable. Moreover, as Shyam-
Sunder and Myers (1999) have argued, most empirical specifications incorporate a partial
adjustment mechanism which means that, even if firms behave in a pure pecking order
manner, it is still extremely difficult to empirically reject the static trade-off model as a valid
description of firms’ capital structure policies.

8
In order to mitigate these problems, in this paper we undertake two forms of analysis. First,
we analyse the actual one-period changes in each major category of financing. Based on the
static trade-off model predictions and each firm’s actual growth rate over the period, these
actual changes are further decomposed into their “expected” and “unexpected” components.
For example, in the case of total debt, the actual change (as a proportion of total assets) can be
decomposed into its expected and unexpected components as follows:
Actual change = Expected change in total debt + Unexpected change in total debt
in total debt
(Dt-Dt-1)/TAt-1 = (g x Dt-1/TAt-1 ) + ((Dt-Dt-1)/TAt-1 - g x Dt-1/TAt-1) (2)
.
where g = (TAt-TAt-1)/TAt-1
If all of the average “expected” changes in financing derived from the static trade-off model
are statistically indistinguishable from the actual changes (or, equivalently, the average
“unexpected” change for each category of financing = 0), then this will be evidence which is
consistent with the static trade-off model, but inconsistent with the pecking order model.
However, if:
(a) the average “unexpected” change in retained earning is statistically greater than zero,
(b) the average “unexpected” change in debt is statistically less than the “unexpected”
change in retained earnings and
(c) the average “unexpected” change in new share issues to outsiders is statistically less than
the average “unexpected” change in debt,
then this will provide statistical evidence consistent with the pecking order model but
inconsistent with the static trade-off model.
The second set of tests involve regression analyses whereby the dependent variable consists
of the actual growth rate of each firm in each period and the independent variables consist of
the relative changes in each of the different category of financing used. By focusing on how
the changes in each type of financing impacts upon total financing we are able to investigate
whether the pattern of estimated coefficients are consistent with a pecking order. We begin
from the accounting balance sheet identity, which equates the total assets of the enterprise
(the uses of funds) with different types of financial claims used to fund these assets (the
sources of funds), i.e.,
9
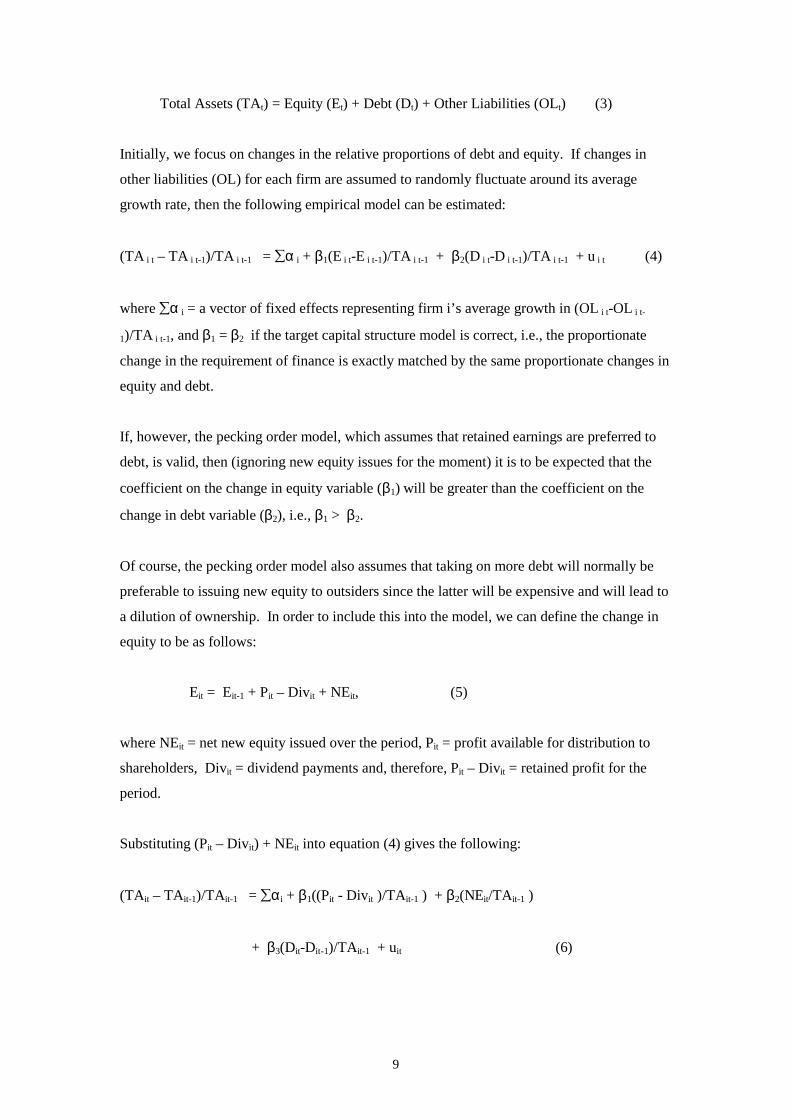
Total Assets (TAt) = Equity (Et) + Debt (Dt) + Other Liabilities (OLt) (3)
Initially, we focus on changes in the relative proportions of debt and equity. If changes in
other liabilities (OL) for each firm are assumed to randomly fluctuate around its average
growth rate, then the following empirical model can be estimated:
(TA i t – TA i t-1)/TA i t-1 = ∑α i + β1(E i t-E i t-1)/TA i t-1 + β2(D i t-D i t-1)/TA i t-1 + u i t (4)
where ∑α i = a vector of fixed effects representing firm i’s average growth in (OL i t-OL i t-
1)/TA i t-1, and β1 = β2 if the target capital structure model is correct, i.e., the proportionate
change in the requirement of finance is exactly matched by the same proportionate changes in
equity and debt.
If, however, the pecking order model, which assumes that retained earnings are preferred to
debt, is valid, then (ignoring new equity issues for the moment) it is to be expected that the
coefficient on the change in equity variable (β1) will be greater than the coefficient on the
change in debt variable (β2), i.e., β1 > β2.
Of course, the pecking order model also assumes that taking on more debt will normally be
preferable to issuing new equity to outsiders since the latter will be expensive and will lead to
a dilution of ownership. In order to include this into the model, we can define the change in
equity to be as follows:
Eit = Eit-1 + Pit – Divit + NEit, (5)
where NEit = net new equity issued over the period, Pit = profit available for distribution to
shareholders, Divit = dividend payments and, therefore, Pit – Divit = retained profit for the
period.
Substituting (Pit – Divit) + NEit into equation (4) gives the following:
(TAit – TAit-1)/TAit-1 = ∑αi + β1((Pit - Divit )/TAit-1 ) + β2(NEit/TAit-1 )
+ β3(Dit-Dit-1)/TAit-1 + uit (6)

10
where, if a pecking order exists with retained equity, then debt and finally new equity to
outsiders as the preferred ranking of finance, β1 > β3 > β2.
In Table 2, we present panel data empirical results from estimating equation (6) that are
consistent with the pecking order model. In order to further test some of the implications of
the pecking order model, we partition the sample into high and low information asymmetry
and managerial ownership groups, i.e., closely-held and other firms respectively. The pecking
order pattern of the coefficients should be more apparent in the case of the closely-held (high
information asymmetry and managerial ownership) group than in the case of the other firms
group (i.e., the relatively low information asymmetry and managerial ownership firms). Also
included in Table 2 are the separately estimated regressions for each group, plus an
augmented version of equation (6) which includes an additional interaction term to measure
the differential slope coefficient on the retained earnings variable in respect of the high
information asymmetry firms. If the estimated coefficient on this interaction term is
significantly positive then this will indicate that the closely-held firms have a significantly
greater preference for using retained earnings over other sources of finance.
The next stage of the analysis focuses on the composition of debt, since not all types of debt
may be equally preferred. The total change in debt finance can be decomposed into categories
that reflect its costs, availability and owner-manager preferences. Four categories of debt are
considered: hire purchase liabilities, long term debt, short term debt (including overdrafts)
and intra-group debt balances. Intra-group balances may be governed by external factors
such as head office credit policies that are unrelated to information asymmetries. Hire
purchase liabilities are essentially a form of fixed term finance tied to a specific asset
purchase in which the legal title to the asset remains with the lender until the final instalment
has been made. Thus during the term of the loan, the finance is “secured” on the basis of the
second-hand value of the asset. This may be a significant source of finance for very small
owner-managed firms that are either already highly geared and/or have insufficient cash or
collateral to finance the purchase of “general purpose” items in which there is a well-
organised second-hand market, e.g., vehicles. Due to the relatively higher information
requirements and greater monitoring costs associated with long term finance, it is reasonable
to assume a likely preference amongst owner-managers for short-term rather than long term
debt finance. Thus, equation (6) can be further augmented as follows:
(TAit–TAit-1)/TAit-1 = ∑αi + β1((Pit-Divit)/TAit-1)) + β2(NEit/TAit-1) + β3(GRPit-GRPit-1)/TAit-1

11
+ β4(HPit-HPit-1)/TAit-1 + β5(SDit-SDit-1)/TAit-1 + β6(LDit-LDit-1)/TAit-1 + uit (7)
where (GRPit - GRPit-1)/TAit-1, (HPit-HPit-1)/TAit-1, (SDit-SDit-1)/TAit-1 and (LDit-LDit-1)/TAit-1
are respectively the change in intra-group balances, hire purchase, short term debt and long
term debt.
Empirical estimates of the model described by equation (7) are presented in Table 3. As with
the previous table, additional estimates of the model are presented which include an
interaction term to measure the differential slope coefficient on the closely-held firms’
retained equity variable, plus separately estimated models for the closely-held firms and the
other firms samples.
Our data also allows an exploration of the relationships between gross operating profits,
directors fees, corporate taxes and dividends. Given that firms have a preference for retained
earnings, how do they “manage” their capital structures, what discretion do they have in
regard to dividends and/or directors fees? Non-listed, smaller, owner-managed firms clearly
have more discretion over these matters (and have greater incentives to exercise their
discretion) than listed and widely-held firms where outside investors may rely upon/expect a
certain level of dividends each year and where directors remuneration is determined via
remuneration committees and related to external managerial labour market factors (see
Ezzamel and Watson, 1998).
So, for example, if the profit before directors remuneration is defined as, πit = Pit + DRit, this
will represent the total funds available for reinvestment from internal sources and the
“discretionary” outflows will be (Divit + DRit) and, therefore, the actual amounts reinvested
(i.e., the retained earnings at time t) will be:
πit - (Divit + DRit.).
We can replace the retained earnings variable (Pit-Divit)/TAit-1 used in the previous two tables
with the above three variables (divided by TAit-1) that together constitute retained earnings. A
significant improvement in the explanatory power of the empirical estimates vis-à-vis Table 2
is to be expected if these discretionary payments across the firms in the sample are of any
systematic importance in explaining their relative need for new finance. The positive
coefficient on the profit before directors fees variable (πit) should also be larger in absolute

12
size than the (expected) negative coefficients on the dividend (Divit) and directors fees
variables (DRit.).
These results, because they confirm the main findings discussed later in the paper, are not
reported in detail but are available from the authors upon request. In addition, the following
forms of partitioning, reflecting other possible causes of any one-period changes in capital
structure, have also been undertaken, but not reported since these results did not materially
alter the conclusions to be drawn from the reported results:
• the firm being debt constrained, i.e., firms with prior period high debt/Equity ratios can be
expected to use relatively more retained equity and other sources of equity than low D/E
ratio firms.
• firms with unexpectedly high earnings (and/or unexpectedly low Dividends) relative to
last year, since these may prefer retained earnings over debt.
• firms experiencing positive growth, since the pecking order model coefficients may only
apply to growing firms as firms experiencing negative growth may have different
preferences.
• young firms, age less than 10 years old, since information asymmetries may be expected
to decrease with time
• small firms, less than 50 employees, may be expected to have different pecking order
preferences irrespective of ownership concentration.
THE SAMPLE AND DATA
Data for this study is from 655 firms that responded to a mail survey on trade credit practice
conducted in late 1994, constituting a useable response rate of 18%3. The survey collected
detailed data on the firm itself; its ownership and organisational structure, products, markets,
supplier relationships, and credit management issues. The firms mailed were a randomly
selected stratified sample of manufacturing companies originally drawn from the UK FAME
database and all had single digit SIC Codes 2,3 or 4. Details of the survey instrument can be
obtained from the authors. This was then matched with the financial and behavioural data
contained on a full credit reference report, provided by Dun & Bradstreet International. The
sample reduces to 626 if we include only those firms for which we have more than one year
of financial data.
Section A of Table 1 shows the number of observations per year and the (almost-equal) split
between closely-held businesses (i.e., those in which the directors collectively own a majority

13
stake) and other firms. It is to be expected that the pecking order models will have greater
explanatory power in respect of the closely-held firms than for the other firms.
Section B of Table 1 indicates that the mean total asset size of the closely-held firms, at
slightly less than £4m, is less than 40% that of the other firms (£10.3m). In terms of the
relative proportions of different types of financing, Section B indicates that though both
groups of firms have approximately the same proportions of equity finance (share capital plus
retained profits), the closely-held firms have a smaller proportion of issued share capital and a
correspondingly higher proportion of retained earnings vis-à-vis the other firms. In terms of
the non-equity forms of finance, it is also clear that the closely-held firms make greater use of
short-term debt (e.g., overdrafts) and other liabilities (e.g., trade credit, provisions for future
tax, other accrued charges and directors loans, unpaid fees, etc.), whilst the other firms obtain
proportionately more of their funds from other group company members.
In Section C of Table 1, the profit and loss account variables are expressed in terms of their
percentage of annual sales. For both the closely-held and other firms, the total appropriations
of profit in the form of directors fees and dividends is about 5% of sales. In the case of the
other firm sample, the average appropriations of profit as directors fees and dividends are
approximately equal. However, as should be expected for the closely-held firms, directors fee
payments are some 3.5 times the size of dividend payments.
Section D of Table 1 provides a summary of the variables used in the empirical models in
which all items are expressed in terms of the annual balance sheet opening total assets figures.
As can be seen from the table, the average percentage change in total assets over the five year
period from 1989-90 to 1993-4, is a little over 3.6%, slightly higher at 4% in the case of the
closely-held firms. Retained profits at 2.41% represents approximately 60% of the additional
finance for the growth in total assets in respect of the closely-held firms whilst in the case of
the other firms retained profits account for only one-third of the additional finance.
THE EMPIRICAL RESULTS
In section E of Table 1, the actual changes in retained earnings, total debt and new share
issues are each decomposed into their “expected” and “unexpected” changes. It will be
recalled from equation (1) that the static trade-off model implies that all of the “unexpected”
changes will be statistically indistinguishable from zero. The pecking order model predicts
that the average unexpected retained earnings will be positive, the average unexpected debt
either negative or significantly less positive than the average level of unexpected retained
earnings, and the average unexpected new share issues significantly less than the average
unexpected debt. Moreover, these differences in unexpected changes will be most apparent in

14
the case of the closely-held firms, due to the predicted greater responsiveness to owner-
manager preferences, greater information asymmetries between insiders and outsiders and the
greater costs associated with external financing characteristic of these firms.
As can be seen from section E of the table, the overall sample unexpected changes in retained
earnings, though positive, is not statistically significantly so at conventional levels of
confidence. However, as predicted by the pecking order model, for the sub-sample
consisting of closely-held firms, the average positive unexpected retained earnings is
statistically significant at 1% levels. The unexpected change in debt is statistically
significantly negative as predicted by the pecking order model at 5% for the full sample and
for the other firms, though not for the closely-held sub-sample. As regards new share issues,
though the overall sample average is statistically significantly positive at the 5% level of
confidence, it is clear from the sub-sample results that only in the case of the other firms is the
average positive unexpected new share issues of any statistical importance. T-tests for the
equality of means between the closely-held and other firms conducted on the three
unexpected changes in finance variables show that with the exception of the debt component,
the differences between the two sub-samples are statistically significant at 1% levels of
confidence. On the basis of these results, it seems safe to conclude that the pecking order
model provides a more empirically plausible explanation of the changes in financing than the
static trade-off model, particularly, as expected, in relation to the closely-held firm sub-
sample.
We now turn to the regression estimates detailing the relative influence of each of the
financing components in relation to overall financial changes. Table Two presents the
simplest models in which we distinguish between retained earnings and changes in share
capital and total debt. The first two columns, labelled Models 1 and 2, are estimated using all
observations whilst the final two columns, closely-held and other firms, have been estimated
using only the respective sub-samples. In all 4 models, however, the pattern of coefficients
are the same in terms of relative size: the retained profits coefficient is largest, followed by
the change in total debt coefficient and, finally, the change in share capital coefficient being
in all cases the smallest. Model 2 includes an additional interaction term to measure the
differential coefficient on the retained profits variable for the closely-held firms and, as
expected, this is significantly positive. The separately estimated sub-sample models, unlike
model 2 which allows only the coefficient on the retained profits variable to vary, allows all
of the coefficients in the model to differ across the two groups of firms. As can be seen from
the table, all of the estimated coefficients for the closely-held firms are higher than those
estimated on the other firms sample. The separately estimated model is also able to explain a

15
significantly higher proportion of the variance in the dependent variable for the closely-held
firms than is the case for the other firms sample model4.
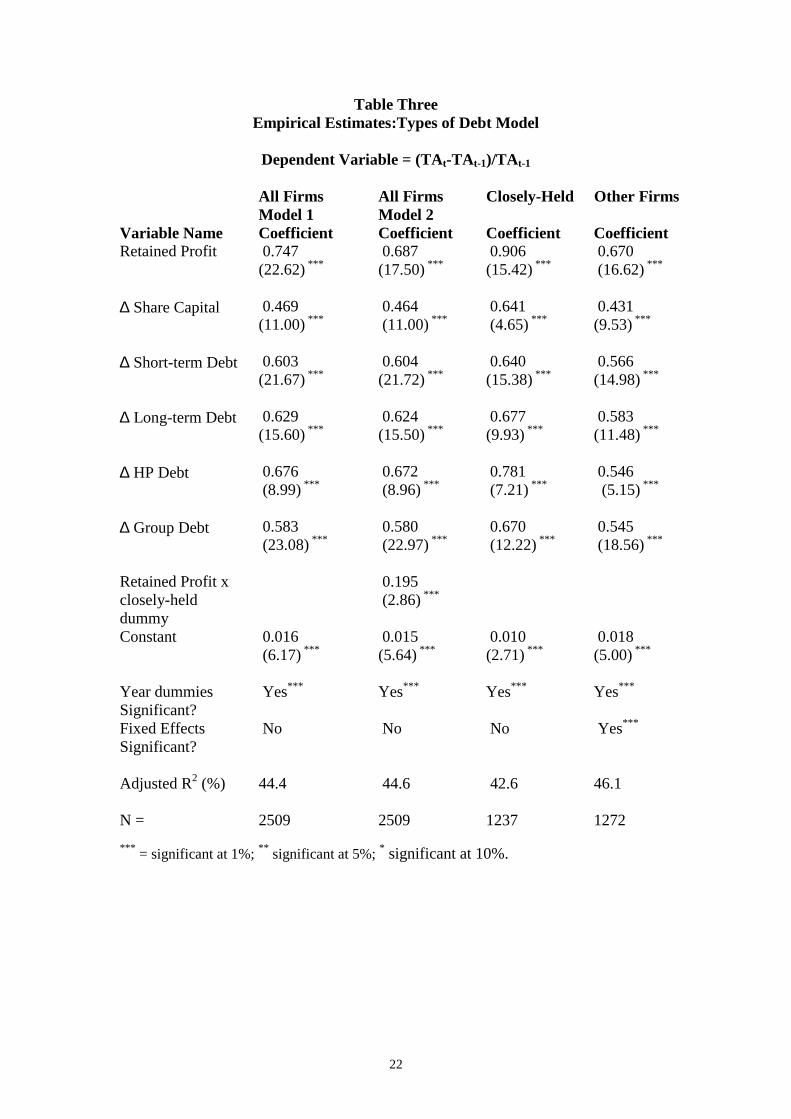
The models estimated in Table 2 do not distinguish between different types of debt. In Table
3 we distinguish between four types of debt: hire purchase, debts owing to group members,
long-term debt and short-term debt. As can be seen from the table, the inclusion into the
models of these additional variables produces stronger results in terms of the adjusted R2’s,
and in terms of the relative size and statistical significance of all the (new and old)
independent variable coefficients. The pattern of coefficients in all cases confirm the
previous results but also suggest that in the case of the closely-held firms there is also a
stronger preference for HP debt than for other types of debt, but that all types of debt are
preferred over the issuing of new share capital. The greatly increased explanatory power of
all of the empirical estimates vis-à-vis Table 2 suggests that there may be a pecking order
within debt finance, particularly in regard to the other firms sub-sample since these firms
appear to have a greater variety of choices of finance open to them than the closely-held
firms. It is also evident that for many closely-held firms there is a greater preference for
additional hire purchase finance than for other types of debt.
As indicated earlier, it is possible to replace the retained profit variable with the 3 variables
which together constitute the retained profits measure: profit before directors fees, directors
fees and dividend payments. If, as expected, closely-held firms have both greater
opportunities and incentives to retain profits in the business then we would expect to find that
the model including the separate components of retained earnings would provide higher
explanatory power than the model which included only the retained profits variable. Also, the
(negative) coefficients on the directors’ fees and dividend variables should be smaller (in
absolute terms) than the (positive) total profit coefficient. The estimate for the closely-held
firms, not reported here, is indeed able to explain a significantly higher proportion of the
variance in the dependent variable vis-à-vis the Table 2 estimates. Moreover, the (negative)
coefficients on the directors’ fees and dividend variables are, as expected, smaller than that of
the total profit variable. These findings were, however, also equally applicable in respect of
the empirical results of the other firms. It seems, therefore, that irrespective of the level of
insider ownership all SMEs have the necessary incentives and opportunities to vary their
profit distribution policies in a manner which appears to increase the explanatory power of the
pecking order model.5
When we further partition both samples by age, we find some evidence that younger firms
have a stronger preference for financing via retained earnings and short-term debt. This latter

16
finding, though entirely consistent with the pecking order explanation may, however, be more
to do with supply-side constraints than owner-manager preferences. Finally, as can be seen
from tables 1 and 2, as expected, the firm-level fixed effects are only of any statistical
significance in respect of the other firms sample. Indeed, it is the explanatory power of the
fixed effects that largely accounts for the greater explanatory power of the other firms model
relative to that of the closely-held firms. We interpret this finding as being consistent with the
pecking order model as it confirms that the changes in other liabilities (mainly trade credit
and unpaid tax balances) for the closely-held firms are relatively less stable than these of the
other firms. Though, once again, this finding could equally reflect supply-side constraints.
CONCLUDING REMARKS
The paper has made a preliminary attempt at empirically testing the pecking order model
implication that when SMEs require additional finance the use of retained earnings will be
preferred over debt and that debt will be preferred over new share issues to outsiders. We
examined the relative size of the estimated coefficients on the various equity and debt
variables in a regression model that attempted to explain how the annual changes in firm
assets had been financed. The pattern of coefficients was found to be consistent with the
pecking order model predictions and this was found to be particularly strong in relation to the
closely-held firms where information asymmetries and a commonality of interests between
shareholders and managers, and therefore the suggested pecking order preferences, would be
most apparent.
The results also suggest that there may be a pecking order within debt types since the
explanatory power of all the estimated models increases significantly when the change in debt
is decomposed into its various components. Clearly, much more work has to be undertaken
prior to firm empirical conclusions can be drawn. Our analysis does not take into account
differences in the use of the funds, i.e., the asset side of the balance sheet, changes in
perceived risks and nor does it address the cost and availability supply-side factors which,
rather than owner-manager (demand-side) preferences, may be driving the results obtained.

17
REFERENCES
Akerlof, G. (1970), ‘The Market for Lemons: quality, uncertainty and the market mechanism’, Quarterly Journal of Economics, Vol. 89, pp.488-500.
Brennan, M.J. (1995), ‘Corporate Finance over the past 25 years’, Financial Management, Vol.24, pp. 9-22.
De Meza, D. and D. Webb (1990), ‘Risk, Adverse Selection and Capital Market Failure’, Economic Journal, Vol.100, pp. 206-14.
Dhawan, R. (1997), ‘Asymmetric Information and Debt Financing: the empirical importance of size and balance sheet factors’, International Journal of the Economics of Business, Vol.4, pp. 189-202.
Ezzamel, M. and R. Watson (1998), ‘Market Comparison Earnings and the Bidding-Up of Executive Cash Compensation: evidence from the UK’, Academy of Management Journal, Vol. 41, pp. 221-231.
Grinblatt, M. and S. Titman (1998), Financial Markets and Corporate Strategy, (Macgraw-Hill publishers).
Griner, E.H. and L.A. Gordon (1995), ‘Internal Cash Flow, Insider Ownership, and Capital Expenditures: a test of the pecking order and managerial hypotheses’, Journal of Business Finance and Accounting, Vol. 22 (March), pp. 179-198.
Harris, M. and A. Raviv (1991), ‘The Theory of Capital Structure’, Journal of Finance, Vol. 46, pp. 297-355.
Helwege, J. and N. Liang (1996), ‘Is there a pecking order?: Evidence from a panel of IPO firms’, Journal of Financial Economics, Vol.40, pp. 429-58.
Jensen, M. and W. Meckling (1976), ‘Theory of the Firm: Managerial Behaviour, Agency Costs and Ownership Structure’, Journal of Financial Economics, Vol. 3, pp. 305-60.
Jordan, J., J. Lowe, and P. Taylor (1998), ‘Strategy and Financial Policy in UK Small Firms’, Journal of Business Finance and Accounting, Vol.25, pp. 1-28.
Keasey, K. and R. Watson (1995), ‘The Bank Financing of Small Unlisted Firms in the UK: an analysis of recent conflicts’, Journal of Small Business Finance, Vol.4, pp. 143-64.
Miller, M. (1977) ‘Debt and Taxes’, Journal of Finance, Vol. 32, pp.261-75.
Modigliani, F. and M. Miller (1958), ‘The Cost of Capital, corporation Finance, and the Theory of Investment’, American Economic Review, Vol. 49, pp. 261-97.
Modigliani, F. and M. Miller (1963), ‘Taxes and the Cost of Capital: A correction’, American Economic Review, Vol. 53, pp. 433-43.
Myers, S.C. (1984), ‘The Capital Structure Puzzle’, Journal of Finance, Vol. 39, pp. 575- 92.
Myers, S. and N. Majluf, (1984), ‘Corporate Financing and Investment Decisions when

18
firms have information that investors do not have’, Journal of Financial Economics, Vol.13 pp. 187-221.
Stiglitz, J.E. and A.Weiss (1981), ‘Credit Rationing in Markets with Imperfect Information’, Amercian Economic Review, Vol. 71, pp. 393-410.
Shyam-Sunder, L. and S.C. Myers(1999), ‘Testing Static Tradeoff against Pecking Order Models of Capital Structure’, Journal of Financial Economics, Vol. 51, pp.219-44.

19
Table OneDescriptive Statistics
Section A: Observations by Year and Firm Type
Year All Firms Closely-Held Other Firms1990 498 244 2541991 547 268 2791992 574 282 2921993 578 288 2901994 384 213 170Total 2581 1295 1286
Section B:Capital Structure Variables
All Firms Closely-Held Other FirmsMean (SD) Mean (SD) Mean (SD)
Total Assets (£m) 7.14 (10.86) 3.98 (4.70) 10.32 (14.65)Share Capital (%) 14.88 (24.26) 11.22 (17.35) 18.56 (29.64)Retained profits (%) 19.14 (35.80) 24.17 (28.58) 14.07 (41.23)Long-term Debt (%) 4.12 (10.10) 4.74 (8.22) 3.50 (11.65)Hire Purchase (%) 2.24 (5.30) 2.95 (6.03) 1.53 (4.33)Short-term Debt (%) 9.04 (12.72) 10.51 (12.38) 7.55 (12.88)Group Debt (%) 12.85 (20.05) 5.28 (13.42) 20.47 (29.40)Other Liabilities (%) 37.73 (20.27) 41.11 (20.48) 34.32 (19.48)
All section B variables expressed in terms of their % of the end of year balance sheettotal asset values.
Section C: Profit & Loss Account Variables
All Firms Closely-Held Other FirmsMean (SD) Mean (SD) Mean (SD)
Sales (£m) 10.44 (12.29) 6.57 (7.06) 14.11 (14.80)Profit before DF(%) 6.95 (21.06) 7.21 (14.32) 6.70 (25.86)Directors Fees (%) 3.09 (11.02) 3.75 (10.55) 2.44 (11.43)Profit after DF (%) 3.77 (19.11) 3.27 (9.57) 4.24 (11.43)Tax (%) 1.20 (2.82) 1.07 (2.17) 1.33 (3.33)Dividends (%) 1.83 (8.04) 1.04 (3.52) 2.62 (10.77)Retained profits (%) 0.61 (19.31) 1.02 (8.28) 0.22 (25.70)
All section C variables, with the exception of sales, are expressed in terms of their % ofannual turnover

20
Section D: Variables in the Empirical ModelsAll Firms Closely-Held Other FirmsMean (SD) Mean (SD) Mean (SD)
% ∆ in Total Assets 3.62 (16.50) 4.00 (16.12) 3.24 (16.88)% ∆ share capital 0.92 (7.67) 0.30 (3.04) 1.55 (10.39)% ∆ Long-term Debt -0.05 (7.19) 0.17 (6.11) -0.27 (8.13)% ∆ Short-term Debt -0.28 (10.21) -0.15 (9.39) -0.41 (10.98)% ∆ HP Debt 0.11 (3.53) 0.19 (3.49) 0.02 (3.57)% ∆ Group Debt 0.41 (12.26) 0.15 (8.00) 0.67 (15.41)Profit before DF 11.54 (16.37) 13.14 (17.13) 9.98 (15.59)Directors Fees 4.96 (9.40) 6.55 (12.11) 3.37 (4.97)Tax 2.11 (3.36) 1.99 (3.10) 2.22 (3.60)Dividends 2.46 (6.43) 1.71 (4.71) 3.22 (7.72)Retained Profits 1.73 (10.63) 2.41 (8.68) 1.07 (12.20)
All section D variables expressed in terms of their % of start-of-period total assets.
Section E: Unexpected Changes in Financing
All Firms Closely-Held Other FirmsMean (SD) Mean (SD) Mean (SD)
% unexpected ∆ inRetained Profits
t-value for equalityof means =
0.24 (10.85)
2.38***
0.76 (8.40) *** -0.27 (12.77)
% unexpected ∆ inshare capital
t-value for equalityof means =
0.56 (8.57) **
2.71***
0.11 (3.91) 1.02 (11.47)***
% unexpected ∆ inTotal Debt
t-value for equalityof means =
-0.53 (11.67) **
1.00
-0.31 (10.68) -0.76 (12.58) ***
All section E variables expressed in terms of their % of start-of-period total assets.
*** = significant at 1%; ** significant at 5%; * significant at 10%.

21
Table TwoEmpirical Estimates:Basic Model
Dependent Variable = (TAt-TAt-1)/TAt-1
All Firms All Firms Closely-Held Other FirmsModel 1 Model 2
Variable Name Coefficient Coefficient Coefficient CoefficientRetained Profit 0.568
(15.65) ***0.488(11.27) ***
0.780(12.62) ***
0.467(10.32) ***
∆ Share Capital 0.192(4.19) ***
0.187(4.08) ***
0.437(2.96) ***
0.150(3.02) ***
∆ Total Debt 0.447(17.14) ***
0.447(17.17) ***
0.608 (16.07) ***
0.330 (9.23) ***
Retained Profit xclosely-helddummy
0.260(3.37) ***
Constant 0.025(8.47) ***
0.023(7.81) ***
0.017(4.05) ***
0.027 (6.45) ***
Year dummiesSignificant?
Yes*** Yes*** Yes*** Yes***
Fixed EffectsSignificant?
Yes* Yes* No Yes***
Adjusted R2 (%) 28.4 28.8 34.7 26.4
N = 2509 2509 1237 1272
*** = significant at 1%; ** significant at 5%; * significant at 10%.
22
Table ThreeEmpirical Estimates:Types of Debt Model
Dependent Variable = (TAt-TAt-1)/TAt-1
All Firms All Firms Closely-Held Other FirmsModel 1 Model 2
Variable Name Coefficient Coefficient Coefficient CoefficientRetained Profit 0.747
(22.62) *** 0.687(17.50) ***
0.906(15.42) ***
0.670 (16.62) ***
∆ Share Capital 0.469(11.00) ***
0.464 (11.00) ***
0.641 (4.65) ***
0.431(9.53) ***
∆ Short-term Debt 0.603(21.67) ***
0.604(21.72) ***
0.640(15.38) ***
0.566(14.98) ***
∆ Long-term Debt 0.629(15.60) ***
0.624(15.50) ***
0.677(9.93) ***
0.583(11.48) ***
∆ HP Debt 0.676 (8.99) ***
0.672 (8.96) ***
0.781 (7.21) ***
0.546 (5.15) ***
∆ Group Debt 0.583 (23.08) ***
0.580 (22.97) ***
0.670 (12.22) ***
0.545 (18.56) ***
Retained Profit xclosely-helddummy
0.195 (2.86) ***
Constant 0.016 (6.17) ***
0.015(5.64) ***
0.010(2.71) ***
0.018(5.00) ***
Year dummiesSignificant?
Yes*** Yes*** Yes*** Yes***
Fixed EffectsSignificant?
No No No Yes***
Adjusted R2 (%) 44.4 44.6 42.6 46.1
N = 2509 2509 1237 1272*** = significant at 1%; ** significant at 5%; * significant at 10%.

23
Endnotes 1 Closely-held is a binary variable, coded 1 when the current directors have a majorityequity stake and 0 otherwise. It would be desirable to measure ownershipconcentration as a continuous variable i.e. percentage of equity owned by currentdirectors in order to test hypothesis concerning the precise relationship betweenfunding sources and principal/agent compatibility. Moreover, there are other potentialproxies, the age of the firm, for instance, that might be used to test whetherinformational asymmetries decrease over time. Also, as size and ownershipconcentration are correlated, a number of tests for age/time and size impacts on thepecking order hypothesis were also undertaken.
2 Also, there are no issue costs associated with retained earnings.
3 The response rate was as expected given the detailed nature of the questionnairesurvey. However, a response rate of 18% requires that tests for non-response biasshould be undertaken. The comprehensive data-base from which the sample framewas drawn allowed thorough tests to be completed. Two tests were carried out. Thefirst involved tests for differences in the sample characteristics between earlyrespondents (returned questionniares within one month) and later respondents(returned > 1 month). No significant differences were found. The second test involvedt-tests on the full sample of respondents and non-respondents in four areas: size (e.g.total assets, employees, turnover); profitability (ROCE, ROTA); working capitalstructure (debtor days, creditor days) and age. There were no differences in the meansof these variables at 5% significance. Pearson’s chi square was used to test forgeographical and industry bias and differences in legal status.
4 Various experiments were conducted with variables representing both age and sizeof firm. Age was measured as a continuous variable, a quadratic function, a linearspline and a binary variable for firms less than 10 years old and used as bothadditional control variable and an alternative partitioning mechanism. The sample waspartitioned by age (less than 10 years old) and size (less than 50 employees). Apattern of results consistent with a pecking order was always maintained. In respect ofage partitions it was evident that younger firms pay lower dividends and are morereliant on short-term debt finance. The latter result, however, may be more consistentwith supply-side financial constraints than firm–level preferences.
5 Also, the lack of any significant ownership effect either within or between the twogroups of firms appears to be consistent with Griner and Gordon’s (1995) inability touncover any significant evidence in favour of the managerial (self-interest)hypothesis.


