
SHEAR TRANSFER STRENGTH OF CONCRETE PLACED AGAINST HARDENED
CONCRETE
A Thesis
Presented to
The Graduate Faculty of The University of Akron
In Partial Fulfillment
of the Requirements for the Degree
Master of Science
Mohamed Habouh
August, 2015

ii
SHEAR TRANSFER STRENGTH OF CONCRETE PLACED AGAINST HARDENED
CONCRETE
Mohamed Habouh
Thesis
Approved: Accepted:
Advisor Department Chair
Dr. Anil Patnaik Dr. Wieslaw K. Binienda
Committee Member Acting Dean of the College
Dr. David Roke Dr. Rex Ramsier
Committee Member Interim Dean of the Graduate school
Dr. Ala Abbas Dr. Chand Midha
Date

iii
ABSTRACT
Shear transfer strength of concrete placed against hardened concrete has been of
interest because of the unavoidable joints between structural elements. Failed joints in
adjacent box beam girder bridges cause premature aging of these bridges and financial
liabilities. There are no design guidelines for such joints. This research was performed to
understand the joint behavior and vertical shear transfer mechanism of as-cast concrete
joints. Three sets of reinforced, un-reinforced along with specimens with precompression
were tested. Finite element analyses models were developed. It was established that (a)
ACI 318-2011 over-estimates the shear strength of joints with high clamping force. (b)
The shear strength expression introduced by Patnaik 2001 for horizontal shear for smooth
interface is applicable for vertical shear with a well defined upper bound for shear
strength at clamping forces larger than 800 psi. (c) Lateral stresses and lateral spread of
joints are generated due to vertical shear. Lateral supports and the application of normal
compressive forces to shear interface will increase the joint strength. (d) Larger vertical
slip at the shear interfaces at failure load is possible when external normal force is
applied.
iv
ACKNOWLEDGMENTS
I would like to express my deepest and sincere appreciation to my advisor Dr.
Anil Patnaik for his persistent guidance and continued support throughout the research;
He has been a constant source of great inspiration for me. I am also very thankful to my
committee members, Dr. D. Roke and Dr. A. Abbas for their valuable suggestions and
corrections. I would like to thank all my friends; the graduate students for their help and
valuable advices throughout the entire research process, I would like to thank my family
and friends for their continued support in this challenging experience.

v
TABLE OF CONTENTS
Page
LIST OF TABLES ............................................................................................................ iix
LIST OF FIGURES ........................................................................................................... xi
CHAPTER
I. INTRODUCTION ........................................................................................................... 1
1.1 Background and Problem Statement ....................................................................... 1
1.2 ACI Current Practice............................................................................................... 4
1.3 Study Objective ....................................................................................................... 6
II. LITERATURE REVIEW ............................................................................................... 7
2.1 The factors affecting the bond strength between concrete layers with different
ages. ........................................................................................................................ 7
2.1.1 Surface Preparation. ....................................................................................... 8
2.1.2 Shrinkage ....................................................................................................... 9
2.1.3 Stiffness.......................................................................................................... 9
2.1.4 Curing .......................................................................................................... 10
2.2 The Study of the Ultimate Shear Strength for Horizontal shear. .......................... 11
2.2.1 The Shear Strength in Horizontal Rough Interface for Composite Concrete
Beams. .......................................................................................................... 11
2.2.1.1 Horizontal Shear with Rough Interface by (Loov & Patnaik, 1994). .... 11
2.2.1.2 Horizontal Shear Transfer across a Roughened Surface (Mitchell, 2002).
................................................................................................................ 12
vi
2.2.2 The Shear Strength in Horizontal Smooth Interface for Composite Concrete
Beams. .......................................................................................................... 14
2.2.3 The use of keys for horizontal shear ............................................................ 17
2.3 The Study of the Ultimate Shear Strength for Vertical shear ............................... 20
2.3.1 Shear Capacity of Monolithic Concrete vs. the Concrete Placed Against
Hardened Concrete, the Cracked Concrete (Aziz, 2010). ............................ 20
2.3.2 Shear Strength for Vertical Shear Interface. ................................................ 24
2.3.2.1 Equations by (Anderson, 1960) ............................................................. 25
2.3.2.2 Equations by (Mattock & Kaar, 1961) ................................................... 25
2.3.2.3 Equation by (Saemann & Washa, 1964) ................................................ 25
2.3.2.4 Equations by (Gaston & Kriz, 1964) ..................................................... 26
2.3.2.5 Equations by (Birkeland & Birkeland, 1966) ........................................ 26
2.3.2.6 Modified Equation by (Mattock A. H., 1974) ....................................... 27
2.3.2.7 Equation by (Hermansen & Cowan, 1974) ............................................ 27
2.3.2.8 (Mattock A. H., 2001) ............................................................................ 27
2.3.3 Shear transfer across a crack in reinforced high strength concrete. ............. 28
III. METHODOLOGY ..................................................................................................... 30
3.1 Study Parameters .................................................................................................. 30
3.1.1 Reinforcement and Concrete........................................................................ 30
3.1.3 Mix Design................................................................................................... 33
3.1.4 Compressive Strength .................................................................................. 33
3.1.5 Rebar Arrangement ...................................................................................... 34
3.2 Preparation of Specimens. .................................................................................... 37
3.3 Shear Test Setup and Procedure ........................................................................... 38

vii
IV. RESULTS AND DISCUSSION ................................................................................. 40
4.1 Test Results. .......................................................................................................... 40
4.2 Rebar Distribution and Failure Mode. .................................................................. 41
4.3 Load-Slip Diagram................................................................................................ 46
4.4 Comparisons of Test Specimens ........................................................................... 56
4.5.1 Material Properties. ...................................................................................... 62
4.5.2 Displacement control approach.................................................................... 65
4.5.3 ABAQUS Analysis Plan .............................................................................. 68
4.5.3 ABAQUS Analysis Plan .............................................................................. 68
4.5.4 Rebar Modeling ........................................................................................... 70
4.5.5 Concrete Modeling....................................................................................... 70
4.5.6 Boundary Conditions ................................................................................... 71
4.5.7 Contact between Steel and Concrete............................................................ 71
4.5.8 Friction between Concrete Surfaces ............................................................ 72
4.5.9 Analysis Results ........................................................................................... 73
4.5.10 Discussion .................................................................................................. 77
4.5.10.1 Boundary Condition ............................................................................. 77
4. 5.10.2 Rebar Distribution and Reinforcement Area. ..................................... 79
V. POTENTIAL APPLICATION FOR ADJACENT BOX BEAM GIRDER BRIDGES
..................................................................................................................................... 83
5.1 Introduction ........................................................................................................... 83
5.2 State-of-practice for key way geometry ................................................................ 84
5.3 ODOT Current Practice ........................................................................................ 86
5.5 Design Criteria for Connections (Henry, 2011) .................................................... 88
viii
5.6 Test Program ......................................................................................................... 89
5.7 Specimen Design .................................................................................................. 90
5.7.1Compressive strength of concrete units and grout ........................................ 91
5.8 Test Results ........................................................................................................... 91
5.9 Discussion ............................................................................................................. 94
5.9.1 Load Transfer Mechanism ........................................................................... 94
5.9.2 Failure Modes .............................................................................................. 94
5.9.3 First Crack Load and Reserve Strength ....................................................... 95
5.9.4 Vertical Displacement .................................................................................. 97
VI. CONCLUSIONS AND RECOMMENDATIONS ................................................... 101
REFERENCES ............................................................................................................... 103
APPENDIX ..................................................................................................................... 106

ix
LIST OF TABLES
Table Page
1 : Roughness Classification (Pedro & Eduardo, 2011) ..................................................... 9
2: Design Equations (Mitchell, 2002) ............................................................................... 13
3: Details of 24 Test Beams for a Smooth Interface (Patnaik, 2001) ............................... 15
4: Previous Test Results for 18 Beams for a Smooth Interface ........................................ 16
5: Interface Shear Transfer Capacity (Aziz, 2010) ........................................................... 23
6 : Surface Condition and Friction Coefficient. ................................................................ 26
7: Mattock Design Expression (A) ................................................................................... 27
8: K Factors ....................................................................................................................... 27
9: Revised Mattock Design Expressions (B) .................................................................... 28
10: λ Factor ....................................................................................................................... 28
11:Proposed horizontal shear expressions by (Mansur, Vinayagam, & Tan, 2008)......... 29
12: Study Parameters ........................................................................................................ 32
13: Mix Design. ................................................................................................................ 33
14: Compressive Strength ................................................................................................. 33
15: Shear Test Results ....................................................................................................... 40
16: Shear Strength by ACI Expressions............................................................................ 43
17: Test Variables ............................................................................................................. 56
18: Tensile Test Results. ................................................................................................... 63
x
19: Input File for Steel "Stress-Strain Curve" ................................................................... 66
20: Input File of Concrete "Stress-Strain Curve".............................................................. 67
21: Specimen Characteristics for FE Models.................................................................... 68
22: FE Analysis Results .................................................................................................... 73
23: Results from the Key Way Shear Tests at Failure ..................................................... 92
24: Results from the Key Way Shear Tests at First Crack ............................................... 92
xi
LIST OF FIGURES
Figure Page
1: Water Leakage at a Typical Joint in Adjacent Box Beams ............................................ 2
2: Box Beams with Corroded Strands at the Bottom .......................................................... 3
3 : Roughness of Concrete Surface (Pedro & Eduardo, 2011) ........................................... 8
4 : Shear Distribution at Interface Due To Differential Stiffness (Pedro & Eduardo,
2011). ................................................................................................................................ 10
5: Horizontal Shear Strength for Rough Interface by (Mitchell, 2002) ............................ 13
6 : Test Specimen (Patnaik, 2001) .................................................................................... 15
7 : Comparison between Different Design Expressions for Smooth Interface (Patnaik,
2001) ................................................................................................................................. 17
8: Shear connections (Arafjo & E1 Debs, 2005) .............................................................. 18
9: Push-out test (Arafjo & E1 Debs, 2005) ....................................................................... 19
10: Sampling Details (Aziz, 2010) - (A) ........................................................................... 21
11 : Sampling Details (Aziz, 2010) - (B) .......................................................................... 22
12 : Development Length (ACI, 2011) ............................................................................. 32
13: Test Specimen’s reinforcement .................................................................................. 34
14: Test Specimens Interface Details ................................................................................ 35
15: Test Specimen Details (continued) ............................................................................. 36
16 : Rough Interface in the Current Tests ......................................................................... 37
17: Test setup .................................................................................................................... 38

xii
18 : Development Length in Specimens ........................................................................... 41
19: Splitting and Failure of S33 ........................................................................................ 42
20: Comparing test results with Horizontal Shear Expression for rough interface by (Loov
& Patnaik, 1994) ............................................................................................................... 44
21: Comparing test results with Horizontal Shear Expression for Smooth interface
(Patnaik, 2001) – A (psi) ................................................................................................... 45
22 : Load Slip Diagram ..................................................................................................... 47
23: Shear-Slip Diagram for Set # 2 ................................................................................... 47
24: Shear-Slip Diagram for Set # 3 ................................................................................... 48
25: Failure in S14 .............................................................................................................. 49
26: Cracks in S26 .............................................................................................................. 50
27: Failure mode of S26 .................................................................................................... 51
28: Splitting tensile stresses in S14 ................................................................................... 51
29: Splitting tensile stresses in S22 ................................................................................... 52
30: Specimen S22 with no cracking in the middle concrete block ................................... 52
31: Failure mode of specimen S26.................................................................................... 53
32: Failure mode of specimen S14.................................................................................... 54
33: distribution of applied load ......................................................................................... 54
34: Failure mode of specimen S26.................................................................................... 55
35: Interface Area vs. Shear Strength Constant Area of Steel - A .................................... 57
36: Interface Area vs. Shear Strength Constant Area of Steel - B .................................... 58
37: Set #2 Constant Ac =90 in2 with variable area of shear reinforcement - A ................ 58
38: Set #2 Constant Ac =90 in2 with variable area of shear reinforcement - B ................ 59
39: Set #3 Constant Ac =150 in2 with variable area of shear reinforcement - A .............. 59

xiii
40: Set #3 Constant Ac =150 in2 with variable area of shear reinforcement - B .............. 60
41: Rebar distribution for As = 6#3 ................................................................................... 60
42: Rebar distribution for As = 4#3 ................................................................................... 60
43: Rebar distribution - A ................................................................................................. 61
44: Rebar distribution - B ................................................................................................. 61
45 : Tensile Test Steup of Rebar ....................................................................................... 62
46 : Preparation of Tensile Test Specimen ....................................................................... 63
47 : Stress Strain Diagram of Rebar ................................................................................. 64
48: Specimen Size and Rebar Details for FE Model ........................................................ 69
50: Concrete Model Mesh ................................................................................................. 70
49: Rebar Mesh ................................................................................................................. 70
51: Interface Friction Surface ........................................................................................... 72
52: Steel and Concrete Stresses Distribution .................................................................... 74
53: Lateral Displacement for FR441................................................................................. 75
54: Load vs. Slip for FE Models - A ................................................................................. 76
55: Load vs. Slip for FE Models - B ................................................................................. 76
56: Boundary Condition and Load Carrying Capacity ..................................................... 78
57: Boundary Conditions and Shear Strength ................................................................... 78
58: Rebar Distribution and Reinforcement Area - Load ................................................... 80
59: Rebar Distribution and Reinforcement Area - Shear .................................................. 80
60: Interface Area - Load .................................................................................................. 82
F61: Interface Area - Shear ............................................................................................... 82
62: Examples of key Way Configurations (Henry, 2011) ................................................ 85

xiv
63: Different Key Way Geometries (Murphy, Kim, Zang, & Chao, 2010) ...................... 85
64: Standard ODOT Key Way Geometry ......................................................................... 86
65: The Use of Transverse Force (Henry, 2011) .............................................................. 87
66: Average Transverse force (Henry, 2011) ................................................................... 89
67: Typical Geometry of Test Specimens ......................................................................... 90
68: Test Specimen with a Tie Rod .................................................................................... 91
69: Typical Load-Slip Diagram for Specimens without Tie-Rod ..................................... 93
70: Typical Load-Slip Diagram for Specimens with Tie-Rod .......................................... 93
71: Typical failure mode for specimens with tie-rod ........................................................ 96
72: Typical failure mode for specimens without tie-rod ................................................... 97
73: Failure load Vs. Torque .............................................................................................. 98
74: Ultimate load Vs. Torque............................................................................................ 98
75: Ties in Box Beam Bridges (PCI, 2009) ...................................................................... 99

1
CHAPTER I .
INTRODUCTION
1.1 Background and Problem Statement
In reinforced concrete structures, the integrity of the structural elements is
important; the highest load carrying capacity will be achieved if there are no joints
between different concrete units, and the entire structure is made as a monolithic concrete
structure assuring that the structure will act as a single unit. However making a structure
completely monolithic is not always the practical or economical. Therefore, joints are
unavoidable in construction. Cost, time, ease of construction, and safety are important
factors that will influence the location and number of planned and controlled construction
joints. Construction joints may result from unexpected circumstances that can be due to
the breakdown of construction equipment, unsuitable materials (e.g., concrete with
properties outside the acceptable QA/QC limits), or bad weather condition. It is important
to avoid the joints in the locations of high bending or shear stresses. Joints can be vertical
or horizontal while the loads acting in these joints can be perpendicular or parallel to the
joint interface. Some examples of the expected joints are the joints between the web and
the flange in T-sections, joints between columns and their footings, joints between the
columns and the beams, the longitudinal joints in the adjacent prestressed concrete box

2
beam girders. Such joints can be reinforced joints with transverse rebar or
unreinforced joints. The capacity of the unreinforced joints can be significantly low in
comparison with the reinforced joints. The overall design of a structure including the
joints is to ensure that the structure acts as one monolithic unit.
In adjacent prestressed box beam girders, when joints are exposed to the weather
and loading conditions, the failure of the shear key between the adjacent girders is
usually accompanied with failure in the waterproofing membranes. The key way joints
are grouted with cementitious grouts. The water leaking through the key way of a typical
longitudinal joint will corrode the internal reinforcement and the prestressing strands
leading to spalling of the concrete cover in the box beams. This problem is a very
common problem as reported by many state departments of transportation in the United
States.
Figure 1: Water Leakage at a Typical Joint in Adjacent Box Beams

3
In bridges, failure of the joints can cause deterioration because the girders will act
individually under the applied loads resulting in higher vertical deflection and larger
horizontal movements that can cause the reported waterproofing membrane failure,
usually the cracks propagates to the asphalt pavement on the surface. The corroded
strands within the box beams can suffer reduced cross-sectional area and loss of prestress
leading to higher deflection than expected. In order to understand the joint behavior, the
shear transfer strength of the grout placed against the hardened concrete surface of the
adjacent precast concrete box beams needs to be evaluated.
Figure 2: Box Beams with Corroded Strands at the Bottom
In this research project, the interface shear transfer strength was investigated for
concrete placed against hardened concrete with and without reinforcement when a static

4
load is applied parallel to the interface to develop the required basis for establishing the
failure criteria and the quantify the effects of the factors influencing the joint shear
transfer capacity at the key way joints of adjacent box beam bridges.
1.2 ACI Current Practice
The American Concrete Institute Code (ACI 318, 2011) adopted the shear-friction
concept to evaluate the shear strength of the cracked concrete and the concrete placed
against hardened concrete. It is assumed that such a crack will form, and that
reinforcement must be provided across the crack to resist relative displacement by dowel
action. When shear acts along a crack, one crack face slips relative to the other. If the
crack faces are rough and irregular, this slip is accompanied by separation of the crack
faces. At ultimate, the separation is sufficient to stress the reinforcement crossing the
crack to its yield point. The reinforcement provides a clamping force across the
crack faces. The applied shear is then resisted by friction between the crack faces, and by
dowel action of the reinforcement crossing the crack.
When the shear-friction reinforcement is perpendicular to the shear plane, the
nominal shear strength is given by
where Ac is the area of concrete section resisting shear transfer (in2 ) and K1 =
400 psi for normal weight concrete, 200 psi for all-lightweight concrete, and 250 psi for
sand lightweight concrete. These values of K1 apply to both monolithically cast concrete
and to concrete cast against hardened concrete with a rough surface.
Another ACI equation to determine the shear capacity for concrete placed against
hardened concrete with rough surface

5
. Where μ is coefficient of friction = 1.0 λ
for normal weight concrete, for the case of concrete placed against the hardened
concrete with rough interface, a coefficient of 1.0 is used. And three upper limits are
applied to the shear capacity, and the smallest limit governs.
The Horizontal shear strength was defined by the ACI 318-11 in section 11.4.6.3 when
the contact surfaces are clean, free of laitance, and intentionally roughened to a full
amplitude of approximately 1/4 in., shall be taken equal to ,
but not greater than .
The expression accounts only for the surface area of the interface and the steel ties
crossing the interface, that reinforcement was defined in section 17.6.1, 17.6.2, 17.6.3 as
Where ties are provided to transfer horizontal shear, tie area shall not be less than
and tie spacing shall not exceed four times the least
dimension of supported element, nor exceeding 24 in.
Ties for horizontal shear shall consist of single bars or wire, multiple leg stirrups,
or vertical legs of welded wire reinforcement.
All ties shall be fully anchored into interconnected elements.
The design expression doesn’t account for the compressive strength of the concrete if
]. If vertical shear using the shear friction theory will
apply as discussed earlier.
6
1.3 Study Objective
The ACI doesn’t differentiate between the cracked concrete and the concrete
placed against hardened concrete with a rough interface. Considering the weak bond
strength between the concrete placed against hardened concrete. The design expressions
account for the area of reinforcement crossing the section without considering the
distribution of that rebar in the section. The previous studies considered many factors that
affect the shear strength of concrete interface but all of them are concrete related factors
accounting for the area of steel crossing the interface, the effect of the rebar distribution
of the bars in the concrete were not studied. A secondary objective is to develop a well-
defined state of stresses using finite element models to understand the load paths and the
effect of the different distribution of the reinforcement on the interface performance. Also
needed is a validation of the horizontal shear strength expressions for the prediction of
interface shear strength. The effect of the clamping force on the shear strength of
concrete joined using grout material is also needed. The following is a summary of the
objectives of the study:
• Evaluation of the ACI current expression
• Evaluate the previous expressions by researchers
• Determine the behavior of joints under applied loads
• Study the effects of steel area, rebar distribution of the steel crossing the shear
interface, and the effects of concrete interface area
• Study effects of lateral restraints at the interface, and normal forces acting on the
interface
7
CHAPTER II .
LITERATURE REVIEW
The shear capacity of reinforced concrete has been subject to research since the
fifties of 20th
century, with that extensive research for the last 60 years, the design codes
had changed over time to reach the current shear strength expressions stated in ACI 318-
11. The current practices at the time of each study and the interest of different researchers
varied in the context of structural concrete in different earlier studies. In this literature
review, the developments, theories, and test results from previous research are explained
within the following classification.
1. The differences between the shear capacities for monolithic concrete, the concrete placed
against hardened concrete, the cracked concrete, concrete interface with smooth or rough
interface, and the application of shear keys and its effect on the ultimate shear strength.
2. The factors affecting the bond strength between concrete layers with different ages.
3. The study of the ultimate shear strength for the case of horizontal and vertical shear.
2.1 The factors affecting the bond strength between concrete layers with different ages.
There are many parameters which are often neglected by the design codes that can
affect the strength of the interface by affecting the bond strength at the interface

8
Between concrete layers cast at different ages (Birkeland H. W., 1968). The
factors adopted under this study are described in the following sections of this chapter.
2.1.1 Surface Preparation.
Roughness of concrete interface will change the friction coefficient of the
concrete interface.
Figure 3 : Roughness of Concrete Surface (Pedro & Eduardo, 2011)
In Figure 3 on surface preparation the following are the descriptions of each surface (a)
left as-cast; (b) wire-brushing; (c) sandblasting; (d) shot blasting; and (e) hand-scrubbing.
A laser roughness analyzer was used to quantify the roughness parameter and to
measure the maximum valley depth . The valley depth varies from 0.005 inch for
concrete placed against steel formwork to 0.093 inch for the hand scrubbed concrete.
The bond strength of the concrete-to-concrete interface increased with the
increase of the surface roughness, therefore that the higher the roughness of the interface
the higher the shear strength (Pedro & Eduardo, 2011).

9
Table 1 : Roughness Classification (Pedro & Eduardo, 2011)
Surface preparation Maximum valley depth Rv, mm (inch)
Left as-cast 0.119 (0.005)
Wire-brushing 0.473 (0.019)
Sand blasting 0.604 (0.024)
Shot blasting 0.899 (0.035)
Hand-scrubbing 2.350 (0.093)
2.1.2 Shrinkage
Stresses increase with the increase of the differential shrinkage between concrete
layers.
2.1.3 Stiffness
The differential stiffness between the concrete layers is an important factor that
will affect the friction between the concrete interface. In the study by Pedro & Eduardo
(2011), four specimens each having two layers of concrete were tested to understand the
effects of differential stiffness, the base (bottom) layer for the 4 specimens was
ksi, and the top layer with four different modulus of elasticity values
. These experiments showed that the differential
stiffness could have influence in the bond strength of the interface.

10
Figure 4 : Shear Distribution at Interface Due To Differential Stiffness (Pedro &
Eduardo, 2011).
The stress distribution at the interface, for both shear and normal stresses, is
influenced by the differential stiffness of the two units on either side of the interface.
With the increase of the differential stiffness, stress concentrations occur at both ends and
the stress distribution assumes an S-shaped form. For the concrete layers with the same
modulus of elasticity, the stress distributions are linear along the interface.
2.1.4 Curing
Two curing conditions were considered in the study by Pedro & Eduardo (2011).
One set of concrete specimens was stored in the laboratory and another set was stored
outside, directly exposed to the environmental conditions such as solar radiation, rain,
and wind. For both curing conditions, inside and outside the laboratory, the average
values of temperature and relative humidity were very similar, whereas the coefficient of
variation for the inside condition was approximately the double relative to the outside
condition, due to higher daily fluctuations of both parameters.

11
2.2 The Study of the Ultimate Shear Strength for Horizontal shear.
The shear strength in concrete can be classified in the two major different
categories, the horizontal shear strength and the vertical shear strength, both of these two
categories can be subdivided by the combination of rough vs. smooth interface,
reinforced vs. non reinforced, with or without shear key, monolithic vs. concrete placed
against hardened concrete.
2.2.1 The Shear Strength in Horizontal Rough Interface for Composite Concrete Beams.
The shear strength of the composite beam specimens for the rough interface is discussed
below.
2.2.1.1 Horizontal Shear with Rough Interface by (Loov & Patnaik, 1994).
In this study the authors introduced a new parabolic design equation to replace
four of the ACI equations based on 16 beam tests which account for the effect of the
concrete strength and the clamping stress. This equation is equally applicable for
lightweight concrete and semi-lightweight concrete. The test results indicated that (1)
stirrups are unstressed and ineffective until the horizontal shear stresses exceed 1.5 to
, (2) without special effort to produce roughness, the interface can develop
adequate shear resistance and that will simplify the production of the precast concrete
beams. That also eases the onsite production of concrete when it is tedious to add
roughness to the interface in the concrete inside the formwork with heavy reinforcement.
A normally vibrated concrete presents an as-cast surface in most of the horizontal joints.
Vertical joints that are cast against wooden or steel formwork will have smooth surface.
Many variables like the width and the length of the flange, different areas of longitudinal
steel, variable effective depth; variable yield stress of the reinforcement leading to
12
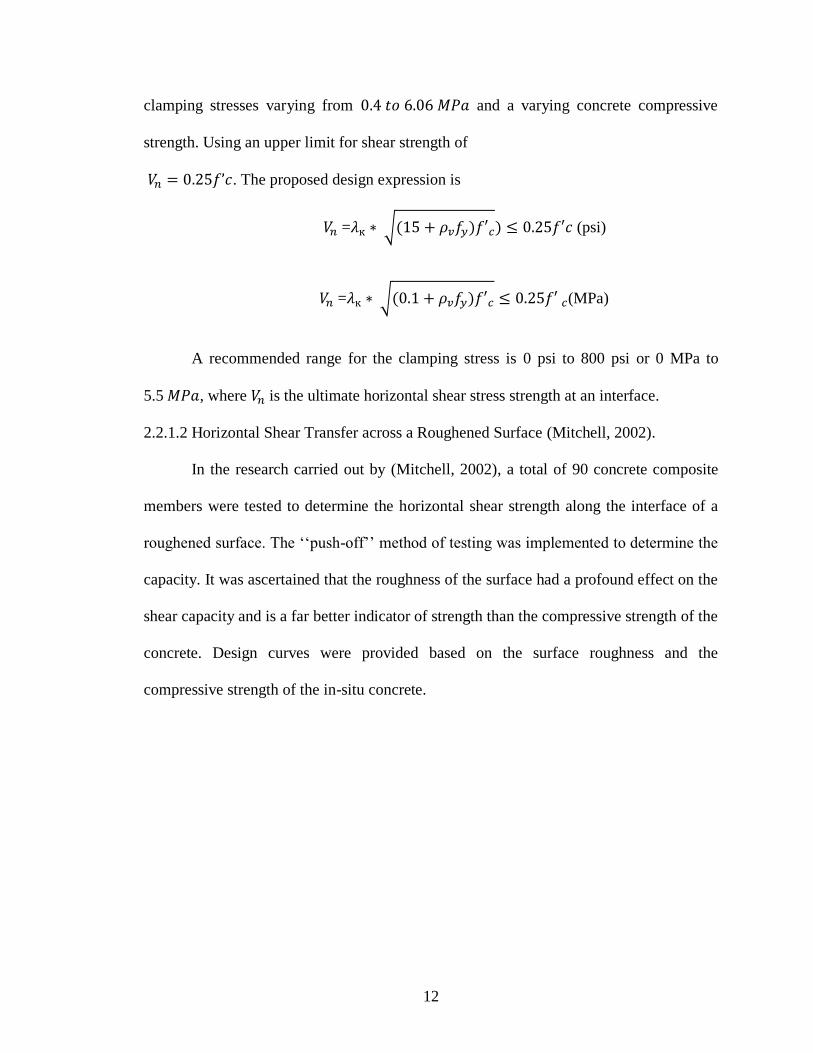
clamping stresses varying from and a varying concrete compressive
strength. Using an upper limit for shear strength of
. The proposed design expression is
= (psi)
= (MPa)
A recommended range for the clamping stress is 0 psi to 800 psi or 0 MPa to
5.5 , where is the ultimate horizontal shear stress strength at an interface.
2.2.1.2 Horizontal Shear Transfer across a Roughened Surface (Mitchell, 2002).
In the research carried out by (Mitchell, 2002), a total of 90 concrete composite
members were tested to determine the horizontal shear strength along the interface of a
roughened surface. The ‘‘push-off’’ method of testing was implemented to determine the
capacity. It was ascertained that the roughness of the surface had a profound effect on the
shear capacity and is a far better indicator of strength than the compressive strength of the
concrete. Design curves were provided based on the surface roughness and the
compressive strength of the in-situ concrete.

13
Figure 5: Horizontal Shear Strength for Rough Interface by (Mitchell, 2002)
They introduced four equations to evaluate the design values for the horizontal
shear strength; two of them relate the shear strength to the roughness and two to calculate
the shear strength using the concrete compressive strength as shown in Table 2.
Table 2: Design Equations (Mitchell, 2002)
Horizontal shear for
the regression curve
Horizontal shear At 95% one
side confidence interval.
Horizontal shear based on
concrete strength
Horizontal shear based on
roughness
14
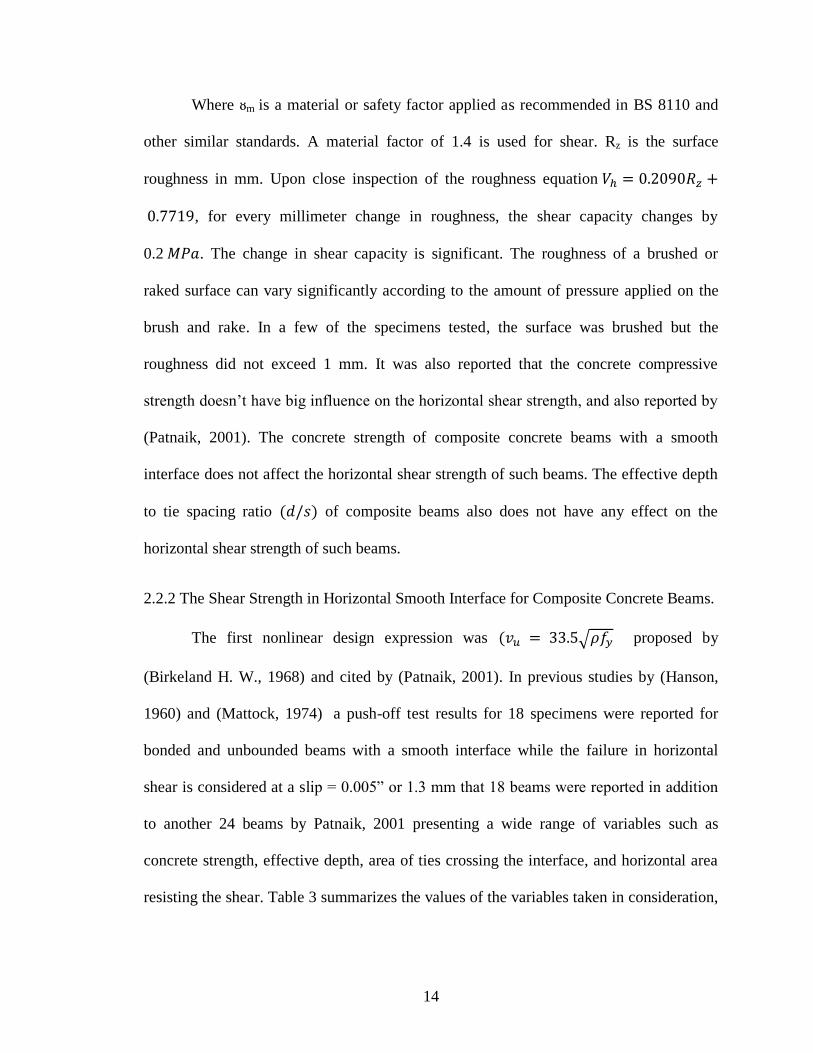
Where ᴕm is a material or safety factor applied as recommended in BS 8110 and
other similar standards. A material factor of 1.4 is used for shear. Rz is the surface
roughness in mm. Upon close inspection of the roughness equation
, for every millimeter change in roughness, the shear capacity changes by
0.2 . The change in shear capacity is significant. The roughness of a brushed or
raked surface can vary significantly according to the amount of pressure applied on the
brush and rake. In a few of the specimens tested, the surface was brushed but the
roughness did not exceed 1 mm. It was also reported that the concrete compressive
strength doesn’t have big influence on the horizontal shear strength, and also reported by
(Patnaik, 2001). The concrete strength of composite concrete beams with a smooth
interface does not affect the horizontal shear strength of such beams. The effective depth
to tie spacing ratio of composite beams also does not have any effect on the
horizontal shear strength of such beams.
2.2.2 The Shear Strength in Horizontal Smooth Interface for Composite Concrete Beams.
The first nonlinear design expression was proposed by
(Birkeland H. W., 1968) and cited by (Patnaik, 2001). In previous studies by (Hanson,
1960) and (Mattock, 1974) a push-off test results for 18 specimens were reported for
bonded and unbounded beams with a smooth interface while the failure in horizontal
shear is considered at a slip = 0.005” or 1.3 mm that 18 beams were reported in addition
to another 24 beams by Patnaik, 2001 presenting a wide range of variables such as
concrete strength, effective depth, area of ties crossing the interface, and horizontal area
resisting the shear. Table 3 summarizes the values of the variables taken in consideration,

15
a shear strength expression was introduces by (Patnaik, 2001) evaluating the horizontal
shear to be calculated as
Table 3: Details of 24 Test Beams for a Smooth Interface (Patnaik, 2001)
Figure 6 : Test Specimen (Patnaik, 2001)

16
Table 4: Previous Test Results for 18 Beams for a Smooth Interface
Comparing the strength provided by ACI 318-99, Canadian code, PCI expression,
Test results and the newly proposed expression it was found that the ACI and Canadian
codes underestimate the strength of the interface while the PCI expression under estimate
the sections with high clamping stresses and not accurate for low clamping stresses
(Figure 7).

17
Figure 7 : Comparison between Different Design Expressions for Smooth Interface
(Patnaik, 2001)
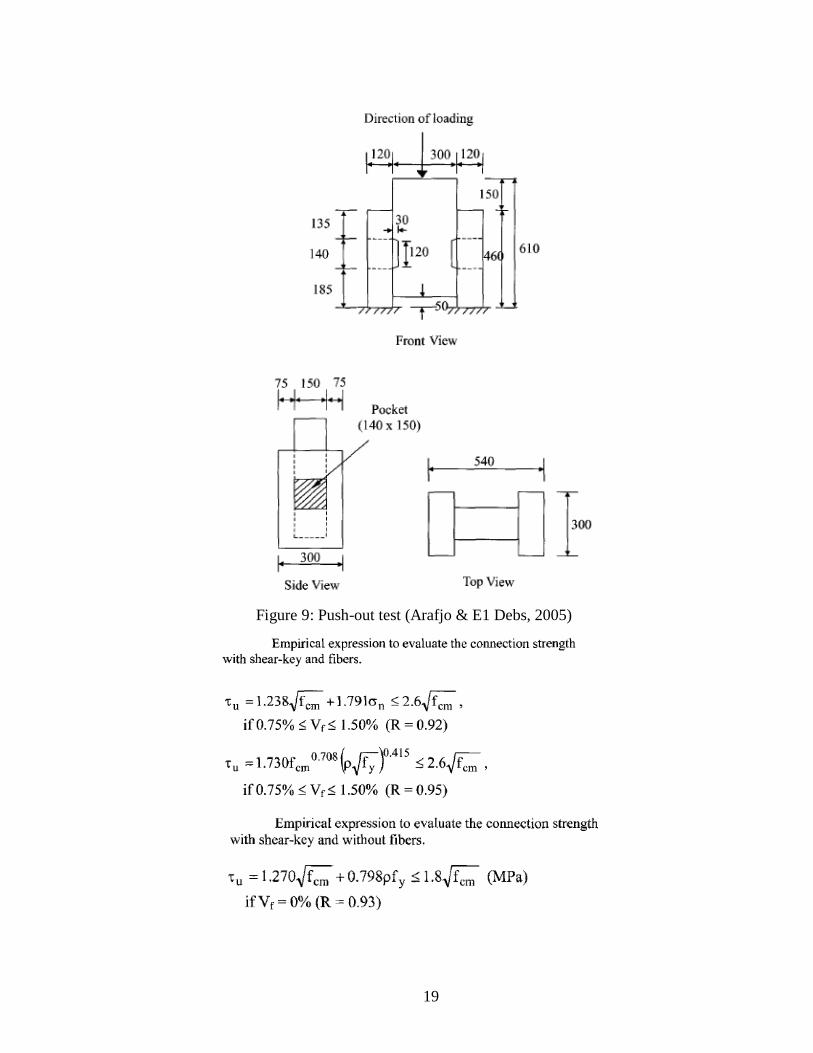
2.2.3 The use of keys for horizontal shear
The use of shear key and different shear key design have a significant influence
on the shear strength, in a research study by (Arafjo & E1 Debs, 2005) considering the
cast in-situ concrete is one of the simplest and cost effective ways to connect two
concrete elements, the connections proposed by these authors in that research are shown
in Figure 8: Shear connections and Figure 9.

18
Figure 8: Shear connections (Arafjo & E1 Debs, 2005)
They concluded that a 35% increase in the connection strength can be achieved by
increasing the compressive strength of the pocket filling concrete, and further increase in
the connection strength can be obtained by increasing the pocket diameter, the
application of fiber to the filling concrete increased the connection strength by 62%. They
proposed two expressions to evaluate the strength of the precast slabs and beams made
composite by this type of connection.
19
Figure 9: Push-out test (Arafjo & E1 Debs, 2005)
20
2.3 The Study of the Ultimate Shear Strength for Vertical shear
This section deals with the discussion of ultimate shear strength of vertical shear.
2.3.1 Shear Capacity of Monolithic Concrete vs. the Concrete Placed Against Hardened
Concrete, the Cracked Concrete (Aziz, 2010).
In an experimental study by Aziz (2010), 14 Specimens were tested to compare
the shear capacity of concrete surface considering seven specimen configurations.
1- Reinforced monolithic concrete
2- Plain concrete with smooth interface
3- Smooth interface with reinforcement across the shear resisting plane
4- Plain concrete with rough interface
5- Rough interface with reinforcement across shear plane
6- Plain concrete with shear key
7- Reinforced shear key across the shear interface.
Figure 10 and 11 show the specimens and the different cases used in the study by Aziz
(2010).

21
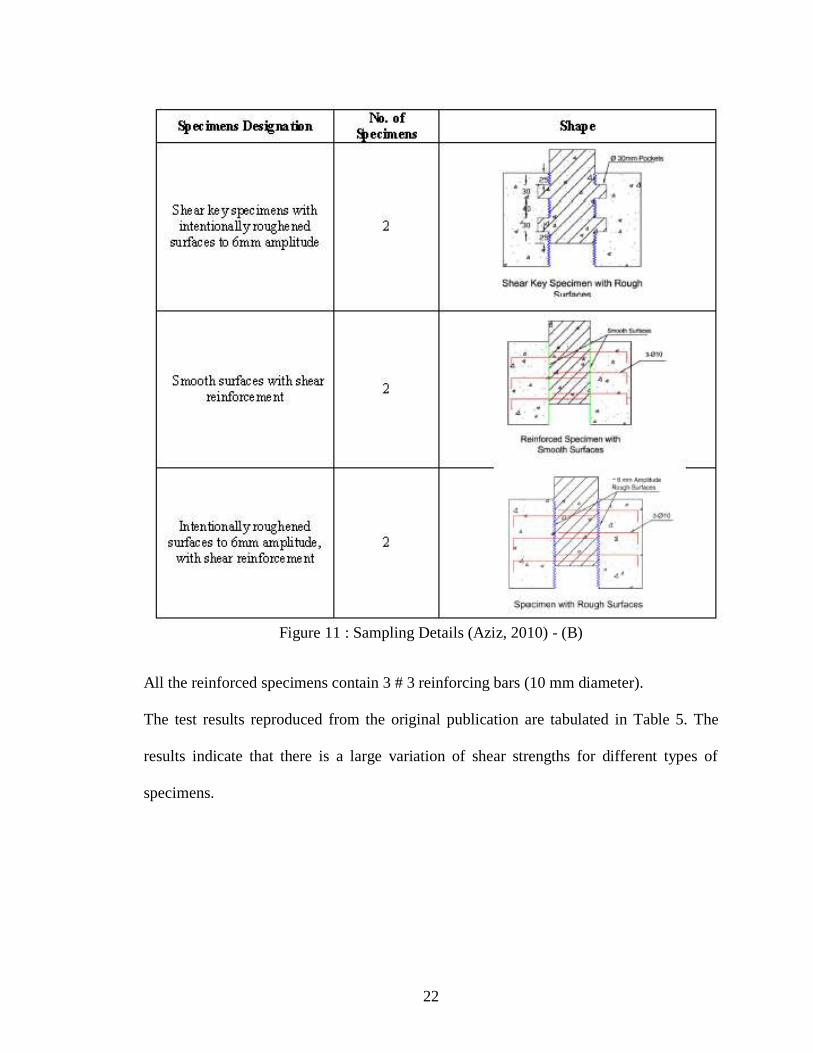
Figure 10: Sampling Details (Aziz, 2010) - (A)
22
Figure 11 : Sampling Details (Aziz, 2010) - (B)
All the reinforced specimens contain 3 # 3 reinforcing bars (10 mm diameter).
The test results reproduced from the original publication are tabulated in Table 5. The
results indicate that there is a large variation of shear strengths for different types of
specimens.
23
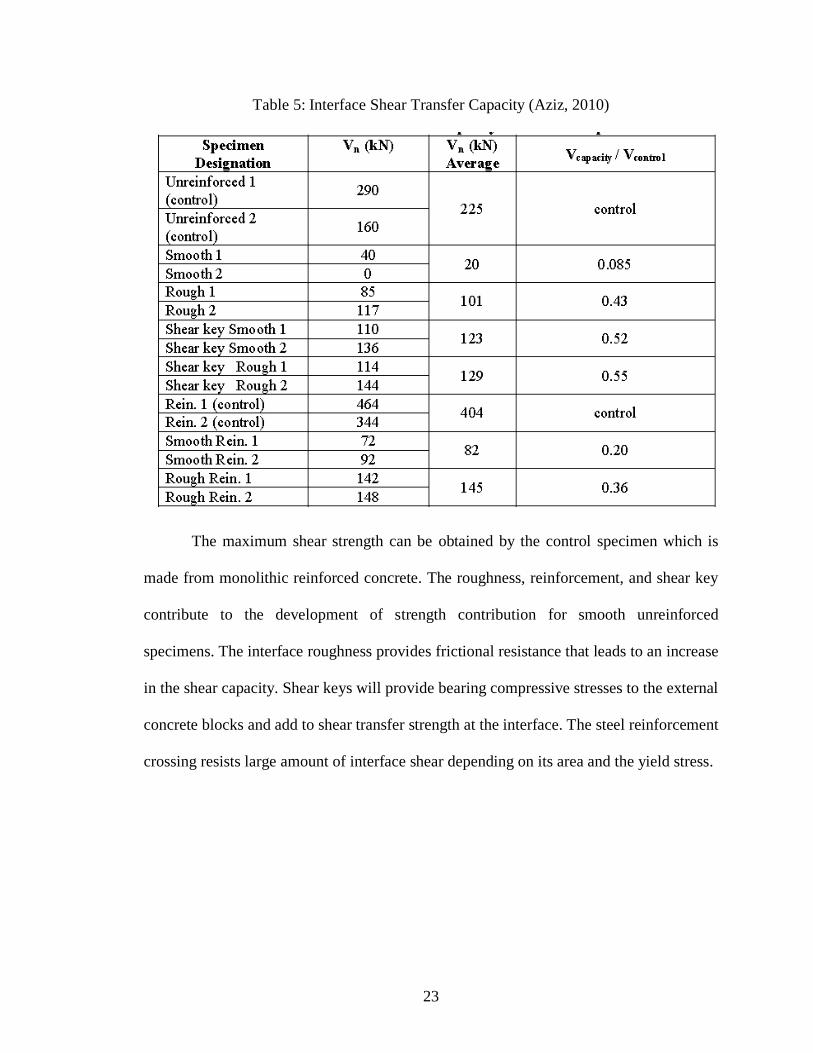
Table 5: Interface Shear Transfer Capacity (Aziz, 2010)
The maximum shear strength can be obtained by the control specimen which is
made from monolithic reinforced concrete. The roughness, reinforcement, and shear key
contribute to the development of strength contribution for smooth unreinforced
specimens. The interface roughness provides frictional resistance that leads to an increase
in the shear capacity. Shear keys will provide bearing compressive stresses to the external
concrete blocks and add to shear transfer strength at the interface. The steel reinforcement
crossing resists large amount of interface shear depending on its area and the yield stress.

24
2.3.2 Shear Strength for Vertical Shear Interface.
The ‘‘shear-friction theory’’ was first presented in 1966 and was adopted in all
design codes for reinforced concrete structures to predict the shear strength of different
types of concrete-to-concrete interface such as:
(a) The interface between a precast element and a cast-in-place units
(b) The interface between two parts of an element cast at different times
(c) The interface between an element and a support
(d) The interface between an existing element and a repairing/strengthening layer
(e) The interface between two parts of an element generated by a crack.
Two different situations can be considered:
a) interface shear strength without loss of adhesion.
b) Interface shear strength with relative slip between both concrete parts. Where the
‘‘shear-friction theory’’ can be applied, where the interfacial behavior is assumed to be
controlled by cohesion (sometime called aggregate interlock), friction and dowel action.
All design expressions have been calibrated from experimental results, mostly using
push-off test specimens (Pedro & Eduardo, 2012).
The development of ultimate shear strength expressions on test results and
empirical equations. In a study by Gaston and Kriz (1964) design expressions to estimate
the ultimate longitudinal shear stress in scarf joints of precast concrete were suggested.
This expression accounts only for the normal force without reinforcement or frictional
contribution for a smooth interface expression and was as follows:

25
Another expression for smooth bonded interfaces the design expression was suggested as
follows:
(psi)
Where Vu is the ultimate longitudinal shear stress at the interface and is the normal
stress at the interface.
2.3.2.1 Equations by (Anderson, 1960)
Anderson was one of the first to propose a design expression to predict the longitudinal
shear strength of concrete interfaces. The proposed expressions are as follows:
For psi
For psi
2.3.2.2 Equations by (Mattock & Kaar, 1961)
These authors proposed a design expression based on the shear span/effective depth ratio
to determine the ultimate longitudinal shear stress at the interface of composite reinforced
concrete beams. The proposed expression is as follows:
2.3.2.3 Equation by (Saemann & Washa, 1964)
The surface condition was not considered in the proposed expression because the authors
concluded that its contribution to the shear strength is variable and decreases with the
increase of the shear reinforcement ratio.
(psi)

26
2.3.2.4 Equations by (Gaston & Kriz, 1964)
The authors suggested the following design expressions to estimate the ultimate
longitudinal shear stress in scarf joints of precast concrete. For smooth un-bonded
interfaces the design
Smooth bonded interfaces the design expression is as follows:
2.3.2.5 Equations by (Birkeland & Birkeland, 1966)
They were the first to propose a linear expression to evaluate the ultimate
longitudinal shear stress of concrete interfaces. The proposed expression is as follows:
Where is the ultimate longitudinal shear stress at the interface; is the
reinforcement ratio; is the yield strength of the reinforcement; and Ø is the internal
friction angle. The tangent of the internal friction angle is also designated as coefficient
of friction and the term is the clamping stresses. This expression was proposed
for smooth concrete surfaces, and intentionally roughened concrete surfaces. The
coefficient of friction was empirically determined, varying with the surface preparation,
and it was defined for several situations.
Table 6 : Surface Condition and Friction Coefficient.
Surface condition Ø μ
Monolithic concrete 59.5 1.7
Intentionally roughened construction joints 54.5 1.4
For ordinary construction joints and for concrete to steel
interfaces
38.7 to 45 0.8 to
1.0
27
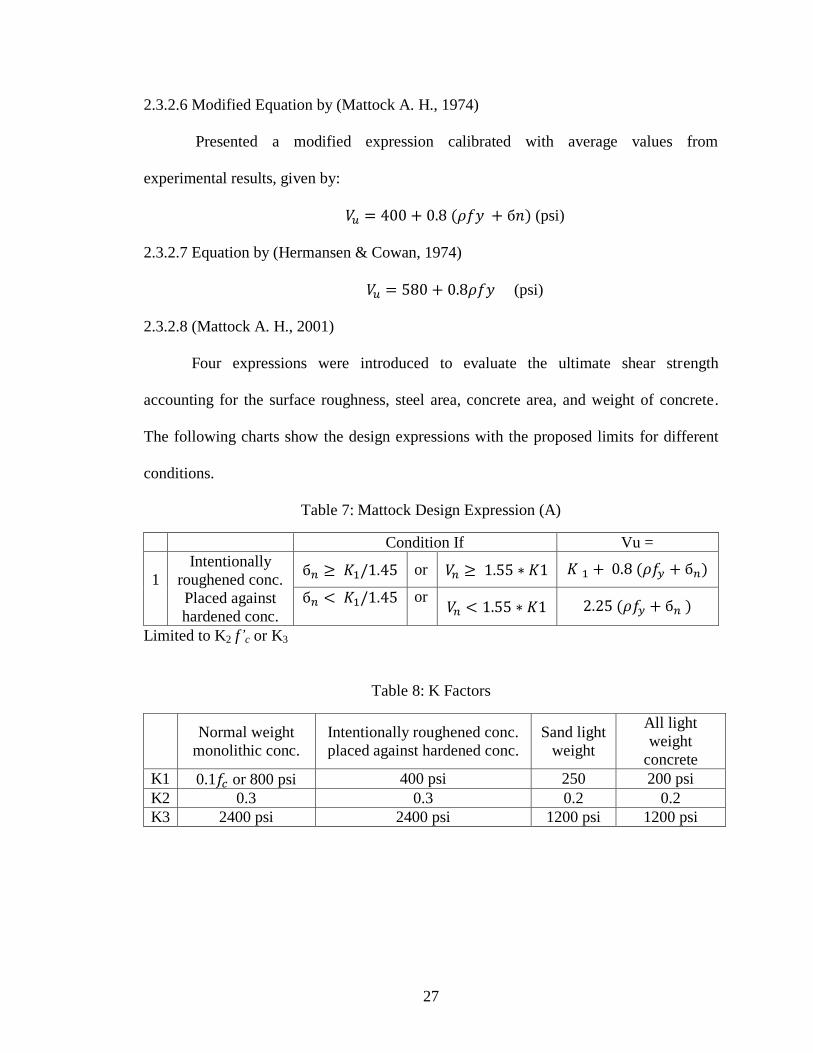
2.3.2.6 Modified Equation by (Mattock A. H., 1974)
Presented a modified expression calibrated with average values from
experimental results, given by:
(psi)
2.3.2.7 Equation by (Hermansen & Cowan, 1974)
(psi)
2.3.2.8 (Mattock A. H., 2001)
Four expressions were introduced to evaluate the ultimate shear strength
accounting for the surface roughness, steel area, concrete area, and weight of concrete.
The following charts show the design expressions with the proposed limits for different
conditions.
Table 7: Mattock Design Expression (A)
Condition If Vu =
1
Intentionally
roughened conc.
Placed against
hardened conc.
or
or
Limited to K2 f’c or K3
Table 8: K Factors
Normal weight
monolithic conc.
Intentionally roughened conc.
placed against hardened conc.
Sand light
weight
All light
weight
concrete
K1 0.1 or 800 psi 400 psi 250 200 psi
K2 0.3 0.3 0.2 0.2
K3 2400 psi 2400 psi 1200 psi 1200 psi

28
Table 9: Revised Mattock Design Expressions (B)
2 For conc. Placed against hardened conc. not
intentionally roughened surface 0.6λρ
0.2 Or 800 psi 3
For concrete anchored to clean, unpainted, as-
rolled steel by headed studs or by reinforcing
bars
Table 10: λ Factor
Normal weight
concrete Sand light weight All light weight concrete
λ 1 0.85 0.75
2.3.3 Shear transfer across a crack in reinforced high strength concrete.
The modulus of elasticity, ductility, stiffness, and behavior of concrete depend on
the concrete compressive strength. The design expressions introduced by many
researchers in earlier studies limit the use of those expressions to a certain percent values
of the concrete compressive strength in the range of normal strength concrete for their
expressions to be applicable. In a study by (Mansur, Vinayagam, & Tan, 2008), the
authors investigated many of the available expressions for high strength concrete for the
shear transfer strength of a concrete interface, both analytically and experimentally. A
comparison was made between several design expressions, including the ones proposed
in the ACI 318-05 and PCI Design Handbook (1992) and those suggested by Mattock and
his co-workers, Walraven et al., Mau and Hsu, Lin and Chen, and Loov and Patnaik
(1994). It was concluded that the design expressions proposed by Walraven et al. and by
Mau and Hsu give unsafe predictions of the interface shear strength. Moreover, the
design expression proposed by (Loov & Patnaik, 1994), similar to the one proposed by

29
Mau and Hsu, although with different values for the coefficients, presented similar and
unconservative predictions.
A single curve formulation was proposed by (Mansur, Vinayagam, & Tan, 2008) based
on the design expression by Mau and Hsu and calibrated with a set of 154 test results.
The compressive strength of the concrete adopted in the experimental study was between
and , while the normalized clamping forces
were between 0.02 and 0.39. The proposed expression is given by:
≤ 0.3
Where is the ultimate longitudinal shear stress at the interface; fc is the
concrete compressive strength; ρ is the reinforcement ratio; and is the yield strength of
the reinforcement. The yield strength of the reinforcement bars crossing the interface was
and ). Comparing the proposed expression
with the experimental data, and they concluded that their equation could be unsafe for
low values of the normalized clamping forces. Therefore, a tri-linear formulation was
proposed
Table 11:Proposed horizontal shear expressions by (Mansur, Vinayagam, & Tan, 2008)
Clamping force( CF)
2.5 ρ /
+ 0.55 ρ / 0.3
2.4 Summary
In this chapter, a summary of some of the common design equations for the shear
transfer strength of a concrete interface suggested by several researchers in the past
studies is outlined. A distinction between horizontal shear in composite concrete beams
and interface shear transfer strength needs to be made in applying these design equations.

30
CHAPTER III .
METHODOLOGY
This chapter explains how the experimental plan was developed to address the
research objectives. The following methodology was adopted to address the objectives of
this study. The test plan includes the development of suitable details for the test
specimens, specimen preparation, test set-up and the related shear tests.
3.1 Study Parameters
The parameters considered for study are discussed below.
3.1.1 Reinforcement and Concrete
Three sets of specimens were made for comparisons between smooth and rough
concrete interfaces, different reinforcement ratios, and different reinforcement
distribution on the joint. A smooth interface was obtained by casting concrete against ply-
wood, and a rough interface was obtained as an as-cast surface without smoothing or
intentionally roughening the interface.
The three sets of 12 specimens each were made in this test program. The reinforcement
crossing the interface and specimen geometry were symmetric. Each test specimen
comprised three concrete units resulting in two shear planes. The first of the three sets of
31
tests represents a smooth interface with two specimens (S12, S14) reinforced with two
and four #3 bars crossing each shear plane. In the designation of the test specimens, the
first number stands for the set number (1, 2, or 3) and the second number stands for the
number of reinforcing bars crossing each shear plane, the second set comprised five
specimens with rough concrete surface reinforced using # 3 rebar , the number of bars
crossing each interface varied from two through six bars in each plane (S22, S23, S24,
S25, and S26), and the third set comprised five specimens with rough interface reinforced
using # 3 bars, The number of bars crossing each interface varied from two through six
bars with larger shear area and different reinforcement ratios Where As is the
area of steel crossing the interface, Ac is the area of concrete interface. Set # 2 and # 3
had equal number of bars crossing the interface with different rebar distribution. The
concrete and rebar areas for all the specimens are given in Table 12: Study Parameters2
accounting for the two the shear interfaces in each test specimen.

32
Table 12: Study Parameters
Set
No.
Specimen
Name
No. of
#3
bars
Concrete
Surface
Area of
Concrete
surface
(in2)
As
(in2)
ρ = As/Ac
1 S12 2 smooth 116 0.44 0.0038
S14 4 116 0.88 0.0076
2
S22 2
Rough
90 0.44 0.0049
S23 3 90 0.66 0.0073
S24 4 90 0.88 0.0098
S25 5 90 1.1 0.0122
S26 6 90 1.32 0.0147
3
S32 2
Rough
150 0.44 0.0029
S33 3 150 0.66 0.0044
S34 4 150 0.88 0.0059
S35 5 150 1.1 0.0073
S36 6 150 1.32 0.0088
3.1.2 Development Length for Rebar
According to
ACI 318-11 (Section R12.5), the development length of the hook for the bars in tension
should be . If #3 bars with diameter of 0.375” are used,
Figure 12 : Development Length (ACI, 2011)

33
Five inches are used as development length for the rebar in the Specimens.
3.1.3 Mix Design
The concrete mix design used for the 3 sets of specimens is given in Table 13.
Table 13: Mix Design.
1 Cement content 675 lb/yd3
2 Water at (W/C = 0.5) 338 lb/yd3
3 Coarse aggregate # 8 1424 lb/yd3
4 Coarse aggregate # 3/8 427 lb/yd3
5 Fine Aggregate River sand 997 lb/yd3
3.1.4 Compressive Strength
The concrete was mixed in room temperature of about 70 F in a laboratory scale
concrete mixer. The test specimens were made in plywood molds and place in the curing
room after 24 hours of setting for moist curing. Compressive strength tests on standard
cylinders were conducted to determine the compressive strength of the concrete on the
day of the testing. The compressive strength for the weakest block in each Specimen at
the time of testing was determined based on the average of 3 cylinder tests and reported
in Table 14: Compressive Strength.
Table 14: Compressive Strength
# Specimen Compressive strength,
psi # Specimen
Compressive strength,
psi
1 S12 6158 7 S26 6690
2 S14 6158 8 S32 6158
3 S22 6023 9 S33 6158
4 S23 6625 10 S34 6158
5 S24 6155 11 S35 6158
6 S25 6625 12 S36 6158

34
3.1.5 Rebar Arrangement
According to the study by (Aziz,
2010), the non-reinforced smooth
concrete interface can resist 0 to 7% of
the shear strength of monolithic concrete
and up to 30 or 40% of the shear
strength with a rough interface. It is well
known that reinforced joints can develop
larger shear strength than those without
any interface reinforcement. Therefore,
in this research project, the following
three factors were studied:
a) Reinforcement area
b) Area of concrete interface
c) Arrangement of the reinforcement in the section
Different values of the ratio were used to account for the first two factors.
Specimens S23 and S35 have the same steel ratio ρ value of 0.0073. However, the
number of rebar and the concrete surface area are not the same for the two specimens.
Specimens S25 and S35 had the same rebar area in the joint with different arrangement to
study the effect of different rebar distribution.
Figure 13: Test Specimen’s reinforcement

35
Figure 14: Test Specimens Interface Details

36
Figure 15: Test Specimen Details (continued)

37
3.2 Preparation of Specimens.
For the first set; concrete units were cast 6 days apart where the first part U-
shaped units with the rebar were cast first on smooth plywood surface, and subsequently
the second (or the middle) unit was cast.
The second and the third set were casted 2 days apart without smoothening for a
natural vibrated rough surface that gives full amplitude of ¼ in or more was obtained to
match the normal construction practice as shown in Figure 16 : Rough Interface in the
Current Test.
The horizontal bars at the corners were provided to prevent the pull out of the
reinforcement from the concrete and to improve the stress distribution in the concrete that
can be expected in real structures. This detailing is assumed to provide adequate
Figure 16 : Rough Interface in the Current Tests

38
confinement for the steel in the concrete section and adequate development length for the
reinforcing bars one either side of the interface. Each specimen consists of three concrete
units with a suitable rough or smooth concrete interface and a recess under in the middle
block (reduced height) to allow for slip during the shear tests.
3.3 Shear Test Setup and Procedure
The testing machine used for the test is a hydraulic machine with a capacity of
300 kips, while the maximum applied load to the specimens was less than 130 kips.
Loading was continued beyond the initial slip and subsequent failure to capture the final
failure mode and the deformation of the reinforcement. A loading rate of 70 lb/sec was
applied to the specimens to demonstrate static load.
Figure 17: Test setup
39
Each test lasted 20 to 30 minutes to reach the maximum load depending on the
amount of load needed to fail a particular specimen. Dial gages were fixed at the top of
the moving (left and right) concrete units to measure the relative slip of the middle block
and the corresponding applied load at 1,000 lb load intervals initially and at every 500 lb
interval closer to the failure. Load-slip relationship was developed by calculating average
slip from the two gages (one at each interface). The test set-up is shown in Figure 17:
Test setup.
Each specimen of the second and third sets had 3 different casting dates and
different compressive strength. As per ACI 318-11, the least strength should be the
governing strength used in the design equations. Compression tests were performed on
three standard cylinders to determine the average strength of the concrete for each
batch.

40
CHAPTER IV .
RESULTS AND DISCUSSION
4.1 Test Results.
The steel ratio in the test specimens varies from 0.3% to 1.2%. The test results
show that the interface shear strength can be increased by increasing the reinforcement
ratio ρ with significantly lower relative slip at the interface.
Table 15: Shear Test Results
SN. Specimen
no.
# of
bars
Max
load (lb)
Shear
strength
(psi)
Slip
(in)
concrete
Sec.
Shear
Area
(in2)
ρ =
As/Ac As
1 S12 2 28944 249.52 0.257 3*7.25=
21.75
116 0.003793 0.44
2 S14 4 38105 328.49 0.01925 116 0.007586 0.88
3 S22 2 33227 369.19 0.038
4*4=
16 i
n2
90 0.004889 0.44
4 S23 3 55171 613.01 0.04275 90 0.007333 0.66
5 S24 4 62945 699.39 0.041 90 0.009778 0.88
6 S25 5 80799 897.77 0.041 90 0.012222 1.10
7 S26 6 71000 788.89 0.05725 90 0.014667 1.32
8 S32 2 47314 315.43 0.06375
5*6=
30 i
n2
150 0.002933 0.44
9 S33 3 61233 408.22 0.1825 150 0.0044 0.66
10 S34 4 60835 405.57 0.0445 150 0.005867 0.88
11 S35 5 112201 748.0067 0.089 150 0.007333 1.10
12 S36 6 126445 842.9667 0.0975 150 0.0088 1.32

41
4.2 Rebar Distribution and Failure Mode.
The arrangement of the rebar defines the load path and affects the stress
distribution in the concrete section and the failure mode Figure 19: Splitting and Failure
of S33. Splitting and subsequent failure of S33 shows that the concrete was crushed and
totally damaged while the rebar was still in place Figure 19. Failure can result from
yielding in the steel, excessive stresses in concrete, or pullout for the rebar due to
inadequate development length and/or lack of confinement for the reinforcement.
Figure 18 : Development Length in Specimens
The case of S33 when the 3 bars are vertically above each other, the failure
happened at the same section containing the 3 bars due to the splitting of the specimen in
the middle.

42
Figure 19: Splitting and Failure of S33
ACI 318 –11 equation using the shear friction theory for the case of concrete
placed against hardened concrete with μ = 1 for concrete placed against hardened
concrete and μ = 0.6 for cracked concrete and λ = 1 for normal weight concrete predicts
the nominal shear strength
This expression takes only the area of the interface reinforcement into
consideration while the distribution of the rebar in the section is not considered; the upper
limit for concrete strength is the least value determined from three expressions.
For normal weight concrete either placed monolithically or placed against
hardened concrete with surface intentionally roughened, shall not exceed the smallest
of

43
Comparing test results to ACI and the horizontal shear expressions
Table 16 below shows the calculation of shear strength according to ACI
expression and the applied limitations for each test specimen.
Table 16: Shear Strength by ACI Expressions
Spec
imen
f'c
psi
Ac
(in
2)
As
(in
2)
=
As/
Ac
AC
I 1
(0.8
Av*F
y+
AcK
1)
AC
I 11
Avf*
Fyf*
μ (
lb)
0.2
f'c*
Ac
(lb)
1600*A
c (l
b)
(480+
0.0
8f'
c)*A
c
(lb)
V=
AC
I (l
b)
v =
AC
I (p
si)
S12 6,158 116 0.44 0.0038 67,520 26,400 142,866 185,600 112,826 26,400 228
S22 5,086 90 0.44 0.0049 57,120 26,400 91,548 144,000 79,819 26,400 293
S32 6,158 150 0.44 0.0029 81,120 26,400 184,740 240,000 145,896 26,400 176
S23 5,086 90 0.66 0.0073 67,680 39,600 91,548 144,000 79,819 39,600 440
S33 6,158 150 0.66 0.0044 91,680 39,600 184,740 240,000 145,896 39,600 264
S14 6,158 116 0.66 0.0057 78,080 39,600 142,866 185,600 112,826 39,600 341
S24 5,086 90 0.88 0.0098 78,240 52,800 91,548 144,000 79,819 52,800 587
S34 6,158 150 0.88 0.0059 102,240 52,800 184,740 240,000 145,896 52,800 352
S25 5,086 90 1.1 0.0122 88,800 66,000 91,548 144,000 79,819 66,000 733
S35 6,158 150 1.1 0.0073 112,800 66,000 184,740 240,000 145,896 66,000 440
S26 5,086 90 1.32 0.0147 99,360 79,200 91,548 144,000 79,819 79,200 880
S36 6,158 150 1.32 0.0088 123,360 79,200 184,740 240,000 145,896 79,200 528
Comparing the test results of Specimen S12, S14 to the (ACI, 2011) to the
expressions by (Patnaik, 2001)for the horizontal shear strength for concrete with smooth
interface shows that ACI expression is safe and
conservative when the smooth interface expression by Patnaik 2001 may not be
applicable for interface shear other than for horizontal shear in composite concrete

44
beams with a smooth interface.
Comparing the test results of 12 Specimens with rough interface to the ACI
expression and the expression of horizontal shear for concrete with rough interface
using the expression by (Loov & Patnaik, 1994)
Figure 20: Comparing test results with Horizontal Shear Expression for rough interface
by (Loov & Patnaik, 1994)
The roughness of the concrete has a considerable contribution to shear strength,
the test specimens were not intentionally roughened to match the suggested roughness
condition, it was vibrated with as-cast surface but without smoothing or roughening of
the surface. Figure 15 shows the application of the expression introduced by Patnaik 2001
for the horizontal shear strength with a smooth interface.
0
200
400
600
800
1,000
1,200
1,400
1,600
1,800
S12 S22 S32 S23 S33 S14 S24 S34 S25 S35 S26 S36
Shea
r (p
si)
Test specimens
Test specimens strength vs. Horizontal shear expressions
Rough (Loov & Patnaik 1994)
Test results
ACI
3#3 bars 6#3 bars 5#3 bars 4#3 bars 2#3 bars
Smo
oth
Smo
oth
45
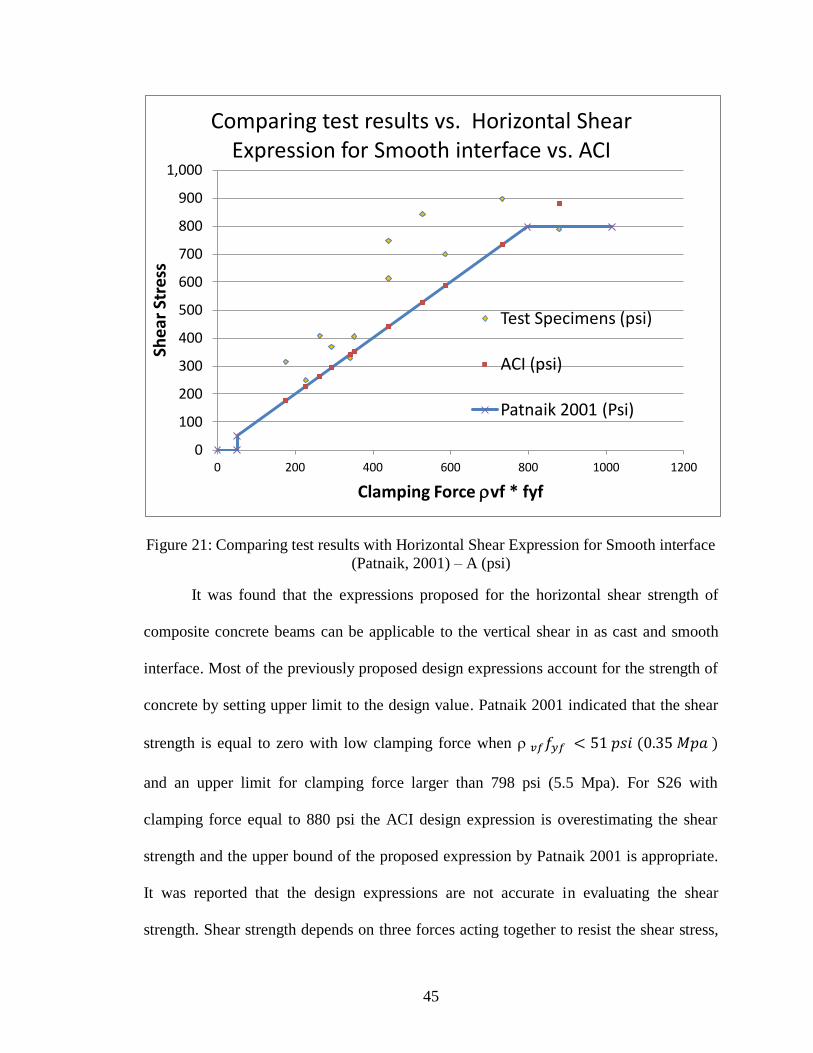
Figure 21: Comparing test results with Horizontal Shear Expression for Smooth interface
(Patnaik, 2001) – A (psi)
It was found that the expressions proposed for the horizontal shear strength of
composite concrete beams can be applicable to the vertical shear in as cast and smooth
interface. Most of the previously proposed design expressions account for the strength of
concrete by setting upper limit to the design value. Patnaik 2001 indicated that the shear
strength is equal to zero with low clamping force when
and an upper limit for clamping force larger than 798 psi (5.5 Mpa). For S26 with
clamping force equal to 880 psi the ACI design expression is overestimating the shear
strength and the upper bound of the proposed expression by Patnaik 2001 is appropriate.
It was reported that the design expressions are not accurate in evaluating the shear
strength. Shear strength depends on three forces acting together to resist the shear stress,
0
100
200
300
400
500
600
700
800
900
1,000
0 200 400 600 800 1000 1200
She
ar S
tres
s
Clamping Force vf * fyf
Comparing test results vs. Horizontal Shear Expression for Smooth interface vs. ACI
Test Specimens (psi)
ACI (psi)
Patnaik 2001 (Psi)

46
(a) the bond between the concrete accompanied with relatively small slip depending on
the elasticity of concrete, (b) the friction between the concrete at the interface which can
be increased by restraining the lateral movements of the concrete units in the tension
region, and/or by applying external normal forces to increase the friction and to balance
the tensile force developed in the rebar (c) the rebar area and crossing the interface
which may also affect dowel-action. Most of the test specimens could resist shear greater
than the ACI design expression . Except for S14 with clamping force equal
341 psi with smooth interface. This expression allows stresses to reach the yield stress,
the actual yield stress was determined from a tensile test of the rebar. Figure 47 : Stress
Strain Diagram of Rebar shows that the ultimate stress is around 50% above the yield
stress, however limiting the allowable strength to the yield stress is convenient to control
the slip and to provide safety margin.
4.3 Load-Slip Diagram
Figures 25 to 34 demonstrate the effect of the confinement of the rebar and effect
of the distribution of the bars in the section from the test results. In specimen S34 with
compressive strength was almost equal to 6,155 psi for . 2
which is greater than for S24. The failure load for S34 was
.
In S14 and S24 with the same rebar distribution, S14 had smooth interface, better
confinement for the rebar and higher with a concrete cover of 2 inches. Three inch
concrete cover for S24 is smaller than that of S14. The failure load for S24
was which is the failure load of S14.

47
Figure 22 : Load Slip Diagram
Figure 23: Shear-Slip Diagram for Set # 2
0
10,000
20,000
30,000
40,000
50,000
60,000
70,000
0 0.05 0.1 0.15 0.2 0.25 0.3 0.35 0.4
Loa
d (
lb)
Slip (in)
Load Vs. Slip diagram
S34
S24
S14
0
100
200
300
400
500
600
700
800
900
1,000
0 0.05 0.1 0.15 0.2 0.25 0.3 0.35 0.4
Shea
r st
ress
(p
si)
Shear test - 5 specimens in set #2 (in)
Shear Vs. Slip diagram
S22
S23
S24
S25
S26

48
The common result is that the ultimate shear capacity at failure happens at a slip of
around 0.05 in. and the higher the steel ratio, the higher the shear strength.
Figure 24: Shear-Slip Diagram for Set # 3
The shear capacity of the specimen S36 with six bars was greater than the shear
strength of S35. However the initial slip is larger in S36 than in S35. The reason for large
slip might be the uneven surface of specimen S36. The general trend in the test results
were that the higher the reinforcement ratio, the less the slip and the higher the ultimate
shear capacity of the specimen.
0
100
200
300
400
500
600
700
800
900
0 0.05 0.1 0.15 0.2 0.25
Shea
r St
ress
(p
si)
Shear test - 5 specimens in set #3 (in)
Shear Vs. Slip diagram
S32
S33
S34
S35
S36

49
Figure 25: Failure in S14
The external concrete units with cross section of didn’t provide enough
confinement for the reinforcement. The movement of the rebar from its original location
and bending of the rebar appears in Figure 25: Failure in S145. The rebar appeared to
have transferred the load to the middle concrete block thereby splitting the concrete
above the reinforcement. Because of the distribution of the 4 bars in the section, the
middle block for specimen S33 did not split in the case of S33 Figure 19: Splitting and
Failure of S33.
Specimen S26: The first cracks to appear while loading the test specimen and are
vertical cracks between the concrete blocks when the applied load broke the bond
between the concrete blocks. Some cracks regularly appeared in all the specimen under
the loading point due to the concentration of the stresses which is considered a disturbed
region. When the slip started between the concrete blocks, the interface reinforcement is
mobilized and the loads were transferred to the interface rebar connecting the blocks
together.

50
The third type of cracks appears at the level of the rebar which appears first in the
external blocks due to the lack of concrete confinement for the rebar.
S26: Loading on the specimen was continued manually after the failure of the
specimen and reaching the ultimate load capacity and recording the shear strength to
observe the final failure mode. Figure 26 shows the external blocks that failed due to low
confinement of the rebar and the lateral split in the middle block, the second failure
pattern at the rebar level.
Figure 26: Cracks in S26
51
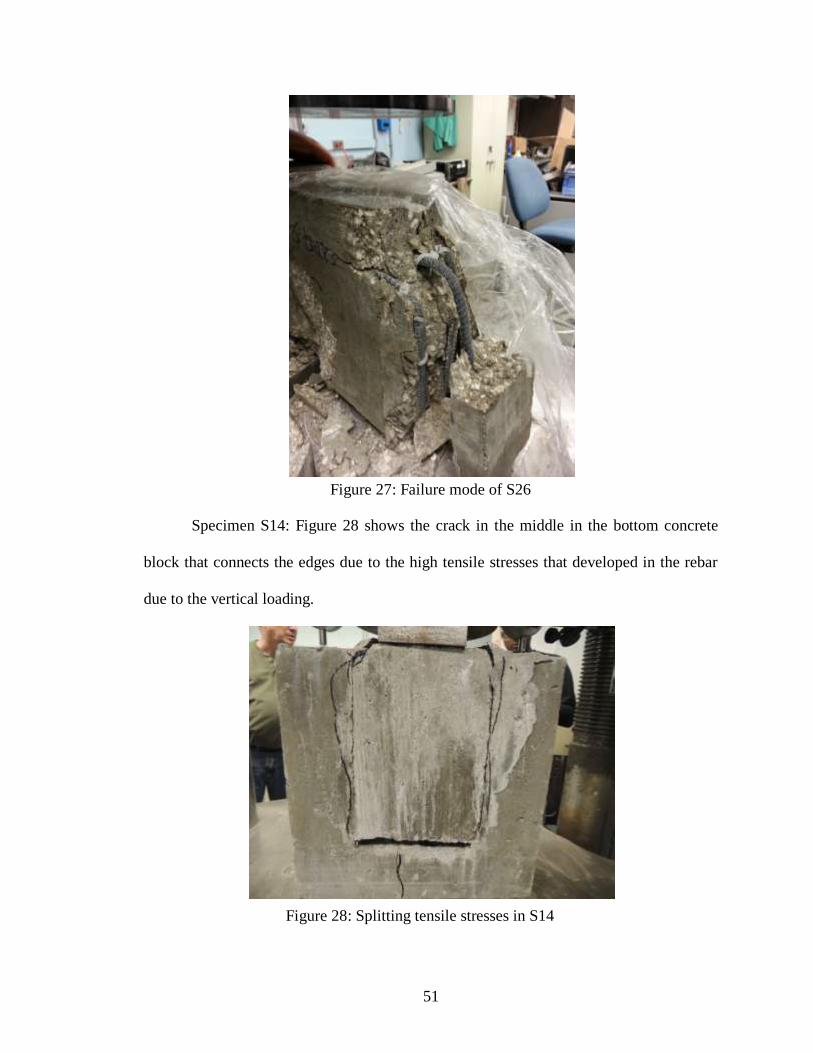
Specimen S14: Figure 28 shows the crack in the middle in the bottom concrete
block that connects the edges due to the high tensile stresses that developed in the rebar
due to the vertical loading.
Figure 27: Failure mode of S26
Figure 28: Splitting tensile stresses in S14

52
Specimen S22: when the reinforcing bars are all in one vertical plane, the stress
concentration in the section containing the rebar splits the specimen at this section.
Figure 29: Splitting tensile stresses in S22
Furthermore, for specimen S22, the middle concrete block had no cracks while
the external block was split at the middle as shown in Figure 30.
Figure 30: Specimen S22 with no
cracking in the middle concrete block

53
Specimen S26: With larger area of reinforcement and more than one bar in the
shear interface in the vertical plane, the effects of the concrete confinement is observed
to increase the shear capacity and to avoid the splitting tensile failure in the specimen
Figure 31: Failure mode of specimen S26.
Specimen S14: the picture shows the back side of the specimen that is similar to
the front view in (Figure 25: Failure in S14) when the cover concrete spalled on both
sides around the rebar, bigger concrete cover and rebar confinement may help to avoid
this type of failure.
Figure 31: Failure mode of specimen S26

54
Specimen S34: using steel plate under the loading cell provides a uniform loading
on the middle block and eliminates cracks in the middle block under the applied loading.
Specimen S26: The cracks developed at the location of the rebar through the
height of the specimen as it appears in Figure 36 in the left external concrete block with 3
Figure 32: Failure mode of specimen S14
Figure 33: distribution of applied load

55
cracks at different levels indicating a disturbed region at the location of the rebar. The use
of strut and tie model to follow the load path and stresses distribution in the specimen can
be explained based on these cracks.
Figure 34: Failure mode of specimen S26

56
4.4 Comparisons of Test Specimens
The most common situation for cold joint in projects is when the hardened concrete
is cast against formwork, which is defined in this research as concrete with smooth surface,
or “as-cast” concrete surface when the concrete is cast and vibrated without intentional
roughness or smoothing, three comparisons were made between the specimens with rough
interface (1) constant steel area with variable interface surface area, (2) constant interface
area with variable steel area for set # 2 with a constant Ac =90 in2 with variable area of
shear reinforcement and set # 3 with constant Ac =150 in2 but with variable area of shear
reinforcement, and (3) constant reinforcement areas with different rebar distribution (S24
vs. S34 and S26 vs. S36).
Table 17: Test Variables
Rough interface
Constant
As
Variable
Ac
Specimen
ID
Ultimate
load
Constant
Ac
Variable
As Specimen
ID
Ultimate
load
2#3 90 S22 33,227
90
2#3 S22 33,227
150 S32 47,314
3#3 S23 55,171
3#3 90 S23 55,171
4#3 S24 62,945
150 S33 61,233
5#3 S25 80,799
4#3 90 S24 62,945
6#3 S26 71,000
150 S34 60,835
150
2#3 S32 47,314
5#3 90 S25 80,799
3#3 S33 61,233
150 S35 112,201
4#3 S34 60,835
6#3 90 S26 71,000
5#3 S35 112,201
150 S36 126,445
6#3 S36 126,445
Comparing S23 to S33 with the same rebar area and increased interface area from
90 in2 to 150 in
2, the load capacity increased from 55,171 lb to 61,233 lb, however the
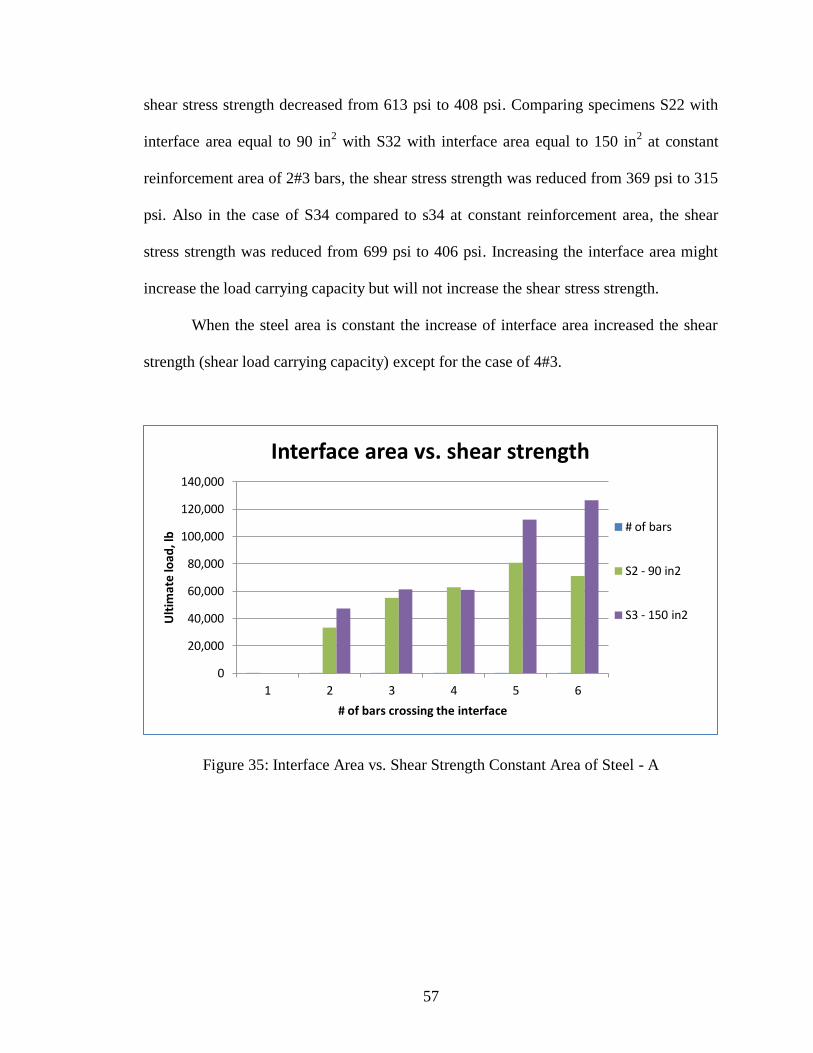
57
shear stress strength decreased from 613 psi to 408 psi. Comparing specimens S22 with
interface area equal to 90 in2 with S32 with interface area equal to 150 in
2 at constant
reinforcement area of 2#3 bars, the shear stress strength was reduced from 369 psi to 315
psi. Also in the case of S34 compared to s34 at constant reinforcement area, the shear
stress strength was reduced from 699 psi to 406 psi. Increasing the interface area might
increase the load carrying capacity but will not increase the shear stress strength.
When the steel area is constant the increase of interface area increased the shear
strength (shear load carrying capacity) except for the case of 4#3.
Figure 35: Interface Area vs. Shear Strength Constant Area of Steel - A
0
20,000
40,000
60,000
80,000
100,000
120,000
140,000
1 2 3 4 5 6
Ult
imat
e lo
ad
, lb
# of bars crossing the interface
Interface area vs. shear strength
# of bars
S2 - 90 in2
S3 - 150 in2

58
Figure 36: Interface Area vs. Shear Strength Constant Area of Steel - B
Increasing the reinforcement area increased load and shear capacities for all the
specimens except S26.
Figure 37: Set #2 Constant Ac =90 in2 with variable area of shear reinforcement - A
0
200
400
600
800
1,000
1,200
1 2 3 4 5 6
Shea
r St
ren
gth
(p
si)
# of bars crossing the interface
Interface area vs. shear strength
# of bars
S1 - 116 in2
S2 - 90 in2
S3 - 150 in2
0
10,000
20,000
30,000
40,000
50,000
60,000
70,000
80,000
90,000
1 2 3 4 5 6
Ult
imat
e lo
ad, l
b
# of bars
Set #2 Constant Ac =90 in2
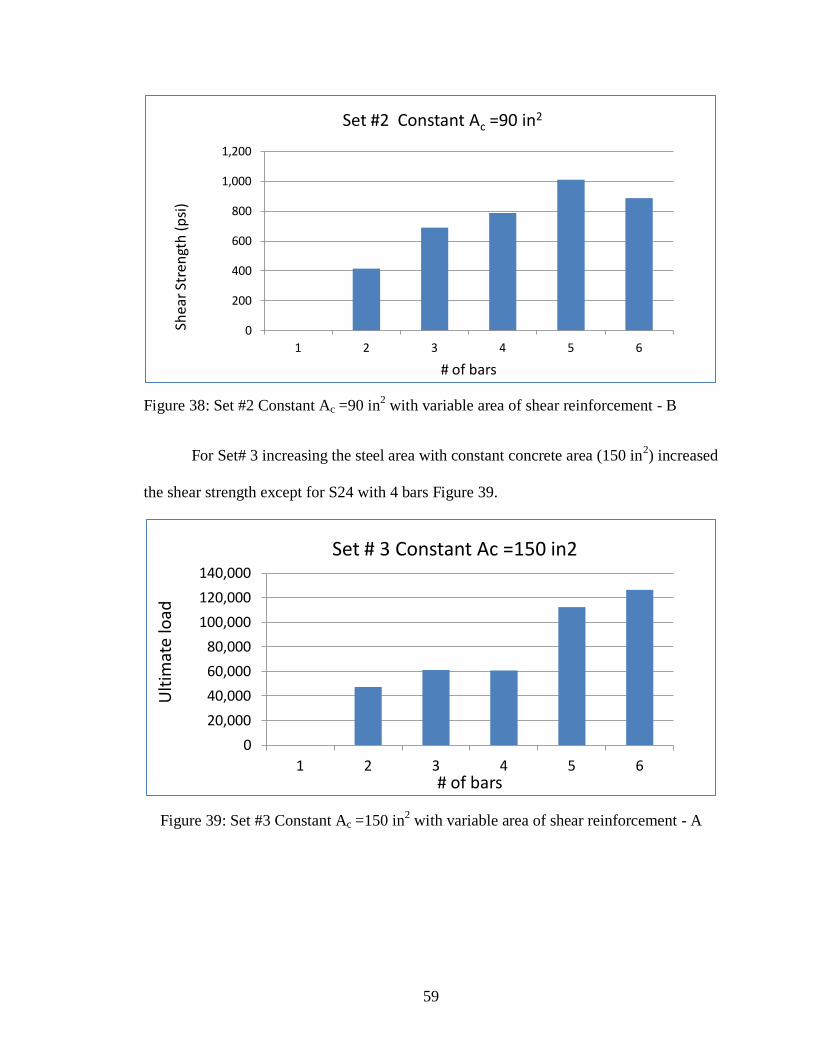
59
Figure 38: Set #2 Constant Ac =90 in2 with variable area of shear reinforcement - B
For Set# 3 increasing the steel area with constant concrete area (150 in2) increased
the shear strength except for S24 with 4 bars Figure 39.
Figure 39: Set #3 Constant Ac =150 in2 with variable area of shear reinforcement - A
0
200
400
600
800
1,000
1,200
1 2 3 4 5 6
Shea
r St
ren
gth
(p
si)
# of bars
Set #2 Constant Ac =90 in2
0
20,000
40,000
60,000
80,000
100,000
120,000
140,000
1 2 3 4 5 6
Ult
imat
e lo
ad
# of bars
Set # 3 Constant Ac =150 in2
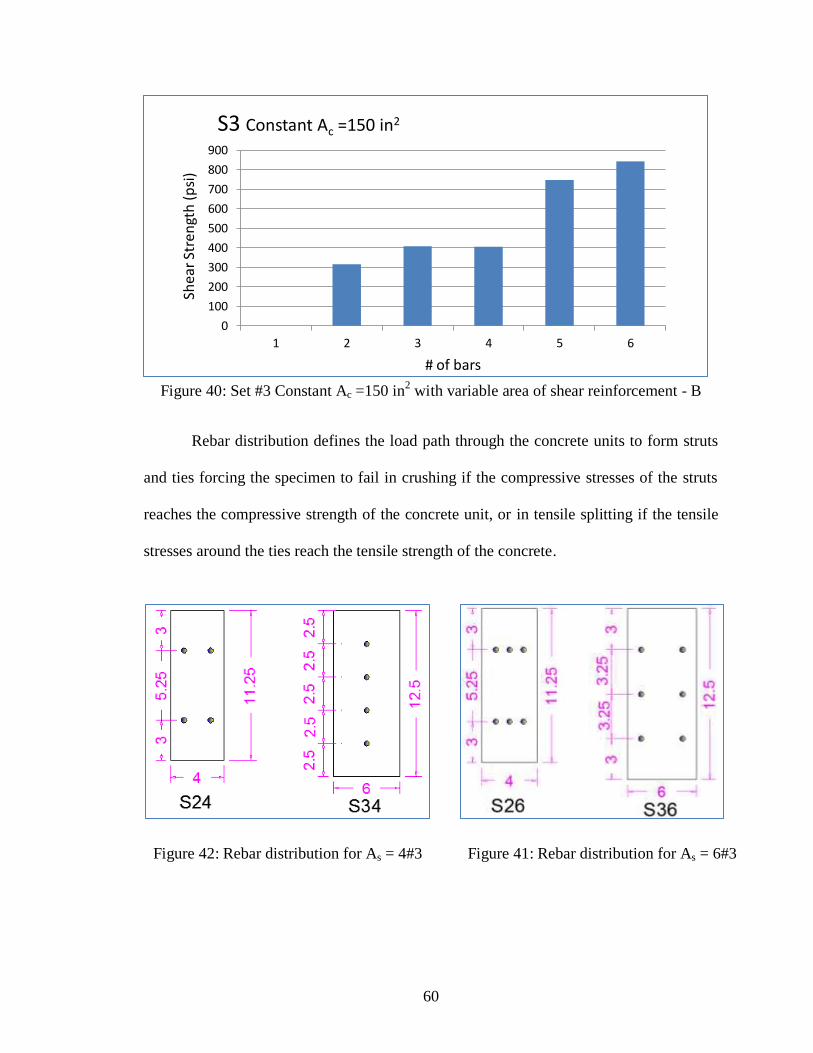
60
Figure 40: Set #3 Constant Ac =150 in
2 with variable area of shear reinforcement - B
Rebar distribution defines the load path through the concrete units to form struts
and ties forcing the specimen to fail in crushing if the compressive stresses of the struts
reaches the compressive strength of the concrete unit, or in tensile splitting if the tensile
stresses around the ties reach the tensile strength of the concrete.
0
100
200
300
400
500
600
700
800
900
1 2 3 4 5 6
Shea
r St
ren
gth
(p
si)
# of bars
S3 Constant Ac =150 in2
Figure 42: Rebar distribution for As = 4#3 Figure 41: Rebar distribution for As = 6#3

61
The rebar distribution in S24 is better than S34 that increased the shear stress
strength of the specimen from 406 psi to 700 psi despite a larger interface area in Set#3
than in Set#2. Better comparison could be achieved with constant area of concrete
interface.
Figure 43: Rebar distribution - A
Figure 44: Rebar distribution - B
0
20,000
40,000
60,000
80,000
100,000
120,000
140,000
S24 S34 S26 S36
Ult
imat
e lo
ad (
lb)
Effect of rebar distribution
0
100
200
300
400
500
600
700
800
900
S24 S34 S26 S36
She
ar S
tren
gth
(p
si)
Effect of rebar distribution

62
4.5 Finite Element Analysis
Three dimensional finite element models were used to compare the laboratory test
results and to analyze the stress in the steel and the concrete due to static load using
ABAQUS 6.11 / STANDARD
4.5.1 Material Properties.
Tensile test was conducted on a used rebar to determine the actual stress strain
curve for the input file ABAQUS. Three tensile specimens were tested using # 4 bars and
machined in the mid-length to reduce the diameter to 0.3” instead of the actual bar
diameter of 0.5 inch to control the location of failure then applying tensile load.
Displacement at a rate 0.05 in/min or 0.0008 inch/sec was applied for the first and second
specimens and a displacement rate of 0.1 inch/min applied for the third Specimen.
Figure 45 : Tensile Test Steup of Rebar

63
0.50
6.75
0.50
2.506.75
17"
Ø0.50
0.30 Ø0.30
Dimensions in inches
Figure 46 : Preparation of Tensile Test Specimen
All three specimens failed in the expected location with significantly higher
stresses compared to the specified strength that was recommended by the
manufacturer, with ultimate stresses reaching 130 ksi. The following table shows the test
results for the three specimens.
Table 18: Tensile Test Results.
Specimen # 1 Specimen # 2 Specimen # 3
Loading rate (in/sec) 0.0008 0.0008 0.0016
Loading rate (lb/sec) 52 52 104
Yield stress (ksi) 88.9 81.5 68.6
Strain at yield 0.00269 0.0027 0.00356
ultimate stress (ksi) 135.7 128.9 116.8
Strain at ultimate stress 0.10172 0.09115 0.09928
Load at failure (kips) 111.7 105.201 87.0871
Strain at failure 0.18088 0.19762 0.16418

64
The data of specimen # 1 was used in the finite element modeling. A stress–strain
diagram for specimen # 1 is shown in Figure 45 : Tensile Test Steup of Rebar.
Figure 47 : Stress Strain Diagram of Rebar
-20
0
20
40
60
80
100
120
140
160
0 0.05 0.1 0.15 0.2
Stre
ss (
Ksi)
Strain (in/in)
Typical stress strain curve for grade 60 rebar
Stress - Strain curve

65
4.5.2 Displacement control approach
A displacement control approach was used in modeling the test specimens using
ABAQUS implicit for static analysis. Load control approach is used to apply loads in the
test. The program calculates the corresponding displacement and stress. This will not be
true representation of the loading condition in developing the actual stress-strain curves
used for steel and concrete because applied stressed can have two different values of
strains causing the program to abort without completing the analysis. In such a situation
we can use the displacement control approach to apply continuous displacement to the
structure and the program will calculate the corresponding required load and stress. In
other types of analysis like static Riks or dynamic analysis, ABAQUS can handle this
type of stress-strain curves with descending values in a load or displacement controlled
analysis.
A tremendous amount of data were obtained by the computerized test machine for
the stress strain tensile test of the rebar including loading and unloading cycles to
maintain a . Aa select and calculated set of values that
will define the stress-strain curve were used in ABAQUS input files. ABAQUS also
requires in the input file separated elastic and plastic regions for the material properties.
The numbers in Table 18 were used in the input file which defines the elastic region of
the mild steel as the linear part of the curve with a stress of with the
corresponding ; then the plastic stresses from
until it reaches the ultimate stress бu = with corresponding plastic
that vary from 0 to 0.00507 in/in. The unloading and failure region

66
to reach a maximum plastic strain = 0.00642 that corresponds to a total strain =
0.00642+0.00275 = 0.00917 in/in.
Table 19: Input File for Steel "Stress-Strain Curve"
Steel
Es 29,000 ksi ϵy 0.00275 in/in
Stress Plastic strain Stress Plastic strain
89096 0 119034 0.00297
89096 9.00E-05 120209 0.00307
89695 0.00018 121324 0.00316
90145 0.00026 122008 0.00328
91151 0.00038 123845 0.00337
92347 0.00049 125115 0.00347
93497 0.00058 126945 0.00359
94188 0.00072 127487 0.00369
95163 0.00083 128434 0.00378
95699 0.00093 128556 0.00391
96796 0.00106 129978 0.00401
98301 0.00116 130278 0.0041
99801 0.00126 131929 0.00441
100768 0.00139 132495 0.00454
102136 0.0015 133116 0.00465
103495 0.00159 134966 0.00487
104776 0.00172 135595 0.00507
105590 0.00183 135025 0.0052
107313 0.00191 134879 0.0053
108074 0.00204 134304 0.00541
109610 0.00213 132461 0.00554
110817 0.00223 130956 0.00564
111923 0.00235 129229 0.00574
113484 0.00245 127214 0.00588
114506 0.00255 124857 0.00598
115386 0.00266 120601 0.00608
116882 0.00276 117733 0.00621
117716 0.00285 113339 0.00632
18346 0.00642

67
Table 20: Input File of Concrete "Stress-Strain Curve"
Concrete
f'c = 6,500 psi Ec = 4,645 ksi Elastic
strain strain
= 0.00063
Stress
Plastic
strain
Total
strain Stress
Plastic
strain
Total
strain
2925 0 0.00063 6325 0.0019 0.00253
3724 0.00005 0.00068 6264 0.002 0.00263
4186 0.0001 0.00073 6198 0.0021 0.00273
4601 0.0002 0.00083 6127 0.0022 0.00283
4969 0.0003 0.00093 6054 0.0023 0.00293
5291 0.0004 0.00103 5977 0.0024 0.00303
5567 0.0005 0.00113 5899 0.0025 0.00313
5800 0.0006 0.00123 5819 0.0026 0.00323
5994 0.0007 0.00133 5738 0.0027 0.00333
6150 0.0008 0.00143 5657 0.0028 0.00343
6273 0.0009 0.00153 5576 0.0029 0.00353
6366 0.001 0.00163 5495 0.003 0.00363
6432 0.0011 0.00173 5414 0.0031 0.00373
6474 0.0012 0.00183 5334 0.0032 0.00383
6496 0.0013 0.00193 5255 0.0033 0.00393
6499 0.0014 0.00203 5177 0.0034 0.00403
6487 0.0015 0.00213 5100 0.0035 0.00413
6462 0.0016 0.00223 5024 0.0036 0.00423
6425 0.0017 0.00233 4949 0.0037 0.00433
6379 0.0018 0.00243

68
4.5.3 ABAQUS Analysis Plan
Finite element analysis was performed to determine (i) the ultimate shear capacity
of the reinforced concrete with rough interface (ii) study the effects of rebar distribution,
As, Ac, boundary conditions and the lateral supports effect on the ultimate shear capacity.
The parameters taken into consideration in the analysis are given in Table 21. The rebar
distribution considered in the analysis is shown in Figure 50. All the reinforcing bars
used in the FE models are #3 bars with and a diameter of 0.375 in.
Table 21: Specimen Characteristics for FE Models
SN. Model ID
No.
of
rebar
Rebar
distribution Lateral
support
conc. Interface in
one side
Rows Columns b h
1 FR441 4 4 1 FREE 4 10
2 FB441 4 4 1 Fixed base 4 10
3 FF441 4 4 1 Fully fixed 4 10
4 FR422a 4 2 2 FREE 4 10
5 FR422b 4 2 2 FREE 4 10
6 FR623 6 2 3 FREE 4 10
7 FR632 6 3 2 FREE 4 10
8 FR441 4 2 2 Fully fixed 6 12
9 FF441 4 4 1 Fully fixed 6 12
Each model name had two letters and three numbers, the two letters are to define
the lateral supports conditions, where FR was used when the external concrete units were
modeled without restraining the lateral movements, FB for models when all the nodes in
the base of the two external concrete units were restrained against the lateral movements,
and FF for models when all the nodes in the sides of the two external concrete units were
restrained against the lateral movements. Three numbers following the first two represent

69
the number of #3 bars crossing each of the two interfaces, the number of rows of
reinforcement, and the number of columns. Figure 48: Specimen Size and Rebar Details
for FE Model shows the model size and rebar details.
Figure 48: Specimen Size and Rebar Details for FE Model
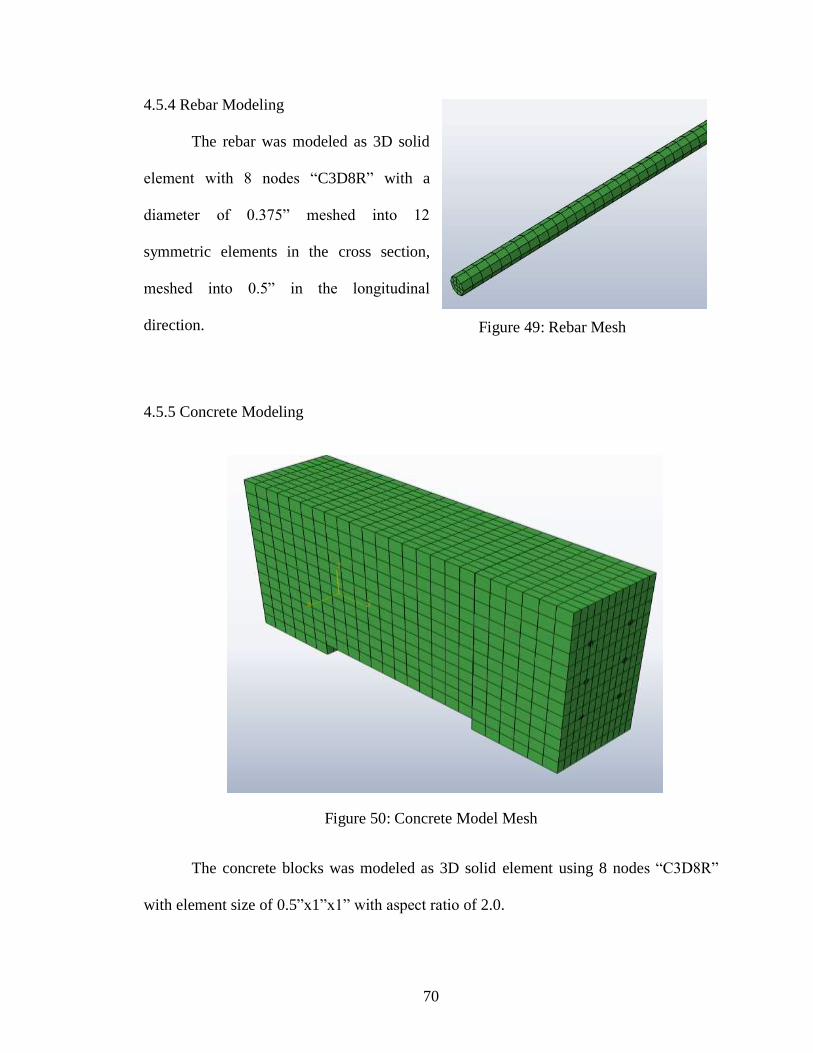
70
4.5.4 Rebar Modeling
The rebar was modeled as 3D solid
element with 8 nodes “C3D8R” with a
diameter of 0.375” meshed into 12
symmetric elements in the cross section,
meshed into 0.5” in the longitudinal
direction.
4.5.5 Concrete Modeling
Figure 50: Concrete Model Mesh
The concrete blocks was modeled as 3D solid element using 8 nodes “C3D8R”
with element size of 0.5”x1”x1” with aspect ratio of 2.0.
Figure 49: Rebar Mesh

71
4.5.6 Boundary Conditions
The top of the middle concrete units was supported to restrain the translation in Y
direction “vertical movement- u2”, the load was applied to the external concrete units as
0.5 upward displacement which is higher than the possible slip in the interface between
the concrete units. The analysis was expected to abort when the stresses in the rebar or
the concrete units exceed the specified stress-strain input values for the defined material.
The movement in the horizontal direction “U1” was studied in 3 cases; (a) with free
external units, (b) with fully laterally supported sides; (c) when supporting the base only
matching the fixation of the base provided by the contact with the testing machine.
4.5.7 Contact between Steel and Concrete
In the laboratory test a development length was provided to prevent the pull out of
the rebar from the concrete; Hence in the computer model the rebar was defined as
embedded in the concrete unit, only the 8 elements in the perimeter of the bars were
included in this contact and the concrete units were defined as a host.

72
4.5.8 Friction between Concrete Surfaces
The interface contact for the concrete placed against hardened concrete with
rough interface will provide shear strength; to account for that friction in the computer
models, a friction module considering the master surface in the middle concrete unit and
the slave surface in the external concrete units as shown in Figure 51 was used.
Figure 51: Interface Friction Surface

73
4.5.9 Analysis Results
The analysis of the model indicated large tensile stresses in the rebar, with lateral
spread for the models with support condition “free to move laterally”, accompanied with
vertical slip at the interface. The ultimate load and ultimate shear strength is reported in
Table 22: FE Analysis Results.
Table 22: FE Analysis Results
#
Model
ID ρ%
As
(in2) Ac (in
2)
Load
(lb)
Shear
(psi)
Vertical
disp. (in)
horizonta
l disp.
(in)
1 FR441 1.1 0.88 80 46,599 582 0.00762958 0.0052
2 FB441 1.1 0.88 80 63,101 789 0.0228885 -
3 FF441 1.1 0.88 80 68,415 855 0.0415397 -
4 FR422(a) 1.1 0.88 80 51,888 649 0.0169456 0.0067
5 FR422(b
)
1.1 0.88 80 55,548 694 0.0163237 0.0069
6 FR623 1.65 1.32 80 65,593 820 0.0074532 0.0073
7 FR632 1.65 1.32 80 75,637 945 0.012501 0.0097
8 FR441 0.59 0.88 150 55,871 372 0.019399 0.0063
9 FF441 0.59 0.88 150 87,594 584 0.051332 -

74
Figure 52: Steel and Concrete Stresses Distribution

75
Six models were analyzed with free lateral movement to the two external concrete
units, a lateral separation range from 0.0052” to 0.0097” at the bottom of the interface as
shown in Figure 53. The load-slip relationships obtained from the finite element analyses
are shown in Figures 54 and 55.
Figure 53: Lateral Displacement for FR441

76
Figure 54: Load vs. Slip for FE Models - A
Figure 55: Load vs. Slip for FE Models - B
0
10,000
20,000
30,000
40,000
50,000
60,000
70,000
80,000
0 0.005 0.01 0.015 0.02
Ult
imat
e lo
ad (
lb)
Vertical slip (in)
Load Vs. Slip diagram - 1
80-FF441 80-FR422(a)
80-FR422(b) 80-FR632
80-FR623 150-FR441
0
10,000
20,000
30,000
40,000
50,000
60,000
70,000
0 0.005 0.01 0.015 0.02
Ult
imat
e lo
ad (
lb)
Vertical slip (in)
Load Vs. Slip diagram - 2
80-FR441
80-FB441

77
4.5.10 Discussion
The finite element analysis can demonstrate the effects of a) boundary conditions,
b) reinforcement area, c) rebar distribution, and d) interface area.
4.5.10.1 Boundary Condition
In the laboratory test as shown in Figure 17: Test setup, no lateral support was
provided to the specimen. However the friction between the contact surfaces of the
specimen and the lower platen of the test machine will provide some lateral fixity under
the vertical load. The magnitude of this frictional resistance is difficult to estimate. Finite
element models were able to demonstrate that lateral supports increased the shear
strength, prevented the lateral separation of the concrete units. For the three comparable
models with constant reinforcement and concrete interface area it was found that the
model with restrained against lateral separation on the exterior blocks (FF441) has higher
shear load and shear strength capacities of 68415 lb or 855 psi compared to the model
with restrained only at the base (FB441) with strength of (63,101 lb or 789 psi). The
model with restrained base (FB441) has higher shear load and shear strength (63,101 lb
or 789 psi) compared to the model with unrestrained boundary conditions (FR441) with
strength of 46,599 lb or 582 psi. Some of the results of the finite element analysis are
shown in Figures 56 and 57.

78
Figure 56: Boundary Condition and Load Carrying Capacity
Figure 57: Boundary Conditions and Shear Strength
Spec. 1- FR441 2- FB441 3- FF441
Ac 80 80 80
As 0.88 0.88 0.88
ρ% 1.10 1.10 1.10
Load 0 46,599 63,101 68,415
0
10,000
20,000
30,000
40,000
50,000
60,000
70,000
80,000
Ult
imat
e Lo
ad
(lb
)
Effects of Boundary Conditions
Spec. 1- FR441 2- FB441 3- FF441
Ac 80 80 80
As 0.88 0.88 0.88
ρ% 1.10 1.10 1.10
Shear (psi) 0 582 789 855
0 100 200 300 400 500 600 700 800 900
Ult
imat
e Sh
ear
Str
ess
(psi
)
Effects of Boundary Conditions

79
4. 5.10.2 Rebar Distribution and Reinforcement Area.
At fixed reinforcement areas and interface surfaces it was found that specimen
FR441 with 4#3 bars placed in one column had shear load and strength equal to 46,955 lb
or 582 psi which is less than placing the 4 bars in 2 rows and 2 columns in specimen 4-
FR422 (a) with loading capacity of 51,888 lb or 649 psi. Changing the spacing between
the rebar could change the shear strength which can be found by comparing 4-FR422(a)
to 5-FR422(b) with load carrying capacity of 55,548 lb or 694 psi and also compared to
6-FR623 with two rows and 3 columns of rebar, had loading carrying capacity of 65,593
lb or 820 psi which is less than for model 7-FR635 with 3 rows and 2 columns with load
carrying capacity of 75,637 lb or 945 psi. ACI 318-11 allows using the same expression
for single layer of steel and for two layers of steel (ties), with no limits for the spacing
between the layers.
The increase of the reinforcement area at a fixed concrete surface increased the
value of ρ, increased the ultimate load and shear strength of the model. With concrete
area of 80 in2, the steel area increased from 0.88 to 1.32 in
2 and ρ increased from 1.1% to
1.65%, for model FR441 to FR623. The corresponding load carrying capacity increased
from 46,599 lbs to 65,593 lbs and the shear stress strength increased from 582 psi to 820
psi.

80
Figure 58: Rebar Distribution and Reinforcement Area - Load
Figure 59: Rebar Distribution and Reinforcement Area - Shear
Spec. 1- FR441 4-
FR422(a) 5-
FR422(b) 6- FR623 7- FR632
Ac 80 80 80 80 80
As 0.88 0.88 0.88 1.32 1.32
ρ% 1.10 1.10 1.10 1.65 1.65
Load 0 46,599 51,888 55,548 65,593 75,637
0 10,000 20,000 30,000 40,000 50,000 60,000 70,000 80,000
Ult
imat
e Lo
ad
(lb
)
Effects of Rebar distribution and Reinforcement Area
Spec. 1- FR441 4-
FR422(a) 5-
FR422(b) 6- FR623 7- FR632
Ac 80 80 80 80 80
As 0.88 0.88 0.88 1.32 1.32
ρ% 1.10 1.10 1.10 1.65 1.65
Shear (psi) 0 582 649 694 820 945
0
200
400
600
800
1,000
Ult
imat
e Sh
ear
Str
ess
(psi
)
Effects of Rebar Distribution and Reinforcement Area

81
4.5.10.3 Interface Area
Using the same rebar area (4 bars, As = 0.88 in2) the increase of the concrete area
will increase the ultimate load applied to the specimen. However the reduction of
(ρ=As/Ac) reduces the shear strength which is the case for specimen FF441 with Ac = 80
in2. The ultimate load is 68,415 lb with shear strength of 855 psi when the concrete area
was increased with the same reinforcement ρ reduced from 1.1% to 0.59%. The ultimate
load increased to 87,594 lb but the shear strength reduced to 584 psi. In general, the
reduction of ρ reduces the shear strength. The same trend exists in the case of FR441
Figure 60: Interface Area - Load and Figure 61: Interface Area - Shear. The bond and
friction between concrete units has limited effect on the improvement of the strength
compared to reinforcement area. It is believed by (Saemann & Washa, 1964) that the
effect of roughness will reduce significantly with the increase of the reinforcement ratio.
At high reinforcement ratios, a proper confinement surrounding the rebar is required not
only for development of tensile stresses, but also to resist the compressive stresses
transferred from the rebar to the surrounding concrete.

82
Figure 60: Interface Area - Load
Figure 61: Interface Area - Shear
Spec. 1- FR441 8- FR441 3- FF441 9- FF441
Ac 80 150 80 150
As 0.88 0.88 0.88 0.88
ρ% 1.10 0.59 1.10 0.59
Load 0 46,599 55,871 68,415 87,594
0 10,000 20,000 30,000 40,000 50,000 60,000 70,000 80,000 90,000
100,000
Ult
imat
e Lo
ad
(lb
)
Effects of the Concrete Interface Area
Spec. 1- FR441 8- FR441 3- FF441 9- FF441
Ac 80 150 80 150
As 0.88 0.88 0.88 0.88
ρ% 1.10 0.59 1.10 0.59
Shear (psi) 0 582 372 855 584
0
200
400
600
800
1,000
She
ar S
tres
s St
ren
gth
(p
si)
Concrete surface area effect
83
CHAPTER V .
POTENTIAL APPLICATION FOR ADJACENT BOX BEAM GIRDER BRIDGES
5.1 Introduction
The use of cement based mortar is a common practice in construction especially
when pre-cast concrete elements are used; the non-metallic non-shrink grouts are used to
join adjacent precast reinforced concrete structural elements. A wide range of grout
materials is available in the market. Non-metallic, non-shrink cement based grouts are
specified by the departments of transportation in most of the states to reduce the
shrinkage cracks and to avoid corrosion due to the exposure to weather conditions. The
ultra-high performance concrete is a good alternative for the traditional grouts with
higher bond strength with the concrete girders and higher resistance to the chloride
penetration and low porosity because of the ingredients used in the mix design.
Key ways are formed in the structural elements to act as shear keys when filled
with grouts. The grout is expected to have a perfect bond with the precast concrete units
and to transfer the stresses from one girder to the adjacent girder to ensure that the
structure acts as a single unit. An important application of using grouts in key ways is for
the pre-cast pre-stressed bridge girders. Key ways can be in the longitudinal direction

84
joining adjacent box beams in the case of pre-cast pre-stressed box beam girders or in the
transverse direction connecting beams in long span bridges. Transverse ties or
prestressing strands are sometimes used to provide clamping force in the transverse
direction in the case of adjacent pre-cast pre-stressed box beam girders to ensure the
integrity of the structure in transferring the loads between the adjacent girders.
Joint performance depends on three factors:
1- Geometry of the key way
2- Properties of grout material
3- The amount of transverse force applied to the girder
The findings from the research described in this thesis are attempted to be applied
to a practical application. That practical application is for key way joints of adjacent box
beam bridges. The following sections outline the basis for potentially adopting some of
the test results to adjacent box beam bridges. One of the common types of grout material
used in the key ways of adjacent box beams is a normally a cementitious material that is
similar to concrete. Wet grout placed against hardened concrete is expected to perform in
a manner similar to wet concrete cast against hardened concrete. Therefore, preliminary
work for the evaluation of key way grouted joints was done in this part of the project as a
pilot study for a larger research project that will follow this work.
5.2 State-of-practice for key way geometry
Key way geometries in Figure 62: Examples of key Way Configurations and
Figure 63: Different Key Way Geometries show that some states use a full depth key
way and other states use a partial depth key way with wide range of widths.

85
Figure 62: Examples of key Way Configurations (Henry, 2011)
Figure 63: Different Key Way Geometries (Murphy, Kim, Zang, & Chao, 2010)

86
5.3 ODOT Current Practice
Ohio Department of Transportation has standard designs for box beam girders
with standard key way geometries. For all and wide box beams with composite
or non-composite beams, when the beam height is 12 the key way is
deep and wide for the top opening to place the grout, below which a of depth
with width. The key way depth is increased from total of to
in case of deeper box beams with height of a standard slope of for the
chamfers at the transitions to change widths.
Figure 64: Standard ODOT Key Way Geometry

87
5.4 Transverse Force
This information was gathered primarily from a survey of state highway agencies
through the AASHTO Highway Subcommittee on Bridges and Structures and a review of
the AASHTO LRFD Bridge Design Specifications (Henry, 2011). The locations for the
ties were at the ends, mid span, quarter points, and third points, depending on the number
of ties tying adjacent box beams. About 70% of the respondents reported that the ties
were placed at mid-depth. If two strands or bars were used at one longitudinal location,
they were placed at the third points in the depth. Other responses included specific
location depths.
Figure 65: The Use of Transverse Force (Henry, 2011)

88
5.5 Design Criteria for Connections (Henry, 2011)
Eighty-one percent of states and 89% of the respondents to the survey stated that they did
not make any design calculations to determine the amount of transverse ties between box
beams. Some respondents provided information about the post-tensioning force used for
each transverse tie and the spacing of ties. Based on this information, the average
transverse force per unit length along the span for various numbers of ties was calculated.
Figure 11 shows the results for 11 states. Where a single horizontal line is shown, it is
based on the specified maximum spacing between ties. If the ties are closer than the
minimum, the force will be higher than shown in the figure. Some states presented a
range of forces because these states used a fixed number of ties for a range of span
lengths. These are shown as a vertical band of color. A design chart to determine the
required effective transverse post-tensioning force is provided in the PCI bridge design
manual. This chart is based on the work of El- Remaily et al.
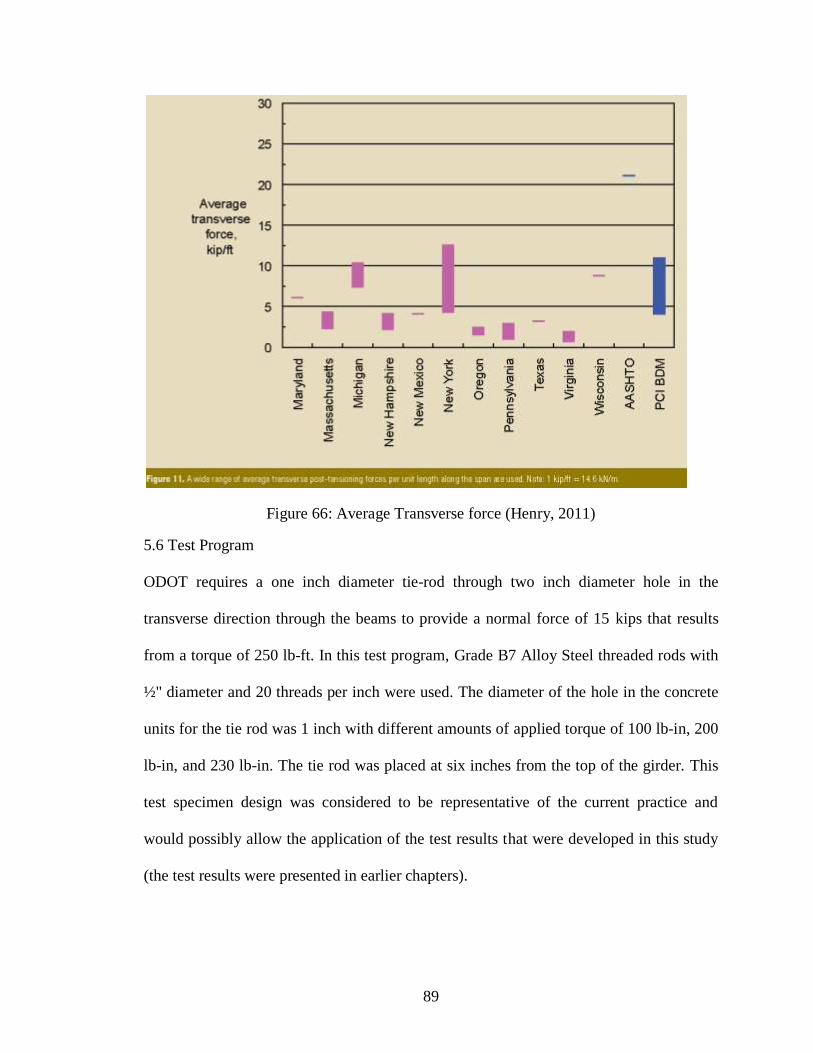
89
Figure 66: Average Transverse force (Henry, 2011)
5.6 Test Program
ODOT requires a one inch diameter tie-rod through two inch diameter hole in the
transverse direction through the beams to provide a normal force of 15 kips that results
from a torque of 250 lb-ft. In this test program, Grade B7 Alloy Steel threaded rods with
½" diameter and 20 threads per inch were used. The diameter of the hole in the concrete
units for the tie rod was 1 inch with different amounts of applied torque of 100 lb-in, 200
lb-in, and 230 lb-in. The tie rod was placed at six inches from the top of the girder. This
test specimen design was considered to be representative of the current practice and
would possibly allow the application of the test results that were developed in this study
(the test results were presented in earlier chapters).
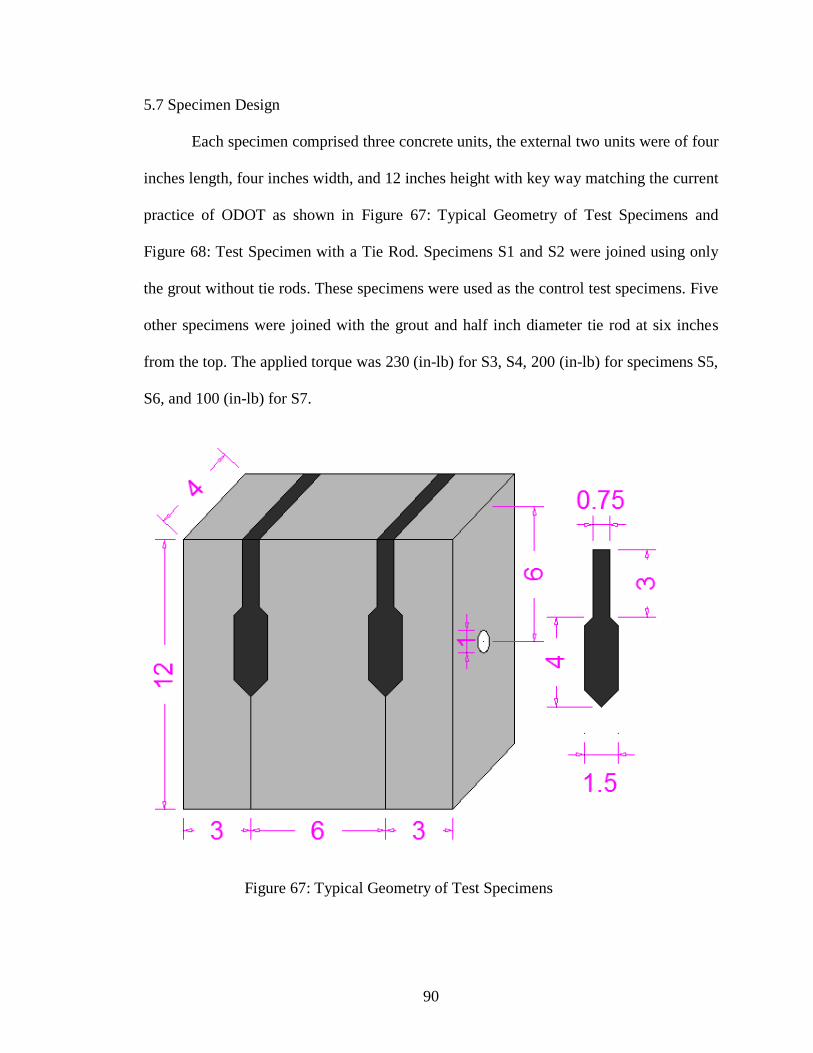
90
5.7 Specimen Design
Each specimen comprised three concrete units, the external two units were of four
inches length, four inches width, and 12 inches height with key way matching the current
practice of ODOT as shown in Figure 67: Typical Geometry of Test Specimens and
Figure 68: Test Specimen with a Tie Rod. Specimens S1 and S2 were joined using only
the grout without tie rods. These specimens were used as the control test specimens. Five
other specimens were joined with the grout and half inch diameter tie rod at six inches
from the top. The applied torque was 230 (in-lb) for S3, S4, 200 (in-lb) for specimens S5,
S6, and 100 (in-lb) for S7.
Figure 67: Typical Geometry of Test Specimens

91
.
5.7.1Compressive strength of concrete units and grout
Concrete Compressive Strength For S1,S2, S3, and S7 (psi) 8,615
Concrete Compressive Strength For S4,S5 (psi) 8,686
Grout (psi) 7,477
5.7.2 Grout Material
Approved ODOT grout material was used based on the availability in the local market
with reasonably high compressive strength; the average 28 day compressive strength of
the grout was 7,477 psi.
5.8 Test Results
The results developed from the preliminary testing of the seven specimens are shown for
failure condition in Table 23 and at first crack condition in Table 24.
Figure 68: Test Specimen with a Tie Rod

92
Table 23: Results from the Key Way Shear Tests at Failure
#
Concrete
compressive
strength
(psi)
Grout
compressive
strength
(psi)
Tie-
rod
torque
Failure
load (lb)
Vertical
displacement
(in)
Top
lateral
displacement
(in)
Bottom
lateral
displacement
(in)
S1 8,615 7,477 0 4,940 0.0395 Not measured 0.004
S2 8,615 7,477 0 8,530 0.03925 Not measured 0.014
S3 8,615 7,477 230 23,050 0.1425 0.0425 0.092
S4 8,686 7,477 230 23,068 0.13075 Not measured 0.055
S5 8,686 7,477 200 23,838 0.11275 0.0315 0.07
S6 8,686 7,477 200 29,133 0.13225 0.0165 0.078
S7 8,615 7,477 100 25,691 0.09375 0.06 0.0445
Table 24: Results from the Key Way Shear Tests at First Crack
#
Concrete
compressive
strength (psi)
Grout
compressive
strength (psi)
Tie-
rod
torque
First
crack
load
(lb)
Vertical
displacement
(in)
Top
lateral
displacement
(in)
Bottom
lateral
displacement
(in)
S1 8,615 7,477 0 2,800 0.013 Not
measured 0.0023
S2 8,615 7,477 0 7,800 0.0245 Not
measured 0.0055
S3 8,615 7,477 230 18,000 0.0646 0.0045 0.0065
S4 8,686 7,477 230 18,000 0.0635 Not
measured 0.0065
S5 8,686 7,477 200 18,000 0.05525 0.012 0.012
S6 8,686 7,477 200 11,500 0.0555 0.0055 0.0055
S7 8,615 7,477 100 13,500 0.033 0.017 0.003
Typical load-slip curves are shown in Figure 69 for specimens without tie rods and are
shown in Figure 70 for specimens with tie rods

93
Figure 69: Typical Load-Slip Diagram for Specimens without Tie-Rod
Figure 70: Typical Load-Slip Diagram for Specimens with Tie-Rod
0
1000
2000
3000
4000
5000
6000
7000
8000
9000
10000
0 0.01 0.02 0.03
Loa
d (
lb)
Slip (inch)
2- Load Slip diagram for specimen without tie rod
ave dv
dh@ bottom
0.0646, 18500
bot. 0.0065, 18000
top 0.0045, 18000
0
5000
10000
15000
20000
25000
0 0.05 0.1
Loa
d (
lb)
Slip (inch)
3- Load Slip diagram for sapecimen with 230 lb.in torque
dv
dh@ bottom
dh@top
94
5.9 Discussion
The listed concrete compressive strength is the least of the three average
compressive strengths of the three concrete units. The middle concrete unit was
supported at the top by the cross-head preventing it from vertical movement, while the
load was applied to exterior two concrete units when the loading platen was moved
upward. Dial gages were installed to measure the relative vertical slip between the three
units, and the lateral spread or outward movements at the bottom. The top lateral
movements were measured only in S3, S5, S6, and S7.
5.9.1 Load Transfer Mechanism
The specimen strength depends on the bond strength between the concrete and the
grout material, the area of contact at the interface, bearing of grout on the chamfered base
of concrete units, friction between the grout and concrete, shear resisted by steel cross-
sectional area of the tie-rod crossing the interfaces. When loading is purely in shear, the
primary difference between the specimens reported in previous chapters of this thesis and
the key way joints is the additional bearing pressure mobilized on the chamfered base of
concrete units.
5.9.2 Failure Modes
A sudden failure took place at the interface for the specimens without a tie-rod;
concrete units and grout were not damaged or cracked as shown in Figure 72. For
specimens with a tie rod, the specimens could be loaded until the concrete units were
cracked or the tie-rod yielded. For specimen size used in this study, the concrete failed
before steel as shown in Figure 71.

95
5.9.3 First Crack Load and Reserve Strength
A higher first crack load was recorded for the specimens with a tie rod compared
to those without a tie rod. A load equal to 11,500 lb to 18,000 lb for specimens with tie
rods was recorded as compared to 2,800 lb and 7,800 lb for the specimens without tie
rod. The resulting higher load carrying capacity may be due to the contribution of the
steel area of the tie-rod crossing the two interfaces and larger frictional resistance at the
interface due to the clamping force applied through tie rod torque. The reserve strength
“post-cracking load” was larger for the specimens with tie rod because the tie rod will
provide lateral stability preventing the excessive lateral spread of the units at the bottom.

96
Figure 71: Typical failure mode for specimens with tie-rod

97
Figure 72: Typical failure mode for specimens without tie-rod
5.9.4 Vertical Displacement
Using a tie rod with the resulting clamping force allows larger vertical slip at first
crack load. There was a trend also to increase the vertical slip as the clamping force is
increased in all specimens. A vertical slip of 0.025 inch was the maximum slip recorded
for specimens without tie rod, and increased to 0.033 inch for specimen S7 with 100 in-lb
torque. For the specimens S5 and S6, with torque equal to 200 in-lb had the same amount
of slip equal to 0.055". For the specimens S3 and S4 with 230 in-lb of torque, vertical
slips equal to 0.063" and 0.064" were recorded. Increasing the clamping force using the
same area of steel crossing the interface allowed larger vertical slip at first crack load.

98
Figure 73: Failure load Vs. Torque
Figure 74: Ultimate load Vs. Torque
0
5,000
10,000
15,000
20,000
25,000
30,000
35,000
0 50 100 150 200 250
Failu
re L
oa
d (
lb)
Torque (in-lb)
Ultimate load
0
5,000
10,000
15,000
20,000
0 50 100 150 200 250
Failu
re L
oa
d (
lb)
Torque (in-lb)
First crack load

99
ACI 318-11 allows the interface shear transfer strength equation to design for the
horizontal shear in flexure.
In “direct” shear along a shear plane, the increase in the load acting will reduce
the frictional contribution due to lateral separation and vertical slip as found in all test
specimens reported in this study unless the concrete blocks are supported in the
horizontal direction to maintain full surface contact during the entire duration of the
loading. This kind of restraint against separation at the interface is achievable in the case
of precast-prestressed adjacent box beam girder bridges when ties or horizontal
prestressing strands are used to tie the units together. The tie elevation and the
compressive force applied to the box beams will influence the contribution from friction
and crack width between the units.
Figure 75: Ties in Box Beam Bridges (PCI, 2009)

100
An example of precompression across the interface for single cell box beams is
shown in Figure 75: Ties in Box Beam Bridges (PCI, 2009) where two tie rods are used
to prevent separation in the tensile and compression zones.
The equations evaluated in this study will form a basis for developing a prediction
model in an upcoming research project on key way evaluation for determining the shear
transfer strength of the longitudinal joints for adjacent box beam bridges.

101
CHAPTER VI .
CONCLUSIONS AND RECOMMENDATIONS
The following conclusions may be drawn from the research study presented in
this thesis. The study included an evaluation of the existing shear transfer strength
equations for a smooth or rough interface and a carefully designed experimental work to
determine the shear transfer strength of an interface with concrete cast against the surface
of hardened concrete.
1. The horizontal shear strength equations for the prediction of the interface shear
strength in composite concrete beams by Patnaik 2001 are suitable for predicting the
shear transfer strength of a concrete interface.
2. Under a shear loading that is parallel to shear interface, tensile stresses across the
interface will cause a lateral separation to develop resulting in a reduction of the shear
strength.
3. The boundary conditions affect the shear strength; providing lateral supports in such
way as to prevent separation at the interface can control the horizontal displacement;
thereby maintaining the frictional contact between the two sides of an interface.

102
4. Applying an external clamping force perpendicular to the shear interface increases the
shear strength of the interface. Such an external clamping force can be a substitute for
the lateral supports for practical reasons. This aspect is particularly helpful in the case
of precast-prestressed box beam girders for which it is not practical to provide lateral
supports after installing the girders in place.
5. The distribution of the rebar crossing the shear interface will change the load path
through the concrete section and a better distribution of the interface steel results in
higher shear transfer strength of the concrete interface. Using strut and tie model for
each individual situation to evaluate the compressive stresses in the struts and the
tensile stresses in the rebar is a suitable approach, but a reasonable strut width needs to
be considered based on the spacing of the reinforcing bars.
6. Detailing limits are needed for the spacing between the shear reinforcement crossing
the interface to provide enough confinement and development length.
7. The higher the reinforcement ratio crossing the interface the lower the vertical slip,
with more utilization of concrete strength at failure.
8. Suitable choice of key way depths and widths are needed to improve the shear strength
and joint performance in precast-prestressed box beam bridges.
103
REFERENCES
1 ACI. (2011). Building code requirement for reinforced concrete. Detroit: ACI
318-11.
2 Anderson, A. R. (1960). Composite design in precast cast-in-place concrete. Prog
Archit, pp. 2(2):38-58.
3 Arafjo, D. L., & E1 Debs, M. K. (2005, March). Strength of shear connection in
composite bridges with precast decks using high performance concrete and shear-
keys. Materials and Structures, pp. 173-181.
4 Aziz, J. R. (2010). Shear Capacity of Concrete Prizms With Interface Joints.
Journal Of Engineering Volume 16.
5 Birkeland, H. W. (1968). Precast And Prestressed Concrete. Class Notes For
Course University of British Columbia.
6 Birkeland, P. W., & Birkeland, H. W. (1966). Connections in precast concrete
structure. ACI JOURNAL, 63(3):345-68.
7 Eduardo, N. J., D, D.-d.-C. a., & Branco b, J. A. (2010). Accuracy of Design
Code Expressions for Estimating Longitudinal Shear Strength of Strengthening
Concrete Overlays. Engineering Structures 32.
8 Gaston, J. R., & Kriz, L. B. (1964). Connections in precast concrete strucures-
scarf joints. PCI J.
9 Hanson, N. W. (1960). Precat Prestressed Concrete Bridges. 2. Horizontal Shear
Connections. Portland Cement Assoc.
10 Henry, R. G. (2011). Adjacent precast concrete box-beam bridges: State of the
practice. PCI, 75-91.
11 Hermansen, B. R., & Cowan, J. (1974). Modified shear-friction theory for bracket
design,. ACI Journal, 71(2):55-60.

104
12 Khan, L. F., & Mitchell, A. D. (2002). Shear friction tests with high strength
concrete. ACI Structural Journal, pp. 99(1):98-103.
13 Loov, R. E., & Patnaik, A. K. (1994). Horizontal Shear Strength of Composite
Concrete Beams With Rough Interface. PCI, 39(1):48-69.
14 Mahmoud et al, M. (2013). Interfacial shear behavior of composite flanged
concrete beams,. HBRC.
15 Mansur, M. A., Vinayagam, T., & Tan, K. H. (2008). Shear transfer across a
crack in reinforced high strength concrete. ACES J Material, pp. 20(4):294–302.
16 Mattock, A. H. (1974). Shear tranfer in concrete having reinforcement at an angle
to the shear plan. ACI J. Special puplication 42-2.
17 Mattock, A. H. (1994). Reader comments of paper "Horizontal shear strength of
composite concrete beams with a rough interface" puplished in PCI Journal
January- February 1994:39(1):48-69, by Loov RE, Patnaik AK. . PCI Journal, pp.
39(5):106-8.
18 Mattock, A. H. (2001). Shear friction and high strength concrete. ACI Structural
journal.
19 Mattock, A., & Kaar, P. (1961). Shear test of continuous girders. PCA, 3(1) : 19-
46.
20 Mitchell, G. (2002). Horizontal Shear Transfer Across a Roughenen Surface.
Cement & Concrete Composites, 25 (2003) 379–385.
21 Murphy, M. l., Kim, J., Zang, Z., & Chao. (2010). Deteminning more effective
approaches of grouting shear keys of adjacent box beams. Pennsylvanya
Transportation Institute.
22 Naito Main, C. J. (n.d.). Retrieved from Google:
http://www.google.com/imgres?newwindow=1&safe=off&hl=en&biw=1242&bih
=545&tbm=isch&tbnid=BghQeccoJdC1iM%3A&imgrefurl=http%3A%2F%2Fw
ww.lehigh.edu%2F~cjn3%2Fpenndot.shtml&docid=dfi2nZhB6zCxFM&imgurl=
http%3A%2F%2Fwww.lehigh.edu%2F~cjn3%2Fcorr.jpg&w=800&h=600&
23 Patnaik, A. H. (2001). Behavior of composite concrete beams with smooth
interface. ASEC J Struct Eng.
24 PCI. (2009). The State of the Art of Precast/Prestressed Adjacent Box Beam
Bridges.

105
25 Pedro, M. S., & Eduardo, N. B. (2011). Factors Affecting Bond Between Old And
New Concrete. ACI Material Journal.
26 Pedro, M. S., & Eduardo, N. J. (2012). A state-of-the art review on shear friction .
Engineering Structures.
27 Pedro, M. S., & Eduardo, N. J. (2013). A State of The Art Reviw on Roughness
Quantification Method for Concrete Surfaces. Construction and Building
Materials 38 912-923.
28 Raths, C. H. (1977). Reader comments of paper "Design proposals for reinforced
concrete corbels" May-June 1976;21(3):18-42, by Mattock A PCI. PCI.
29 Saemann, J. C., & Washa, G. W. (1964). Horizontal shear connections between
precast beams and cast in place slabs. American Concrete Institute, pp.
61(11):1309-83.
30 Scott, J. (2010). Interface shear strength in lightweight concrete bridge girders.
Thesis submitted to the faculty of the Virginia Polytechnic Institute and State
University.
31 Wall, J. S., & Shrive, N. G. (1988). Factors Affecting Bond Between Old and
New Concrete. ACI Material Journal, 85-M15.
32 Wong, R., Ma, S., Wong, R., & Chau, K. T. (2007). Shear strength components of
concrete under direct shearing. Cement and Concrete Research.

106
APPENDIX
Tensile test results
-20
0
20
40
60
80
100
120
140
-0.05 0 0.05 0.1 0.15 0.2 0.25
Stre
ss (
Ksi
)
Strain (in/in)
Specimen # 2
Stress Strain curve

107
Selected data from Abaqus input file
** Generated by: Abaqus/CAE 6.11-2
*Preprint, echo=NO, model=NO, history=NO, contact=NO
** PARTS
*Part, name=bar-mesh-1
*Element, type=C3D8R
*Elset, elset=_PickedSet2, internal, generate
1, 1200, 1
** Section: steel
*Solid Section, elset=_PickedSet2, material=STEEL
*End Part
**
*Part, name="external unit-mesh-1"
-20
0
20
40
60
80
100
120
140
0 0.05 0.1 0.15 0.2
Stre
ss (
Ksi
).
Strain (in/in)
Specimen # 3
Stress - Strain …

108
*Node
1, 5., 12., 4.
*Element, type=C3D8R
1, 118, 119, 132, 131, 1, 2, 15, 14
480, 688, 689, 702, 701, 571, 572, 585, 584
*Elset, elset=_PickedSet2, internal, generate
1, 480, 1
** Section: concrete
*Solid Section, elset=_PickedSet2, material=CONCRETE
*End Part
*Part, name="moddle part-mesh-1"
*Node
1, 15., 12., 4.
1089, 5., 2., 0.
*Element, type=C3D8R
1, 100, 101, 112, 111, 1, 2, 13, 12
800, 1077, 1078, 1089, 1088, 978, 979, 990, 989
*Elset, elset=_PickedSet2, internal, generate
1, 800, 1
*Nset, nset=supports, generate
1, 1079, 11
** Section: concrete
*Solid Section, elset=_PickedSet2, material=CONCRETE
*End Part
** ASSEMBLY
109
*Assembly, name=Assembly
*Instance, name=bar-mesh-1-1, part=bar-mesh-1
0., 4., 2.
0., 4., 2., 0., 5., 2., 90.
*End Instance
*Instance, name="external unit-mesh-1-1", part="external unit-mesh-1"
*End Instance
*Instance, name="moddle part-mesh-1-1", part="moddle part-mesh-1"
*End Instance
*Instance, name="external unit-mesh-1-1-lin-1-2", part="external unit-mesh-1"
15., 0., 0.
*End Instance
*Instance, name=bar-mesh-1-1-lin-1-2, part=bar-mesh-1
0., 6., 2.
0., 6., 2., 0., 7., 2., 90.
*End Instance
*Instance, name=bar-mesh-1-1-lin-1-3, part=bar-mesh-1
0., 10., 2.
0., 10., 2., 0., 11., 2., 90.
*End Instance
*Instance, name=bar-mesh-1-1-lin-1-4, part=bar-mesh-1
0., 8., 2.
0., 8., 2., 0., 9., 2., 90.
*End Instance
*Elset, elset=_PickedSet31, internal, instance=bar-mesh-1-1-lin-1-2

110
1, 2, 3, 4, 5, 6, 7, 8, 9, 10, 11, 12, 13, 14, 15, 16
, 1200
*Elset, elset=_PickedSet31, internal, instance=bar-mesh-1-1
1, 2, 3, 4, 5, 6, 7, 8, 9, 10, 11, 12, 13, 14, 15, 16
1197, 1198, 1199, 1200
*Elset, elset=_PickedSet31, internal, instance=bar-mesh-1-1-lin-1-4
1, 2, 3, 4, 5, 6, 7, 8, 9, 10, 11, 12, 13, 14, 15, 16 ,1200
*Elset, elset=_PickedSet31, internal, instance=bar-mesh-1-1-lin-1-3
1, 2, 3, 4, 5, 6, 7, 8, 9, 10, 11, 12, 13, 14, 15, 16
, 1198, 1199, 1200
*Nset, nset=_PickedSet33, internal, instance="moddle part-mesh-1-1", generate
1, 1079, 11
*Nset, nset=_PickedSet35, internal, instance="external unit-mesh-1-1", generate
586, 702, 1
*Nset, nset=_PickedSet36, internal, instance="external unit-mesh-1-1-lin-1-2", generate
1, 117, 1
*Nset, nset=_PickedSet39, internal, instance="external unit-mesh-1-1", generate
13, 702, 13
*Nset, nset=_PickedSet39, internal, instance="external unit-mesh-1-1-lin-1-2", generate
13, 702, 13
*Elset, elset="_EXTERNAL block sufaces_S1", internal, instance="external block-mesh-
1-1-lin-1-2", generate
385, 480, 1
*Elset, elset="_EXTERNAL block sufaces_S2", internal, instance="external block-mesh-
1-1", generate
1, 96, 1
111
*Surface, type=ELEMENT, name="EXTERNAL block sufaces"
"_EXTERNAL block sufaces_S1", S1
"_EXTERNAL block sufaces_S2", S2
*Elset, elset="_middle block surface_S1", internal, instance="moddle part-mesh-1-1",
generate
721, 800, 1
*Elset, elset="_middle block surface_S2", internal, instance="moddle part-mesh-1-1",
generate
1, 80, 1
*Surface, type=ELEMENT, name="middle block surface"
"_middle block surface_S1", S1
"_middle block surface_S2", S2
** Constraint: Constraint-1
*Embedded Element, absolute exterior tolerance=0.01, exterior tolerance=0.01, roundoff
tolerance=0.01
_PickedSet31
*End Assembly
** MATERIALS
*Material, name=CONCRETE
*Concrete
2925., 0.
4949.07, 0.0037
*Failure Ratios
1.16, 0.09, 1.28, 0.3333
*Shear Retention
1., 0.01
112
*Tension Stiffening
1., 0.
0., 0.002
*Elastic
4.64539e+06, 0.18
*Material, name=STEEL
*Elastic
2.9e+07, 0.28
*Plastic
89096., 0.
113339., 0.17717
** INTERACTION PROPERTIES
*Surface Interaction, name=friction
1.,
*Friction, slip tolerance=0.005
0.9,
** BOUNDARY CONDITIONS
** Name: U1-U3 Type: Displacement/Rotation
*Boundary
_PickedSet35, 1, 1
_PickedSet35, 3, 3
** Name: U2 Type: Displacement/Rotation
*Boundary
_PickedSet33, 2, 2
** Name: u1 Type: Displacement/Rotation

113
*Boundary
_PickedSet36, 1, 1
** INTERACTIONS
** Interaction: FRICTION
*Contact Pair, interaction=friction, type=SURFACE TO SURFACE
"EXTERNAL block sufaces", "middle block surface"
** STEP: loaded
*Step, name=loaded, inc=1000000
*Static
0.001, 100., 0.0001, 1.
** BOUNDARY CONDITIONS
** Name: DISPLACEMENT Type: Displacement/Rotation
*Boundary
_PickedSet39, 2, 2, 0.5
** OUTPUT REQUESTS
*Restart, write, frequency=0
** FIELD OUTPUT: F-Output-1
*Output, field, variable=PRESELECT
** HISTORY OUTPUT: H-Output-1
*Output, history, variable=PRESELECT
*End Step


