Shadow Pills, Actual Pill Policy, and Firm Value
K. J. Martijn Cremers, Scott B. Guernsey,* Lubomir P. Litov, and Simone M. Sepe†
August 6, 2019
Abstract
We analyze the impact of the right to adopt a poison pill – a “shadow pill” – on actual pill policy and
firm value by exploiting the quasi-natural experiment provided by the staggered adoption of poison pill
laws that validated the pill as a takeover defense. We document that a strengthened shadow pill
promotes the use of actual poison pills and increases firm value – especially for acquisition targets, and
more innovative firms or firms with stronger stakeholder relationships. Our findings suggest shadow
pills create value for some firms by increasing their bargaining power in takeovers and reducing their
contracting costs with stakeholders.
JEL classifications: G32, G34, K22, O32
Keywords: Poison pill, antitakeover statutes, shadow pill, firm value, bargaining power, bonding
University of Notre Dame, Mendoza College of Business. Email address: [email protected]. * University of Cambridge, Judge Business School. Email address: [email protected]. University of Oklahoma, Price College of Business and the College of Law and Wharton Financial Institutions
Center, University of Pennsylvania. Email address: [email protected]. † University of Arizona, James E. Rogers College of Law and Institute for Advanced Study in Toulouse –
Fondation Jean-Jacques Laffont – Toulouse School of Economics. Email address: [email protected].
We thank seminar participants at Texas Christian University, the Toulouse School of Economics, the University
of Alabama, the University of Illinois at Chicago, the University of Oklahoma, as well as participants at the 2018
Accounting and Finance Conference, the 2018 American Law and Economics Association meeting, the 26th
Finance Forum (AEFIN), the 2018 Financial Management Association (FMA) meeting, the 2018 NYU External
Law and Economics Workshop, the 2018 Paris December Finance meeting, the 2018 North American Society for
Financial Studies Cavalcade, the 2018 Southwest Finance Symposium, and the 2019 Midwest Finance
Association meeting. For useful comments and discussions, we also thank Anup Agrawal, Sanjai Bhagat, John
Bizjak, Alon Brav, Brian Broughman, Ryan Bubb, Catherine Casamatta, Emiliano Catan (discussant), John
Coates, Douglas Cook, Vicente Cuñat, Ofer Eldar (discussant), Mara Faccio, Daniel Ferreira, Sergio Garcia
(discussant), Todd Gormley, Denis Gromb, Randall Heron (discussant), Peter Iliev, Kose John, Marcel Kahan,
Swaminathan Kalpathy, Summer Kim, Sandy Klasa, Michael Klausner, Gabriele Lattanzio, Scott Linn, Nadya
Malenko, Saura Masconale, Ron Masulis, William Megginson, H. Shawn Mobbs, Sandra Mortal, Urs Peyer
(discussant), Sebastian Pouget, Sugata Ray, Ed Rock, Tatiana Salikhova (discussant), Laura Starks, Renjie Wang
(discussant), and Pradeep Yadav. This paper is featured as a European Corporate Governance Institute (ECGI) –
Finance Working Paper No. 595/2019, and was awarded the 2018 AEFIN Best paper of the Conference by the
Spanish Finance Association and was a semifinalist for the Best Corporate Finance paper at the 2018 FMA. A
previous version of the paper was titled “Shadow Pills and Long-Term Firm Value.”
Internet Appendix results are available at: https://papers.ssrn.com/sol3/papers.cfm?abstract_id=3074658

1
Law and finance scholars generally agree that the poison pill (formally known as a
“shareholder rights plan”) is among the most powerful antitakeover defenses (e.g., Malatesta
and Walkling 1988; Ryngaert 1988; Comment and Schwert 1995; Coates 2000; Bebchuk,
Coates, and Subramanian 2002; Cremers and Ferrell 2014). While details vary across different
implementations, the basic defensive mechanism of the pill provides existing shareholders with
stock purchase rights that entitle them to acquire newly issued shares at a substantial discount
in the “trigger” event that a hostile bidder obtains more than a pre-specified percentage of the
company’s outstanding shares, while withholding such rights from the hostile bidder. As a
result, poison pills grant the board of directors the ability to dilute the ownership stake of a
hostile bidder substantially, giving the board de facto veto power over any hostile acquisition.
After the Delaware Supreme Court validated the use of the pill in 1985, a significant
literature investigated whether the adoption of a poison pill is beneficial or detrimental to
shareholder interests. While earlier findings were mixed,1 over the past decade empirical
studies have found that the adoption of a pill is negatively associated with firm value (e.g.,
Bebchuk, Cohen and Ferrell 2009; Cuñat, Gine, and Guadalupe 2012; Cremers and Ferrell
2014). However, this result is difficult to interpret, as the decision to employ a pill is
endogenous and poison pills can be unilaterally adopted by the board of directors, so that even
firms that do not currently have a pill in place still have a “shadow pill” (Coates 2000). The
availability of the shadow pill exacerbates endogeneity concerns, as reverse causality or other
omitted variables might explain both the board’s decision to adopt a poison pill and the reported
negative association between the adoption of a pill and firm value (Bhagat and Jefferis 1993;
Comment and Schwert 1995; Catan 2019).
In this paper, we contribute to the debate on the association between poison pills and firm
value by shifting the focus from “visible” pills to shadow pills – i.e., studying the effect that
arises from the right to adopt a poison pill (which right constitutes the shadow pill) rather than
its realized adoption. To this end, we consider the implications of state-level poison pill laws
(PPLs) on a firm’s actual pill policy and financial value, consistent with a large body of studies
1 Some prior studies find a negative association between the adoption of a poison pill and, respectively, abnormal
stock returns (Malatesta and Walkling 1988; Ryngaert 1988; Brickley, Coles, and Terry 1994; Bizjak and
Marquette 1998; Gillan and Starks 2000), bond returns (Datta and Iskandar-Datta 1996), takeover propensities
(Bebchuk, Coates, and Subramanian 2002; Field and Karpoff 2002; Karpoff, Schonlau, and Wehrly 2017), and
Tobin’s Q (Gompers, Ishii, and Metrick 2003; Chi 2005). Other studies, instead, find a positive association
between the adoption of a poison pill and, respectively, stock returns (Caton and Goh 2008) – in particular, for
firms with outsider-dominated boards (Brickley, Coles and Terry 1994) – takeover premiums (Comment and
Schwert 1995; Cotter, Shivdasani and Zenner 1997; Heron and Lie 2006, 2015), and operating performance
(Danielson and Karpoff 2006), while also finding that the poison pill does not deter takeovers (Ambrose and
Megginson 1992; Bhagat and Jefferis 1993; Carney and Silverstein 2003).

2
that exploit variation from state antitakeover laws as quasi-natural experiments (e.g., Karpoff
and Malatesta 1989; Bertrand and Mullainathan 1999, 2003; Garvey and Hanka 1999; Qiu and
Yu 2009; Francis et al. 2010; Giroud and Mueller 2010; Atanassov 2013; Gormley and Matsa
2016; Karpoff and Wittry 2018). Among these state laws, PPLs explicitly sanction the validity
of the right to adopt a poison pill, thereby (as we will show) strengthening the relevance of the
shadow pill.
Our main findings are twofold. First, we document that the passage of PPLs result in
significant increases in the likelihood that PPL-affected firms adopt new pills and maintain
existing pills. Second, we find that the Tobin’s Q of the companies incorporated in states with
PPLs increases significantly relative to firms incorporated elsewhere. Further, we also confirm
the findings of the previous literature that visible pills are negatively associated with Tobin’s
Q, which underlines the importance of our study’s endeavor at disentangling the value
implications of the ex-ante right to adopt a poison pill (i.e., shadow pill) relative to the ex-post
endogenous decision to put an actual pill in-place.
Two economic mechanisms can explain these findings. First, we show that the strengthened
validity granted to poison pills through a PPL helps boards of directors to bargain for a higher
purchasing price after being targeted in a takeover contest (though we find no evidence that
PPLs predict takeover activity itself). Second, we find that the increases in Tobin’s Q for firms
incorporated in a PPL-adopting state are more pronounced for more innovative firms or firms
where firm-specific stakeholder investments are more relevant (e.g., with a large customer or
in a strategic alliance). Overall, these findings support the view that the shadow pill promotes
value enhancement for some firms by improving the negotiating position of a target’s board
(the “bargaining power hypothesis”) and by reducing a firm’s contracting costs with its
stakeholders (the “bonding hypothesis”).
Because our study relies on PPLs to identify how a strengthened shadow pill affects actual
pill policy and firm value, we follow the recommendation of recent work (e.g., Catan and
Kahan 2016; Cain, McKeon, and Solomon 2017; Karpoff and Wittry 2018) and account for the
legal environment into which these laws were passed. In particular, due to the pervasive
influence of Delaware case law over other jurisdictions (e.g., Ryngaert 1988; Cremers and
Ferrell 2014; Dammann 2019), the validity of the pill was arguably fairly certain from 1985
(when the Delaware Supreme Court validated the poison pill in Moran v. Household
International, Inc.) until at least 1988, when two Delaware decisions (City Capital Associates
v. Interco Inc. and Grand Metropolitan PLC v. Pillsbury Co.) injected novel uncertainty by
restricting a board’s ability to maintain a pill indefinitely. Adding to the confusion, a

3
subsequent decision in Paramount Communications, Inc. v. Time, Inc. in 1989 overturned the
rulings in Interco and Pillsbury.
Therefore, during the period 1985 to 1988 covering most of the PPLs considered in prior
studies, firms incorporated in both Delaware and elsewhere had ready access to the pill (and
thus had an effective shadow pill, irrespective of whether their incorporating state had adopted
a PPL). Moreover, during this period a majority of firms incorporated in both Delaware and
elsewhere actually adopted a visible pill (see Figure 1). These two circumstances likely reduced
the importance of introducing PPLs in this period. The topsy-turvy chain of judicial events
from 1985 to 1989 could also plausibly explain why most states (27-out-of-35) decided to adopt
PPLs post-Interco and Pillsbury, as a way to provide legal certainty.
Considering this legal context, our study focuses on PPLs adopted during the period 1995
to 2009 – which we term the “second wave” (SW) of adoptions. Beginning the SW in 1995
ensures that we have a relatively stable pre-treatment period (i.e., not confounded by the
aforementioned Delaware court decisions or the hostile takeover wave of the 1980s), which
helps address identification concerns. Additionally, the value implications of SW-PPLs have
never been studied and, given the changed underlying legal context, a priori it is reasonable to
expect that results for this later set of laws might differ from results obtained by prior studies
using the earlier set of PPLs passed between 1986 and 1990 (i.e., the “first wave” (FW) of
adoptions).
We first show that our results for FW-PPLs are in line with prior work. In particular, in a
recent paper, Karpoff and Wittry (2018) document evidence that prior corporate governance
studies using business combination laws (BCLs) as a source of identifying variation for
individual firm’s takeover protection are potentially plagued by an omitted variable problem if
they do not account for pertinent institutional and legal context – including PPLs. Most relevant
for our study, they show that PPLs adopted during their sample period (i.e., 1976-1995) appear
to negatively associate with return on assets (ROA), although this negative association becomes
insignificant in their subsequent tests that control for firm-level defenses, such as poison pills
(similar to prior work, e.g., Karpoff and Malatesta 1989).2 Consistent with their results, we
document that firms incorporated in states adopting FW-PPLs did not experience significant
changes in their levels of Tobin’s Q, excess stock returns, or ROA.3 Consistent with our
2 Karpoff and Malatesta (1989) analyze the effect of several state antitakeover statutes on stock prices between
1982 and 1987 and find negative abnormal returns surrounding press announcements of antitakeover legislation,
especially in response to PPLs. In supplemental tests, however, they show their results are contingent on firms not
having company-level protections (e.g., poison pills) in-place. 3 See Internet Appendix Table A1 and Table 1.

4
conjecture, this result suggests that FW-PPLs did not materially impact firms’ shadow pills,
due to the arguably undisputed legal right to a pill during almost all of this period as explained
above.
We then investigate the likelihood of the passage of SW-PPLs conditional on state-level
characteristics (e.g., prior adoption of other major antitakeover laws, the incorporating state’s
M&A volume, GDP per capita and growth rate, and state business entry and exit rates), and
incorporation state and year fixed effects. We find no significant predictors for the adoption of
SW-PPLs, suggesting that the adoption of these laws is largely exogenous to the legal and
economic environment in which they were introduced.
Our principal findings on the effect of SW-PPLs on actual pill policy and long-term value
are estimated using difference-in-differences regressions that include firm, U.S. Census
division-by-year,4 and industry-by-year fixed effects. First, we show that these PPLs
significantly increased the propensity of firms incorporated in the enacting states to adopt and
maintain existing (e.g., renew expiring) pills relative to Delaware and non-Delaware firms
without such legislation. Second, we document that a strengthened shadow pill, as enabled by
the passage of PPLs results in an economically and statistically significant increase in the
affected firms’ Tobin’s Q of 5.1%, relative to the sample average.
We obtain results similar to using division-by-year fixed effects by using instead region-
by-year (i.e., Northeast, Midwest, South, and West) or headquarter-state-by-year fixed effects,
which control for unobserved, time-varying differences across headquarter regions or
headquarter states, respectively. However, we primarily focus on the division-by-year fixed
effects results because Census divisions capture a more granular geographic locale than
regions, and the majority of affected firms and non-Delaware unaffected firms incorporate and
locate their headquarter in the same state, such that results using headquarter-state-by-year
fixed effects depend on a limited set of firms for identification.
Our findings are further robust to the incorporation of possible selection effects through the
creation of a matched sample, where the “treated” firms incorporated in SW-PPL-adopting
states are matched to “control” firms with similar observable ex-ante characteristics and
headquartered in the same Census division and in the same industry, but incorporated in a state
that has not adopted a PPL. The difference in the Tobin’s Q between treated and control firms
4 The U.S. Census Bureau classifies census divisions by grouping states and the District of Columbia into the
following nine geographical subdivisions: New England, Middle Atlantic, East North Central, West North
Central, South Atlantic, East South Central, West South Central, Mountain, and Pacific. We interact a firm’s
headquarter division with year dummies to control for unobserved, time-varying sources of local heterogeneity
that could correlate with PPLs, pill adoptions and firm value.

5
in the matched sample – as well as pre-event trends of other important firm characteristics – is
insignificant in the three-year period preceding the laws’ passage, while the difference in
Tobin’s Q is significantly positive in the three-year period following their adoptions.
We find analogous results of increased value after PPLs are adopted using other proxies for
firm value than Tobin’s Q, such as excess stock returns, profitability, and Total Q (Peters and
Taylor 2017). As a final robustness test, we conduct a long-term event study surrounding the
adoption of PPLs, which employs long (short) portfolios that buy (sell) treated (control) stocks
from our matched sample around the time their (matched sample counterpart’s) state of
incorporation adopts a law. The resulting long-short portfolio has a positive and significant
alpha of about 0.9% per month in the period surrounding the adoption of the SW-PPLs.
Finally, we examine two possible economic channels through which the shadow pill could
contribute to firm value, namely the “bargaining power hypothesis” (e.g., Stulz 1988;
Berkovitch and Khanna 1990; Harris 1990; Kadyrzhanova and Rhodes-Kropf 2011) and the
“bonding hypothesis” (e.g., Knoeber 1986; Laffont and Tirole 1988; Shleifer and Summers
1988; Johnson, Karpoff, and Yi 2015) of takeover defenses. Under the bargaining power
hypothesis, having the right to adopt a poison pill strengthens the negotiating position of the
board vis-à-vis any potential bidder, thereby allowing directors to obtain a higher offer price
for the target’s shareholders. Alternatively, under the bonding hypothesis, limiting the ability
of shareholders to disrupt a firm’s long-term strategy – such as through strengthening the
shadow pill – serves as a commitment device that binds the shareholders to long-term
strategies. Such bonding can decrease a firm’s cost of contracting with its stakeholders and,
thereby, improve long-term firm value.
Consistent with the bargaining power hypothesis, firms with a pill in-place receive a higher
takeover premium after their state adopts a PPL, without evidence of any change in the
likelihood of becoming a target. This finding helps to explain why the increase in the use of
the actual pill we document for some PPL-affected firms can be valuable. Additionally, in
support of the bonding hypothesis, we find that firms incorporated in a state that adopts a PPL
and for which stakeholder relationships are likely more relevant – such as firms that are more
engaged in long-term investments in innovation, have a large customer, are in a strategic
alliance, or are more labor intensive – experience a higher increase in Tobin’s Q.
Overall, our study contributes to the literature on the poison pill and, more generally,
takeover defenses, in the following four ways. First, we contribute to prior scholarship by
analyzing the adoption of both FW- and SW-PPLs (i.e., considering all 35 enacting states),
extending prior work that only employs FW-PPLs (e.g., Karpoff and Malatesta 1989; Karpoff
6
and Wittry 2018).5 Second, we confirm the insignificant results obtained by earlier studies on
the association between FW-PPLs and proxies of firm value but show that SW-PPLs are
positively related to these same proxies. We explain the difference through the changed legal
context pertaining to the validity of the (right to adopt a) poison pill from the FW-period to the
SW-period. Third, we assemble a comprehensive panel dataset on firm-level poison pills. This
enables us to test the impact of PPLs on actual pill policy, as well as to confirm the findings of
prior literature on other determinants of pill adoption. Fourth, we contribute to the literature
examining the relationship between takeover defenses and firm value,6 finding support for both
the bargaining power hypothesis (e.g., Stulz 1988; Berkovitch and Khanna 1990; Harris 1990;
Comment and Schwert 1995; Heron and Lie 2006, 2015; Kadyrzhanova and Rhodes-Kropf
2011) and bonding hypothesis (e.g., Knoeber 1986; Laffont and Tirole 1988; Shleifer and
Summers 1988; Cen, Dasgupta, and Sen 2015; Johnson, Karpoff, and Yi 2015, 2018; Bhojraj,
Senguota, and Zhang 2017;7 Cremers, Litov, and Sepe 2017; Chemmanur and Tian 2018) of
takeover defenses.
1. Data and Empirical Framework
1.1. Sample selection, definition of variables and summary statistics
We start the construction of our primary dataset by combining information on firm-level
poison pills from two institutional providers, four prior academic studies, and our own hand-
collected sample. The institutional data providers include the Securities Data Companies
(SDC) Corporate Governance and the Institutional Shareholder Services (ISS) Governance
5 In related work, Cain, McKeon, and Solomon (2017) study 16 different state antitakeover statutes and court
rulings over the period 1965-2014 and find that PPLs do not impact hostile takeover activity, but do not consider
the specific impact of these laws on overall firm value. Neither do other recent working papers considering PPLs,
such as, for example, John and Kadyrzhanova (2017). They find that a classified board’s power to deter a takeover
during periods of heightened merger activity is strengthened by a PPL. Fich, Harford and Yore (2018) show that
their main result linking BCLs to the marginal value of cash is robust to using PPLs. 6 For example, see DeAngelo and Rice (1983); Linn and McConnell (1983); Demsetz and Lehn (1985); Malatesta
and Walkling (1988); Morck, Shleifer, and Vishny (1988); Karpoff and Malatesta (1989); Brickley, Coles and
Terry (1994); Lang and Stultz (1994); Yermack (1996); Cotter, Shivdasani, and Zenner (1997); Himmelberg,
Hubbard, and Palia (1999); Daines (2001); Palia (2001); Bertrand and Mullainathan (2003); Gompers, Ishii, and
Metrick (2003); Bebchuk, Cohen, and Ferrell (2009); Francis et al. (2010); Giroud and Mueller (2010, 2011);
Cuñat, Gine, and Guadalupe (2012); Cremers and Ferrell (2014); Straska and Waller (2014). 7 Bhojraj, Sengupta, and Zhang (BSZ) (2017) use two 1995 Delaware court decisions to examine how antitakeover
provisions relate to innovative firms’ value. Our study materially differs in the following three ways. First, we
isolate the value relevancy of the shadow pill for the average firm. Second, we use the PPL setting, where the
staggered adoption of state laws is generally accepted by the literature as providing identification (Catan and
Kahan 2016; Karpoff and Wittry 2018). The setting in the BSZ study has been criticized by, e.g., Heron and Lie
(2015), who show that these court rulings are unrelated to poison pills and takeover premiums and that their scope
extends beyond Delaware, rendering difference-in-differences tests invalid. Third, we employ regression models
with firm, industry-by-year, and headquarter-geography-by-year fixed effects (Gormley and Matsa 2016), while
the BSZ study only includes industry fixed effects. When we consider the 1995 Delaware court decisions in our
sample with appropriately specified fixed effects models, we do not find the rulings mattered for firm value.

7
databases. We supplement these observations with poison pill data from Comment and Schwert
(1995), Catan and Goh (2008), Cremers and Ferrell (2014), and Cremers, Litov and Sepe
(2017). Additionally, we add our own hand-collected data from Factiva searches on firms with
missing pill information from the sources above over the period 1992–2012.
The resulting sample contains firm-level poison pill information on 3,423 unique firms
between 1983 and 2012, which we merge with the industrial firms (excluding utilities and
financials) in the merged CRSP-Compustat database. To be included in the sample, we require
that firms are incorporated and headquartered in the U.S., with non-missing or non-negative
book value of assets or net sales, and without missing observations for the dependent and
independent variables used in our baseline regression model. This selection criterion results in
a panel with 33,826 firm-year observations covering the period 1983–2012, which begins and
ends three-years before and after the first and last state adopts a PPL. Per our discussion in the
introduction, we then partition this dataset into two separate samples encompassing the first
(1983 to 1993) and second (1992 to 2012) wave of PPL adoptions.
Our study’s key independent variable, 𝑃𝑃𝐿, is an indicator capturing whether a firm is
incorporated in a state that has passed a PPL at any point between 1986 and 2009. We obtain
information on whether states have passed one of these laws from Barzuza (2009), Cain,
McKeon and Solomon (2017) and Karpoff and Wittry (2018), and report each state’s adoption
month/year date in Internet Appendix Table A2. We use historical incorporation information
from Compact Disclosure covering the period 1986 to 2006 and the CRSP Historical U.S.
Stock database (available directly from the University of Chicago, though currently not
included in WRDS) between 1990 and 2012.8 Combining law adoption dates and historical
incorporation data, we construct the indicator variable, 𝑃𝑃𝐿, which is set equal to one in the
adoption year and afterwards for all firms incorporated in the enacting states, and set to zero in
the years prior to adoption. 𝑃𝑃𝐿 always equals zero for firms in states that never passed a PPL,
including firms incorporated in Delaware. Given Delaware’s prominence, its unique history of
poison pill case law and the empirical uncertainty it creates for the validity of pill adoption and
redemption, we verify that our main findings are robust to the exclusion of Delaware firms
entirely (Internet Appendix Table A12).
Along with 𝑃𝑃𝑖𝑙𝑙, which measures the adoption and maintenance of poison pills, we study
the separate implications of PPLs for new adoptions of pills (𝑁𝑒𝑤 𝑃𝑃𝑖𝑙𝑙) and the duration of
8 We backfill states of incorporation for firm-years prior to 1986 using the oldest observation from either the
Compact Disclosure or CRSP Historical database.

8
existing pills (𝐿𝑛(𝑃𝑃𝑖𝑙𝑙 𝐷𝑢𝑟𝑎𝑡𝑖𝑜𝑛)) for firms incorporated in enacting states. 𝑁𝑒𝑤 𝑃𝑃𝑖𝑙𝑙 is
defined as an indicator equal to one if a firm adopts a poison pill for the first-time in the current
year, and zero otherwise. 𝐿𝑛(𝑃𝑃𝑖𝑙𝑙 𝐷𝑢𝑟𝑎𝑡𝑖𝑜𝑛) is measured as the natural logarithm of one plus
the number of years a firm has had an existing pill in-place as of the current year.
We primarily employ Tobin’s Q (𝑄) as our main proxy for firm value, consistent with
prior work examining the value relevancy of corporate governance arrangements (e.g.,
Demsetz and Lehn 1985; Morck, Shleifer, and Vishny 1988; Lang and Stultz 1994; Yermack
1996; Himmelberg, Hubbard, and Palia 1999; Daines 2001; Palia 2001; Bhagat and Jefferis
2002; Gompers, Ishii, and Metrick 2003; Bebchuk, Cohen, and Ferrell 2009; Cremers, Litov
and Sepe 2017). We follow Fama and French (1992) and measure 𝑄 as the ratio of market to
book value of assets using financial data from Compustat.
We recognize that 𝑄 is an imperfect measure of value, for example, because it can also
proxy for a firm’s growth opportunities (Smith and Watts 1992; Jung et al. 1996; Parise 2018)
and is subject to potential measurement error (Erickson and Whited 2000, 2012; Bartlett and
Partnoy 2018). Therefore, in robustness tests, we also analyze the implications of PPLs for the
following alternative proxies of (changes in) firm value: excess stock returns in both an annual
regression setting (𝐸𝑥𝑐𝑒𝑠𝑠 𝑅𝑒𝑡𝑢𝑟𝑛) and using a monthly portfolio approach (𝐴𝑙𝑝ℎ𝑎),
measured using either the Fama-French four-factor (Carhart 1997) or three-factor (Fama and
French 1993) models (returns data comes from the CRSP database); return on assets (𝑅𝑂𝐴),
measured as operating income before depreciation and amortization scaled by total assets
(Giroud and Mueller 2010) (data comes from Compustat); and Total Tobin’s Q (𝑇𝑜𝑡𝑎𝑙 𝑄),
which is a modified version of 𝑄 that includes intangible capital in the denominator (Peters and
Taylor 2017) (data comes from the WRDS database: Peters and Taylor Total Q).
Additionally, we include several control variables shown by the prior corporate
governance literature to correlate with 𝑃𝑃𝑖𝑙𝑙 and 𝑄: the natural logarithm of a firm’s total assets
(𝐿𝑛(𝐴𝑠𝑠𝑒𝑡𝑠)) and one plus its number of years in the Compustat database (𝐿𝑛(𝐴𝑔𝑒)), the
Herfindahl-Hirschman index (𝐻𝐻𝐼) based on a firm’s three-digit standard industrial
classification (SIC) code, sales growth (𝑆𝐺), an indicator for whether a firm has negative net
income for the fiscal year (𝐿𝑜𝑠𝑠), debt-to-equity ratio (𝐷𝐸𝑄), firm liquidity (𝐹𝐿𝐼𝑄), capital
expenditures scaled by total assets (𝐶𝐴𝑃𝑋/𝐴𝑠𝑠𝑒𝑡𝑠), research and development expenditures
divided by net sales (𝑅&𝐷/𝑆𝑎𝑙𝑒𝑠), and a firm’s level of institutional ownership (𝐼𝑂). Data for
most of the controls come from Compustat with the exception of 𝐼𝑂, which is obtained from
Thomson Reuters. Further, in our default specifications, we follow Karpoff and Wittry (2018)

9
and include dummies for the other most common forms of state antitakeover statutes: business
combination law (𝐵𝐶𝐿), control share law (𝐶𝑆𝐿), directors’ duties law (𝐷𝐷𝐿), and fair price
law (𝐹𝑃𝐿).
Our final set of sample construction procedures includes: excluding firms with observed
lobbying activity for specific antitakeover statutes (information comes from Karpoff and Wittry
2018, Table III, p. 662); winsorizing all of the continuous variables at the 5% level in both tails
to mitigate the influence of extreme outliers;9 and adjusting dollar values for inflation using
2015 dollars. Internet Appendix A provides variable definitions.
Internet Appendix Table A3 presents summary statistics. In particular, Panel A (Panel B)
of this table reports the mean, standard deviation, 25th, 50th and 75th percentiles, and the total
number of observations for the dependent and independent variables in our dataset over the full
sample 1983–2012 (for the period 1992–2012, which begins and ends three years before and
after the first and last second SW-PPL states adopted their laws). Our main sample – accounting
for the use of lagged controls and dropped singleton groups (Correia 2015)10 – is comprised of
33,371 (26,254) firm-year observations.
The average percentage of firm-years in our sample in which a company has a 𝑃𝑃𝑖𝑙𝑙 in-
place is 39.3% (40.7% for 1992-2012) and has a standard deviation of 0.49. Moreover, the
average 𝑄 for our main sample is 1.9 with a standard deviation of 0.91, while 32.3% of the
observations in our dataset are affected by a 𝑃𝑃𝐿. Overall, the descriptive statistics for our
variables are similar to those in prior, empirical corporate governance studies.
1.2. Identification strategy
We investigate the relevancy of the shadow pill for firm-level pill adoptions and firm value
by exploiting the quasi-natural experiment created by the staggered enactment of PPLs by
firms’ incorporating states. The key assumption underlying this strategy is that the enactment
of these laws provides an exogenous “shock” to the takeover protection of firms incorporated
in the adopting states through the strengthening of the shadow pill. An essential step in
verifying the plausibility of this assumption is to assess the likelihood that states adopting a
PPL is related to certain local characteristics (e.g., state macroeconomic factors) that might
also correlate with individual firms’ pill decisions and value and, thereby, invalidate the
exclusion restriction of our identification strategy.
9 Our findings are unchanged if, instead, we winsorize continuous variables at the 1% or 2.5% level in both tails. 10 Singleton groups (i.e., groups with only one observation) are common in regressions with interacted fixed
effects – which we use in this study. Correia (2015) shows that maintaining singleton groups in linear regressions
with multiple levels of fixed effects can lead to underestimated standard errors and incorrect inference.

10
To examine this concern, we follow a similar approach as Acharya, Baghai, and
Subramanian (2014) and analyze the predictability of PPLs. We estimate a linear probability
model, where we define the dependent variable as the adoption of PPLs, and where potential
predictor variables include state-level firm, macroeconomic, political economy, and corporate
law factors that a priori could determine these laws’ enactment, along with state of
incorporation and year fixed effects. For example, to explore the possibility of a reverse
causality problem, we specify state-year (‘𝑆𝑌’) median across all firms in the sample
incorporated in the state (‘𝐼𝑛𝑐’), both in levels and changes (‘∆’) in the frequency of poison
pills (𝐼𝑛𝑐 𝑆𝑌 𝑃𝑃𝑖𝑙𝑙 and 𝐼𝑛𝑐 𝑆𝑌 ∆ 𝑃𝑃𝑖𝑙𝑙, respectively), and include three separate proxies of
firm value (𝐼𝑛𝑐 𝑆𝑌 𝑄, 𝐼𝑛𝑐 𝑆𝑌 ∆ 𝑄, 𝐼𝑛𝑐 𝑆𝑌 𝑅𝑒𝑡𝑢𝑟𝑛, 𝐼𝑛𝑐 𝑆𝑌 ∆ 𝑅𝑒𝑡𝑢𝑟𝑛, 𝐼𝑛𝑐 𝑆𝑌 𝑅𝑂𝐴, and
𝐼𝑛𝑐 𝑆𝑌 ∆ 𝑅𝑂𝐴). In addition, we include predictors for whether the state has already adopted
another common antitakeover law (𝐵𝐶𝐿, 𝐶𝑆𝐿, 𝐷𝐷𝐿, and 𝐹𝑃𝐿).
Other predictors include the state’s level of M&A activity (𝐼𝑛𝑐 𝑆𝑌 𝑀&𝐴 𝑉𝑜𝑙), GDP per
capita (𝐿𝑛(𝐼𝑛𝑐 𝑆𝑡𝑎𝑡𝑒 𝐺𝐷𝑃𝑃𝐶)) and growth rate (𝐼𝑛𝑐 𝑆𝑡𝑎𝑡𝑒 𝐺𝐷𝑃 𝐺𝑟𝑜𝑤𝑡ℎ), a dummy for
whether the majority of a state’s U.S. House of Representatives belongs to the Republican Party
(% 𝐼𝑛𝑐 𝑆𝑡𝑎𝑡𝑒 𝑅𝑒𝑝𝑢𝑏𝑙𝑖𝑐𝑎𝑛), a state’s level of population (𝐿𝑛(𝐼𝑛𝑐 𝑆𝑡𝑎𝑡𝑒 𝑃𝑜𝑝)), rates of
unemployment (𝐼𝑛𝑐 𝑆𝑡𝑎𝑡𝑒 𝑈𝑛𝑒𝑚𝑝𝑙𝑜𝑦) and state business entry and exit (𝐼𝑛𝑐 𝑆𝑡𝑎𝑡𝑒 𝐸𝑛𝑡𝑟𝑦 and
𝐼𝑛𝑐 𝑆𝑡𝑎𝑡𝑒 𝐸𝑥𝑖𝑡). We include state of incorporation fixed effects to control for unobserved and
time-invariant heterogeneity at the state level, and year fixed effects to account for transitory
U.S.-wide factors (e.g., macroeconomic conditions).
In the main analysis, we focus on SW-PPLs – which are unexplored by prior literature and
form the basis for our key tests – using the sample period 1992 to 2012; in the Internet
Appendix we show the analogous results for FW-PPLs over the time frame 1983 to 1993. The
predictor variables are measured in the year prior to the law’s passage, and we drop states from
the analysis once they adopt a PPL. We standardize the continuous variables to have a mean of
zero and unit variance in order to ease comparisons across coefficients, and estimate standard
errors clustered at the state of incorporation level. Table 2 presents our findings.
The evidence from each of the four columns in Table 2 strongly suggests that state-level
factors are unable to predict the passage of SW-PPLs. The coefficients pertaining to a states’
median levels and changes in poison pills, Tobin’s Q, stock returns, and ROA are separately
(Columns (1) to (3)) and collectively (Column (4)) insignificantly different from zero, so that
reverse causality is unlikely to be a concern for our identification. Likewise, the adoption of
any of the other antitakeover laws do not predict SW-PPLs (unlike in the first wave, see Internet
11
Appendix Table A4). The coefficients on 𝐿𝑛(𝐼𝑛𝑐 𝑆𝑡𝑎𝑡𝑒 𝐺𝐷𝑃𝑃𝐶) and all other state-level
macroeconomic and political factors are always statistically insignificant, indicating that the
passage of SW-PPLs is not driven by local economic conditions (again in contrast to FW-PPL
adoptions). We conclude that we do not find any evidence inconsistent with the assumption
that the adoption of SW-PPLs provides an exogenous shock to individual firms’ takeover
protection.
1.3. Empirical specification
Our baseline investigation of the implications of the shadow pill employs a difference-in-
differences (DD) regression model, comparing changes in either poison pill status or Tobin’s
Q amongst firms incorporated in states with PPLs relative to those of firms incorporated
elsewhere.
Specifically, we estimate
𝑦𝑖𝑗𝑙𝑠𝑡 = 𝛽𝑃𝑃𝐿𝑠𝑡 + 𝛼′𝐗𝑖𝑗𝑠𝑡 + 𝛾𝑖 + 𝜔𝑙𝑡 + 𝜆𝑗𝑡 + 𝜀𝑖𝑗𝑙𝑠𝑡 (1)
where 𝑦 denotes either 𝑃𝑃𝑖𝑙𝑙 or 𝑄 of firm 𝑖, operating in industry 𝑗, headquartered in U.S.
Census division 𝑙, incorporated in state 𝑠, in year 𝑡. Our main independent variable, 𝑃𝑃𝐿, is an
indicator for whether a firm’s incorporation state 𝑠 has adopted a PPL as of the current year 𝑡,
while X represents a vector of controls – outlined in Section 1.1 – including indicators for the
other most common antitakeover laws. As a robustness check, some of our tests exclude firm-
level controls since most of these variables are endogenous and likely also affected by the laws
and could, therefore, bias our point estimates (Angrist and Pischke 2009; Roberts and Whited
2013). We include firm fixed effects, 𝛾, to control for unobserved, time-invariant heterogeneity
within firms, and U.S. Census division-by-year, 𝜔, and industry-by-year interacted fixed
effects, 𝜆, to control for unobserved, time-varying heterogeneity within divisions of location
and industries, respectively. Finally, we cluster our standard errors by states of incorporation.
The U.S. Census division dummies are defined using the U.S. Census Bureau’s nine
geographical subdivisions (New England, Middle Atlantic, East North Central, West North
Central, South Atlantic, East South Central, West South Central, Mountain, and Pacific).
Importantly, this specification ensures that our inferences are robust to many sources of
unobserved, time-variant heterogeneity that could bias our estimates, including local
macroeconomic factors which are likely shared by states within close geographic proximity
(Heider and Ljungqvist 2015). We assign a firm’s division-of-location based on its (historical)
state of headquarters, since this is generally where its major plants and operations are located
(Henderson and Ono 2008).

12
The two-digit SIC industry-by-year fixed effects control for potential unobserved, time-
varying industry trends. Prior work shows that merger waves tend to occur within industries
(e.g., Mitchell and Mulherin 1996; Maksimovic and Phillips 2001; Rhodes‐Kropf, Robinson,
and Viswanathan 2005). Thus, if the staggered adoption of PPLs across states is correlated with
M&A activity – though Table 2 suggests this is not the case – and potentially correlated with
other unobservable characteristics that also impact firms’ actual pill policy and Tobin’s Q, our
use of industry-by-year fixed effects should account for this source of confounding variation.
The division-by-year fixed effects should also control for some of this variation since most
industries cluster by geography (Ellison and Glaeser 1997, 1999; Ellison, Glaeser and Kerr
2010).
A common alternative strategy developed in the BCL literature to deal with local sources
of unobserved, confounding variation is to use fixed effects at the level of headquarter states
rather than at the level of U.S. Census divisions (Gormley and Matsa 2014, 2016). We confirm
that our results are robust to using this approach (see Table 5). A limitation of this approach,
however, is that it relies on the assumption that most firms are incorporated and headquartered
in different states. For example, Gormley and Matsa (2016, p. 437) “…are able to obtain
estimates for the BC laws’ effect even after including state-by-year fixed effects because more
than 60% of [their sample] firms are incorporated and located in different states.” In contrast,
only 28% of the firms in our sample that are incorporated in a PPL-adopting state are
headquartered somewhere else (similarly, fewer than 29% of the non-Delaware-incorporated
firms that are incorporated in states without these laws are headquartered outside of their
incorporation state). In contrast, more than 99% of Delaware-incorporated firms are
headquartered in a different state. Therefore, the use of headquarter-state-by-year fixed effects
in our setting leaves only a relatively small amount of variation to estimate the coefficient on
𝑃𝑃𝐿. This limits our tests’ statistical power and restricts our comparisons to almost exclusively
Delaware firms. This latter point is especially relevant as it increases the likelihood that some
other confounding events in Delaware (e.g., other poison pill case law) might bias our point
estimates. Therefore, we use U.S. Census division-by-year fixed effects as an alternative
approach to address these econometric issues.
2. First Wave (FW-) PPLs in the Shadow of Delaware
The landmark 1985 decision of the Delaware Supreme Court in Moran v. Household
International affirmed the validity of the poison pill for firms incorporated in the state of
Delaware and promoted the widespread adoption of the pill for firms incorporated in both

13
Delaware and outside of the state (Helman and Junewicz 1986; Fleischer, Hazard, and Klipper
1988) – see our Figure 1. Law and finance scholars, however, tend to describe the legal status
of the pill for firms incorporated in states other than Delaware as uncertain until these states
adopted PPLs that validated the use of the pill (Catan and Kahan 2016; Cain, McKeon,
Solomon 2017; Karpoff and Wittry 2018). The argument usually given to defend the uncertain
status of the poison pill for firms incorporated outside Delaware before the enactment of PPLs
is that state courts’ decisions invalidated the use of the poison pill in the states of New York,
New Jersey, Georgia, Wisconsin, Colorado, Virginia, and Indiana between 1986 and 1989
(Catan and Kahan 2016; Cain, McKeon, Solomon 2017).11
Yet the pervasive authority of Delaware judicial decisions over non-Delaware corporations
(e.g., Ryngaert 1988; Cremers and Ferrell 2014; Dammann 2019) points to an opposite
conjecture; namely, that the validity of the poison pill was fairly certain in the immediate
aftermath of Moran for both firms incorporated in Delaware and outside of the state. Indeed,
as evidenced by Figure 1, the widespread adoption of visible poison pills, even for non-
Delaware firms, in the years immediately following Moran, supports the view that this ruling
was understood to apply to non-Delaware firms as well.12
In order to test this conjecture, the first four columns of Table 3 regress a poison pill
indicator variable (𝑃𝑃𝑖𝑙𝑙) on dummies for whether a firm’s state of incorporation adopts an
FW-PPL (𝐹𝑊 𝑃𝑃𝐿), or eventually adopts one of these laws during the SW
(𝐸𝑣𝑒𝑛𝑡𝑢𝑎𝑙 𝑆𝑊 𝑃𝑃𝐿), over either the “Entire FW-period” of 1983 to 1993 (Columns (1)–(2))
or the “Post-Moran” period of 1986 to 1993 (Columns (3)–(4)). Following prior studies (e.g.,
Dowen, Johnson, and Jensen 1994; Comment and Schwert 1995; Heron and Lie 2006, 2015;
Cremers and Ferrell 2014), we additionally include a number of firm-level controls:
𝐿𝑛(𝐴𝑠𝑠𝑒𝑡𝑠), 𝐿𝑛(𝐴𝑔𝑒), 𝐻𝐻𝐼, 𝑆𝐺, 𝐿𝑜𝑠𝑠, 𝐷𝐸𝑄, 𝐹𝐿𝐼𝑄, 𝐶𝐴𝑃𝑋/𝐴𝑠𝑠𝑒𝑡𝑠, 𝑅&𝐷/𝑆𝑎𝑙𝑒𝑠, and 𝐼𝑂, as
well as dummies for other common antitakeover laws: 𝐵𝐶𝐿, 𝐶𝑆𝐿, 𝐷𝐷𝐿, and 𝐹𝑃𝐿. Further, we
specify firm fixed effects and interacted fixed effects – U.S. Census division-by-year and two-
digit SIC industry-by-year. Lastly, the continuous independent variables are standardized to
have a mean of zero and variance of one, and the standard errors are adjusted for clustering at
the state of incorporation level.
11 The uncertainty created by these decisions, however, did not last long, as each of these states passed a PPL
shortly after the related invalidating court decision. For example, while the New York Supreme court invalidated
the use of the pill in June 1988 (in Bank of New York Co. v. Irving Bank Corp.), the state of New York passed a
PPL in December of the same year. 12 This interpretation also finds support in the evidence that court decisions in states other than Delaware
frequently referenced Moran in their own poison pill rulings.
14
Consistent with our argument that Moran validated the use of the pill for both Delaware
and non-Delaware incorporated firms at least until November 1988, we document that the point
estimates on 𝐹𝑊 𝑃𝑃𝐿 are always statistically insignificant in Columns (1)–(4) of Table 3.
Furthermore, when we consider the use of the pill by firms incorporated in states that eventually
adopted PPLs during the SW-period (𝐸𝑣𝑒𝑛𝑡𝑢𝑎𝑙𝑙𝑦 𝑆𝑊 𝑃𝑃𝐿), we show that these firms are
equally likely to adopt pills as firms incorporated in Delaware and in other non-Delaware states
that never enacted a PPL. Consistent with prior work analyzing the determinants of pill
adoptions over a similar timeframe (see, e.g., Comment and Schwert 1995, who use the sample
period 1977–1991), we also find that firms larger in size (𝐿𝑛(𝐴𝑠𝑠𝑒𝑡𝑠)) and with higher
liquidity (𝐹𝐿𝐼𝑄) are more likely to adopt a poison pill, while firms that have higher sales growth
(𝑆𝐺) are less inclined to employ the use of a pill. Further consistent with this work, we
document that the coefficient on 𝑄 (𝐷𝐸𝑄) is positive (negative), but statistically insignificant.
Under the view that Delaware common law shapes corporate law in all other states, we
further conjecture that Delaware decisions that followed Moran could have mattered more for
the uncertainty of the pill in other states than earlier state courts’ decisions in those same states.
In particular, in the fall of 1988, the Delaware courts issued two decisions – City Capital
Associates v. Interco Inc. and Grand Metropolitan PLC v. Pillsbury Co. – that unexpectedly
increased uncertainty about the use of the poison pill, although mostly in regard to the
redemption of the pill, rather than its validity per se. In both of these decisions, the Delaware
court halted the continued use of a visible poison pill that prevented an unsolicited tender offer,
which prompted considerable comment at the time and even induced some corporate lawyers
to recommend firms to move out of Delaware (Fleischer and Sussman 2013).
In line with this interpretation, Figure 1 indicates that the average percentage of “All
Firms” in our sample with a pill in-place began to decrease sharply after 1988. However, this
figure also suggests that the cohort of firms least affected by the Interco and Pillsbury decisions
were those incorporated in states with an explicit right to adopt poison pills via their states’
previously enacted PPLs (i.e., “FW PPL Firms”). Further supporting this view, the last two
columns of Table 3 show that firms incorporated in states with FW-PPLs were 4.6% to 7.6%
more likely to have a pill in-place in the “Post-Interco & Pillsbury” period (1989–1993),
relative to division rivals sharing similar industry trends, but incorporated elsewhere.13
Meanwhile, the results in Column (6) indicate that firms incorporated in states that eventually
13 We additionally show that FW-PPLs also lead to value increases in the post-Interco and Pillsbury period (Panel
B of Internet Appendix Table A11). Yet, our estimates in these tests are much noisier as they are exposed to
confounding variation from prior pill-related court rulings (e.g., Moran, Interco, Pillsbury, and Paramount).

15
adopt an SW-PPL, but at the time of the analysis are not covered by a law, are 26.2% less likely
to employ the use of a poison pill after 1988. This could plausibly explain why most states (27-
out-of-the-35) decided to adopt PPLs post-November of 1988, as the viability of the poison pill
as a strong defense was no longer assured after Interco and Pillsbury.14
Considering this legal context, and consistent with Karpoff and Wittry’s argument that
“the institutional, political-economy and historical context in which a law is enacted has a large
effect on the appropriate specification and interpretation of tests that use legal changes for
identification” (Karpoff and Wittry 2018, page 658), our analysis focuses on SW-PPLs that
were passed during the 1995 to 2009 period. From an identification perspective, doing so
ensures that we have a relatively stable pre-treatment period – i.e., unconfounded by the
passage of Delaware court decisions related to the use of the pill – and, thus, mitigates the
likelihood of measurement error that could bias our estimates.
3. Main Results
Our main research questions are how a “strengthened” shadow pill – as proxied by the
adoption of a PPL – impacts actual pill policy and firm value. To address these questions, we
first analyze the relation between PPLs – focusing on SW-PPLs for the reasons explained above
– and firm decisions to adopt and maintain (𝑃𝑃𝑖𝑙𝑙) poison pills, as well as the laws’ effects on
new pill adoptions (𝑁𝑒𝑤 𝑃𝑃𝑖𝑙𝑙) and existing pill redemptions (𝐿𝑛(𝑃𝑃𝑖𝑙𝑙 𝐷𝑢𝑟𝑎𝑡𝑖𝑜𝑛)). Second,
we estimate the value implications of PPLs using Tobin’s Q (𝑄) regressions. Third and last,
we show that our findings related to Tobin’s Q are robust to additional tests, such as a matched
sample analysis, and to using alternative value measures.
3.1. Shadow pills and actual pill policy
We begin our empirical analysis of PPLs by examining their relationship with firm-level
poison pills. We hypothesize that there are at least two potentially competing effects governing
a firm’s decision to implement a pill when its shadow pill is strengthened by one of these laws.
On the one hand, since PPLs sanction a firm’s right to adopt a visible poison pill, we might
expect that firms incorporated in PPL-adopting states will have them in-place more frequently
14 The Interco and Pillsbury decisions were later reversed by the 1989 Delaware court decision in Paramount
Communications, Inc. v. Time Inc., which some commentators read as granting the board an unconstrained power
“to just say no” to unsolicited tender offers (Bebchuk, Coates, Subramanian 2002). Several other commentators,
however, maintain that Delaware case law on pill redemption cases remains in an unsettled state and tends to
depend on specific circumstances that have limited general applicability for firms incorporated outside of
Delaware (Fleischer and Sussman 2013). We interpret the back-and-forth rulings in Delaware on the validity and
redemption of poison pills as a clear indication that firms outside of the state are more likely to rely on their own
incorporating states’ statutory and case law in the ensuing period.
16
(i.e., a “validation effect”). On the other hand, if visible poison pills do not provide incremental
protection beyond the shadow pill, we might anticipate that firms do not alter their use of the
pill or even decrease their reliance on them (i.e., a “substitution effect”). We start by testing
these predictions in Panel A of Table 4, by regressing 𝑃𝑃𝑖𝑙𝑙 on 𝑃𝑃𝐿 plus other controls and
firm, division-by-year, and industry-by-year fixed effects.
In Column (1), without specifying firm-level controls, we find marginally significant
evidence in favor of the validation effect. The point estimate on 𝑃𝑃𝐿 suggests that firms
incorporated in a PPL-adopting state are 5.8% more likely to put in place and maintain a visible
pill (𝑃𝑃𝑖𝑙𝑙), relative to firms operating in the same division and sharing similar industry trends,
but incorporated in a non-PPL passing state. This finding is consistent with the general,
unconditional, trend for “SW PPL Firms” as Figure 1 shows an upward movement in this
cohort’s use of 𝑃𝑃𝑖𝑙𝑙 beginning in 1995 and continuing for the next decade. However, when
we expand the model to control for other firm-level characteristics in Column (2), the
coefficient on 𝑃𝑃𝐿 becomes insignificantly different from zero.
Further, in both columns, we also report the estimates on pre-determined levels of 𝑄 and
find strong evidence of a potential reverse causality problem as the coefficients indicate that
lower-valued firms – and thus firms more at risk of takeover – are 3% to 5% more likely to
have a pill in-place, consistent with Cremers and Ferrell (2014). We then supplement this
finding by estimating regressions of 𝑄 on “relative year” dummy variables that indicate the
number of years before, and after, the year in which a firm adopts a poison pill, along with
firm, division-by-year, and industry-by-year fixed effects (following a similar approach in
Catan 2019). The relative year dummies include indicators for up to 10 years before and after
a pill’s adoption, and we estimate robust standard errors adjusted for clustering by firm since
both of these variables are measured at this level. The resulting point estimates and 95%
confidence intervals of the relative year dummies are plotted in Internet Appendix Figure A1.
The figure provides suggestive evidence that firm value significantly declines in the five years
before a firm decides to deploy a poison pill. Meanwhile, the association with Tobin’s Q is
insignificant in the year of and each of the five years after the pill’s adoption. This finding thus
supports the view that the negative association between the adoption of a visible poison pill
and lower firm value reported in prior studies is likely attributable to reverse causality (Cremers
and Ferrell 2014; Catan 2019).
Motivated by these results, we consider the heterogeneous value implications of PPLs for
firms with different levels of Tobin’s Q in the last two columns of Panel A, Table 4.

17
Specifically, we create indicators for whether a firm’s level of 𝑄 falls in the lowest
(𝑄(𝐿𝑜𝑤𝑒𝑠𝑡)), middle-to-lowest (𝑄(𝐿𝑜𝑤)), middle-to-highest (𝑄(𝐻𝑖𝑔ℎ)), or highest
(𝑄(𝐻𝑖𝑔ℎ𝑒𝑠𝑡)) part of its quartile distribution in our sample, and interact these dummies with
𝑃𝑃𝐿. Moving to our fully specified model in Column (4), we document evidence that PPLs
validate the adoption and maintenance of 𝑃𝑃𝑖𝑙𝑙 for firms with the lowest values of Tobin’s Q
– and thus, most likely at risk of takeover – in our sample as these firms are 5.3% more likely
to have a poison pill relative to division and industry rivals in non-PPL enacting states.
In Panel B of Table 4, we then decompose 𝑃𝑃𝑖𝑙𝑙 into 𝑁𝑒𝑤 𝑃𝑃𝑖𝑙𝑙 and
𝐿𝑛(𝑃𝑃𝑖𝑙𝑙 𝐷𝑢𝑟𝑎𝑡𝑖𝑜𝑛). The advantage of this approach is that it allows us to better determine
how PPLs affect adoptions of new pills relative to the maintenance of existing pills. The first
two columns specify 𝑁𝑒𝑤 𝑃𝑃𝑖𝑙𝑙 as the dependent variable and include our full set of controls
and fixed effects. We find that the average firm incorporated in a PPL-adopting state does not
alter their frequency of new poison pill adoptions (Column (1)); but, rather it is only firms with
Tobin’s Q in the lowest quartile of its distribution that significantly increase their use of new
pills (Column (2)) – at a rate of 8.4%. We then regress 𝐿𝑛(𝑃𝑃𝑖𝑙𝑙 𝐷𝑢𝑟𝑎𝑡𝑖𝑜𝑛) on the same set
of independent variables and find much stronger evidence that PPL affected firms increase
their maintenance of existing pills. For instance, in Column (4), we document evidence that
only firms with levels of 𝑄 in the highest quartile of its distribution (𝑄(𝐻𝑖𝑔ℎ𝑒𝑠𝑡))) are
unaffected by the laws, while the other three groups (𝑄(𝐿𝑜𝑤𝑒𝑠𝑡), 𝑄(𝐿𝑜𝑤), and 𝑄(𝐻𝑖𝑔ℎ))
significantly increase the duration of their pills in-place.15
3.2. Shadow pills and long-term firm value
In this section, we investigate the value implications of a strengthened right to adopt a
poison pill (i.e., “shadow pill”) by focusing on Tobin’s Q as our primary measure of firm value.
We then address the concern that a potential selection bias (e.g., reincorporation) might drive
our Q results by constructing a matched sample that restricts our tests to firms that were
incorporated in PPL-adopting states at least one year before its passage. We then check the
robustness of our findings on Tobin’s Q in both the full and matched samples by examining
the effect of PPLs on alternative measures of firm value such as stock returns and profitability.
15 With respect to controls, firms that are larger in size (𝐿𝑛(𝐴𝑠𝑠𝑒𝑡𝑠)), older (𝐿𝑛(𝐴𝑔𝑒)), have higher debt-to-equity
ratios (𝐷𝐸𝑄) and levels of institutional ownership (𝐼𝑂) are more likely to adopt a pill, while firms in more
concentrated industries (𝐻𝐻𝐼), with greater sales growth (𝑆𝐺), liquidity (𝐹𝐿𝐼𝑄) and capital expenditures
(𝐶𝐴𝑃𝑋/𝐴𝑠𝑠𝑒𝑡𝑠) are less inclined to use poison pills. The correlations we find between these standard firm-level
controls and 𝑃𝑃𝑖𝑙𝑙 are mostly consistent with prior literature (e.g., Dowen, Johnson, and Jensen 1994; Comment
and Schwert 1995; Heron and Lie 2006, 2015; Cremers and Ferrell 2014).

18
Finally, we briefly outline additional robustness tests that we include in a supplemental Internet
Appendix.
3.2.1. Full sample. Table 5 reports the DD estimates of the impact of the adoption of PPLs
by state legislatures – as a proxy for the strengthening of the shadow pill – on the Tobin’s Q of
firms in enacting states over the period 1992 to 2012. Each of the five columns employ 𝑄 as
the dependent variable and include controls for the other four antitakeover laws (𝐵𝐶𝐿, 𝐶𝑆𝐿,
𝐷𝐷𝐿, and 𝐹𝑃𝐿). Columns (1)–(3) specify our default set of fixed effects – firm, division-by-
year, and industry-by-year – whereas, the last two columns check the robustness of our results
to controlling for local “shocks” using regions or headquarter states instead of divisions. The
last four columns include the full set of firm-level control variables (𝑃𝑃𝑖𝑙𝑙, 𝐿𝑛(𝐴𝑠𝑠𝑒𝑡𝑠),
𝐿𝑛(𝐴𝑔𝑒), 𝐻𝐻𝐼, 𝑆𝐺, 𝐿𝑜𝑠𝑠, 𝐷𝐸𝑄, 𝐹𝐿𝐼𝑄, 𝐶𝐴𝑃𝑋/𝐴𝑠𝑠𝑒𝑡𝑠, 𝑅&𝐷/𝑆𝑎𝑙𝑒𝑠, and 𝐼𝑂), and the standard
errors are adjusted for clustering at the state of incorporation level.
The adoption of PPLs has a positive and statistically significant impact on the Tobin’s Q
of firms in enacting states. The results in the first two columns provide strong support for the
key implication of the view that a strengthened shadow pill is value-enhancing for
shareholders. In Column (1), without including any potentially endogenous firm-level controls
(besides 𝑃𝑃𝑖𝑙𝑙 which correlates with both 𝑃𝑃𝐿 and 𝑄), we find that firms incorporated in a
state with a PPL experience an increase in 𝑄 of 10.5 percentage points relative to firms
incorporated elsewhere but operating in the same U.S. Census Division and sharing a similar
industry trend. This represents an economically significant increase of 5.7% (=0.105/1.855)
relative to the sample mean’s 𝑄. Further, the estimated coefficient on 𝑃𝑃𝐿 in Column (2)
confirms that the passage of these laws are valuable for shareholders, even after including
controls for company characteristics, as firms incorporated in these states have Tobin’s Qs that
are 9.5 percentage points higher than those of division and industry rivals incorporated in non-
PPL adopting states. This represents an economically significant 5.1% increase relative to the
sample mean for 𝑄 of 1.855.
In addition, we show that our baseline point estimate in Column (2) is stable to the
omission of any one SW-PPL-passing state. We present evidence for this stability in Internet
Appendix Figure 2. In particular, on the y-axis we plot each of the coefficients we estimate
from separate regressions that exclude SW-PPL states one-by-one – excluded state shown on
the x-axis – along with their corresponding 95% confidence intervals. The results indicate that
these coefficients compare favorably to our reference estimate, with magnitudes that fall

19
between 0.073 and 0.111 and t-statistics ranging from 2.58 to 3.78. Hence, we do not find
evidence that an unobserved, state-specific factor (or outliers) drive our key result.
Meanwhile, each of the columns in Table 5 confirm the prior literature, finding a negative
correlation between actual firm-level pills and Tobin’s Q (e.g., Gompers, Ishii, and Metrick
2003; Bebchuk, Cohen and Ferrell 2009; Cremers and Ferrell 2014). However, in light of our
results in Table 4 and Internet Appendix Figure A1, the negative association between visible
poison pills and Tobin’s Q seems plausibly endogenous and due to reverse causality. In Column
(3), we then explore the possibility that the positive effect of PPLs is dependent on firms having
poison pills in-place. Yet, when we regress 𝑄 on the interaction of 𝑃𝑃𝐿 and 𝑃𝑃𝑖𝑙𝑙 we find that
the point estimate (=0.011) on the interacted variables is both economically and statistically (t-
stat=0.31) insignificant, while the standalone coefficient (=0.091) on 𝑃𝑃𝐿 remains strongly
significant at the 1% level (t-stat=2.76), which suggests that shadow pills create long-term
value for shareholders independent of actual pills.16
The last two columns of Table 5 serve as robustness checks to our main specification,
which includes division-by-year fixed effects by alternatively employing the use of U.S.
Census Regions (i.e., Northeast, Midwest, South, and West) (as in Autor, Donohue, and
Schwab 2006; Acharya, Baghai, and Subramanian 2014) or headquarter states (as in Gormley
and Matsa 2014, 2016; Karpoff and Wittry 2018) to control for potential local confounding
factors. Reassuringly, our key inference on the value relevance of the shadow pill remains
unchanged using either of these alternative specifications. For example, the fully specified
model with state-by-year fixed effects in Column (5) indicates that firms incorporated in PPL
adopting states still experience increases in 𝑄 of 4.5% (=0.083/1.855) relative to its sample
mean, when compared with firms located in the same headquarter state and sharing similar
industry trends, but incorporated elsewhere. Still, we prefer the use of divisions as they provide
a more granular geographical measurement than regions and are not susceptible to the
econometric issues engendered by the use of headquarter states that we outlined in Section 1.3.
16 Internet Appendix Table A5 decomposes 𝑃𝑃𝑖𝑙𝑙 into 𝑁𝑒𝑤 𝑃𝑃𝑖𝑙𝑙 and 𝐿𝑛(𝑃𝑃𝑖𝑙𝑙 𝐷𝑢𝑟𝑎𝑡𝑖𝑜𝑛) and tests whether
PPLs differentially affect firms that adopt and maintain pills either before or after their law’s enactment. Our
results indicate the shadow pill always remains positive and significantly related to 𝑄, and the only instance in
which firm-level pill decisions might affect Q is when a company adopts a new poison pill after its incorporation
state passes a PPL (point estimate=-0.214 and t-stat=-2.56). This finding may imply: (i) shadow pills provide
sufficient protection and that actual adoption only serves to entrench managers (Manne 1965; Cary 1969;
Easterbrook and Fischel 1991; Bebchuk, Coates, and Subramanian 2002; Bebchuk, Cohen, and Ferrell 2009), or
(ii) as documented in Table 4 and Internet Appendix Figure A1, the decision to adopt a pill is endogenously
correlated with 𝑄 and the negative association is due to reverse causality (Cremers and Ferrell 2014; Catan 2019).

20
Next, we move to study the timing of changes in Tobin’s Q relative to the timing of PPL
adoptions in order to check the validity of our DD estimate on 𝑃𝑃𝐿. As underscored in Angrist
and Pischke (2009) and Roberts and Whited (2013), the fundamental assumption of this
identification strategy is that of parallel trends in the outcome variable (i.e., 𝑄) between firms
“treated” by PPLs and those “un-treated” by the laws in the period before their passage.
To test the parallel trends assumption, we follow Acharya, Baghai, and Subramanian
(2014) and Gormley and Matsa (2016) and create Figure 2 by regressing our measure of
Tobin’s Q on dummy variables that indicate a firm’s incorporating state’s relative year to PPL
enactment, along with firm, division-by-year, and industry-by-year fixed effects, and controls
for the other antitakeover laws. We then plot the point estimates on the relative year indicators
on the y-axis, and indicators for each year in a plus or minus four-year window surrounding
PPL adoption on the x-axis. We also plot a 95% confidence interval for the coefficient
estimates, where the interval is based on robust standard errors with state of incorporation
clustering. Consistent with the parallel trends assumption, we find that firms incorporated in
PPL adopting states and non-PPL adopting states have insignificantly different levels of
Tobin’s Q in the four-year period before the laws are passed, but that the difference in 𝑄 starts
to broaden in the year of adoption and becomes statistically different in the one- through four-
years post-adoption.
3.2.2. Matched sample. We now turn our attention to addressing the concern that a selection
effect (e.g., reincorporation) might bias our inference that PPLs positively impact the Tobin’s
Q of firms incorporated in enacting states. In particular, since using a DD design with a pooled
panel entails considering firms that reincorporate or first-time incorporate into a PPL-adopting
state, a strengthened shadow pill is non-random for these firms.
To account for this potential bias, we construct a propensity score-matched sample
whereby we match firms in each of the SW-PPL adopting states in the year before passage (t-
1) to a pool of firms incorporated in states without one of these laws in at least the three years
following its matched counterparts’ adoption year. We define firms incorporated in states that
are one-year away from PPL enactment as “treated” firms (𝑇𝑟𝑒𝑎𝑡𝑒𝑑), and their potential
matches as “control” firms. The basic idea behind this research design is that by matching firms
in the year prior to treatment, we ensure that our matched sample is restricted to firms that were
incorporated in states before the PPLs were passed, disallowing the possibility that firms
selected into treatment (i.e., a stronger shadow pill) via (re)incorporation.

21
Our matching procedure requires that treated and control firms are identical on firm-level
poison pill status, and, whenever possible that they headquarter in the same U.S. Census
Division and operate in the same two-digit SIC industry. When it is infeasible to match exactly
on divisions (two-digit SIC industries), we allow matches to the next closest division (one-digit
SIC industry). Additionally, we construct propensity scores for matching from 𝑄 and
𝑇𝑜𝑡𝑎𝑙 𝐴𝑠𝑠𝑒𝑡𝑠. We present the summary statistics for the two groups of firms in the year before
treatment in Panel A of Table 6.
To begin, each of the matching variables is statistically indifferent between treated and
control firms. For instance, the 𝑄 of treated firms in year t-1 is 1.744 with a standard deviation
of 0.986, while the 𝑄 of the control firms is 1.814 with a standard deviation of 0.919. This
negligible 0.071 absolute difference is statistically indifferent (t-stat=0.85). Furthermore, the
firm-level poison pill dummy is matched exactly between the two groups, while the SIC2 and
Divisions dummies are quite similar between the 264 treated (means: 𝑆𝐼𝐶2=43.6 and
𝐷𝑖𝑣𝑖𝑠𝑖𝑜𝑛𝑠=5.5) and 264 control (means: 𝑆𝐼𝐶2=43.7 and 𝐷𝑖𝑣𝑖𝑠𝑖𝑜𝑛𝑠=5.7) firms. Lastly,
Internet Appendix Table A6 shows that the other (non-explicitly matched) firm-level controls
are also comparable between the two groups, indicating that they are similar on observable
characteristics in the year before treatment.
Shifting down to Panel B of Table 6, we present point estimates from regressions of
Tobin’s Q on a 𝑇𝑟𝑒𝑎𝑡𝑒𝑑 × 𝑃𝑜𝑠𝑡 (we use this variable name instead of 𝑃𝑃𝐿 in the matched
sample) interaction term over a t±3 estimation window. The first two columns specify firm,
division-by-year, and industry-by-year fixed effects to ensure our post-treatment comparisons
remain between the t-1 matched pairs, while the last column only uses firm and year fixed
effects for robustness. Further, each of the three columns include dummies for the other
antitakeover laws and the last two append our firm-level controls. Focusing on Column (2), we
find that our matched treated firms experience significant increases in their 𝑄 of 9.8 percentage
points when compared to the control group, which translates to an economically significant
5.4% increase relative to the matched sample mean for 𝑄 of 1.831. Further, the coefficient on
𝑃𝑃𝑖𝑙𝑙 is now statistically insignificant since we exactly matched treated and controls firms on
this variable.
Importantly, the coefficient on 𝑇𝑟𝑒𝑎𝑡𝑒𝑑 × 𝑃𝑜𝑠𝑡 in the matched sample (point
estimate=0.098 and t-stat=2.13) and on 𝑃𝑃𝐿 in the full sample (point estimate=0.091 and t-
stat=2.76) are quite similar in both economic magnitude and statistical significance. These

22
results are, thus, indicative that a selection effect (e.g., reincorporation) does not drive our main
findings in the full sample.
3.2.3. Alternative value measures. Having demonstrated the robustness of the positive
relationship between PPLs and Tobin’s Q, we now investigate the reliability of 𝑄 as a proxy
for firm value by considering alternative value measures. We start this analysis in Panel A of
Table 7, by employing the same baseline specifications we use in the full (Table 5) and matched
(Table 6) samples, but in these models, we replace Tobin’s Q as the dependent variable with
the following three measures. The first alternate proxy is 𝐸𝑥𝑐𝑒𝑠𝑠 𝑅𝑒𝑡𝑢𝑟𝑛 (similar to Cohen
and Wang 2013), estimated as the residual from regressions of annual stock returns on the
Fama-French four (i.e., Market, SMB, HML, and MOM) factors (Fama and French 1993;
Carhart 1997). Second, we consider the profitability measure, return on assets (𝑅𝑂𝐴), which
we define as operating income before depreciation and amortization divided by the total book
value of assets (Giroud and Mueller 2010). The third alternative value measure, Total Tobin’s
Q (𝑇𝑜𝑡𝑎𝑙 𝑄), is proposed by Peters and Taylor (2017) and modifies 𝑄 by explicitly accounting
for intangible capital in the firm’s replacement cost of total capital.
The ultimate takeaways from the six columns in Panel A of Table 7 are that a strengthened
shadow pill is valuable for shareholders and that Tobin’s Q is a consistent proxy of this value.
That is, irrespective of whether we employ 𝐸𝑥𝑐𝑒𝑠𝑠 𝑅𝑒𝑡𝑢𝑟𝑛, 𝑅𝑂𝐴, or 𝑇𝑜𝑡𝑎𝑙 𝑄 as dependent
variables, and whether we use our full sample or a matched sample, our inferences remain
unchanged: PPLs are positively and significantly related to accepted empirical proxies of firm
value. For example, Column (1) suggests that shareholders of firms incorporated in states with
PPLs experience a significant 3.2 percentage point increase in the 𝐸𝑥𝑐𝑒𝑠𝑠 𝑅𝑒𝑡𝑢𝑟𝑛 on their
shares, relative to division and industry rivals incorporated in a non-PPL enacting state. Moving
over to Columns (3) and (4), we examine the effect of SW-PPLs (i.e., post-1995) on 𝑅𝑂𝐴. We
find that 𝑅𝑂𝐴 improves for the subset of firms incorporated in states that strengthen the right
to adopt a poison pill by 4.5% (=0.006/0.132) in the full sample (Column 3) and 8%
(0.010/0.125) in the matched sample (Column 4) relative to its respective means.
As a final robustness check of our findings related to Tobin’s Q, we consider an alternative
research design and employ a monthly portfolio return approach, which can be viewed as a
long-term stock event study, consistent with the prior corporate governance literature
(Gompers, Ishii, and Metrick 2003; Bebchuk, Cohen, and Ferrell 2009; Cremers and Ferrell
2014; Cremers, Litov, and Sepe 2017). In this approach, we focus on our matched sample of
firms and construct long (short) portfolios of stocks from treated (control) firms around the

23
time their (matched counterparts’) state of incorporation adopts a PPL. The central premise
underlying this framework is that if a strengthened shadow pill matters for a firm’s long-term
performance, but its impact is not immediately incorporated into stock prices because of, for
example, inefficiencies in information across states and time, then the realized returns for a
treated firm would be systematically higher than those for a control firm.
Panel B of Table 7 (Internet Appendix Table A7) tests this conjecture and reports our
findings that the long-short portfolios of treated and control firms result in positive and
significant 𝐴𝑙𝑝ℎ𝑎 over “6m36” and “12m36” holding periods, using a value-weighted (an
equally-weighted) market factor, and estimating the risk-adjusted, excess returns with either
the four-factor (Carhart 1997), three-factor (Fama and French 1993), or market-factor (Treynor
1962; Sharpe 1964; Lintner 1965; Mossin 1966) models. For instance, when we buy stocks of
treated firms and short stocks of control firms 6-months or 12-months before the adoption date
of their (matched firms’) respective PPL and continue such strategy until 36-months after
(“6m36” or “12m36”), we find an annualized abnormal return of 11.9% using the four-factor
model. These magnitudes are economically significant and comparable to the 13% increase in
𝐴𝑙𝑝ℎ𝑎 following the staggering up and (de)staggering of a board documented by Cremers,
Litov and Sepe (2017).
3.2.4. Additional robustness. We conduct several additional robustness tests of our main
finding that shadow pills are value-enhancing for shareholders. However, to conserve space,
we include these supplemental analyses in the Internet Appendix (Tables A8 to A14). As a
roadmap for interested readers, we include a brief synopsis of these tests below:
(i) State-by-year fixed effects.
a. Full sample. In Column (5) of Table 5, we verify the strength of our main finding to the
inclusion of state-by-year fixed effects. However, following Gormley and Matsa (2016), we
take this analysis a step further and decompose the effect of PPLs into cohorts of firms
incorporated and headquartered in the same state (𝑆𝑎𝑚𝑒 𝐼𝑛𝑐-𝐻𝑄 𝑆𝑡𝑎𝑡𝑒) and incorporated and
headquartered in different states (𝐷𝑖𝑓𝑓. 𝐼𝑛𝑐-𝐻𝑄 𝑆𝑡𝑎𝑡𝑒). Consistent with our discussion of the
econometric issues about the use of state-by-year fixed effects in the PPL-setting, we find that
our results are driven by the 72% of 𝑆𝑎𝑚𝑒 𝐼𝑛𝑐-𝐻𝑄 𝑆𝑡𝑎𝑡𝑒 firms, while the coefficient on
𝑃𝑃𝐿 × 𝐷𝑖𝑓𝑓. 𝐼𝑛𝑐-𝐻𝑄 𝑆𝑡𝑎𝑡𝑒 is positive but insignificant (we argue) due to a lack of variation
(i.e., statistical power), in both the PPL firm-years and non-Delaware, non-PPL firm-years.

24
b. Matched sample. As a further robustness check on the concern that unobserved, time-
varying headquarter state factors are driving our results, we re-perform our matching
procedure, but interchange the criterion of exact matching on U.S. Census divisions to
matching on states of headquarters. We then regress 𝑄 on 𝑇𝑟𝑒𝑎𝑡𝑒𝑑 × 𝑃𝑜𝑠𝑡 in this alternative
sample and find our results continue to hold.
(ii) Placebo tests.
a. Full sample. We follow Cornaggia et al. (2015) and randomly assign states (without
replacement) a PPL, but require that our assignment procedure follows the laws’ actual
empirical distribution – thus, if our main results are driven by confounding factors that occur
around the same time as PPL adoptions, they should remain present in the data, and could
continue to bias our findings. Reassuringly, however, we find an economically and statistically
insignificant point estimate on 𝑅𝑎𝑛𝑑𝑜𝑚𝑖𝑧𝑒𝑑 𝑃𝑃𝐿 for our four proxies of value.
b. Matched sample. We provide evidence for the parallel trends assumption in our matched
sample by moving back actual adoption dates of PPLs by four-years and reperforming our
matching procedure in year 𝑡-1 of the pseudo adoption date. We then estimate our baseline
model using either 𝑄, 𝐸𝑥𝑐𝑒𝑠𝑠 𝑅𝑒𝑡𝑢𝑟𝑛, 𝑅𝑂𝐴, or 𝑇𝑜𝑡𝑎𝑙 𝑄 with an (𝑡 ±3) estimation window
and find the coefficients on 𝑃𝑠𝑒𝑢𝑑𝑜 𝑇𝑟𝑒𝑎𝑡𝑒𝑑 × 𝑃𝑜𝑠𝑡 are always insignificant.
(iii) First and second wave PPL sample periods combined. We consider the combined
average effect of first (1986 to 1990) and second (1995 to 2009) wave PPLs by using the period
1983–2012 in the full sample and by matching firms in all 35 law adopting states in the matched
sample and show that our key inference is unchanged.
(iv) Sample adjusted for Delaware case law. We argue the 1985 Delaware court decision in
Moran effectively validated the use of the pill for all firms, including those incorporated outside
of Delaware, while successive rulings in Interco and Pillsbury in 1988 reestablish uncertainty
regarding pill redemption, thus, limiting the general applicability of Delaware case law.
Accordingly, to have a pre-treatment period unconfounded by these court rulings, we define
the SW of adoptions to begin with Minnesota in 1995, rather than with PPLs adopted
immediately after Interco and Pillsbury (1989 or 1990). For robustness, we adjust the SW to
begin in 1989 and find that our full and matched sample results persist. Additionally, we show
that our findings continue to hold if we focus exclusively on the value implications of FW-
PPLs over the sample period 1989 to 1993.
25
(v) Excluding Delaware or multi-law adopting states. We show that both our full and
matched sample Tobin’s Q results are robust to excluding firms incorporated in Delaware and,
separately, excluding states that enact other antitakeover laws in the same year they pass PPLs.
(vi) Poison pill validity index (PPV-Index). Our final robustness test considers an alternative
proxy for shadow pills. Using PPLs and state-level court decisions on pills from Cain, McKeon,
and Solomon (2017), we construct the 𝑃𝑃𝑉-𝐼𝑛𝑑𝑒𝑥 to capture changes across states and time
on the validity of the pill. Substituting this measure for 𝑃𝑃𝐿 in our full sample 𝑄 regressions,
we continue to find that shadow pills are valuable.17
4. Economic Channels
What economic channels can explain our finding that a strengthened shadow pill, as
sanctioned by the enactment of a PPL, adds to firm value? To address this question, we draw
on the existing theoretical literature and examine two potential economic mechanisms. The
first is the “bargaining power hypothesis,” under which having the right to adopt a poison pill
strengthens the bargaining power of the board vis-à-vis any potential bidder, thereby allowing
directors to obtain a higher offer price for the target’s shareholders (DeAngelo and Rice 1983;
Linn and McConnell 1983; Stulz 1988; Berkovitch and Khanna 1990; Harris 1990;
Kadyrzhanova and Rhodes-Kropf 2011). The second is the “bonding hypothesis” which posits
that a board’s power to deter a hostile takeover benefits shareholders by allowing a firm to
more credibly “bond” itself to longer-term operational strategies – strategies that would
otherwise be at risk of reversal if the firm underwent a change of control (Knoeber 1986;
Laffont and Tirole 1988; Shleifer and Summers 1988).
4.1. Bargaining power hypothesis
We test the bargaining power hypothesis, following prior empirical studies (DeAngelo and
Rice 1983; Linn and McConnell 1983; Comment and Schwert 1995; Field and Karpoff 2002;
Heron and Lie 2006, 2015; Bates, Becher, and Lemmon 2008; Kadyrzhanova and Rhodes-
Kropf 2011), by analyzing both target acquisition propensities and premiums. The data for
these tests are pulled from the SDC M&A database and is comprised of 257 unsolicited
acquisition attempts announced over the period 1992–2012. We define a takeover attempt as
unsolicited if the SDC database classifies the attempt as hostile or otherwise unsolicited (as in
Heron and Lie 2006, 2015).
17 In unreported tests, we also show that our key full sample Tobin’s Q results continue to hold after including
controls for heterogenous PPL provisions (e.g., dead-hand pill and weak-pill provisions) and staggered boards
(and their interaction with PPLs).

26
Panel A of Table 8 examines the impact of PPLs on the likelihood that firms incorporated
in law adopting states receive a takeover bid (Columns (1)–(2)), as well as its effect on the
probability that a deal is successfully completed (Columns (3)–(6)). We define the dependent
variable, 𝐵𝑖𝑑 (𝐴𝑐𝑞𝑢𝑖𝑟𝑒𝑑), using an indicator variable equal to one if a target firm announces
that it has received a bid (is acquired in a completed takeover, either through a merger or an
acquisition) in the SDC M&A database, and zero otherwise. Each of the six columns includes
our full set of baseline controls, plus an indicator for whether a firm receives multiple bids
(𝑀𝑢𝑙𝑡𝑖𝑏𝑖𝑑), as well as its preceding year’s stock return (𝑅𝑒𝑡𝑢𝑟𝑛). The first four (last two)
columns specify firm, division-by-year, and industry-by-year (division) fixed effects.
As shown by Panel A’s row of coefficients on 𝑃𝑃𝐿, firms with strengthened shadow pills
are equally likely to receive a takeover bid or be successfully acquired as firms without the
same legally sanctioned right to adopt poison pills.18 Additionally, our analysis of the
heterogeneous effect of PPLs for firms with pills in-place (𝑃𝑃𝐿 × 𝑃𝑃𝑖𝑙𝑙), also indicates that
the enhanced validity of the pill, as enabled by the laws, does not significantly alter the
probability of being a target or acquired in a takeover. Lastly, consistent with prior studies
(Ambrose and Megginson 1992; Bhagat and Jefferis 1993; Comment and Schwert 1995; Heron
and Lie 2006, 2015; Bates, Becher, and Lemmon 2008; Karpoff, Schonlau, and Wehrly 2019),
we do not find evidence that actual poison pills (𝑃𝑃𝑖𝑙𝑙) materially deter takeovers either.
Next, in Panel B of Table 8, we investigate whether takeover premiums are positively
related to the adoption of PPLs, as the bargaining power hypothesis would suggest. In these
tests, we employ the following two dependent variables: 𝑇𝑜𝑡𝑎𝑙 𝑃𝑟𝑒𝑚𝑖𝑢𝑚, measured as the
total percentage premium offered relative to the target’s price four-weeks prior to the initial
offer, and 𝑃𝑟𝑒𝑚𝑖𝑢𝑚 𝐼𝑛𝑐𝑟𝑒𝑎𝑠𝑒, defined as the percentage increase in the bid price relative to
the target’s stock price four-weeks prior to the initial offer. We specify the full set of controls
in each of the five columns, in addition to 𝑀𝑢𝑙𝑡𝑖𝑏𝑖𝑑 and 𝑅𝑒𝑡𝑢𝑟𝑛, and we also include a dummy,
𝑀𝑜𝑟𝑛𝑖𝑛𝑔-𝐴𝑓𝑡𝑒𝑟 𝑃𝑃𝑖𝑙𝑙, for whether a firm adopts a poison pill in response to a takeover bid
(as in Heron and Lie 2006, 2015). Lastly, our specifications use division fixed effects, and not
firm or interacted fixed effects, since we are focusing exclusively on the cross-section of
18 There are, however, empirical challenges with this analysis. Specifically, we are unable to test how many target
bids and would-be-successful acquisition attempts never occurred because of the laws, and how many ex-ante
target firms became too expensive to acquire following the enactment of a PPL since, as we document, these laws
significantly increased firms’ market values. John and Kadyrzhanova (2017) find that the interaction of PPLs and
merger waves is an economically (but not statistically) significant deterrent of takeovers, while the effect of the
laws during off-wave periods is insignificant in both respects.

27
successful unsolicited bids and, since, correspondingly, our sample size is limited to 257
observations.
In Columns (1) and (3) of Panel B, we find that shadow pills do not increase the total
premium or initial premium offered to successfully acquired firms as the point estimates on
𝑃𝑃𝐿 are statistically insignificant. On the other hand, the coefficients on 𝑃𝑃𝑖𝑙𝑙 (𝑀𝑜𝑟𝑛𝑖𝑛𝑔-
𝐴𝑓𝑡𝑒𝑟 𝑃𝑃𝑖𝑙𝑙) in each of the five columns (the last column) are (is) positive and statistically
significant, suggesting that visible poison pills can benefit a target’s shareholders via increased
bargaining power (consistent with, e.g., Brickley, Coles and Terry 1994; Comment and
Schwert 1995; Cotter, Shivdasani, and Zenner 1997; Heron and Lie 2006, 2015). However,
when we interact 𝑃𝑃𝐿 and 𝑃𝑃𝑖𝑙𝑙 in Columns (2) and (4)–(5), we find evidence that the
enhanced validity of the pill as authorized by a PPL heterogeneously increases both
𝑇𝑜𝑡𝑎𝑙 𝑃𝑟𝑒𝑚𝑖𝑢𝑚 and 𝑃𝑟𝑒𝑚𝑖𝑢𝑚 𝐼𝑛𝑐𝑟𝑒𝑎𝑠𝑒. For instance, in the second (last) column,
shareholders of target firms incorporated in states with one of these laws and an actual pill in-
place experience a 7.7% (14.6%) differential increase in the total premium received (premium
relative to the initial bid).
Hence, the evidence from Table 8 indicates that PPLs can be value-enhancing for
shareholders of acquisition targets as the strengthened right to adopt a poison pill enhances the
negotiating position of firms with pills in-place – which can explain why the adoption of pills
for firms with lower levels of 𝑄 and, thus, most likely at risk of takeover, can be valuable.
Unfortunately, however, these findings on the bargaining power hypothesis have two major
drawbacks in explaining our key result that shadow pills increase the long-term value of firms.
First, our main findings indicate the PPLs are value relevant for the average firm (Tables 5–7),
while the increase in takeover premiums is only for a subset of firms with visible poison pills.
When we interacted 𝑃𝑃𝐿 with 𝑃𝑃𝑖𝑙𝑙 in Column (3) of Table 5, we did not find evidence for a
differential effect on Tobin’s Q. Second, and more generally, the bargaining power hypothesis
does not explain the full range of our results. In particular, while it could be consistent with an
increase in 𝐸𝑥𝑐𝑒𝑠𝑠 𝑅𝑒𝑡𝑢𝑟𝑛 and 𝐴𝑙𝑝ℎ𝑎, it is less consistent with increases in 𝑄 and 𝑇𝑜𝑡𝑎𝑙 𝑄
and altogether unable to explain our evidence on 𝑅𝑂𝐴.
4.2. Bonding hypothesis
We now move to examine the bonding hypothesis as an alternative economic channel.
Underlying this framework, is the idea that empowering a board to commit the firm to a
business strategy that cannot easily be reversed – by strengthening a board’s ability to contest
the disruption caused by takeovers – is value-enhancing as it decreases a firm’s cost of

28
contracting and promotes the undertaking of long-term projects and stronger stakeholder
relationships (Knoeber 1986; Laffont and Tirole 1988; Shleifer and Summers 1988; Stein 1988,
1989; Johnson, Karpoff, and Yi 2015). In order to test this channel, we follow the prior
literature (Johnson, Karpoff, and Yi 2015; Cen, Dasgupta, and Sen 2015; Cremers, Litov, and
Sepe 2017; Chemmanur and Tian 2018) and analyze the differential value effects of PPLs for
firms more reliant on operational strategies that center around long-term investments in
innovation and stakeholder relationships.
4.2.1. Innovative firms. The strengthened right to adopt a poison pill and, thus, resist a
takeover bid, could play an essential bonding device toward a firm’s stakeholders. Further,
since companies more engaged in innovation often require more significant firm-specific
investments from stakeholders (e.g., employees, strategic alliance partners, suppliers, and
customers), a shadow pill could prove useful in preventing the ex-post expropriation of these
investments and more credibly commit innovative firms toward its non-shareholders.
We test these critical predictions of the bonding hypothesis by considering the
heterogeneous effect of PPLs for firms that are more dependent on investments in innovation
using the following four proxies: (1) 𝑅&𝐷/𝑆𝑎𝑙𝑒𝑠, is a measure for the importance of corporate
expenditures on research and development activities (Chan, Lakonishok, and Sougiannis 2001;
Eberhart, Maxwell, and Siddique 2004) (data comes from Compustat); (2)
𝐼𝑛𝑡𝑎𝑛𝑔𝑖𝑏𝑙𝑒 𝐶𝑎𝑝𝑖𝑡𝑎𝑙, is a “catch-all” measure for the importance of intangible capital (Core,
Holthausen, and Larcker 1999; Duru, Wang, and Zhao 2013) and is defined as a firm’s
intangible capital estimated replacement cost (as proposed by Peters and Taylor 2017) (data
comes from WRDS in the Peters and Taylor Total Q database); (3) 𝐶𝑊 𝑃𝑎𝑡𝑒𝑛𝑡𝑠, which
captures the novelty or quality of a firm’s innovative output by weighting its patents based on
the number of citations they receive (Hall, Jaffe, and Trajtenberg 2005; Atanassov 2013; Kogan
et al. 2017; Chemmanur and Tian 2018) (data comes from the KPSS Google patents dataset);19
and (4) 𝑅𝑄, or research quotient, which measures the output elasticity of R&D (as proposed in
Knott 2008) (data comes from WRDS in the Research Quotient database).
Panel A of Table 9 presents our results. In each of the four columns, we specify Tobin’s Q
as the dependent variable and include our full set of default control variables and fixed effects.
We find, consistent with the theoretical predictions of the bonding hypotheses, that when
boards are better equipped to contest the potential disruption caused by a takeover – via a
19 Our inference is unchanged if we use patent counts or stock market-value of patents (Kogan et al. 2017) instead
of citation-weighted patents.
29
shadow pill – firms that are more engaged in research and development (Column (1)), have
more intangible capital (Column (2)) and patent citations (Column (3)), or are better at
converting R&D into sales (Column (4)), experience heterogeneous gains in value. For
example, in Column (1), we document that a one-standard-deviation increase in the proxy,
𝑅&𝐷/𝑆𝑎𝑙𝑒𝑠, yields an economically significant increase in 𝑄 of 7.4% (=2.139×0.064/1.855)
for firms incorporated in PPL adopting states, relative to its sample mean. Likewise, we find
in Column (2) that firms with strengthened shadow pills that have a one-standard-deviation
higher level of 𝐼𝑛𝑡𝑎𝑛𝑔𝑖𝑏𝑙𝑒 𝐶𝑎𝑝𝑖𝑡𝑎𝑙 have a 3.8% (=0.198×0.353/1.855) higher 𝑄 compared to
division and industry rivals with less intangible-based capital.
4.2.2. Stakeholder relationships. We continue our evaluation of the bonding hypothesis as
a source of value of shadow pills by considering their various effect for firms that are more
reliant on stakeholder relationships. To do so, we employ four different proxies which aim to
capture the importance of these relationships directly. They include: (1)
𝑂𝑟𝑔𝑎𝑛𝑖𝑧𝑎𝑡𝑖𝑜𝑛𝑎𝑙 𝐶𝑎𝑝𝑖𝑡𝑎𝑙, a “catch-all” measure for the importance of organizational capital
(Eisfeldt and Papanikolaou 2013) that is defined as a firm’s organizational capital replacement
cost (as proposed by Peters and Taylor 2017) (data comes from WRDS in the Peters and Taylor
Total Q database); (2) 𝐿𝑎𝑟𝑔𝑒 𝐶𝑢𝑠𝑡𝑜𝑚𝑒𝑟, which captures the significance of customers who
are likely to have a longer-term association with the firm (Cen, Dasgupt, and Sen 2015;
Johnson, Karpoff, and Yi 2015) and is measured using an indicator for whether a firm’s
percentage of customer sales, based on the Compustat segment level database, is above the
sample average; (3) 𝑆𝑡𝑟𝑎𝑡𝑒𝑔𝑖𝑐 𝐴𝑙𝑙𝑖𝑎𝑛𝑐𝑒, an indicator of whether the business has a long-term
partnership with another company (Bodnaruk, Massa, and Simonov 2013; Johnson, Karpoff,
and Yi 2015); and (4) 𝐿𝑎𝑏𝑜𝑟 𝐼𝑛𝑡𝑒𝑛𝑠𝑖𝑡𝑦, which measures how intensely businesses rely on their
human capital and is defined as the total number of employees divided by real sales revenue
(Dewenter and Malatesta 2001), where we adjust sales using 2015 dollars.
Panel B of Table 9 shows our results. Columns (1)–(4) maintain Tobin’s Q as the
dependent variable and include the full set baseline controls and fixed effects. Consistent with
our conjectures under the bonding hypotheses, we find in Column (1) that firms incorporated
in PPL passing states and with a one-standard-deviation higher level of
𝑂𝑟𝑔𝑎𝑛𝑖𝑧𝑎𝑡𝑖𝑜𝑛𝑎𝑙 𝐶𝑎𝑝𝑖𝑡𝑎𝑙 have a 4.6% (=0.365×0.232/1.855) higher 𝑄 compared to firms
operating in the same division and sharing similar industry trends but with a smaller share of
organizational capital. Similarly, Column (3) shows that firms with a strengthened shadow pill
and in a relationship with a 𝑆𝑡𝑟𝑎𝑡𝑒𝑔𝑖𝑐 𝐴𝑙𝑙𝑖𝑎𝑛𝑐𝑒 partner experience a 10.1 percentage point
30
increase in Tobin’s Q, which represents an economically significant 5.4% increase relative to
the sample mean for 𝑄 of 1.855.
In sum, the evidence in Table 9 indicates that the strengthened right to adopt a poison pill,
as enabled by PPLs, is especially likely to benefit firms where long-term investments in
innovation are more critical, that have more organizational capital or a large customer, are in a
strategic alliance, or are more labor-intensive, by enabling these firms to more closely bond its
stakeholders to its operational strategy and, in so doing, decrease its costs of contracting.
5. Conclusion
This paper contributes to the debate on whether poison pills benefit or hurt shareholders
by shifting the focus from visible pills to shadow pills – that is, studying the right to adopt the
pill (which right constitutes the shadow pill) rather than endogenous, adopted pills. We do so
by exploiting the quasi-natural experiment provided by the staggered passage of poison pill
laws (PPLs) that validated the use of the pill and, thus, strengthened the relevance of the shadow
pill as a takeover defense.
While other studies have exploited these laws, our paper is the first to focus on the second
wave (SW-) PPLs passed during the period 1995 to 2009 and to explore the implications of
these laws for actual pill policy and long-term value. Given substantial changes in the
underlying legal context since the enactment of first wave PPLs employed by prior studies, we
conjecture that results for this later set of laws might well differ from earlier findings. Further,
from an identification perspective, focusing on SW-PPLs ensures that we have a pre-treatment
period unconfounded by Delaware court decisions that could have impacted the relevance of
PPLs for affected firms, thus avoiding the likelihood that measurement error biases our
estimates.
Our analysis delivers two main results. First, we show that firms incorporated in PPL
adopting states are more likely to adopt new poison pills and maintain their use of existing
pills. The result on new pill adoptions, however, is contingent on the ex-ante value of the firm
being amongst the lowest (and thus, likely most at risk of takeover) in our sample’s distribution
of Tobin’s Q, suggesting that the shadow pill promotes a “validation effect” for these firms’
poison pill policy. Second, we document that the availability of a stronger shadow pill results
in significant improvements in value for firms incorporated in the enacting states, and
especially for those with existing pills that are targeted in acquisition attempts or for firms more
engaged in innovation or with stronger stakeholder relationships. Moreover, using a
comprehensive dataset of firm-level visible pills, we confirm the findings of the previous

31
literature on the determinants of actual pill adoption and its negative association with Tobin’s
Q. This suggests that a stronger shadow pill is beneficial to shareholders, even if the
(endogenous) adoption of an actual pill is not.
Overall, our results support the view that the shadow pill serves a positive corporate
governance function for some firms consistent with economic mechanisms that relate to the
“bargaining power hypothesis” and the “bonding hypothesis” of takeover defenses. The first
channel is rooted in the rationale that strengthening the board’s ability to resist a hostile
takeover attempt increases the board's power to negotiate with a potential bidder and,
ultimately, to extract a higher purchasing price for the benefit of the target’s shareholders. The
second maintains that the right to adopt a pill increases firm value by re-empowering the board
against short-term shareholder interference that can be disruptive of a firm’s commitment
toward more stable stakeholder relationships or longer-term investments projects, which
reduces the costs of contracting.

32
References
Acharya, V. V., R. P. Baghai, and K. V. Subramanian. 2014. Wrongful discharge laws and innovation.
Review of Financial Studies 27:301-46.
Ambrose, B. W., and W. L. Megginson. 1992. The role of asset structure, ownership structure, and
takeover defenses in determining acquisition likelihood. Journal of Financial and Quantitative Analysis
27:575-90.
Angrist, J. D., and J. S. Pischke. 2009. Mostly harmless econometrics: An empiricist’s companion. 1st
Ed. (Princeton, NJ: Princeton University Press).
Atanassov, J. 2013. Do hostile takeovers stifle innovation? Evidence from antitakeover legislation and
corporate patenting. Journal of Finance 68:1097-131.
Autor, D. H., J. J. Donohue III, and S. J. Schwab. 2006. The costs of wrongful-discharge laws. Review
of Economics and Statistics 88:211-31.
Bartlett, R. P., and F. Partnoy. 2018. The misuse of Tobin’s Q. Unpublished working paper. University
of California, Berkeley.
Barzuza, M. 2009. The state of state antitakeover law. Virginia Law Review 95:1973-2052.
Bates, T. W., D. A. Becher, and M. L. Lemmon. 2008. Board classification and managerial
entrenchment: Evidence from the market for corporate control. Journal of Financial Economics 87:656-
77.
Bebchuk, L. A., J. C. Coates IV, and G. Subramanian. 2002. The powerful antitakeover force of
staggered boards: Theory, evidence, and policy. Stanford Law Review 54:887-1501.
Bebchuk, L. A., A. Cohen, and A. Ferrell. 2009. What matters in corporate governance?. Review of
Financial Studies 22:783-827.
Berkovitch, E. and N. Khanna. 1990. How target shareholders benefit from value‐reducing defensive
strategies in takeovers. Journal of Finance, 45:137-56.
Bertrand, M., and S. Mullainathan. 1999. Is there discretion in wage setting? A test using takeover
legislation. RAND Journal of Economics 30:535–54.
––––. 2003. Enjoying the quiet life? Corporate governance and managerial preferences. Journal of
Political Economy 111:1043-75.
Bhagat, S., and R. H. Jefferis. 1993. Is defensive activity effective?. Unpublished working paper.
University of Colorado, Boulder.
––––. 2002. The econometrics of corporate governance studies. MIT Press, Cambridge.
Bhojraj, S., P. Sengupta, and S. Zhang. 2017. Takeover defenses: Entrenchment and efficiency. Journal
of Accounting and Economics 63:142-60.
Bodnaruk, A., M. Massa, and A. Simonov. 2013. Alliances and corporate governance. Journal of
Financial Economics 107:671–693.
Bizjak, J. M., and C. J. Marquette. 1998. Are shareholder proposals all bark and no bite? Evidence from
shareholder resolutions to rescind poison pills. Journal of Financial and Quantitative Analysis 33:499-
521.

33
Brickley, J. A., J. L. Coles, and R. L. Terry. 1994. Outside directors and the adoption of poison
pills. Journal of Financial Economics 35:371-90.
Cain, M. D., S. B. McKeon, and Solomon, S. D. 2017. Do takeover laws matter? Evidence from five
decades of hostile takeovers. Journal of Financial Economics 124:464-85.
Cary, W. 1969. Corporate devices used to insulate management from attack. Antitrust Law Journal
39:318-24.
Carhart, M. M. 1997. On persistence in mutual fund performance. Journal of Finance 52:57-82.
Carney, W. J., and L. A. Silverstein. 2003. Illusory protections of the poison pill. Notre Dame Law
Review 79:179-220.
Catan, E. M. 2019. The insignificance of clear-day poison pills. Journal of Legal Studies forthcoming.
Catan, E. M., and M. Kahan. 2016. The law and finance of antitakeover statutes. Stanford Law Review
68:629-82.
Caton, G. L., and J. Goh. 2008. Corporate governance, shareholder rights, and shareholder rights plans:
Poison, placebo, or prescription?. Journal of Financial and Quantitative Analysis 43:381-400.
Cen, L., S. Dasgupta, R. Sen. 2015. Discipline or disruption? Stakeholder relationships and the effect
of takeover threat. Management Science 62:2820-41.
Chan, L. K. C., J. Lakonishok, and T. Sougiannis. 2001. The stock market valuation of research and
development expenditures. Journal of Finance 56:2431-56.
Chemmanur, T. J., and X. Tian. 2018. Do antitakeover provisions spur corporate innovation? A
regression discontinuity analysis. Journal of Financial and Quantitative Analysis 53:1163-94.
Chi, J. D. 2005. Understanding the endogeneity between firm value and shareholder rights. Financial
Management 34:65-76.
Coates, J. 2000. Takeover defenses in the shadow of the pill: A critique of the scientific evidence. Texas
Law Review 79:271-382
Cohen, A., and C. C. Wang. 2013. How do staggered boards affect shareholder value? Evidence from
a natural experiment. Journal of Financial Economics 110:627-41.
Comment, R., and G. W. Schwert. 1995. Poison or placebo? Evidence on the deterrence and wealth
effects of modern antitakeover measures. Journal of Financial Economics 39:3-43.
Core, J. E., R. W. Holthausen, and D. F. Larcker. 1999. Corporate governance, chief executive officer
compensation and firm performance. Journal of Financial Economics 51:371-406.
Cornaggia, J., Y. Mao, X. Tian, and B. Wolfe. 2015. Does banking competition affect innovation?.
Journal of Financial Economics 115:189-209.
Correia, S. 2015. Singletons, cluster-robust standard errors and fixed effects: A bad mix. Unpublished
technical note. Duke University.
Cotter, J. F., A. Shivdasani, and M. Zenner. 1997. Do independent directors enhance target shareholder
wealth during tender offers?. Journal of Financial Economics 43:195-218.

34
Cremers, K. J. M.., and A. Ferrell. 2014. Thirty years of shareholder rights and firm value. Journal of
Finance 69:1167-96.
Cremers, K. J. M., L. P. Litov, and S. M. Sepe. 2017. Staggered boards and long-term firm value,
revisited. Journal of Financial Economics 126:422-44.
Cuñat, V., M. Gine, and M. Guadalupe. 2012. The vote is cast: The effect of corporate governance on
shareholder value. Journal of Finance 67:1943-77.
Daines, R. M. 2001. Does Delaware law improve firm value? Journal of Financial Economics 62:525-
58.
Danielson, M. G., and J. M. Karpoff. 2006. Do pills poison operating performance?. Journal of
Corporate Finance 12:536-59.
Dammann, J. 2019. Deference to Delaware corporate law precedents and shareholder wealth: An
empirical analysis. Unpublished working paper. University of Texas at Austin.
Datta, S., and M. Iskandar-Datta. 1996. Takeover defenses and wealth effects on security holders: The
case of poison pill adoptions. Journal of Banking and Finance 20:1231-50.
DeAngelo, H., and E. M. Rice. 1983. Antitakeover charter amendments and stockholder
wealth. Journal of Financial Economics 11:329-59.
Demsetz, H., and K. Lehn. 1985. The structure of corporate ownership: Causes and consequences.
Journal of Political Economy 93:1155–77.
Dewenter, K. L., and P. H. Malatesta. 2001. State-owned and privately owned firms: An empirical
analysis of profitability, leverage, and labor intensity. American Economic Review 91:320-34.
Dowen, R. J., J. M. Johnson, and G. R. Jensen. 1994. Poison pills and corporate governance. Applied
Financial Economics 4:305-13.
Duru, A., D. Wang, and Y. Zhao. 2013. Staggered boards, corporate opacity and firm value. Journal of
Banking and Finance 37:341-360.
Easterbrook, F., and D. Fischel. 1991. The economic structure of corporate law. Harvard University
Press, Cambridge, MA.
Eberhart, A. C., W. F. Maxwell, and A. R. Siddique. 2004. An examination of long-term abnormal
stock returns and operating performance following R&D increases. Journal of Finance 59:623–50.
Eisfeldt, A., and D. Papanikolaou. 2013. Organization capital and the cross-section of expected returns.
Journal of Finance 68:1365-406.
Ellison, G., and E. L. Glaeser. 1997. Geographic concentration in US manufacturing industries: A
dartboard approach. Journal of Political Economy 105:889-927.
––––. 1999. The geographic concentration of industry: Does natural advantage explain agglomeration?.
American Economic Review 89:311-16.
Ellison, G., E. L. Glaeser, and W. R. Kerr. 2010. What causes industry agglomeration? Evidence from
coagglomeration patterns. American Economic Review 100:1195-213.

35
Erickson, T., and T. M. Whited. 2000. Measurement error and the relationship between investment and
q. Journal of Political Economy 108:1027-57.
––––. 2012. Treating measurement error in Tobin’s q. Review of Financial Studies 25:1286-329.
Fama, E. F., and K. R. French. 1992. The cross‐section of expected stock returns. Journal of Finance
47:427-65.
––––. 1993. Common risk factors in the returns on stocks and bonds. Journal of Financial Economics
33:3-56.
Fich, E. M., J. Harford, and A. S. Yore. 2018. Does takeover protection matter? Evidence from a natural
experiment. Unpublished working paper. Drexel University.
Field, L. C., and J. M. Karpoff. 2002. Takeover defenses of IPO firms. Journal of Finance 57:1857-89.
Fleischer, A., G. L. Hazard, and M. Z. Klipper. 1988. Boardgames: The changing shape of corporate
power. Little, Brown and Company. Boston, Massachusetts.
Fleischer, A., and A. Sussman. 2013. Takeover defenses, Aspen Law and Business. New York, New
York.
Francis, B. B., I. Hasan, K. John, and M. Waisman. 2010. The effect of state antitakeover laws on the
firm's bondholders. Journal of Financial Economics 96:127-54.
Garvey, G. T., and G. Hanka. 1999. Capital structure and corporate control: The effect of antitakeover
statutes on firm leverage. Journal of Finance 54:519-46.
Gillan, S. L., and L. T. Starks. 2000. Corporate governance proposals and shareholder activism: The
role of institutional investors. Journal of Financial Economics 57:275-305.
Giroud, X., and H. M. Mueller. 2010. Does corporate governance matter in competitive industries?.
Journal of Financial Economics 95:312-31.
––––. 2011. Corporate governance, product market competition, and equity prices. Journal of Finance
66:563-600.
Gompers, P., J. Ishii, and A. Metrick. 2003. Corporate governance and equity prices. Quarterly Journal
of Economics 118:107-56.
Gormley, T. A., and D. A. Matsa. 2014. Common errors: How to (and not to) control for unobserved
heterogeneity. Review of Financial Studies 27:617-61.
––––. 2016. Playing it safe? Managerial preferences, risk, and agency conflicts. Journal of Financial
Economics 122:431-55.
John, K., and D. Kadyrzhanova. 2017. Managerial entrenchment waves. Unpublished working paper.
New York University.
Johnson, W. C., J. M. Karpoff, and S. Yi. 2015. The bonding hypothesis of takeover defenses: Evidence
from IPO firms. Journal of Financial Economics 117:307-32.
––––. 2018. The lifecycle effects of firm takeover defenses. Unpublished working paper, University of
Washington.

36
Hall, B. H., A. Jaffe, and M. Trajtenberg. 2005. Market value and patent citations. RAND Journal of
Economics 36:16-38.
Harris, E. G. 1990. Antitakeover measures, golden parachutes, and target firm shareholder welfare.
RAND Journal of Economics 21:614-25.
Heider, F., and A. Ljungqvist. 2015. As certain as debt and taxes: Estimating the tax sensitivity of
leverage from state tax changes. Journal of Financial Economics 118:684-712.
Helman, R. A., and J. J. Junewicz. 1986. A fresh look at poison pills. Business Law 42:771-78.
Henderson, J. V., and Y. Ono. 2008. Where do manufacturing firms locate their headquarters?. Journal
of Urban Economics 63:431-450.
Heron, R. A., and E. Lie. 2006. On the use of poison pills and defensive payouts by takeover
targets. Journal of Business 79:1783-807.
––––. 2015. The effect of poison pill adoptions and court rulings on firm entrenchment. Journal of
Corporate Finance 35:286-96.
Himmelberg, C. P., R. G. Hubbard, and D. Palia. 1999. Understanding the determinants of managerial
ownership and the link between ownership and performance. Journal of Financial Economics 53:353-
84.
Jung, K., Y. C. Kim, and R. Stulz. 1996. Timing, investment opportunities, managerial discretion, and
the security issue decision. Journal of Financial Economics 42:159-85.
Kadyrzhanova, D., and M. Rhodes‐Kropf. 2011. Concentrating on governance. Journal of Finance
66:1649-85.
Karpoff, J. M., and P. H. Malatesta. 1989. The wealth effects of second-generation state takeover
legislation. Journal of Financial Economics 25:291-322.
Karpoff, J. M., and M. D. Wittry. 2018. Institutional and legal context in natural experiments: The case
of state antitakeover laws. Journal of Finance 73:657-714.
Karpoff, J. M., R. J. Schonlau, and E. W. Wehrly. 2017. Do takeover defense indices measure takeover
deterrence?. Review of Financial Studies 30:2359-412.
––––. 2019. Which antitakeover provisions matter?. Unpublished working paper. University of
Washington.
Knoeber, C. R. 1986. Golden parachutes, shark repellents, and hostile tender offers. American
Economic Review 76:155-67.
Knott, A. M. 2008. R&D/returns causality: Absorptive capacity or organizational IQ. Management
Science 54:2054-067.
Kogan, L., D. Papanikolaou, A. Seru, and N. Stoffman. 2017. Technological innovation, resource
allocation, and growth. Quarterly Journal of Economics 132:665-712.
Laffont, J., and J. Tirole. 1988. Repeated auctions of incentive contracts, investment and bidding parity,
with an application to takeovers. RAND Journal of Economics 19:516-37.

37
Lang, L., and R. Stulz. 1994. Tobin’s Q, corporate diversification, and firm performance. Journal of
Political Economy 102:1248-80.
Linn, S. C., and J. J. McConnell. 1983. An empirical investigation of the impact of ‘antitakeover’
amendments on common stock prices. Journal of Financial Economics 11:361-99.
Lintner, J. 1965. Security prices, risk, and maximal gains from diversification. Journal of Finance 20:
587-615.
Malatesta, P. H., and R. A. Walkling. 1988. Poison pill securities: Stockholder wealth, profitability, and
ownership structure. Journal of Financial Economics 20:347-76.
Manne, H. G. 1965. Mergers and the market for corporate control. Journal of Political Economy 73:110-
20.
Maksimovic, V., and G. Phillips. 2001. The market for corporate assets: Who engages in mergers and
asset sales and are there efficiency gains?. Journal of Finance 56:2019–065.
Mitchell, M. L., and J. H. Mulherin. 1996. The impact of industry shocks on takeover and restructuring
activity. Journal of Financial Economics 41:193–229.
Morck, R., A. Shleifer, and R. Vishny. 1988. Management ownership and market valuation: An
empirical analysis. Journal of Financial Economics 20:293–315.
Mossin, J. 1966. Equilibrium in a capital asset market. Econometrica 34:768-83.
Palia, D. 2001. The endogeneity of managerial compensation in firm valuation: A solution. Review of
Financial Studies 14:735-64.
Parise, G. 2018. Threat of entry and debt maturity: Evidence from airlines. Journal of Financial
Economics 127:226-47.
Peters, R. H., and L. A. Taylor. 2017. Intangible capital and the investment-q relation. Journal of
Financial Economics 123:251-72.
Qiu, J., and F. Yu. 2009. The market for corporate control and the cost of debt. Journal of Financial
Economics 93:505-24.
Rhodes‐Kropf, M., D. T. Robinson, and S. Viswanathan. 2005. Valuation waves and merger activity:
The empirical evidence. Journal of Financial Economics 77:561–603.
Roberts, M. R., and T. M. Whited. 2013. Endogeneity in empirical corporate finance. In Handbook of
the Economics of Finance (Vol. 2, pp. 493-572). Elsevier.
Ryngaert, M. 1988. The effect of poison pill securities on shareholder wealth. Journal of Financial
Economics 20:377-417.
Sharpe, W. F. 1964. Capital asset prices: A theory of market equilibrium under conditions of risk.
Journal of Finance 19:425-42.
Shleifer, A., and L. Summers. 1988. Breach of trust in hostile takeovers, in A.J. Auerbach (ed.),
Corporate takeovers: Causes and consequences.
Smith Jr, C.W., and R. L. Watts. 1992. The investment opportunity set and corporate financing,
dividend, and compensation policies. Journal of Financial Economics 32: 263-92.

38
Stein, J. C. 1988. Takeover threats and managerial myopia. Journal of Political Economy 96:61-80.
––––. 1989. Efficient capital markets, inefficient firms: A model of myopic corporate behavior.
Quarterly Journal of Economics 104:655-69.
Straska, M., and H. G. Waller. 2014. Antitakeover provisions and shareholder wealth: A survey of the
literature. Journal of Financial and Quantitative Analysis 49:933-56.
Stulz, R. 1988. Managerial control of voting rights: Financing policies and the market for corporate
control. Journal of Financial Economics 20:25-54.
Treynor, J. L. 1962. Jack Treynor's' toward a theory of market value of risky assets'. Unpublished
working paper.
Yermack, D. 1996. Higher market valuation of companies with a small board of directors. Journal of
Financial Economics 40:185–211.

39
Figure 1
Percentage of firms with a poison pill
This figure plots a solid black line representing the percentage of firms with a poison pill in-place in
our sample, each year from 1983 to 2012. We additionally partition the sample into the percentage of
firms with a poison pill incorporated in a state that eventually adopts a poison pill law (PPL) between
1986 and 1990 (first wave – FW) with a dashed line and blue squares, 1995 and 2009 (second wave –
SW) with a dashed line and green diamonds, and Delaware, which never adopts a PPL with a dashed
line and red triangles.
0.00%
10.00%
20.00%
30.00%
40.00%
50.00%
60.00%
70.00%
80.00%
1982 1984 1986 1988 1990 1992 1994 1996 1998 2000 2002 2004 2006 2008 2010 2012
Per
cen
tage
of
firm
s w
ith
a P
Pil
l
Year
All Firms FW PPL Firms SW PPL Firms Delaware Firms

40
Figure 2
The timing of the PPLs effect on Tobin’s Q
This figure plots the coefficient estimates (y-axis) from regressing 𝑄 on firm, division-by-year, and
industry-by-year fixed effects, four other antitakeover law indicators, and dummies denoting the year
relative to the adoption date of a firm’s incorporating state’s PPL (x-axis) over the period 1992 to 2012.
The specification is the same as that reported in Column 1 of Table 5 except that we allow the effect of
the law to vary annually in event time. Dashed lines correspond to the 95% confidence intervals of the
coefficient estimates, calculated from robust standard errors clustered by the state of incorporation.
Green triangles (blue diamonds) denote significance at the 5% (10%) level.
-0.200
-0.100
0.000
0.100
0.200
0.300
0.400
-4 -3 -2 -1 0 1 2 3 4
Co
effi
cien
t fo
r Q
Year Relative to PPL Adoption
Point Estimate 95% Confidence Interval

41
Table 1
First wave PPLs and firm value
𝑄[𝑡] 𝐸𝑥𝑐𝑒𝑠𝑠 𝑅𝑒𝑡𝑢𝑟𝑛[𝑡] 𝑅𝑂𝐴[𝑡] 𝑇𝑜𝑡𝑎𝑙 𝑄[𝑡]
(1) (2) (3) (4) (5) (6) (7) (8)
𝐹𝑊 𝑃𝑃𝐿[𝑡] -0.013
(-0.52)
-0.017
(-0.62)
0.013
(0.57)
0.011
(0.46)
-0.000
(-0.16)
0.000
(0.01)
-0.015
(-0.44)
-0.021
(-0.67)
𝑃𝑃𝑖𝑙𝑙[𝑡−1] -0.024
(-1.22)
-0.042**
(-2.27)
-0.017
(-1.31)
-0.005
(-0.33)
-0.003
(-1.17)
-0.005**
(-2.36)
-0.024
(-0.99)
-0.033
(-1.58)
𝐿𝑛(𝐴𝑠𝑠𝑒𝑡𝑠)[𝑡−1] -0.283***
(-7.10)
-0.217***
(-15.08)
-0.029***
(-11.55)
-0.139***
(-2.96)
𝐿𝑛(𝐴𝑔𝑒)[𝑡−1] -0.358*
(-1.80)
-0.173*
(-1.99)
-0.000
(-0.01)
-1.011***
(-3.63)
𝑆𝐺[𝑡−1] 0.311***
(14.19)
-0.089**
(-2.33)
0.069***
(10.70)
0.399***
(13.81)
𝐿𝑜𝑠𝑠[𝑡−1] -0.036***
(-5.37)
0.053***
(3.36)
-0.010***
(-6.19)
-0.076***
(-7.04)
𝐷𝐸𝑄[𝑡−1] -0.019
(-1.67)
0.030**
(2.40)
0.000
(0.25)
0.008
(0.78)
𝐹𝐿𝐼𝑄[𝑡−1] -0.141*
(-1.90)
-0.341***
(-5.13)
-0.028***
(-3.42)
-0.017
(-0.27)
𝐶𝐴𝑃𝑋/𝐴𝑠𝑠𝑒𝑡𝑠[𝑡−1] 0.264*
(2.01)
-0.922***
(-7.23)
-0.048**
(-2.19)
0.708***
(4.37)
𝑅&𝐷/𝑆𝑎𝑙𝑒𝑠[𝑡−1] 0.573
(0.33)
0.544
(1.09)
-0.287**
(-2.25)
-0.133
(-0.07)
𝐼𝑂[𝑡−1] 0.029
(0.61)
-0.417***
(-9.44)
0.024***
(3.20)
0.120
(1.32)
Other antitakeover laws Yes Yes Yes Yes Yes Yes Yes Yes
Firm FE Yes Yes Yes Yes Yes Yes Yes Yes
Division × Year FE Yes Yes Yes Yes Yes Yes Yes Yes
Industry × Year FE Yes Yes Yes Yes Yes Yes Yes Yes
N 9,037 9,037 9,037 9,037 9,037 9,037 9,031 9,031
Adjusted R2 0.754 0.769 0.058 0.100 0.673 0.700 0.766 0.778
42
This table presents results from OLS regressions analyzing the value implications of first wave (FW) poison pill laws (PPLs) over the sample period 1983 to
1993. The dependent variables include: Tobin’s Q (𝑄); excess stock returns, estimated using the Fama-French four-factor model (𝐸𝑥𝑐𝑒𝑠𝑠 𝑅𝑒𝑡𝑢𝑟𝑛), return on
assets (𝑅𝑂𝐴); and Total Tobin’s Q (𝑇𝑜𝑡𝑎𝑙 𝑄), which explicitly accounts for intangible assets when estimating a firm’s replacement cost of capital. We define
the key independent variable 𝐹𝑊 𝑃𝑃𝐿 as an indicator equal to one if a firm’s state of incorporation has adopted a PPL (passed at any point in time between
1986 and 1990) as of the current year, and zero otherwise. The “Other antitakeover laws” include 𝐵𝐶𝐿, 𝐶𝑆𝐿, 𝐷𝐷𝐿, and 𝐹𝑃𝐿. Unreported insignificant control
includes 𝐻𝐻𝐼. Division fixed effects are measured using U.S. Census divisions, and industry fixed effects are defined by two-digit SIC codes. Continuous
variables are winsorized at the 5% level in both tails. Internet Appendix A provides variable definitions. 𝑡-statistics (clustered by the state of incorporation) are
reported in parentheses. *, **, and *** denote significance at the 10%, 5%, and 1% level, respectively.
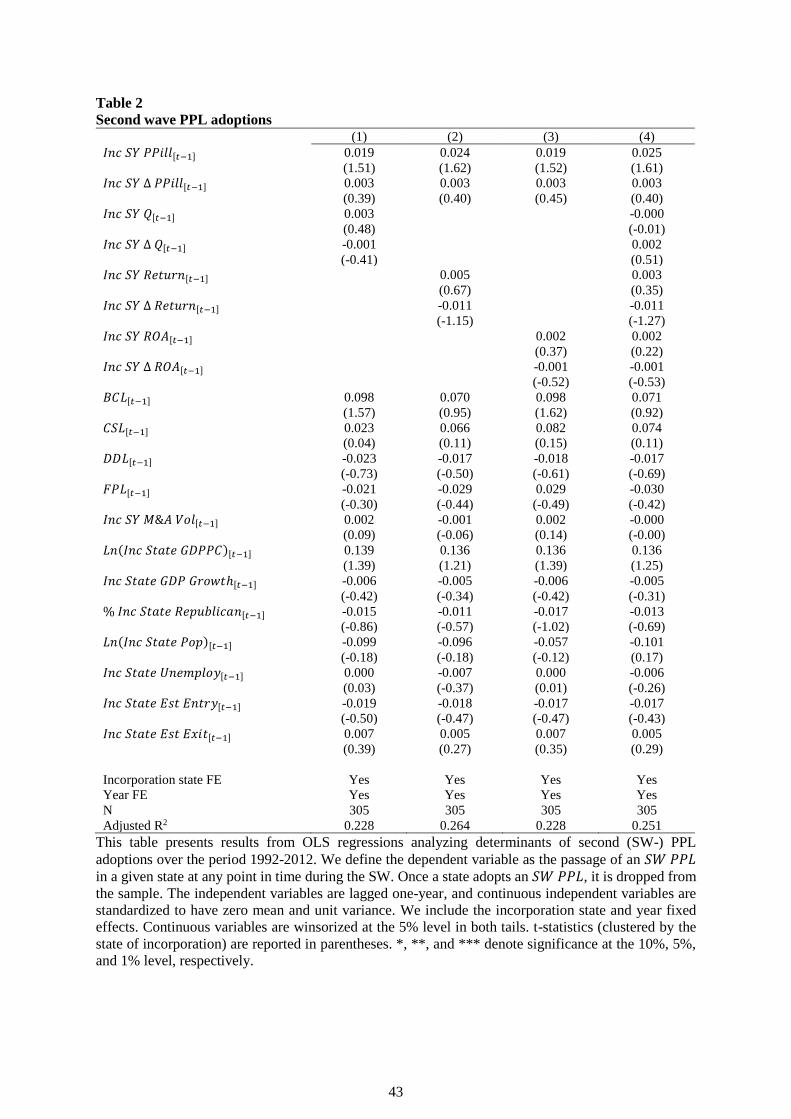
43
Table 2
Second wave PPL adoptions (1) (2) (3) (4)
𝐼𝑛𝑐 𝑆𝑌 𝑃𝑃𝑖𝑙𝑙[𝑡−1] 0.019
(1.51)
0.024
(1.62)
0.019
(1.52)
0.025
(1.61)
𝐼𝑛𝑐 𝑆𝑌 ∆ 𝑃𝑃𝑖𝑙𝑙[𝑡−1] 0.003
(0.39)
0.003
(0.40)
0.003
(0.45)
0.003
(0.40)
𝐼𝑛𝑐 𝑆𝑌 𝑄[𝑡−1] 0.003
(0.48)
-0.000
(-0.01)
𝐼𝑛𝑐 𝑆𝑌 ∆ 𝑄[𝑡−1] -0.001
(-0.41)
0.002
(0.51)
𝐼𝑛𝑐 𝑆𝑌 𝑅𝑒𝑡𝑢𝑟𝑛[𝑡−1] 0.005
(0.67)
0.003
(0.35)
𝐼𝑛𝑐 𝑆𝑌 ∆ 𝑅𝑒𝑡𝑢𝑟𝑛[𝑡−1]
-0.011
(-1.15)
-0.011
(-1.27)
𝐼𝑛𝑐 𝑆𝑌 𝑅𝑂𝐴[𝑡−1] 0.002
(0.37)
0.002
(0.22)
𝐼𝑛𝑐 𝑆𝑌 ∆ 𝑅𝑂𝐴[𝑡−1] -0.001
(-0.52)
-0.001
(-0.53)
𝐵𝐶𝐿[𝑡−1] 0.098
(1.57)
0.070
(0.95)
0.098
(1.62)
0.071
(0.92)
𝐶𝑆𝐿[𝑡−1] 0.023
(0.04)
0.066
(0.11)
0.082
(0.15)
0.074
(0.11)
𝐷𝐷𝐿[𝑡−1] -0.023
(-0.73)
-0.017
(-0.50)
-0.018
(-0.61)
-0.017
(-0.69)
𝐹𝑃𝐿[𝑡−1] -0.021
(-0.30)
-0.029
(-0.44)
0.029
(-0.49)
-0.030
(-0.42)
𝐼𝑛𝑐 𝑆𝑌 𝑀&𝐴 𝑉𝑜𝑙[𝑡−1] 0.002
(0.09)
-0.001
(-0.06)
0.002
(0.14)
-0.000
(-0.00)
𝐿𝑛(𝐼𝑛𝑐 𝑆𝑡𝑎𝑡𝑒 𝐺𝐷𝑃𝑃𝐶)[𝑡−1] 0.139
(1.39)
0.136
(1.21)
0.136
(1.39)
0.136
(1.25)
𝐼𝑛𝑐 𝑆𝑡𝑎𝑡𝑒 𝐺𝐷𝑃 𝐺𝑟𝑜𝑤𝑡ℎ[𝑡−1] -0.006
(-0.42)
-0.005
(-0.34)
-0.006
(-0.42)
-0.005
(-0.31)
% 𝐼𝑛𝑐 𝑆𝑡𝑎𝑡𝑒 𝑅𝑒𝑝𝑢𝑏𝑙𝑖𝑐𝑎𝑛[𝑡−1] -0.015
(-0.86)
-0.011
(-0.57)
-0.017
(-1.02)
-0.013
(-0.69)
𝐿𝑛(𝐼𝑛𝑐 𝑆𝑡𝑎𝑡𝑒 𝑃𝑜𝑝)[𝑡−1] -0.099
(-0.18)
-0.096
(-0.18)
-0.057
(-0.12)
-0.101
(0.17)
𝐼𝑛𝑐 𝑆𝑡𝑎𝑡𝑒 𝑈𝑛𝑒𝑚𝑝𝑙𝑜𝑦[𝑡−1] 0.000
(0.03)
-0.007
(-0.37)
0.000
(0.01)
-0.006
(-0.26)
𝐼𝑛𝑐 𝑆𝑡𝑎𝑡𝑒 𝐸𝑠𝑡 𝐸𝑛𝑡𝑟𝑦[𝑡−1] -0.019
(-0.50)
-0.018
(-0.47)
-0.017
(-0.47)
-0.017
(-0.43)
𝐼𝑛𝑐 𝑆𝑡𝑎𝑡𝑒 𝐸𝑠𝑡 𝐸𝑥𝑖𝑡[𝑡−1] 0.007
(0.39)
0.005
(0.27)
0.007
(0.35)
0.005
(0.29)
Incorporation state FE Yes Yes Yes Yes
Year FE Yes Yes Yes Yes
N 305 305 305 305
Adjusted R2 0.228 0.264 0.228 0.251
This table presents results from OLS regressions analyzing determinants of second (SW-) PPL
adoptions over the period 1992-2012. We define the dependent variable as the passage of an 𝑆𝑊 𝑃𝑃𝐿
in a given state at any point in time during the SW. Once a state adopts an 𝑆𝑊 𝑃𝑃𝐿, it is dropped from
the sample. The independent variables are lagged one-year, and continuous independent variables are
standardized to have zero mean and unit variance. We include the incorporation state and year fixed
effects. Continuous variables are winsorized at the 5% level in both tails. t-statistics (clustered by the
state of incorporation) are reported in parentheses. *, **, and *** denote significance at the 10%, 5%,
and 1% level, respectively.

44
Table 3
First wave PPLs and firm-level poison pills Entire FW-period Post-Moran Post-Interco & Pillsbury
(1) (2) (3) (4) (5) (6)
𝐹𝑊 𝑃𝑃𝐿[𝑡] 0.069
(1.32)
0.072
(1.38)
0.038
(0.59)
0.044
(0.68)
0.076*
(1.85)
0.046*
(1.76)
𝐸𝑣𝑒𝑛𝑡𝑢𝑎𝑙 𝑆𝑊 𝑃𝑃𝐿[𝑡] 0.027
(0.41)
0.062
(1.00)
-0.262***
(-4.91)
𝑄[𝑡−1] 0.000
(0.00)
0.000
(0.01)
-0.016
(-1.46)
-0.016
(-1.47)
0.006
(0.85)
0.008
(1.05)
𝐿𝑛(𝐴𝑠𝑠𝑒𝑡𝑠)[𝑡−1] 0.080***
(4.18)
0.079***
(4.09)
0.102***
(3.79)
0.102***
(3.76)
0.027
(0.91)
0.027
(0.91)
𝐿𝑛(𝐴𝑔𝑒)[𝑡−1] -0.034
(-0.43)
-0.034
(-0.42)
0.268***
(2.68)
0.268***
(2.68)
0.147**
(2.51)
0.149**
(2.52)
𝐻𝐻𝐼[𝑡−1] -0.014
(-0.97)
-0.014
(-0.97)
-0.030*
(-1.98)
-0.030*
(-1.99)
-0.003
(-0.25)
-0.002
(-0.14)
𝑆𝐺[𝑡−1] -0.018***
(-6.42)
-0.018***
(-6.36)
-0.014***
(-4.40)
-0.014***
(-4.39)
-0.008**
(-2.37)
-0.009**
(-2.47)
𝐿𝑜𝑠𝑠[𝑡−1] 0.019**
(2.28)
0.019**
(2.29)
0.021**
(2.52)
0.021**
(2.56)
0.005
(0.63)
0.004
(0.54)
𝐷𝐸𝑄[𝑡−1] -0.000
(-0.05)
-0.000
(-0.04)
-0.016***
(-3.03)
-0.016***
(-3.04)
-0.008**
(-2.66)
-0.008**
(-2.56)
𝐹𝐿𝐼𝑄[𝑡−1] 0.025**
(2.56)
0.025**
(2.55)
0.015
(1.48)
0.015
(1.46)
0.012***
(2.77)
0.012**
(2.55)
𝐼𝑂[𝑡−1] 0.085***
(6.20)
0.085***
(6.23)
0.066***
(4.76)
0.066***
(4.79)
0.024**
(2.23)
0.024**
(2.17)
Other antitakeover laws Yes Yes Yes Yes Yes Yes
Firm FE Yes Yes Yes Yes Yes Yes
Division × Year FE Yes Yes Yes Yes Yes Yes
Industry × Year FE Yes Yes Yes Yes Yes Yes
N 9,037 9,037 6,562 6,562 4,258 4,258
Adjusted R2 0.709 0.709 0.765 0.765 0.918 0.918
This table presents results from OLS regressions exploring the implications of FW-PPLs for firm-level poison pills over the entire FW-period (1983 to 1993),
as well as post-Moran (1986 to 1993) and post-Interco & Pillsbury (1989 to 1993). The dependent variable 𝑃𝑃𝑖𝑙𝑙 is an indicator for whether a firm has a poison
pill in-place as of the current year. 𝐹𝑊 𝑃𝑃𝐿 is an indicator for whether a state has adopted a PPL at any point in time between 1986 and 1990. 𝐸𝑣𝑒𝑛𝑡𝑢𝑎𝑙 𝑆𝑊 𝑃𝑃𝐿
is a dummy variable equal to one if a firm is incorporated in a state that adopts a PPL during the period 1995 and 2009. The “Other antitakeover laws” include
𝐵𝐶𝐿, 𝐶𝑆𝐿, 𝐷𝐷𝐿, and 𝐹𝑃𝐿. Unreported insignificant predictors include 𝐶𝐴𝑃𝑋/𝐴𝑠𝑠𝑒𝑡𝑠 and 𝑅&𝐷/𝑆𝑎𝑙𝑒𝑠. Division fixed effects are measured using U.S. Census

45
divisions, and industry fixed effects are defined by two-digit SIC codes. Continuous variables are winsorized at the 5% level in both tails. Internet Appendix A
provides variable definitions. t-statistics (clustered by the state of incorporation) are reported in parentheses. *, **, and *** denote significance at the 10%, 5%,
and 1% level, respectively.

46
Table 4
Firm-level poison pill adoptions Panel A: Explaining the adoption and maintenance of 𝑃𝑃𝑖𝑙𝑙 (1) (2) (3) (4)
𝑃𝑃𝐿[𝑡] 0.058*
(1.97)
0.030
(1.20)
𝑄[𝑡−1] -0.050***
(-9.13)
-0.030***
(-7.29)
𝑃𝑃𝐿[𝑡] × 𝑄(𝐿𝑜𝑤𝑒𝑠𝑡)[𝑡−1] 0.087**
(2.54)
0.053*
(1.79)
𝑃𝑃𝐿[𝑡] × 𝑄(𝐿𝑜𝑤)[𝑡−1] 0.072**
(2.26)
0.033
(1.27)
𝑃𝑃𝐿[𝑡] × 𝑄(𝐻𝑖𝑔ℎ)[𝑡−1] 0.060*
(1.88)
0.031
(1.17)
𝑃𝑃𝐿[𝑡] × 𝑄(𝐻𝑖𝑔ℎ𝑒𝑠𝑡)[𝑡−1] 0.017
(0.49)
0.002
(0.09)
𝐿𝑛(𝐴𝑠𝑠𝑒𝑡𝑠)[𝑡−1] 0.088***
(5.25)
0.099***
(6.03)
𝐿𝑛(𝐴𝑔𝑒)[𝑡−1] 0.343***
(14.11)
0.347***
(14.34)
𝐻𝐻𝐼[𝑡−1] -0.020**
(-2.33)
-0.020**
(-2.31)
𝑆𝐺[𝑡−1] -0.012***
(-3.21)
-0.016***
(-3.83)
𝐿𝑜𝑠𝑠[𝑡−1] -0.005
(-0.75)
-0.002
(-0.38)
𝐷𝐸𝑄[𝑡−1] 0.009**
(2.38)
0.011***
(2.86)
𝐹𝐿𝐼𝑄[𝑡−1] -0.022***
(-3.50)
-0.025***
(-4.02)
𝐶𝐴𝑃𝑋/𝐴𝑠𝑠𝑒𝑡𝑠[𝑡−1] -0.010**
(-2.41)
-0.013***
(-2.98)
𝑅&𝐷/𝑆𝑎𝑙𝑒𝑠[𝑡−1] -0.014*
(-1.77)
-0.012
(-1.55)
𝐼𝑂[𝑡−1] 0.038***
(5.32)
0.035***
(4.95)
Other antitakeover laws Yes Yes Yes Yes
Firm FE Yes Yes Yes Yes
Division × Year FE Yes Yes Yes Yes
Industry × Year FE Yes Yes Yes Yes
N 26,248 26,248 26,248 26,248
Adjusted R2 0.577 0.601 0.573 0.600

47
Panel B: The implications of 𝑃𝑃𝐿s for:
𝑁𝑒𝑤 𝑃𝑃𝑖𝑙𝑙[𝑡] 𝐿𝑛(𝑃𝑃𝑖𝑙𝑙 𝐷𝑢𝑟𝑎𝑡𝑖𝑜𝑛)[𝑡]
(1) (2) (3) (4)
𝑃𝑃𝐿[𝑡] 0.053
(1.19)
0.179*
(1.90)
𝑄[𝑡−1] -0.019***
(-4.24)
-0.094***
(-7.83)
𝑃𝑃𝐿[𝑡] × 𝑄(𝐿𝑜𝑤𝑒𝑠𝑡)[𝑡−1] 0.084*
(1.75)
0.272**
(2.66)
𝑃𝑃𝐿[𝑡] × 𝑄(𝐿𝑜𝑤)[𝑡−1] 0.076
(1.62)
0.196**
(2.12)
𝑃𝑃𝐿[𝑡] × 𝑄(𝐻𝑖𝑔ℎ)[𝑡−1] 0.030
(0.64)
0.191*
(1.96)
𝑃𝑃𝐿[𝑡] × 𝑄(𝐻𝑖𝑔ℎ𝑒𝑠𝑡)[𝑡−1] 0.020
(0.46)
0.082
(0.76)
Other antitakeover laws Yes Yes Yes Yes
Control variables Yes Yes Yes Yes
Firm FE Yes Yes Yes Yes
Division × Year FE Yes Yes Yes Yes
Industry × Year FE Yes Yes Yes Yes
N 6,372 6,372 17,482 17,482
Adjusted R2 0.224 0.224 0.523 0.523
This table presents results from OLS regressions analyzing the implications of PPLs for firm-level
poison pill dynamics over the sample period 1992 to 2012. The dependent variable in Panel A is an
indicator for whether a firm has a poison pill in-place as of the current year (𝑃𝑃𝑖𝑙𝑙). We define the
dependent variables in Panel B as an indicator for the first time a firm adopts a poison pill (𝑁𝑒𝑤 𝑃𝑃𝑖𝑙𝑙), and a count variable for the number of years a firm has a pill in-place (𝐿𝑛(𝑃𝑃𝑖𝑙𝑙 𝐷𝑢𝑟𝑎𝑡𝑖𝑜𝑛)). Specific
to the first two columns, once a firm adopts a new pill, it is excluded from the sample. We only include
firms that eventually adopt a pill in these regressions. In both panels, the independent variables are
lagged one-year, and continuous independent variables are standardized to have zero mean and unit
variance. The “Other antitakeover laws” include 𝐵𝐶𝐿, 𝐶𝑆𝐿, 𝐷𝐷𝐿, and 𝐹𝑃𝐿. Division fixed effects are
measured using U.S. Census divisions, and industry fixed effects are defined by two-digit SIC codes.
Continuous variables are winsorized at the 5% level in both tails. Internet Appendix A provides variable
definitions. 𝑡-statistics (clustered by the state of incorporation) are reported in parentheses. *, **, and
*** denote significance at the 10%, 5%, and 1% level, respectively.

48
Table 5
PPLs and Tobin’s 𝐐 (1) (2) (3) (4) (5)
𝑃𝑃𝐿[𝑡] 0.105***
(3.66)
0.095***
(3.30)
0.091***
(2.76)
0.089***
(2.83)
0.083**
(2.01)
𝑃𝑃𝑖𝑙𝑙[𝑡−1] -0.139***
(-6.47)
-0.069***
(-3.09)
-0.072***
(-2.92)
-0.067***
(-3.02)
-0.067***
(-3.20)
𝑃𝑃𝐿[𝑡] × 𝑃𝑃𝑖𝑙𝑙[𝑡−1] 0.011
(0.31)
𝐿𝑛(𝐴𝑠𝑠𝑒𝑡𝑠)[𝑡−1] -0.327***
(-19.64)
-0.327***
(-19.67)
-0.325***
(-22.41)
-0.334***
(-22.10)
𝐿𝑛(𝐴𝑔𝑒)[𝑡−1] -0.071
(-1.38)
-0.070
(-1.37)
-0.067
(-1.16)
-0.062
(-0.95)
𝐻𝐻𝐼[𝑡−1] 0.037
(0.59)
0.038
(0.60)
0.037
(0.59)
0.061
(0.96)
𝑆𝐺[𝑡−1]
0.416***
(18.41)
0.416***
(18.42)
0.416***
(17.92)
0.420***
(20.47)
𝐿𝑜𝑠𝑠[𝑡−1] -0.042***
(-5.22)
-0.042***
(-5.22)
-0.043***
(-5.34)
-0.039***
(-4.83)
𝐷𝐸𝑄[𝑡−1] -0.060***
(-7.01)
-0.060***
(-7.00)
-0.061***
(-8.10)
-0.060***
(-5.91)
𝐹𝐿𝐼𝑄[𝑡−1] 0.187***
(4.51)
0.187***
(4.50)
0.183***
(4.28)
0.200***
(4.56)
𝐶𝐴𝑃𝑋/𝐴𝑠𝑠𝑒𝑡𝑠[𝑡−1] 0.755***
(4.55)
0.755***
(4.55)
0.731***
(4.36)
0.678***
(3.44)
𝑅&𝐷/𝑆𝑎𝑙𝑒𝑠[𝑡−1] -0.394
(-0.83)
-0.394
(-0.83)
-0.407
(-0.88)
-0.282
(-0.70)
𝐼𝑂[𝑡−1] 0.165***
(4.66)
0.165***
(4.63)
0.160***
(4.37)
0.168***
(4.47)
Other antitakeover laws Yes Yes Yes Yes Yes
Firm FE Yes Yes Yes Yes Yes
Division × Year FE Yes Yes Yes No No
Region × Year FE No No No Yes No
State × Year FE No No No No Yes
Industry × Year FE Yes Yes Yes Yes Yes
N 26,254 26,254 26,254 26,254 26,254
Adjusted R2 0.649 0.674 0.674 0.674 0.674
This table presents results from OLS regressions analyzing the value implications of PPLs over the
period 1992 to 2012. The dependent variable is Tobin’s Q (𝑄). The “Other antitakeover laws” include
𝐵𝐶𝐿, 𝐶𝑆𝐿, 𝐷𝐷𝐿, and 𝐹𝑃𝐿. Division (region) fixed effects are measured using U.S. Census divisions
(regions), state fixed effects are defined by a firm’s state of location, and industry fixed effects are
defined by two-digit SIC codes. Continuous variables are winsorized at the 5% level in both tails. t-
statistics (clustered by the state of incorporation) are reported in parentheses. *, **, and *** denote
significance at the 10%, 5%, and 1% level, respectively.

49
Table 6
PPLs and Tobin’s Q in a matched sample
Panel A: Pre-treatment year (t-1) summary statistics
(1) (2) (3)
Treated Control Difference
𝑄[𝑡] 1.744
(0.986)
1.814
(0.919)
-0.071
(-0.85)
𝑇𝑜𝑡𝑎𝑙 𝐴𝑠𝑠𝑒𝑡𝑠[𝑡] 1908.5
(5510.9)
1938.2
(4977.2)
-29.67
(-0.10)
𝑃𝑃𝑖𝑙𝑙[𝑡] 0.330
(0.471)
0.330
(0.471)
0.000
(0.00)
𝑆𝐼𝐶2[𝑡] 43.63
(19.63)
43.69
(19.75)
-0.057
(-0.03)
𝐷𝑖𝑣𝑖𝑠𝑖𝑜𝑛𝑠[𝑡] 5.511
(2.388)
5.652
(2.571)
-0.140
(-0.65)
N (by group) 264 264
Panel B: The effect of 𝑃𝑃𝐿s on 𝑄
(1) (2) (3)
𝑇𝑟𝑒𝑎𝑡𝑒𝑑[𝑡] × 𝑃𝑜𝑠𝑡[𝑡] 0.087**
(2.10)
0.098**
(2.13)
0.107**
(2.40)
𝑃𝑃𝑖𝑙𝑙[𝑡−1] -0.047
(-0.68)
-0.035
(-0.46)
-0.046
(-0.87)
Other antitakeover laws Yes Yes Yes
Control variables No Yes Yes
Firm FE Yes Yes Yes
Division × Year FE Yes Yes No
Industry × Year FE Yes Yes No
Year FE No No Yes
N 2,620 2,620 2,620
Adjusted R2 0.729 0.752 0.724
This table presents summary statistics and results from OLS regressions for a matched sample. 𝑇𝑟𝑒𝑎𝑡𝑒𝑑
(control) firms are defined as companies incorporated in states that (do not) adopt PPLs (in at least the
three years following its matched counterpart’s adoption year). We use propensity score matching with
replacement in year 𝑡-1 to create a sample matched on 𝑄 and 𝑇𝑜𝑡𝑎𝑙 𝐴𝑠𝑠𝑒𝑡𝑠, and exactly on 𝑃𝑃𝑖𝑙𝑙, and
when possible, exactly on divisions, and two-digit SIC industries – when it is not possible to match
exactly on division (SIC2), we match on the next closest division (SIC1). Panel A reports pre-treatment
year summary statistics. We also report differences between sample means (𝑡-stats in parentheses).
Panel B shows the matched sample 𝑄 regression results over 𝑡 ± 3 estimation windows. The “Other
antitakeover laws” include 𝐵𝐶𝐿, 𝐶𝑆𝐿, 𝐷𝐷𝐿, and 𝐹𝑃𝐿. “Control variables” include 𝐿𝑛(𝐴𝑠𝑠𝑒𝑡𝑠),
𝐿𝑛(𝐴𝑔𝑒), 𝐻𝐻𝐼, 𝑆𝐺, 𝐿𝑜𝑠𝑠, 𝐷𝐸𝑄, 𝐹𝐿𝐼𝑄, 𝐶𝐴𝑃𝑋/𝐴𝑠𝑠𝑒𝑡𝑠, 𝑅&𝐷/𝑆𝑎𝑙𝑒𝑠, and 𝐼𝑂. Division fixed effects are
measured using U.S. Census divisions, and industry fixed effects are defined by two-digit SIC codes.
𝑇𝑟𝑒𝑎𝑡𝑒𝑑 and 𝑃𝑜𝑠𝑡 are omitted due to collinearity with fixed effects. Continuous variables are
winsorized at the 5% level in both tails. t-statistics (clustered by the state of incorporation) are reported
in parentheses. *, **, and *** denote significance at the 10%, 5%, and 1% level, respectively.

50
Table 7
Alternative value measures Panel A: The implications of PPLs for:
𝐸𝑥𝑐𝑒𝑠𝑠 𝑅𝑒𝑡𝑢𝑟𝑛[𝑡] 𝑅𝑂𝐴[𝑡] 𝑇𝑜𝑡𝑎𝑙 𝑄[𝑡]
(1) (2) (3) (4) (5) (6)
𝑃𝑃𝐿[𝑡] 0.032**
(2.21)
0.006**
(2.14)
0.104***
(2.79)
𝑇𝑟𝑒𝑎𝑡𝑒𝑑[𝑡] × 𝑃𝑜𝑠𝑡[𝑡] 0.043**
(2.40)
0.010**
(2.09)
0.105**
(2.50)
𝑃𝑃𝑖𝑙𝑙[𝑡−1] -0.012
(-1.01)
-0.018
(-0.32)
-0.003***
(-2.85)
-0.013
(-1.62)
-0.101***
(-5.21)
-0.093
(-0.90)
Other antitakeover laws Yes Yes Yes Yes Yes Yes
Control variables Yes Yes Yes Yes Yes Yes
Firm FE Yes Yes Yes Yes Yes Yes
Division × Year FE Yes Yes Yes Yes Yes Yes
Industry × Year FE Yes Yes Yes Yes Yes Yes
N 26,253 2,621 26,239 2,578 26,225 2,570
Adjusted R2 0.114 0.183 0.671 0.772 0.666 0.757

51
Panel B: Portfolio analysis Four-factor model Three-factor model Market-factor model
Portfolio “6m36”
Long Short Long -
Short
Long Short Long -
Short
Long Short Long -
Short
𝐴𝑙𝑝ℎ𝑎 (monthly) 1.048**
(2.28)
0.179
(0.46)
0.989**
(2.15)
1.007**
(2.21)
0.092
(0.24)
1.005**
(2.23)
0.926**
(2.09)
0.148
(0.41)
0.856*
(1.92)
Average # firms 45.11 45.58 - 45.11 45.58 - 45.11 45.58 -
N 252 254 - 252 254 - 252 254 -
Adjusted R2 0.278 0.372 0.033 0.280 0.367 0.037 0.271 0.361 0.005
Four-factor model Three-factor model Market-factor model
Portfolio “12m36”
Long Short Long -
Short
Long Short Long -
Short
Long Short Long -
Short
𝐴𝑙𝑝ℎ𝑎 (monthly) 0.681
(1.49)
-0.136
(-0.37)
0.991**
(2.23)
0.623
(1.37)
-0.225
(-0.63)
1.014**
(2.35)
0.576
(1.30)
-0.165
(-0.48)
0.882**
(2.04)
Average # firms 49.81 50.07 - 49.81 50.07 - 49.81 50.07 -
N 253 254 - 253 254 - 253 254 -
Adjusted R2 0.297 0.402 0.029 0.297 0.396 0.033 0.295 0.392 0.004
This table examines the effect of PPLs on firm value using alternative measures. Panel A reports results
from OLS regressions on both the full sample over the period 1992 to 2012 and the matched sample
with 𝑡 ± 3 estimation windows. The dependent variables include 𝐸𝑥𝑐𝑒𝑠𝑠 𝑅𝑒𝑡𝑢𝑟𝑛, 𝑅𝑂𝐴, and 𝑇𝑜𝑡𝑎𝑙 𝑄.
The “Other antitakeover laws” include 𝐵𝐶𝐿, 𝐶𝑆𝐿, 𝐷𝐷𝐿, and 𝐹𝑃𝐿. “Control variables” include
𝐿𝑛(𝐴𝑠𝑠𝑒𝑡𝑠), 𝐿𝑛(𝐴𝑔𝑒), 𝐻𝐻𝐼, 𝑆𝐺, 𝐿𝑜𝑠𝑠, 𝐷𝐸𝑄, 𝐹𝐿𝐼𝑄, 𝐶𝐴𝑃𝑋/𝐴𝑠𝑠𝑒𝑡𝑠, 𝑅&𝐷/𝑆𝑎𝑙𝑒𝑠, and 𝐼𝑂. Division
fixed effects are measured using U.S. Census divisions, and industry fixed effects are defined by two-
digit SIC codes. t-statistics (clustered by the state of incorporation) are reported in parentheses. Panel
B shows results from a portfolio analysis using the matched sample 𝑇𝑟𝑒𝑎𝑡𝑒𝑑 and control firms. The
long (short) portfolios are constructed as follows. For portfolios “6m36” and “12m36” we include all
stocks of matched 𝑇𝑟𝑒𝑎𝑡𝑒𝑑 (control) firms starting either 6 or 12 months before the fiscal year-end of
the year in which the matched treated incorporating state adopts a PPL and hold (short) these stocks for
36 months. The long-short portfolios are then created by differencing the portfolio returns of the long
and short portfolios, for each respective month. We use the four-factor, three-factor, and market factor
models to estimate 𝐴𝑙𝑝ℎ𝑎 (monthly), where each of the models uses a value-weighted market factor,
and we calculate the portfolio return with each stock weighted by its market capitalization immediately
preceding its inclusion in the portfolio. 𝑡-statistics (based on robust standard errors) are presented in
parentheses. The number of stocks in the long and short portfolios are averaged across all months and
displayed in the “Average # firms” row. The “N” row shows the total number of firms with useable
returns. In both panels, continuous variables are winsorized at the 5% level in both tails. Internet
Appendix A provides variable definitions. *, **, and *** denote significance at the 10%, 5%, and 1%
level, respectively.

52
Table 8
Testing the bargaining power hypothesis Panel A: PPLs and takeover propensities
𝐵𝑖𝑑[𝑡] 𝐴𝑐𝑞𝑢𝑖𝑟𝑒𝑑[𝑡] 𝐴𝑐𝑞𝑢𝑖𝑟𝑒𝑑[𝑡]
(only takeover targets)
(1) (2) (3) (4) (5) (6)
𝑃𝑃𝐿[𝑡] × 𝑃𝑃𝑖𝑙𝑙[𝑡] 0.010
(0.22)
0.005
(0.35)
0.135
(1.05)
𝑃𝑃𝐿[𝑡] -0.026
(-1.26)
-0.028
(-1.31)
-0.002
(-0.14)
-0.004
(-0.28)
0.009
(0.07)
-0.063
(-0.40)
𝑃𝑃𝑖𝑙𝑙[𝑡−1] 0.022
(1.25)
0.020
(1.07)
-0.001
(-0.18)
-0.002
(-0.52)
-0.027
(-0.59)
-0.070
(-1.07)
Other antitakeover laws Yes Yes Yes Yes Yes Yes
Control variables Yes Yes Yes Yes Yes Yes
Division × Year FE Yes Yes Yes Yes No No
Industry × Year FE Yes Yes Yes Yes No No
Division FE No No No No Yes Yes
N 24,653 24,653 24,653 24,653 257 257
Adjusted R2 0.043 0.043 0.095 0.095 0.144 0.144
Panel B: PPLs and takeover premiums
𝑇𝑜𝑡𝑎𝑙 𝑃𝑟𝑒𝑚𝑖𝑢𝑚[𝑡] 𝑃𝑟𝑒𝑚𝑖𝑢𝑚 𝐼𝑛𝑐𝑟𝑒𝑎𝑠𝑒[𝑡]
(1) (2) (3) (4) (5)
𝑃𝑃𝐿[𝑡] × 𝑃𝑃𝑖𝑙𝑙[𝑡] 0.077**
(2.18)
0.139**
(2.28)
0.146**
(2.42)
𝑃𝑃𝐿[𝑡] 0.043
(0.68)
0.004
(0.06)
0.107
(1.48)
0.030
(0.38)
0.024
(0.30)
𝑃𝑃𝑖𝑙𝑙[𝑡] 0.049***
(3.12)
0.024*
(1.86)
0.093***
(3.11)
0.048**
(2.41)
0.049**
(2.37)
𝑀𝑜𝑟𝑛𝑖𝑛𝑔-𝐴𝑓𝑡𝑒𝑟 𝑃𝑃𝑖𝑙𝑙[𝑡] 0.096**
(2.19)
Other antitakeover laws Yes Yes Yes Yes Yes
Control variables Yes Yes Yes Yes Yes
Division FE Yes Yes Yes Yes Yes
N 257 257 257 257 257
Adjusted R2 0.039 0.053 0.104 0.127 0.133
This table presents results from OLS regressions analyzing the takeover implications of PPLs over the
period 1992 to 2012. Panel A examines the effect of PPLs and 𝑃𝑃𝑖𝑙𝑙 on takeover propensities. The
dependent variables include 𝐵𝑖𝑑 and 𝐴𝑐𝑞𝑢𝑖𝑟𝑒𝑑, where the last two columns only consider firms that
receive takeover bids. 𝐵𝑖𝑑 (𝐴𝑐𝑞𝑢𝑖𝑟𝑒𝑑) is an indicator equal to one if a firm receives a takeover bid
(acquired) as cataloged by the SDC M&A database. Division fixed effects are measured using U.S.
Census divisions, and industry fixed effects are defined by two-digit SIC codes. Panel B explores the
effect of PPLs and 𝑃𝑃𝑖𝑙𝑙 and 𝑀𝑜𝑟𝑛𝑖𝑛𝑔-𝐴𝑓𝑡𝑒𝑟 𝑃𝑃𝑖𝑙𝑙 on takeover premiums. The dependent variables
include 𝑇𝑜𝑡𝑎𝑙 𝑃𝑟𝑒𝑚𝑖𝑢𝑚 and 𝑃𝑟𝑒𝑚𝑖𝑢𝑚 𝐼𝑛𝑐𝑟𝑒𝑎𝑠𝑒. 𝑇𝑜𝑡𝑎𝑙 𝑃𝑟𝑒𝑚𝑖𝑢𝑚 (𝑃𝑟𝑒𝑚𝑖𝑢𝑚 𝐼𝑛𝑐𝑟𝑒𝑎𝑠𝑒) is the total
percentage premium (premium increase in percentage) offered relative to the target’s price 20 days
before the initial offer. The “Other antitakeover laws” include 𝐵𝐶𝐿, 𝐶𝑆𝐿, 𝐷𝐷𝐿, and 𝐹𝑃𝐿. “Control
variables” include 𝑀𝑢𝑙𝑡𝑖𝑏𝑖𝑑, 𝑅𝑒𝑡𝑢𝑟𝑛, 𝐿𝑛(𝐴𝑠𝑠𝑒𝑡𝑠), 𝐿𝑛(𝐴𝑔𝑒), 𝐻𝐻𝐼, 𝑆𝐺, 𝐿𝑜𝑠𝑠, 𝐷𝐸𝑄, 𝐹𝐿𝐼𝑄,
𝐶𝐴𝑃𝑋/𝐴𝑠𝑠𝑒𝑡𝑠, 𝑅&𝐷/𝑆𝑎𝑙𝑒𝑠, and 𝐼𝑂. Continuous variables are winsorized at the 5% level in both tails.
Internet Appendix A provides variable definitions. t-statistics (clustered by the state of incorporation)
are reported in parentheses. *, **, and *** denote significance at the 10%, 5%, and 1% level,
respectively.

53
Table 9
Testing the bonding hypothesis
Panel A: Heterogeneous effects of PPLs for innovative firms
(1) (2) (3)a (4)
𝑃𝑃𝐿[𝑡] × 𝑅&𝐷/𝑆𝑎𝑙𝑒𝑠[𝑡−1] 2.139**
(2.59)
𝑃𝑃𝐿[𝑡] × 𝐼𝑛𝑡𝑎𝑛𝑔𝑖𝑏𝑙𝑒 𝐶𝑎𝑝𝑖𝑡𝑎𝑙[𝑡−1] 0.198***
(3.04)
𝑃𝑃𝐿[𝑡] × 𝐶𝑊 𝑃𝑎𝑡𝑒𝑛𝑡𝑠[𝑡−1] 0.027**
(2.26)
𝑃𝑃𝐿[𝑡] × 𝑅𝑄[𝑡−1] 0.780*
(1.78)
𝑃𝑃𝐿[𝑡] 0.036
(1.28)
-0.014
(-0.30)
0.073**
(2.30)
-0.030
(-0.29)
𝑅&𝐷/𝑆𝑎𝑙𝑒𝑠[𝑡−1] -0.640*
(-1.69)
𝐼𝑛𝑡𝑎𝑛𝑔𝑖𝑏𝑙𝑒 𝐶𝑎𝑝𝑖𝑡𝑎𝑙[𝑡−1] -0.509***
(-15.41)
𝐶𝑊 𝑃𝑎𝑡𝑒𝑛𝑡𝑠[𝑡−1] -0.000
(-0.02)
𝑅𝑄[𝑡−1] 0.303
(1.41)
𝑃𝑃𝑖𝑙𝑙[𝑡−1] -0.070***
(-3.12)
-0.061***
(-2.70)
-0.062**
(-2.52)
-0.100**
(-2.24)
Other antitakeover laws Yes Yes Yes Yes
Control variables Yes Yes Yes Yes
Firm FE Yes Yes Yes Yes
Division × Year FE Yes Yes Yes Yes
Industry × Year FE Yes Yes Yes Yes
N 26,254 26,254 24,231 11,620
Adjusted R2 0.675 0.679 0.680 0.669
a Our patent data ends in 2010.

54
Panel B: Heterogeneous effects of PPLs for stakeholder relationships
(1) (2) (3) (4)
𝑃𝑃𝐿[𝑡] × 𝑂𝑟𝑔𝑎𝑛𝑖𝑧𝑎𝑡𝑖𝑜𝑛𝑎𝑙 𝐶𝑎𝑝𝑖𝑡𝑎𝑙[𝑡−1] 0.365***
(2.84)
𝑃𝑃𝐿[𝑡] × 𝐿𝑎𝑟𝑔𝑒 𝐶𝑢𝑠𝑡𝑜𝑚𝑒𝑟[𝑡−1] 0.056*
(1.79)
𝑃𝑃𝐿[𝑡] × 𝑆𝑡𝑟𝑎𝑡𝑒𝑔𝑖𝑐 𝐴𝑙𝑙𝑖𝑎𝑛𝑐𝑒[𝑡−1] 0.101*
(1.83)
𝑃𝑃𝐿[𝑡] × 𝐿𝑎𝑏𝑜𝑟 𝐼𝑛𝑡𝑒𝑛𝑠𝑖𝑡𝑦[𝑡−1] 0.266***
(3.73)
𝑃𝑃𝐿[𝑡] -0.009
(-0.19)
0.101***
(3.35)
0.039
(0.83)
0.085***
(2.84)
𝑂𝑟𝑔𝑎𝑛𝑖𝑧𝑎𝑡𝑖𝑜𝑛𝑎𝑙 𝐶𝑎𝑝𝑖𝑡𝑎𝑙[𝑡−1] -0.283***
(-3.03)
𝐿𝑎𝑟𝑔𝑒 𝐶𝑢𝑠𝑡𝑜𝑚𝑒𝑟[𝑡−1] 0.037***
(2.91)
𝑆𝑡𝑟𝑎𝑡𝑒𝑔𝑖𝑐 𝐴𝑙𝑙𝑖𝑎𝑛𝑐𝑒[𝑡−1] -0.063*
(-1.84)
𝐿𝑎𝑏𝑜𝑟 𝐼𝑛𝑡𝑒𝑛𝑠𝑖𝑡𝑦[𝑡−1] -0.154
(-0.63)
𝑃𝑃𝑖𝑙𝑙[𝑡−1] -0.073***
(-3.03)
-0.069***
(-3.10)
-0.069***
(-3.09)
-0.068***
(-3.15)
Other antitakeover laws Yes Yes Yes Yes
Control variables Yes Yes Yes Yes
Firm FE Yes Yes Yes Yes
Division × Year FE Yes Yes Yes Yes
Industry × Year FE Yes Yes Yes Yes
N 26,254 26,254 26,254 25,965
Adjusted R2 0.669 0.674 0.675 0.676
This table presents results from OLS regressions analyzing the heterogeneous value implications of
PPLs for firms that are more innovative or reliant on stakeholder relationships over the period 1992 to
2012. Panel A (B) interacts 𝑃𝑃𝐿 with the following proxies for innovation (stakeholder relationships):
𝑅&𝐷/𝑆𝑎𝑙𝑒𝑠, 𝐼𝑛𝑡𝑎𝑛𝑔𝑖𝑏𝑙𝑒 𝐶𝑎𝑝𝑖𝑡𝑎𝑙, 𝐶𝑊 𝑃𝑎𝑡𝑒𝑛𝑡𝑠, and 𝑅𝑄 (𝑂𝑟𝑔𝑎𝑛𝑖𝑧𝑎𝑡𝑖𝑜𝑛𝑎𝑙 𝐶𝑎𝑝𝑖𝑡𝑎𝑙, 𝐿𝑎𝑟𝑔𝑒 𝐶𝑢𝑠𝑡𝑜𝑚𝑒𝑟, 𝑆𝑡𝑟𝑎𝑡𝑒𝑔𝑖𝑐 𝐴𝐿𝑙𝑖𝑎𝑛𝑐𝑒, and 𝐿𝑎𝑏𝑜𝑟 𝐼𝑛𝑡𝑒𝑛𝑠𝑖𝑡𝑦). In both panels, the dependent variable
is Tobin’s Q (𝑄). The “Other antitakeover laws” include 𝐵𝐶𝐿, 𝐶𝑆𝐿, 𝐷𝐷𝐿, and 𝐹𝑃𝐿. “Control variables”
include 𝐿𝑛(𝐴𝑠𝑠𝑒𝑡𝑠), 𝐿𝑛(𝐴𝑔𝑒), 𝐻𝐻𝐼, 𝑆𝐺, 𝐿𝑜𝑠𝑠, 𝐷𝐸𝑄, 𝐹𝐿𝐼𝑄, 𝐶𝐴𝑃𝑋/𝐴𝑠𝑠𝑒𝑡𝑠, 𝑅&𝐷/𝑆𝑎𝑙𝑒𝑠, and 𝐼𝑂.
Division fixed effects are measured using U.S. Census divisions, and industry fixed effects are defined
by two-digit SIC codes. Continuous variables are winsorized at the 5% level in both tails. Internet
Appendix A provides variable definitions. t-statistics (clustered by the state of incorporation) are
reported in parentheses. *, **, and *** denote significance at the 10%, 5%, and 1% level, respectively.


