
UNITED STATES DEPARTMENT OF THE INTERIOR
GEOLOGICAL SURVEY
Seismic Study of the Agua de Pau Volcano, Sao Miguel, Apores
by
P .B. Dawson1 , A. M. R. da Silva2, J. R. Evans1 , and H. M. lyer1
Open-File Report 89-331
Prepared on behalf of the Laboratdrio de Geociencias e Tecnologia of the Regional Government of the Apores
in cooperation with the Institute Nacional de Meterologia and Geofisica, Portugal
This report is preliminary and has not been reviewed for confo vmty with U.S. Geo logical Survey editorial standards or with the North American Stratigraphic Code. Any use of trade, product, or firm names is for descriptive purposes only and does not imply endorsement by the U.S. Government.
Park, California 2Ponta Delgada, Apores
1989

Table of Contents
Introduction ............................................................................................................................ 2Geologic and Plate Tectonic Setting ..................................................................................... 2Previous Work on Sao Miguel .............................................................................................. 3Instrumentation ....................................................................................................................... 4Velocity Models ..................................................................................................................... 6Magnitude Determination ...................................................................................................... 8Data ......................................................................................................................................... 9
Local Microseismicity ..................................................................................................... 9Swarm Activity .......................................................................................................... 10
Regional Seismicity ......................................................................................................... 11Vp/Vs and Poisson's Ratio ..................................................................................................... 11
Local Events .................................................................................................................... 12Regional Events ............................................................................................................... 13Observations .................................................................................................................... 13
Regional Travel Time Residual Analysis .............................................................................. 13Discussion ............................................................................................................................... 15
Earthquake and Volcanic Hazards .................................................................................. 16Magma Chamber ............................................................................................................. 17
Review of Seismic Applications and Recommendations for Future Studies ...................... 17Seismic Studies ................................................................................................................ 17
Earthquake Hazards Evaluation and Monitoring ...................................................... 17Volcano Hazards Evaluation and Monitoring ........................................................... 17Geothermal Exploration and Environmental Monitoring of GeothermalDevelopment ............................................................................................................. 18
Microearthquakes .................................................................................................. 19Exploration ....................................................................................................... 19Tectonic Evolution .......................................................................................... 19Detection of Zones of Anomalous Physical Properties ................................. 19Environmental Monitoring ................................................,.................._........ 20
Regional Earthquakes and Teleseisms ................................................................. 20Recommendations ............................................................................................................ 20
Acknowledgements ................................................................................................................ 21References .............................................................................................................................. 21Figure Captions ...................................................................................................................... 28

Tables and Appendices
Table 1 .................................................................................................................................... 5Table 2 ............................................................................................................................. 7Table 3 ....................................................^ 7Table 4 ....................................._^^ 8TibleS .................................................._ 12Table 6 .................................................^ 14Appendix 1 ............................................................................................................................. 58Appendix 2 ............................................................................................................................. 61Appendix 3 ............................................................................................................................. 67

INTRODUCTION
A seismic study of the Agua de Pau volcano on Sao Miguel Island, Apores, was con ducted from June 19, to October 10, 1983 by the United States Geological Survey (USGS) and the Laboratdrio de Geociencias e Tecnologia (LGT) of the Regional Government of the Apores (RGA), in cooperation with the Institute Nacional de Meterologia e Geofisica (INMG), Apores. The study was part of the LGT program to define the geothermal resources of the Agua de Pau volcano. In 1983 LGT contracted the Office of Earthquakes, Volcanoes, and Engineering, USGS to conduct the seismic study. LGT had previously contracted a comprehensive geoscience assessment of the Agua de Pau geothermal field by members of the USGS from Denver, Colorado, Flagstaff, Arizona, the Hawaiian Volcanic Observatory, and Menlo Park, California. The results of this comprehensive study which was funded by the L^5T, USGS, and the United States Agency for International Development (USAID) have been presented by Silva el al. [1985].
In this report we present seismic data collected from the central portion of Sao Miguel using 10 three-channel digital event recorders which were installed by the USGS to augment the 8-station INMG permanent network on Sao Miguel. Included is a brief review of the geo logic and plate tectonic setting of the Apores and the data set, including instrumentation, earthquake location and magnitude determination procedures, temporal and spatial patterns of seismicity, Vp/Vs ratios, and analysis of travel time residuals from regional earthquakes. A review of seismic applications that could serve LGT as a basis for direction in planning future work is included followed by a list of recommendations for upgrading the permanent network and performing further geophysical studies.
GEOLOGIC AND PLATE TECTONIC SETTING
The Aporean archipelago is composed of 9 volcanic islands in the Atlantic Ocean between 37 to 40 degrees north latitude and 25 to 32 degrees west longitude (Figure 1). From a global tectonic point of view the archipelago is located at the westward termination of the Alpide tectonic belt as a triple junction with the Mid-Atlantic Ridge (MAR). The section of this tectonic feature which runs from Gibraltar to the MAR is called the Apores-Gibraltar fracture zone [Laughton et al., 1972]. The Apores-Gibraltar Fracture Zone is characterized by continental collision at the Iberian-African continental margins, and to the west into a deep oceanic basin, a zone of convergence which terminates at about 18°W. From 18°W to 24°W is the 400 km long Gloria fault, an east-west trending strike-slip plate boundary. This linea ment continues west as the East Apores Fracture Zone (EAFZ) to an intersection with the MAR. At about 24°W the Terceira Rift [Machado, 1972] splits off from the EAFZ to the northwest and continues to the North Apores Fracture Zone (NAFZ) and a triple junction with the MAR at about 39°N. Between the Terceira Rift, EAFZ, and the MAR is the broad Apores plateau (Figure 2).
There are two likely mechanisms for the formation of the present Apores triple junction. McKenzie [1972] suggested that the triple junction originated at the junction of the MAR with the EAFZ and then migrated to the north (up the MAR) producing two oblique-spreading arms, one of which would correspond to the Terceira Rift. Krause and Watkins [1970] have proposed a similar model. Searle [1980] prefers a model in which the triple junction jumps from the MAR-EAFZ intersection to a point farther north on the MAR. The Apores spread ing center (Terceira Rift) is then produced, and the EAFZ becomes (relatively) inactive.

The Terceira Rift trends northwest from the Gloria fault at about 36.8°N, 24.5°W to an intersection with the NAFZ near 39.3°N, 28.8°W. The rift is composed of a series of en echelon rifted basins expressed on the islands as grabens where differentiated volcanoes are emplaced, connected by fissural zones where basaltic volcanism occurs. It has been reported that there are chemical differences between volcanic rocks in the fissural zones and the graben zones (where differentiation is occurring), this is verified at least in part on the islands of Faial, Pico, Terceira, and Sao Miguel (Silva, pers. commun. 1986).
Sao Miguel is the largest island in the archipelago, and lies near the southeast end of the Terceira Rift. Three active trachytic stratovolcanoes are the primary morphologic features on the island (Figure 3). The volcano Furnas and associated Povopao volcanic center comprise the eastern highlands of the island. Agua de Pau volcano, at 950m high, occupies the center ofj the island and the the volcano Sete Cidades bolsters the western end of Sao Miguel. All three volcanoes have calderas formed since the late Pleistocene as a result of voluminous eruptions of locally welded pyroclastic flows. Each of these volcanoes have erupted at least once in the last seven hundred years. A 15-km nearly east-west trending zone of fissural basaltic cones runs to Sete Cidades volcano, some 20-km NW of Agua de Pau.
The Agua de Pau volcano lies in a northwest trending graben. The volcano is built on a complex of trachytic welded tuffs, and basaltic and trachytic lava flows which range in age from 300,000 to 100,000 years b.p. The main cone consists of trachytic domes, flows and pyroclastic deposits. C14 ages from the pyroclastic flows on Agua de Pau have yielded ages greater than 40,000 years to about 4600 years b.p. The summit of Agua de Pau contains a caldera 3 kilometers wide and 100 to 300 meters deep. The caldera floor is occupied by Logoa do Fogo (Fogo Lake). The caldera is morphologically young and the present relief likely formed during the eruption of 4600 b.p. Several pyroclastic deposits on Sao Miguel erupted from Agua de Pau suggest earlier caldera forming episodes [Duffield and Muffler, 1984]. A trachytic eruption in a. d. 1563 produced the pumice that covers most of the sum mit and upper flanks of Agua de Pau and mafic lavas were erupted from the flanks of Agua de Pau in a. d. 1563 and 1652.
PREVIOUS WORK ON SAO MIGUELAs part of the geothermal exploration and development program which was begun in
1976 on Sao Miguel, many varied geoscience studies have been undertaken by LOT, private contractors, and the USGS [Geonomics, 1977; Candida et al., 1984; Silva et al., 1985], Prior to 1976 the scientific work on Sao Miguel was restricted to studies of geologic processes and volcanic histories. Geologic accounts of Sao Miguel are given by Jeremine [1957], Zbyszewski [1961], Walker and Croasdale [1971], and Booth et al. [1978]. Volcanic activity has been documented by Weston [1964], and Machado in [Van Padang et al., 1967]. The tectonic setting of the Apores has been discussed by Laughton et al. [1972], Feraud et al. [1980], and Searle [1980]. In 1973 a research hole was drilled by scientists from Dalhousie University to obtain information on the volcanic stratigraphy on the north side of Agua de Pau. Temperatures measured in the hole were in excess of 200°C at depths greater than 500m [Muecke et al., 1974] and prompted further research into the geothermal potential of Sao Miguel. From 1980 to 1984 LGT contracted the USGS to perform a comprehensive study of the geothermal prospects on Sao Miguel, A review of the geologic, geochemical, and geophysical studies performed by the USGS is given by Silva et al. [1985].

The first microearthquake survey on Sao Miguel was conducted in 1976 on Agua de Pau [Geonomics, 1977]. The survey, lasting about 8 weeks and using a portable seismic network, yielded 11 locatable seismic events, most of which were not within the geothermal field. Sub sequently, LOT in collaboration with INMG set up a 8-station seismic array on Sao Miguel. The data from this network has not yet been interpreted.
INSTRUMENTATIONWe used 10 Sprengnether DR-100 portable digital seismographs and two Teledyne
Geotech portable drum recorders (Portacorders ) for the study. Six of the digital recorders and the two drum recorders were installed at sites around the Agua de Pau massif. Three more digital recorders were used at the INMG observatory in Ponta Delgada to record the 8- vertical and 1-horizontal components of the permanent INMG network. The tenth digital instrument was used as a backup and for testing noise levels. Station names and locations are shown Figure 4, and operating parameters are listed in Table 1.
Finding appropriately quiet sites for the portable stations was difficult. Nearly all of Sao Miguel is under heavy cultivation; where the terrain prohibits farming, cattle are grazed or lumbering operations are present. Pyroclastic flows cover most of the island and rock outcrops are rare. Most outcrops occur in canyons, stream beds, along the coast, or in road cuts and for the most part are inaccessible or seismically noisy. Hence, our seismometer sites were based on compromise between accessibility and best available noise conditions.
The Sprengnether DR-100 is a 12-bit precision transient-event recorder designed for signals in the frequency range 0-300 Hz and can record up to three components of seismic data. The DR-100 has an adaptive trigger system and a solid state memory to preserve sig nal onsets. Channel one is used to activate the trigger. The signal from this channel is rectified and integrated in two averagers giving short-term (STA) and long-term (LTA) aver age signal levels. STA and LTA averaging periods can be varied and the ratio of these vol tages is compared to a user-specified trigger threshold. When the threshold is reached the recorder is turned on. Pre-trigger data is stored in a shift-register memory to preserve pre- trigger signals (event onsets). We used a sample rate of 100 samples/sec and pre-event memory of about 3 seconds. Station CRA and two of the recorders (Mil and MI2) kept in the INMG observatory had extra memory cards and pre-event memory of 7 seconds.
The DR-100 has a clock with day/hr/min/sec display derived from a Vectron TCXO 1-MHz oscillator. The system ages 2X10"9 ppm and has a temperature stability of 3x10~7 sec/deg from 0°C to 50°C. While the system is triggering on an event, timing spikes are added to samples at each odd second on all channels. Before each event is recorded a time code is written containing the system display information, including the time of the first time spike; after each event is recorded a second time code is written containing the time of the last time spike. The header, data, and tailer are recorded on a cassette tape. The recording duration for each event was set for 20 seconds; each tape could hold about 20 events.
The six digital recorders installed on Agua de Pau utilized one vertical and two horizon tal L-4 1-Hz geophones and 5-pole low-pass filters with corners at 50 Hz. Gains for the field instruments ranged from 42db to 72db. The seismometer response and the amplifier response are shown in Figure 5. The operating variables depended on the level and type of cultural and natural background noise.
A DP-100 playback unit and paper chart recorder were also taken to Ponta Delgada to make analog playbacks of the seismograms. Some of the larger local events were timed using

Table
1.
Code
St
atio
n
ADA
Agua de
Alto
ADB
Agua
de
Alto
B
CHC
Char
coal
CML*
Pico Cigarreiro
CRA
CumleIra
EPD
Esprai
ados
EPE
Esprai
ados
FAC*
Faja de Cl
naFR
A*
Pico
dos
Cedr
osLF
A*
Logoa
do Fo
goLCD
Logo
a do
Co
ngro
MTS*
Monte
Escuro
PFM
Porto
Form
osa
PST
Past
ePV
M Pi
co Ve
rmel
hoPV
N Pico Ve
rmel
hoRI
B*
Cerrado
Novo
RIBN*
Cerrado No
voSB
A Santa
Barbara
SVA*
Pico Ga
fanh
oto
VIF*
Mi
rado
uro
Stat
ion
Loca
tion
s and
Oper
atin
g Pa
rame
ters
Period of
Op
erat
ion
Latitude
Long
itud
e El
evat
ion
Seis
mome
ter
Gain
(Day/Month/Year)
(Deg Min
utes
) (D
eg M
inutes)
(Meters)
Mode
l (d
b)
22/06/83 -
12/07/83 -
18/06/83 -
21/0
6/83
-
24/06/83 -
22/0
6/83
-25
/07/
83 -
18/0
7/83
-21/06/83 -
21/06/83 -
22/0
6/83
-21
/06/
83 -
23/06/83 -
20/06/83 -
18/06/83 -
23/0
6/83
-21/06/83 -
18/07/83 -
02/10/83 -
18/0
7/83
-21/06/83 -
12/07/83
09/10/83
06/1
0/83
12/1
0/83
06/1
0/83
25/07/83
07/1
0/83
12/1
0/83
12/10/83
12/1
0/83
07/1
0/83
12/1
0/83
30/09/83
06/1
0/83
23/06/83
06/1
0/83
12/1
0/83
12/1
0/83
12/1
0/83
12/1
0/83
12/1
0/83
37 37 37 37 37 37 37 37 37 37 37 37 37 37 37 37 37 37 37 37 37
43.85
43.98
45.9
246
.25
45.19
47.7
247
.73
46.3
944.56
46.3
645
.27
46.8
648
.33
44.1
647
.93
47.9
347
.97
47.97
47.8
947
.63
44.6
9
N N N N N N N N N N N N N N N N N N N N N
25 25 25 25 25 25 25 25 25 25 25 25 25 25 25 25 25 25 25 25 25
28.
28.
30.
32.
28.
23.
23.
39.
21.
28.
24.
26.
25.
31.
30.
30.
27.
27.
31.
19.
26.
59 62 59 76 13 81 76 03 20 99 37 31 66 66 93 93 66 66 00 03 38
W W W W W W W W W W W W W W W W W W W W W
190
200
632
291
667
506
501
191
557
693
454
826
345
265
100
100
526
526
110
644
647
S-60
00L-4C
L-4C
S-60
00L-
4CL-4C
L-4C
S-60
00S-
6000
S-6000
L-4C
S-60
00L-4C
L-4C
L-4C
L-4C
S-60
QOS-6000
L-4C
S-60
00S-6000
66**
60-6
6**
66 42 66 66 66 42 42-4
854 66 54
-60
66-7
266 66 60-66**
54 48 66 48 54
* IN
MG permanent
stations:
high c
ut filter 10
H,
low
cut
filt
er 0.5
Hz,
anti-a
lias
50
, and
vert
ical
com
pone
nts
exce
pt R
IBN
(N-S h
orizontal
comp
onen
t)
**
Portable dr
um recorders.
All
other
stations operated with
high a
nd lo
w cu
t filters
out, anti-alias 50,
and
three
components (Vertical, N-
S, E-
W).

P-phases hand picked from the strip charts. We used a HP-85 microcomputer and com puter program HYP85 [Dawson et al., 1985] which is similar to the computer program HYPOINVERSE [Klein, 1978] to locate earthquakes while on Sao Miguel.
The INMG seismic network on Sao Miguel is centered on Agua de Pau with signals from all stations telemetered to the INMG observatory in Ponta Delgada. TThere they are decoded and recorded on paper charts at 2 mm/s. The network utilizes Geotech S-6000 , 2-Hz geophones. We monitored all vertical components and one horizontal component (Sta tion RIB) from the INMG network with three of the Sprengnether DR-100's at system gains of 36 to 54 db. The 2-Hz seismometers and 10-Hz low-pass filters in the observatory seismographs largely determined the system pass-band for these permanent network stations. The three recorders at INMG were triggered simultaneously by channel one of instrument one (usually station VTF). The INMG recorders were run at low gain levels (24-36 db) because of the extreme cultural and natural noise levels on Sao Miguel. Two Portacorders (ink drum recorders) were operated to provide visual checks of seismic activity in the field and to obtain seismic data for sites too noisy for triggered digital recorders. They utilized L-4 1-Hz vertical geophones, and were operated at gains of 60-72 db.
Two precision clocks (Master Clock n, built by the USGS) were hand carried to the Apores from Menlo Park, California, to provide accurate international time standards for the experiment. The clocks contain an oven-controlled oscillator (aging = 5xlO~10 ppm, tempera ture stability = 6X10"9 sec/deg from -40°C to +55°C) and were calibrated to the Rubidium time source in Menlo Park, California, before leaving for the Apores. Once in Ponta Delgada one clock was kept stationary for the duration of the experiment and the other clock was used in the field to calibrate the DR-100 clocks and note the drift rates at every tape change. The field master clock was reset to the stationary master clock once a day. On October 7, 8, and 9, 1983 the master clock was compared to the DCF (Hamburg, Germany) radio time code. The master clock drifted 41.75 ms in 110 days, an average drift rate of 0.36 ms per day (slow compared to the DCF signal). No corrections to earthquake origin times have been applied to compensate for this small drift.
Clocks on each instrument were checked at every tape change and reset to the master time clock. Clock drifts ranged from -13 to +18 ms/day relative to the master clock. Correc tions for clock drift were made for each event assuming linear drift, and added to the picked arrival times. Appendix A is a listing of clock drifts for the experiment.
VELOCITY MODELSA velocity model based on refraction data from the MAR south of the Apores [Whit-
marsh, 1973] was used for preliminary locations while the experiment was conducted. This simple 3 layer model is shown in Table 2.

Table 2.
3-layer crustal velocity model \Whimarsh, 19731
Depth to top (km)0.003.808.00
Velocity (km/second)4.506.807.50
The model does not allow for thicker crust in the Apores plateau or slow velocities due to nefar surface pyroclastic deposits.
All events were subsequently relocated using a velocity model derived from seismic refraction data on Sao Miguel by Senos and Nunes [1980] (Table 3). They derived several similar models for Sao Miguel, the most important features of each being the slow velocities in the upper 2-3 km and the generally thicker (10-11 km) crustal velocities than those derived from seismic refraction profiles at or near the MAR. The low velocities in the top 3 km reflect the near surface pyroclastic flows.
Table 3.
Crustal velocity model based on seismic refraction Senos and Nunes [19801
Depth to top (km)0.000.502.205.40
11.00
Velocity (km/second)2.404.105.406.807.80
Final earthquake locations (Appendix B) were derived using the Senos and Nunes [1980] model with station delay terms (Table 4) inferred from a study of regional earthquakes referred to later in this paper and applied to the calculated travel times in the location routine. The average root-mean-square residuals in the hypocenter location as well as vertical and hor izontal errors were improved 10% using these station terms. Figure 6a is a comparison of epicenters for nine local earthquakes derived from the velocity model without station terms and the veloc: 7 model using station terms. Figure 6b is a depth cross-section along A-A' of Figure 6a showing the calculated hypocenters for both models. The most visible difference between the models aside from the improved location residuals is that when applying station terms all epicentral locations are shifted from 0.1 to 2.3 km south and up to 1.3 km deeper.

Table 4.
Station elevations and delays applied in the location routine
StationPVNFACADBCMLPSTPFMLGDEPERIBFRACHCSVAVIFCRALFAMTS
Elevation (m)100191200291265345454501526557632644647667693826
Delay*-0.130.05
-0.10-0.02-0.09-0.17-0.01-0.10-0.050.010.03
-0.020.020.050.030.03
* Delays calculated from a least-squares-fit to regional earthquake data
MAGNITUDE DETERMINATIONLocal earthquake magnitudes can be determined in several ways; we use coda duration
(MD) for all magnitudes listed in this report. The coda-duration magnitude (MD) is derived by computing the duration of ground motion by employing the relation
MD = a + b log(a) + c A
where (a) is the geometric mean of the total signal duration at all stations recording the event, and A is the arithmetic mean distance in kilometers from the epicenter to the recording sta tions [Lee et al., 1972]. The coda duration is defined as the time from the first motion to where the signal is lost in the background noise. In the absence of any magnitude scale for the Apores, we have used the constants in the scale for California derived by Lee et al. [1972]:
MD=-0.87 + 2.00 log(a) + 0.0035A,
Therefore the MD values presented give only relative magnitudes for the Sao Miguel area. We used 20 second recording durations (including approximately 3 or 7 second pre-event memory), so only events of less than 13 to 17 seconds duration were used for the coda- duration method. Most of the microseismicity recorded on Sao Miguel was of 10 to 15 seconds duration so the coda could be measured accurately. Coda durations for the larger
events were taken from the INMG records. Bakun [1984] has shown that a close correlation exists in California between MD and the local magnitude ML [Richter, 1935] for the range 1.5 = ML = 3.25. The MD values obtained give a first order approximation of the local seismic magnitudes on Sao Miguel. To develop a magnitude scale that is tuned specifically for the Apores region, many more events must be recorded, including larger-magnitude local events.
DATAData from the DR-100 cassette tapes were read onto a computer system which
allowed accurate timing and phase picks of the seismograms, as well as the display of all seismograms for each event (Figure 7). The timing precision of the seismograms is approxi- mfctely 0.05s. Phase data for each instrument (universal time of the first arrival, direction of first motion, S-arrival time, and coda duration) were then entered into event files. Earthquake hypocenters were obtained using the computer program HYPO71 [Lee and Lahr, 1975]. Earthquake hypocenters, program parameters, and symbols used for the HYPO71 location rou tine are listed in Appendix B,, and Appendix C is a listing of phase data files used for the hypocentral calculation for each event.
There were approximately 7500 station triggers during the experiment. Analog seismo grams were made for each event to determine if the triggers were culturally or seismically induced. Approximately 90% of the 7500 triggers appear to have been culturally induced. This means that in order to record small magnitude microseismicity on Sao Miguel with surficial seismometers one necessarily records a great deal of the human and bovine activity near each station. Over the recording period (June 19 to October 10, 1983), 60 locatable earthquakes, 30 to 40 unlocatable events with arrivals at only two or three stations, and over 300 one station triggers (apparently earthquakes) were recorded. Locatable events averaged one event every seven days. However, microseismic activity was quite high during the entire recording period with several one or two station triggers occurring per day caused by events of MD < 1. Many of the unlocatable events and one station triggers are monochromatic in character. No definite cultural source could be discerned to be causing this type of signal. These small signals are either highly filtered by local velocity structure or are possible B-type volcanic events. At least 60 of the one station events were associated with swarm activity on September 6-7, 1984. Of the 60 located events, 16 are considered regional events (10 km to 140 km outside of the network). The 44 remaining events occurred within and up to 10 km from the network. No teleseisms were recorded because of the high background noise level. Figure 8 is a plot of seismic triggers versus time for the duration of the experiment.
Local MicroseismicityFrom June 18 to October 10, 1983, 44 local events in the magnitude (MD) range of 0.6
to 2.3 were located. Ninety five percent of these events occurred to the east of the summit of Agua de Pau. This area is bounded by .Lagoa do Fogo on the west, Lagoa de S. Braz on the northeast, and Lagoa do Congro on the south, all occupying Quaternary calderas or trachytic explosion craters. The hypocenters have a horizontal accuracy of about 1.3 km, and a depth accuracy of about 1.6 km. Figure 9a is a map of the earthquake epicenters. Focal depths of these earthquakes (Figure 9b) range from less than 1 to about 12 km depth with only two events occurring deeper than 10 km. The largest events with well constrained focal depths occurred between 2- to 6 km. The events are evenly spread between these depths with no
10
apparent clustering or linearity. Of significant note is the absence of any located events beneath the summit region of Agua de Pau and the dipping to the east of locatable events with depth. Temporal seismicity patterns were accented by two periods of swarm activity on June 28-29, and September 6-7, 1983 with 50 percent of the located events occumng during the swarms.
Swarm Activity. There were two periods of seismic activity in which locatable events occurred at a higher rate than the background level. On June 28-29, 1983, eight events were located and several unlocatable events occurred. All of the earthquakes during this period were located to the east of Agua de Pau. This increase in seismic activity lasted 28 hours with local magnitudes ranging from MD 1.1 to 1.5. A larger period of swarm activity with over 200 recorded earthquakes occurred between September 6-7, 1983.
I The recording of the seismic swarm on September 6-7, 1983 was enhanced because background noise levels were very low and most stations were running with higher than nor mal gains. Over 200 events were recorded on the INMG station VIF during a 16-hour period from 1500 UTC September 6, to 0700 UTC September 7, 1983. The digital instruments closest to the swarm area triggered on the numerous events at the beginning of the swarm and ran out of tape before the larger shocks of the sequence occurred. Digital recorders further than 5-6 km from the swarm triggered only on the larger events. Altogether digital records of at least 64 of the swarm events were obtained. Many of the events triggered only one or two stations and the INMG paper records were not clear enough to pick reliable arrivals for the small events. Twenty three events were large enough to be located, 11 by digital records alone, 6 by digital and paper records, and 6 by paper records alone. Magnitudes during this time ranged from MD 0.6 to 2.3 and focal depths ranged from 0.1 to 12 km. Figure 10 is a plot of the 23 events located during the September 6-7, 1983 swarm.
The swarm of September 6-7, 1983 (Figure 10) began with numerous small events recorded just above the background noise level. The earthquakes increased in magnitude and rate of occurrence for eight hours, with at least 146 events recorded during this prograde period, until 2310 UTC, September 6, 1983 when a MD 2.1 event occurred. Seismic activity incrementally dropped off after the 2310 event, with 75 events occurring through 0600 UTC, September 7, 1983. At 0555 UTC September 7, 1983 the largest locatable event of the swarm was recorded at MD 2.3. Two more locatable events were recorded at 0606 and 0635 UTC, after which activity remained very low for three days with only a few one and two sta tion events recorded until September 11, 1983. Figure 11 is a plot of total events versus time for the swarm activity and Figure 12 is a plot of magnitude versus time for the September swarm.
There are several possible explanations for the seismic activity on the east side of Agua de Pau. First, the activity could be associated with the geothermal system described by Duffield and Muffler [1984], although no surface manifestations of the system are visible in the area of seismic activity and seismic activity is sparse near known manifestations on the north slope of Agua de Pau. Fumaroles and hot springs, such as Lambadas and Caldeiras, occur at the intersection of faults and deeply eroded canyons on the north slope of Agua de Pau. The east side of Agua de Pau is not deeply eroded so the geothermal system may be masked by overlying deposits. Second, the activity could be due to regional stress being released along the Terceira Rift. The structure of the rift zone is not well defined through Agua de Pau because recent volcanic deposits cover most structure and faults. Third, many of the studies concerning Sao Miguel suggest that a large rhyolitic magma chamber underlies the

11
central and eastern portion of Sao Miguel [Booth et al., 1978; Duffield and Muffler, 1984; Gandido et al. t 1984]. The seismic activity could be associated with minor inflation or deflation of the postulated magma chamber or with movement of magma in fractures. The absence of seismic activity beneath the summit of Agua de Pau and the sharp delineation of the activity at an angle away from the summit of the volcano (to the east) may be reflecting the "shadow" of a magmatic, partially molten, or hot plutonic heat source. This boundary may reflect a difference in temperature and or pressure which corresponds to an elastic- anelastic transition zone. Another interpretation of the demarcation of seismicity is that it may delineate the east side of the Agua de Pau graben, although the dip of the interface is in the wrong sense for a graben structure. Anderson [1936] predicted with mathematical analysis that outward dipping caldera fault structures would result from cauldron subsidence. The most prominent example of outward dipping caldera faults is seen at Rabaul caldera, Papau New Guinea [Mori and McKee, 1987]. The observed depths of earthquakes at Rabaul only extend to about 4 km depth, while at Agua de Pau the seismicity extends to greater than 10 km. It is not known if the caldera ring fault system extends to these depths, so the mag matic or regional tectonic interpretations discussed above may be more likely sources for the seismic activity.
Regional SeismicitySixteen regional earthquakes were recorded over the period of the experiment. Since
these events occurred well outside our seismic network, their epicenters and depths could not be determined accurately and magnitudes are taken from codas on the paper INMG records. Several of these events had emergent P-phases and poor S-phases, and were monochromatic in character. It is possible that these events could be local B-type volcanic events. A typical regional event located using good arrivals is shown in Figure 13. Figure 14 shows the epi centers of the 16 regional earthquakes. The epicenters are scattered over a broad area about Sao Miguel. At least 12 of the 16 events fall along a northwest striking zone, reminiscent of the 10-year regional pattern of seismicity shown in Figure 15, which delineates the Terceira Rift, North Apores Fracture Zone, and the Mid-Atlantic Ridge.
Vp/Vs AND POISSON'S RATIO
In the hypocenter location program (HYPO71), a constant Vp/Vs ratio is assumed. Since only a P-velocity model is specified, the program assumes that the S-velocity is 1/V3 of P- velocity, corresponding to a Poisson's ratio of 0.25. However, significant Vp/Vs variations have been found in active geothermal areas, such as Yellowstone National Park, Wyoming [Chatterjee et al., 1985]. These variations are thought to be caused by pore-fluid and steam- filled fractures in geothermal reservoirs.
Vp/Vs can b6 determined by using the Wadati method in which arrival times of P-waves (tp) are plotted as the abscissa and the difference of arrival time between the P and S-phases (Tp_s) as the ordinate. If Poisson's ratio
a = Y «Vp / Vs)2 - 2) / ((Vp / Vs)2 - 1)
is constant along the travel path of the seismic ray, the relation (Tp_s) versus tp will be a straight line for any given event with a slope equal to (Vp/Vs)-l [Wadati, 1933; and Kiss- linger and Engdahl, 1973]. Alternately, one can plot a modified Wadati diagram in which
12
instead of plotting Tp_s versus Tp, the P-wave travel time Tp is plotted as abscissa against the S-wave travel time Ts as ordinate. Earthquake location and origin time errors do not affect the slope in either method if Poisson's ratio is constant in the volume sampled by the seismic rays. The slope of the line through the Tp versus Ts travel time plot gives Vp/Vs directly. The advantage of the latter method is that travel time data from several earthquakes can be plotted simultaneously to derive an average of Vp/Vs for the study area. Hypocentral errors only weakly effect such plots.
Local eventsWe chose to use the modified Wadati method of plotting Tp versus Ts to derive a VJVS
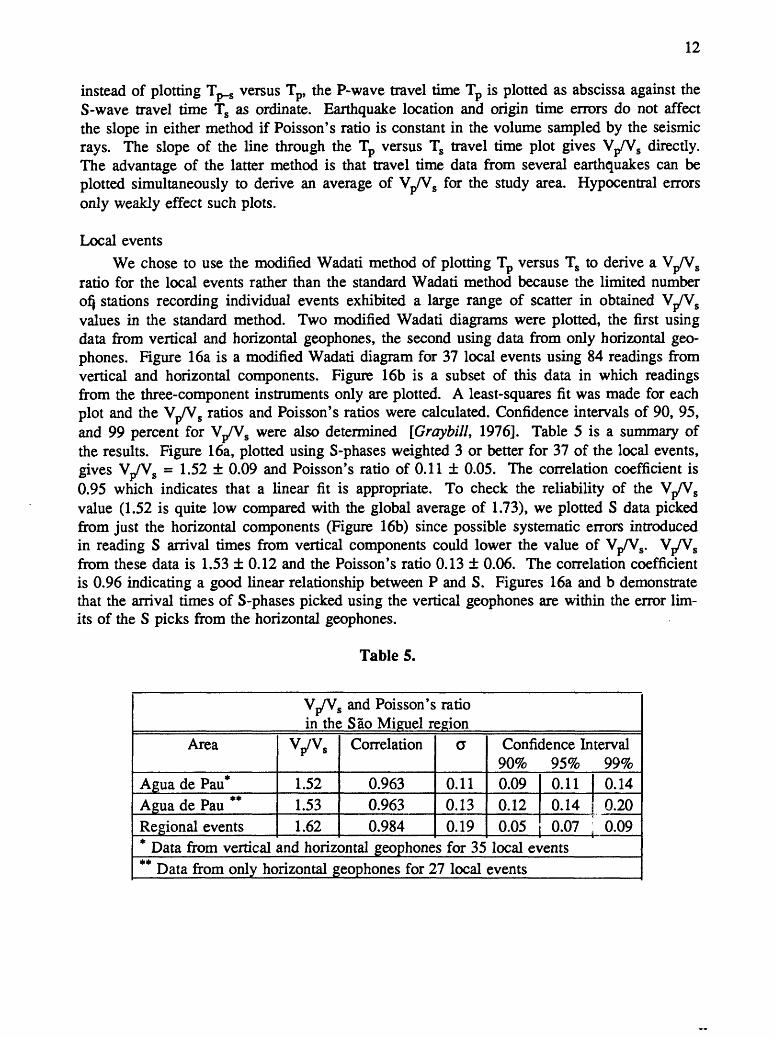
ratio for the local events rather than the standard Wadati method because the limited number oi) stations recording individual events exhibited a large range of scatter in obtained Vp/Vs values in the standard method. Two modified Wadati diagrams were plotted, the first using data from vertical and horizontal geophones, the second using data from only horizontal geo- phones. Figure 16a is a modified Wadati diagram for 37 local events using 84 readings from vertical and horizontal components. Figure 16b is a subset of this data in which readings from the three-component instruments only are plotted. A least-squares fit was made for each plot and the Vp/Vs ratios and Poisson's ratios were calculated. Confidence intervals of 90, 95, and 99 percent for Vp/Vs were also determined [Graybill, 1976]. Table 5 is a summary of the results. Figure 16a, plotted using S-phases weighted 3 or better for 37 of the local events, gives Vp/Vs = 1.52 ± 0.09 and Poisson's ratio of 0.11 ± 0.05. The correlation coefficient is 0.95 which indicates that a linear fit is appropriate. To check the reliability of the Vp/Vs value (1.52 is quite low compared with the global average of 1.73), we plotted S data picked from just the horizontal components (Figure 16b) since possible systematic errors introduced in reading S arrival times from vertical components could lower the value of Vp/Vs. Vp/Vs from these data is 1.53 ± 0.12 and the Poisson's ratio 0.13 ± 0.06. The correlation coefficient is 0.96 indicating a good linear relationship between P and S. Figures 16a and b demonstrate that the arrival times of S-phases picked using the vertical geophones are within the error lim its of the S picks from the horizontal geophones.
Table 5.
Vp/Vs ^d Poisson's ratio in the Sao Miguel resion
Area
Agua de Pau*Agua de Pau *Regional events
Vp/Vs
1.521.531.62
Correlation
0.9630.9630.984
a
0.110.130.19
Confidence Interval 90% 95% 99%0.090.120.05
0.11 1 0.140.14 1 0.200.07 ; 0.09
* Data from vertical and horizontal geophones for 35 local events** Data from only horizontal geophones for 27 local events

13
Regional eventsVp/Vs ratios for the regional events were derived using Wadati's original method for four
of the best-recorded regional events. The resulting Vp/Vs ratios are widely scattered in the range of 0.91-1.98, reflecting the poor resolution resulting from using a limited number of data points over a limited aperture range for each event. To find an average Vp/Vs value for the regional events we plotted the phase data from nine regional events on a modified Wadati plot using only arrivals weighted 3 or better (Figure 16c). The resulting best fit line for the regional events gives a value of 1.62 ± 0.05 for Vp/Vs and Poisson's ratio of 0.19 ± 0.02. The correlation coefficient for the data is 0.98. The data for the regional events are summar ized in Table 5. Figure 16d is a bar graph showing the error limits of Vp/Vs for two local event data sets and the regional event data set
iObservations
Two key observations can be made of our Vp/Vs measurements: (1) there is a 7% difference between Vp/Vs values computed using local and regional events; and (2) low Vp/Vs values prevail for both regional- and local-event data sets, compared with the global average value of 1.73. We are unable to assign a high level of confidence to the difference between Vp/Vs for local and regional events, as can be seen from the bar graph in Figure 16d. How ever, the difference, if real, is not surprising since the local events represent Vp/Vs in a crustal volume of complex volcanic rock around the Agua de Pao volcano, whereas the Vp/Vs value using regional events are for the sub-moho ray paths of Pn and Sn phases of the regional events. One expects the regional Vp/Vs value to correspond to that for fairly homogeneous upper mantle, however, the Vp/Vs value for basaltic samples from the Pacific Ocean measured in the laboratory is about 1.86 [Christensen, 1972], a value much higher than our observed 1.62.
A plausible explanation for the low Vp/Vs value in the crust beneath Agua de Pao can be given in terms of the presence of a fractured geothermal reservoir in which the temperatures are close to that at water-steam transition. A steam-water phase-transition anelastic mechan ism should affect compressibility more than shear modulus, lowering Vp/Vs. The presence of partial melt is not an acceptable explanation since melt inclusions tend to reduce S-wave velo city more than P and increase Vp/Vs. Mineralogical anomalies [Kern and Richter, 1981] between the summit and flanking volcanic materials could produce a lower Vp/Vs ratio, or erroneous identification of the S-phases are possible explanations. However, the consistent correlation of S between events (Table 5), indicates we are accurately identifying the S-phase.
REGIONAL TRAVEL TIME RESIDUAL ANALYSISTeleseismic P-residual and attenuation studies have been used extensively in the United
States to delineate zones of anomalous seismic-wave velocities associated with magmatic heat sources (Yellowstone: [lyer et al, 1981]; The Geysers-Clear Lake area: [Oppenheimer and Herkenhqff, 1981, and Ward and Young 1980]; Long Valley-Mono Craters: [Achauer et al, 1986]; Coso Hot Springs: [Reasenberg et al, 1980, and Young and Ward, 1980]; Roosevelt Hot Springs: [Robinson and lyer, 1981]; San Francisco Mountain: [Stauber, 1982]; Newberry Volcano: [Stauber et al, 1988]; and Medicine Lake Volcano: [Evans, 1982]). On Sao Miguel, due to the high ambient seismic noise level, we did not record any teleseisms, however, we were able to use the regional events to map P-residual patterns in the Agua de

14
Pau area using a modified version of the teleseismic experiment The term "P-delay" refers to the increase in travel time as seismic P-waves traverse a low-velocity body, such as a magma chamber. If the P-waves travel through a homogeneous, isotropic medium the arrival times of P-phases at a seismograph array reflect a constant velocity of travel and no travel time residu als (advances or delays) are observed. On the other hand, if the waves sample an anomalous high- or low-velocity zone the arrival-times give measurable travel time residuals. Positive residuals or P-delays are associated with low-velocity or low-density bodies and negative resi duals or P-advances are associated with high-velocity or high-density bodies beneath the array.
Travel time residuals were calculated for P-arrival times from nine of the regional events by using a least squares fit to the plane wave-front. Average apparent velocity and azimuth of travel to the source were also calculated. The travel time residuals at each station are simply the deviation of the observed arrival times from the predicted least-squares-fit arrival times. Note that the residuals calculated using this method are independent of the earthquake loca tions and origin times and do not account for wave front curvature. Azimuths of the events measured from the network ranged from 91° to 314°. Apparent velocities, azimuths, and resi duals are shown in Table 6. Residuals from all azimuths, except the event at 263°, show positive residuals (delays) around the summit of Agua de Pau. Superimposed on this central delay is a pattern of azimuthally varying residuals. To highlight the azimuthally invariant component of the residual pattern, we have averaged the residuals from all events (Figure 17). The azimuthally invariant pattern is dominated by an east-west elongate zone of P-delays (with an amplitude of 0.1 to 0.2 seconds) centered on Agua de Pau volcano.
Table 6.Plane Wave Station Residuals
BvKtt AiBHUtfa App. Vol. Stttiflfi
(<fc«nu) (kn*ec) ADB CHC CML CRA EPE FAC FRA LFA LCD MTS PPM PST PVN RIB SVA V1F
Z7521S7 314»»
1120533 393"
2220040 193
2730543 !»
2250214 149**»
1S32229 131
2342236 130***
2S20421 127***
1792217 91
Averaje
Avonac NW"
Avon* SE*ra
623
6X2
&85
7J9
345
7.32
135
7.71
7.14
7.72
&S3
7.24
OM
-
OjOl
-0.16
-O15
-
O5S*
-O26*
-
-0.10
O08
-0.16
.
-
0.04
-
0.02
-
-
-
0.03
-
a 02
aos
-
-OXT7
-046
-ZJO»
0.10
aoo
-Ou06
O04
-002
-aos
-0.01
.
O13
-OJ04
-
-
-
-
-
O05
0.13
-
.
-
-
-
0.10
' -
OJO
-
-0.10
002-
033*
OL21*
OuOl
-
O47*
013
-
O05
O02
ojm
,
Oj04
054»
Ou06
-
aoiurn*
0X7
a79»
O01
OXM
aoo
aoo-
ao7
003-006
ao9aioaio
-OJO
003
aoo
aos
.
-
-
-001
----
0.01
.
0.01
0.03
002
au-am
002
O09
-O03
009
aoo
O03
001
O02
.
-- -
OJ7
-
OJ7
-
0.17
.
- O05
003
Ol«
-
-
O09
an
-O08
-O17
-O21
0.19
O72*
-O03
-O01
O38
0.13
0.13
-015
000
-
-008
O07
O02
-O06
-O09
O15
013
005
aoo-O04
0.01
-042*
0.19
-
0.06
OJ02
-
0.02
OjOl
OJOS
Oj03
014
0.19
OXM
OJ6
0.01
OM
OJ02
OJ05
0.02
OM
OM
* 4 qualities not used in the analysis
Assuming that the averaged residuals reflect velocity anomalies in the top layers of the

15
crust, the residuals remaining when the average residual is removed should approach zero if all variations in P-wave velocities are due to structure in the top crustal layers (because resi duals caused by shallow anomalies are azimuthally invariant). Figures 18a-i are plots of the residuals for each event minus the average residuals. The patterns show clear evidence for azimuthal variation - the delays shift away from the source direction for different* events.
There are several possible explanations for this pattern of delays including elevation effects, composition effects (trachytic volcano versus mafic crust), or anomalies due to steam or melt in the upper. Simple elevation effects can account for most of the delays observed near the summit of Agua de Pau. Figure 19 shows station elevation versus the average resi dual. Except for FAC and CML, the two stations on the western extension of the anomaly, the data fit a line indicating an elevation correction velocity of 5 km/s should be applied as a station term. The observed P-delays of 0.1 to 0.2 seconds require 0.5 to 1 km station eleva tion, which is the range of elevation for the stations. Since the average station residuals seem to reflect structure observed from all azimuths, they have been applied as station term input to HYPO71 for locating the regional and local earthquakes.
The difference in composition from the Agua de Pau massif to the surrounding crust could also contribute to the delay pattern. A complex of trachytic tuffs and flows imbedded in a basaltic medium could cause a delay of P-wave arrivals at stations on the massif. Another explanation for the delays is to assume that the linear relationship between residuals and elevation is caused by an extended crustal low-velocity zone. Since the seismic waves used in this study are probably Pn phases with an emergent angle of about 23°, the observed delays could be interpreted to have been caused by a low-velocity body, elongate in an east- west direction, beneath the Agua de Pau volcano. The body could be 10 km long and 5 km wide, extending from the surface to a depth of about 5 km. The resultant velocity decrease (using 0.1-0.2 second delay) within the body from the surrounding rock would be about 10%. One example of such a low-velocity body could be a large steam reservoir within the upper crust. The presence of a large geothermal system in the area of Agua de Pau is also sug gested by the geochemical and geophysical studies performed by the USGS, the presence of hot springs such as Lombadas and Caldeiras, of producing geothermal wells, and the low Vp/Vs ratios discussed earlier. A steam reservoir can explain the low Vp/Vs and low P-wave velocities inferred from the delays because steam-filled fractures in rock volumes result in lower than normal P-velocities [Ito et a/., 1979]. Another explanation for a crustal low- velocity body is the presence of partial melt [lyer and Stewart, 1977]. Relating detailed sur face lithology with the observed residuals, and further detailed geophysical studies are needed to discriminate between these proposed delay-causing mechanisms.
DISCUSSIONThe significant finding of this study is that the seismic activity recorded for the duration
of the experiment was centered on the east slope of Agua de Pau and extended into the topo graphic low between the Agua de Pau and Furnas volcanoes. Little seismicity was recorded directly under the Agua de Pau caldera and no seismicity occurred near any known geother mal manifestations such as Lombadas or Caldeiras. It must be noted that only the larger events (M>1.5) which occurred within the network triggered 50 per cent or more of the port able stations. Station VIF triggered the recording of the 8 INMG vertical seismometers so there is a bias toward locating events occurring in the vicinity of station VIF. Few events occurred south of VIF, however, indicating that there is a real southern boundary of seismic
16
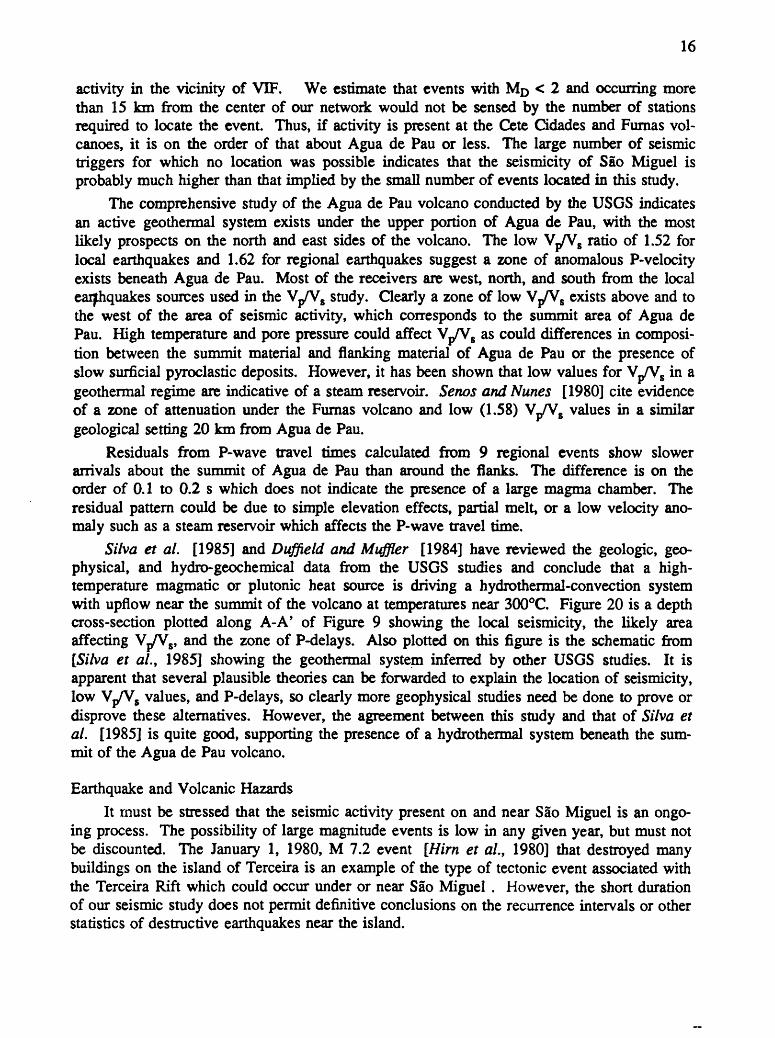
activity in the vicinity of VIF. We estimate that events with M£> < 2 and occurring more than 15 km from the center of our network would not be sensed by the number of stations required to locate the event. Thus, if activity is present at the Cete Cidades and Furnas vol canoes, it is on the order of that about Agua de Pau or less. The large number of seismic triggers for which no location was possible indicates that the seismicity of Sao Miguel is probably much higher than that implied by the small number of events located in this study.
The comprehensive study of the Agua de Pau volcano conducted by the USGS indicates an active geothermal system exists under the upper portion of Agua de Pau, with the most likely prospects on the north and east sides of the volcano. The low Vj/Vs ratio of 1.52 for local earthquakes and 1.62 for regional earthquakes suggest a zone of anomalous P-velocity exists beneath Agua de Pau. Most of the receivers are west, north, and south from the local earthquakes sources used in the Vj/Vs study. Clearly a zone of low Vj/Vs exists above and to the west of the area of seismic activity, which corresponds to the summit area of Agua de Pau. High temperature and pore pressure could affect Vj/Vs as could differences in composi tion between the summit material and flanking material of Agua de Pau or the presence of slow surficial pyroclastic deposits. However, it has been shown that low values for Vj/V8 in a geothermal regime are indicative of a steam reservoir. Senos and Nunes [1980] cite evidence of a zone of attenuation under the Furnas volcano and low (1.58) Vj/Vs values in a similar geological setting 20 km from Agua de Pau.
Residuals from P-wave travel times calculated from 9 regional events show slower arrivals about the summit of Agua de Pau than around the flanks. The difference is on the order of 0.1 to 0.2 s which does not indicate the presence of a large magma chamber. The residual pattern could be due to simple elevation effects, partial melt, or a low velocity ano maly such as a steam reservoir which affects the P-wave travel time.
Silva et al. [1985] and Duffield and Muffler [1984] have reviewed the geologic, geo physical, and hydro-geochemical data from the USGS studies and conclude that a high- temperature magmatic or plutonic heat source is driving a hydrothermal-convection system with upflow near the summit of the volcano at temperatures near 300°C. Figure 20 is a depth cross-section plotted along A-A' of Figure 9 showing the local seismicity, the likely area affecting \yVs, and the zone of P-delays. Also plotted on this figure is the schematic from [Silva et al., 1985] showing the geothermal system inferred by other USGS studies. It is apparent that several plausible theories can be forwarded to explain the location of seismicity, low Vj/Vs values, and P-delays, so clearly more geophysical studies need be done to prove or disprove these alternatives. However, the agreement between this study and that of Silva et al. [1985] is quite good, supporting the presence of a hydrothermal system beneath the sum mit of the Agua de Pau volcano.
Earthquake and Volcanic HazardsIt must be stressed that the seismic activity present on and near Sao Miguel is an ongo
ing process. The possibility of large magnitude events is low in any given year, but must not be discounted. The January 1, 1980, M 7.2 event [Him et al., 1980] that destroyed many buildings on the island of Terceira is an example of the type of tectonic event associated with the Terceira Rift which could occur under or near Sao Miguel . However, the short duration of our seismic study does not permit definitive conclusions on the recurrence intervals or other statistics of destructive earthquakes near the island.

17
The youthful calderas and historical volcanic activity at all of the volcanic centers on Sao Miguel, as well as the ages of eruptions documented by Booth et al. [1978] indicate future eruptions can be expected. The eruptive histories of the volcanoes on Sao Miguel document recurrence intervals of 500 years for a magnitude 6 eruption and 200 years for a magnitude 5 eruption. Swarm activity is often observed in active volcanic systems and the occurrence of two such swarms of seismic activity in three months suggests the presence of an active volcanic system at the Agua de Pau volcano. Seismic monitoring of the microearth- quake activity on Sao Miguel must be upgraded so that an accurate record of activity can be built for future reference. Deviations from the normal pattern of seismicity should be noted so that possible impending eruptions could be prepared for.
N^agrna ChamberOne of the purposes of our study was to detect any magma chamber present beneath the
Agua de Pau volcano. Travel time residuals obtained from the regional events do not definitively define a magma chamber, though they could be interpreted as due to a crustal low-velocity body in which the P-wave velocity is lower than normal by about 10%. The body could be a result of a dry-steam reservoir or a partially molten magma chamber beneath Agua de Pau or simply reflect the silicic composition of the massif.
The low Vp/Vs ratios of local events can be attributed to slow surficial deposits, but are more likely due to a steam-charged geothermal system. Since the geologic and geophysical evidence indicate the presence of a steam reservoir beneath the central and eastern portion of Sao Miguel, then the magmatic system that drives the system should be located. Booth et al. [1978] have shown that between about 5000 and 7000 a.B.P. there were at least 13 basaltic eruptions around the flanks of Agua de Pau and Furnas. During the past 5000 years there have been no basaltic flank eruptions in the same area. They suggest that a lateral spreading of the trachytic magma chamber that supplies Agua de Pau occurred at about the time of the "Fogo A" eruption (4550 a.B.P.). The subsequent termination of basaltic flank eruptions may be a result of the inability of the basaltic magma to penetrate the overlying trachytic magma chamber. Lagoa do Congro and Logoa de S. Braz (Figure 3) occupy craters between Agua de Pau and Furnas. Both are post "Fogo A" trachytic eruption centers indicating a trachytic magma chamber or feeder system exists under the central and eastern area of Sao Miguel.
Our study indicates the existence of an anomalous zone, most likely a steam-charged geothermal system, beneath most of Agua de Pau. The abrupt delineation of seismic activity from the summit of Agua de Pau eastward with depth may outline the eastern edge of the magma chamber which drives the geothermal system.
REVIEW OF SEISMIC APPLICATIONS AND RECOMMENDATIONS FOR FUTURE STUDIES
Seismic StudiesSeismic studies are important for the Acores in general and for Sao Miguel in particular
for the following reasons:1. Earthquake hazards evaluation and monitoring.

18
2. Volcanic hazards evaluation and monitoring.3. Geothermal exploration and environmental monitoring of geothermal development.
Earthquake hazards evaluation and monitoring.The Apores are situated at the intersection of two active seismic zones, the Mid-Atlantic
Ridge and the Apores-Gibraltar Fracture Zone (Figure 2). Reports of historical seismicity [Machado, 1966; Machado, 1973; and Machado and Forjaz, 1965] describe the frequent occurrence of felt earthquakes and less-frequent occurrence of destructive earthquakes in the Apores archipelago. The potential for large earthquakes in the Apores was demonstrated by the occurrence of the destructive Terceira earthquake (MD7.2) of January 1, 1980. Sao Miguel was last subjected to a destructive earthquake in 1522 near the town of Villa Franca dcf Campo. The island appears not to have had a major earthquake since then. The many kilometers of old hand erected stone walls that traverse the landscape of Sao Miguel indicate that major seismic events are fairly uncommon. Therefore, the importance of monitoring seismicity is vital for the understanding of the tectonic and volcanic processes occurring on Sao Miguel.
Volcanic hazards evaluation and monitoring.In addition to the potential seismic risk, volcanic hazards provide a compelling reason for
seismic monitoring of all the Apores islands, and in particular, the highly populated Sao Miguel. The three active stratovolcanoes of Sao Miguel, (Sete Cidades, Agua de Pau, and Furnas; Figure 3) have a long record of explosive eruptions. Booth et al. [1978] have docu mented a total of 57 volcanic eruptions during the past 5000 years on Sao Miguel using tephrachronology. "Of the 28 trachytic and 29 basaltic eruptions known to have occurred dur ing this period, ten were of magnitude 6, twenty-six of magnitude 5, and at least 9 of magni tude 4 or less (in Tsuya's scale based on total volumes of material erupted). ...Although no eruptions of magnitude 7 have occurred during this period, such eruptions are no doubt possi ble on the island. ...An eruption of magnitude 6 thus takes place on an average every 500 years in Sao Miguel, one of magnitude 5 every 200 years..." The most recent trachytic erup tions were in 1562 at Fogo (magnitude 6) and in 1640 at Furnas (magnitude 5).
Even though information on the seismic activity preceding any of these eruptions is sparse, we think it is reasonable to assume that volcanic eruptions in the Apores are preceded by intense seismic activity as in other major volcanoes of the world. The 1957-1958 Capel- inhos eruption on Ihla Faial was documented by Machado et al. [1962]. No seismic monitor ing devices were located on the island at the onset of the eruption so the pre-emptive seismi city is unknown. A Bosch-Omori seismograph was installed several months after eruptive activity began and was operating during a seismic swarm in May, 1958. From May 12 to May 13, 450 earthquakes were felt on Faial, many of intensity X on the modified Mercalli scale [Machado et al., 1962]. In this brief period of time over 500 homes were destroyed. Araujo [1801] documented the seismic and eruptive history of the Apores from their discovery to 1801. He describes several volcanic eruptions and intense accompanying seismi city. Therefore, we believe that continuous seismic monitoring of the Apores volcanoes is an absolute necessity. Particularly for Sao Miguel, a properly operating state of the art seismic network giving precise locations of seismic activity in and around the island could save lives and property by providing an early warning of a volcanic eruption.

19
Geothermal exploration and environmental monitoring of geothermal development.Seismic techniques used in geothermal studies fall into two categories, active techniques,
in which controlled explosions or vibrators are used to generate seismic waves, and passive techniques, in which earthquakes are used as the sources. Active studies are mainly con cerned with modeling the fine structure of the crust using refraction and reflection surveys and are not discussed here. Passive studies mainly consist of microearthquake surveys to establish a seismo-tectonic framework of the geothermal area under investigation and to model the three-dimensional structure of the area. Seismic waves from local, regional, and distant earth quakes can be used to model anomalous physical properties of the underlying rock, such as those caused by hydrothermal activity or partial melting. Following is a brief review of the application of passive seismic methods in geothermal studies.
IMicroearthquakesMicroearthquake studies in geothermal areas can be divided into several categories:a. Exploration.b. Tectonic evolution.c. Detection of zones of anomalous physical properties in the upper crust (due to the
presence of geothermal reservoirs, magma pockets etc.).d. Environmental monitoring.
a. Exploration. Geothermal prospects are invariably located in areas of active tecton- ism, hence it is not surprising that most of them are quite seismically active. Ward and Jacob [1971] showed how a microearthquake survey can be used as a geother mal exploration tool to delineate fracture zones which provide paths for hot water to reach the surface. There have been numerous microearthquake surveys in geother mal areas for geothermal exploration [Ward and Bjornsson, 1971; Marks et al. y 1978; and Walter and Weaver, 1980].
b. Tectonic evolution. Whether microearthquake surveys are useful for siting geother mal drill-holes or not, their study forms an important and integral part of the pro cess of understanding the volcanic and tectonic evolution of geothermal areas. Clear examples of the utility of tectonic studies for geothermal exploration are pro vided by studies at Brawley and Coso geothermal areas, California [Weaver and Hill, 1979]. In both these areas it has been demonstrated that the geothermal zones occur at miniature continental spreading centers.
c. Detection of zones of anomalous physical properties. Microearthquakes can be used jo look for velocit/ and attenuation anomalies associated with hydrothermal reser voirs and magma pockets in geothermal areas. Chatterjee et al. [1985] found abnormally low Vj/Vs (and low Poisson's ratio) beneath the geyser basins of Yel- lowstone National Park, Wyoming. They attributed this to the presence of hydroth ermal reservoirs in which the temperatures were close to those needed for the transi tion of water to steam. Sanders and Ryall [1983] used the observed strong attenuation of S-waves from microearthquakes along certain paths to map the

20
subsurface geometry of magma bodies in Long Valley, California. In the same region Kissling et al. [1984], using local earthquake data and a tomographic inver sion method, have delineated a zone of low P-wave velocity in the depth range of 3 to 7 km beneath the resurgent dome and the south moat of the Long Valley caldera.
»
d. Environmental monitoring. In general, seismic activity occurs in many geothermal areas of the world. Ward [1972] discussed the problem of earthquake risks associ ated with geothermal activity. A primary concern is whether the extraction of fluids and reinjection of spent fluids could trigger a moderate earthquake. There is clear evidence that modifying fluid pressure can alter seismicity patterns. In particular, seismic activity seems to be triggered by injection of fluids at high pressure into the
| ground [Raleigh et al., 1976]. Eberhart-Phillips and Oppenheimer [1984] showed, by careful relocation of earthquakes in the Geysers geothermal area, California, that seismic activity tends to cluster near production wells in the steam field. They could not find statistically significant results to show whether seismicity was indeed induced by the reinjection of spent fluids. They postulate that the seismic activity associated with geothermal production could be a result of perturbation of the regional stress field due to volumetric contraction caused by steam withdrawal.
Regional Earthquakes and TeleseismsAn important constituent of a geothermal system is the heat source that activates it, usu ally some form of magmatic intrusion. In order to estimate the longevity of a geother mal system and to understand its volcanic setting, it is important to detect and delineate these magmatic intrusions. The technique of measurement of teleseismic travel time resi duals has been successfully used to make three-dimensional models of velocity anomalies in the crust and upper mantle of the earth [Aki, 1982] and has been used by lyer et al. [1979, 1981], Reasenberg et al. [1980], Robinson and lyer [1981], and Steeples and lyer [1976], among others, to map magma chambers in several geothermal areas in the United States. (For a review of geophysical detection of magma chambers, see [lyer, 1984].) Regional earthquakes can be used in a similar way to locate anomalous low- velocity zones in the earth's crust.RecommendationsThe level of seismic activity on Sao Miguel leads us to recommend several studies which
would help characterize the active geothermal, seismic, and volcanic processes occurring there.
(1). The first, and most important, recommendation is to upgrade the existing seismic network. The paper recorders now used do not have the sensitivity to detect small-magnitude microearthquakes. An island-wide network that would enable the detection and location of events to the MD=1 lev-;] would greatly improve the understanding of seismic activity on the island. Because of the high level of noise on the island we recommend that the present sta tions and any future stations be installed in boreholes to reduce the problem of surficial noise and to enhance the detection capabilities of the network. Such a network should provide, (a) a background seismicity level with which to compare seismicity changes associated with future geothermal development, (b) seismic monitoring for detecting seismic activity preced ing hazardous volcanic eruptions, and (c) seismicity studies for earthquake prediction and

21
earthquake hazard evaluation. It is also recommended that a state-of-the-art computer-oriented seismic data analysis center be set up to process the data from the seismic array and that it be staffed by professional seismologists, at least one of whom should have a Ph.D. Any such network must operate with high reliability - an electrical engineer should also be employed to maintain and modify the network under the seismologists direction. Such a rfetwork would also be of tremendous scientific interest, potentially attracting visiting scientists to extend the research opportunities and capability of the laboratory.
(2). The effectiveness of a seismic network depends on how precisely earthquake hypo- centers can be determined. For all the studies mentioned above, earthquake location accuracy to a fraction of a kilometer is required. The critical data to achieve such precision are detailed velocity models commonly derived from seismic refraction experiments. The avail- atjle refraction data for Sao Miguel [Senos and Nunes, 1980] is a good beginning but is inadequate for this application; we propose a comprehensive refraction experiment. Instru ments, field procedures, and analysis techniques for such an experiment are highly developed in many institutions of the world including the U.S. Geological Survey [Zucca et al., 1982; and Fuis et al., 1984]. The small dimensions of Sao Miguel (60 km x 15 km) permit deploy ment of dense profiles of portable seismic stations on the island and detonation of seismic- source explosions in the ocean to evolve detailed velocity models.
(3). An extension of the seismic refraction study is to conduct an active source seismic tomography imaging experiment to model in three dimensions both lateral and vertical velo city and attenuation heterogeneities associated with the geothermal and volcanic systems in the Agua de Pau-Fumas area of Sao Miguel. Such an experiment would consist of deploying a two-dimensional array of about 120 seismographs over an 10 x 10 km area with average instrument spacing of about 1 km, and setting off seismic-source explosions (in the ocean) around the array. This method has proved very successful in providing images of upper cru- stal magma chamber at two volcanoes in the Cascade Range, USA [Achauer et aL 1988, and Evans and Zucca, 1988].
(4). We strongly recommend a teleseismic P-residual study of the whole of Sao Miguel, The strategy would be to supplement the proposed seismic network with several portable sta tions to achieve an average instrument spacing of about 5 km. Collection of teleseismic and regional event data requires several months of recording. The analysis of data from such a study would provide a 3-dimensional model of the crust and upper mantle to depths of about 60 km beneath Sao Miguel with a resolution as good as 5 km. This model would comple ment the high-resolution model from the seismic imaging experiment proposed under (3). This type of experiment could be expected to provide a wealth of data to explore in detail the seismicity, Vp/Vs, and residual anomalies discussed earlier in this report. The data set thus collected can be used for numerous studies related to the seismicity, tectonics, volcanology, and geothermal potential of Sao Miguel.
ACKNOWLEDGEMENTSThe staff of LOT provided full logistic support and negotiated with landowners for field
deployments. Laboratory space was provided by LOT and INMG provided access to their permanent network. Louis and Roberto Amaral participated in all aspects of our activities and in addition to the long and hard hours of field work acted as interpreters and guides. They very quickly grasped the principles of the operation of our seismic system and provided invaluable help as field and laboratory technicians. Finally, we acknowledge full support and

22
help from the numerous officials of the Regional Government of the Apores, the U.S. Consu late in Sao Miguel, the USAID missions in Ponta Delgada and Lisboa, and the Office of Inter national Geology of the U.S. Geological Survey.

23
REFERENCES
Achauer, U., J. R. Evans, and D. S. Stauber, High-resolution seismic tomography of Compressional wave velocity structure at Newberry Volcano, Oregon Cascade Range, /. Geophys. Res., 93, 10,135-10,147, 1988.
Achauer, U., L. Greene, J. R. Evans, and H. M. lyer, Nature of the magma chamber underly ing the Mono Craters area, eastern California, as determined from teleseismic travel time residuals, /. Geophys. Res., 91, 13,873-13,891, 1986.
Aki, K., Three-dimensional seismic inhomogeneities in the lithosphere and asthenosphere: evidence for decoupling in the lithosphere and flow in the asthenosphere, Reviews of Geoph. etc, 20, 161-170, 1982.
Anderson, E. M., The dynamics of the formation of cone-sheets, ring-dykes and caldron-subsidences, Proc. Royal Soc. Edinburgh, 56, 128-157, 1936.
Bakun, W. H., Seismic moments, local magnitudes, and coda-duration magnitudes for earth quakes in central California, Bull. Seism. Soc. Am., 74, 439-458, 1984.
Booth, B., R. Croasdale, and G. P. L. Walker, A quantitative study of five thousand years of volcanism on Sao Miguel, Azores, Philos. Trans. R. Soc. London, 288, 271-319, 1978.
Chatterjee, S. N., A. M. Pitt, and H. H. lyer, Vp/Vs ratios in the Yellowstone National Park region, Wyoming, /. ofVolcan. and Geotherm. Res., 26, 213-230, 1985.
Christensen, N. L, Compressional and shear wave velocities at pressures to 10 kilobars for basalts from the East Pacific Rise, Geophy. J. R. Astron. Soc, 28, 425-429, 1972..
Conde Senos, M. L. and J. A. F. Costa Nunes, Report of seismic refraction on Isla Sao Miguel, Servico Meteorologica Nacional, 1980.
Dawson, P. B., R. Cutler, and J. R. Evans, HP-85 computer program HYP85; an earthquake location program, US. GeoL Surv. Open File Rep., 85-243, 33 pp., 1985.
da Silva, A. M. R., W. A. Duffield, and L. J. P. Muffler, Geothermal studies of Agua de Pau Volcano, Sao Miguel, Azores,, Trans. Geothermal Resources Coun., 9, part II, p. 401-406., 1985.
de Araujo, L. A., Memoria chronologica dos tremores mais notaveis, Na Typographia Chal- cographica e Litter aria, 24 pp., 1801.
Duffield, W. A. and L. J. P. Muffler, Geothermal Resources of Sao Miguel, Azores, A sum mary report for USAID., 1984.
Eberhart-Phillips, D. and D. H. Oppenheimer, Induced seismicity in the Geysers geothermal area, California, /. Geophys. Res., 89, 1191-1207, 1984.
Evans, J. R., Compressional-wave velocity structure of the Medicine Lake volcano and vicin ity from teleseismic relative traveltime residuals, Tech. Prog. Abs. and Biog., 52nd Annual Meeting, 482-485 , Soc. Explor. Geophys., Tulss OK, 1982.
Evans, J. R. and J. J. Zucca, Active high-resolution seismic tomography of Compressional wave velocity and attenuation structure at Medicine Lake Volcano, Northern California Cascade Range, , 93, 15016-15036, 1988.

24
Feraud, G., I. Kaneoka, and C. J. Allegre, K/Ar ages and stress pattern in the Azores: geo- dynamic implications, Earth and Planetary Science Letters, 46, 275-286, 1980.
Fuis, G. S., W. D. Mooney, J. H. Healy, G. A. McMechan, and W. J. Lutter, A seismic refraction survey of the Imperial Valley Valley Region, California, Journal of Geophys. Res., 89, 1165-1189, 1984,.
Gandido, A., M. Guidi, C. Merlo, L. Mete, R. Rossi, C. Sommaruga, and L. Zan, Prelim inary model of the Ribeira Grande geothermal field (Azores Islands), United Nations Economic Commission for Europe Seminar on Utilization of Geothermal Energy for Electric Power Production and Space Heating, Florence, Italy., 1984.
Geonomics, Inc., , Microearthquake seismology survey, Task IV, of the Sao Miguel geother mal project, submitted to IGA, Azores., 1977.
6raybill, F. A., Theory and application of the linear model, Duxbury Press, 1976.Him, A., H. Haessler, P. Hoang-Trong, G. Wittlinger, and L. A. Mendes Victor, Aftershock
sequence of the January 1st, 1980, earthquake and present-day tectonics in the Azores, Geophyisical Research Letters, 7, 501-504, 1980.
Ito, H., J. DeVilbiss, and A. Nur, Compressional and shear waves in saturated rock during water-steam transition, /. Geophys. Res., 84, 4731-4735, 1979.
lyer, H. M., Geophysical evidence for the locations, shapes and sizes, and internal structure of magma chambers beneath regions of Quaternary volcanism, Phil. Trans. Roy. Soc. London, A310, 473-510, 1984.
lyer, H. M., J. R. Evans, G. Zandt, R. M. Stewart, J. M. Coakley, and J. N. Roloff, A deep low-velocity body under the Yellowstone caldera, Wyoming: delineation using telese- ismic P-wave residuals and tectonic interpretation, Geol. Soc. Am. Bull., 92, Part I: 792-798, Part H: 1471-1646, 1981.
lyer, H. M., D. H. Oppenheimer, and T. Hitchcock, Abnormal P-wave delays in the Geysers-Clear Lake geothermal area, California, Science, 204, 495-497, 1979.
lyer, H. M. and R. M. Stewart, Teleseismic technique to locate magma in the crust and upper mantle, Bulletin 96, edited by H. J. B. Dick, 281-299 , Oregon Department of Geology and Mineral Industries, Portland, 1977.
Jeremine, E., Etude microscopique des roches de la region de Furnas (S. Miguel, Acores), Com. Serv. Geol. Portugal, 38, 65-90, 1957.
Kern, H. and A. Richter, Temperature derivatives of compressional and shear wave velocities in crustal and mantle rocks at 6 kbar confining pressure, /. Geophys., 49, 47-56, 1981.
Kissling, E., W. L. Ellsworth, and R. S. Cockerham, Three-dimensional structure of the Long Valley caldera, California, region by geotomography, U.S. Geol. Surv. Open File Rep., 84-939, 188-220, 1984.
Kisslinger, C. and E. R. Engdahl, The interpretation of Wadati diagram with relaxed assump tions, Bull. Seism. Soc Am., 63, 1723-1736, 1973.
Klein, F. W., Hypocenter location program HYPOINVERSE, Part 1: Users guide to ver sions 1, 2, 3, and 4, U.S. Geol. Surv. Open File Rep.., 78-694, 113 pp., 1978.
25
Krause, D. C. and N. D. Watkins, North Atlantic crustal genesis in the vicinity of the Azores, Geophys. J. R. astr. Soc., 19, 261-283, 1970.
Laughton, A. S., R. B. Whitmarsh, J. S. M. Rusby, M. L. Somers, J. Revie, B. S. McCart- ney, and J. E. Nafe, A continuous east-west fault on the Azores-Gibraltar ridge, Nature, 237, 217-220, 1972.
Lee, W. H. K., R. E. Bennett, and K. L. Meagher, A method of estimating magnitude of local earthquakes from signal duration, U.S. Geol. Swrv. Open File Rep., XX, 37 pp., 1972.
Lee, W. H. K. and J. C. Lahr, HYPO71 (Revised); A computer program for determining hypocenter, magnitude and first motion pattern of local earthquakes, U.S. Geol. Surv. Open File Rep., 75-311, 1975.
Machado, F., Anomalias das Intensidades do Terramoto de S. Miguel, Acores em 1522, Bol. Mus. Lab. Miner. Geol. Fac. Ciencas, 10, 109-117, 1966.
Machado, F,, Periodicidade sismica nos Acores, Ministerio da Industria e Technologia, Direccao-Geral dos Servicos Electricos, Direccao Geral dos Combustiveis, Comissao para o Estudo de Geotermia dos Acores-S. Miguel, Documentacao., 1973.
Machado, F. and V. H. Forjaz, A crise sismica de S. Jorge, de Fevereiro de 1964, Bol. Soc. Geol. Port., 16, 19-36, 1965.
Machado, F., W. H. Parson, A. F. Richards, and J. W. Mulford, Capelhinos eruption of Fayal Volcano, Azores, 1957-1958, /. Geophys. Res., 67 (9), 3519-3530, 1962.
Machado, F., J. Quintino, and J. H. Monteiro, Geology of the Azores and the Mid-Atlantic rift, Proc. 24th Int. Geol. Congr., Sect. 3, 134-142, 1972.
Marks, S. M., R. S. Ludwin, K. B. Louie, and C. G. Bufe, Seismic monitoring at the Geysers geothermal field, California, US. Geol. Surv. Open File Rep., 78-798, 1978.
McKenzie, D., Active tectonics of the Mediterranean region, Geophys. J. R. Astron. Soc, 30, 109-185, 1972.
Mori, J. and C. McKee, Outward-dipping ring-fault strucutre at Rabaul caldera as shown by earthquake locations, Science, 235, 193-195, 1987.
Muecke, G. K., J. M. Ade-Hall, F. Aumento, A. MacDonald, P. H. Reynolds, R. D. Hynd- man, J. Quintino, N. Opdyke, and W. Lowrie, Deep drilling in an active geothermal area in the Azores, Nature, 252, 281-285, 1974.
Neumann Van Padang, M., A. F. Richards, F. Machado, T. Bravo, P. E. Baker, and R. W. Le Maitre, Atlantic Ocean, Inter. Volcan. Assoc., Catalogue of active volcanoes-?t 21., 1967.
Oppenheimer, D. H. and K. E. Herkenhoff, Velocity-density properties of the lithosphere from three-dimensional modeling at the Geysers-Clear Lake region, California, /. Geo phys. Res., 86, 6057-6065, 1981.
Raleigh, C. B., J. D. Healy, and J. D. Bredehoeft, An experiment in earthquake control at Rangely, Colorado, Science, 191, 1230-1237, 1976.
Reasenberg, P., W. Ellsworth, and A. Walter, Teleseismic evidence for a low-velocity body under the Coso geothermal area, /. Geophys. Res., 85, 2471-2483, 1980.

26
Richter, C. F., An instrumental earthquake magnitude scale, Bull. Seism. Soc. Am., 25, 1-32, 1935.
Robinson, R. and H. M. lyer, Delineation of a low-velocity body under the Roosevelt Hot Springs geothermal area, Utah, using teleseismic P-wave data, Geophysics, 46, 1456-1466, 1981.
Sanders, C. O. and F. Ryall, Geometry of magma bodies beneath Long Valley, California determined from anomalous earthquake signals,, Geophysical Research Letters, 10, 690-692, 1983.
Searle, R. C., Tectonic pattern of the Azores spreading centre and triple junction, Earth and Planetary Science Letters, 51, 415-534., 1980.
Stauber, D. A., Two-dimensional compressional wave velocity structure under San Francisco * volcanic field, Arizona, from teleseismic P-residual measurements, /. Geophys. Res., 87,
5451-5459, 1982.Stauber, D. A., S. M. Green, and H. M. lyer, Three-dimensional P velocity structure of the
crust below Newberry volcano, Oregon, /. Geophys. Res., 93, 10,059-10,107, 1988.Steeples, D. W. and H. M. lyer, Low-velocity zone under Long Valley as determined from
teleseismic events, /. Geophys. Res., 81, 849-860, 1976.Wadati, K., On travel time of earthquake waves, Part n, Geophys. Mag., 7, 101-111, 1933.Walker, G. P. L. and R. Croasdale, Two plinian-type eruptions in the Azores, /. Geol. Soc.
London, 127, 17-55, 1971.Walter, A. W. and C. S. Weaver, Seismicity of the Coso Range, California, JGR, 85, 2441-
2458, 1980.Ward, P. L., Microearthquakes: prospecting tool and possible hazard in the development of
geothermal resources, Geothermics, 1, 3-12, 1972.Ward, P. L. and S. Bjornsson, Microearthquakes, swarms, and the geothermal areas of Ice
land, /. Geophys. Res., 76, 3953-3982, 1971.Ward, P. L. and K. H. Jacob, A study of microearthquakes and ground noise in the
Ahuachapan geothermal field, El Salvador, Central America,, Final Report to the United Nations Resources and Transport Division, Energy Section., 1971.
Ward, R. W. and C. Young, Mapping seismic attenuation within geothermal systems using teleseisms with application to the Geysers-Clear Lake region, /. Geophys. Res., 85, 5227-5236, 1980.
Weaver, C. S. and D. P. Hill, Earthquake swarms and local crustal spreading along major strike slip faults in California, Pageoph, 117, 51-64, 1979.
Weston, F. S., List of recorded volcanic eruptions in the Azores with brief reports, Bol. Mus. Lab. Miner. Geol. Fac. Ciencas, 10, 3-18, 1964.
Whitmarsh, R. B., Median valley refraction line, Mid-Atlantic ridge at 37 N, Nature, 246, 297-299, 1973.
Young, C. and R. W. Ward, Three-dimensional Q model of the Coso Hot Springs known geothermal resource, /. Geophys. Res., 85, 2459-2470, 1980.

27
Zbyszewski, G., Etude geologique de me de S. Miguel (Acores), Com. Serv. Geol. Portu gal, 45, 5-79, 1961.
Zucca, J. J., D. P. Hill, and R. L. Kovach, Crustal structure of Mauna Loa Volcano, Hawaii, from seismic refraction and gravity data, Bull. Seis. Soc. Am., 72, 1535-155P, 1982.

28
FIGURE CAPTIONS
Figure 1. Generalized map of the regional tectonic structures in the region of the Apores. Shown are the Mid-Atlantic Ridge (MAR), the Apores-Gibraltar Fracture Zone (AGFZ), and the Gloria Fault (GF).
Figure 2. Bathymetric map (after Tolstoy, 1951) of the Apores Plateau. The plateau is bounded on the west by the Mid-Atlantic Ridge, on the south by the East Apores Fracture Zone, and on the northeast by the Terceira Rift and North Apores Fracture Zone. Bathymetry is in meters.
Figure 3. Sao Miguel island. Shown are the three main volcanic centers, Sete Cidades, Agua de Pau, and Furnas. Calderas are indicated by hatched lines. Fissural basalt cones are shaded. Dots indicate the principle towns of Sete Cidades, Ponta Delgada, Ribeira Grande, Vila Franca do Campo, Furnas, Povopao, and Nordeste. Dots with tails show existing thermal springs on Agua de Pau including Caldeiras and Lombadas. Dashed lines are inferred faults from geophysical surveys. Lakes are indicated by script type. Solid diamonds are seismic station locations.
Figure 4. Seismic network used for the experiment. Solid diamonds are the INMG per manent network stations with signals telemetered to Ponta Delgada. Open diamonds indicate USGS digital recorder locations except for PVN and ADB which were paper drum recorders.
Figure 5. Frequency response curves for a) L4-C IHz geophone, and b) AS-110 high gain amplifier (not including the 50 Hz 5-pole anti-alias filters) employed in the DR-100.
Figure 6. Map (a) and cross section A-A' (b) of 8 selected local events. Open circles are events located without station terms, solid circles are the same events located with station terms.
Figure 7. Typical seismograms for a local event: a) the vertical component with the P-arrival indicated by the dashed line and timing marks for the first (1) and second (2) odd seconds after instrument trigger indicated by solid lines; b) horizontal component for the same event with the S-arrival indicated by the dashed line; and c) output of the plotting routine showing seismograms from 6 stations for the same event
Figure 8. Total seismic triggers from June 20 to October 12, 1983 determined from analog records of approximately 7500 station triggers.
Figure 9. Final location map for local events using the velocity model of Senos and Nunes [1980] with station terms, b) Shows the events in a depth cross-section. Magnitude and depth symbols are shown in (a). Diamonds indicate station locations.
Figure 10. Epicenters (a) and depth cross-section (b) for the events located during the September 6-7, 1983 swarm. Symbols are the same as Figure 9.
Figure 11. Bar graph of seismic events against time for the September 6-7, 1983

29
seismic swarm. Time period is 24 hours from 1000 (UTC) September 6. Events are grouped into 15 minute intervals.
Figure 12. Calculated magnitudes versus time for the September 6-7, 1983 seismic swarm. The largest recorded event was MD 2.34 at 0555 (UTC) September 7, 1983.
Figure 13. Plot of seismograms for a typical regional event which occurred approxi mately 35 km SE of Sao Miguel. Solid lines through the middle of the seismograms are the odd second spikes from the DR-100 record.
Figure 14. Regional earthquakes located from June 19 to October 10, 1983 by the INMG and USGS network. Sao Miguel is shown in outline. Locations are approximate because of the small aperture of the network. Local events are also plotted.
Figure 15. Regional earthquakes recorded by NOAA for the years 1970 to 1980 near the Acores Plateau (from the World Data Center A for Solid Earth Geophysics, National Geo physical Data Center). Shown by dashed lines are the approximate locations of the Mid- Atlantic Ridge (MAR), North Apores Fracture Zone (NAFZ), Terceira Rift (TR), East Acores Fracture Zone (EAFZ), and the Gloria Fault (GF). Islands are shaded.
Figure 16. Modified Wadati diagrams with S-travel time plotted against P-travel time for a) 37 local events with data from vertical and horizontal geophones, b) 27 local events with P from vertical geophones and S from horizontal geophones only, c) 9 regional events using data from vertical and horizontal components, and d) error estimates for the 90% confidence level for (A) local event data from 16a, (B) local event from 16b, and (C) regional event data from 16c.
Figure 17. Average (invariant) residuals calculated from 9 regional events. The con tour which approximates 0 s delay is shown with a solid line.
Figure 18. a-i) Residuals at each station minus the invariant residual for the 9 regional events. 0 s contour is shown with a solid line. Arrow indicates approximate approach azimuth of event
Figure 19. Average station residuals versus station elevation. Line A is a least-squares fit to all stations, Line b is a least- squares fit to all stations accept FAC and CML, and line C is the slope of the velocity in the top layer of the velocity model used in the hypocentral loca tion routine.
Figure 20. Depth cross-section plotted along line A-A' of Figure 9. Vertical exaggera tion is 2x. Shown are the areas of P-wave delay and low Vp/Vs. The dashed line indicates the zone of low Vp/Vs and P-wave attenuation from Senos and Nunes [1980]. Locations of seismic events are shown as solid circles. Shown is the proposed geothermal model of Agua de Pau Silva et al., [1985].

CO c -n 0
90'
I45°
I0
° I_
60'
45
°-
30
°-
15°-
90
45'
i 0°
h-6
0'
-4
5'
^3
0'
-15
CO o

32<
31'
30
24
° W
4
0°N
Tl
<5'
c t (D ro
,800-^
V0
V >
800
1A
OC
TF
QR
MIG
AS
''-^ \<
^9
BA
NK
4ooA
V^-^
,
36
°
CO

CM
CO
,05 -
,01i i
,51i i
,03
,53i
i
Od
LU
DQ
O
p
DO
UD
JJ
D||A
/^
00,6-0,03
,05
i i
i i
r >i
OL
7 3 no IN 's 3 a vi H
I
- ,0
f
- ,5
t
- ,0
5
- ,5
5
CO
0O)
il
,01,5L
,93
,0f
,05

33
oLO
LO
o HCM
LO CM
o -
LO -
O CM
LO CM
- o
- LO
OLO
LO
Figure 4

34
J) mCO "0
OzCOm
30
20
10
80
60
40
30
20
10
6
A'
J
/
j1
I
1
/
B
t
1
/
'"X
X
^
MODEL L-4C GEOPHONE
1.0 HZ 5500 OHM COIL
(;URVE SHUNT DAMPir
A OPEN 0 28
B 8905 OHMS 0.70
NlG -
04 0.6 0.8 1 2 34 8 8 10
FREQUENCY(a)
CO-< COHm
mCO "0
OzCOm
.01 .1 10 100 Hz
FREQUENCY
(b)
Figure 5

DE
PT
H
(KM
)
l I
o -
o
o
CO c ^
0 0>
OO
O
<*
OO
o
cn
-
N)
O
h O N
)h
cn N)
h O
CO
01

(a)
EPD1
36
(b)
(c)
^l^^
I I I I I I I I I I I .... I I I I I .1,__It .r b. r.U. *L -.1
Figure 7

g
TOTAL TRIGGERS
-oooooooooooooooo
so ~o ^c_c
00CM
c_ C 3
cO
m =.
CO m
OEo

38
50' -
45'
35' 30' i
25'
A
t
10 KMVila Franca do Campo
35' 30' 25'
0 10 20
DISTANCE (KM)
20'i
IHLA DE S. MIGUEL
a* A'Lagoa
k_) das Furnat
- 50'
- 45'
20'
A 1
^>
Vx~^x
II Q_LJ Q
o--1-2 --3 -4 --5 --6 -
-8 --9 -
-10--1 1 -
i |s-\ {_)
n ° R ^o °Q> ° o ^ o
a r-,na j-i aD rj LH
igD l I n. . u
0 o 00 0°oA
A A A,.,.,,,,,,,,,,,,,,,
Figure 9

39
50' -
45'
35' 30' 25'
\
20'
IHLA DE S. MIGUEL
h 50'
A
X\~Q_ UJ Q
o--1-2-3-4-5-6-7-8 \_Q
-10H-1 1
0
10 KM
35'
- 45'
Vila Franca do Campo
30' 25'
°Q>n CD
D D DD
a
OO
10 20 DISTANCE (KM)
20'
A'
D
Figure 10
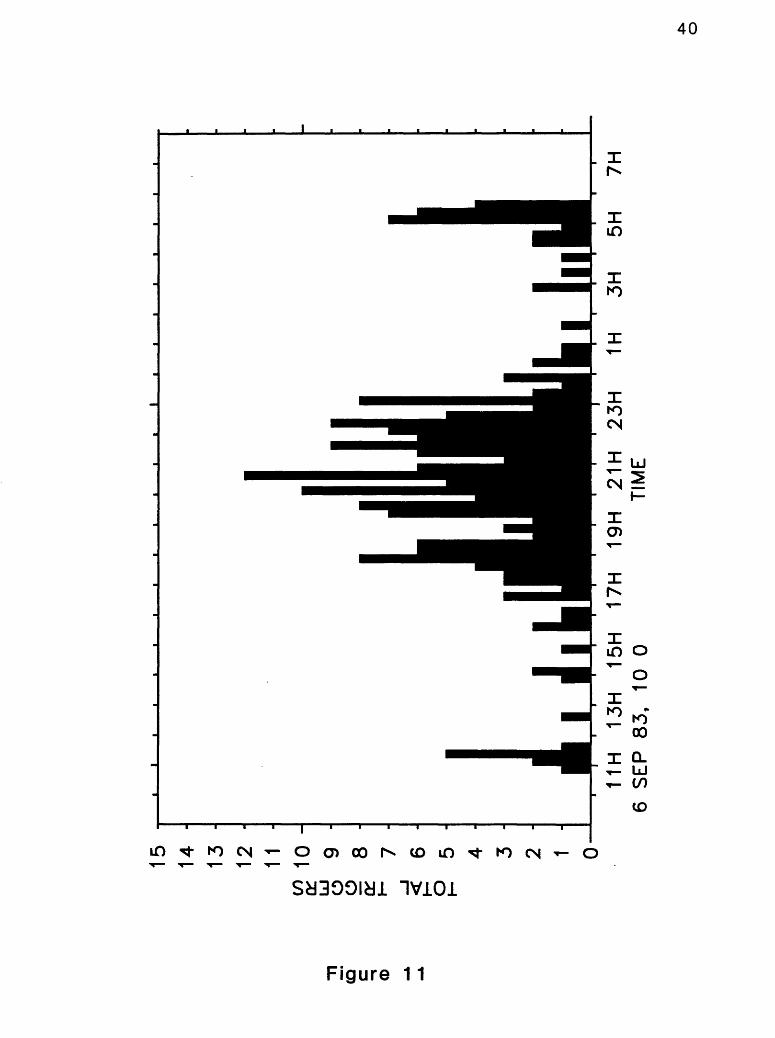
TOTAL TRIGGERS
o -^
Ofr

Zl
en
m -* T) ^
CD -^ CM ru
O ^
vjI
CMI
cnI
vlI
(OI
dS
MAGNITUDECM
> OO o m D
<o o> CM o b b b b
:£a-&-Je=©QO
tr
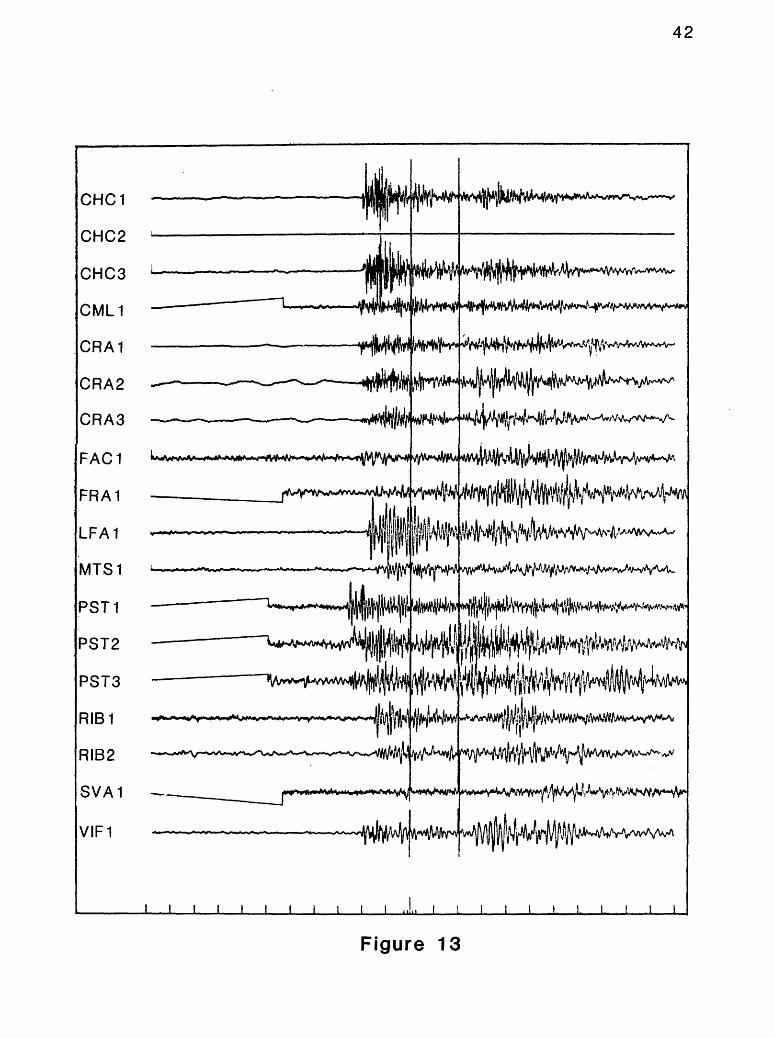
42
fflli^^
Vl|fj^^
^y^
^
^frM^MN^^^
SVA1
VIF1
i i i t i
Figure 13

OJ00
O
f O
N3-
O)
M-
CJi
-N3O)
: CJ1 o
00
O

S-WAVE TRAVELTIME (S)S-WAVE TRAVELTIME (S)
O U1 O O1 O (Ji O * «« ««O -* K) CM 4*» GH O> *******
K) -
mo
1 1 1 1 1 1
O
1 1 1 1 1
VP/VSS-WAVE TRAVELTIME (S)
* * « O» O> xlO -^ k> CM -fc. cn *******
I ' I
S m
i ^^< in
i I I I I
Xxx
x*X XX

6.
5.
4. 3.
2. 1.
0.
-of/
x)
. 1.
2.
3.
4« /
0 o
/ P
-WA
VE
TR
AV
ELT
IME
(S
) ! <*
0.
2.
4.
6.
8.
10.
12.
14.
16.
P-W
AV
E
TRA
VE
LTIM
E
(S)
o s|
10 <n to C*>
01

35
'3
0' i
25'
20'
_L
50'
-
(Q C
40
.05
45
1
4-0
.17
4^0.0
54-0
.10
0.0
3 L
agoa
\
ag
S.
Bra
z
\
05
\/*-0.0
1
10
KMV
ila
Fra
nca
do
C
am
po
- 5
0
/ (
L
agoa
S__
I d
as
Pu
mas
o^-
45
35
'3
0'
25'
20'
o>

35'
50
' -
< c ""I
0 00
0)
45'
30' i
25
'
\
10
KM
Vila
F
ran
ca
do
Ca
mp
o
20' i
- 5
0'
- 45
1
351
3025'
20
'

oo
,03
,52 i
odLU
DQ
O
p
DO
UD
JJ
D|JA
OL
JD
000k_D
O)
- ,0
5
,02,oe

351
30' i
25
'2
0' i
50'
-
<a c -i
0 00 o
45'
-(
( L
ag
oa
S_I
da
sF
urn
as
V
10
KM
Vila
F
ranca
do
C
am
po
- 5
0'
- 45'
35
'30
'25'
20
'
CD

3530' i
25
20
'
50
' -
(Q C -^ CD 00
Q.
45
' -
10
KM 35'
Vila
F
ranca
d
o
Ca
mp
o \30'
25
'
- 50'
- 45'
20
'en
o
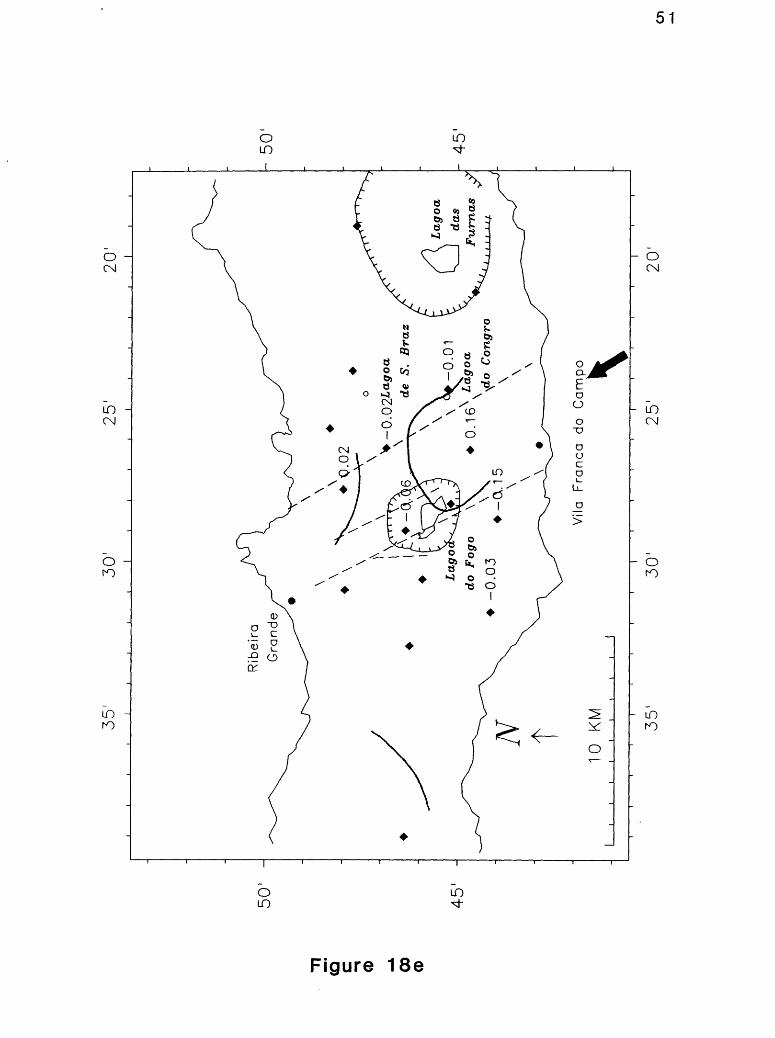
51
oLO
LO
oCN
LO CM
O
LO H
o o.E o o
O Oc o!^
LJ_
O
O CN
LO CM
h o
h LO
OLO
LO
Figure 18e

50'
-
CO C ^ 0 00
45'
35
'30
' i25'
10
KM
4-0
.10
\>
0.0
9 L
ago
\de
S.
B
raz
\\\
°+
-Q.Q
}Lo
9°
a
\do
Con
gro
\\
Vila
F
ran
ca
do
Ca
mp
o
20
' i
- 50'
(
( L
agoa
S_
I da
sF
urn
as
j?
N
- 4
5'
30'
25'
20'
01

53
oLO
LO
oCNJ
ID(N
o -
O C\J
oQ.
E a O
_D
>
- O
- LO
o
OLO
LO
Figure 18g

54
o m
m
oCM
m CM
o -
in ro
oQ.
ED O
>
O
O CM
mCM
o ro
Om
m
Figure 18h

35
'30'
25
'20'
50
' -
(Q C i 0 00
45
'/
( L
agoa
S_I
da
sF
urn
as
o?
t10
K
MV
ila
Fra
nca
d
o
Ca
mp
o
- 5
0
- 4
5'
35
'3
0'
25
'2
0'
en
en
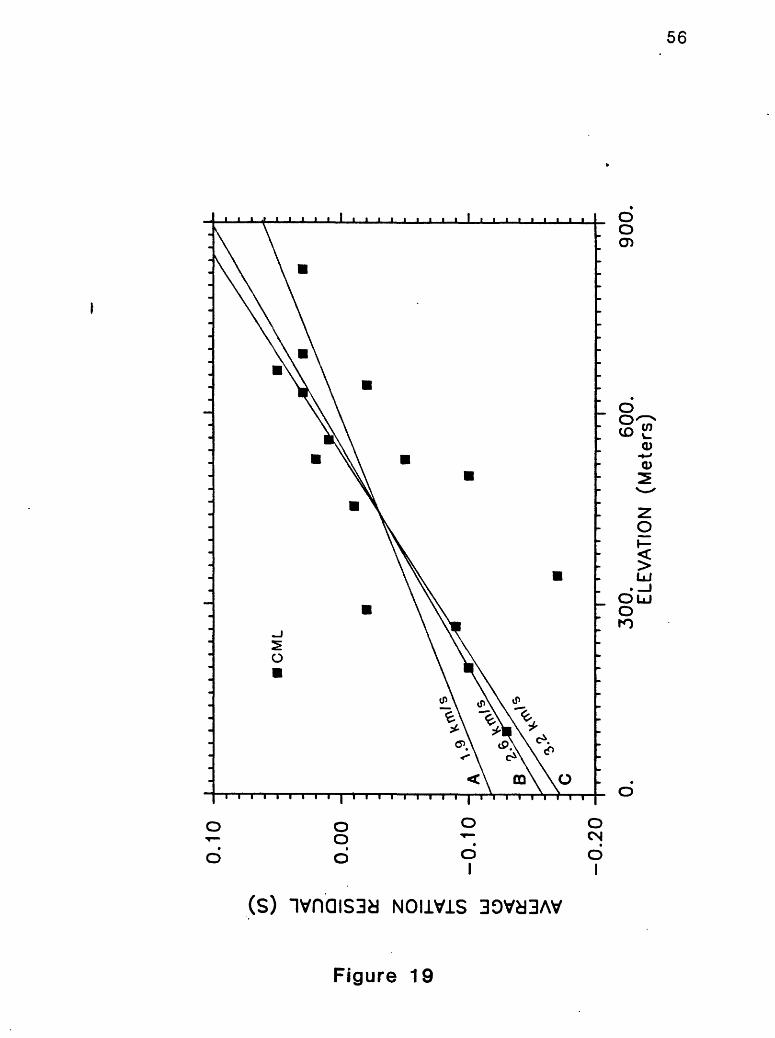
0.1
0
CO c I
CD CO
ID 77,
0.0
0
-
o: 2
O LJ O <
o: LJ
-0.1
0 -
-0.2
0
0.3
00
. 60
0,
ELE
VA
TIO
N
(Mete
rs)
900,
Ol
o>

57
Q_ LJ Q
Low Vp/Vs
P Wave Delays
Furnas
Plutonic Heat Source
10DISTANCE (KM)
Figure 20

58
APPENDIX A
Clock Drifts (ms)
Station: Recorder No, :
DAY169170171172173174175176177178179180181182183184185186187188189190191192193194195196197198199200201202203204205206207208209210211212213214215216217218219220221222223
ADA CMC 216 192
on..
+ 14.on... .
-44.5 +19..
* 8.-40.6-14.5 * 7.
.
. .-37.4 + 9.
. .-23.3 * 7.
.-28.5 * 5.
.
. .-38.4 + 6.
.-27.1 * 4.
.+ 4.
._
+ 5..
+ 6..
* 4....
* 4..
* 4..
* 4...
* 7..
* 9._.
* 7.._
+10._.
+ 6..
+ 6.
7
3
0
4
2
6
0
8
6
8
7
3
7
0
3
3
2
7
5
1
0
0
CRA 347
on...
+15.7.
+15.2..
+22.9.
+17.7.
+15.0..
+22.8.
+16.0.
+15.9._
+21.8_
+16.8.
+15.6..
+20.9.
+15.2.
+16.1-.
+23.7.
+19.1.
+16.8..
+26.4.
+18.4.
+ 16.4
EPD 214-216
on.-._
+81.0.
+31.8.
+26.8..
+41.0.
+23.7.
+18.2..
+34.1.
+22.3MMHMMMM*
-20.8-11.2
___
-37.7_
-24.2..
-35.3.
-21.1.
-21.0..
-31.6.
-20.3.
-20.8..
-37.1.
-21.7-
LCD 218
on..«_
+44.7.
+16.8.
+14.5._
+23.5.
+16.0.
+13.4..
+26.1.
+14.9.
+16.2._..
+34.3_
+13.2..
+13.3.
+10.1.
+11.3_-.
+15.6.
+10.1.
+10.9..
+12.7.
+ 7.4-
Mil 346
on..
+67.8.
+56.0.
+31.3.
+33.1._
+43.9_
+31.2.
+33.1..
+49.7.
+31.5.
+32.6_.
+50.4.
+27.9.
+33.0..
+43.7.
+29.7.
+30.4..
+43.3.
+27.4.
+28.5..
+47.7.
+36.1-
MI 2 344
+43.6.
+32.6.
+15.8.
+16.5._
+22.4_
+16.2.
+16.8..
N/R.
+15.8.
+16.4..
+25.2.
+14.6.
+17.3..
+23.0.
+15.9.
+16.4..
+21.6.
+13.3.
+ 14.1..
+25.6.
+19.4.
MIS 203
on.
+ 5.6.
+ 5.9..
+ 8.8.
+ 5.9-
+ 6.1..
+ 9.7.
+ 6.6.
+ 5.8._
+ 8.9.
+ 6.6.
PFM 202
on...
+59.1.
+32.0.
+28.0..
+47.8.
+31.1.
+27.9..
+45.4.
+30.2.
+29.5+13.7
.
.
.+60.3
.+31.1
.
.+41.7
+29.0-
+30.0--
+44.1.
+31.7.
+32.3..
+47.9.
+30.5-
PST PVM SBA 212 202 202
on- 7.
-...
-31..
-16..
-12...
-18..
-12..
-12.-.
-17.-
-14._
-11.-.
-16..
-11..
-11.-.
-18..
-11..
-10.-.
-16..
-11..
-10...
-15..
-13..
-11.
on._
4 +51.7-
+24.7
9
0
4
3
6
9
7
9
4
7
6
2
0
3
8
3
6
7
8
4
3

59
Appendix A cont.
Clock Drifts (ms)
Station: Recorder No. :
DAY2242251226227228229230231232233234235236237238239240241242243244245246247248249250251252253254255256257258259260261262263264265266267268269270271272273274275276277278
ADA CHC 216 192
.
.* 8.5
.* 5.2
.
.-
+11.4.
* 6.0-
+ 5.7-.
* 9.7.
* 5.8.
* 6.3__
+10.9
* 7.2 «
* 6.3_
+11.3.
* 7.3.
+11.4..
+13.8
+ 8.5
+ 6.8.
+15.8.
+ 7.2_
+ 8.0.
+ 8.9_
+ 8.7-
CRA 347
.
.+26.
-+17.
.+15.
-.
+23..
+16.-
+15.-.
+23..
+16._
+15..
+24.
+16.-
+15.__
+23._
+15..
+19...
+27.
+17..
+16..
+28..
+16..
+16...
+22..
+16.-
3
0
8
6
3
9
1
3
9
6
6
2
7
8
2
2
7
1
3
5
9
0
9
EPD 214-216
-25.0..
-39.5.
-26.8.
-26.4._
-38.9
-64.7-
+13.7..
-39.5.
-27.8
-26.2 _
-33.6.
-27.2.
-27.1..
-40.2 _
-24.8.
-26.8..
-38.3.
-29.8.
-24.3..
-27.0.
-23.6.
-26.7....-
LGD 218
+ 8.2..
+12.6.
+ 7.5.
+ 6.8..
+ 9.6_
+ 6.4.
+ 6.5.»
+10.1
+ 6.0_
+ 6.4 »
+12.4.
+ 6.1-.
+ 6.5_.
+ 9.8_
+ 6.7_
+ 6.7..
+ 9.4.
+ 6.1.
+ 9.6_-
+19.1.
+ 9.8.
+ 9.0....
+24.7
Mil 346
+29.1..
+47.2_
+32.9.
+32.8 _
+49.9
+32.4.
+31.0..
+62.6.
+41.5_
+25.4..
+40.9.
+29.6.
+32.7..
+48.5.
+24.4-.
+26.6-.
+40.2.
+24.8.
+25.9..
+50.7.
+33.3.
+34.5._
+51.6.
+37.4
MI 2 344
+15.9..
+26.3_
+19.1.
+19.0..
+26.9.
+17.7.
+15.7._
+39.6_
+27.0.
+11.9..
+24.2.
+17.5-.
+20.8..
+30.2_
+12.4.
+15.2-.
+19.8-
+11.2.
+13.3.-
+28.1.
+18.5. +19.3
.
.+29.6
+21.5
M13 203
+ 5.6..
+ 9.2.
+ 6.0.
+ 6.2_.
+ 8.8.
+ 5.9.
+ 6.4..
+ 8.6
+ 5.3.
+ 6.9..
+10.7.
+ 5.3.
+ 5.9..
+24.6.
+ 6.5.
+ 6.6-.
+10.1-
+ 6.8-
+ 6.9.-
+ 8.7.
+ 5.7.
+ 6.0. ".
+ 9.8
+ 6.0
PFM 202
+33.2..
+47.7.
+32.2.
+32.7..
+45.7.
- 7.7.
+71.8._
+49.2_
+31.4_
+31.5..
+52.9.
+32.7-
+34.6..
N/R.
+33.3.
+33.2-.
+49.0-
+30.8-
+37.2..
+64.4.
+37.0_
+37.3
^M^MMM
PST 212
.
.-18.
.-11.
-10.
.
.-16.
_-12.
.-10.
.
.-19.
.-12.
.-13.
.
-17.
-12..
-13..
-17..
-12..
-12..-
-15.
-13..
-11...
-12..
-11.
- 9...
-17..
-12..
PVM SBA 202 202
3
4
9
6
4
8
0
6
0
8
3
1
3
0
1
9
0
5
3
4
9
2 on.
3 +14.0+16.9

60
Appendix A cont.
Clock Drifts (ns)
Station: Recorder No.:
DAY279280281282283284 285 I
ADA CMC 216 192
+ 8.2
CRA 347
+ 16.9
EPD 214-216
--83.8
LGD 218
* 9.5
Mil 346
.+35.4
.
+50.5_
+32.3
MI2 344
.+19.7
.
.+28.1
.+17.2
MIS PFM 203 202
.+ 6.4
._
+10.1_
+ 6.8
PST 212
-11.3
PVM SBA 202 202
+20.7..
+43.7+17.8+18.8+19.8
___ Station removed
Tapes were changed and clock drifts were measured every two days (three days over weekends) and each clock was reset to *0.1 ms after drift was measured. The numbers 1n the above table Indicate the amount of drift (ms) measured on the Indicated day from the previous tape change.

61
APPENDIX B
FINAL HYPOCENTERS
YRMODA ORIGIN LAT LON DEPTH MAG NO GAP DM RMS ERH ERV Qft
830628
830628
830628
830628
830628_|
830628
830629
830629
830629
830701
830702
830702
830705
830705
830706
830713
830717
830718
830719
830725
830726
830730
830805
1 830810
830812
830813
830824
830829
0231:34.13
1410:10.14
1415:00.13
1730:07.51
2217:18.62
2344:55.36
0242:43.39
0411:53.50
0611:11.47
0533:23.32
1109:58.67
2229:30.83
0633:52.64
2328:26.29
0233:01.21
0120:25.21
0048:49.37
1229:07.77
2328:53.87
0737:03.88
1724:19.23
2321:27.25
2355:30.84
0040:34.46
2326:14.46
0214:45.68
2017:20.11
2214:19.99
37° 44.72'
37° 46.57'
37° 43.39'
37° 46.21'
37° 54.95'
37° 46.54'
37° 45.22'
37° 46.42'
37° 46.04'
38° 16.55'
37° 43.44'
37° 28.62'
37° 54.49'
37° 46.46'
37° 46.31'
37° 33.62'
37° 45.81'
37° 45.33'
37° 44.97'
37° 27.72'
37° 32.74'
37° 48.11'
37° 44.15'
37° 25.80'
38° 11.73'
37° 30.76'
37° 46.47'
37° 45.49'
25° 25.79'
25° 25.26'
25° 25.33'
25° 26.41'
25° 00.44'
25° 25.47'
25° 23.07'
25° 24.84'
25° 26.20'
26° 16.96'
25° 20.42'
25° 05.49'
25° 58.79'
25° 27.80'
25° 26.39'
25° 16.75'
25° 22.67'
25° 33.78'
25° 24.94'
25° 17.62'
25° 06.90'
25° 39.57'
25° 26.34'
25° 35.11'
25° 02.96'
25° 15.77'
25° 25.70'
25° 21.82'
10.22
6.98
8.03
3.33
3.00
9.19
1.29
6.61
5.68
3.00
2.06
1.14
0.43
0.38
0.98
21.32
10.14
1.01
3.29
0.67
9.49
4.27
1.66
5.75
3.00
5.64
6.11
6.08
1.44
1.09
1.29
1.48
1.62
1.41
1.12
1.04
1.14
2.40
1.42
1.80
1.51
1.54
1.31
1.79
1.63
1.16
1.19
1.55
1.78
1.85
1.50
1.77
1.73
1.83
1.30
1.15
7
5
5
6
12
9
4
5
5
6
8
17
9
5
7
7
10
4
6
8
14
6
12
20
15
17
6
7
174
259
328
172
346
99
316
271
192
357
314
344
353
116
144
345
162
305
159
354
342
285
180
321
339
335
146
126
0.9
1.6
2.9
1.2
36.0
1.4
5.0
2.3
1.5
85.7
2.4
37.5
41.1
1.8
3.0
24.9
3.2
2.3
2.2
33.9
36.2
33
1.0
34.3
50.4
29.7
1.1
1.9
0.05
0.02
0.10
0.09
0.28
0.06
0.00
0.00
0.04
0.08
0.07
0.14
0.13
0.29
0.23
0.17
0.05
0.47
0.06
0.29
0.14
0.03
0.16
0.13
0.47
0.23
0.03
0.07
0.9
1.4
5.1
1.0
194.8
0.9
0.0
0.1
1.5
999.9
1.4
56.6
389.7
2.56
1.3
15.4
0.8
0.0
0.7
676.4
61.9
13.4
0.8
1.3
127.4
2.8
0.7
0.8
1.0
1.0
2.4
2.1
253.4
1.0
0.0
0.1
1.2
999.9
0.6
42.4
146.9
40.9
1.0
15.3
0.7
0.0
1.5
511.0
109.5
4.9
0.4
141.0
120.7
267.6
0.9
1.1
BC
CC
DC
CC
DC
BC
CC
CC
CC
DC
CC
DC
DC
DC
CC
DC
BC
DC
BC
DC
DC
DC
CC
DC
DC
DC
BC
BC

62
APPENDIX B
FINAL HYPOCENTERS
YRMODA ORIGIN LAT LON DEPTH
830902
830906
830906
830906
B30906
830906
830906
830906
830906
830906
830906
830906
830906
830906
830906
830906
830906
830906
830906
830906
830906
830907
830907
830907
830912
830912
830914
830930
1403:15.40
1509:06.25
1751:33.65
1842:57.68
1847:02.37
1848:43.95
1902:37.35
1913:45.93
1914:00.96
1920:3121
2022:10.59
2033:13.44
2058:18.76
2102:35.57
2133:16.98
2140:46.17
2158:02.96
2200:20.98
2204:21.98
2245:18.45
2310:51.63
0555:16.05
0606:1180
0635:45.52
0315:31.79
1716:37.43
0507:56.61
0742:34.70
37° 37.68'
37° 48.06'
37° 44.41'
37° 45.73'
37° 45.70'
37° 44.79'
37° 45.71'
37° 45.76'
37° 46.32'
37° 45.97'
37° 45.57'
37° 43.71'
37° 45.95'
37° 46.29'
37° 45.64'
37° 4636'
37° 46.75'
37° 49.28'
37° 46.26'
37° 46.02'
37° 46.66'
37° 47.43'
37° 45.89'
37° 46.81'
37° 51.31'
37° 56.91'
37° 45.12'
37° 47.29'
25° 34.69'
25° 24.29'
25° 26.12'
25° 26.42'
25° 27.22'
25° 25. 16'
25° 21.59'
25° 27.07'
25° 19.16'
25° 27.65'
25° 25.45'
25° 24.63'
25° 25.60'
25° 25.90'
25° 26.74'
25° 25.74'
25° 26.41 '
25° 26.41'
25° 24.78'
25° 27.77'
25° 24.97'
25° 24.59'
25° 25.66'
21 J 26.89'
25° 28.45'
25° 40.33'
25° 24.72'
25° 23.70'
1.50
5.27
1105
0.65
3.12
10.12
5.39
0.83
3.00
0.54
1.32
4.55
3.00
3.00
0.17
6.14
6.97
3.00
1.72
3.67
1.40
3.68
3.00
4.03
136
3.00
4.63
5.09
MAG
1.01
1.39
0.63
1.15
0.96
0.55
0.72
0.55
1.52
0.75
0.95
0.98
1.60
1.30
1.52
1.69
1.51
1.23
1.40
1.15
107
134
1.51
1.93
1.30
1.82
1.36
1.31
NO GAP DM
6
6
6
5
5
7
9
6
3
6
6
7
3
7
5
9
5
3
7
5
13
13
3
7
6
9
8
7
345
205
223
109
148
170
209
138
339
148
223
315
238
160
129
177
137
323
272
149
137
165
233
110
294
317
244
162
17.8
1.0
0.6
1.9
2.2
1.8
5.2
2.2
10.5
2.1
2.1
3.2
2.0
12
1.8
1.2
0.2
4.5
2.5
1.9
2.0
2.7
2.0
0.9
9.6
19.6
5.0
3.9
RMS ERH ERV Q»
1.13
0.04
0.10
0.15
0.01
0.12
0.13
0.07
0.00
0.21
0.19
0.10
0.00
0.23
0.09
0.08
0.12
0.20
0.13
0.02
0.13
0.19
0.00
0.18
0.03
0.27
0.08
0.13
61.0
0.9
3.1
0.1
0.1
13
3.6
0.3
0.0
10
2.5
1.3
0.0
16
0.5
0.9
4.5
0.0
1.4
0.3
0.6
1.1
0.0
1.4
15
24.1
1.4
1.4
27.6
0.5
2.2
1.9
0.3
1.5
3.6
3.4
0.0
201.3
5.8
1.9
0.0
3.3
1.6
0.9
5.3
0.0
0.4
0.7
0.4
1.7
0.0
2.8
102.8
29.6
1.4
3.7
DC
CC
DC
CC
CC
CC
DC
CC
CC
CC
DC
CC
CC
CC
CC
BC
DC
CC
CC
CC
BC
CC
CC
BC
DC
DC
CC
CC

63
APPENDIX B
FINAL HYPOCENTERS
YRMODA ORIGIN LAT LON DEPTH MAG NO GAP DM RMS ERH ERV Q
831001
831002
831002
831009
0007:35.44
0543:23.45
2157:04.33
0421:03.36
37° 45.44'
37° 00.61'
38° 05.07'
37° 26.31'
24° 31.36'
25° 1187'
26° 03.81'
24° 55.56'
1.50
1.10
3.00
5.71
108
3.00
3.10
123
16
11
9
14
355
349
134
341
70.1
90.0
95.0
50.6
0.17
0.12
181
0.09
649.2
81.3
19.9
43.0
400.8
26.9
74.5
76.5
DC
DC
DC
DC
Program Parameters Test Variable Value Used DefinitionTEST(01)
TEST(03)
TEST(ll)
0.0001
0.2
15
Crustal Velocity Model 2.40 0.00 4.10 0.50 5.40 2.20 6.80 5.40 7.80 11.00
3.30.
100.
1.73
3
The cutoff value for RMS below which Jeffrey's weighting of residuals is not used. In this case Jeffrey's weighting is always used.Critical F-value for the stepwise multiple regression [Draper and Smith, 1966]. TEST(03) should be set according to the number and quality of P- and S- arrivals.Maximum number of iterations in the hypocentral adjustment.
Column 1: P-velocity (km/sec) in a given layer. Column2: depth (km) to the top of a given layer.
Trial focal depth in km.Distance in km from epicenter where the distance weighting is 1.Distance in km from epicenter beyond which the distance weighting as 0.Ratio of P-veloctiy to S-velocity.A, B, Cf and D quality class of earthquakes to be included in the summary of residuals. Method of selecting earthquake magnitude:

64
Hypocenter Output
The following data in the HYPO71 locations are given for each event:
1. DATE of earthquake: Year, Month, and day. 830628 = June 28, 1983.2. ORIGIN time in Coordinated Universal Time (UTC), (hour, minute, and second).
1410 10.14 = 14 hours, 10 minutes, and 10.14 seconds.3. Epicenter in degrees and minutes of north latitude (LATITUDE) and west longitude
(LONGITUDE).4. DEPTH of the focus in kilometers.5. MAG, local magnitude of the earthquake.£. NO, total number of P- and S-arrivals used in location the earthquake.7. GAP, largest azimuthal separation (degrees) between stations.8. DM, epicentral distance (km) to the nearest station.9. RMS, root-mean-square error of the time residuals:
where $R$ is the observed seismic-wave arrival time minus the computed time at the SithS station.
10. ERH, standard error of the epicenter (km):
where SDX and SDY are the standard errors in latitude and longitude, respectively, of the epicenter.
11. ERZ, standard error of the depth in kilometers.12. Q, solution quality of the hypocenter. This measure is intended to indicate the general
reliability of each solution.Q Epicenter Focal Depth
ABCD
excellentgoodfairpoor
goodfair
poorpoor
Q is based on the nature of the station distribution with respect to the earthquake and the statistical measure of the solution. These two factors are each rated independently according to the following schemes.
Station Distrubution NO GAP DMIN
A > 6 < 90 < depth or 5 km B > 6 < .35 < 2 x depth or 10 km C > 6 < 180 < 50 km D others
Statistical Measures RMS (sec) ERH (km) ERZ (km)

65
A < 0.15 < 1.0 < 2.0B <0.30 <2.5 <5.0C < 0.50 < 5.0D others
Q is taken as the average of the ratings from the two schemes, i.e., an A and a C yields a B, and two B's yield a B. When the two ratings are only one level apart the lower one is used, i.e., an A and a B yield a B.

Z
W
W
co
o p
p p
p p
p
Tf uS Tf vd o* vd
Tf C
O
coco3 t-*C
O C
O
O <S
coco
CO
U">
t-; T-Ht-" oo co co
oo Tf o co t-- cS ON
P fS
CO
CO CO
VO t-;
VO
VO
VO
VO
VO* V
O V
O
CO
CO
CO
CO
CO
CO
CO
T-H
T
-H
T-H
T
-H
T-H
T
-H
T-H
CO
CO
CO
CO
CO
CO
CO
o o
oo o
oo
OO
OO
00
OO
OO
OO
OO
^O V
D V
O V
O V
O V
O V
O
0000000
CO
CO
CO
CO
CO
CO
CO
0
0 O
O O
O O
O O
O O
O O
O
T-H O
pp
pp
oooo o
Tf
CO
00
CO
CO
CO
CO
oo r^. o «n
vo r*»oo T-H
T-H
T
-H
T-H
T
-H
oooo
Tf T
f T
f T
fT
-H
T-H
T
-H
T »
oo oooo oo cs cs fS cs vovovovooooo
CO
CO
CO
CO
oo oo oo ooco
oooo
CO
CO
coco
Tf O
NO
N OO
fS* COV
OV
O
Tf
ON
CO
«
OC
O «O
»-» fS C
S CO
VO
VO
VO
VO
Tf T
f T
f T
f
oo oo oo oo V
OV
OV
OV
Ooo o
oC
O C
O C
O C
Ooooo o
oo
o
T-H
T
-H
T-H
T
f
*&££
oo
oo
o
COCS
Tf
Tf
CO
coco
fNQT
t
OO
Nr-v
o
ON
t** OO ON VO T
f »O u-i vo ON
oo 060606 06VO VO VO VO VO ON ON ON ON ON C
S CS C
S CS C
S
oo oo oo oo ooC
S CS C
S CS <N
VO VO VO VO VOo
oo
oo
CO
CO
CO
CO
CO
oo oooo oo oo
T-H
T
-H O
O
<
N
oo
oo
oo
CO
CO
CO
CO
CO
CO
CO
CO
CO
CO
CO
CO
vo Tf Q Tf r- T-I
ON ON Tf ON T
f OO
* O* T-H
O
* CS
CO
C
O C
O C
O C
OC
O C
O
OO
O
>
O
T-H
O
T
-H
»n oo oo p co cs
>o >ri uS vo vo r^r*» r*» r*» t** f*» r*»
oo oo oo oo oo oo cs cs cs cs cs csvo vo vo vo vo vooooooo
CO CO CO CO CO CO
OO OO 00 OO OOOO
CO
* I O
CO
tS *-*
cj
pp
pp
pp
pp
TfT
fT
flO
VO
CS
CO
i-*
CO Tf CO CO Tf Tf
CO CO CO CO CO CO
oo vo >n in incs
06 ON 06 06 06 ON
CO
Tfc
NlC
OC
OC
OO
*-'
cocococococococo
oooooooooooooooo vovovovovovovovo0
0 O
OO
OO
O
cocococococococo
oooooooooooooooo
OO
OO
OD
DD
QD
cO
Tf
++
pppp
T-H
O
O O
OT
-H O
*~
4 '~
(
CO
Tf T
f
CO
CO
CO
CO
t-- OJ
oo oo oo_
VOT
f T
f T
f
T-H CO
OO
OO
00 O
N O
N VO
*T
f T
f
U->
T
f T
f T
f
oo
oo
ON ON ON ON
VO
VO
VO
VO
oo
oo
CO
CO
CO
CO
oo oo oo oo
-°
pp
pp
oo I^O
N
Tj* C
O
CO
CO
00
O
T-H C
O
Tf
CO
VO
r*-vo >o »o
in
80
J V
OO
O
T-H
T
-H C
O
S3
ON ONcscsvo
vo
00
co
co
oo oo S3
ON ONcs csVO
VO
00
co
co
oo oo
T-H O
CO
CO
+ Q
+
+
OH
O
H O
H
pp
p p
O'T
^ON
O
CO
Tf
Tf T
f
CO
CO
CO
CO
«ooo Tf esf-C
O VO ON
CO
Tf
Tf IT
)T
(
T-H
T
(
T-H
»o »o oo r*-oo oo oo pC
S CS C
S COT
-H
T-H
T
-H T
(
ON ON ON ONcs cscs csV
OV
OV
OV
Oo
oo
oC
O C
O C
O C
Ooooo oo oo
OJ O
CO
CO
o Q
+ +
^E
OH
C^
PW
w

QCO
p p
p p
pOO O
O O
O
<S CO CO
CO CO
CO CO
CO C
O CO
oo >n rfr co <s
^ oo r- o
\C
OC
O T
f VO
vo r- r- r- oo coco co co coC
O C
O C
O C
O C
O
CO
CO
CO
CO
CO
oo
oo
or t
r t
i-H i-H
T
t
oo
oo
o
r- r- r- r- r-o
oo
oo
CO
CO
CO
CO
CO
oo oo oo oo oo
LW
CU
00
00
CO
CO
CO
CO
CO CO
CO
CO
r- ^
co<
S C
O I-H
OO
r
co coo
oo
in o
\
oo
oo
r- r- r- r-0
00
0
CO CO
CO CO
oo oo oo oo
i-H T
-» <
S O
OOOOOOOOOOO
OO
OO
OO
OO
OO
OO
OO
OO
OO
OO
OO
CO CO
CO CO
CO
tS vo vo
ON
CO CO
CO
W-JO
OO
N
r-OO
OO
OO
ON
ON
ON
ON
ON
ON
ON
coco
coco
coco
coco
coco
coO
NO
NO
NO
NO
NO
NO
NO
NO
NO
NO
N
OO
OO
OO
OO
OO
O
OO
OO
OO
OO
OO
O
cococococococococococo
oooooooooooooooooooooo
Q Q
O Q
oo
oo
oo
OO
tS
CO COCO Tf Tf CO
CO CO CO CO CO CO
oONr- >oC
OO
Nw>
oo oo
oo oo oo
8O
i-H i-H
i-H C
O
oo
oo
o
CO
CO
CO
CO
CO
CO
vo vo vo vo vo VOoooooo
oo
oo
oo
r* r* r^ r- r* r-000000
CO CO
CO CO
CO CO
oo oo
oo
oo
oo oo
CO
CO
+
PU W
I CO
"<t
+ +
Q +
+PU PU W
W
CO
OO
OO
Oin
CO
COco
in VOON vo co vovo «s co»nvo vo r- r^ oooo oo oo oo ooC
O C
O C
O C
O C
O
in wi in in >n
ooooo
ooooo
CO
CO
CO
CO
CO
oo oooo oo oo
CO
CO
fS «S «N
PU PU
PU P
u PU
oooooo
^
CO
CO
CO C
OC
O CO
CO
CO
Tf I-H r-< r- >n o
m oo co in rt 1-1
^
VO
VO
in in >nV
O VlD V
O
«s TtO
T-«
VO VOo
oo
oo
o
r-« r- r- r- r*- r-«o
oo
oo
oC
O C
O C
O C
O C
O C
Ooo oo oo oo oo oo
pu pu pu pu pu
oo
oo
o o
oON ON ON ON ON ON O1
""^
T
"11^
l*
1^
1"^
f"^
1
""^
C
^l
^T
f
CO
CO
ON r- co corf coC
O C
O
coCOinCO
TfrCO nVOCO
C
O
coON in
in »n
tN ^
"
W) *~~< <
N ^
" O
OO
O O
i i *** *~* *"<C
O C
O C
O C
O C
O C
O C
O0000000
ooooooo
CO
CO
CO
CO
CO
CO
CO
ooooooo
CO
CO
CO
CO
CO
CO
CO
oo oo oo oo oo oo oo
OO
OC
O C
OC
O T
*Q
IDD
Q + + +
a, a- PU PU & £< PH
HH
W
K
H
W
»-<
I "
PQ

68
APPENDIX CPHASE DATA
STAVIFEPDFRAPFMMTSADBRIBLFAPVNCMLVIFRIBSVAVIFFRAMTSRIBLFAVIFMTSLFARIBVIFCRAPFMMTSRIBPSTLFAFRASVACMLFACFACPVNPSTLFAADBRIBMTSVIF
PRMKP-4
IPUOIPUOIPUOPD1P+3
IPDOPU1P-3
EP+0PUO
EP+0EP+4IPDO
P-3P+3
EP+4P+l
EPU3IPU1IPU1EP+3PU1PUOP+3P+lPUOPUOPDOP+4P+4P+4PU1IP+0P+4
IP+4IPD1
P+3IPD1IPD1IPU3
TIME P-SEC830717004850.02830717004851.32830717004851.35830717004851.46830717004851.53830717004851.67830717004851.71830717004852.05830717004852.55830718122908.05830718122910.40830718122910.93830719232854.11830719232854.86830719232854.87830719232855.07830719232855.29830719232855.60830725073710.53830725073710.82830725073711.14830725073712.29830726172425.27830726172425.60830726172425.65830726172425.72830726172425.97830726172426.05830726172426.11830726172426.37830726172426.38830726172426.66830726172427.94830730232128.55830730232130.00830730232130.16830730232130.67830730232130.74830730232130.77830730232131.16830730232131.62
S-SEC52.9652.9052.8952.93
53.4253.4954.47
11.79
SRMKS4S4S3S2
S3S4S4
S3
58.00.S 456.4156.5757.2556.8256.5415.2315.9116.0017.2730.1532.2430.3930.5329.6530.8430.9330.4631.8931.6233.67
31.52
32.63
S4S3S4S2S4S3S3S3S3S2S4S3S4S4S2S3S3S4S3S3
S2
S3
DUR16.017.020.016.015.025.018.019.012.010.010.010.010.013.09.0
11.09.0
11.014.014.014.014.018.018.018.018.018.018.018.018.018.018.018.020.030.020.020.025.020.020.020.0

69
APPENDIX CPHASE DATA
STAVIFLCDADBCRAMTSRIBLFAFRACMLSVAPSTADBCRACMLFACCHCVIFLFAPVNRIBMTSFRASVASVAADBVIFMTSFRARIBLFAPVNCMLFACCMLLCDADBVIFPSTMTSLFAPVNRIBFAC
PRMKIPUOIPU1IP+3IPU1IPDOEP+3
P+2P-3
EP+4EP+2
P+0P+3
IP+0P+2P+2
IPUOP-2P-0P+3P-0P+lP+3P+4PD1P+4P-l
PU1P+4P+lP-lP+3P-3P+3
EP+4PUOP+3P+lPUOP-lP-l
EP+4P+3PDO
TIME P-SEC830805235531.44830805235531.55830805235531.91830805235531.97830805235532.32830805235532.66830805235532.67830805235532.71830805235533.01830805235533.75830810004040.33830810004040.50830810004040.79830810004040.81830810004040.93830810004040.94830810004040.98830810004041.16830810004041.20830810004041.50830810004041.54830810004041.55830810004042.35830812232623.13830812232623.24830812232623.57830812232623.90830812232623.99830812232624.18830812232624.32830812232624.60830812232624.70830812232626.03830813021450.00830813021450.83830813021450.90830813021451.11830813021451.50830813021451.55830813021451.74830813021451.80830813021452.10830813021453.21
S-SEC32.9232.95
32.41
34.03
35.06
44.6144.3045.65
45.8945.9245.63
45.6046.3747.1346.1448.4229.6630.0030.1430.9231.0131.7531.9430.6031.8733.5456.3354.3054.5055.2755.9755.8156.4455.0057.4158.46
SRMKS4S2
S2
S 1
S4
S2S3S2
S3S2S3
S4S 1S4S 1S4S2S4S2S3S4S3S2S4S2S2S3S2S3S2S2S3S3S3S3S3
DUR20.019.022.015.013.010.013.016.013.013.025.014.020.018.018.025.018.018.010.018.018.018.018.015.018.015.015.015.015.015.020.015.015.000.000.025.000.000.000.000.015.000.000.0

LOto
O O
oo oo oo oo oo oo oo
LO LO LO LO LO LO LO
oo oo oo oo oo
oo oo
4*
; £t
£t £t £t £t
£t
"O *O ON
ON ON
ON O\
O O ON ON ON ON
Os
Lft
Lft
4^. 4^ LO LO LO
ON t
o L
ft to
4>
oo t
o O
N O
-£
LO
Lft
ON O
N ON
ON
ON
Lft
ON O
N 4*.
y*O L
ft ON to to vo
to ON OO 4^ O L
ft
CO CO CO CO CO CO
4^ 4^ 4^
to 4^
4^
OO
OO
OO
O
oo o
o oo
oo
oo o
o oo
o
o
o
w w
wtr
l *r
t tr
l+
+ +
+4^
H- »
to 4
^
oo oo oo oo oo
oo
LOLO
"8
oooo ooo
o oo
oo
4^ 4^ 4^
4^
45* 4^
to
to to
to to
to
Lft
Lft
Lft
Lft
Lft
Lft
VO vo vo OO OO OO
O O
00 t
OO
N to
to
-^
4 ^
O
ON O
N O
s O
x U
i» »
) »)
O
vO
H-
OO
ON V
*
coco
co
coco
00
00
00
oooooo
w rn
T3 T
3t
+ t
+4
^ »
> 4
^
oo oo oo oo oo
LO LO LO LO LO
Lft
Lft
Lft
Lft
Lft
i_t
»_t
|_t
»_t
»_t
4^ LO LO LO LO
H- O\ O\ L
ft L
ftO
O t
O Q
VO
L
ft i O
O LO
LO
O
O O
O -
O -
-J
-J O
N *
O
N L
ft
tO O
O t
O -
J L
O
COCOCO COCO
4^ 4^ LO LO LO
oo
oo
oLf
t Lf
t Lf
t Lf
t O
OO
OO
OO
T3 T
Jccc
OL
OO
Lft
Lft
OO
LO
LO
LO
4^
. O
N L
ft
SO
O
OO
OO
2H
- »
H- »
L
ft O
O
COCOCO
LO tO tO
LO
4^.
LO
ooo
+
LO+
LO
+
LO
OO OO OO OO OO OO OO
LO LO LO LO LO LO LO
to t
o to
to
to t
o to
LO L
O L
O L
O L
O L
O L
Oto
to
to t
o i-
» i
tO |
_* H
- O
VO
vO
-^4
i -
^4 4
5*. -J
vo
Lft
ON
-O L
O L
O t
O L
ft O
*
to t
o to
to
toIO
tO
Lft
O L
Oto tO
O
O--
4 -
-4-J
Lft
H-
tO L
O
CO CO CO CO CO
4i. L04^ 4^ LO
Lft
4^
CO
LO
OO
OO
OO
O
oo o
o oo
oo
oo o
o oo
OO
OO
OO
O
t""1 5
0
^ ^
» »»
»»
» o
£5
w 4
*
oo o
o oo
oo
LO
LO
LO
LO
OO
OO
oo
oo
oo o
o to
to
to
to
VO V
OV
OV
Oto
to
to t
o to
to
to t
o
oo o
o oo
LO
LO
LO
ooo
oo o
o oo
to
to
toV
O V
O v
oto
to
to
to t
o to
to t
o to
to
to t
o to
tO tO
H
-» J
-* J
-» I
» O
Lft I V
p ^
1 4
^ L
O I
vo
ON
vo
ON
OO
ON
vo
to t
o t
o to
to
to t
o45
k 4^
4^
LO
tO
tO
LO
OO
4^
Lft
VO
-J V
O L
ft
tO L
ft L
ft L
ft V
O -
O t
O
CO
CO
CO
CO
CO
CO
CO
4*
. 4
^ 4
^ 4
^ t
o L
O 4
*.
OO
OO
OO
OO
OO
OO
OO
mT3
22
T3 'f
l 2
± C
+ +
C
4*0
to 4
^0
oo oo oo oo oo oo
LO LO LO LO LO LO
OOOOOO
oo oo oo oo oo oo
to to to to to to
4^. 4^ 4^ 4^ 4^
" to to to to to to
oooooo
-J -
J -o
-J
-J -
J to
to
to t
o to
to
LO O
OL
ft L
ft L
ft
4^ L
O -
O L
ft i O
N
to t
o to
to
to t
o4^
tO
LO
tO
IO
LO
VO
10
10
-J O
N
i L
ft t
O t
O L
O L
O
CO CO CO CO CO CO
4i. 4^
4^ LO 10 4v
to to to
to to to
oooooo
J^ ^3
CO W

>< HQ
QW
co
CO
pp
pp
pp
OO
OO
O
en TJ- «- en Tf
CO
CO
CO
C
OC
O
r-enoo »OCN en
eno
«- ONoo vo
r--oo
»o vo en oo »-« CN O
oo oo oo CN Tfen en wS »o vo vooo oo oo oo oo ooT
t T
t T
t T
t T
t T
too oo oo oo oo oo
88888
en en en en en enO
O O
O O
O O
O 0
0 O
O
<s »-« encu cu cm
ooooooo
CO
CO
CO
CO
CO
CO
CO
OO O OO O
s >O CN CN
vo O «-«vo oo w> en
p*» ^D en en en Tt i*^oo ON ON ON ON ON O
en en en en en en T
t
_sen enO
O 0
0 O
O O
O O
O O
O 0
0
ooooo
oo
oo
o
en en
en co
co co
en o
en «-
»O ON oo «- en «n vo r^vo vo vo vo Tf Tf Tf ri- en en en en -ON ON ON ON ONvo vo
en en en en enoooooo oo oo
ooo
Ooo en
00
ON ON
888
ggg
en en enoooooo
So
o
oooooo
o !- «o
r*ir>»o«- o
oo
oo
CNC
OCNen en
CN
^t
CO
CO
ON en
en «o en en
ON O ^t en vo «o
«- cN cN r- c en
en en en en «o vo en en en en en en o
pp
po
oCN CN CN CN CN CNON ON ON ON ON ONVOen en en en en en oooo oooo oooo
»-i Q »-« en
eu eu eu eu eu
CJ
oooo
oo oo oo oo O
OO
O
Tt1 en en T^ co co co co
ON*-* »T>ONT
f T
t «
- VO
eN eN en en
ON en VOCN ' j en ON «« <tr-4
i-H
«-4
C
N»
-H
»-H
t (
«
t
CN CN CN CN8
S8
SCN CN CN CNVO VO vo vo
O
en en en enoooooo oo
??
§?U
H
OO
OO
OO
ON
oo
OOo
p^fr en 06 cN co co J^ co
co
vo oo
vo voS5 vd» I
» 1
^
H t-H
VO
«S cN
en en en en en en en enO
OO
O
en en en en oooo oooo
UH
oo
o
oooo
ON
ON
O
«~i f-H CNO
OO
O O
O
pp
oCN «N
CN
111
en en enoooo oo
OO
O
co
OO
OO
en Tf en en co co co co
*O *O
Tf ON
ppoo en
r^ 06 r^ 06 en en en en
enen
r^ pvo vo vo r-- en en en enoooo
« * «-^ » »» » CN «N
«N CN
VO vo vo vo
en en en en oooo oooo
?T
-H
T-H
i-H
f -f -f
CU (X O
u (X

72
APPENDIX CPHASE DATA
STAVIFMTSLGDLFAMTSVIFRIBLGDLFAMTSVIFLGDLFAMTSLFAVIFMTSVIFRIBLFALGDLFAMTSVIFLGDMTSVIFRIBLFAFRASVACHCCMLPSTMTSRIBVIFLFASVACHCCMLPSTFAC
PRMKIPU2IPD2IPU1IPD1IPDOIPUOIPDOIP+3IPDOIPDOIPUOIPU1
EPUOEPUOEPUOEPUOIPD1EP+0EPD3IPDO
P+4IPU1IPD1IPU1IPUOEP+1IPD1IPUOIPUOIPU2IPU1IPUOIPD1IPUOIPUOIPU1IPD2IPU1IPU1IPU1IPUOIPUOEP+4
TIME P-SEC830906213317.63830906213317.78830906213318.15830906213318.20830906214047.55830906214047.60830906214047.65830906214047.67830906214047.95830906215804.35830906215804.45830906215804.71830906215804.75830906220022.05830906220022.75830906220023.25830906220422.80830906220423.25830906220423.53830906220423.55830906220423.66830906224519.50830906224519.55830906224519.62830906224519.93830906231052.30830906231052.80830906231052.85830906231053.30830906231053.45830906231053.85830906231054.01830906231054.10x830906231054.25830907055517.15830907055517.25830907055517.30830907055517.60830907055518.20830907055518.48830907055518.55830907055518.77830907055520.00
S-SEC
19.30
48.7548.7548.6547.8449.00
5.89
23.5024.5924.7024.7524.67
21.01
54.3554.2054.0055.4557.5055.16
55.9822.0018.7018.75
20.5020.3920.7520.73
SRMK
S3
S3S3S3S3S3
S 1
S3S4S2S3S4
S2
S3S3S4S4S4S2
S2S4S3S3
S4S3S2S 1
DUR15.015.015.017.025.020.015.015.021.016.017.012.017.012.0
10.015.015.010.018.011.010.013.08.0
10.037.035.033.041.028.029.018.025.020.047.040.042.055.037.041.040.042.018.0

73
APPENDIX CPHASE DATA
STAMTSVIFLFARIB
RIBMTSVIFLFASVAEPECHCPST
CHCFACLFACMLRIBMTSFRAVIF
EPECRACHCPST
FRAMTSRIBVIFSVALFASVAFRAVIFMTSADBRIBLFACMLFAC
PRMKIPDOIPUO
EPD1EP+4
IPUOIPUOIPUOIPDOEP_3IPUOIPUOIP-0
EP+4EP+3IPUOEP+3EP+0IPUOEP+4IPD4IPU1IPD1IP+1P+l
IPUOIPUOIPDOIPDOIPDOIPDOIP+0IP+3IPUOIP+3IP-3IP+0IP-3
IPUOIP-3
TIME P-SEC830907060613.75830907060613.80830907060614.23830907060614.95830907063546.40830907063546.60830907063546.65830907063546.95830907063548.25830912031533.93830912031534.19830912031534.77830912171641.46830912171641.64830912171641.97830912171642.04830912171642.38830912171642.80830912171644.43830912171644.56830914050758.04830914050758.16830914050758.69830914050759.06830930074236.33830930074236.34830930074236.35830930074236.60830930074236.61830930074236.73831001000746.81831001000747.13831001000748.10831001000748.19831001000748.30831001000748.42831001000748.94831001000749.33831001000750.45
S-SEC15.1015.2515.5015.6348.1548.5048.1048.7550.2535.4635.9637.0044.3944.63
45.5246.85
47.1459.2359.2960.3560.8437.9437.9037.2237.8037.88
55.0355.9256.8756.8257.3057.6158.8959.7659.82
SRMKS4S4S4SOS4S4S3S4S3S2S 1S2S3S3
S4S3
S3S3S3S3S3S4S4S2S4S4
S2S2S3S3S3S2S3S2S3
DUR15.020.015.012.025.025.022.027.025.010.012.013.020.020.020.020.020.020.020.020.012.012.012.015.012.012.012.012.012.012.020.020.020.020.035.020.020.020.020.0

74
APPENDIX CPHASE DATA
STAIFRAADBSVAVIFMTSLFACMLPVNRIBFACFACPVNCMLRIBLFAMTSADBVIFSVAFRASVAADBVIFMTSRIBLFAPVNCMLFAC
PRMKP+4
IPU3IPD2IPD2IPUOIPUO
P-2IP-3
IPU4P+4
PDOP+3PDOPDOPDOPDOP+3P-l
PDOPUOPUOIP+3PUOPUOPUOPUOP+3PUOPU1
TIME P-SEC831002054336.33831002054336.50831002054336.67831002054336.71831002054337.18831002054337.29831002054337.43831002054337.59831002054337.63831002054338.20831002215709.77831002215710.70831002215710.77831002215711.32831002215711.43831002215711.80831002215711.90831002215712.24831002215712.81831009042111.55831009042111.79831009042112.40831009042112.44831009042112.82831009042112.95831009042113.16831009042113.20831009042113.56831009042114.73
S-SEC47.6848.4047.9048.9049.3049.3549.4049.6049.66
23.7025.0024.9525.5025.6125.9826.0826.4226.9917.09
18.8518.9319.6819.9218.8419.9721.0422.30
SRMKS4S4S4S4S4S4S4S4S4
S3S3S3S3S3S3S3S3S 3S4
S4S2S2S4S4S3S3S2
DUR20.040.020.020.020.020.020.030.020.020.018.030.018.018.018.018.042.018.018.0
22.022.090.022.022.022.022.055.022.022.0


