CVUSD School Waste AuditsOctober 2012

Presentation Summary
Background on CVUSD Recycles
The Waste Audit Process
So What?
Next Steps
Waste Audit Results

• State grant awarded to the City of Thousand Oaks ‐ $200k+
• Primary focus: beverage containers eligible for the California Redemption Value (CRV)
• Provide recycling infrastructure – containers, carts, storage, pickers, etc.
• Outreach & education – school visits, signs, information, waste audits
• Part‐time Recycling Coordinator
• Monitor recycling activity and report recycling rates
Background on CVUSD Recycles

RECYCLABLES
• Cardboard
• Paper
• CRV Plastic Bottles
• CRV Metal Cans
• CRV Glass Bottles
• Other Recyclables
• Compostables
• Unused/Unopened Food
• Other (e.g., e‐waste, toner cartridges and other things that shouldn’t be put in the trash or recycling)
• Trash
NON‐RECYCLABLES*
The Waste Audit Process• One day’s worth (24 hrs.) of waste and recycling• Sort into different categories:
Composting is not yet available in our area on a commercial
scale, but we hope it will be some day!
* In auditing materials set aside for recycling, non‐recyclable materials were not differentiated into these categories – it was all simply considered “contamination.”

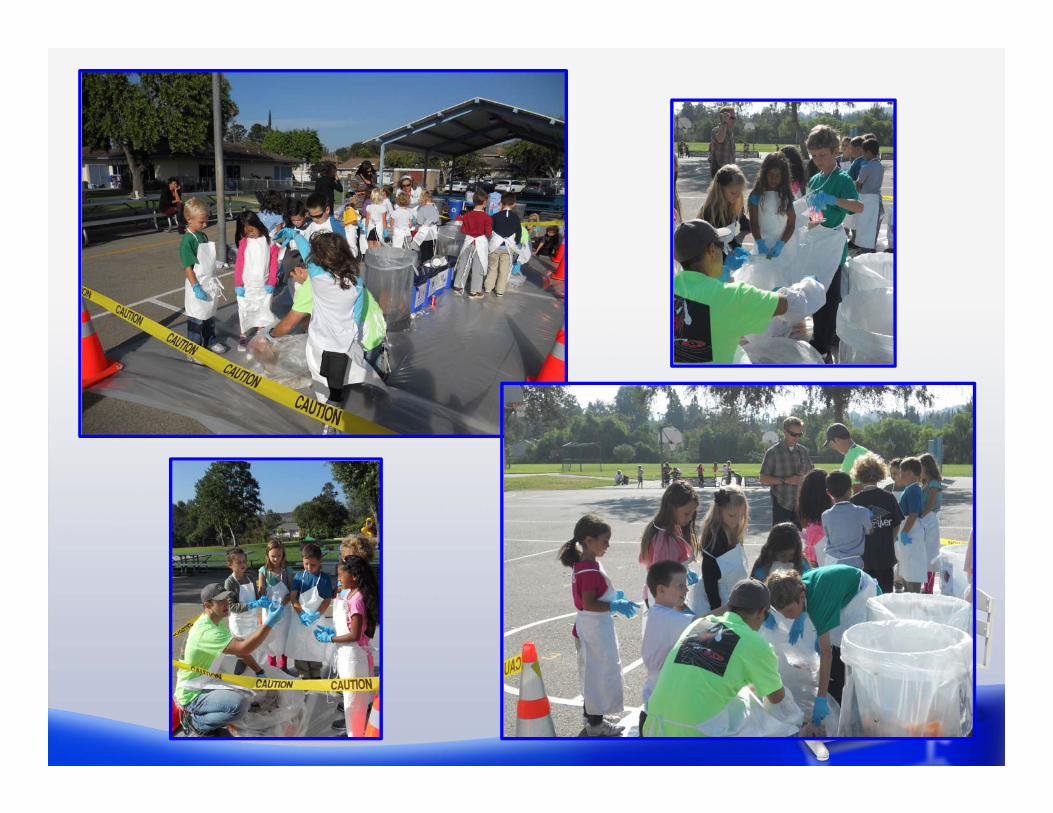


• Weigh and record each category
• Compile results:• % each category
• % recyclables in trash
• % trash in recycling
• current diversion rate
• potential diversion rate
• CRV recovery rate
• estimated amount of CRV needed to meet 80% recovery goal
The Waste Audit Process (cont.)

More On Our Categories
Category What it Includes What it Doesn’t How Come?
Paper White paperColored paperNewspaperPaperboard Books
Waxed paperMilk & juice cartonsTissue paperPaper towels
It’s very hard to separate wax, plastic and other coatings from paper; these are technically recyclable, but not through our service provider.The fibers in tissue paper and paper towels are simply too short to recycle.
Other Recyclables
Non‐CRV plastic containersOther hard plasticsMetal cansClean tin foil
Plastic bags & filmJuice pouchesChip bags
Plastic bags are technically recyclable, but very rarelyand not through our service provider. Juice pouches and chip bags are simply not recyclable, although in some instances they can be repurposedthrough companies like Terracyle.
CompostableMaterials
All food, including meats, bread, dairy, etc.Food‐soiled paper
Wax‐coated paper We sorted for a commercial composting stream – one that can handle any food, as well as food‐soiled paper.
Unused/Uneaten Food
Whole sandwichesUnopened chips, bars & pre‐packaged mealsWhole, undamaged fruit
Anything that’s been opened or bitten into
We wanted to see if there are particular food items kids aren’t eating so parents and the District’s Nutritional Services could take this into consideration.
Why’d they do it that way?

RESULTS

Make‐up of the trash stream, particularly the top four categories, was fairly consistent between all of the schools.
With the exception of one school, compostable material made up the majority, comprising between 43.6% and 68% of the trash stream.*
Trash was the next highest category, making up between 15.3% and 38.9% of the waste stream.
Next was either paper or unused/unopened food.
Composite “Trash” Stream Composition
* At TOHS, trash comprised a slightly higher percent (38.9%) than compostables (35.0%).
Cardboard1.3%
Paper8.7%
CRV Plastic Bottles1.2%
CRV Glass Bottles0.2%
CRV Metal Cans0.2%
Other Recyclables3.2%
Compostables52.4%
Unused/Unopened Food10.4%
Trash21.6%
Other0.8%
Not including materials set aside for recycling
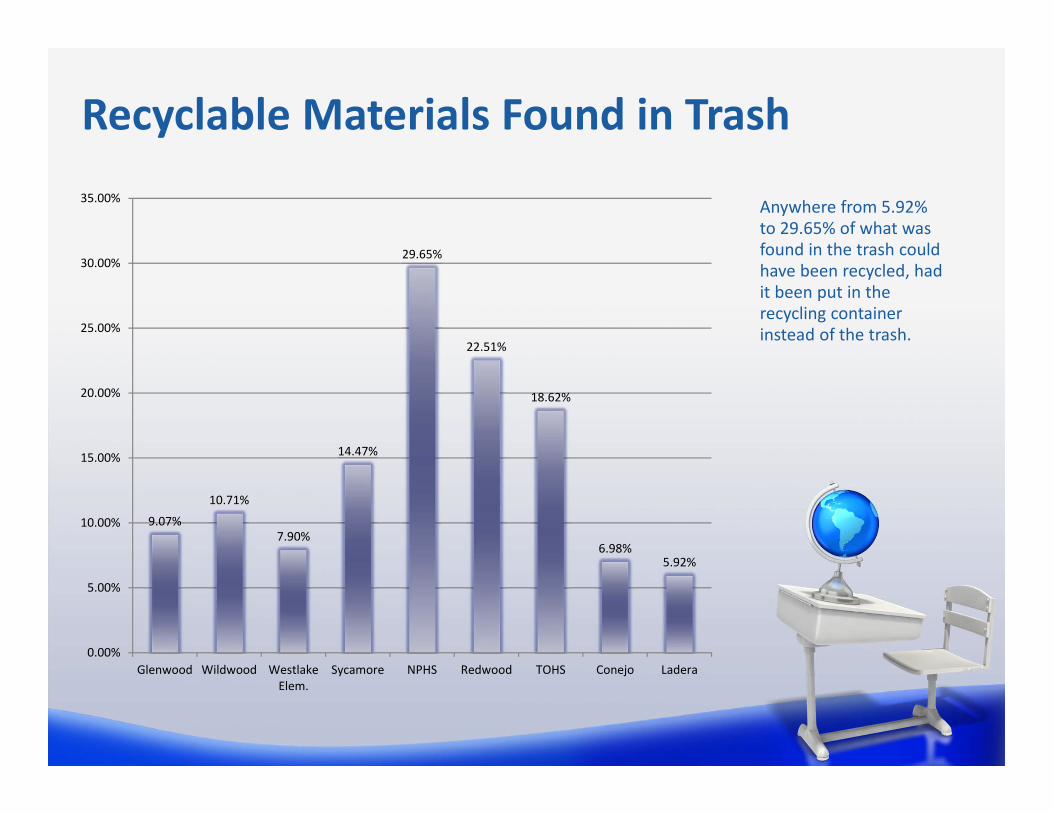
Anywhere from 5.92% to 29.65% of what was found in the trash could have been recycled, had it been put in the recycling container instead of the trash.
Recyclable Materials Found in Trash
9.07%
10.71%
7.90%
14.47%
29.65%
22.51%
18.62%
6.98%5.92%
0.00%
5.00%
10.00%
15.00%
20.00%
25.00%
30.00%
35.00%
Glenwood Wildwood WestlakeElem.
Sycamore NPHS Redwood TOHS Conejo Ladera
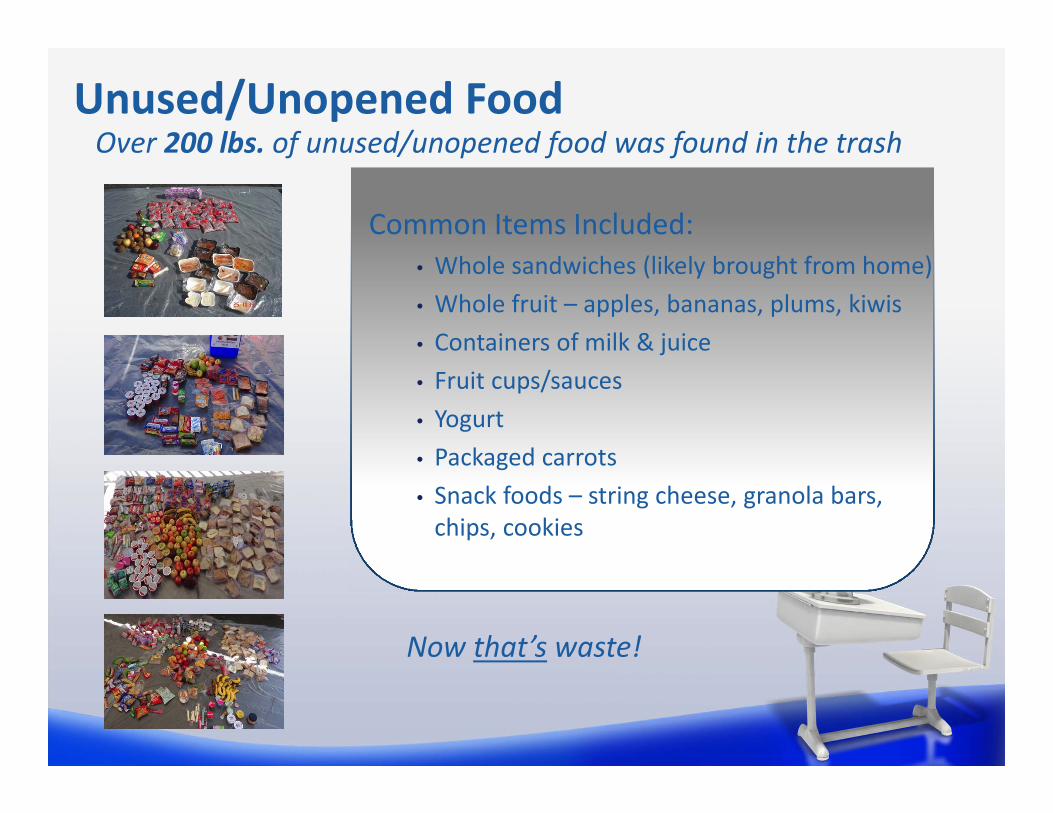
Common Items Included:• Whole sandwiches (likely brought from home)• Whole fruit – apples, bananas, plums, kiwis• Containers of milk & juice• Fruit cups/sauces• Yogurt• Packaged carrots• Snack foods – string cheese, granola bars, chips, cookies
Now that’s waste!
Unused/Unopened FoodOver 200 lbs. of unused/unopened food was found in the trash

Make‐up of the recycling stream was highly variable between the different schools, particularly with respect to contamination levels.
Contamination was highest at schools that place all waste from certain areas in the recycling container, versus having separate recycling containers.
Some contamination in the recycling stream is OK; excessive contamination may render the whole load unrecyclable.
Trash (Contamination) in the “Recycling” Stream
0.47%
5.18%
68.32%
5.07%
80.89%
25.00%
64.32%
4.02%5.80%
0.00%
10.00%
20.00%
30.00%
40.00%
50.00%
60.00%
70.00%
80.00%
90.00%
Glenwood Wildwood WestlakeElem.
Sycamore NPHS Redwood TOHS Conejo Ladera

Is this good?
Any diversion is good! To give you an idea of where we stack up:
• Presidential Executive Order 13514 sets a goal of 50% diversion for Federal agencies by 2015.
• The State of California has a statewide goal of 75% diversion by 2020.
Current Diversion Rates% not going to landfill
7.71%
35.61%
11.58%
18.66%
10.03%
7.53%
13.30%
25.76%
28.72%
0.00%
5.00%
10.00%
15.00%
20.00%
25.00%
30.00%
35.00%
40.00%
Glenwood Wildwood WestlakeElem.
Sycamore NPHS Redwood TOHS Conejo Ladera
Average: 17.65%

Some schools could increase their diversion rate significantly by recycling more. However, in most cases it will be impossible to achieve greater than 30‐40% diversion without the addition of composting.
Potential Diversion RatesIf all recyclables found in the trash had been recycled…
Average: 27.31%(10% higher than the current rate)
16%
42%
17%
30%
24%
28%
25%
31%
33%
0.00%
5.00%
10.00%
15.00%
20.00%
25.00%
30.00%
35.00%
40.00%
45.00%
Glenwood Wildwood WestlakeElem.
Sycamore NPHS Redwood TOHS Conejo Ladera

SO WHAT?

The CVUSDRecyclesProgram has a goal of recovering an average of 80% of CRV materials generated at schools!
Current average: 48.67%
We’re over half way there!
CRV Recovery Rates% of CRV materials currently being recycled
0%
82%
61%
37%
83%
13%
9%
64%
89%
0.00%
10.00%
20.00%
30.00%
40.00%
50.00%
60.00%
70.00%
80.00%
90.00%
100.00%
Glenwood Wildwood WestlakeElem.
Sycamore NPHS Redwood TOHS Conejo Ladera

This represents the total earning potential if all CRV items generated at the schools were to be redeemed.
Nine School Total: $22,696
Value of CRV Materials in Trash and RecyclingOver the Course of a 180‐Day School YearPlastic Bottles & Metals Cans Only (no glass)
$309
$1,451$1,590
$3,598
$5,299
$4,365
$4,923
$702$459
$0
$1,000
$2,000
$3,000
$4,000
$5,000
$6,000
Glenwood Wildwood WestlakeElem.
Sycamore NPHS Redwood TOHS Conejo Ladera
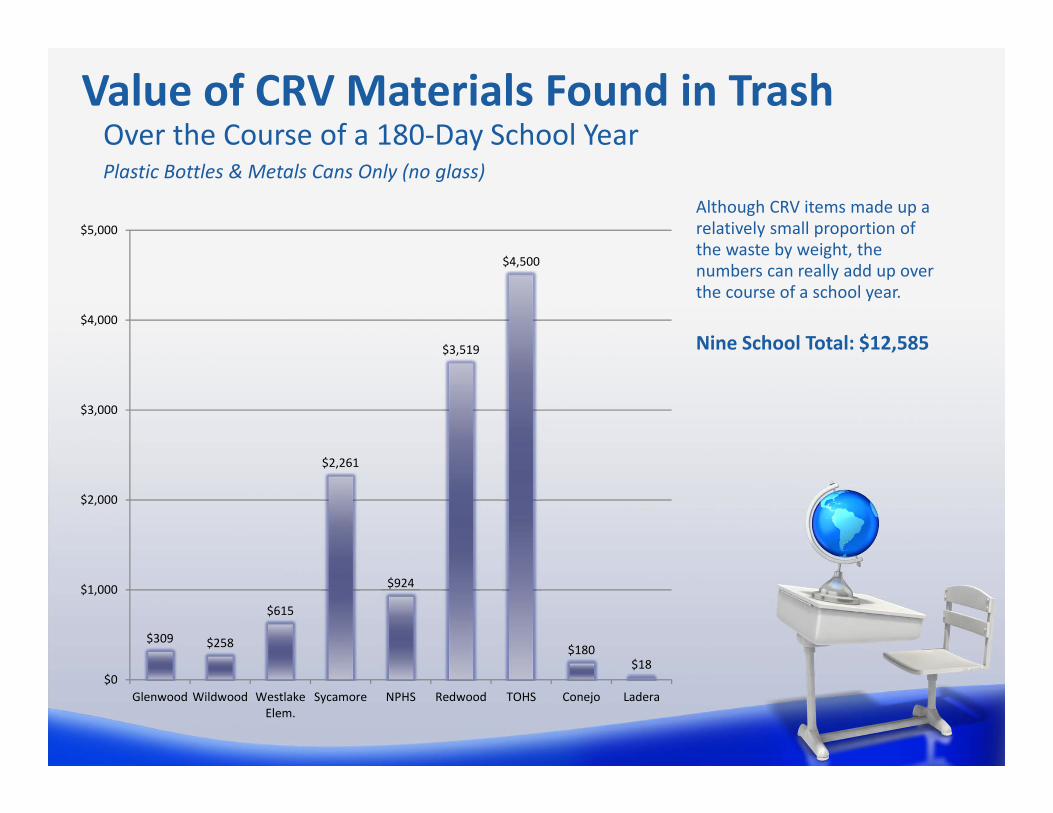
Although CRV items made up a relatively small proportion of the waste by weight, the numbers can really add up over the course of a school year.
Nine School Total: $12,585
Value of CRV Materials Found in TrashOver the Course of a 180‐Day School YearPlastic Bottles & Metals Cans Only (no glass)
$309 $258
$615
$2,261
$924
$3,519
$4,500
$180$18
$0
$1,000
$2,000
$3,000
$4,000
$5,000
Glenwood Wildwood WestlakeElem.
Sycamore NPHS Redwood TOHS Conejo Ladera

NEXT STEPS

• Continue with outreach efforts
• Help schools take their programs to the next step
• Request data from schools
• Compile results on an ongoing basis
• Competitions, events and more!
Check out www.CVUSDRecycles.org to stay up to date!
Next Steps