SATS and Life Cycle Cost Research, 1999-2004
Robert N. McGrath, Ph.D.Embry-Riddle Aeronautical
UniversityDaytona Beach, Florida
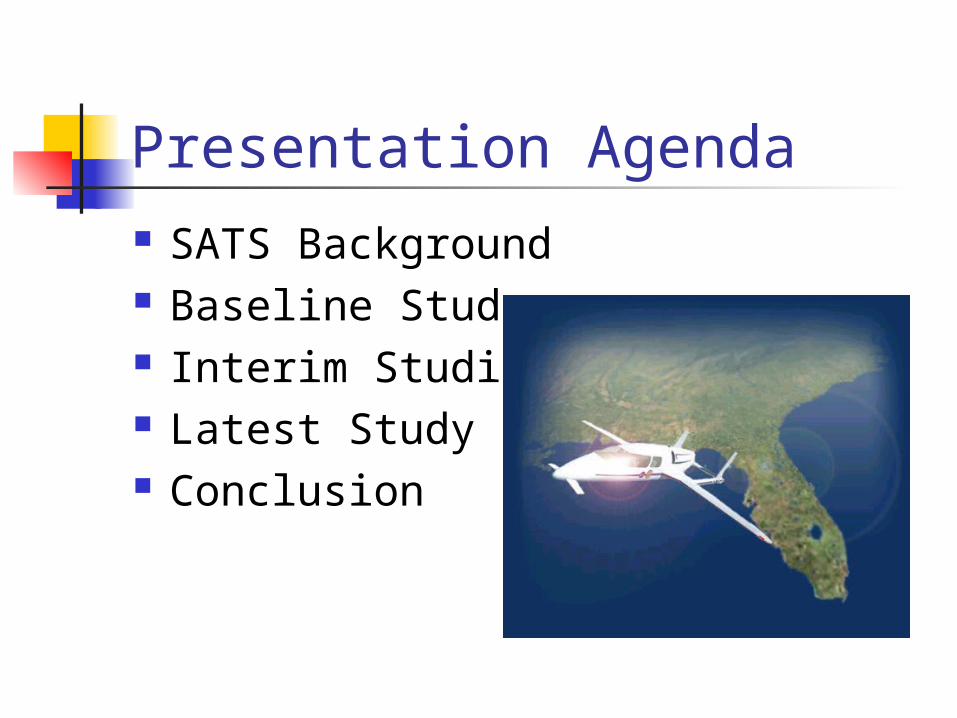
Presentation Agenda SATS Background Baseline Study Interim Studies Latest Study Conclusion
NASA’s Premise
“One of the most significant emergent forces in the first decade of the 21st century will be the value of human time … human/intellectual capital [will replace] physical capital as the basis for the creation of wealth.”
NASA (continued)
“… significant advancement in doorstop-to-destination speed … is possible, if the challenges can be met for making small aircraft and airports more available to the traveling public … enabling technologies include a new generation of engines, avionics, airframe, navigation, communication and operator training.”
SATS
Small Airplane Transportation System Airplane-based personal transportation Ultimate vision: substitute for autos Near term: industrial / govt. niches NASA+industry+academia+public sector
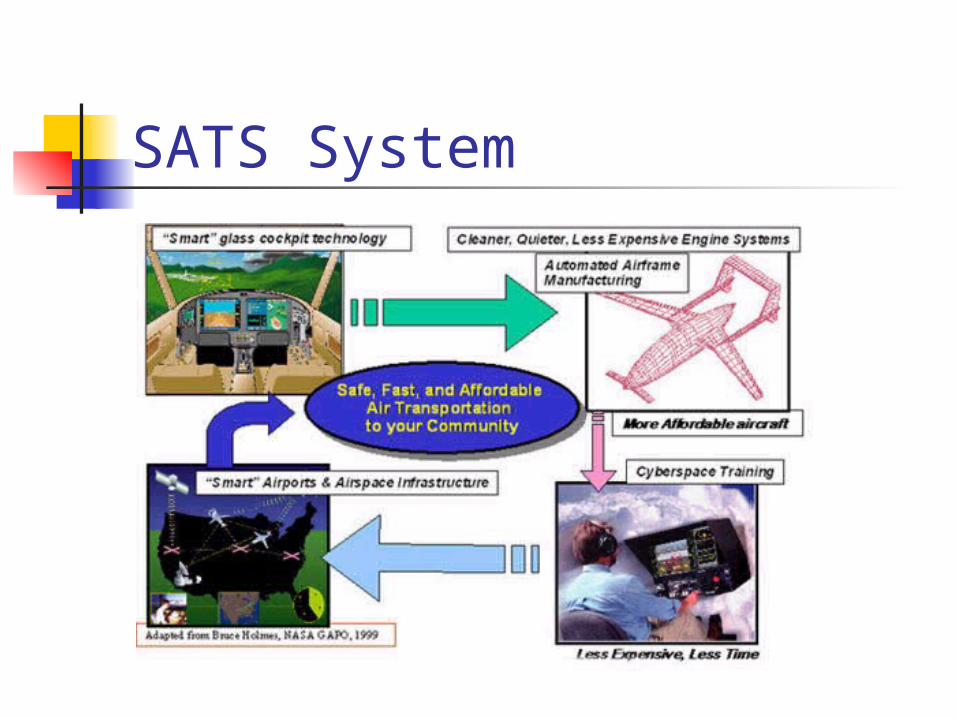
SATS System
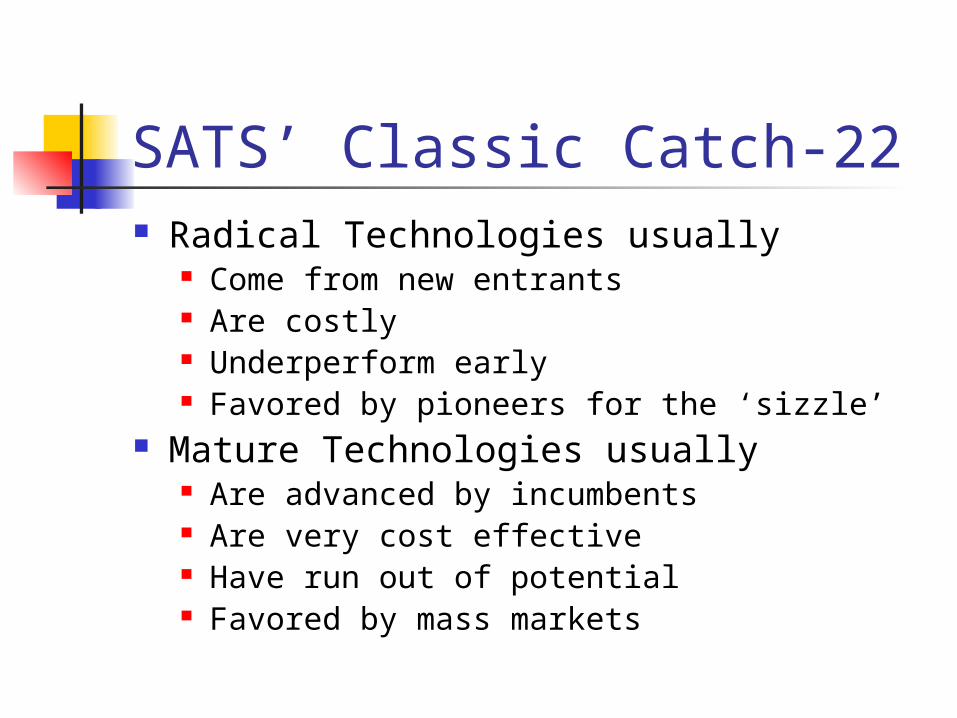
SATS’ Classic Catch-22 Radical Technologies usually
Come from new entrants Are costly Underperform early Favored by pioneers for the ‘sizzle’
Mature Technologies usually Are advanced by incumbents Are very cost effective Have run out of potential Favored by mass markets
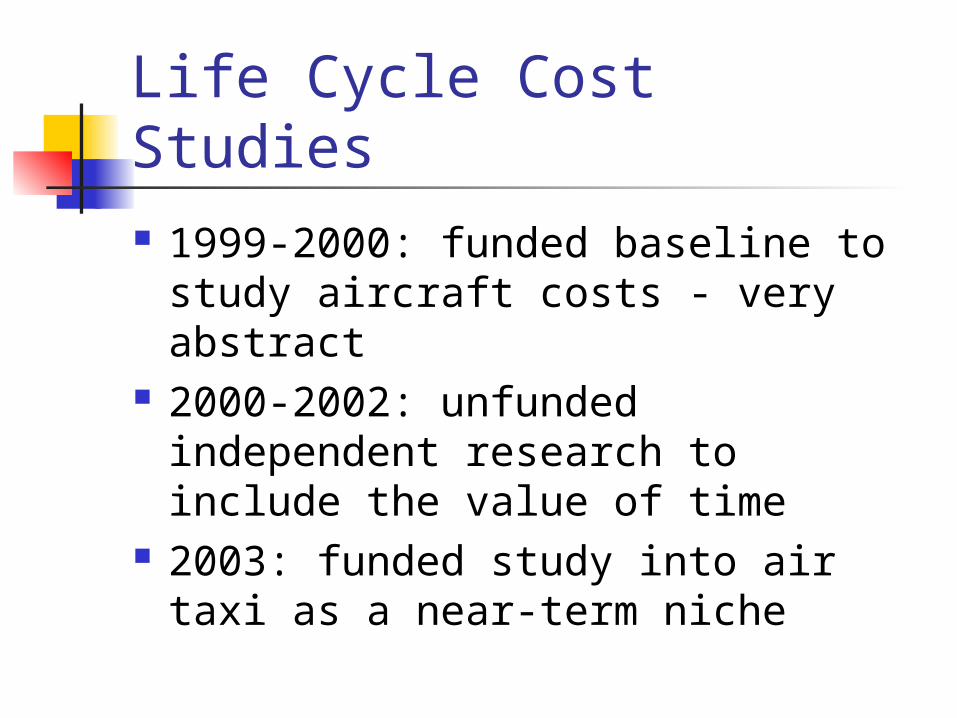
Life Cycle Cost Studies 1999-2000: funded baseline to
study aircraft costs - very abstract 2000-2002: unfunded independent
research to include the value of time
2003: funded study into air taxi as a near-term niche
Baseline Study (1999-2000)
Seven configurations of technology, method of ownership and operation
About 75 independent variables CER’s mostly extrapolations NASA’s vision feasible … given theoretical constraints
about pricing, production strategies
Baseline Conclusions Impressive gains in total cost of
ownership But mass-market not in the near-
term future Keys
Aircraft prices Fuel and maintenance Business and operational assumptions
Interim Independent Studies
… what about ‘time?’ Used the original model as baseline Modified to include value of time
and compare SATS Bizjets to executive travel on airlines
Modified to include value of time and compare autos and SATS Bizjets
What is the Value of Time?
Extant research nonexistent Employee time assumed in Bizjets Aircraft modeled in Travel$ense Samples of city pairs capturing
likely trip ranges Various levels of cost
Interim Conclusions Without considering the value of
time SATS often appeared competitive in
some costs When considering the value of
time SATS often appeared superior in
many costs by wide margins
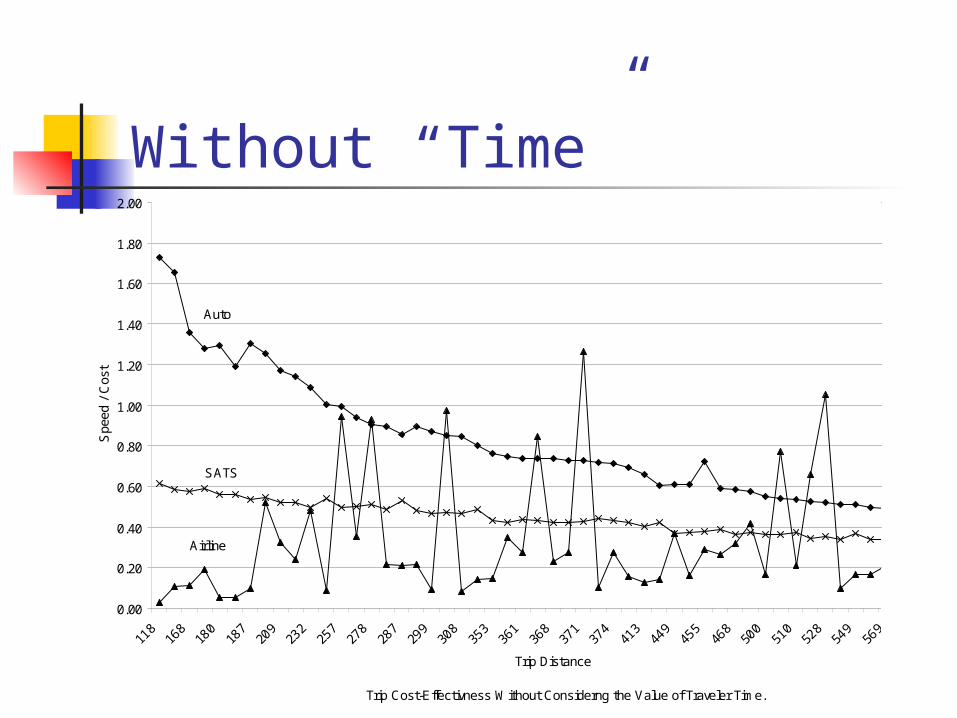
Without “Time”
Trip Cost-Effectivness Without Considerng the Value of Traveler Time.
0.00
0.20
0.40
0.60
0.80
1.00
1.20
1.40
1.60
1.80
2.00
118
168
180
187
209
232
257
278
287
299
308
353
361
368
371
374
413
449
455
468
500
510
528
549
569
Trip Distance
Spe
ed /
Cos
t
Auto
SATS
Airline
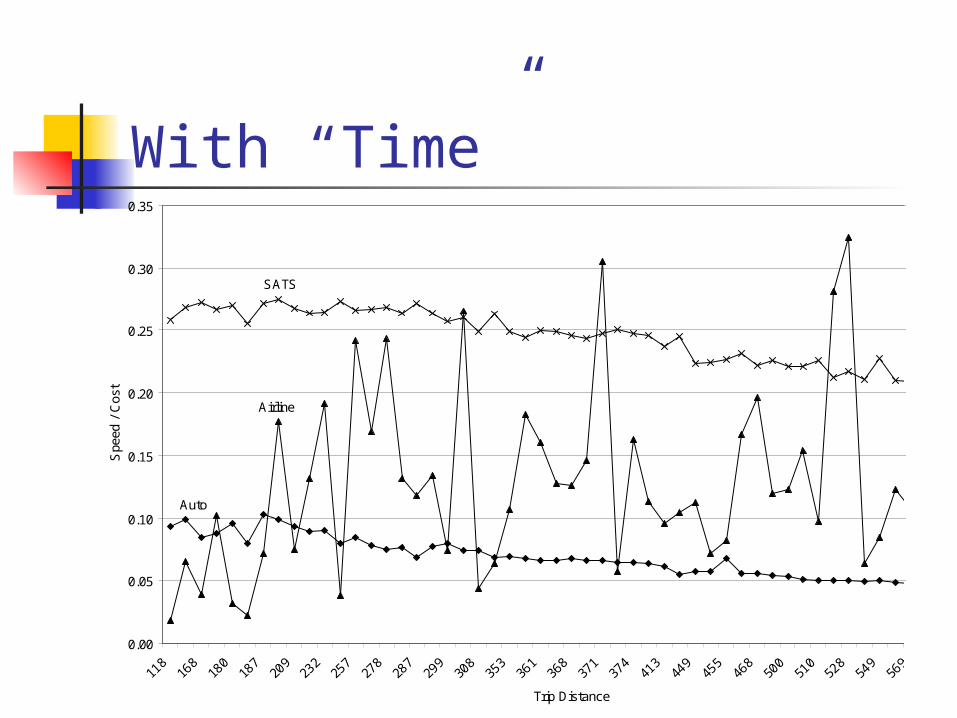
With “Time”
Trip Cost-Effectiveness Considering the Value of Traveler Time.
0.00
0.05
0.10
0.15
0.20
0.25
0.30
0.35
118
168
180
187
209
232
257
278
287
299
308
353
361
368
371
374
413
449
455
468
500
510
528
549
569
Trip Distance
Spe
ed /
Cos
t
SATS
Airline
Auto
The 2003 Study
One of several “business case” studies Not macro/market/economic … … Focused on an air taxi business Compared an entrepreneur’s choice of
Beech Bonanza 33 (4 seats) Beech King Air 200 (8 seats) Eclipse 500 (6 seats)
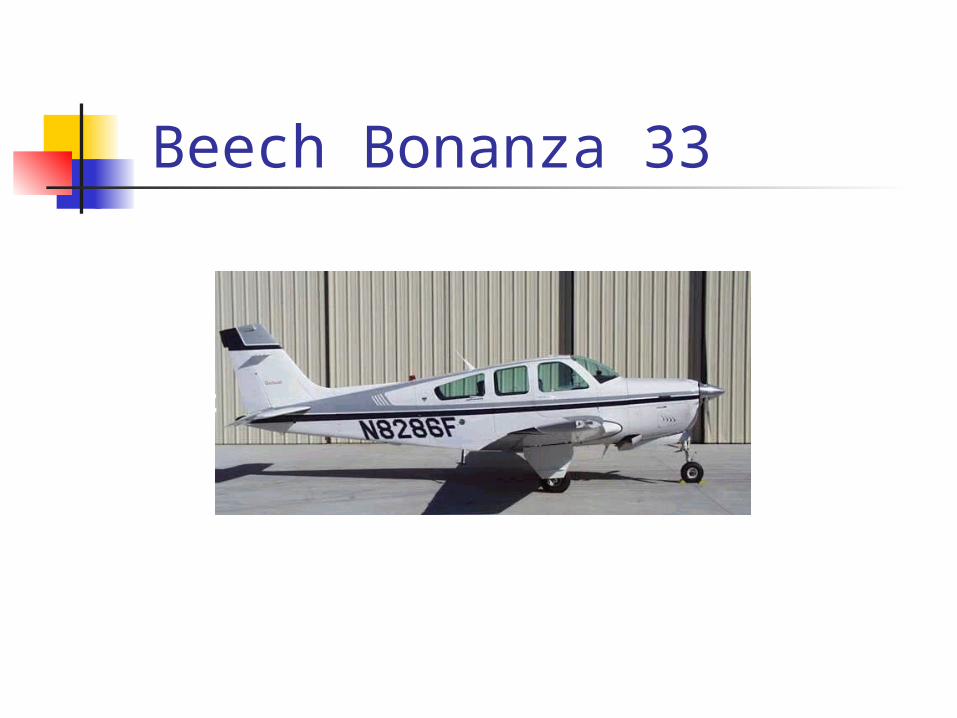
Beech Bonanza 33Eclipse
Bonanza
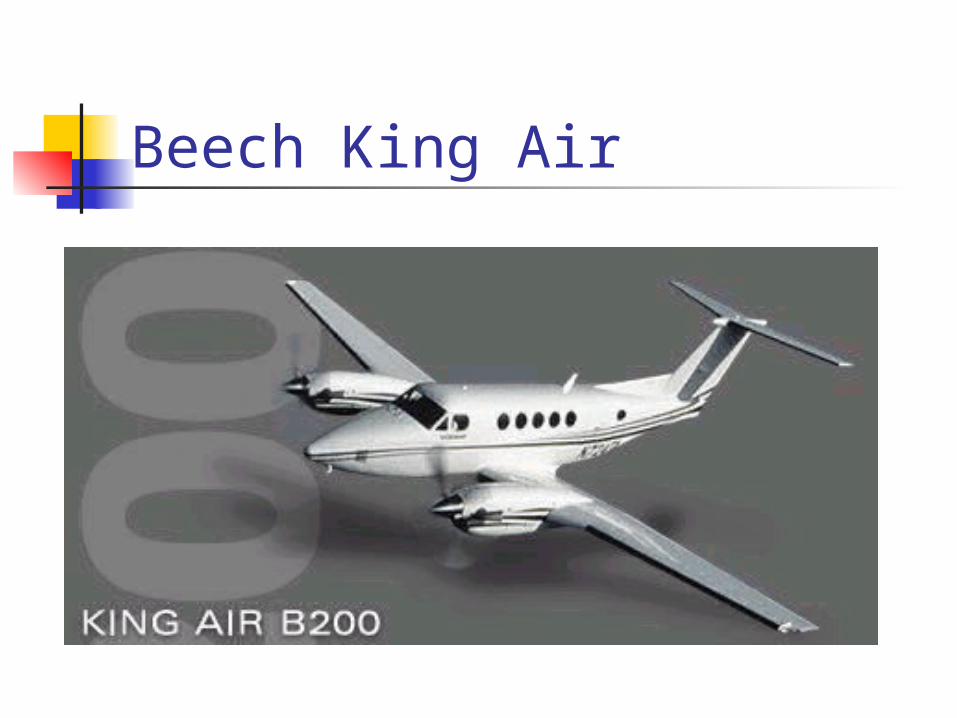
Beech King Air
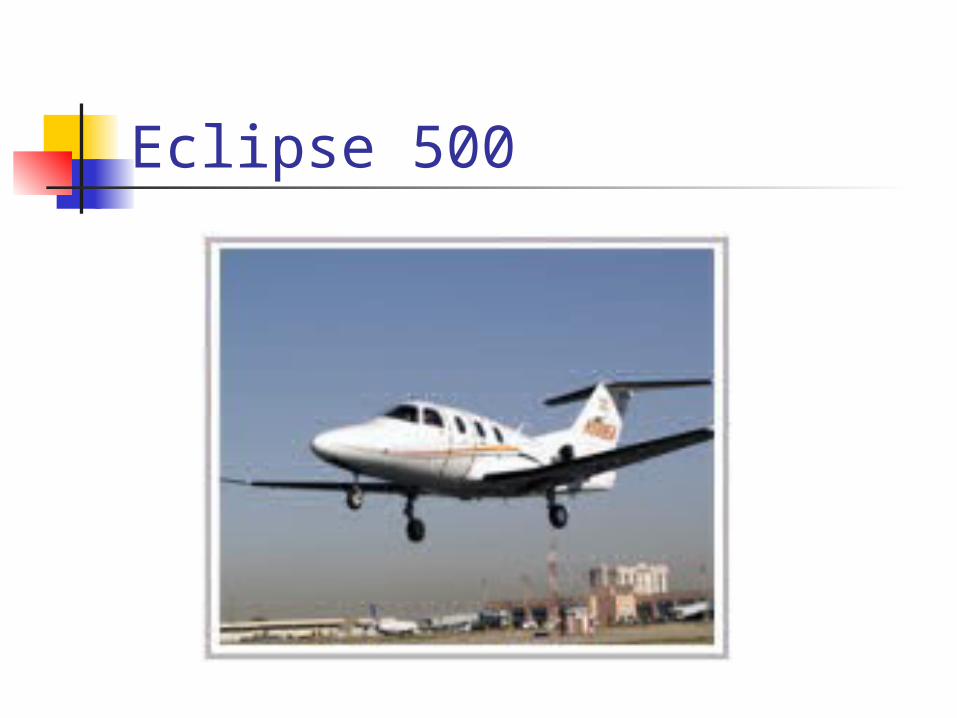
Eclipse 500
The 2003 Study (continued)
Hypothetical Air Taxi Enterprise Today’s “rules of the game” Minimal “SATS” infrastructure Two strategic objectives
Low overhead / organizational infrastructure Operating capacity large enough to exploit
possible economies of scale … 10 a/c, 6 flights/day, 10 year life cycle
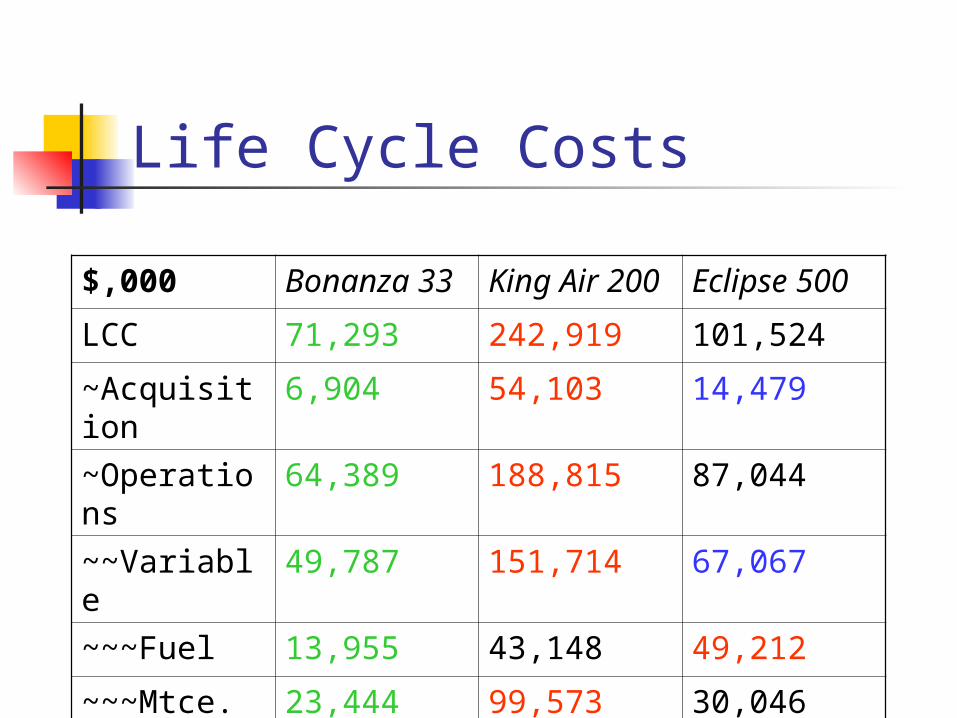
Life Cycle Costs
$,000 Bonanza 33
King Air 200
Eclipse 500
LCC 71,293 242,919 101,524
~Acquisition
6,904 54,103 14,479
~Operations
64,389 188,815 87,044
~~Variable
49,787 151,714 67,067
~~~Fuel 13,955 43,148 49,212
~~~Mtce. 23,444 99,573 30,046
Cost-Effectiveness Analysis
Three measures Cost per Mile Cost per Seat Mile Cost per Hour
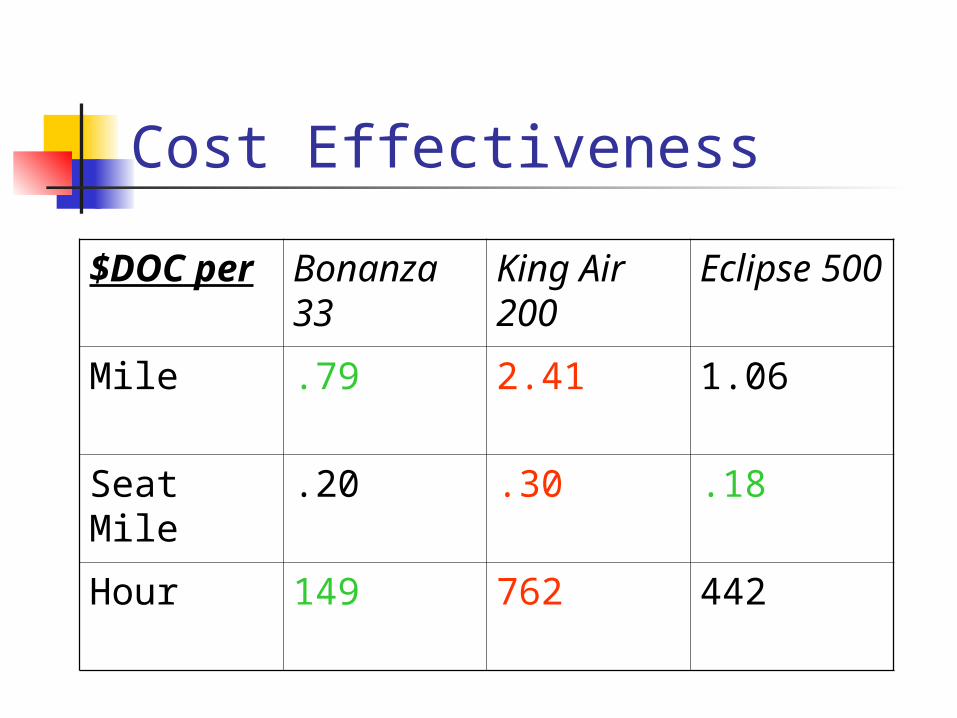
Cost Effectiveness
$DOC per
Bonanza 33
King Air 200
Eclipse 500
Mile .79 2.41 1.06
Seat Mile .20 .30 .18
Hour 149 762 442
Cost Effectiveness (continued)
Load factors affect business viability of a/c
In the enterprise, the market was assumed constant …
… i.e., regardless of a/c chosen, the same # of passengers would board
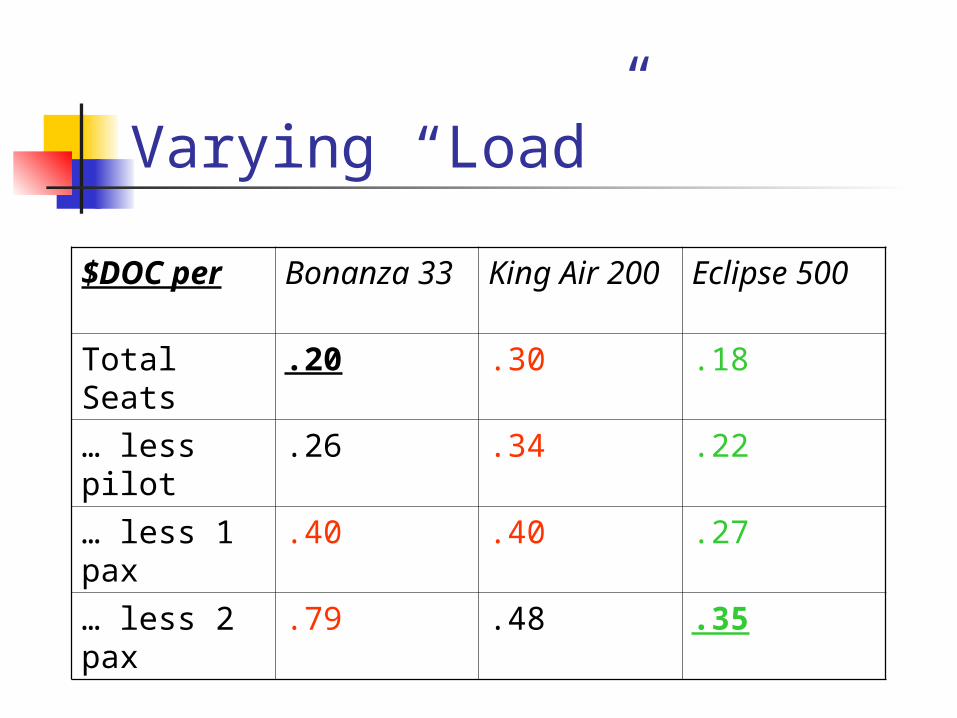
Varying “Load”
$DOC per Bonanza 33
King Air 200
Eclipse 500
Total Seats .20 .30 .18
… less pilot .26 .34 .22
… less 1 pax
.40 .40 .27
… less 2 pax
.79 .48 .35
Load Factor C-E Summary
Extraordinary degradation as passengers removed
The fewer the total seats, the greater the effect
Eclipse emerged as the best, Bonanza and King Air became comparable
Many “mental experiments” can change conclusions
Sensitivity Analysis
Above pointed to uncertainty/risk in: price fuel maintenance capacity utilization (or scale
economy)
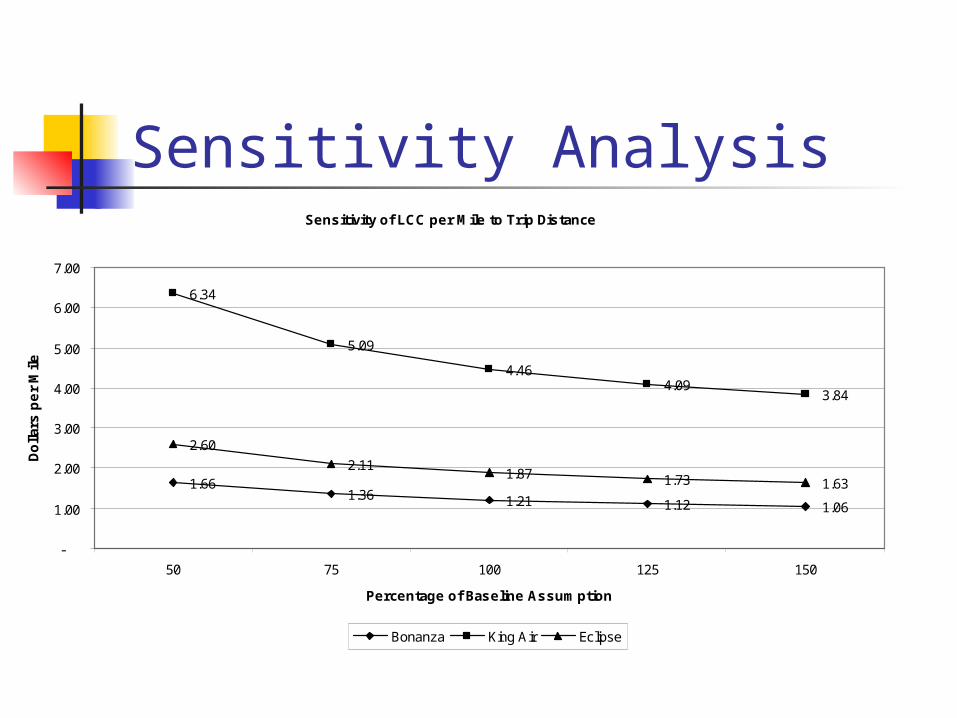
Sensitivity AnalysisSensitivity of LCC per Mile to Trip Distance
1.661.36 1.21 1.12 1.06
6.34
5.09
4.464.09
3.84
2.60
2.111.87 1.73 1.63
-
1.00
2.00
3.00
4.00
5.00
6.00
7.00
50 75 100 125 150
Percentage of Baseline Assumption
Do
llars
pe
r M
ile
Bonanza King Air Eclipse
Air Taxi and SATS
Technology must be aligned with capacity must be aligned with market share
Business innovations (models) are needed as well as technological and marketing innovation
Conclusion
Markets, technologies, etc. will show dynamic and recursive cause and effect
SATS is proceeding in ways that business theory explains well …
Models of technology / industry cycles are robust


