
Saotharlann Náisiúnta Tagartha
Viris UCDUCD National Virus Reference
Laboratory
Dr. Jeff Connell
Assistant Director
National Virus Reference Laboratory.
National Epidemiology ProfileNational Epidemiology ProfileNational Epidemiology ProfileNational Epidemiology Profile
Presentation
• Background
• Needle-stick investigations performed at the NVRL
• National Epidemiological Data for HIV, HBV and HCV infection
• What information is available• Limitations of the data
National Epidemiology ProfileNational Epidemiology ProfileNational Epidemiology ProfileNational Epidemiology Profile

• Risk of transmission is probably directly related to the concentration of the virus (viral load) in the blood of the source patient at the time of exposure
Risk of blood-borne virus (BBB) transmissionRisk of blood-borne virus (BBB) transmissionRisk of blood-borne virus (BBB) transmissionRisk of blood-borne virus (BBB) transmission

Risk of transmission of a BBV to HCW from infected patient following a single open-bore needle-stick injury is;
• 20-30 % - HB eAg POSITIVE• 3% for anti-HCV positive source• 0.3% for anti-HIV positive source
Risk of blood-borne virus (BBB) transmissionRisk of blood-borne virus (BBB) transmissionRisk of blood-borne virus (BBB) transmissionRisk of blood-borne virus (BBB) transmission

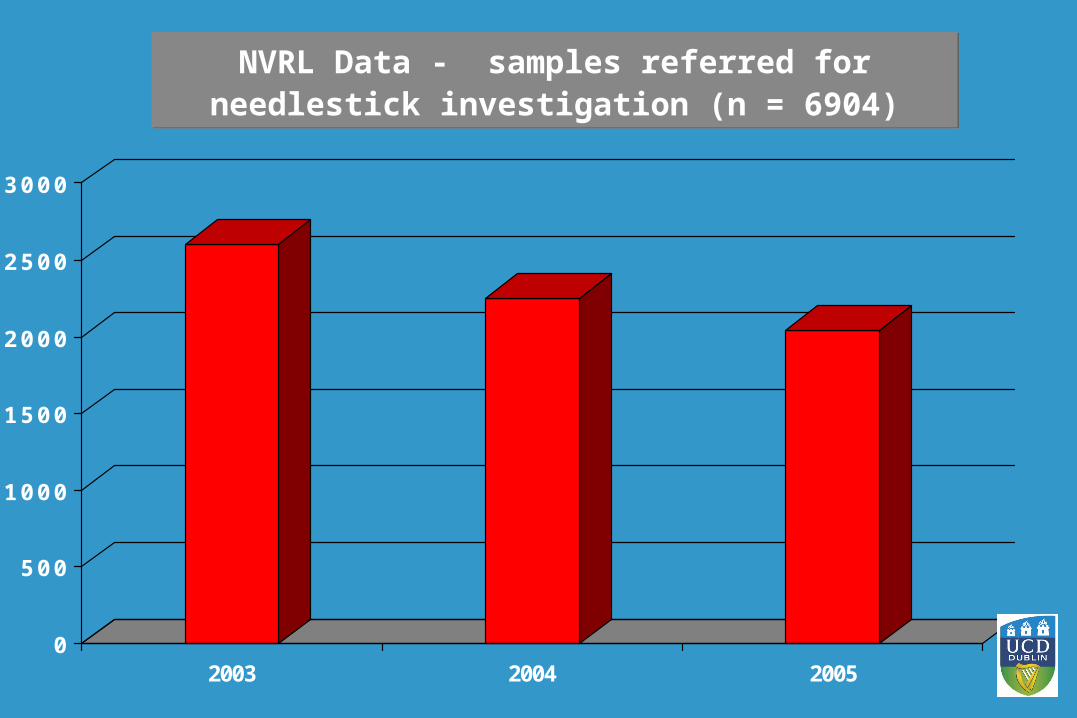
NVRL needle-stick investigationsNVRL needle-stick investigations
Crude data – includes
• Source investigations• Recipient investigations
0
500
1000
1500
2000
2500
3000
2003 2004 2005
NVRL Data - samples referred for needlestick investigation (n = 6904)NVRL Data - samples referred for
needlestick investigation (n = 6904)
0
2
4
6
8
10
12
Perc
enta
ge
1 2 3 4 5 6 7 8 9 10
Hospital ID
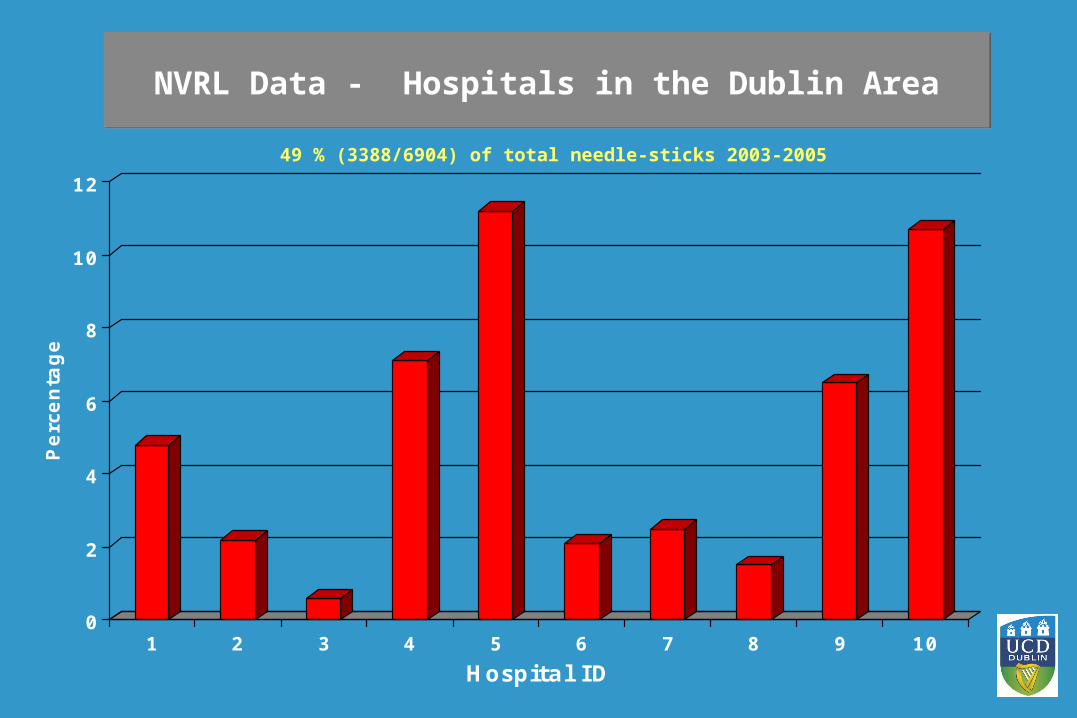
NVRL Data - Hospitals in the Dublin AreaNVRL Data - Hospitals in the Dublin Area
49 % (3388/6904) of total needle-sticks 2003-2005
HIV infectionHIV infection

HIV HIV
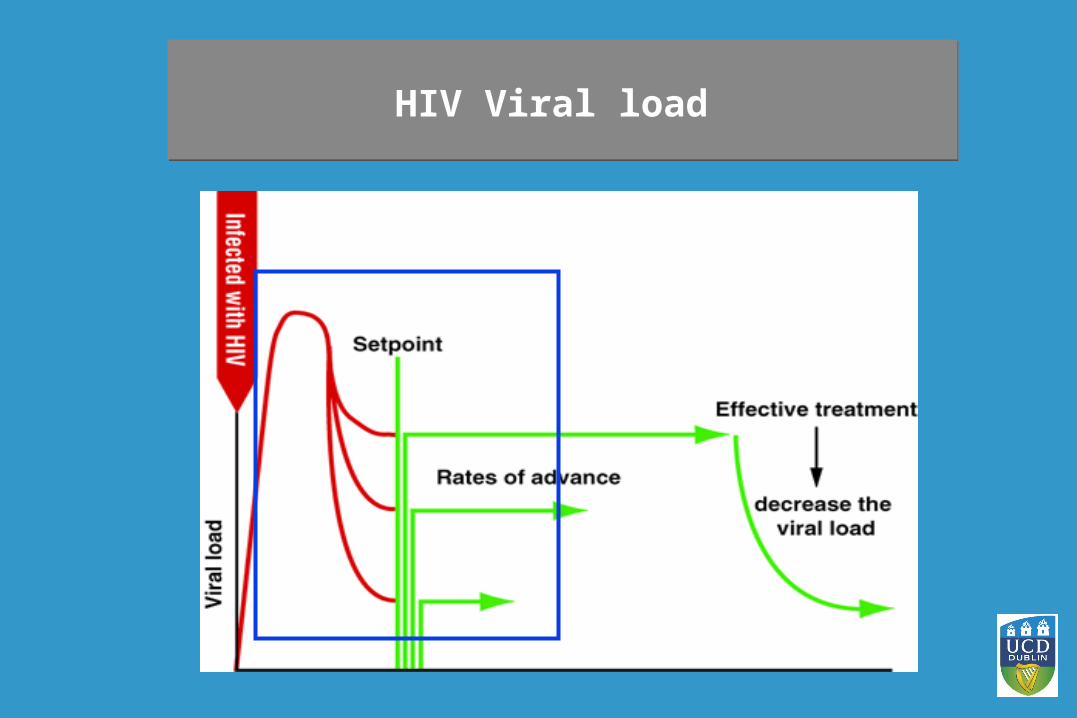
HIV Viral load HIV Viral load
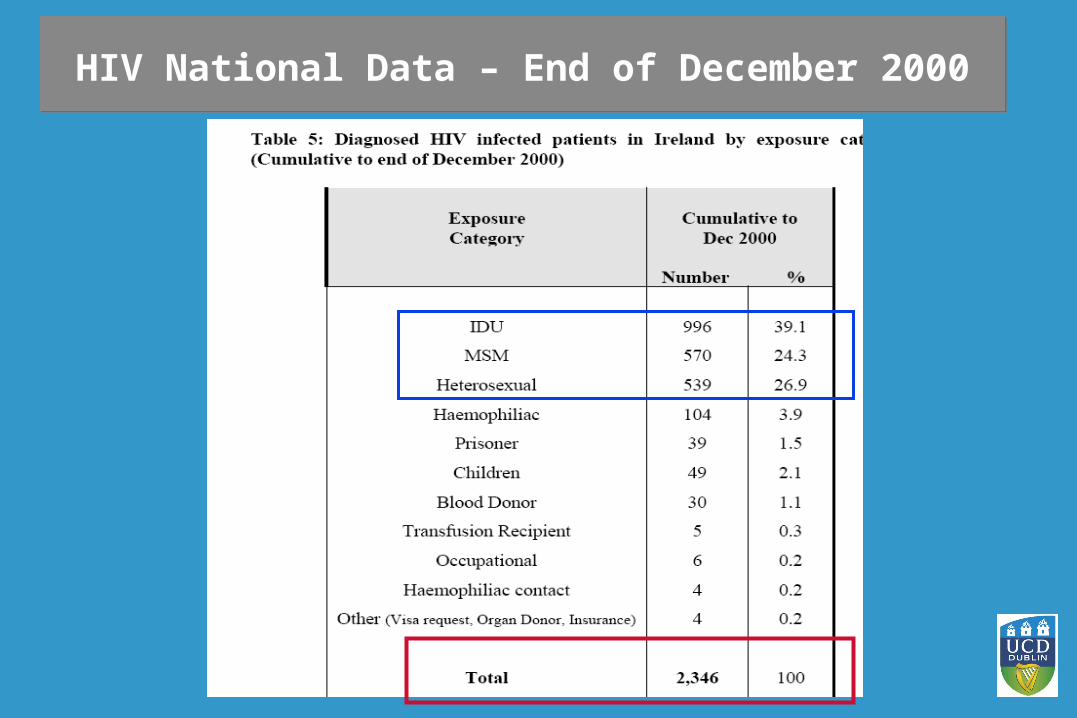
HIV National Data – End of December 2000HIV National Data – End of December 2000
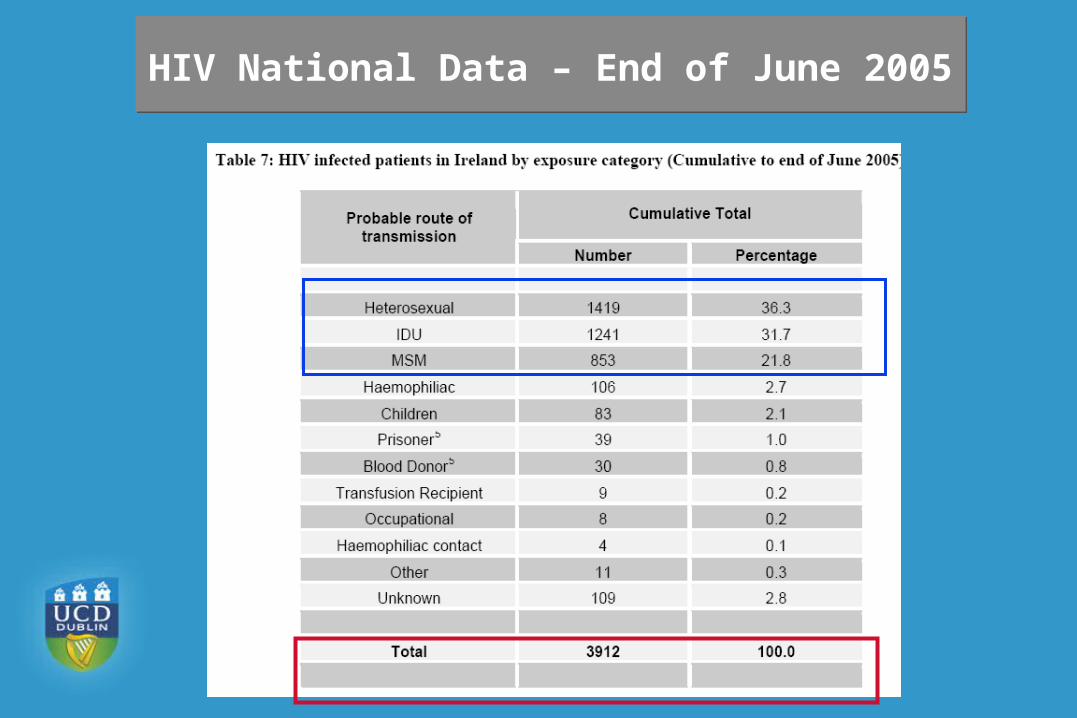
HIV National Data – End of June 2005HIV National Data – End of June 2005

HIV National Data – Q1 and Q2 2005HIV National Data – Q1 and Q2 2005

Hepatitis BHepatitis B
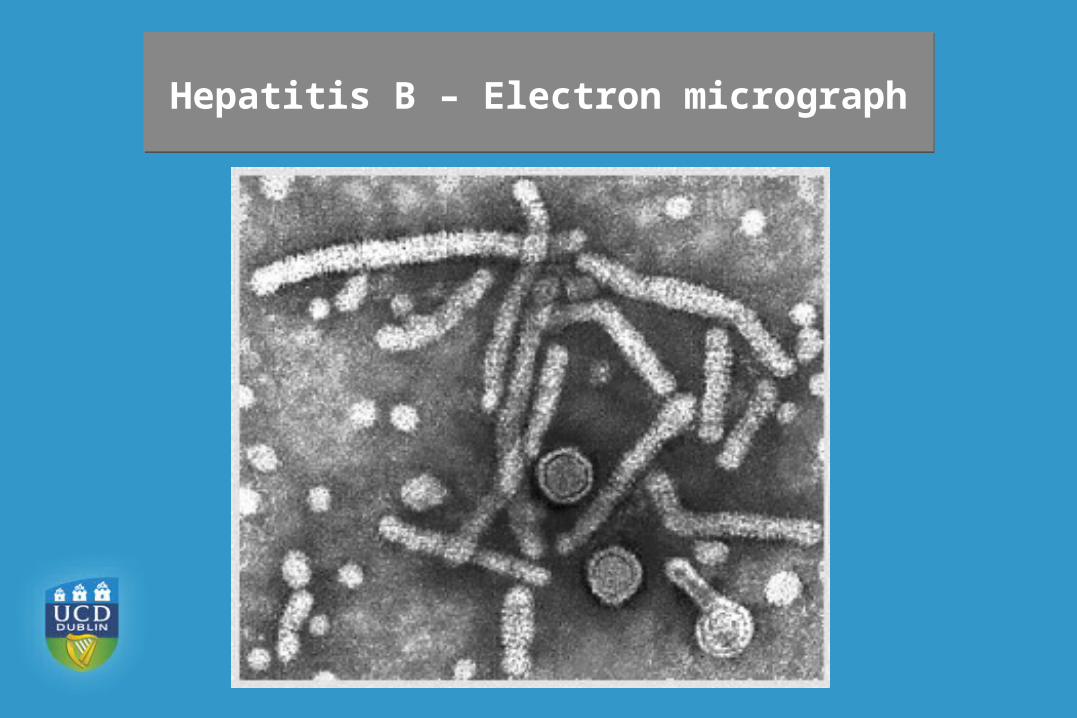
Hepatitis B – Electron micrographHepatitis B – Electron micrograph
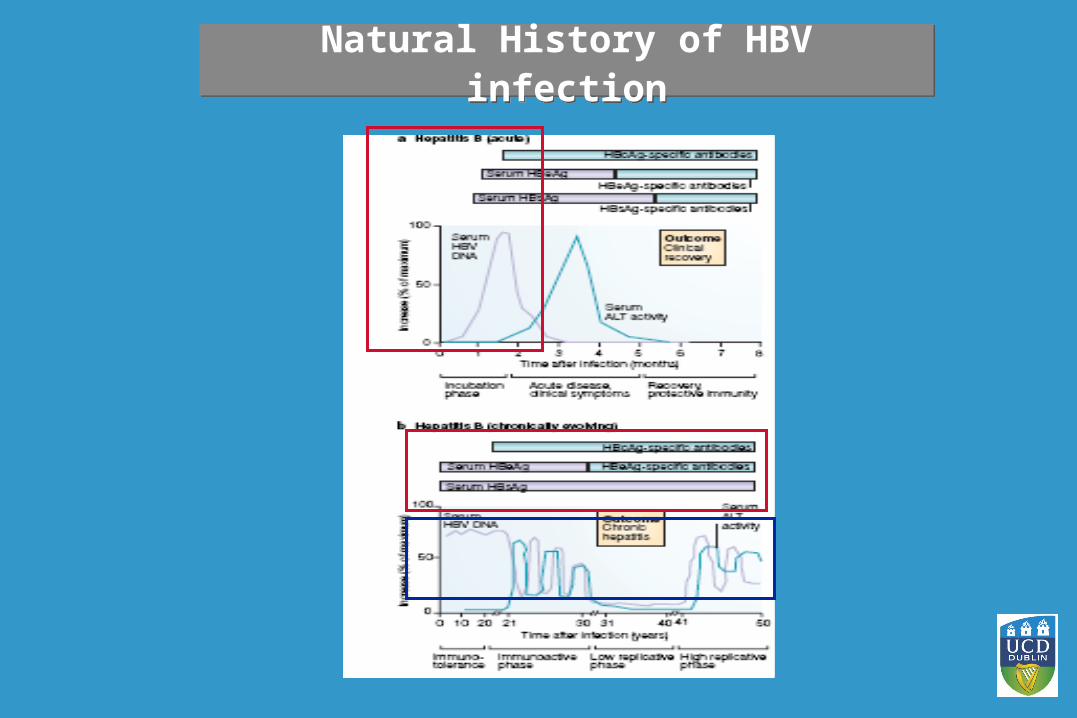
Natural History of HBV infectionNatural History of HBV infection

Hepatitis B infection in IrelandHepatitis B infection in Ireland
Nationally the numbers of HBV infected individuals is not known - data sources are
• Individual studies: IVDU, prisoners - underestimate the national problem
• NVRL database
• HPSC data
• ESEN 2 – European Sero-Epidemiology Network
• Antenatal screening
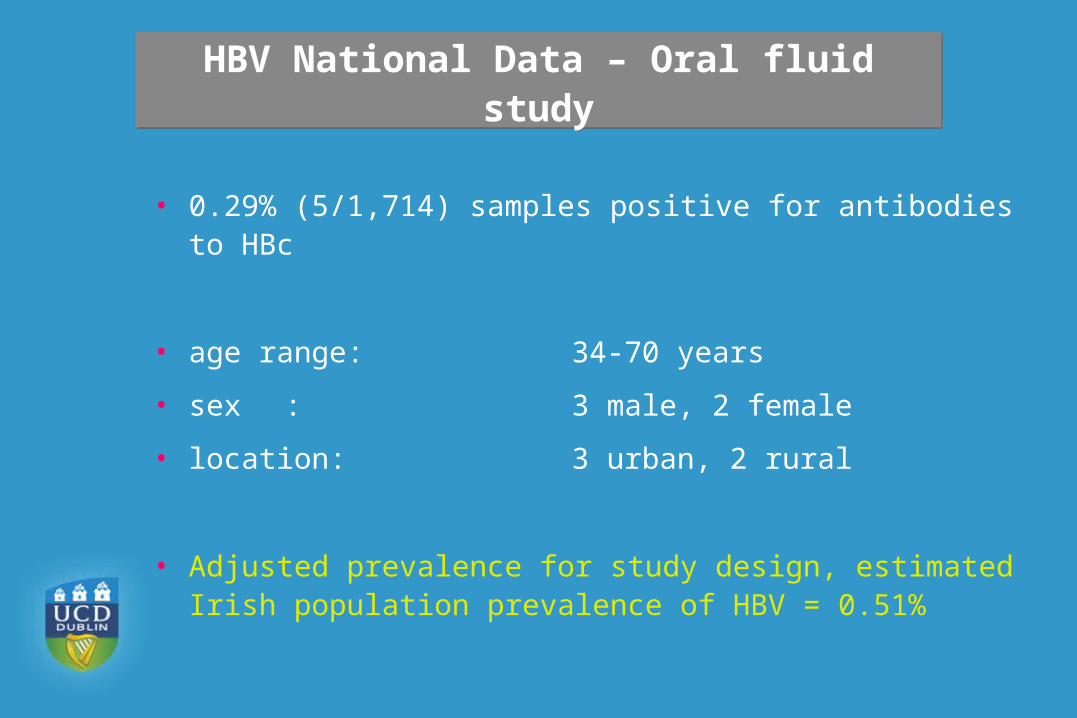
• 0.29% (5/1,714) samples positive for antibodies to HBc
• age range: 34-70 years
• sex : 3 male, 2 female
• location: 3 urban, 2 rural
• Adjusted prevalence for study design, estimated Irish population prevalence of HBV = 0.51%
HBV National Data – Oral fluid studyHBV National Data – Oral fluid study
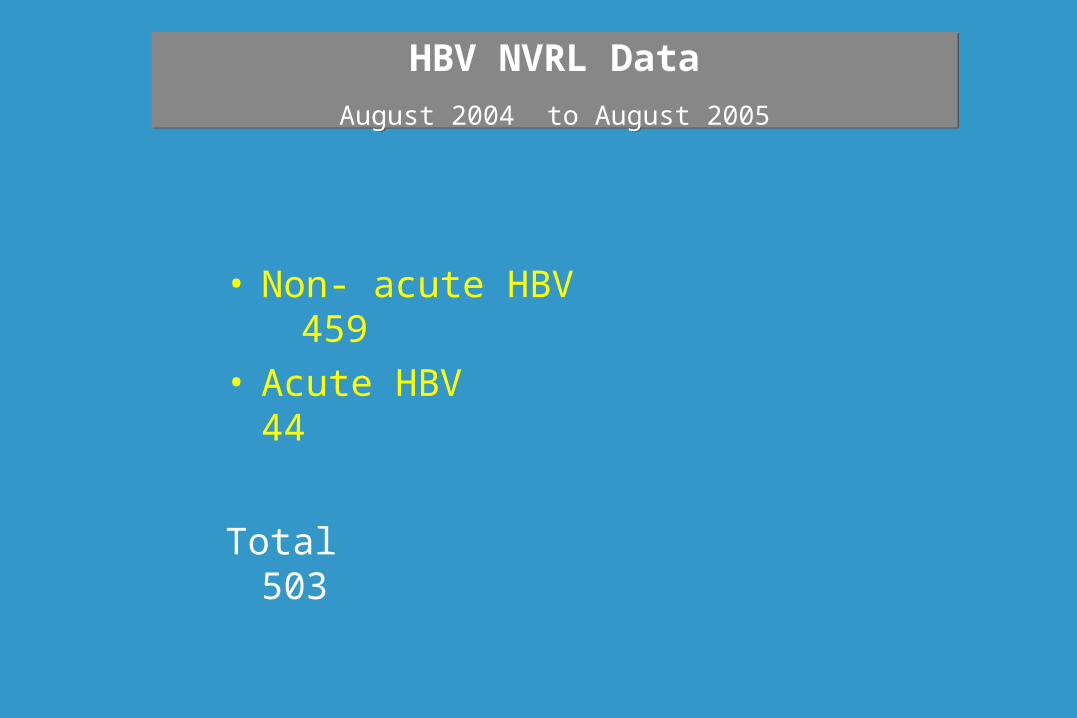
HBV NVRL DataAugust 2004 to August 2005
HBV NVRL DataAugust 2004 to August 2005
• Non- acute HBV 459• Acute HBV 44
Total 503
0
5
10
15
20
25
30
35
40
1 2 3 4 5
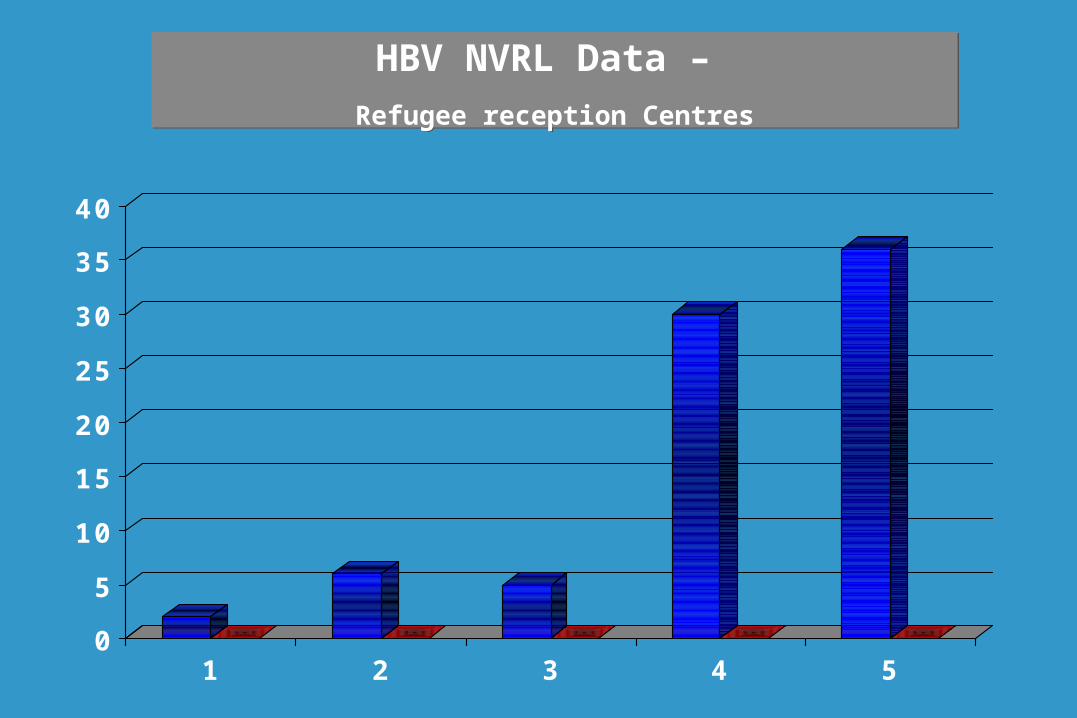
HBV NVRL Data – Refugee reception Centres
HBV NVRL Data – Refugee reception Centres
0
5
10
15
20
25
30
35
40
45
50
1 2 3 4 5
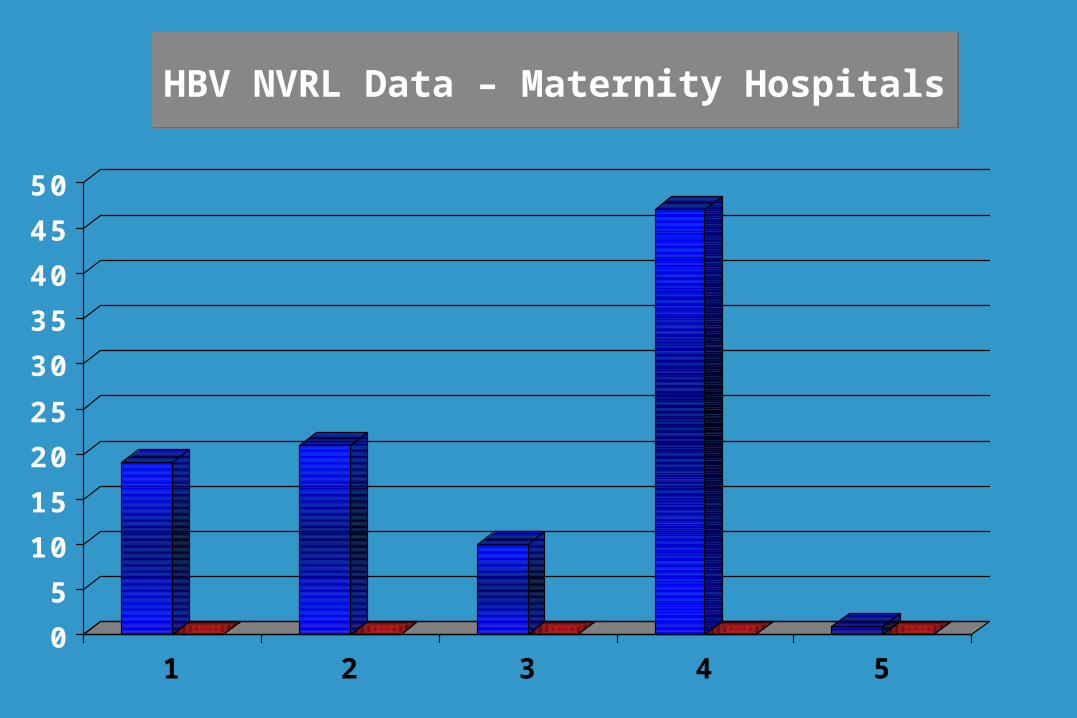
HBV NVRL Data – Maternity HospitalsHBV NVRL Data – Maternity Hospitals
0
5
10
15
20
25
30
35
40
45
50
1 2 3 4 5 6 7 8 9
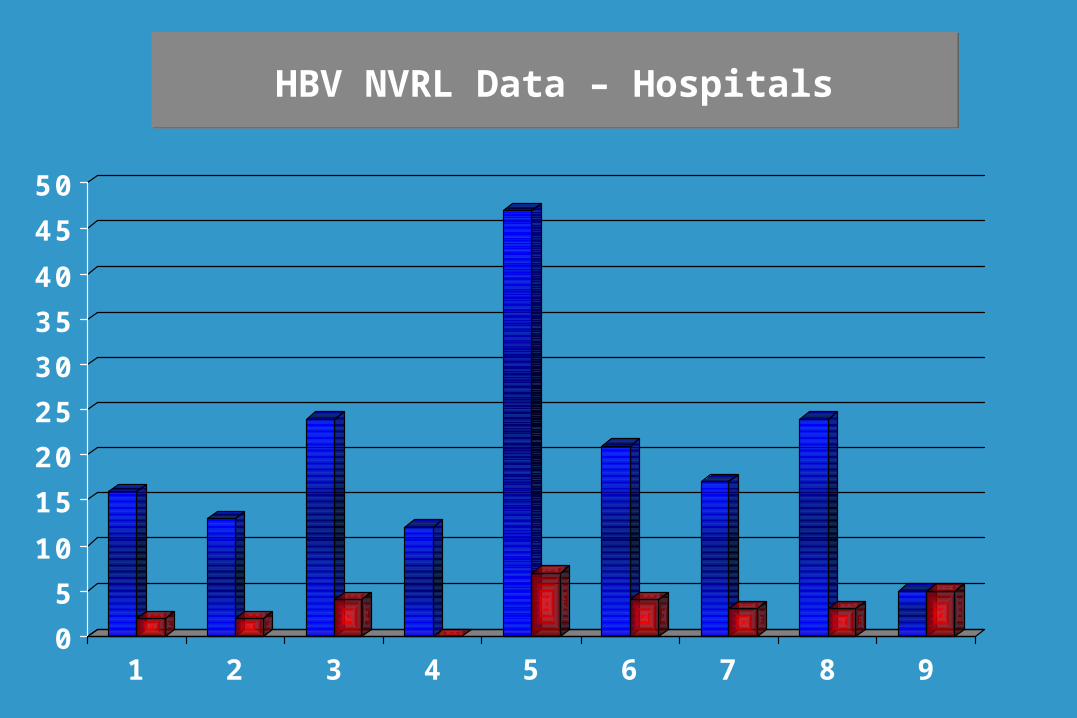
HBV NVRL Data – HospitalsHBV NVRL Data – Hospitals

0
5
10
15
20
25
30
MSM ND Hepatitis/jaundice Fatigue Renal Failure
HBV NVRL DataAcute infection: n=44
HBV NVRL DataAcute infection: n=44

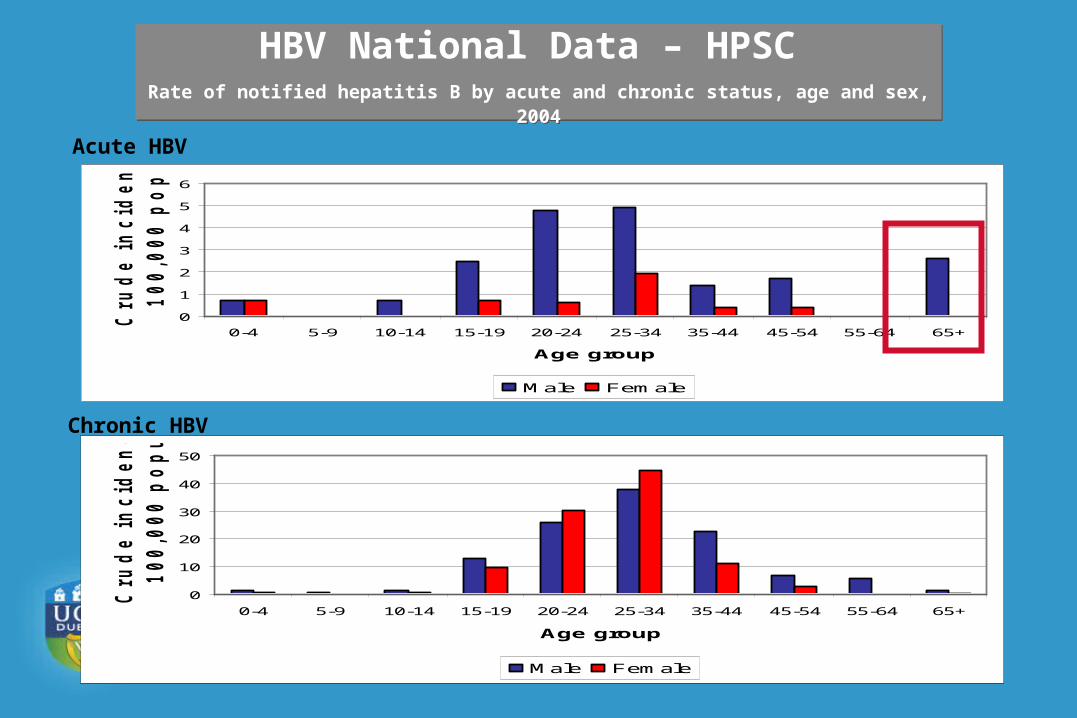
HBV National Data – HPSC HBV National Data – HPSC
Acute HBV
Chronic HBV
0
1
2
3
4
5
6
0-4 5-9 10-14 15-19 20-24 25-34 35-44 45-54 55-64 65+
Age group
Cru
de in
cid
en
ce rate p
er
100,000 p
op
ulatio
n
Male Female
0
10
20
30
40
50
0-4 5-9 10-14 15-19 20-24 25-34 35-44 45-54 55-64 65+
Age group
Cru
de in
cid
en
ce rate p
er
100,000 p
op
ulatio
n
Male Female
HBV National Data – HPSC Rate of notified hepatitis B by acute and chronic status, age and sex, 2004
HBV National Data – HPSC Rate of notified hepatitis B by acute and chronic status, age and sex, 2004

020
4060
80100
120140
160180
Q1 Q2 Q3 Q4 Q1 Q2
2004 2005
Year and month
Nu
mb
er o
f n
oti
fica
tio
ns
of
hep
atit
is B Acute (8%)
Chronic (73%)
Unknown (19%)
HBV National Data – HPSC Number of cases of hepatitis B notified by status, 2004 & 2005 (end July)
HBV National Data – HPSC Number of cases of hepatitis B notified by status, 2004 & 2005 (end July)
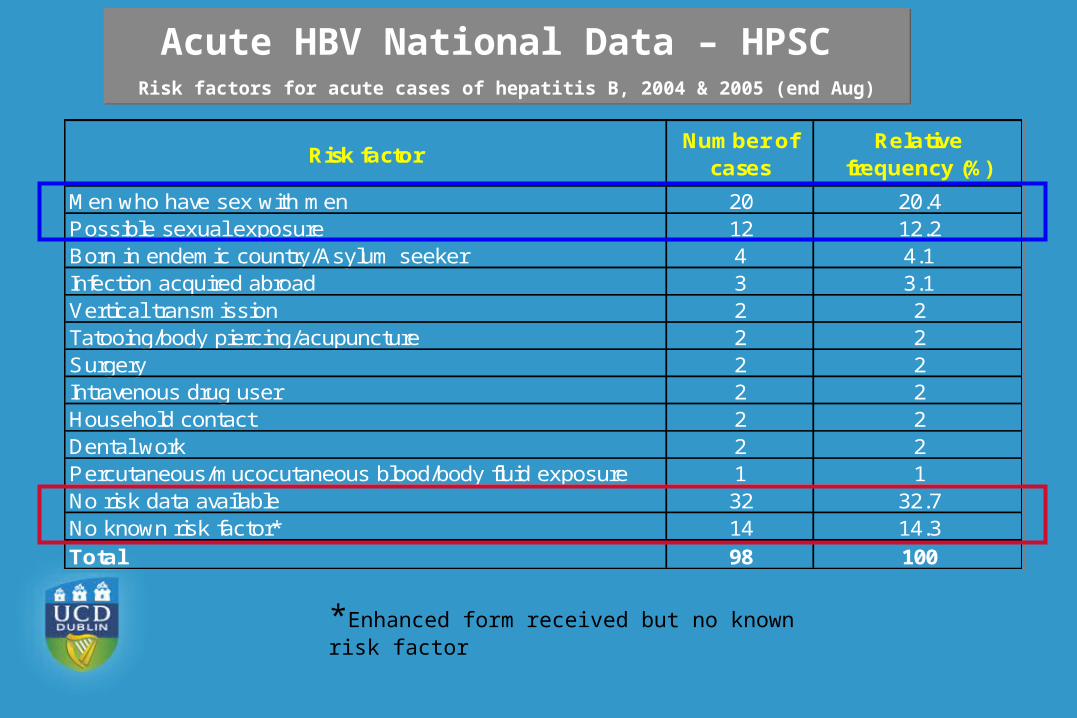
*Enhanced form received but no known risk factor
Risk factorNumber of
casesRelative
frequency (%)
Men who have sex with men 20 20.4Possible sexual exposure 12 12.2Born in endemic country/Asylum seeker 4 4.1Infection acquired abroad 3 3.1Vertical transmission 2 2Tatooing/body piercing/acupuncture 2 2Surgery 2 2Intravenous drug user 2 2Household contact 2 2Dental work 2 2Percutaneous/mucocutaneous blood/body fluid exposure 1 1No risk data available 32 32.7No known risk factor* 14 14.3Total 98 100
Acute HBV National Data – HPSC Risk factors for acute cases of hepatitis B, 2004 & 2005 (end Aug)
Acute HBV National Data – HPSC Risk factors for acute cases of hepatitis B, 2004 & 2005 (end Aug)
Region of BirthNumber of
cases%
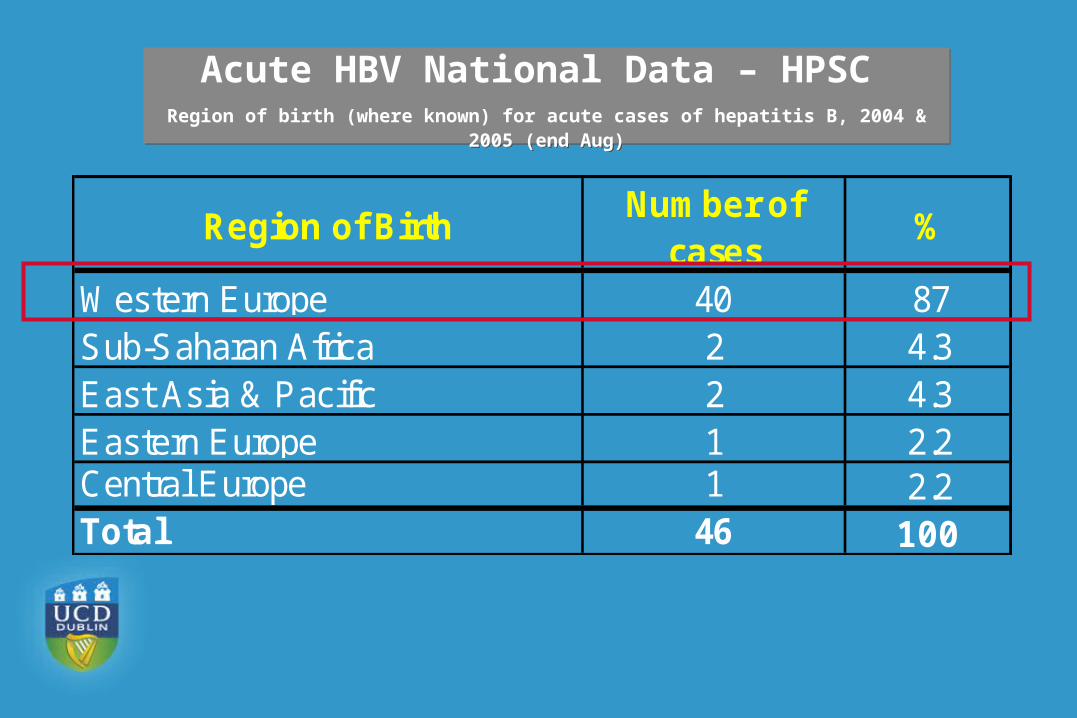
Western Europe 40 87Sub-Saharan Africa 2 4.3East Asia & Pacific 2 4.3Eastern Europe 1 2.2Central Europe 1 2.2Total 46 100
Acute HBV National Data – HPSC Region of birth (where known) for acute cases of hepatitis B, 2004 & 2005 (end Aug)
Acute HBV National Data – HPSC Region of birth (where known) for acute cases of hepatitis B, 2004 & 2005 (end Aug)

Risk factor or proxy for risk factor for all casesNumber of
casesRelative
frequency (%)Born in endemic country/Asylum seeker 219 22.7Household contact 6 0.6Vertical transmission 5 0.5Resident intellectual disability institition 3 0.3Intravenous drug user 3 0.3Dental work 3 0.3Men who have sex with men 2 0.2Infection acquired abroad 2 0.2Possible sexual exposure 2 0.2Surgery 1 0.1Renal Dialysis 1 0.1No risk data available 713 73.8No known risk factor* 6 0.6Total 966 100
Chronic HBV National Data – HPSC Risk factors for chronic cases of hepatitis B, 2004 & 2005 (end Aug)
Chronic HBV National Data – HPSC Risk factors for chronic cases of hepatitis B, 2004 & 2005 (end Aug)
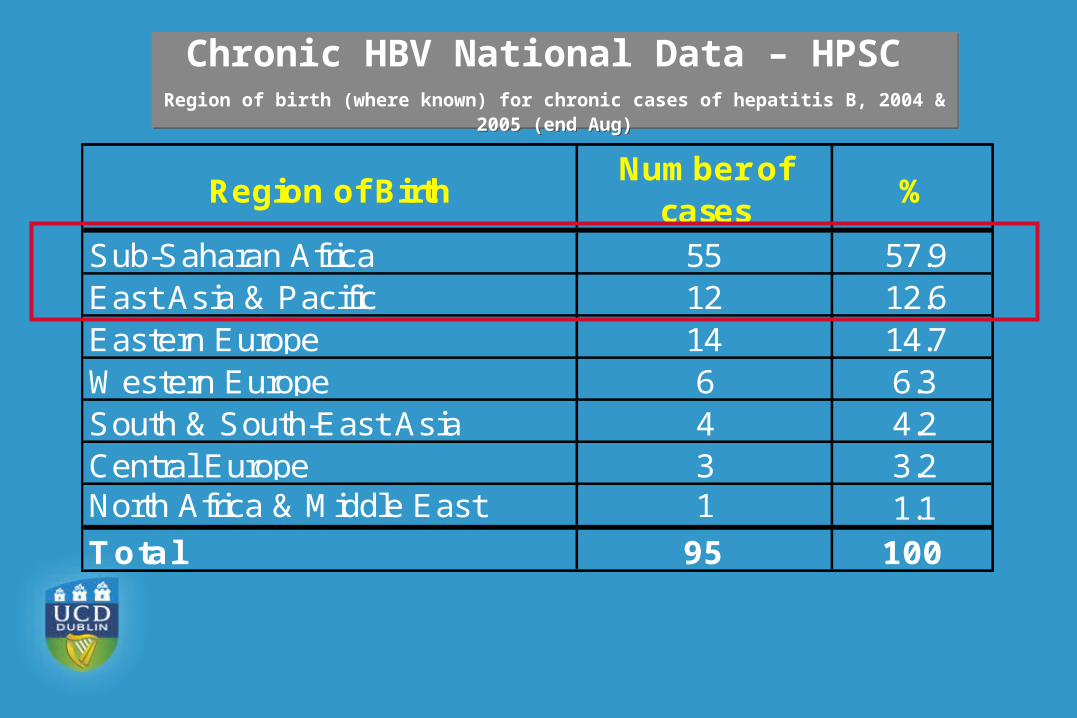
Region of BirthNumber of
cases%
Sub-Saharan Africa 55 57.9East Asia & Pacific 12 12.6Eastern Europe 14 14.7Western Europe 6 6.3South & South-East Asia 4 4.2Central Europe 3 3.2North Africa & Middle East 1 1.1Total 95 100
Chronic HBV National Data – HPSC Region of birth (where known) for chronic cases of hepatitis B, 2004 & 2005 (end Aug)
Chronic HBV National Data – HPSC Region of birth (where known) for chronic cases of hepatitis B, 2004 & 2005 (end Aug)

HBV National Data – HPSC Recent dataRate of notified hepatitis B in Quarter 4 2005
HBV National Data – HPSC Recent dataRate of notified hepatitis B in Quarter 4 2005
ACUTE
CHRONIC

Hepatitis CHepatitis C
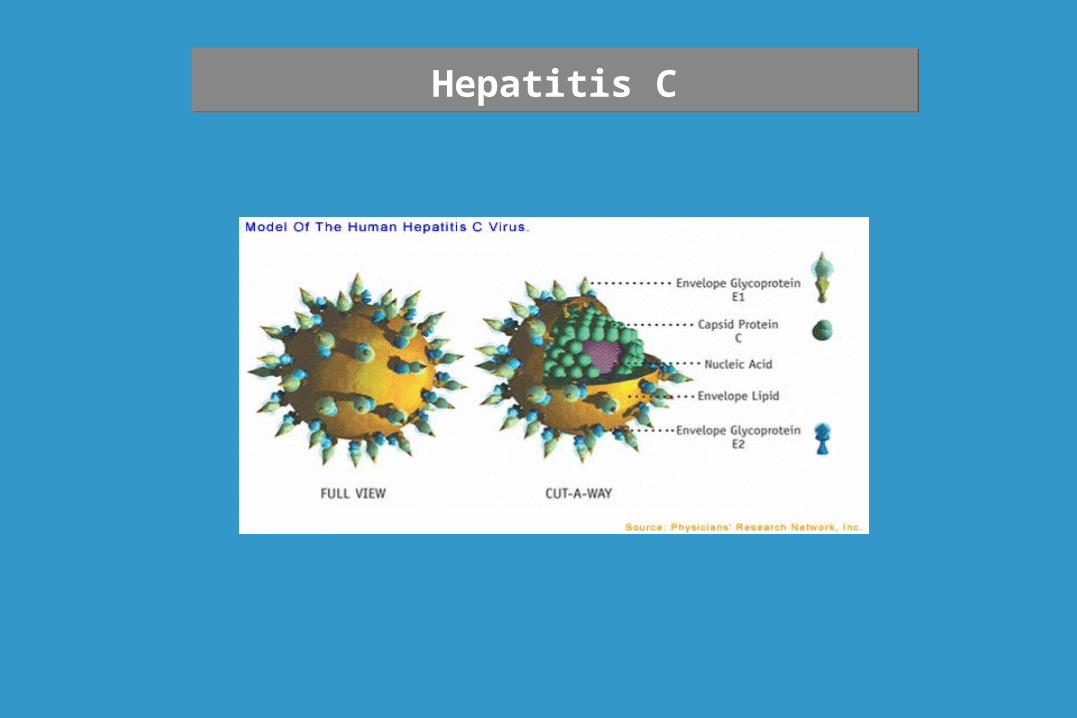
Hepatitis CHepatitis C
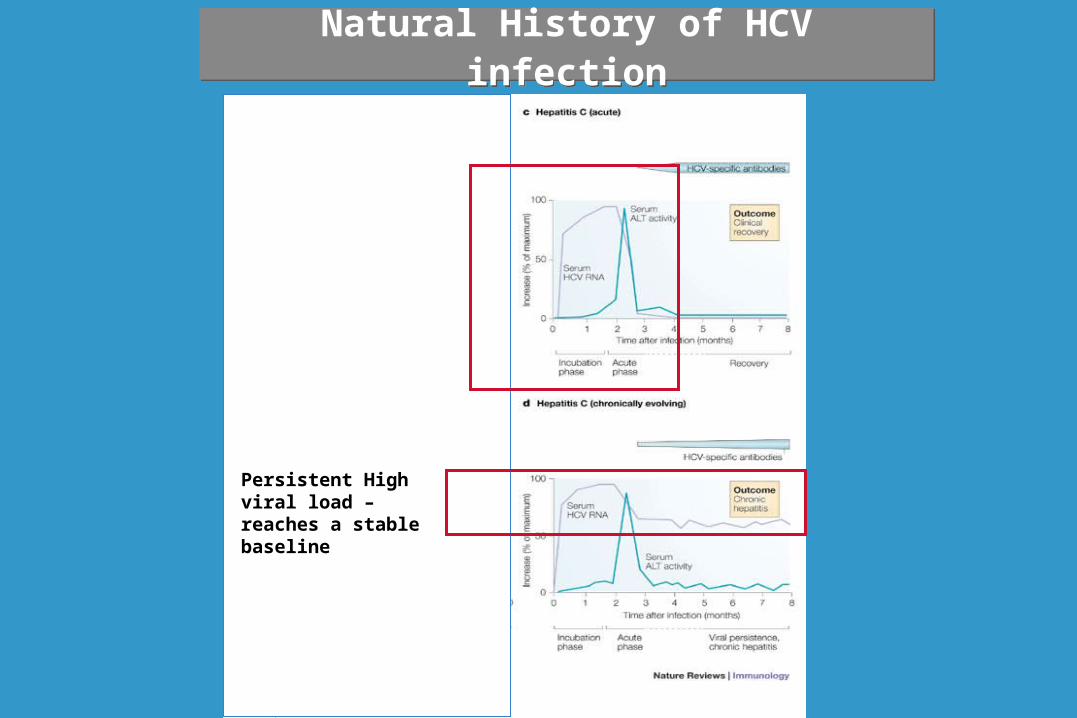
Persistent High viral load – reaches a stable baseline
Natural History of HCV infectionNatural History of HCV infection
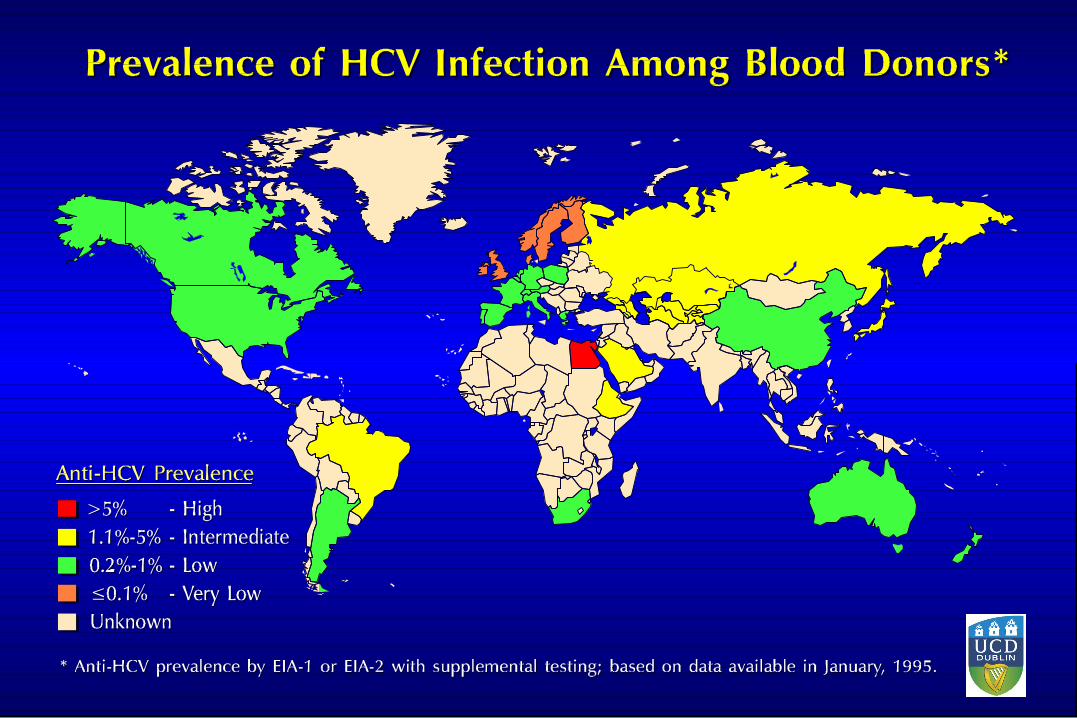

Hepatitis C infection in IrelandHepatitis C infection in Ireland
Numbers of HCV infected individuals not known
• NVRL – HPSC database • National HCV database (blood and blood products)
• Individual studies: IVDU, prisoners - underestimate the national problem
• NVRL data
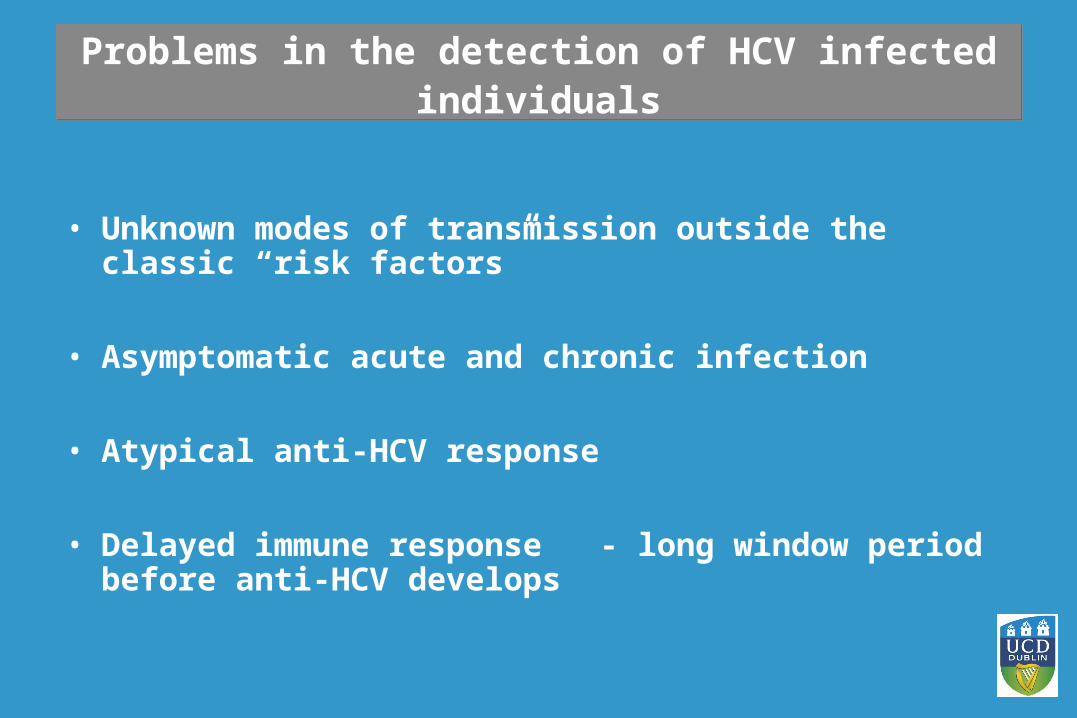
Problems in the detection of HCV infected individuals
Problems in the detection of HCV infected individuals
• Unknown modes of transmission outside the classic “risk factors”
• Asymptomatic acute and chronic infection
• Atypical anti-HCV response
• Delayed immune response - long window period before anti-HCV develops

HCV Genotypic investigations in Ireland 1994 –2005 – NVRL DATA
HCV Genotypic investigations in Ireland 1994 –2005 – NVRL DATA
0
200
400
600
800
1000
1200
1994 1995 1996 1997 1998 1999 2000 2001 2002 2003 2004 2005

HCV Genotypes in Ireland 1994 –2005 – NVRL DATA (n – 8812)
HCV Genotypes in Ireland 1994 –2005 – NVRL DATA (n – 8812)
0
10
20
30
40
50
60
70
80
1994 1995 1996 1997 1998 1999 2000 2001 2002 2003 2004 2005
1 2 3 4

HCV National Data – HPSC HCV National Data – HPSC
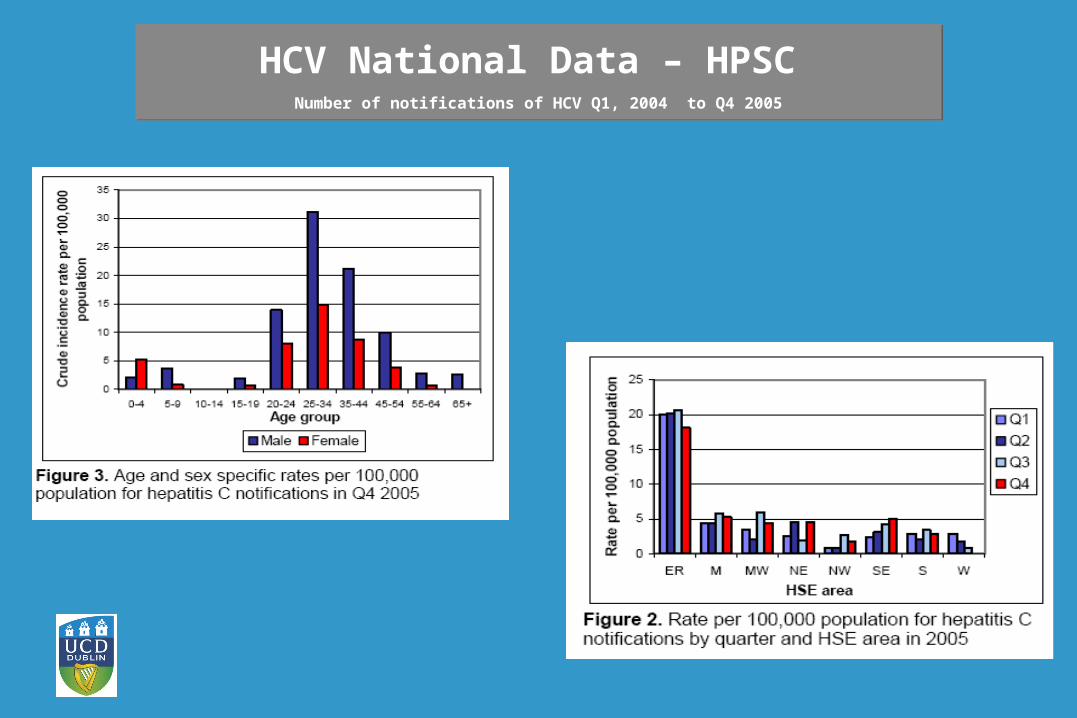
HCV National Data – HPSC Number of notifications of HCV Q1, 2004 to Q4 2005
HCV National Data – HPSC Number of notifications of HCV Q1, 2004 to Q4 2005

• Needle-stick injuries are a substantial problem
• Changing demographics in Ireland – increased level of HIV and HBV
• National data is improving
National Epidemiology Profile - National Epidemiology Profile - ConclusionsConclusions
National Epidemiology Profile - National Epidemiology Profile - ConclusionsConclusions

National Epidemiology ProfileNational Epidemiology ProfileNational Epidemiology ProfileNational Epidemiology Profile
Acknowledgments:
Dr. Lelia Thornton, HPSCLindsay Jones. IT, NVRLStaff at the NVRL

National Epidemiology ProfileNational Epidemiology ProfileNational Epidemiology ProfileNational Epidemiology Profile
Thanks for your attentionAny questions ?


