September 2016State Clearinghouse #2012122071
Recirculated Draft
Substitute Environmental Document in Support ofPotential Changes to the Water Quality Control Planfor the San Francisco Bay–Sacramento San Joaquin Delta Estuary
San Joaquin River Flows andSouthern Delta Water QualityExecutive Summary
State Water Resources Control Board | California Environmental Protection Agency
SJ Flows Cover.indd 1 9/14/16 4:38 PM

RECIRCULATED DRAFT
SUBSTITUTE ENVIRONMENTAL DOCUMENT IN
SUPPORT OF POTENTIAL CHANGES TO THE WATER
QUALITY CONTROL PLAN FOR THE SAN FRANCISCO
BAY-SACRAMENTO/SAN JOAQUIN DELTA
ESTUARY: SAN JOAQUIN RIVER FLOWS AND
SOUTHERN DELTA WATER QUALITY
EXECUTIVE SUMMARY S T A T E C L E A R I N G H O U S E N O . 2 0 1 2 1 2 2 0 7 1
State Water Resources Control Board
California Environmental Protection Agency
P.O. Box 100
Sacramento, CA 95812-0100
Contact: Katheryn Landau
916.341.5588
W I T H A S S I S T A N C E F R O M :
ICF International
630 K Street, Suite 400
Sacramento, CA 95814
Contact: Nicole Williams
916.737.3000
September 2016

State Water Resources Control Board. 2016. Substitute Environmental Document in Support of Potential Changes to the Water Quality Control Plan for the San Francisco Bay-Sacramento/San Joaquin Delta Estuary: San Joaquin River Flows and Southern Delta Water Quality. Recirculated Draft (SCH#2012122071). September. (ICF 00427.11.) Sacramento, CA. Prepared with assistance from ICF International, Sacramento, CA.
State of California
Governor Edmund G. Brown Jr.
California Environmental Protection Agency
Matthew Rodriquez, Secretary, Cal EPA
State Water Board
Felicia Marcus, Chair
Frances Spivy-Weber, Vice-Chair
Tam M. Doduc, Board Member
Steven Moore, Board Member
Dorene D'Adamo, Board Member
Tom Howard, Executive Director, State Water Board
Division of Water Rights
Les Grober, Deputy Director
STATE WATER RESOURCES
CONTROL BOARD
P.O. Box 100
Sacramento, CA 95812-0100
(916) 341-5250
http://www.waterboards.ca.gov


Evaluation of San Joaquin River Flow and Southern Delta Water Quality Objectives and Implementation
i September 2016
ICF 00427.11
Executive Summary Contents
List of Tables .......................................................................................................................................... iii
List of Figures .......................................................................................................................................... v
List of Acronyms and Abbreviations ...................................................................................................... vi
Introduction .................................................................................................................................. 1
California Environmental Quality Act ........................................................................................... 2
Project Description ....................................................................................................................... 3
Lower San Joaquin River Flow and Southern Delta Salinity Proposals ........................ 3
Plan Area ...................................................................................................................... 5
Recirculated CEQA Document ...................................................................................... 6
Purpose, Need, and Goals ............................................................................................................ 7
Need for Flow Objectives ............................................................................................. 8
Need for Updated Salinity Objectives ........................................................................ 10
San Joaquin River Flow Proposal ................................................................................................ 11
Narrative and Numeric Flow Objectives .................................................................... 11
Lower San Joaquin River Alternatives ........................................................................ 13
Recommended LSJR Alternative—Issues to be Resolved .......................................... 21
Effects of the Flow Proposal ....................................................................................... 21
Benefits of the Flow Proposal .................................................................................... 38
Southern Delta Salinity Proposal ................................................................................................ 48
Southern Delta Water Quality Alternatives ............................................................... 49
Recommended SDWQ Alternative—Issues to be Resolved ....................................... 50
CEQA Baseline ............................................................................................................................. 51
Summary of Effects ..................................................................................................................... 51
LSJR Alternatives ........................................................................................................ 51
SDWQ Alternatives ..................................................................................................... 58
Organization and Content of the Substitute Environmental Document .................................... 60
Intended Uses of This SED .......................................................................................................... 62
Scope of Content and Analysis ................................................................................... 65
Past Public Review and CEQA Noticing ...................................................................... 66
Scientific Review ......................................................................................................... 67
Review and Consultation Requirements .................................................................... 68
Availability of the Substitute Environmental Document ............................................ 68
Areas of Known Controversy and Changes Made to the 2012 Draft Substitute
Environmental Document ........................................................................................................... 69
Reservoir Operation and Water Supply Effects Model Assumptions ........................ 70
State Water Resources Control Board California Environmental Protection Agency Executive Summary Contents
Evaluation of San Joaquin River Flow and Southern Delta Water Quality Objectives and Implementation
ii September 2016
ICF 00427.11
Effects of the Proposed Flow Objectives on Municipal Water Supplies .................... 71
Groundwater and Water Supply Assumptions, and the Associated Use of
the SWAP Model ........................................................................................................ 71
Geography Used for SWAP Analysis ........................................................................... 71
Analysis of Various Economic Topics .......................................................................... 72
Use of Adaptive Implementation ............................................................................... 72
Analysis of Dry Years and Consecutive Dry Years ....................................................... 72
Plan Area Description ................................................................................................. 72
Analyses of the Potential Effects on the City and County of San Francisco ............... 72
Non-Flow Measures ................................................................................................... 73
Benefits of the Proposed Objectives to Fish and Wildlife .......................................... 73
Discussion of Multiple Fish Topics .............................................................................. 74
Other Changes ............................................................................................................ 74
Next Steps ................................................................................................................................... 74
References Cited ......................................................................................................................... 99

State Water Resources Control Board California Environmental Protection Agency
Executive Summary Contents
Evaluation of San Joaquin River Flow and Southern Delta Water Quality Objectives and Implementation
iii September 2016
ICF 00427.11
Tables
Page
Table ES-1. Percent Unimpaired Flows by LSJR Alternative ................................................................ 15
Table ES-2. Summary of Mean Annual Water Supply Effects ............................................................. 22
Table ES-3. Mean Annual Water Supply Effects of LSJR Alternative 3 (40 Percent
Unimpaired Flow Proposal) by Water Year Type .............................................................. 23
Table ES-4. Groundwater Use Based on 2009 Levels of Groundwater Pumping ................................ 25
Table ES-5. Annual Average Applied Water Demand, Groundwater Pumping, and Unmet
Demand Based on 2009 Levels of Groundwater Pumping ............................................... 26
Table ES-6. Groundwater Use Based on 2014 Levels of Groundwater Pumping ................................ 27
Table ES-7. Annual Average Applied Water Demand, Groundwater Pumping, and Unmet
Demand Based on 2014 Levels of Groundwater Pumping ............................................... 27
Table ES-8. Average Annual Baseline Energy Generation and Difference from Baseline
by Tributary (gigawatt hours) ........................................................................................... 30
Table ES-9. Average Annual Total Economic Output Related to Agricultural Production in
the Irrigation Districts under Baseline Conditions and the Change for LSJR
Alternatives 2, 3, and 4 ..................................................................................................... 32
Table ES-10. Average Annual Total Employment Related to Agricultural Production in the
Irrigation Districts under Baseline Conditions and the change for LSJR
Alternatives 2, 3, and 4 ..................................................................................................... 33
Table ES-11. Estimated Annual SFPUC Replacement Water Purchase Costs under LSJR
Alternatives 2, 3, and 4 (Annual Average within Severe 6-Year Drought
Period Represented by Years 1987–1992) ....................................................................... 37
Table ES-12. Estimated Mean Annual SFPUC Replacement Water Purchase Costs under
LSJR Alternatives 2, 3, and 4 ............................................................................................. 38
Table ES-13. Mean Annual February–June Instream Flows in the Plan Area ........................................ 39
Table ES-14. Mean Annual February–June Instream Flow in the Plan Area by Water Year
Type................................................................................................................................... 40
Table ES-15. Summary of Mean Annual Temperature Benefits with Increased Flows
February–June in All Years ................................................................................................ 42
Table ES-16. Summary of Mean Annual Temperature Benefits with Increased Flows
February–June in Critically Dry Years ............................................................................... 43
State Water Resources Control Board California Environmental Protection Agency Executive Summary Contents
Evaluation of San Joaquin River Flow and Southern Delta Water Quality Objectives and Implementation
iv September 2016
ICF 00427.11
Table ES-17. Floodplain Inundation in Acre*Days and Percent Increase over Baseline,
February–June .................................................................................................................. 46
Table ES-18. Floodplain Inundation in Acre*Days and Percent Increase over Baseline,
April–June ......................................................................................................................... 47
Table ES-19. Average Annual Floodplain Inundation in Acre*Days and Percent Increase
over Baseline (April–June) for Tuolumne River ................................................................ 48
Table ES-20. Summary of CEQA Significance Determinations in Chapters 5–15, Plan Area ................. 52
Table ES-21. Summary of CEQA Significance Determinations in Chapters 5–14, Extended
Plan Area ........................................................................................................................... 53
Table ES-22. CEQA Significance Summary of LSJR Alternatives—Other Indirect Actions ..................... 56
Table ES-23. CEQA Significance Summary of LSJR Alternatives Non-Flow Measures ........................... 57
Table ES-24. CEQA Significance Summary SDWQ Alternatives—Methods of Compliance ................... 59
Table ES-25. Organization and Contents of SED Chapters .................................................................... 60
Table ES-26. Organization and Contents of SED Appendices ................................................................ 61
Table ES-27. Porter-Cologne Section 13241 Factors ............................................................................. 64
Table ES-28. Timeline of Public Involvement for the Planning Process, Public Workshops,
and CEQA Noticing ............................................................................................................ 66
Table ES-29. Impact Determinations Identified in Chapters 5–15 ........................................................ 75
State Water Resources Control Board California Environmental Protection Agency
Executive Summary Contents
Evaluation of San Joaquin River Flow and Southern Delta Water Quality Objectives and Implementation
v September 2016
ICF 00427.11
Figures
Page
Figure ES-1. San Joaquin River Basin ..................................................................................... follows ES-6
Figure ES-2. Plan Area ............................................................................................................ follows ES-6
Figure ES-3. Percent of Time that Temperature Goal for April Core Rearing is Achieved in
the Merced River ......................................................................................................... ES-41
Figure ES-4. Lower Tuolumne Inundated Wetted Surface Area as a Function of Discharge
from RM 52 to RM 21.5 ............................................................................................... ES-45
State Water Resources Control Board California Environmental Protection Agency
Executive Summary Contents
Evaluation of San Joaquin River Flow and Southern Delta Water Quality Objectives and Implementation
vi September 2016
ICF 00427.11
Acronyms and Abbreviations
AF acre-feet
Bay-Delta San Francisco Bay/Sacramento-San Joaquin Delta Estuary
Bay-Delta Plan Water Quality Control Plan for the San Francisco Bay/Sacramento-San Joaquin Delta Estuary
BO biological opinion
CCSF City and County of San Francisco
CEQA California Environmental Quality Act
CESA California Endangered Species Act
cfs cubic feet per second
CVP Central Valley Project
CDFW California Department of Fish and Wildlife
D-1641 State Water Board Water Right Decision 1641
DWR California Department of Water Resources
2012 Draft SED December 2012 Draft SED
dS/m deciSiemens per meter
EC electrical conductivity
EIRs environmental impact reports
ESA Endangered Species Act
FERC Federal Energy Regulatory Commission
ft feet
GSPs groundwater sustainability plans
LSJR Lower San Joaquin River
mmhos/cm millimhos per centimeter
NMFS National Marine Fisheries Service
SalSim Salmon simulation model
SDWQ southern Delta water quality
SED substitute environmental document
SFPUC San Francisco Public Utilities Commission
SGMA Sustainable Groundwater Management Act
SJR San Joaquin River
State Water Board State Water Resource Control Board
SWP State Water Project
TAF thousand acre-feet
TAF/y thousand acre-feet per year
UF unimpaired flow
USBR U.S. Bureau of Reclamation
USFWS U.S. Fish and Wildlife Service
VAMP Vernalis Adaptive Management Program
WSE Water Supply Effects model
Evaluation of San Joaquin River Flow and Southern Delta Water Quality Objectives and Implementation
ES-1 September 2016
ICF 00427.11
Executive Summary
Introduction The State Water Resource Control Board’s (State Water Board’s) mission is to preserve, enhance,
and restore the quality of California’s water resources and drinking water for the protection of the
environment, public health, and all beneficial uses, and to ensure proper water resource allocation
and efficient use for the benefit of present and future generations. The recent drought has
highlighted many of the challenges of carrying out this essential responsibility of the State Water
Board to reasonably protect the beneficial uses of water throughout the state.
The San Francisco Bay/Sacramento–San Joaquin Delta Estuary (Bay–Delta) includes the
Sacramento–San Joaquin Delta, Suisun Marsh, and San Francisco Bay. California’s two major rivers,
the Sacramento and the San Joaquin, converge in the Delta and meet incoming seawater from the
Pacific Ocean in San Francisco Bay. The Delta is a critically important natural resource for California
and the nation. It is both the hub of California’s water supply system and the most valuable estuary
and wetlands on the western coast of the Americas, serving municipal, industrial, agricultural,
recreational, and ecological beneficial uses.
The Bay-Delta is in ecological crisis. Fish species have not shown signs of recovery since adoption of
the 1995 Bay-Delta Plan objectives intended to protect fish and wildlife. Several species of fish are
listed as protected species under the California Endangered Species Act (CESA) and under the
federal Endangered Species Act (ESA). The Bay-Delta is also in water supply crisis. Those dependent
on the Delta for water supply have received much less water in recent years because of the drought.
The Bay-Delta is therefore at the center of the ongoing statewide debate about how to reasonably
protect fish and wildlife uses of water without causing unreasonable negative effects on water
supply for agriculture, drinking water, hydropower, and other competing beneficial uses. The
southern Delta is at the center of a more local debate of how to reasonably protect irrigated
agriculture.
The State Water Board protects water quality that affects beneficial uses of water in the Bay-Delta
through its Water Quality Control Plan for the San Francisco Bay/Sacramento–San Joaquin Delta
Estuary (Bay-Delta Plan), The State Water Board is proposing to update two elements of the 2006
Bay-Delta Plan.
San Joaquin River (SJR) flow objectives for the protection of fish and wildlife—the flow element
of the proposed plan update would increase the required flows left in the rivers and would
change the area currently protected by flow requirements by adding compliance locations on
the Stanislaus, Tuolumne, and Merced Rivers, instead of only on the SJR at Vernalis.
Southern Delta salinity objectives for the protection of agriculture—the southern Delta salinity
element of the proposed plan update would increase salinity objectives while generally
maintaining existing conditions and changing compliance locations.
The State Water Board is also proposing to update the program of implementation to achieve these
objectives, which will include monitoring and special studies to fill information needs and to
evaluate the effectiveness of the new objectives and their implementation. Responsibility for
implementing flow objectives will be assigned through water right actions and water quality actions,
State Water Resources Control Board California Environmental Protection Agency
Executive Summary
Evaluation of San Joaquin River Flow and Southern Delta Water Quality Objectives and Implementation
ES-2 September 2016
ICF 00427.11
including Federal Energy Regulatory Commission (FERC) hydropower licensing processes. The State
Water Board also encourages voluntary agreements that will assist in implementing the flow
objectives.
The State Water Board is engaged in a multi-pronged approach to address the ecological crisis and
protect beneficial uses in the Bay-Delta and tributary watersheds. This recirculated substitute
environmental document (SED) evaluates the proposed amendments to the Bay-Delta Plan
involving the LSJR flow objectives and southern Delta salinity objectives, commonly referred to as
Phase I of the Bay-Delta Plan update. In a separate process, referred to as Phase II, the State Water
Board is reviewing and considering updates to other elements of the Bay-Delta Plan, including Delta
outflows, Sacramento and tributary inflows (other than the SJR inflows), and ecosystem regime
shift.1 In Phase III, the State Water Board will consider changes to water rights and other actions to
implement changes to the Bay-Delta Plan from Phases I and II. Phase IV is focused on the
development and implementation of flow objectives in the Sacramento River Watershed to address
public trust needs, with consideration for other beneficial uses of water.
California Environmental Quality Act The State Water Board’s consideration of the proposed amendments to the 2006 Bay-Delta Plan
involving the SJR flow objectives and southern Delta salinity objectives is a discretionary project
under the California Environmental Quality Act (CEQA). CEQA applies to discretionary projects that
that have the potential to result in direct physical changes, or reasonably foreseeable indirect
physical changes, in the environment. When proposing to undertake or approve such projects, state
and local agencies must comply with the procedural and substantive requirements of CEQA. The
State Water Board is the lead agency for this project under CEQA.
CEQA authorizes the Secretary of the Resources Agency to certify a regulatory program of a state
agency as exempt from the requirements for preparing environmental impact reports (EIRs),
negative declarations, and initial studies if certain conditions are met. The State Water Board’s
water quality control planning program is a certified regulatory program and, thus, a SED may be
prepared in lieu of an EIR. This SED fulfills the requirements of CEQA and the State Water Board’s
CEQA regulations to analyze the environmental effects of the proposed Bay-Delta Plan update, as
well as requirements of the Porter-Cologne Water Quality Control Act and other applicable
requirements (more fully described in Chapter 1, Introduction, Section 1.4, State Water Board
Authorities). This SED will inform the State Water Board’s consideration of the proposed
amendments to the 2006 Bay-Delta Plan described in this chapter.
The assessment of environmental effects in this SED was conducted at a programmatic level, which
is more general than a project-specific analysis. The State Water Board’s adoption of amendments to
the 2006 Bay-Delta Plan will not result in direct physical changes in the environment. Rather, it is
through the implementation of the Bay-Delta Plan that physical changes in the environment
potentially may occur. Accordingly, all potential environmental effects evaluated in this SED are
indirect effects associated with implementation, which would occur later in time and would be
1 The use of the term Phase to describe these different processes is solely used for administrative convenience to distinguish the different proceedings. The two water quality proceedings, Phase I and Phase II, for example, involve different water quality objectives, largely different geographic areas, and can be developed and implemented independently of each other. Phase II is not dependent on the completion of Phase I.

State Water Resources Control Board California Environmental Protection Agency
Executive Summary
Evaluation of San Joaquin River Flow and Southern Delta Water Quality Objectives and Implementation
ES-3 September 2016
ICF 00427.11
subject to project-specific environmental review, in compliance with CEQA. This document does not
evaluate specific projects undertaken to implement the Bay-Delta Plan in sufficient detail to support
a project-level approval for any project because the nature and extent of any environmental effects
will depend in large part on the project-level actions undertaken. This SED, however, does evaluate
the indirect effects of the project (plan amendments),2 including reasonably foreseeable
environmental impacts of the methods of compliance and impacts associated with actions that
people may take in response to the project.
This executive summary contains the following elements required by CEQA. The sections of the
executive summary in which the information can be found are indicated in parentheses. Specifically,
Section 15123 of the State CEQA Guidelines requires a brief summary that identifies:
Each significant effect with proposed mitigation measures and alternatives that would reduce or
avoid that effect (Section ES6)
Areas of controversy known to the lead agency, including issues raised by agencies and the
public (Section ES9)
Issues to be resolved, including the choice among the alternatives and whether or how to
mitigate the significant effects (Sections ES4.3 and ES5.2)
Additionally, this executive summary summarizes the following information:
Project location, including a map (Sections ES1.2 and ES1.3)
Statement of project goals (Section ES 2)
General description of the project, including the baseline and alternatives evaluated (Sections
ES1.2, ES3, and ES4)
Statement describing the intended uses of the SED, including review and consultation
requirements (Section ES8)
Project Description The project consists of the following proposed updates to the 2006 Bay-Delta Plan.
The SJR flow objectives for the protection of fish and wildlife, and southern Delta salinity
objectives for the protection of agriculture
The program of implementation to implement these objectives, including requirements for the
monitoring and special studies needed to determine the effectiveness of, and compliance with,
the objectives and to identify needed future changes to the objectives
Lower San Joaquin River Flow and Southern Delta Salinity Proposals
This section describes the proposed amendments to the 2006 Bay-Delta Plan recommended by State
Water Board staff. Chapter 3, Alternatives Description, describes the alternatives evaluated in this
SED. The SJR flow element of the proposed plan amendments (flow proposal) would change the area
2 These plan amendments are the project as defined in State CEQA Guidelines, Section 15378.
State Water Resources Control Board California Environmental Protection Agency
Executive Summary
Evaluation of San Joaquin River Flow and Southern Delta Water Quality Objectives and Implementation
ES-4 September 2016
ICF 00427.11
currently protected by flow requirements by adding compliance locations on the Stanislaus,
Tuolumne, and Merced Rivers. The flow proposal would also change the existing requirement from a
specific monthly requirement that changes by month and year type to a flow parameter that more
closely tracks natural flow variations. The flow proposal would provide the flow conditions
necessary to reasonably protect fish and wildlife beneficial uses. The proposed flows are higher than
the existing flow requirement. Implementation of these higher flows would reduce water available
to water users in the LSJR Watershed more often than does the current objective.
Rather than prescribe a fixed, inflexible flow objective, the flow proposal has a narrative and
numeric flow objective, expressed as a required range of unimpaired flows. Unimpaired flow is the
flow that would accumulate in surface waters in response to rainfall and snowmelt and flow
downstream if there were no reservoirs or diversions to change the quantity, timing, and magnitude
of flows. Unimpaired flow is central to the flow proposal. It differs from natural flow because
unimpaired flow is the flow that occurs at a specific location under the current configuration of
channels, levees, floodplain, wetlands, deforestation and urbanization.
The State Water Board does not propose to revert to natural flows. Though unimpaired flow is not
the same as natural flow, it is nevertheless reflective of the frequency, timing, magnitude, and
duration of the natural flows to which fish and wildlife have adapted and have become dependent
upon. A flow objective based on unimpaired flows is intended to restore a specific percent of these
flows for the reasonable protection of the fish and wildlife beneficial use.
The flow proposal includes the following elements.
Narrative and numeric flow objective with a required percent of unimpaired flow, expressed as
a range from 30 to 50 percent of unimpaired flow, with a starting flow of 40 percent of
unimpaired flow, for February–June for the Stanislaus, Tuolumne, and Merced Rivers through to
the SJR near Vernalis.
Adaptive implementation of unimpaired flows, which allows flows to be shifted in time and
shaped in order to provide the greatest benefits to fish and wildlife, also allows for changes in
flows between 30 and 50 percent of unimpaired flow in response to changed information or
conditions.
In an emergency, a temporary change in the implementation of the flow requirements may be
allowed in a water right proceeding, but measures must be taken to reasonably protect the fish
and wildlife beneficial use in light of the circumstances of the emergency.
Recommendations for non-flow measures3 that are complementary to the flow proposal for the
protection of fish and wildlife, and that are expected to improve habitat conditions or improve
related science and management within the LSJR Watershed. Successful implementation of non-
flow measures may support adaptive adjustments to the required flow within the adaptive
range of 30 to 50 percent of unimpaired flow, as long as the criteria for such adjustments are
met.
The flow proposal also provides a framework for accepting local agreements with alternative
methods for enhancing fish and wildlife in the tributaries. The State Water Board recognizes that
voluntary agreements can help inform and expedite implementation of flow objectives and can
provide durable solutions in the Delta Watershed. In addition, the State Water Board believes that
3 Depending on the context, the terms non-flow measures and non-flow actions may be used interchangeably in this document.
State Water Resources Control Board California Environmental Protection Agency
Executive Summary
Evaluation of San Joaquin River Flow and Southern Delta Water Quality Objectives and Implementation
ES-5 September 2016
ICF 00427.11
suitable voluntary agreements can provide reasonable protections for fish and wildlife and provide
a faster and more durable implementation route if done correctly. As a result, the State Water Board
encourages stakeholders to work together to reach voluntary agreements incorporating a mix of
flow and non-flow measures that meet or exceed the proposed objectives and protect fish and
wildlife uses.
The State Water Board will consider a voluntary agreement as part of its proceedings to implement
the plan amendments, consistent with its obligations under applicable law. In evaluating any
proposal, the State Water Board will consider whether the agreement will help achieve the water
quality objectives, help protect the beneficial use, and be enforceable through Board action.
The recommended amendment to the southern Delta salinity objective (southern Delta salinity
proposal) would eliminate the seasonal element of the current objective by changing the objective to
1.0 deciSiemens per meter (dS/m)4 year-round. Although the proposed April–August salinity
objective is higher than the current 0.7 dS/m objective, the revised water quality objectives coupled
with the implementation measures included in the proposed plan update would provide the same or
better conditions for agricultural uses in the Delta compared to existing conditions through the
continuation, or improvement, of existing management actions, including maintenance of water
levels. The proposal includes requirements that the State Water Project (SWP) and Central Valley
Project (CVP) address the impacts of their export operations on water levels and flow conditions
that may affect salinity conditions in the southern Delta, including the availability of assimilative
capacity for local sources of salinity. USBR would also continue to be required to maintain a salinity
of 0.7 dS/m, April through August at Vernalis, as a condition of their water right, in order to
implement and meet the proposed salinity water quality objectives in the interior southern Delta.
The southern Delta salinity proposal would also replace the three current fixed points for
monitoring southern Delta salinity compliance, and instead identifies three extended channel
segments for monitoring conditions and measuring compliance.
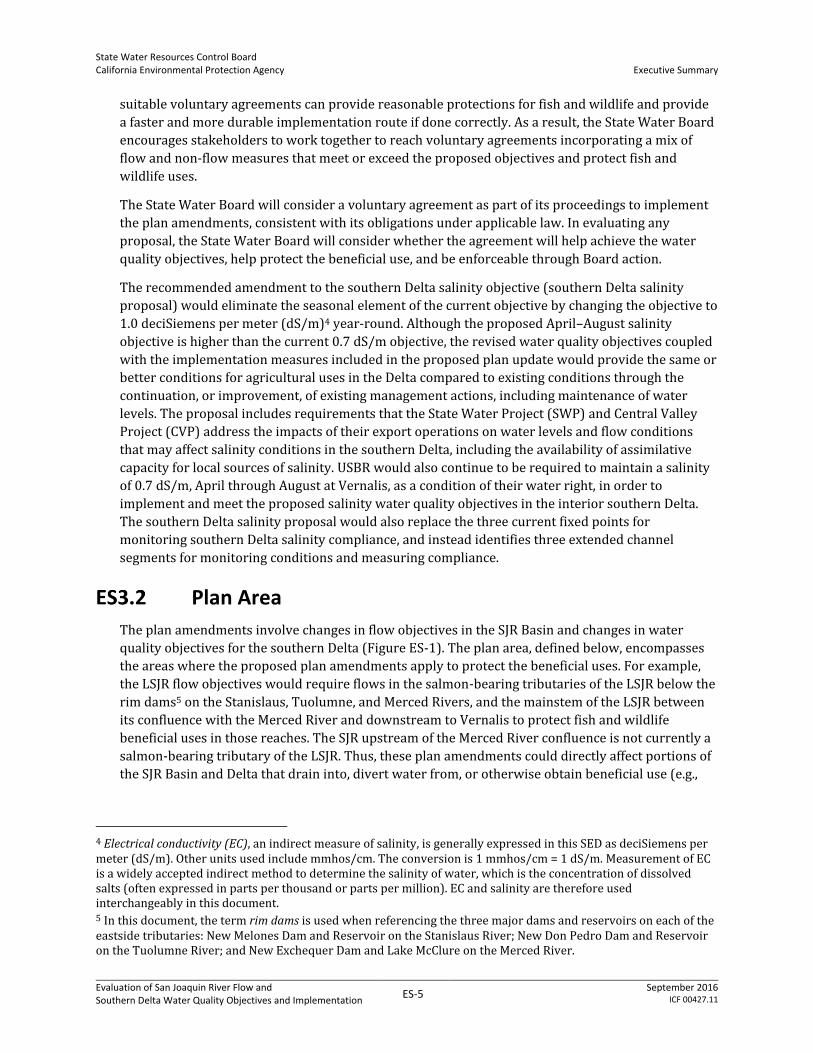
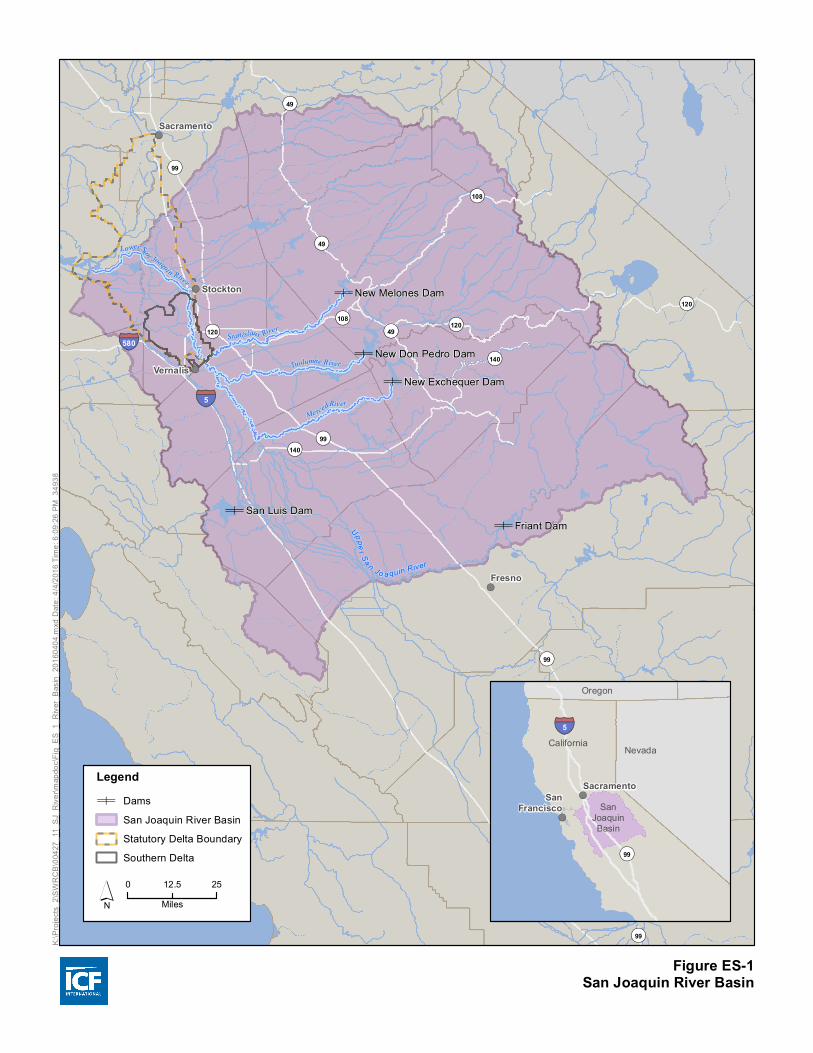
Plan Area
The plan amendments involve changes in flow objectives in the SJR Basin and changes in water
quality objectives for the southern Delta (Figure ES-1). The plan area, defined below, encompasses
the areas where the proposed plan amendments apply to protect the beneficial uses. For example,
the LSJR flow objectives would require flows in the salmon-bearing tributaries of the LSJR below the
rim dams5 on the Stanislaus, Tuolumne, and Merced Rivers, and the mainstem of the LSJR between
its confluence with the Merced River and downstream to Vernalis to protect fish and wildlife
beneficial uses in those reaches. The SJR upstream of the Merced River confluence is not currently a
salmon-bearing tributary of the LSJR. Thus, these plan amendments could directly affect portions of
the SJR Basin and Delta that drain into, divert water from, or otherwise obtain beneficial use (e.g.,
4 Electrical conductivity (EC), an indirect measure of salinity, is generally expressed in this SED as deciSiemens per meter (dS/m). Other units used include mmhos/cm. The conversion is 1 mmhos/cm = 1 dS/m. Measurement of EC is a widely accepted indirect method to determine the salinity of water, which is the concentration of dissolved salts (often expressed in parts per thousand or parts per million). EC and salinity are therefore used interchangeably in this document. 5 In this document, the term rim dams is used when referencing the three major dams and reservoirs on each of the eastside tributaries: New Melones Dam and Reservoir on the Stanislaus River; New Don Pedro Dam and Reservoir on the Tuolumne River; and New Exchequer Dam and Lake McClure on the Merced River.
State Water Resources Control Board California Environmental Protection Agency
Executive Summary
Evaluation of San Joaquin River Flow and Southern Delta Water Quality Objectives and Implementation
ES-6 September 2016
ICF 00427.11
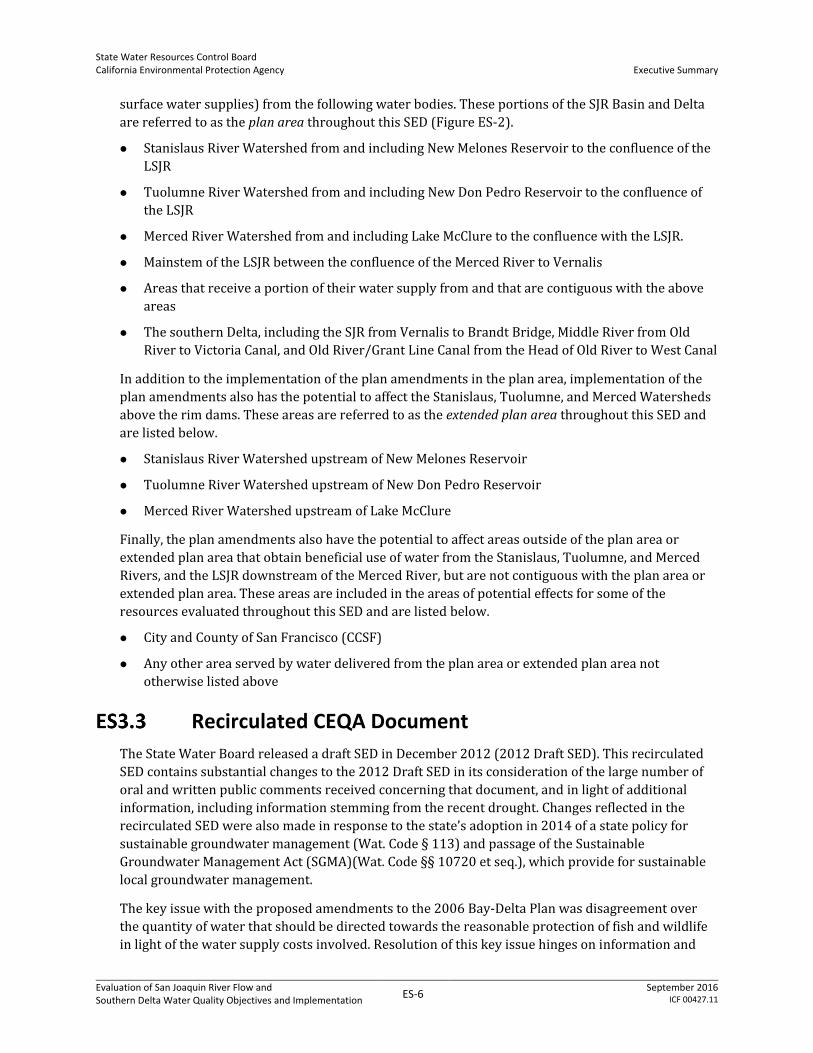
surface water supplies) from the following water bodies. These portions of the SJR Basin and Delta
are referred to as the plan area throughout this SED (Figure ES-2).
Stanislaus River Watershed from and including New Melones Reservoir to the confluence of the
LSJR
Tuolumne River Watershed from and including New Don Pedro Reservoir to the confluence of
the LSJR
Merced River Watershed from and including Lake McClure to the confluence with the LSJR.
Mainstem of the LSJR between the confluence of the Merced River to Vernalis
Areas that receive a portion of their water supply from and that are contiguous with the above
areas
The southern Delta, including the SJR from Vernalis to Brandt Bridge, Middle River from Old
River to Victoria Canal, and Old River/Grant Line Canal from the Head of Old River to West Canal
In addition to the implementation of the plan amendments in the plan area, implementation of the
plan amendments also has the potential to affect the Stanislaus, Tuolumne, and Merced Watersheds
above the rim dams. These areas are referred to as the extended plan area throughout this SED and
are listed below.
Stanislaus River Watershed upstream of New Melones Reservoir
Tuolumne River Watershed upstream of New Don Pedro Reservoir
Merced River Watershed upstream of Lake McClure
Finally, the plan amendments also have the potential to affect areas outside of the plan area or
extended plan area that obtain beneficial use of water from the Stanislaus, Tuolumne, and Merced
Rivers, and the LSJR downstream of the Merced River, but are not contiguous with the plan area or
extended plan area. These areas are included in the areas of potential effects for some of the
resources evaluated throughout this SED and are listed below.
City and County of San Francisco (CCSF)
Any other area served by water delivered from the plan area or extended plan area not
otherwise listed above
Recirculated CEQA Document
The State Water Board released a draft SED in December 2012 (2012 Draft SED). This recirculated
SED contains substantial changes to the 2012 Draft SED in its consideration of the large number of
oral and written public comments received concerning that document, and in light of additional
information, including information stemming from the recent drought. Changes reflected in the
recirculated SED were also made in response to the state’s adoption in 2014 of a state policy for
sustainable groundwater management (Wat. Code § 113) and passage of the Sustainable
Groundwater Management Act (SGMA)(Wat. Code §§ 10720 et seq.), which provide for sustainable
local groundwater management.
The key issue with the proposed amendments to the 2006 Bay-Delta Plan was disagreement over
the quantity of water that should be directed towards the reasonable protection of fish and wildlife
in light of the water supply costs involved. Resolution of this key issue hinges on information and
!(
!(
!(
!(
'
'
'
'
'
'Uppe r Sa n Jo aquin River
Stani slaus River
Lower San Joaquin River
Tuolumne River
MercedRiver
¬«99
¬«140
¬«99
¬«49
¬«120
¬«99
¬«49
¬«108
¬«140
¬«99
¬«120
¬«108
¬«49 ¬«120
§̈¦580
§̈¦5
Stockton
Vernalis
Fresno
Sacramento
New Don Pedro Dam
Friant Dam
New Exchequer Dam
New Melones Dam
San Luis Dam
Figure ES-1San Joaquin River Basin
K:\Pr
ojects
_2\SW
RCB\
0042
7_11
_SJ_
River\
mapd
oc\Fi
g_ES
_1_R
iver_B
asin_
2016
0404
.mxd
Date
: 4/4/
2016
Time
: 6:09
:26 PM
349
38
!(
!(
California
Oregon
Nevada
SanJoaquinBasin
¬«99
§̈¦5
SanFrancisco
SacramentoLegend'Dams
San Joaquin River BasinStatutory Delta BoundarySouthern Delta
´0 2512.5
Miles
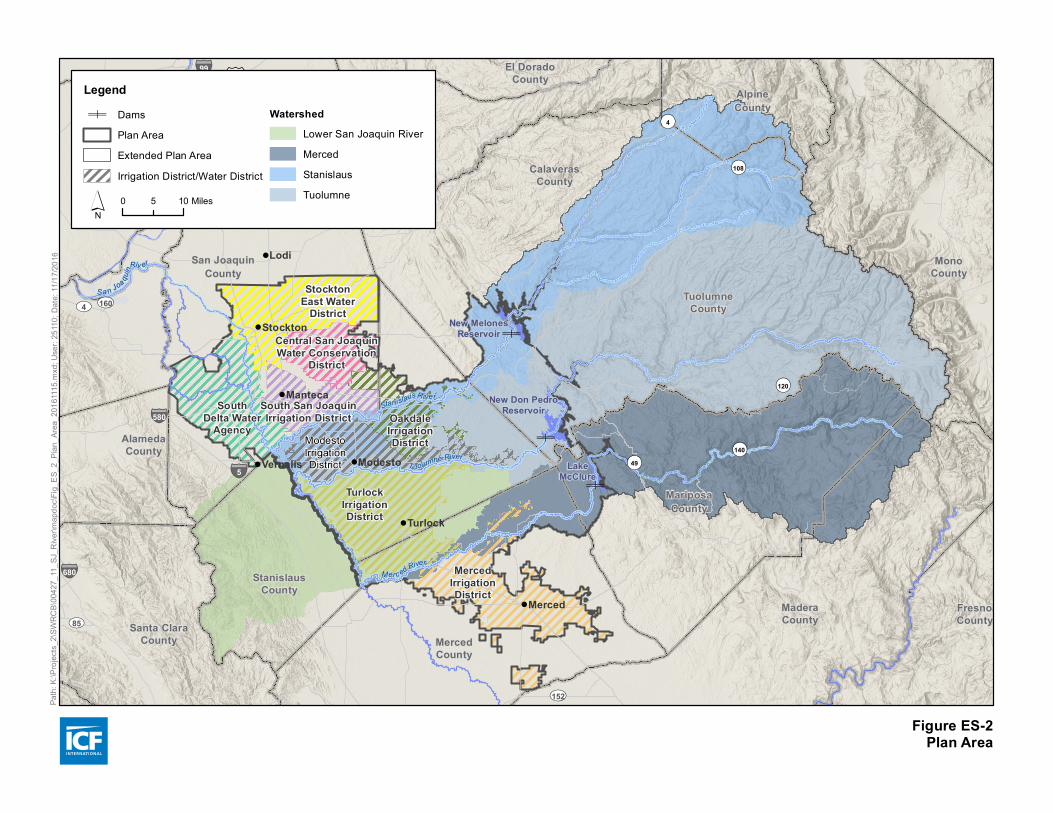
Figure ES-2Plan Area
Path:
K:\Pr
ojects
_2\SW
RCB\0
0427
_11_
SJ_R
iver\m
apdo
c\Fig_
ES_2
_Plan
_Area
_201
6111
5.mxd
; Use
r: 251
10; D
ate: 1
1/17/2
016 !
!
!
!
! !
!
!
'
'
'New MelonesReservoir
New Don PedroReservoir
LakeMcClure
South San JoaquinIrrigation District
Tuolumne River
Mer c ed River
Sa n Joa quinRiv er
Stanislaus River
TurlockIrrigationDistrict
OakdaleIrrigationDistrict
MercedIrrigationDistrict
SouthDelta Water
Agency
StocktonEast Water
District
Central San JoaquinWater Conservation
District
El DoradoCounty
YoloCounty
AlpineCounty
SacramentoCounty
MonoCounty
AmadorCounty
CalaverasCounty
TuolumneCounty
San JoaquinCounty
StanislausCounty
AlamedaCounty
MariposaCounty
MaderaCounty
MercedCounty
FresnoCountySanta Clara
County
¬«140
¬«4
¬«108
¬«49
¬«120
UV85
UV160UV4
UV152
£¤50§̈¦80
§̈¦5
§̈¦99
§̈¦680
§̈¦580
Lodi
Stockton
Manteca
Vernalis Modesto
Turlock
Merced
ModestoIrrigationDistrict
Legend'Dams
Plan AreaExtended Plan AreaIrrigation District/Water District
WatershedLower San Joaquin RiverMercedStanislausTuolumne0 105 Miles´
State Water Resources Control Board California Environmental Protection Agency
Executive Summary
Evaluation of San Joaquin River Flow and Southern Delta Water Quality Objectives and Implementation
ES-7 September 2016
ICF 00427.11
analyses, supported by substantial evidence in the record that can be used to evaluate the tradeoffs.
Following are the principal areas of concern with information and analyses in the 2012 Draft SED,
each of which is addressed in this recirculated document.
Explain and improve reservoir operation assumptions and surface/groundwater water supply
and quality effects
Clarify use of adaptive implementation
Analyze dry year and consecutive dry years
Clarify plan area
Add non-flow measures
Analyze effects on CCSF
Identify and quantify benefits of the plan amendments on fish and wildlife
Analyze effects of the plan amendments on municipal water treatment and water supplies
A brief description of these and other issues, and the changes made in response to the issues raised
regarding the 2012 Draft SED, are provided in Section ES9, Areas of Known Controversy and Changes
Made to the 2012 Draft Substitute Environmental Document. In particular, in light of the potential
surface water and groundwater effects and costs associated with the proposed Bay-Delta Plan flow
objectives, this executive summary provides an expanded description of the effects and costs of, and
benefits expected from, implementing the flow objectives.
This SED has been substantially revised to address the principal areas of concern and the comments
that were received on the 2012 Draft SED; therefore this recirculated document does not provide a
written response to those comments. Comments received on the 2012 Draft SED are in the
administrative record. The State Water Board will respond to the new comments submitted for the
recirculated SED.
Purpose, Need, and Goals The 2006 Bay-Delta Plan designates beneficial uses of water, establishes water quality objectives for
the reasonable protection of those beneficial uses, and outlines a program of implementation for
achieving the water quality objectives. The program of implementation contains actions that the
State Water Board will undertake, including monitoring and special studies, to achieve the
objectives and measure their benefits to fish and wildlife. It also provides recommendations of
actions other entities can take that will contribute to achieving the overall goal of improving
conditions for fish and wildlife. The underlying fundamental project purpose and goal of the plan of
the plan amendments are as follows.
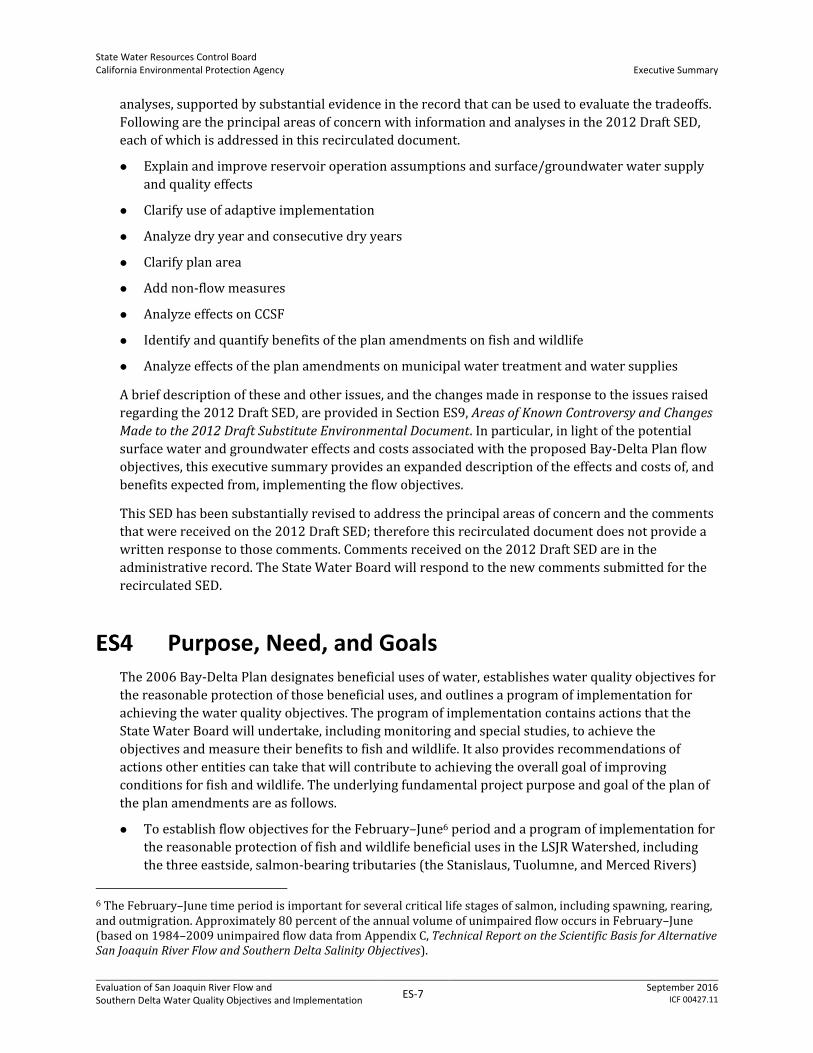
To establish flow objectives for the February–June6 period and a program of implementation for
the reasonable protection of fish and wildlife beneficial uses in the LSJR Watershed, including
the three eastside, salmon-bearing tributaries (the Stanislaus, Tuolumne, and Merced Rivers)
6 The February–June time period is important for several critical life stages of salmon, including spawning, rearing, and outmigration. Approximately 80 percent of the annual volume of unimpaired flow occurs in February–June (based on 1984–2009 unimpaired flow data from Appendix C, Technical Report on the Scientific Basis for Alternative San Joaquin River Flow and Southern Delta Salinity Objectives).
State Water Resources Control Board California Environmental Protection Agency
Executive Summary
Evaluation of San Joaquin River Flow and Southern Delta Water Quality Objectives and Implementation
ES-8 September 2016
ICF 00427.11
To establish salinity objectives for the reasonable protection of southern Delta agricultural
beneficial uses and a program of implementation to achieve the objectives
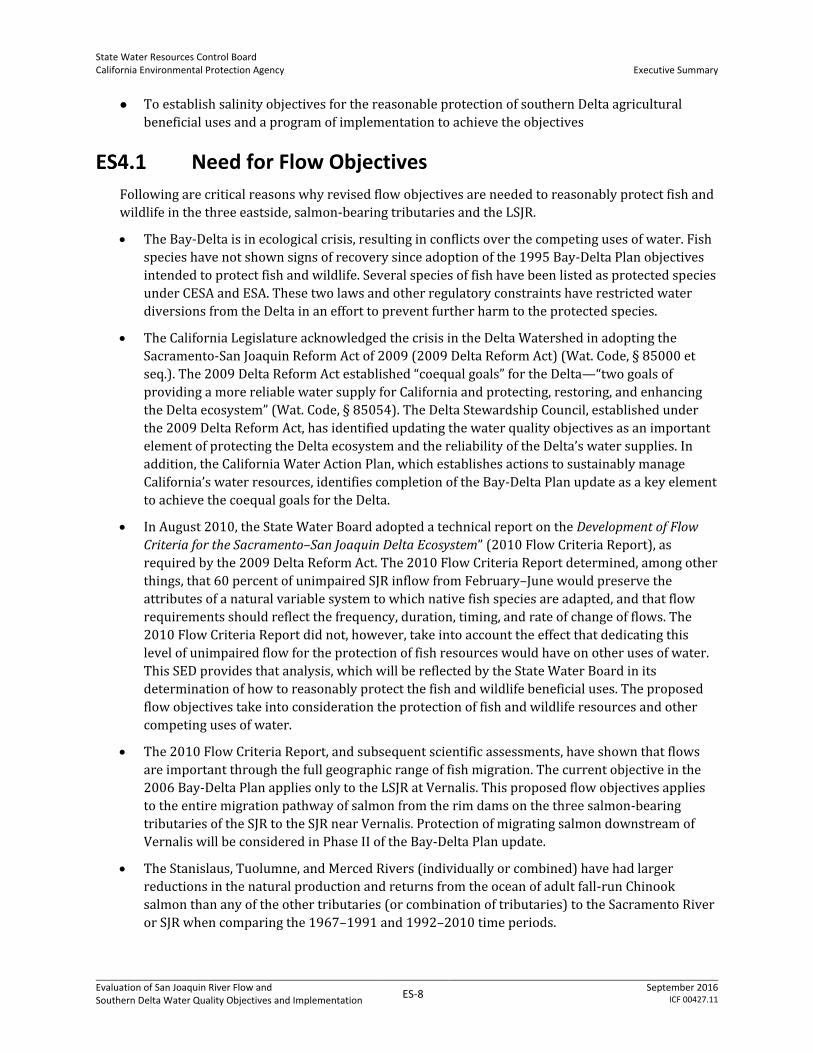
Need for Flow Objectives
Following are critical reasons why revised flow objectives are needed to reasonably protect fish and
wildlife in the three eastside, salmon-bearing tributaries and the LSJR.
The Bay-Delta is in ecological crisis, resulting in conflicts over the competing uses of water. Fish
species have not shown signs of recovery since adoption of the 1995 Bay-Delta Plan objectives
intended to protect fish and wildlife. Several species of fish have been listed as protected species
under CESA and ESA. These two laws and other regulatory constraints have restricted water
diversions from the Delta in an effort to prevent further harm to the protected species.
The California Legislature acknowledged the crisis in the Delta Watershed in adopting the
Sacramento-San Joaquin Reform Act of 2009 (2009 Delta Reform Act) (Wat. Code, § 85000 et
seq.). The 2009 Delta Reform Act established “coequal goals” for the Delta—“two goals of
providing a more reliable water supply for California and protecting, restoring, and enhancing
the Delta ecosystem” (Wat. Code, § 85054). The Delta Stewardship Council, established under
the 2009 Delta Reform Act, has identified updating the water quality objectives as an important
element of protecting the Delta ecosystem and the reliability of the Delta’s water supplies. In
addition, the California Water Action Plan, which establishes actions to sustainably manage
California’s water resources, identifies completion of the Bay-Delta Plan update as a key element
to achieve the coequal goals for the Delta.
In August 2010, the State Water Board adopted a technical report on the Development of Flow
Criteria for the Sacramento–San Joaquin Delta Ecosystem” (2010 Flow Criteria Report), as
required by the 2009 Delta Reform Act. The 2010 Flow Criteria Report determined, among other
things, that 60 percent of unimpaired SJR inflow from February–June would preserve the
attributes of a natural variable system to which native fish species are adapted, and that flow
requirements should reflect the frequency, duration, timing, and rate of change of flows. The
2010 Flow Criteria Report did not, however, take into account the effect that dedicating this
level of unimpaired flow for the protection of fish resources would have on other uses of water.
This SED provides that analysis, which will be reflected by the State Water Board in its
determination of how to reasonably protect the fish and wildlife beneficial uses. The proposed
flow objectives take into consideration the protection of fish and wildlife resources and other
competing uses of water.
The 2010 Flow Criteria Report, and subsequent scientific assessments, have shown that flows
are important through the full geographic range of fish migration. The current objective in the
2006 Bay-Delta Plan applies only to the LSJR at Vernalis. This proposed flow objectives applies
to the entire migration pathway of salmon from the rim dams on the three salmon-bearing
tributaries of the SJR to the SJR near Vernalis. Protection of migrating salmon downstream of
Vernalis will be considered in Phase II of the Bay-Delta Plan update.
The Stanislaus, Tuolumne, and Merced Rivers (individually or combined) have had larger
reductions in the natural production and returns from the ocean of adult fall-run Chinook
salmon than any of the other tributaries (or combination of tributaries) to the Sacramento River
or SJR when comparing the 1967–1991 and 1992–2010 time periods.
State Water Resources Control Board California Environmental Protection Agency
Executive Summary
Evaluation of San Joaquin River Flow and Southern Delta Water Quality Objectives and Implementation
ES-9 September 2016
ICF 00427.11
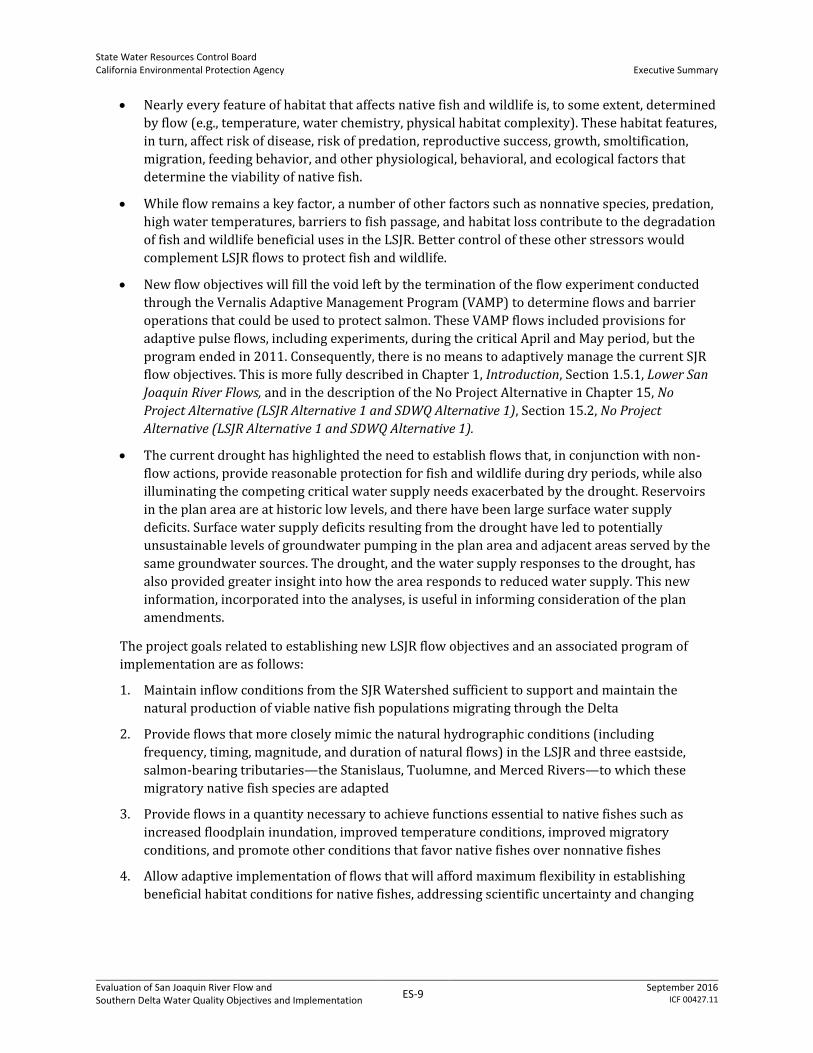
Nearly every feature of habitat that affects native fish and wildlife is, to some extent, determined
by flow (e.g., temperature, water chemistry, physical habitat complexity). These habitat features,
in turn, affect risk of disease, risk of predation, reproductive success, growth, smoltification,
migration, feeding behavior, and other physiological, behavioral, and ecological factors that
determine the viability of native fish.
While flow remains a key factor, a number of other factors such as nonnative species, predation,
high water temperatures, barriers to fish passage, and habitat loss contribute to the degradation
of fish and wildlife beneficial uses in the LSJR. Better control of these other stressors would
complement LSJR flows to protect fish and wildlife.
New flow objectives will fill the void left by the termination of the flow experiment conducted
through the Vernalis Adaptive Management Program (VAMP) to determine flows and barrier
operations that could be used to protect salmon. These VAMP flows included provisions for
adaptive pulse flows, including experiments, during the critical April and May period, but the
program ended in 2011. Consequently, there is no means to adaptively manage the current SJR
flow objectives. This is more fully described in Chapter 1, Introduction, Section 1.5.1, Lower San
Joaquin River Flows, and in the description of the No Project Alternative in Chapter 15, No
Project Alternative (LSJR Alternative 1 and SDWQ Alternative 1), Section 15.2, No Project
Alternative (LSJR Alternative 1 and SDWQ Alternative 1).
The current drought has highlighted the need to establish flows that, in conjunction with non-
flow actions, provide reasonable protection for fish and wildlife during dry periods, while also
illuminating the competing critical water supply needs exacerbated by the drought. Reservoirs
in the plan area are at historic low levels, and there have been large surface water supply
deficits. Surface water supply deficits resulting from the drought have led to potentially
unsustainable levels of groundwater pumping in the plan area and adjacent areas served by the
same groundwater sources. The drought, and the water supply responses to the drought, has
also provided greater insight into how the area responds to reduced water supply. This new
information, incorporated into the analyses, is useful in informing consideration of the plan
amendments.
The project goals related to establishing new LSJR flow objectives and an associated program of
implementation are as follows:
1. Maintain inflow conditions from the SJR Watershed sufficient to support and maintain the
natural production of viable native fish populations migrating through the Delta
2. Provide flows that more closely mimic the natural hydrographic conditions (including
frequency, timing, magnitude, and duration of natural flows) in the LSJR and three eastside,
salmon-bearing tributaries—the Stanislaus, Tuolumne, and Merced Rivers—to which these
migratory native fish species are adapted
3. Provide flows in a quantity necessary to achieve functions essential to native fishes such as
increased floodplain inundation, improved temperature conditions, improved migratory
conditions, and promote other conditions that favor native fishes over nonnative fishes
4. Allow adaptive implementation of flows that will afford maximum flexibility in establishing
beneficial habitat conditions for native fishes, addressing scientific uncertainty and changing

State Water Resources Control Board California Environmental Protection Agency
Executive Summary
Evaluation of San Joaquin River Flow and Southern Delta Water Quality Objectives and Implementation
ES-10 September 2016
ICF 00427.11
conditions, developing scientific information that will inform future management of flows, and
meeting biological goals,7 while still reasonably protecting the fish and wildlife beneficial uses
5. Promote transparency in decision-making and provide certainty to the regulated community by
expressing flow requirements for the protection of fish and wildlife as a share of the total
quantity of water available for all beneficial uses
6. In establishing flow water quality objectives to reasonably protect fish and wildlife, take into
consideration all of the demands being made and to be made on waters in the LSJR and the three
eastside, salmon-bearing tributaries and the factors to be considered for establishing water
quality objectives in Water Code section 13241, including, but not limited to, past, present and
probable future beneficial uses and economic considerations.
7. Provide for the development and implementation of an appropriate monitoring and evaluation
program to inform adaptive implementation of LSJR flows and future changes to the Bay-Delta
Plan
8. Provide for and encourage collaboration, coordination, and integration of regulatory, scientific,
and management processes related to LSJR flows
Need for Updated Salinity Objectives
Following are critical reasons that an update is needed now to reasonably protect agriculture in the
southern Delta.
Recent scientific information (see Appendix C, Technical Report on the Scientific Basis for
Alternative San Joaquin River Flow and Southern Delta Salinity Objectives) indicates that the
current objectives are more stringent than needed to reasonably protect the beneficial use.
This plan amendment carries out the State Water Board’s commitment to review the southern
Delta salinity objectives in light of litigation. This is more fully described in Chapter 1,
Introduction, Section 1.5.3, Related Litigation.
The permanent operable barriers envisioned by the South Delta Improvements Program are a
critical piece of infrastructure that was intended to provide protection of salinity and water
levels in the southern Delta. These operational barriers are no longer likely to be built because
of endangered species concerns, so this infrastructure solution is no longer potentially available
to protect southern Delta agriculture.
Attainment of current salinity objectives in the southern Delta has been difficult because of the
complex interaction of upstream salinity sources, including salts imported to the SJR Basin in
irrigation water; municipal discharges; poor circulation in southern Delta channels; and water
diversions and discharges from agricultural drainage. The challenge of meeting salinity
objectives is compounded by use of compliance locations in the interior southern Delta that are
not optimally situated to assess salinity over a wide area in a tidal environment that is subject to
reverse flows. Therefore, salinity measurement at these locations are not reflective of the
protection of the agricultural beneficial use. The three interior southern Delta salinity
7 Biological goals are outcomes that can be measured to determine the response of salmon and other species to flows and other actions, and include such things as abundance, productivity as measured by population growth rate; genetic and life history diversity; and population spatial extent, distribution, and structure of salmon. As explained in Section ES3.2, Lower San Joaquin River (LSJR) Alternatives, biological goals will be used to inform adaptive implementation, including changes to the flow percent required, within the adaptive range.
State Water Resources Control Board California Environmental Protection Agency
Executive Summary
Evaluation of San Joaquin River Flow and Southern Delta Water Quality Objectives and Implementation
ES-11 September 2016
ICF 00427.11
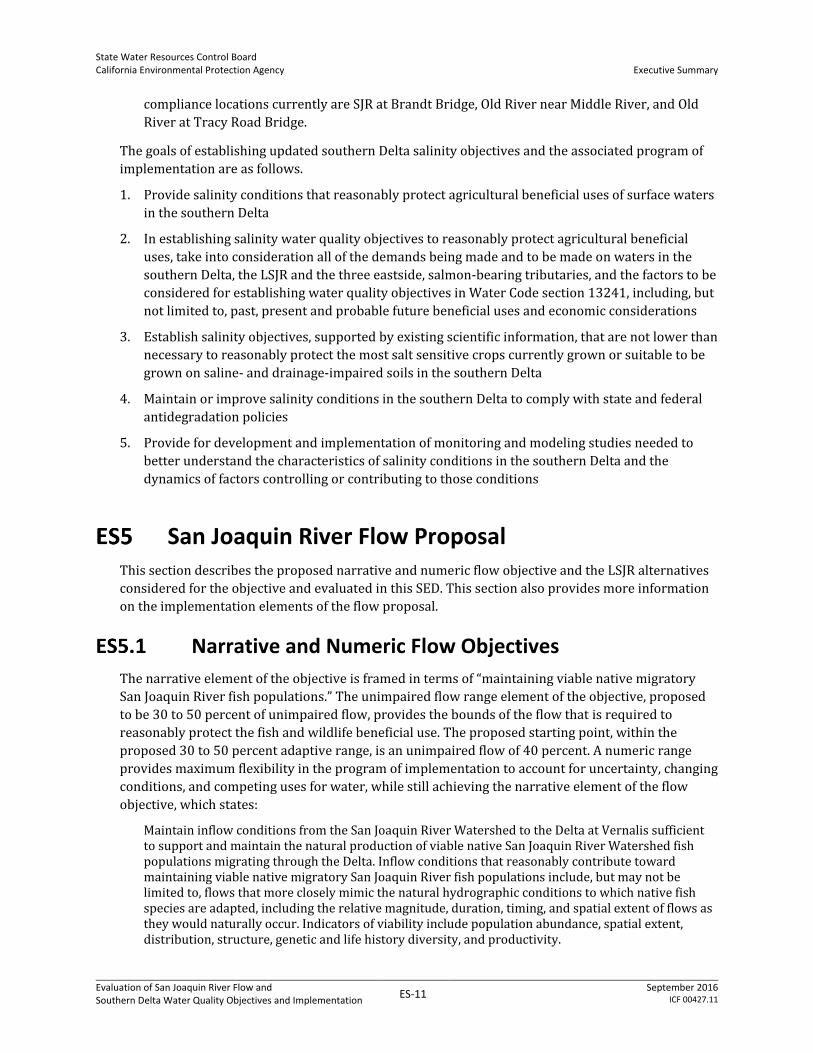
compliance locations currently are SJR at Brandt Bridge, Old River near Middle River, and Old
River at Tracy Road Bridge.
The goals of establishing updated southern Delta salinity objectives and the associated program of
implementation are as follows.
1. Provide salinity conditions that reasonably protect agricultural beneficial uses of surface waters
in the southern Delta
2. In establishing salinity water quality objectives to reasonably protect agricultural beneficial
uses, take into consideration all of the demands being made and to be made on waters in the
southern Delta, the LSJR and the three eastside, salmon-bearing tributaries, and the factors to be
considered for establishing water quality objectives in Water Code section 13241, including, but
not limited to, past, present and probable future beneficial uses and economic considerations
3. Establish salinity objectives, supported by existing scientific information, that are not lower than
necessary to reasonably protect the most salt sensitive crops currently grown or suitable to be
grown on saline- and drainage-impaired soils in the southern Delta
4. Maintain or improve salinity conditions in the southern Delta to comply with state and federal
antidegradation policies
5. Provide for development and implementation of monitoring and modeling studies needed to
better understand the characteristics of salinity conditions in the southern Delta and the
dynamics of factors controlling or contributing to those conditions
San Joaquin River Flow Proposal This section describes the proposed narrative and numeric flow objective and the LSJR alternatives
considered for the objective and evaluated in this SED. This section also provides more information
on the implementation elements of the flow proposal.
Narrative and Numeric Flow Objectives
The narrative element of the objective is framed in terms of “maintaining viable native migratory
San Joaquin River fish populations.” The unimpaired flow range element of the objective, proposed
to be 30 to 50 percent of unimpaired flow, provides the bounds of the flow that is required to
reasonably protect the fish and wildlife beneficial use. The proposed starting point, within the
proposed 30 to 50 percent adaptive range, is an unimpaired flow of 40 percent. A numeric range
provides maximum flexibility in the program of implementation to account for uncertainty, changing
conditions, and competing uses for water, while still achieving the narrative element of the flow
objective, which states:
Maintain inflow conditions from the San Joaquin River Watershed to the Delta at Vernalis sufficient to support and maintain the natural production of viable native San Joaquin River Watershed fish populations migrating through the Delta. Inflow conditions that reasonably contribute toward maintaining viable native migratory San Joaquin River fish populations include, but may not be limited to, flows that more closely mimic the natural hydrographic conditions to which native fish species are adapted, including the relative magnitude, duration, timing, and spatial extent of flows as they would naturally occur. Indicators of viability include population abundance, spatial extent, distribution, structure, genetic and life history diversity, and productivity.
State Water Resources Control Board California Environmental Protection Agency
Executive Summary
Evaluation of San Joaquin River Flow and Southern Delta Water Quality Objectives and Implementation
ES-12 September 2016
ICF 00427.11
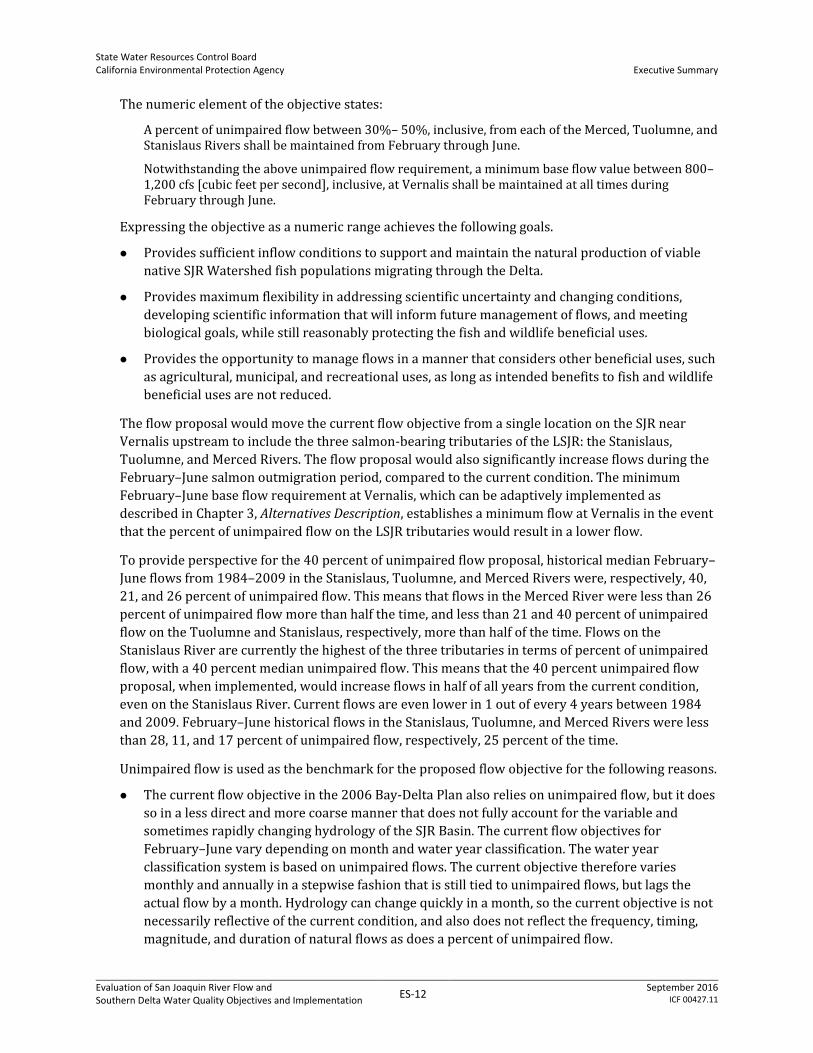
The numeric element of the objective states:
A percent of unimpaired flow between 30%– 50%, inclusive, from each of the Merced, Tuolumne, and Stanislaus Rivers shall be maintained from February through June.
Notwithstanding the above unimpaired flow requirement, a minimum base flow value between 800–1,200 cfs [cubic feet per second], inclusive, at Vernalis shall be maintained at all times during February through June.
Expressing the objective as a numeric range achieves the following goals.
Provides sufficient inflow conditions to support and maintain the natural production of viable
native SJR Watershed fish populations migrating through the Delta.
Provides maximum flexibility in addressing scientific uncertainty and changing conditions,
developing scientific information that will inform future management of flows, and meeting
biological goals, while still reasonably protecting the fish and wildlife beneficial uses.
Provides the opportunity to manage flows in a manner that considers other beneficial uses, such
as agricultural, municipal, and recreational uses, as long as intended benefits to fish and wildlife
beneficial uses are not reduced.
The flow proposal would move the current flow objective from a single location on the SJR near
Vernalis upstream to include the three salmon-bearing tributaries of the LSJR: the Stanislaus,
Tuolumne, and Merced Rivers. The flow proposal would also significantly increase flows during the
February–June salmon outmigration period, compared to the current condition. The minimum
February–June base flow requirement at Vernalis, which can be adaptively implemented as
described in Chapter 3, Alternatives Description, establishes a minimum flow at Vernalis in the event
that the percent of unimpaired flow on the LSJR tributaries would result in a lower flow.
To provide perspective for the 40 percent of unimpaired flow proposal, historical median February–
June flows from 1984–2009 in the Stanislaus, Tuolumne, and Merced Rivers were, respectively, 40,
21, and 26 percent of unimpaired flow. This means that flows in the Merced River were less than 26
percent of unimpaired flow more than half the time, and less than 21 and 40 percent of unimpaired
flow on the Tuolumne and Stanislaus, respectively, more than half of the time. Flows on the
Stanislaus River are currently the highest of the three tributaries in terms of percent of unimpaired
flow, with a 40 percent median unimpaired flow. This means that the 40 percent unimpaired flow
proposal, when implemented, would increase flows in half of all years from the current condition,
even on the Stanislaus River. Current flows are even lower in 1 out of every 4 years between 1984
and 2009. February–June historical flows in the Stanislaus, Tuolumne, and Merced Rivers were less
than 28, 11, and 17 percent of unimpaired flow, respectively, 25 percent of the time.
Unimpaired flow is used as the benchmark for the proposed flow objective for the following reasons.
The current flow objective in the 2006 Bay-Delta Plan also relies on unimpaired flow, but it does
so in a less direct and more coarse manner that does not fully account for the variable and
sometimes rapidly changing hydrology of the SJR Basin. The current flow objectives for
February–June vary depending on month and water year classification. The water year
classification system is based on unimpaired flows. The current objective therefore varies
monthly and annually in a stepwise fashion that is still tied to unimpaired flows, but lags the
actual flow by a month. Hydrology can change quickly in a month, so the current objective is not
necessarily reflective of the current condition, and also does not reflect the frequency, timing,
magnitude, and duration of natural flows as does a percent of unimpaired flow.
State Water Resources Control Board California Environmental Protection Agency
Executive Summary
Evaluation of San Joaquin River Flow and Southern Delta Water Quality Objectives and Implementation
ES-13 September 2016
ICF 00427.11
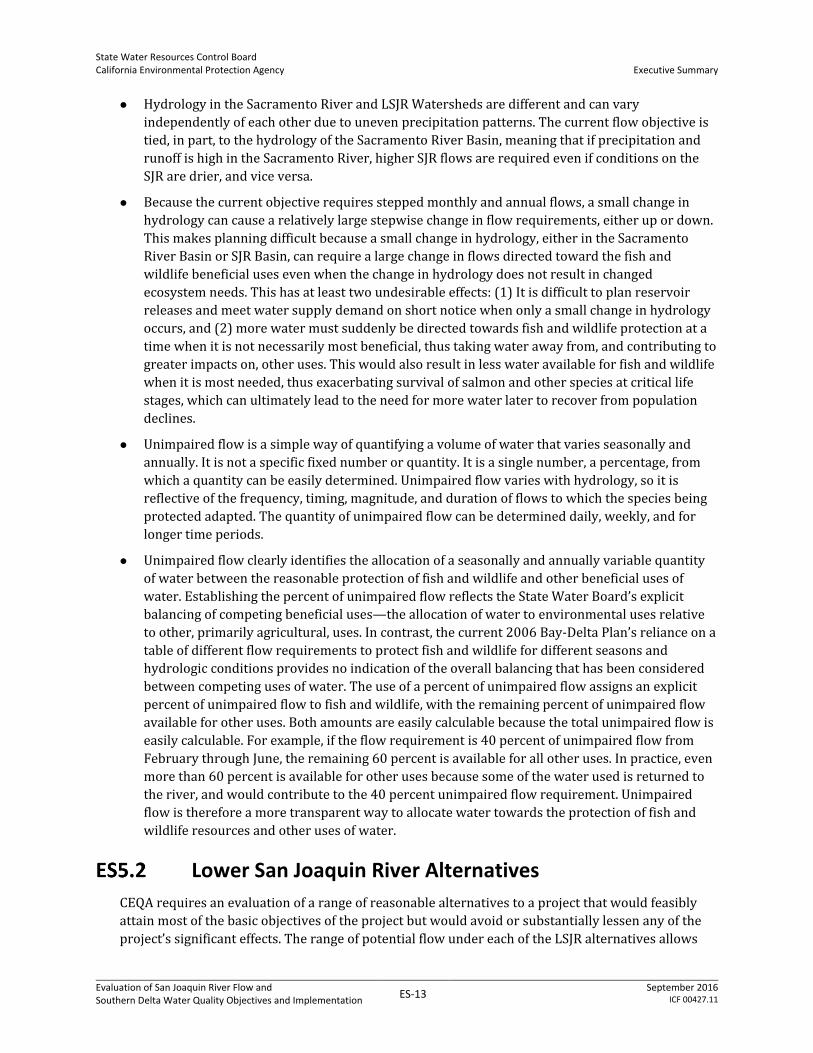
Hydrology in the Sacramento River and LSJR Watersheds are different and can vary
independently of each other due to uneven precipitation patterns. The current flow objective is
tied, in part, to the hydrology of the Sacramento River Basin, meaning that if precipitation and
runoff is high in the Sacramento River, higher SJR flows are required even if conditions on the
SJR are drier, and vice versa.
Because the current objective requires stepped monthly and annual flows, a small change in
hydrology can cause a relatively large stepwise change in flow requirements, either up or down.
This makes planning difficult because a small change in hydrology, either in the Sacramento
River Basin or SJR Basin, can require a large change in flows directed toward the fish and
wildlife beneficial uses even when the change in hydrology does not result in changed
ecosystem needs. This has at least two undesirable effects: (1) It is difficult to plan reservoir
releases and meet water supply demand on short notice when only a small change in hydrology
occurs, and (2) more water must suddenly be directed towards fish and wildlife protection at a
time when it is not necessarily most beneficial, thus taking water away from, and contributing to
greater impacts on, other uses. This would also result in less water available for fish and wildlife
when it is most needed, thus exacerbating survival of salmon and other species at critical life
stages, which can ultimately lead to the need for more water later to recover from population
declines.
Unimpaired flow is a simple way of quantifying a volume of water that varies seasonally and
annually. It is not a specific fixed number or quantity. It is a single number, a percentage, from
which a quantity can be easily determined. Unimpaired flow varies with hydrology, so it is
reflective of the frequency, timing, magnitude, and duration of flows to which the species being
protected adapted. The quantity of unimpaired flow can be determined daily, weekly, and for
longer time periods.
Unimpaired flow clearly identifies the allocation of a seasonally and annually variable quantity
of water between the reasonable protection of fish and wildlife and other beneficial uses of
water. Establishing the percent of unimpaired flow reflects the State Water Board’s explicit
balancing of competing beneficial uses—the allocation of water to environmental uses relative
to other, primarily agricultural, uses. In contrast, the current 2006 Bay-Delta Plan’s reliance on a
table of different flow requirements to protect fish and wildlife for different seasons and
hydrologic conditions provides no indication of the overall balancing that has been considered
between competing uses of water. The use of a percent of unimpaired flow assigns an explicit
percent of unimpaired flow to fish and wildlife, with the remaining percent of unimpaired flow
available for other uses. Both amounts are easily calculable because the total unimpaired flow is
easily calculable. For example, if the flow requirement is 40 percent of unimpaired flow from
February through June, the remaining 60 percent is available for all other uses. In practice, even
more than 60 percent is available for other uses because some of the water used is returned to
the river, and would contribute to the 40 percent unimpaired flow requirement. Unimpaired
flow is therefore a more transparent way to allocate water towards the protection of fish and
wildlife resources and other uses of water.
Lower San Joaquin River Alternatives
CEQA requires an evaluation of a range of reasonable alternatives to a project that would feasibly
attain most of the basic objectives of the project but would avoid or substantially lessen any of the
project’s significant effects. The range of potential flow under each of the LSJR alternatives allows
State Water Resources Control Board California Environmental Protection Agency
Executive Summary
Evaluation of San Joaquin River Flow and Southern Delta Water Quality Objectives and Implementation
ES-14 September 2016
ICF 00427.11
the evaluation of alternatives that would attain the project’s objective of providing inflows while
also reducing any significant effects of the project. This SED evaluates four alternatives for LSJR
flows during the February–June time frame, including the No Project Alternative (LSJR Alternative 1
and SDWQ Alternative 1), and three other LSJR alternatives (LSJR Alternatives 2, 3, and 4). LSJR
Alternatives 2, 3 and 4 includes an unimpaired flow range (e.g., 30 percent to 50 percent under LSJR
Alternative 3), and the ability to adaptively manage flows within this range. LSJR Alternative 2, 3,
and 4 also include common elements, such as a the minimum base flow requirement at Vernalis and
the monitoring and reporting program that are discussed in more detail in Chapter 3, Alternatives
Description.
The LSJR alternatives contain a robust program of implementation to implement the new flow water
quality objectives and best protect beneficial uses under changing conditions. New flow objectives
have not been proposed outside of the February–June time frame. Through adaptive
implementation, however, a portion of the February–June flows could be shifted to other months to
avoid adverse temperature impacts on fish and wildlife. Without this flow shifting there could
otherwise be insufficient water available to achieve temperature criteria in the summer and fall. In
addition, when implementing the LSJR flow objectives, the State Water Board will include minimum
reservoir carryover storage targets or other requirements to help ensure that implementation of the
flow objectives will not have adverse temperature or other impacts on fish and wildlife or, if
feasible, other beneficial uses, and does not impact supplies of water for minimum health and safety
needs, particularly during drought periods. The program of implementation also includes
monitoring, special studies, and evaluation efforts to evaluate compliance and inform future changes
to flow objectives outside of the February–June time frame, including the existing October pulse flow
objective.
The No Project Alternative (LSJR Alternative 1 and SDWQ Alternative 1) is the continuation of the
2006 Bay-Delta Plan and its requirements, as implemented through the State Water Board’s Water
Right Decision 1641 (D-1641) and also includes continuation of, and full compliance with, the
southern Delta salinity objectives as described in SDWQ Alternative 1. LSJR Alternatives 2, 3, and 4
evaluate ranges of unimpaired flows for the February–June period. Each alternative evaluates a
different range of flows.
Alternative 2 evaluates a range between 20 and 30 percent, with 20 percent as the starting
percentage of unimpaired flow in the program of implementation.
Alternative 3 evaluates a range between 30 and 50 percent, with 40 percent as the starting
percentage of unimpaired flow in the program of implementation.
Alternative 4 evaluates a range between 50 and 60 percent, with 50 percent as the starting
percentage of unimpaired flow in the program of implementation.
Each alternative includes an adaptive flow range allowed by four methods of adaptive
implementation. LSJR Alternatives 2, 3, and 4 have the same narrative objective and program of
implementation with the exception of the required percent of unimpaired flow range. The narrative
objective includes four compliance points: one on each tributary upstream of the confluence with
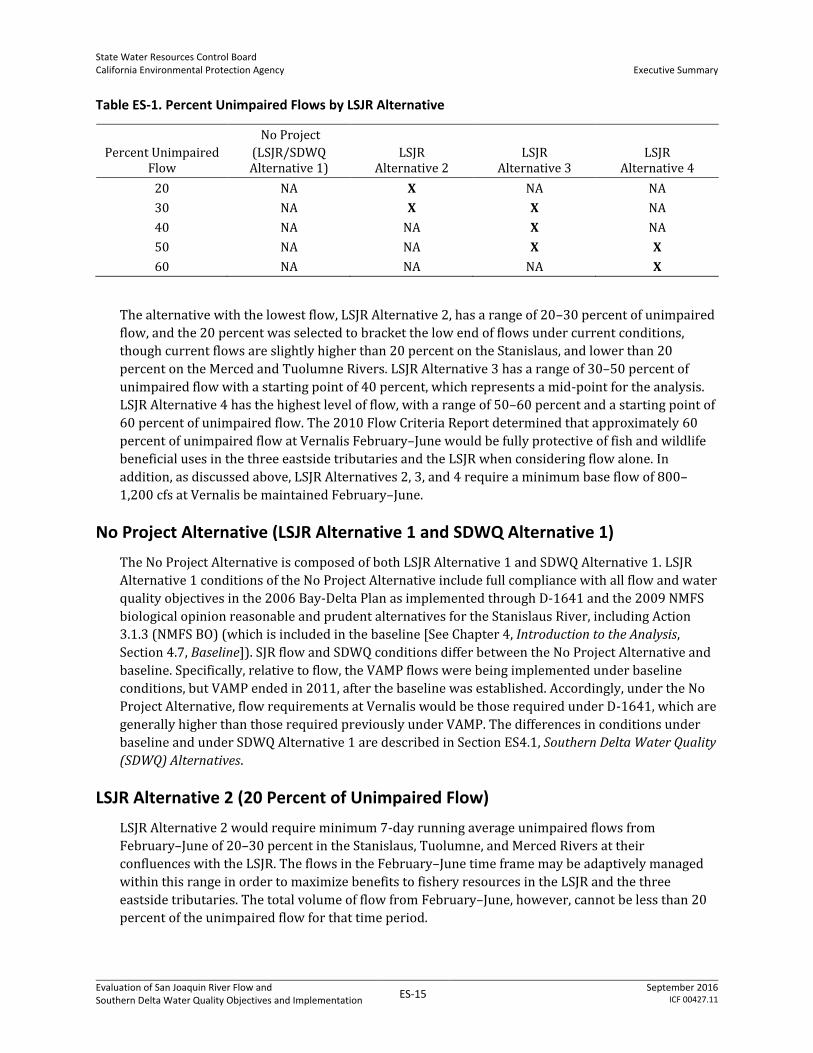
the SJR, and one on the SJR at Vernalis. Table ES-1 summarizes the different unimpaired flows that
could be required under each LSJR alternative.
State Water Resources Control Board California Environmental Protection Agency
Executive Summary
Evaluation of San Joaquin River Flow and Southern Delta Water Quality Objectives and Implementation
ES-15 September 2016
ICF 00427.11
Table ES-1. Percent Unimpaired Flows by LSJR Alternative
Percent Unimpaired Flow
No Project
(LSJR/SDWQ Alternative 1)
LSJR Alternative 2
LSJR Alternative 3
LSJR Alternative 4
20 NA X NA NA
30 NA X X NA
40 NA NA X NA
50 NA NA X X
60 NA NA NA X
The alternative with the lowest flow, LSJR Alternative 2, has a range of 20–30 percent of unimpaired
flow, and the 20 percent was selected to bracket the low end of flows under current conditions,
though current flows are slightly higher than 20 percent on the Stanislaus, and lower than 20
percent on the Merced and Tuolumne Rivers. LSJR Alternative 3 has a range of 30–50 percent of
unimpaired flow with a starting point of 40 percent, which represents a mid-point for the analysis.
LSJR Alternative 4 has the highest level of flow, with a range of 50–60 percent and a starting point of
60 percent of unimpaired flow. The 2010 Flow Criteria Report determined that approximately 60
percent of unimpaired flow at Vernalis February–June would be fully protective of fish and wildlife
beneficial uses in the three eastside tributaries and the LSJR when considering flow alone. In
addition, as discussed above, LSJR Alternatives 2, 3, and 4 require a minimum base flow of 800–
1,200 cfs at Vernalis be maintained February–June.
No Project Alternative (LSJR Alternative 1 and SDWQ Alternative 1)
The No Project Alternative is composed of both LSJR Alternative 1 and SDWQ Alternative 1. LSJR
Alternative 1 conditions of the No Project Alternative include full compliance with all flow and water
quality objectives in the 2006 Bay-Delta Plan as implemented through D-1641 and the 2009 NMFS
biological opinion reasonable and prudent alternatives for the Stanislaus River, including Action
3.1.3 (NMFS BO) (which is included in the baseline [See Chapter 4, Introduction to the Analysis,
Section 4.7, Baseline]). SJR flow and SDWQ conditions differ between the No Project Alternative and
baseline. Specifically, relative to flow, the VAMP flows were being implemented under baseline
conditions, but VAMP ended in 2011, after the baseline was established. Accordingly, under the No
Project Alternative, flow requirements at Vernalis would be those required under D-1641, which are
generally higher than those required previously under VAMP. The differences in conditions under
baseline and under SDWQ Alternative 1 are described in Section ES4.1, Southern Delta Water Quality
(SDWQ) Alternatives.
LSJR Alternative 2 (20 Percent of Unimpaired Flow)
LSJR Alternative 2 would require minimum 7-day running average unimpaired flows from
February–June of 20–30 percent in the Stanislaus, Tuolumne, and Merced Rivers at their
confluences with the LSJR. The flows in the February–June time frame may be adaptively managed
within this range in order to maximize benefits to fishery resources in the LSJR and the three
eastside tributaries. The total volume of flow from February–June, however, cannot be less than 20
percent of the unimpaired flow for that time period.
State Water Resources Control Board California Environmental Protection Agency
Executive Summary
Evaluation of San Joaquin River Flow and Southern Delta Water Quality Objectives and Implementation
ES-16 September 2016
ICF 00427.11
LSJR Alternative 3 (40 Percent of Unimpaired Flow)
LSJR Alternative 3 is similar to LSJR Alternative 2 except that the range of unimpaired flow is 30–50
percent, with starting point of 40 percent of unimpaired flow, and a minimum total volume of flow
from February–June of no less than 30 percent of the unimpaired flow for that time period.
LSJR Alternative 4 (60 Percent of Unimpaired Flow)
LSJR Alternative 3 is similar to LSJR Alternative 2 except that the range of unimpaired flow is 50-–60
percent, with a starting point of 50 percent of unimpaired flow, and a minimum total volume of flow
from February–June of no less than 50 percent of the unimpaired flow for that time period.
Common Elements of All Lower San Joaquin River Alternatives
The following elements of the LSJR alternatives are the same for each:
Adaptive implementation
Implementing entity and biological goals
Planning, monitoring and reporting
State of emergency provisions
Non-flow measures
The State Water Board recognizes that voluntary agreements can help inform and expedite
implementation of the water quality objectives and can provide durable solutions in the Delta
Watershed, so are also described below.
Adaptive Implementation
The unimpaired flow objective is not intended to be implemented in a way that requires rigid
adherence with a fixed percent of unimpaired flow. It is intended to determine a quantity of water
that can be “shaped” or shifted in time to provide more functionally useful flows. Functionally useful
flows are designed to achieve a specific function, such as increased habitat, more optimal
temperatures, or a migration cue. The unimpaired flow requirement is also not intended to remain
at one fixed percent, but rather to be adaptively implemented within a range of unimpaired flow in
response to changing information and changing conditions. LSJR Alternatives 2, 3, and 4 are
intended to be achieved through adaptive implementation. Each of the three tributaries may be
managed differently, with respect to the percent of unimpaired flow and the specific adaptive
implementation, so long as the adaptive implementation in the three rivers is coordinated.
The adaptive implementation element of the flow proposal consists of a defined adaptive
implementation process that allows the magnitude and timing of flows to be adjusted in a number of
ways, within a prescribed range of flows, if best available scientific information supports that such
changes would (1) be sufficient to support and maintain the natural production of the viable native
fish LSJR fish populations migrating through the Delta, and (2) meet any existing biological goals
approved by the State Water Board. Adaptive implementation of flows is intended to accomplish the
following goals.
Respond to changing information and changing conditions, including changes in flow patterns as
a result of climate change
State Water Resources Control Board California Environmental Protection Agency
Executive Summary
Evaluation of San Joaquin River Flow and Southern Delta Water Quality Objectives and Implementation
ES-17 September 2016
ICF 00427.11
Minimize adverse water temperature effects
Support scientific experiments that are intended to assess the benefits of different flow regimes
Adaptive implementation could also be used to optimize flows to achieve the objectives while
serving other beneficial uses, such as agricultural, municipal, and recreational uses, provided that
serving other uses does not reduce intended benefits to fish and wildlife and that specified
requirements are met.
Following are the four methods in which flows can be adaptively implemented under LSJR
Alternative 3. As described in Chapter 3, Alternatives Description, application of the methods varies
slightly among the alternatives. Chapter 3 and the program of implementation in Appendix K,
Revised Water Quality Control Plan, more fully describe these methods and the constraints on their
use.
The percent of unimpaired flow may be adjusted to any value within the adaptive range (30 to
50 percent for LSJR Alternative 3) on an annual or long-term basis.
The percent of unimpaired flow for February–June may be managed as a total volume of water
and released on an adaptive schedule during that period.
As long as the minimum percent of unimpaired flow for the prescribed range (30 percent for the
flow proposal, LSJR Alternative 3, which is 30 to 50 percent of unimpaired flow) is provided
during the February–June time frame, flows may be shifted from the February– June time frame
to other times of year to prevent adverse temperature effects.
The February–June Vernalis base flow requirement may be adjusted on an annual or long-term
basis to any value between 800 and 1,200 cfs.
As explained in Chapter 3 and Appendix K, different levels of approval are required depending on
the nature of the change. Adaptive implementation methods 1 and 4 may be approved by the State
Water Board Executive Director on an annual basis if all the members of a working group (described
below) agree to the change. Methods 2 and 3 may be approved by the State Water Board Executive
Director on an annual basis if one or more members of the working group recommend the change.
Multi-year changes for any of the methods, or changes that cannot be approved by the Executive
Director, must be approved by the State Water Board.
Adaptive implementation allows the frequency, timing, magnitude, and duration of flows to shift in
order to enhance the biological benefits. The LSJR alternatives entail a virtually unlimited number of
possible functional flow regimes, limited only by the upper and lower bounds of the analyzed range
of flows.
The Vernalis base flow requirement, with an adaptive range of 800–1,200 cfs, establishes a
minimum flow in the event that the percent of unimpaired flow would have resulted in a lower
number, such as in critically dry years. This base flow requirement is the minimum quantity of water
needed in all years to reasonably protect the fish and wildlife beneficial use. This base flow
requirement is expressed as a range so that base flow can also be adaptively managed to maximize
the beneficial use of water during critically dry years.
Implementing Entity and Biological Goals
The State Water Board will establish a Stanislaus, Tuolumne, and Merced River Working Group
(STM Working Group) to assist with implementation, monitoring, and assessment activities for the

State Water Resources Control Board California Environmental Protection Agency
Executive Summary
Evaluation of San Joaquin River Flow and Southern Delta Water Quality Objectives and Implementation
ES-18 September 2016
ICF 00427.11
LSJR flow objectives. The STM Working Group will be comprised of representatives from the State
Water Board; California Department of Fish and Wildlife (CDFW); NMFS; U.S. Fish and Wildlife
Service (USFWS); water users on the Stanislaus, Tuolumne, and Merced Rivers; and any other
representatives deemed appropriate by the Executive Director. The STM Working Group or State
Water Board staff, as necessary, will, in consultation with the Delta Science Program, develop
specific measures necessary to implement the February–June LSJR flow requirements and to
monitor and periodically report on their effectiveness. The STM Working Group, or State Water
Board staff as necessary, will also, in consultation with the Delta Science Program, develop proposed
procedures for allowing the adaptive adjustments to the February–June flow objectives.
The program of implementation requires the development of biological goals that can be used to
demonstrate the reasonable protection of LSJR fish and wildlife beneficial uses, evaluate the
effectiveness of the program of implementation, the monitoring and evaluation program, and future
changes to the 2006 Bay-Delta Plan, and to inform adaptive implementation. Based on
recommendations from the STM Working Group, State Water Board staff, and other interested
persons, the State Water Board will consider approving the biological goals within 180 days from
the date of the Office of Administrative Law’s approval of the amendments to the 2006 Bay-Delta
Plan. Once developed, those biological goals may be modified by the State Water Board based on
new information developed through the monitoring and evaluation activities described below or
other pertinent sources of scientific information. Biological goals will be developed specifically for
LSJR salmonids for abundance; productivity as measured by population growth rate; genetic and life
history diversity; and population spatial extent, distribution, and structure. Biological goals will be
one of the tools that can be used to inform adaptive implementation, including changes to the flow
percent required within the adaptive range.
Planning, Monitoring, and Reporting
The program of implementation for LSJR flow objectives identifies the following information, plans,
and reports that the STM Working Group, or State Water Board staff as necessary, must prepare and
submit to the State Water Board or the State Water Board’s Executive Director for approval.
Biological goals to inform the adaptive methods and evaluate the effectiveness of the program of
implementation: the State Water Board will consider approval within 180 days after Office of
Administrative Law approval of the amendments to the Bay-Delta Plan
Measures to achieve, monitor, and evaluate compliance with the flow objectives- one time
preparation and submittal: the State Water Board or its Executive Director will consider
approval within 180 days after Office of Administrative Law approval of the amendments to the
Bay-Delta Plan
Adaptive methods procedures: one time preparation and submittal, the State Water Board or its
Executive Director will consider approval within 180 days after Office of Administrative Law
approval of the amendments to the Bay-Delta Plan
Annual adaptive operations plan: to be submitted by the STM Working Group or subset thereof
by January 10 of each year
Annual report on implementation activities: due December 31 of each year
Comprehensive review of implementation actions: every 3 to 5 years
State Water Resources Control Board California Environmental Protection Agency
Executive Summary
Evaluation of San Joaquin River Flow and Southern Delta Water Quality Objectives and Implementation
ES-19 September 2016
ICF 00427.11
State of Emergency Change Provision
The current drought has highlighted the need for flexibility to adjust requirements in water rights
that implement the current 2006 Bay-Delta Plan objectives during emergencies. The flow proposal
therefore includes a provision to adjust flows for a state of emergency, such as the current drought
emergency. Hydrologic conditions, and water supply needs experienced during the current drought
were analyzed in this SED, and so the analyses in this SED have accounted for a wide range of
hydrologic conditions. Under this emergency provision, the State Water Board, at its discretion or at
the request of any affected responsible agency or person, may authorize a temporary change to the
implementation of the LSJR flow objectives in a water right proceeding if the State Water Board
determines that either (1) there is an emergency as defined by CEQA (Pub. Resources Code, §
21060.3), or (2) the Governor of the State of California or a local governing body has declared a state
or local emergency pursuant to the California Emergency Services Act (Gov. Code, § 8550 et seq.).
Before authorizing any temporary change, the State Water Board must find that measures will be
taken to reasonably protect the beneficial use in light of the circumstances of the emergency.
Non-Flow Actions
The program of implementation for the flow proposal recommends non-flow actions to assist in
further improving habitat conditions that benefit fish and wildlife beneficial uses or to improve
related science and management within the LSJR Watershed. This is intended to provide
recommendations to the entities that will be responsible for attainment of flow objectives, and
others, to use measures other than flow, in collaboration with state and federal agencies, to take
actions that will complement the LSJR flow objectives. Increased flows, however, remain the
principal means of compliance because science shows that some minimum flow is still needed to
reasonably protect fish and wildlife beneficial uses in the LSJR.
While flow remains a key factor, the State Water Board also recognizes that a number of other
factors, such as nonnative species, predation, high water temperatures, barriers to fish passage, and
habitat loss contribute to the degradation of fish and wildlife beneficial uses in the LSJR. Direct
actions to address these other stressors would complement LSJR flows to protect fish and wildlife.
The State Water Board, therefore, recommends certain actions in the program of implementation.
These recommended actions, together with the coordinated monitoring and adaptive
implementation described above, are expected to improve habitat conditions that benefit native fish
and wildlife or are expected to improve related science and management within the LSJR
Watershed, and could reduce the flows needed, within the adaptive range, to achieve reasonable fish
and wildlife protection goals.
Voluntary agreements, described below, may include commitments to undertake the recommended
non-flow actions. If the voluntary agreements include actions that are based upon the best available
science and analyses, and it is demonstrated that implementation of any such actions will improve
conditions sufficiently to support and maintain native fish populations and meet biological goals,
they may be used to support a change in flows within the adaptive range. The following actions are
recommended for evaluation and subsequent implementation.
Restore, enhance, and protect floodplain and riparian habitat.
Reduce vegetation disturbing activities in floodplains and floodways, where safe and
appropriate.
Provide and maintain coarse sediment for salmonid spawning and rearing.

State Water Resources Control Board California Environmental Protection Agency
Executive Summary
Evaluation of San Joaquin River Flow and Southern Delta Water Quality Objectives and Implementation
ES-20 September 2016
ICF 00427.11
Enhance in-channel complexity.
Improve reservoir operations and/or physical structures to maintain adequate water
temperature conditions.
Expand fish screening.
Improve fish passage above dams.
Improve fish and water barrier programs.
Reduce predation and competition by nonnative fish.
Reduce invasive species.
These measures are identified in the program of implementation of the LSJR flow objectives as San
Joaquin River Non-Flow Actions in Appendix K, Revised Water Quality Control Plan. The measures are
described and evaluated in Chapter 16, Evaluation of Other Indirect and Additional Actions.
In addition, the following additional recommended actions for other agencies are currently included
in the 2006 Water Quality Control Plan for the San Francisco Bay/ Sacramento–San Joaquin Delta
Estuary (described in Appendix K).
Improve management and operation of fish hatcheries
Evaluate and revise, if needed, fish harvest policies and take actions to reduce illegal harvesting
Voluntary Agreements
The State Water Board recognizes that voluntary agreements can help inform and expedite
implementation of the water quality objectives and can provide durable solutions in the Delta
Watershed. Subject to acceptance by the State Water Board, a voluntary agreement may serve as an
implementation mechanism for the LSJR flow objectives for the LSJR Tributaries as a whole, an
individual tributary or some combination thereof. Voluntary agreements may include commitments
to meet the flow requirements and to undertake non-flow actions. If the voluntary agreements
include non-flow actions recommended in this Plan or by DFW, the non-flow measures may support
a change in the required percent of unimpaired flow, within the range prescribed by the flow
objectives, or other adaptive adjustments otherwise allowed in this program of implementation. Any
such changes must be supported by CDFW and satisfy the criteria for adaptive adjustments
contained within this program of implementation. At a minimum, to be considered by the State
Water Board, voluntary agreements must include provisions for transparency and accountability,
monitoring and reporting, and for planning, adaptive adjustments, and periodic evaluation, that are
comparable to similar elements contained in the program of implementation for the LSJR flow
objectives.
The State Water Board encourages stakeholders to work together to reach voluntary agreements
that could implement Bay-Delta Plan objectives for fish and wildlife beneficial uses and to improve
conditions in the watershed.
State Water Resources Control Board California Environmental Protection Agency
Executive Summary
Evaluation of San Joaquin River Flow and Southern Delta Water Quality Objectives and Implementation
ES-21 September 2016
ICF 00427.11
Recommended LSJR Alternative—Issues to be Resolved
LSJR Alternative 3, with an initial unimpaired flow of 40 percent and an adaptive range of 30 to 50
percent, is the flow proposal recommended for adoption. This is a draft proposal. During the
adoption process, the State Water Board may select another percent of unimpaired flow within this
adaptive range as the starting point, or select a different adaptive range and starting point based on
the information and analyses in this document and public comment. This choice between the
different alternatives, which represent different levels of protection that must be weighed against
costs and adverse effects, is a primary issue to be resolved by the State Water Board. The remaining
elements of the flow proposal, other than the adaptive range and starting percent, are the same for
LSJR Alternatives 2, 3, and 4.
Effects of the Flow Proposal
The primary effect of the flow proposal is that it would decrease the quantity of surface water
available for diversion for other uses compared to the current condition (water supply effect). This
would affect primarily agriculture, but would also affect drinking water supplies and hydropower
generation. The long-term mean annual reduction in surface water supplies for the 40 percent of
unimpaired flow proposal (LSJR Alternative 3) is 293 thousand acre-feet (TAF), which is a 14
percent reduction in surface water supply from the current condition in the plan area. The adaptive
implementation element of this proposal could increase or decrease the mean annual surface water
supply effect from a high of 465 TAF per year (TAF/y), a 23 percent reduction in surface water
supply from the current condition, at 50 percent of unimpaired flow, to a low of 149 TAF/y, (a 7
percent reduction from the current condition, at 30 percent of unimpaired flow. The water supply
effects analysis takes into account greater reliance on storage to meet water demand in all years, so
an additional effect of the flow proposal would be an overall decrease in the quantity of water stored
in reservoirs. In other words, reservoir levels would be driven lower more frequently, but still
would be required to maintain adequate cold water storage. To ensure that there is adequate
coldwater storage, the water supply effects analysis places constraints on reservoir operations,
including carryover storage. The reduced availability of surface waters, and associated effects on
reservoir levels, results in a negative effect on hydropower generation and other uses.
Table ES-2 provides the summary mean annual surface water supply effects under baseline, and for
every 5 percent increment of unimpaired flow from 20–60 percent for each tributary and the total
plan area. The baseline of 2,068 TAF is the mean annual surface water supply assumed for the plan
area. The change and percent change from baseline for each 5 percent increment of unimpaired flow
are also provided. The water supply effect for the 40 percent unimpaired flow proposal (LSJR
Alternative 3) in each tributary, and for the 30–50 percent adaptive range for the plan area, are
highlighted. The analysis was conducted such that the State Water Board can select, if desired, an
adaptive range and initial starting point for the percent unimpaired flow requirement that is
different from the current proposal. The effects for 35 percent of unimpaired flow provide a useful
reference because this was the proposal in the 2012 Draft SED. As would be expected, the water
supply effects of 40 percent unimpaired flow are larger than the effects of 35 percent unimpaired
flow.
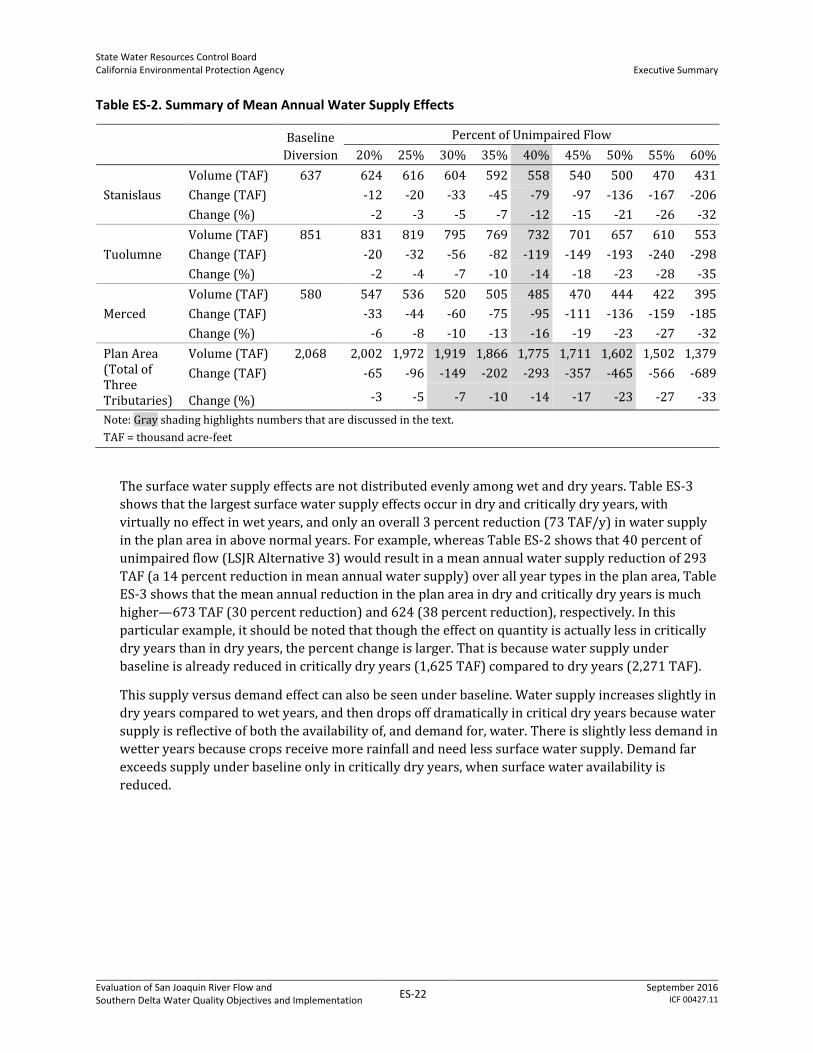
State Water Resources Control Board California Environmental Protection Agency
Executive Summary
Evaluation of San Joaquin River Flow and Southern Delta Water Quality Objectives and Implementation
ES-22 September 2016
ICF 00427.11
Table ES-2. Summary of Mean Annual Water Supply Effects
Baseline
Diversion
Percent of Unimpaired Flow
20% 25% 30% 35% 40% 45% 50% 55% 60%
Stanislaus
Volume (TAF) 637 624 616 604 592 558 540 500 470 431
Change (TAF)
-12 -20 -33 -45 -79 -97 -136 -167 -206
Change (%)
-2 -3 -5 -7 -12 -15 -21 -26 -32
Tuolumne
Volume (TAF) 851 831 819 795 769 732 701 657 610 553
Change (TAF)
-20 -32 -56 -82 -119 -149 -193 -240 -298
Change (%)
-2 -4 -7 -10 -14 -18 -23 -28 -35
Merced
Volume (TAF) 580 547 536 520 505 485 470 444 422 395
Change (TAF)
-33 -44 -60 -75 -95 -111 -136 -159 -185
Change (%)
-6 -8 -10 -13 -16 -19 -23 -27 -32
Plan Area (Total of Three Tributaries)
Volume (TAF) 2,068 2,002 1,972 1,919 1,866 1,775 1,711 1,602 1,502 1,379
Change (TAF)
-65 -96 -149 -202 -293 -357 -465 -566 -689
Change (%) -3 -5 -7 -10 -14 -17 -23 -27 -33
Note: Gray shading highlights numbers that are discussed in the text.
TAF = thousand acre-feet
The surface water supply effects are not distributed evenly among wet and dry years. Table ES-3
shows that the largest surface water supply effects occur in dry and critically dry years, with
virtually no effect in wet years, and only an overall 3 percent reduction (73 TAF/y) in water supply
in the plan area in above normal years. For example, whereas Table ES-2 shows that 40 percent of
unimpaired flow (LSJR Alternative 3) would result in a mean annual water supply reduction of 293
TAF (a 14 percent reduction in mean annual water supply) over all year types in the plan area, Table
ES-3 shows that the mean annual reduction in the plan area in dry and critically dry years is much
higher—673 TAF (30 percent reduction) and 624 (38 percent reduction), respectively. In this
particular example, it should be noted that though the effect on quantity is actually less in critically
dry years than in dry years, the percent change is larger. That is because water supply under
baseline is already reduced in critically dry years (1,625 TAF) compared to dry years (2,271 TAF).
This supply versus demand effect can also be seen under baseline. Water supply increases slightly in
dry years compared to wet years, and then drops off dramatically in critical dry years because water
supply is reflective of both the availability of, and demand for, water. There is slightly less demand in
wetter years because crops receive more rainfall and need less surface water supply. Demand far
exceeds supply under baseline only in critically dry years, when surface water availability is
reduced.
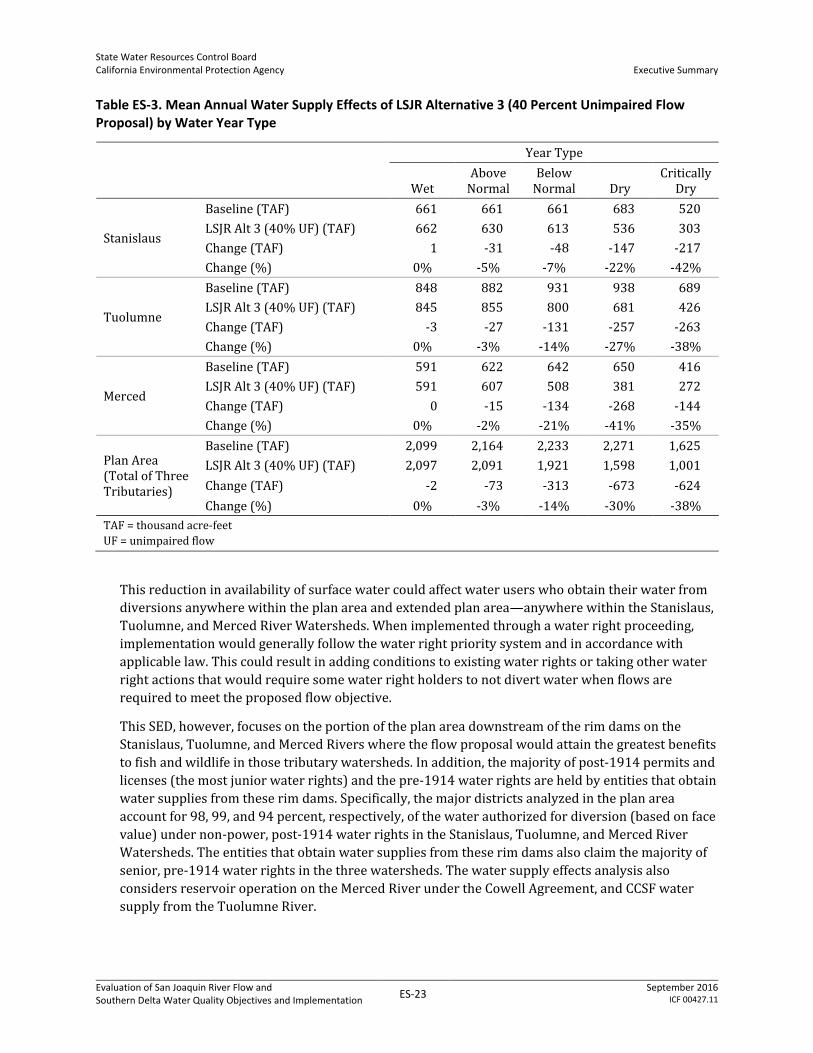
State Water Resources Control Board California Environmental Protection Agency
Executive Summary
Evaluation of San Joaquin River Flow and Southern Delta Water Quality Objectives and Implementation
ES-23 September 2016
ICF 00427.11
Table ES-3. Mean Annual Water Supply Effects of LSJR Alternative 3 (40 Percent Unimpaired Flow Proposal) by Water Year Type
Year Type
Wet Above
Normal Below
Normal Dry Critically
Dry
Stanislaus
Baseline (TAF) 661 661 661 683 520
LSJR Alt 3 (40% UF) (TAF) 662 630 613 536 303
Change (TAF) 1 -31 -48 -147 -217
Change (%) 0% -5% -7% -22% -42%
Tuolumne
Baseline (TAF) 848 882 931 938 689
LSJR Alt 3 (40% UF) (TAF) 845 855 800 681 426
Change (TAF) -3 -27 -131 -257 -263
Change (%) 0% -3% -14% -27% -38%
Merced
Baseline (TAF) 591 622 642 650 416
LSJR Alt 3 (40% UF) (TAF) 591 607 508 381 272
Change (TAF) 0 -15 -134 -268 -144
Change (%) 0% -2% -21% -41% -35%
Plan Area (Total of Three Tributaries)
Baseline (TAF) 2,099 2,164 2,233 2,271 1,625
LSJR Alt 3 (40% UF) (TAF) 2,097 2,091 1,921 1,598 1,001
Change (TAF) -2 -73 -313 -673 -624
Change (%) 0% -3% -14% -30% -38%
TAF = thousand acre-feet
UF = unimpaired flow
This reduction in availability of surface water could affect water users who obtain their water from
diversions anywhere within the plan area and extended plan area—anywhere within the Stanislaus,
Tuolumne, and Merced River Watersheds. When implemented through a water right proceeding,
implementation would generally follow the water right priority system and in accordance with
applicable law. This could result in adding conditions to existing water rights or taking other water
right actions that would require some water right holders to not divert water when flows are
required to meet the proposed flow objective.
This SED, however, focuses on the portion of the plan area downstream of the rim dams on the
Stanislaus, Tuolumne, and Merced Rivers where the flow proposal would attain the greatest benefits
to fish and wildlife in those tributary watersheds. In addition, the majority of post-1914 permits and
licenses (the most junior water rights) and the pre-1914 water rights are held by entities that obtain
water supplies from these rim dams. Specifically, the major districts analyzed in the plan area
account for 98, 99, and 94 percent, respectively, of the water authorized for diversion (based on face
value) under non-power, post-1914 water rights in the Stanislaus, Tuolumne, and Merced River
Watersheds. The entities that obtain water supplies from these rim dams also claim the majority of
senior, pre-1914 water rights in the three watersheds. The water supply effects analysis also
considers reservoir operation on the Merced River under the Cowell Agreement, and CCSF water
supply from the Tuolumne River.

State Water Resources Control Board California Environmental Protection Agency
Executive Summary
Evaluation of San Joaquin River Flow and Southern Delta Water Quality Objectives and Implementation
ES-24 September 2016
ICF 00427.11
The reduction in availability of surface water would not likely translate into an immediate and
equivalent increase in unmet crop water demand because some quantity of the decrease in surface
water diversion lost to meeting the proposed flow objective would be replaced by increased
groundwater pumping. This already occurs during drought years. There is increased reliance on
groundwater pumping when surface water supplies are limited. Groundwater pumping would
continue to offset some of the surface water supply deficits under the LSJR alternatives, just as
groundwater pumping offsets reduced surface water supply availability in critically dry years under
baseline. The sustainability of increased reliance on groundwater pumping is an important issue
that is discussed below.
The reduced availability of surface water diversions could potentially affect various water users,
separated into two categories.
Direct net effects on surface water users that rely upon surface water in the Stanislaus,
Tuolumne, and Merced River Watersheds, with a focus on the area downstream of the major
reservoirs on the three tributaries (Lake McClure, New Don Pedro Reservoir, and New Melones
Reservoir), and indirect groundwater effects on groundwater users.
Direct effects on surface water supplies in the CCSF and other areas served by CCSF.
An evaluation of the potential effects on service providers, including municipal water supply effects,
is provided in Chapter 13, Service Providers, and summarized in Chapter 22, Integrated Discussion of
Potential Municipal and Domestic Water Supply Management Options. The potential effects on CCSF
are identified in much greater detail because CCSF is a major water right holder that relies upon
water delivered from the Tuolumne River to provide approximately 85 percent of the water
supplied to a major metropolitan area. For reasons more fully explained in Appendix L, City and
County of San Francisco Analyses, and summarized below, it is difficult to predict to what specific
extent water supplies for CCSF and related service areas would be affected by the flow proposal.
The potential effects are, therefore, framed as the effect on combined surface and groundwater users
in the plan area and the possible, alternative, effect on CCSF and related service area water supply.
The effects on CCSF and related service areas would not be additive to the surface and groundwater
effects in the plan area. Though water right implementation of the flow proposal could affect CCSF
and related service water suppliers, this would not be an additional effect to the surface and
groundwater effects in the plan area. Any effects on CCSF would reduce effects within the plan area
and vice versa. The reduced availability of surface water diversions in the plan area could also affect
groundwater recharge, hydropower generation, drinking water supply, and would have overall
economic impacts, also discussed below.
Direct Net Effect on Surface Water Users and Indirect Effects on Groundwater Users
The net effect of the flow proposal on water supplies for agricultural purposes would be moderated
to some extent by increased reliance on groundwater to make up for some of the loss in surface
water diversions. Knowledge of current and future rates of groundwater pumping are, therefore,
needed to determine the net effect on water supplies. In other words, groundwater pumping must
be estimated to determine the potential for groundwater to make up some portion of the overall
unmet demand for water resulting from implementation of the LSJR alternatives. Unmet demand is
defined as a shortage of supply to satisfy field crop-applied water needs, whether from surface
water or groundwater.

State Water Resources Control Board California Environmental Protection Agency
Executive Summary
Evaluation of San Joaquin River Flow and Southern Delta Water Quality Objectives and Implementation
ES-25 September 2016
ICF 00427.11
Table ES-4 shows the likely increase in groundwater pumping, assuming 2009 levels of
groundwater pumping capacity and no change in the assumed irrigation efficiencies of the water
districts. Based on this assumption, mean annual groundwater pumping is expected to increase by
105 TAF (364 minus 260, with rounding). Groundwater pumping capacity remains the same in all
years but baseline reliance on groundwater increase from 185 TAF in wet years to 485 TAF in
critically dry years. This shows that groundwater pumping already changes in response to changes
in surface water availability under baseline. Groundwater pumping increases under LSJR Alternative
3 (40 percent of unimpaired flow) are highest in dry years, followed by below normal and critically
dry years, and lowest in above normal years and wet years. Groundwater pumping increases are
highest in dry years because increases in pumping are limited by groundwater pumping capacity in
critically dry years.
Table ES-4. Groundwater Use Based on 2009 Levels of Groundwater Pumping
Average Annual Groundwater Use
All Year Types Wet
Above Normal
Below Normal Dry
Critically Dry
Total GW pumping capacity (TAF/y) 626 626 626 626 626 626
Baseline GW use (TAF/y) 260 185 203 228 221 485
LSJR Alt 3 (40% UF) GW use (TAF/y) 364 192 235 376 524 614
Project increase in GW use (TAF/y)* 105 6 32 149 302 129
GW = groundwater
TAF/y = thousand acre-feet per year
UF = unimpaired flow
* LSJR Alt 3 minus baseline may be different from increase due to rounding.
Table ES-5 shows the change in mean annual unmet agricultural water demand (crop demand at the
field) after taking into account the substitution of reduced surface water with additional
groundwater pumping based on 2009 levels of groundwater pumping capacity. Baseline surface
water supply is lowest in critically dry years. The mean annual baseline unmet demand for all year
types is 45 TAF/y (shown as gray cell in Table ES-5). Most of that unmet demand occurs in critically
dry years, with some in dry years—the mean annual baseline unmet demand in critically dry years
is 224 TAF/y. Under 40 percent unimpaired flow (LSJR Alternative 3), the mean annual unmet
demand increases to 182 TAF/y (gray cell); this is an increase of 137 TAF/y (gray cell) over
baseline. Unmet demand increases in all year types but is largest in below normal, dry, and critically
dry years. The increase in unmet demand in critically dry years under 40 percent unimpaired flow
(LSJR Alternative 3) is 394 TAF/y.
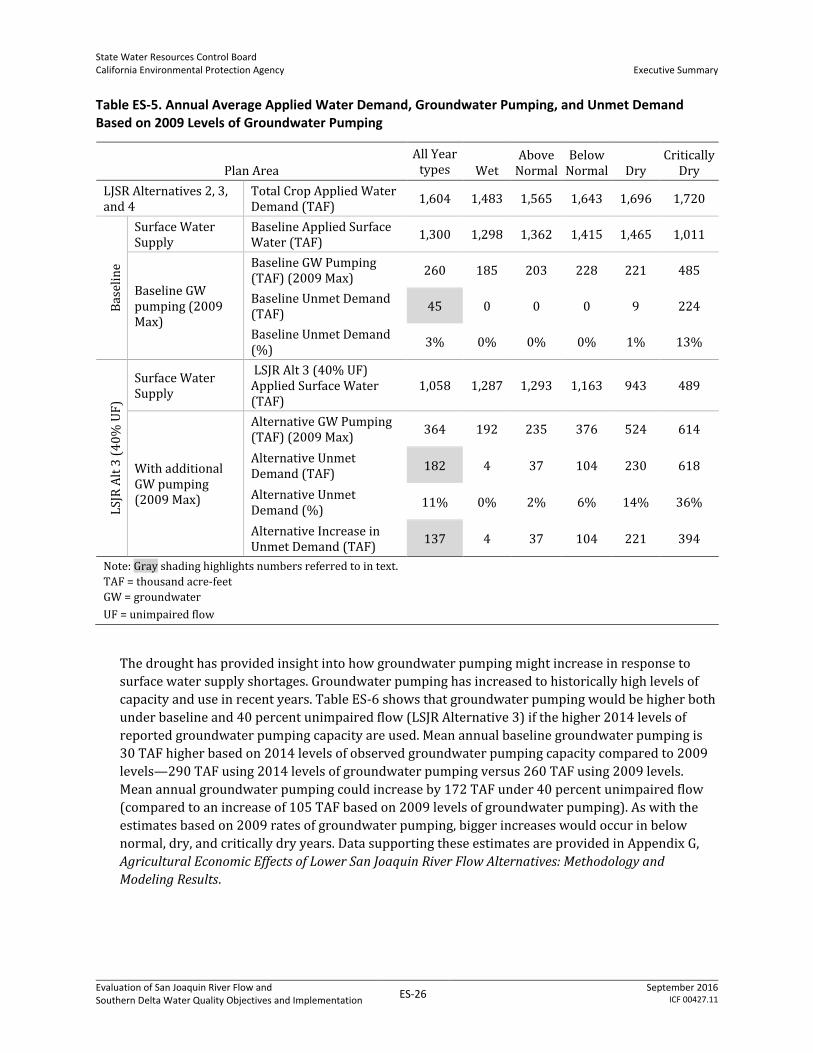
State Water Resources Control Board California Environmental Protection Agency
Executive Summary
Evaluation of San Joaquin River Flow and Southern Delta Water Quality Objectives and Implementation
ES-26 September 2016
ICF 00427.11
Table ES-5. Annual Average Applied Water Demand, Groundwater Pumping, and Unmet Demand Based on 2009 Levels of Groundwater Pumping
Plan Area
All Year types Wet
Above Normal
Below Normal Dry
Critically Dry
LJSR Alternatives 2, 3, and 4
Total Crop Applied Water Demand (TAF)
1,604 1,483 1,565 1,643 1,696 1,720
Bas
elin
e
Surface Water Supply
Baseline Applied Surface Water (TAF)
1,300 1,298 1,362 1,415 1,465 1,011
Baseline GW pumping (2009 Max)
Baseline GW Pumping (TAF) (2009 Max)
260 185 203 228 221 485
Baseline Unmet Demand (TAF)
45 0 0 0 9 224
Baseline Unmet Demand (%)
3% 0% 0% 0% 1% 13%
LSJ
R A
lt 3
(4
0%
UF
)
Surface Water Supply
LSJR Alt 3 (40% UF) Applied Surface Water (TAF)
1,058 1,287 1,293 1,163 943 489
With additional GW pumping (2009 Max)
Alternative GW Pumping (TAF) (2009 Max)
364 192 235 376 524 614
Alternative Unmet Demand (TAF)
182 4 37 104 230 618
Alternative Unmet Demand (%)
11% 0% 2% 6% 14% 36%
Alternative Increase in Unmet Demand (TAF)
137 4 37 104 221 394
Note: Gray shading highlights numbers referred to in text.
TAF = thousand acre-feet
GW = groundwater
UF = unimpaired flow
The drought has provided insight into how groundwater pumping might increase in response to
surface water supply shortages. Groundwater pumping has increased to historically high levels of
capacity and use in recent years. Table ES-6 shows that groundwater pumping would be higher both
under baseline and 40 percent unimpaired flow (LSJR Alternative 3) if the higher 2014 levels of
reported groundwater pumping capacity are used. Mean annual baseline groundwater pumping is
30 TAF higher based on 2014 levels of observed groundwater pumping capacity compared to 2009
levels—290 TAF using 2014 levels of groundwater pumping versus 260 TAF using 2009 levels.
Mean annual groundwater pumping could increase by 172 TAF under 40 percent unimpaired flow
(compared to an increase of 105 TAF based on 2009 levels of groundwater pumping). As with the
estimates based on 2009 rates of groundwater pumping, bigger increases would occur in below
normal, dry, and critically dry years. Data supporting these estimates are provided in Appendix G,
Agricultural Economic Effects of Lower San Joaquin River Flow Alternatives: Methodology and
Modeling Results.

State Water Resources Control Board California Environmental Protection Agency
Executive Summary
Evaluation of San Joaquin River Flow and Southern Delta Water Quality Objectives and Implementation
ES-27 September 2016
ICF 00427.11
Table ES-6. Groundwater Use Based on 2014 Levels of Groundwater Pumping
Average Annual Groundwater Use
All Year types Wet
Above Normal
Below Normal Dry
Critically Dry
Total GW pumping capacity (TAF/y) 903 903 903 903 903 903
Baseline GW use (TAF/y) 290 185 203 228 231 633
LSJR Alt 3 (40% UF) GW use (TAF/y) 462 194 259 460 690 883
Project increase in GW use (TAF/y) 172 9 56 233 460 250
GW = groundwater
TAF/y = thousand acre-feet per year
TAF = thousand acre-feet
UF = unimpaired flow
Table ES-7 shows the change in mean annual unmet agricultural water demand after taking into
account the substitution of reduced surface water with additional groundwater pumping based on
2014 levels of groundwater pumping capacity. The mean annual baseline unmet demand is 15
TAF—this is 30 TAF/y lower than mean annual baseline unmet demand using 2009 levels of
groundwater pumping capacity. All of that unmet demand, 76 TAF on average, occurs in critically
dry years. The mean annual unmet demand increases to 84 TAF, an increase of 69 TAF/y over
baseline (shown as gray shading in Table ES-7). Unmet demand increases in all year types but is
largest in below normal, dry, and critically dry years.
Table ES-7. Annual Average Applied Water Demand, Groundwater Pumping, and Unmet Demand Based on 2014 Levels of Groundwater Pumping
Plan Area All Year
types Wet Above
Normal Below
Normal Dry Critically
Dry
LJSR Alternatives 2, 3, and 4
Total Crop Applied Water Demand (TAF)
1,604 1,483 1,565 1,643 1,696 1,720
Bas
elin
e
Surface water Supply
Baseline Applied Surface Water (TAF)
1,300 1,298 1,362 1,415 1,465 1,011
Baseline GW pumping (2014 Max)
Baseline GW Pumping (TAF) (2014 Max)
290 185 203 228 231 633
Baseline Unmet Demand (TAF)
15 0 0 0 0 76
Baseline Unmet Demand (%)
1% 0% 0% 0% 0% 4%
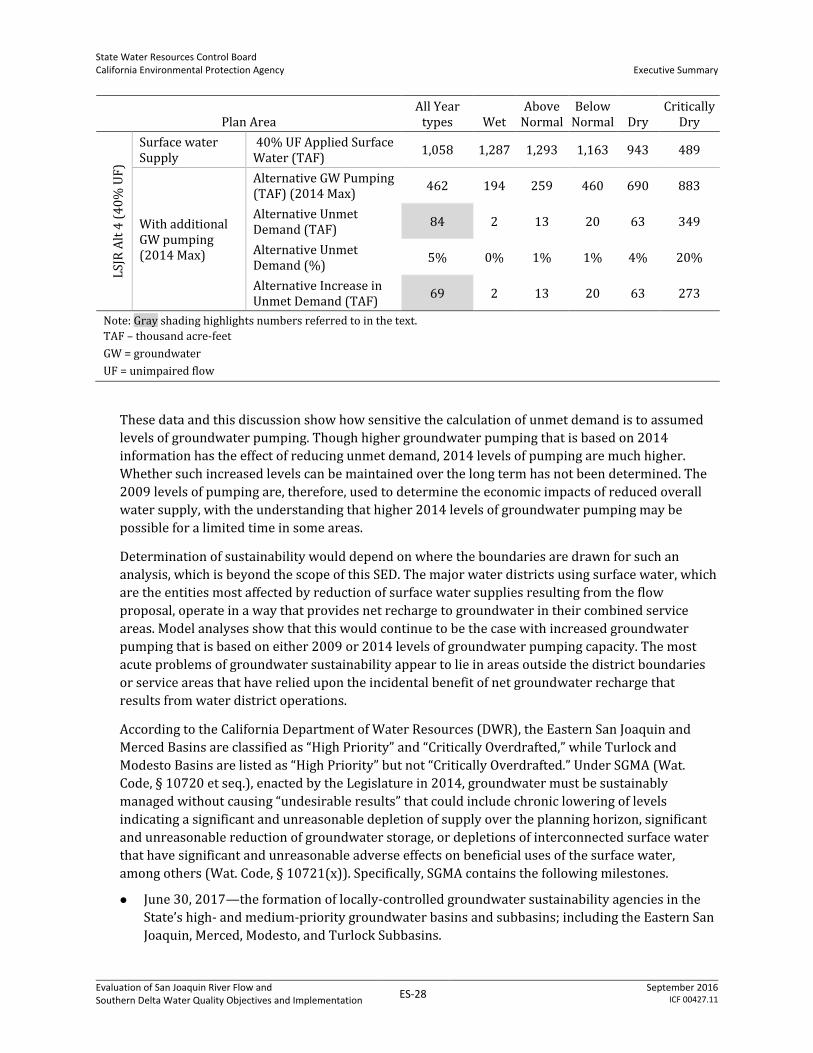
State Water Resources Control Board California Environmental Protection Agency
Executive Summary
Evaluation of San Joaquin River Flow and Southern Delta Water Quality Objectives and Implementation
ES-28 September 2016
ICF 00427.11
Plan Area All Year
types Wet Above
Normal Below
Normal Dry Critically
Dry L
SJR
Alt
4 (
40
% U
F)
Surface water Supply
40% UF Applied Surface Water (TAF)
1,058 1,287 1,293 1,163 943 489
With additional GW pumping (2014 Max)
Alternative GW Pumping (TAF) (2014 Max)
462 194 259 460 690 883
Alternative Unmet Demand (TAF)
84 2 13 20 63 349
Alternative Unmet Demand (%)
5% 0% 1% 1% 4% 20%
Alternative Increase in Unmet Demand (TAF)
69 2 13 20 63 273
Note: Gray shading highlights numbers referred to in the text.
TAF – thousand acre-feet
GW = groundwater
UF = unimpaired flow
These data and this discussion show how sensitive the calculation of unmet demand is to assumed
levels of groundwater pumping. Though higher groundwater pumping that is based on 2014
information has the effect of reducing unmet demand, 2014 levels of pumping are much higher.
Whether such increased levels can be maintained over the long term has not been determined. The
2009 levels of pumping are, therefore, used to determine the economic impacts of reduced overall
water supply, with the understanding that higher 2014 levels of groundwater pumping may be
possible for a limited time in some areas.
Determination of sustainability would depend on where the boundaries are drawn for such an
analysis, which is beyond the scope of this SED. The major water districts using surface water, which
are the entities most affected by reduction of surface water supplies resulting from the flow
proposal, operate in a way that provides net recharge to groundwater in their combined service
areas. Model analyses show that this would continue to be the case with increased groundwater
pumping that is based on either 2009 or 2014 levels of groundwater pumping capacity. The most
acute problems of groundwater sustainability appear to lie in areas outside the district boundaries
or service areas that have relied upon the incidental benefit of net groundwater recharge that
results from water district operations.
According to the California Department of Water Resources (DWR), the Eastern San Joaquin and
Merced Basins are classified as “High Priority” and “Critically Overdrafted,” while Turlock and
Modesto Basins are listed as “High Priority” but not “Critically Overdrafted.” Under SGMA (Wat.
Code, § 10720 et seq.), enacted by the Legislature in 2014, groundwater must be sustainably
managed without causing “undesirable results” that could include chronic lowering of levels
indicating a significant and unreasonable depletion of supply over the planning horizon, significant
and unreasonable reduction of groundwater storage, or depletions of interconnected surface water
that have significant and unreasonable adverse effects on beneficial uses of the surface water,
among others (Wat. Code, § 10721(x)). Specifically, SGMA contains the following milestones.
June 30, 2017—the formation of locally-controlled groundwater sustainability agencies in the
State’s high- and medium-priority groundwater basins and subbasins; including the Eastern San
Joaquin, Merced, Modesto, and Turlock Subbasins.
State Water Resources Control Board California Environmental Protection Agency
Executive Summary
Evaluation of San Joaquin River Flow and Southern Delta Water Quality Objectives and Implementation
ES-29 September 2016
ICF 00427.11
January 31, 2020—Groundwater sustainability plans (GSPs) must be completed for high and
medium priority basins in a critical condition of overdraft.
January 31, 2022—GSPs must be completed in all other high- and medium-priority basins not
currently in overdraft.
Twenty years after adoption of the GSP (2040 and 2042)—all high- and medium-priority
groundwater basins must achieve sustainability.
Groundwater pumping in the plan area (and all other areas of the state) must be sustainable by no
later than 2042. This means that, over time, the water supply effect of flow proposals could
potentially shift to a larger unmet demand compared to baseline. Increased groundwater recharge
in wet years, however, could reduce groundwater impacts, and make higher levels of groundwater
pumping sustainable.
These impacts, though likely to evolve over time as the new law is implemented coincident with the
implementation of the flow proposal, cannot be reasonably quantified for analysis at this time.
Water Supply Effects Outside of the Immediate Plan Area
The effect of the flow proposal on specific water rights is unknown. In general, the flow objectives
would be implemented through water right actions that would follow the water right priority
system, and in accordance with applicable law, and limit water availability starting with the most
junior water rights in the plan area. Conditions would also be placed in water quality certifications
issued by the State Water Board for FERC hydropower projects on the Merced and Tuolumne Rivers.
As stated previously, some of the water supply effect would also occur in the extended plan area and
potentially affected areas.
Stanislaus River Watershed upstream of New Melones Reservoir
Tuolumne River Watershed upstream of New Don Pedro Reservoir
Merced River Watershed upstream of Lake McClure
LSJR Watershed from the Merced River confluence to Vernalis
CCSF, and other areas served by water delivered from the plan area
This means that, when implemented, some of the water supply effect could occur in areas outside
the plan area. In no case, however, would the total effect be greater than has been quantified and
explained for the plan area. As discussed above, the largest uncertainty involves how the water
supply for the CCSF and other areas served by the San Francisco Public Utilities Commission
(SFPUC) could be affected. That is why this SED also analyzes the potential water supply and
economic effects on the CCSF served by water from the Tuolumne River Watershed.
Hydropower, Agricultural, and Domestic and Municipal Water Supply Effects
The direct net effect on surface water users and indirect groundwater effects on groundwater users
would have economic and other effects on hydropower, agriculture, groundwater, and drinking
water. This information is discussed in several chapters and appendices, and is summarized here.
The potential effects on the CCSF are also summarized here and described in Appendix L, City and
County of San Francisco Analyses.
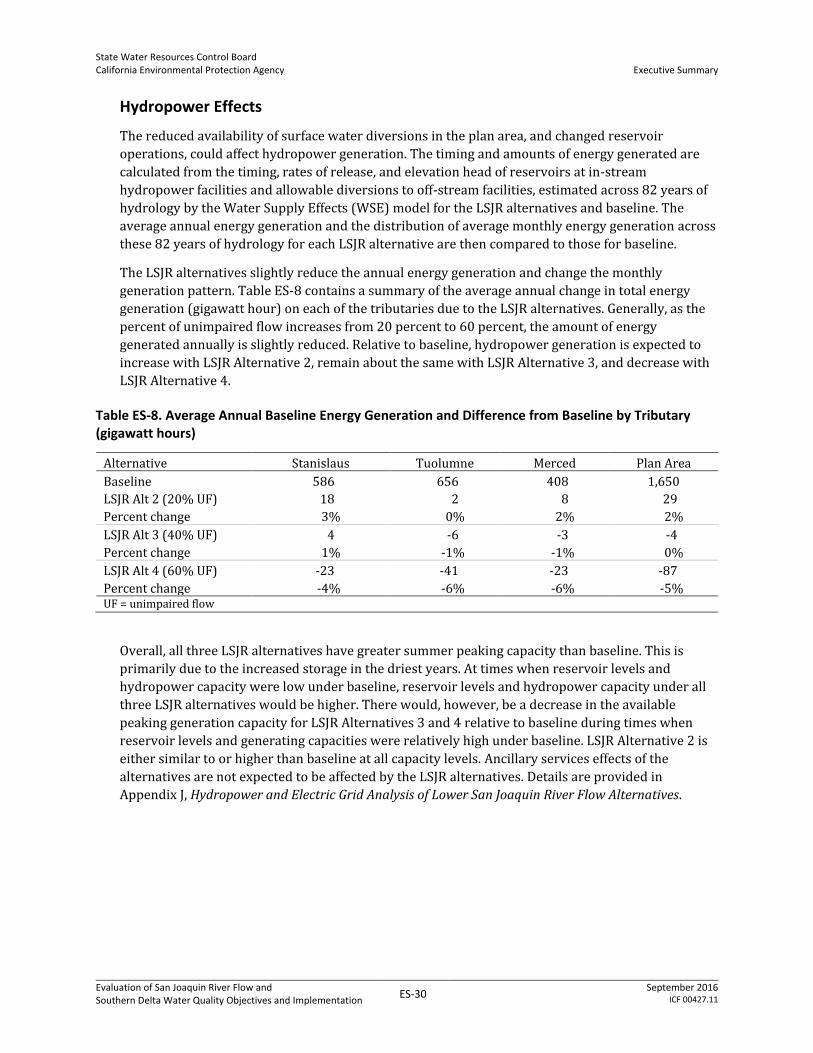
State Water Resources Control Board California Environmental Protection Agency
Executive Summary
Evaluation of San Joaquin River Flow and Southern Delta Water Quality Objectives and Implementation
ES-30 September 2016
ICF 00427.11
Hydropower Effects
The reduced availability of surface water diversions in the plan area, and changed reservoir
operations, could affect hydropower generation. The timing and amounts of energy generated are
calculated from the timing, rates of release, and elevation head of reservoirs at in-stream
hydropower facilities and allowable diversions to off-stream facilities, estimated across 82 years of
hydrology by the Water Supply Effects (WSE) model for the LSJR alternatives and baseline. The
average annual energy generation and the distribution of average monthly energy generation across
these 82 years of hydrology for each LSJR alternative are then compared to those for baseline.
The LSJR alternatives slightly reduce the annual energy generation and change the monthly
generation pattern. Table ES-8 contains a summary of the average annual change in total energy
generation (gigawatt hour) on each of the tributaries due to the LSJR alternatives. Generally, as the
percent of unimpaired flow increases from 20 percent to 60 percent, the amount of energy
generated annually is slightly reduced. Relative to baseline, hydropower generation is expected to
increase with LSJR Alternative 2, remain about the same with LSJR Alternative 3, and decrease with
LSJR Alternative 4.
Table ES-8. Average Annual Baseline Energy Generation and Difference from Baseline by Tributary (gigawatt hours)
Alternative Stanislaus Tuolumne Merced Plan Area
Baseline 586 656 408 1,650
LSJR Alt 2 (20% UF) 18 2 8 29
Percent change 3% 0% 2% 2%
LSJR Alt 3 (40% UF) 4 -6 -3 -4
Percent change 1% -1% -1% 0%
LSJR Alt 4 (60% UF) -23 -41 -23 -87
Percent change -4% -6% -6% -5% UF = unimpaired flow
Overall, all three LSJR alternatives have greater summer peaking capacity than baseline. This is
primarily due to the increased storage in the driest years. At times when reservoir levels and
hydropower capacity were low under baseline, reservoir levels and hydropower capacity under all
three LSJR alternatives would be higher. There would, however, be a decrease in the available
peaking generation capacity for LSJR Alternatives 3 and 4 relative to baseline during times when
reservoir levels and generating capacities were relatively high under baseline. LSJR Alternative 2 is
either similar to or higher than baseline at all capacity levels. Ancillary services effects of the
alternatives are not expected to be affected by the LSJR alternatives. Details are provided in
Appendix J, Hydropower and Electric Grid Analysis of Lower San Joaquin River Flow Alternatives.
State Water Resources Control Board California Environmental Protection Agency
Executive Summary
Evaluation of San Joaquin River Flow and Southern Delta Water Quality Objectives and Implementation
ES-31 September 2016
ICF 00427.11
Agricultural Effects
Agricultural production in the LSJR Watershed is dependent on irrigation water supply from various
sources, including surface water diversions, groundwater pumping, and deliveries from the SWP
and CVP. Implementation of the LSJR alternatives could potentially affect the amount of surface
water diversions available to water users within the LSJR Watershed and could also potentially
affect groundwater levels. Agricultural production would, in turn, depend upon the LSJR
alternatives’ effects on irrigation water supplies. The effects on agriculture are analyzed for the
irrigation districts that regularly obtain water from the Stanislaus, Tuolumne, or Merced Rivers and
the four primary groundwater subbasins under this area (the Eastern San Joaquin, Modesto,
Turlock, and Merced). They are collectively referred to as irrigation districts and include: South San
Joaquin Irrigation District (SSJID), Oakdale Irrigation District (OID), Stockton East Water District
(SEWD), Central San Joaquin Water Conservation District (CSJWCD),Turlock Irrigation District
(TID), Modesto Irrigation District (MID), and Merced Irrigation District (Merced ID). Although water
users other than these districts could be affected by implementation of the LSJR alternatives, the
overall effects would not be different or greater than described here.
The agricultural economic analysis follows three major steps, described in more detail in Appendix
G, Agricultural Economic Effects of the Lower San Joaquin River Flow Alternatives: Methodology and
Modeling Results.
1. Total applied water is estimated, and the effects on available surface water diversions and the
need for groundwater pumping under each of the LSJR alternatives are estimated relative to
baseline conditions using results from the WSE model. Minimum and maximum quantities of
groundwater pumping, to supplement surface water supplies, are determined in this step.
2. The Statewide Agricultural Production (SWAP) model is a multi-region, multi-input and output
economic optimization model of the agricultural economy in California developed by the
University of California, Davis. It is used to estimate the direct effect of changes in surface water
diversions and groundwater pumping on agricultural production and related revenues. The
SWAP model estimates the agricultural production (crop acreages) and revenues (total
production value) associated with the different levels of surface water diversions predicted to
be needed under baseline conditions and the LSJR alternatives. The SWAP model predicts the
production decisions of farmers at a regional level based on principles of economic optimization.
3. The Impact Analysis for Planning (IMPLAN) input-output model, a regional economic impact
model widely used for assessing the economic impacts of changes in natural resources, is used
to estimate changes in the total (direct, indirect, and induced) economic impacts on jobs and
personal income effects resulting from predicted changes in agricultural production.
The IMPLAN model estimates the average annual total economic output from all crop production
and related economic activity in all other sectors, including average direct effects and average
induced and indirect effects. Table ES-9 shows this economic information under baseline conditions,
and also the differences from baseline conditions, both in dollars and percentage change, for each
LSJR alternative. In general, as the percent of unimpaired flow increases, the negative effect on total
economic output increases. LSJR Alternative 3 (40 percent unimpaired flow) results in a mean
annual decrease in economic output of $64 million. This is a 2.5 percent reduction from baseline
mean annual agricultural economic sector output of $2,586 million.
The SWAP model assumes changes in cropping patterns, with a shift away from high water use
crops or crops that generate lower net revenue per acre, with a shift to higher net revenue crops.
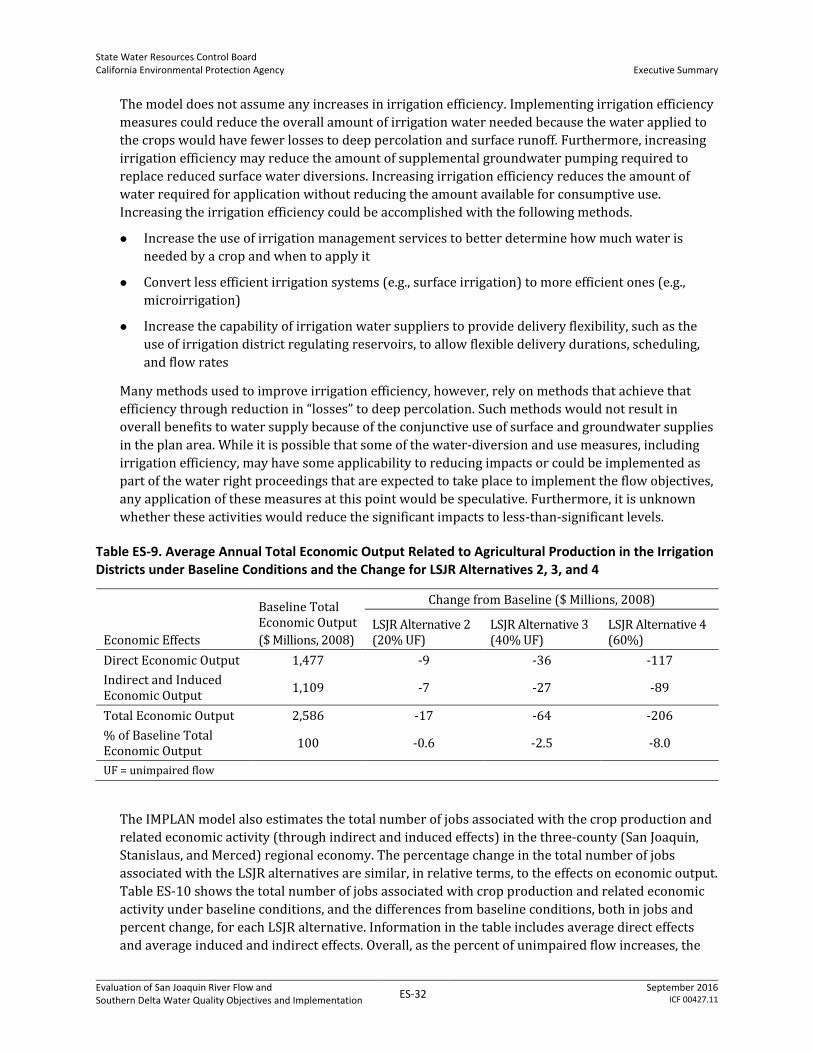
State Water Resources Control Board California Environmental Protection Agency
Executive Summary
Evaluation of San Joaquin River Flow and Southern Delta Water Quality Objectives and Implementation
ES-32 September 2016
ICF 00427.11
The model does not assume any increases in irrigation efficiency. Implementing irrigation efficiency
measures could reduce the overall amount of irrigation water needed because the water applied to
the crops would have fewer losses to deep percolation and surface runoff. Furthermore, increasing
irrigation efficiency may reduce the amount of supplemental groundwater pumping required to
replace reduced surface water diversions. Increasing irrigation efficiency reduces the amount of
water required for application without reducing the amount available for consumptive use.
Increasing the irrigation efficiency could be accomplished with the following methods.
Increase the use of irrigation management services to better determine how much water is
needed by a crop and when to apply it
Convert less efficient irrigation systems (e.g., surface irrigation) to more efficient ones (e.g.,
microirrigation)
Increase the capability of irrigation water suppliers to provide delivery flexibility, such as the
use of irrigation district regulating reservoirs, to allow flexible delivery durations, scheduling,
and flow rates
Many methods used to improve irrigation efficiency, however, rely on methods that achieve that
efficiency through reduction in “losses” to deep percolation. Such methods would not result in
overall benefits to water supply because of the conjunctive use of surface and groundwater supplies
in the plan area. While it is possible that some of the water-diversion and use measures, including
irrigation efficiency, may have some applicability to reducing impacts or could be implemented as
part of the water right proceedings that are expected to take place to implement the flow objectives,
any application of these measures at this point would be speculative. Furthermore, it is unknown
whether these activities would reduce the significant impacts to less-than-significant levels.
Table ES-9. Average Annual Total Economic Output Related to Agricultural Production in the Irrigation Districts under Baseline Conditions and the Change for LSJR Alternatives 2, 3, and 4
Economic Effects
Baseline Total Economic Output
($ Millions, 2008)
Change from Baseline ($ Millions, 2008)
LSJR Alternative 2 (20% UF)
LSJR Alternative 3 (40% UF)
LSJR Alternative 4 (60%)
Direct Economic Output 1,477 -9 -36 -117
Indirect and Induced Economic Output
1,109 -7 -27 -89
Total Economic Output 2,586 -17 -64 -206
% of Baseline Total Economic Output
100 -0.6 -2.5 -8.0
UF = unimpaired flow
The IMPLAN model also estimates the total number of jobs associated with the crop production and
related economic activity (through indirect and induced effects) in the three-county (San Joaquin,
Stanislaus, and Merced) regional economy. The percentage change in the total number of jobs
associated with the LSJR alternatives are similar, in relative terms, to the effects on economic output.
Table ES-10 shows the total number of jobs associated with crop production and related economic
activity under baseline conditions, and the differences from baseline conditions, both in jobs and
percent change, for each LSJR alternative. Information in the table includes average direct effects
and average induced and indirect effects. Overall, as the percent of unimpaired flow increases, the
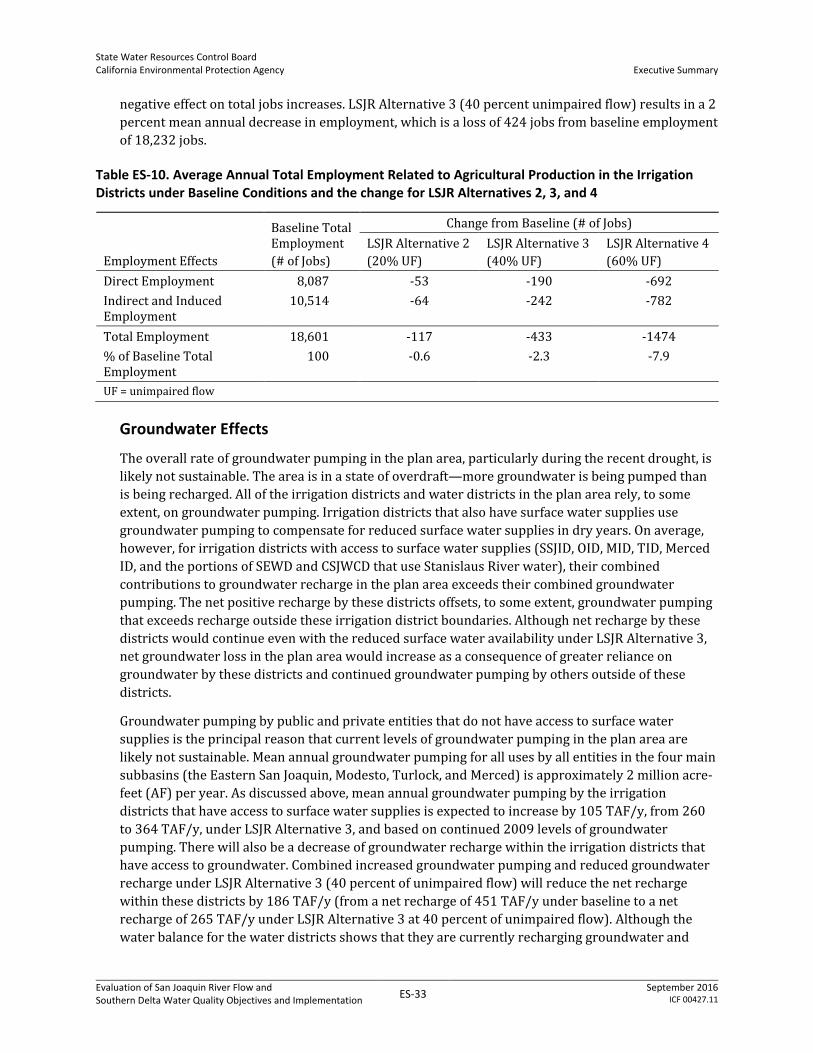
State Water Resources Control Board California Environmental Protection Agency
Executive Summary
Evaluation of San Joaquin River Flow and Southern Delta Water Quality Objectives and Implementation
ES-33 September 2016
ICF 00427.11
negative effect on total jobs increases. LSJR Alternative 3 (40 percent unimpaired flow) results in a 2
percent mean annual decrease in employment, which is a loss of 424 jobs from baseline employment
of 18,232 jobs.
Table ES-10. Average Annual Total Employment Related to Agricultural Production in the Irrigation Districts under Baseline Conditions and the change for LSJR Alternatives 2, 3, and 4
Employment Effects
Baseline Total Employment
(# of Jobs)
Change from Baseline (# of Jobs)
LSJR Alternative 2
(20% UF)
LSJR Alternative 3
(40% UF)
LSJR Alternative 4
(60% UF)
Direct Employment 8,087 -53 -190 -692
Indirect and Induced Employment
10,514 -64 -242 -782
Total Employment 18,601 -117 -433 -1474
% of Baseline Total Employment
100 -0.6 -2.3 -7.9
UF = unimpaired flow
Groundwater Effects
The overall rate of groundwater pumping in the plan area, particularly during the recent drought, is
likely not sustainable. The area is in a state of overdraft—more groundwater is being pumped than
is being recharged. All of the irrigation districts and water districts in the plan area rely, to some
extent, on groundwater pumping. Irrigation districts that also have surface water supplies use
groundwater pumping to compensate for reduced surface water supplies in dry years. On average,
however, for irrigation districts with access to surface water supplies (SSJID, OID, MID, TID, Merced
ID, and the portions of SEWD and CSJWCD that use Stanislaus River water), their combined
contributions to groundwater recharge in the plan area exceeds their combined groundwater
pumping. The net positive recharge by these districts offsets, to some extent, groundwater pumping
that exceeds recharge outside these irrigation district boundaries. Although net recharge by these
districts would continue even with the reduced surface water availability under LSJR Alternative 3,
net groundwater loss in the plan area would increase as a consequence of greater reliance on
groundwater by these districts and continued groundwater pumping by others outside of these
districts.
Groundwater pumping by public and private entities that do not have access to surface water
supplies is the principal reason that current levels of groundwater pumping in the plan area are
likely not sustainable. Mean annual groundwater pumping for all uses by all entities in the four main
subbasins (the Eastern San Joaquin, Modesto, Turlock, and Merced) is approximately 2 million acre-
feet (AF) per year. As discussed above, mean annual groundwater pumping by the irrigation
districts that have access to surface water supplies is expected to increase by 105 TAF/y, from 260
to 364 TAF/y, under LSJR Alternative 3, and based on continued 2009 levels of groundwater
pumping. There will also be a decrease of groundwater recharge within the irrigation districts that
have access to groundwater. Combined increased groundwater pumping and reduced groundwater
recharge under LSJR Alternative 3 (40 percent of unimpaired flow) will reduce the net recharge
within these districts by 186 TAF/y (from a net recharge of 451 TAF/y under baseline to a net
recharge of 265 TAF/y under LSJR Alternative 3 at 40 percent of unimpaired flow). Although the
water balance for the water districts shows that they are currently recharging groundwater and

State Water Resources Control Board California Environmental Protection Agency
Executive Summary
Evaluation of San Joaquin River Flow and Southern Delta Water Quality Objectives and Implementation
ES-34 September 2016
ICF 00427.11
would continue to do so under LSJR Alternative 3, this is not the case for the groundwater subbasins
in the plan area.
As discussed in Chapter 9, Groundwater Resources, the Modesto, Turlock, Merced and Eastern San
Joaquin Subbasins experienced varying degrees of overdraft (i.e., pumping more than recharge over
the long term) and recharge conditions between 1970 and 2000, with the eastern portion of the
subbasins experiencing more severe overdraft. Each subbasin experienced a net overdraft condition
between 1970 and 2000, as indicated by average declines in groundwater elevation of
approximately 15, 7 and 30 feet (ft), respectively, with the eastern portion of the subbasins
experiencing more severe overdraft (DWR 2003a, 2003b, 2003c). The Eastern San Joaquin Subbasin
has been in a consistent overdraft condition (approximately 1.7 ft/year decline in groundwater
level) for the same time period. It is estimated that the overdraft has reduced storage in the Eastern
San Joaquin Subbasin by 2 million AF over a 40-year period (DWR 2003c). According to a recent
DWR review, two of the four groundwater subbasins underlying the study area (Eastern San Joaquin
and Merced) are critically overdrafted (DWR 2016). Groundwater pumping in the region continues
to increase in response to growing urban demand and reduced surface water deliveries from north
of the Delta. Additional pumping in any of these subbasins would likely reduce the average
groundwater level, with a noticeable effect on groundwater levels over a number of years.
Based on overdraft of 2 million AF over a 40-year period, groundwater overdraft in the Eastern San
Joaquin Subbasin has been approximately 50 TAF/y. Groundwater storage in the Turlock Subbasin
decreased by an average of 21.5 TAF/y during the period of 1997 to 2006 (Chapter 9, Table 9-4).
This suggests a mean annual rate of groundwater overdraft of approximately 72 TAF/y for the
combined Eastern San Joaquin and Turlock Subbasins. LSJR Alternative 3 (40 percent of unimpaired
flow) would increase this baseline rate by 36 TAF/y in the Eastern San Joaquin Subbasin and 42
TAF/y in the Turlock Subbasin. The current rate of overdraft in the Merced and Modesto Subbasins
is not known, but if a similar combined rate of overdraft is assumed, the current rate of groundwater
overdraft is approximately 144 TAF/y (2 x 72) in the subbasins. The 186 TAF/y increase in
overdraft under LSJR Alternative 3 (40 percent of unimpaired flow) would slightly more than double
this rate of overdraft to 330 TAF/y (144+186).
It is extremely difficult to provide perspective on the implications of these rates of groundwater
overdraft. The numbers bring into question how long such levels of overdraft can be sustained.
Estimates of groundwater storage made in the 1960s suggest that total aquifer storage in the four
subbasins is on the order of 125 million AF. This suggests that the current assumed rate of overdraft
of 144 TAF/y represents approximately 0.12 percent of the total storage. The rate of overdraft
under LSJR Alternative 3 (40 percent of unimpaired flow), 330 TAF/y, represents 0.26 percent of the
total storage. These low percents of total storage should not be taken to mean that these rates of
groundwater overdraft do not pose a long-term problem with regard to sustainability. A number of
other factors should be considered to make estimates and determinations of sustainability,
including the following.
The estimates of storage from the 1960s must be updated to reflect changes in storage since that
time. There has not been a comprehensive estimate since 1961.
These numbers assume that there is no movement of groundwater between adjacent subbasins,
and no changes in surface and groundwater interaction.
It is impossible to remove all water from storage by pumpage. All groundwater is not fully
accessible economically to farmers and well owners.
State Water Resources Control Board California Environmental Protection Agency
Executive Summary
Evaluation of San Joaquin River Flow and Southern Delta Water Quality Objectives and Implementation
ES-35 September 2016
ICF 00427.11
There will be very large associated effects, including subsidence and loss of recharge capacity,
that occur long before all water in an aquifer could be removed.
This means that action is needed now to address groundwater overdraft in the four groundwater
subbasins, with or without the plan amendments. This highlights the importance of implementing
SGMA in areas where there is already significant groundwater overdraft. This analysis also suggests
that the timelines provided under SGMA afford sufficient time for water users in the plan area to
develop and implement groundwater sustainability plans.
Chapter 9, Groundwater Resources, and Chapter 22, Integrated Discussion of Potential Municipal and
Domestic Water Supply Management Options, provides in-depth discussion and analysis of the
potential effects of the LSJR alternatives on groundwater. Improved municipal and agricultural
water use efficiency and conjunctive water management, with increased groundwater recharge,
would reduce the water supply deficit and mitigate potential impacts associated with increased
groundwater pumping.
Drinking Water
Groundwater pumping is the major source of drinking water in the plan area. Approximately 1.25
million people live within the four major groundwater subbasins in the plan area, and
approximately 1.12 million people (89 percent) receive some portion of their water supply from a
public water supplier. The majority of the remaining 133,000 people within the four major
groundwater subbasins likely rely solely on private wells for domestic use. The analysis in Chapter
13, Service Providers, identifies 93 public water suppliers within the four major groundwater
subbasins that provide drinking water Of these public water suppliers, 28 account for most of the
population and water deliveries. Many of these water suppliers rely on groundwater for a portion of
their supply.
These 28 water suppliers delivered 309 TAF of water in 2013 and 273 TAF in 2014. Groundwater
accounted for approximately 161 TAF (52 percent) in 2013 and 160 TAF (58 percent) in 2014. If it is
assumed that the 133,000 people that do not receive water from a public water supplier (and that
likely rely solely on groundwater) have per capita usage similar to the water suppliers, these
133,000 people likely account for another 40 TAF/y and 35 TAF/y of groundwater pumping in 2013
and 2014 respectively. Based on these assumptions, mean annual groundwater pumping for
municipal and domestic use in the plan area in 2013 and 2014 was, therefore, approximately 198
TAF/y. Municipal and domestic use from surface and groundwater in the plan area was
approximately 349 TAF in 2013 and 308 TAF in 2014. By comparison, the mean annual water
supply effect of LSJR Alternative 3 (40 percent of unimpaired flow) is a mean annual reduction of
293 TAF/y from baseline surface water supply of 2,068 TAF for the irrigation districts that receive
surface water supplies from the Stanislaus, Tuolumne, and Merced Rivers.
A reduction in surface water supply would affect the groundwater aquifer by simultaneously
causing a reduction in recharge volume (from a reduction in deep percolation from the distribution
system and agricultural fields) and an increase in groundwater pumping (to replace lost surface
water supplies). The reduction in surface water supply would therefore affect entities that rely upon
groundwater as their principal source of drinking water by (1) increasing the need to drill deeper
wells to continue to access groundwater, (2) increasing groundwater pumping costs, (3) degrading
groundwater quality, and (4) making groundwater completely unavailable in some areas after some
period of continued unrestricted groundwater pumping.
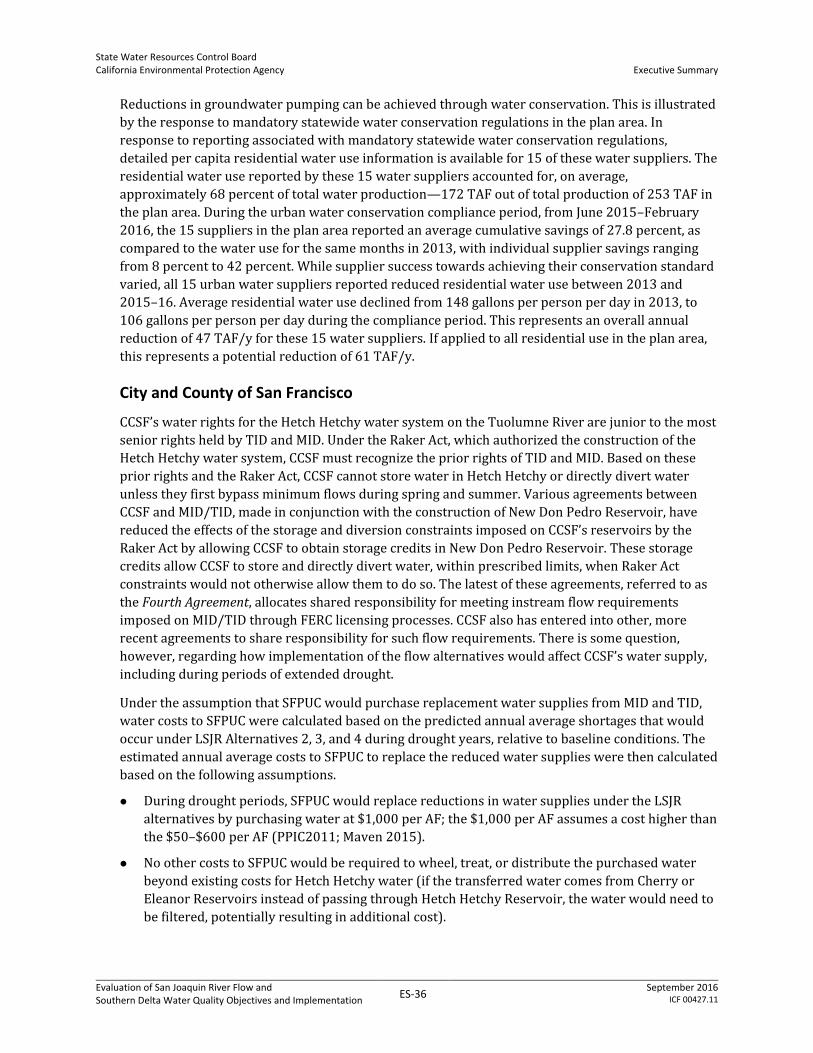
State Water Resources Control Board California Environmental Protection Agency
Executive Summary
Evaluation of San Joaquin River Flow and Southern Delta Water Quality Objectives and Implementation
ES-36 September 2016
ICF 00427.11
Reductions in groundwater pumping can be achieved through water conservation. This is illustrated
by the response to mandatory statewide water conservation regulations in the plan area. In
response to reporting associated with mandatory statewide water conservation regulations,
detailed per capita residential water use information is available for 15 of these water suppliers. The
residential water use reported by these 15 water suppliers accounted for, on average,
approximately 68 percent of total water production—172 TAF out of total production of 253 TAF in
the plan area. During the urban water conservation compliance period, from June 2015–February
2016, the 15 suppliers in the plan area reported an average cumulative savings of 27.8 percent, as
compared to the water use for the same months in 2013, with individual supplier savings ranging
from 8 percent to 42 percent. While supplier success towards achieving their conservation standard
varied, all 15 urban water suppliers reported reduced residential water use between 2013 and
2015–16. Average residential water use declined from 148 gallons per person per day in 2013, to
106 gallons per person per day during the compliance period. This represents an overall annual
reduction of 47 TAF/y for these 15 water suppliers. If applied to all residential use in the plan area,
this represents a potential reduction of 61 TAF/y.
City and County of San Francisco
CCSF’s water rights for the Hetch Hetchy water system on the Tuolumne River are junior to the most
senior rights held by TID and MID. Under the Raker Act, which authorized the construction of the
Hetch Hetchy water system, CCSF must recognize the prior rights of TID and MID. Based on these
prior rights and the Raker Act, CCSF cannot store water in Hetch Hetchy or directly divert water
unless they first bypass minimum flows during spring and summer. Various agreements between
CCSF and MID/TID, made in conjunction with the construction of New Don Pedro Reservoir, have
reduced the effects of the storage and diversion constraints imposed on CCSF’s reservoirs by the
Raker Act by allowing CCSF to obtain storage credits in New Don Pedro Reservoir. These storage
credits allow CCSF to store and directly divert water, within prescribed limits, when Raker Act
constraints would not otherwise allow them to do so. The latest of these agreements, referred to as
the Fourth Agreement, allocates shared responsibility for meeting instream flow requirements
imposed on MID/TID through FERC licensing processes. CCSF also has entered into other, more
recent agreements to share responsibility for such flow requirements. There is some question,
however, regarding how implementation of the flow alternatives would affect CCSF’s water supply,
including during periods of extended drought.
Under the assumption that SFPUC would purchase replacement water supplies from MID and TID,
water costs to SFPUC were calculated based on the predicted annual average shortages that would
occur under LSJR Alternatives 2, 3, and 4 during drought years, relative to baseline conditions. The
estimated annual average costs to SFPUC to replace the reduced water supplies were then calculated
based on the following assumptions.
During drought periods, SFPUC would replace reductions in water supplies under the LSJR
alternatives by purchasing water at $1,000 per AF; the $1,000 per AF assumes a cost higher than
the $50–$600 per AF (PPIC2011; Maven 2015).
No other costs to SFPUC would be required to wheel, treat, or distribute the purchased water
beyond existing costs for Hetch Hetchy water (if the transferred water comes from Cherry or
Eleanor Reservoirs instead of passing through Hetch Hetchy Reservoir, the water would need to
be filtered, potentially resulting in additional cost).
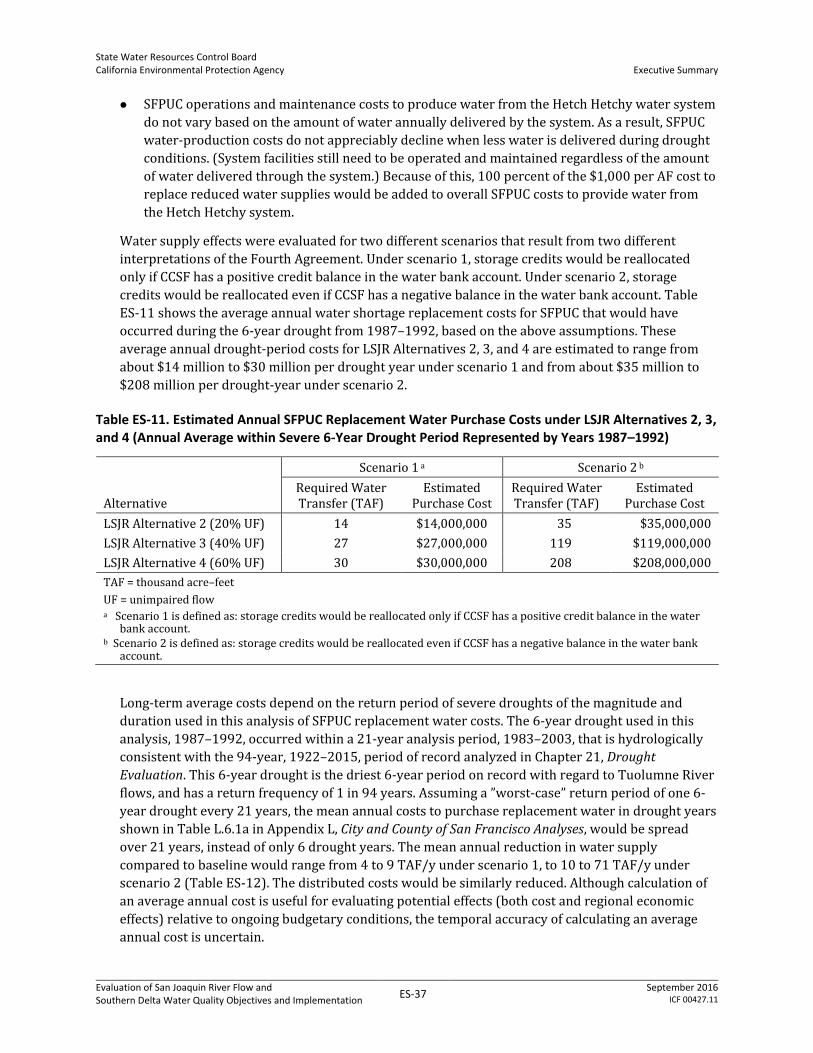
State Water Resources Control Board California Environmental Protection Agency
Executive Summary
Evaluation of San Joaquin River Flow and Southern Delta Water Quality Objectives and Implementation
ES-37 September 2016
ICF 00427.11
SFPUC operations and maintenance costs to produce water from the Hetch Hetchy water system
do not vary based on the amount of water annually delivered by the system. As a result, SFPUC
water-production costs do not appreciably decline when less water is delivered during drought
conditions. (System facilities still need to be operated and maintained regardless of the amount
of water delivered through the system.) Because of this, 100 percent of the $1,000 per AF cost to
replace reduced water supplies would be added to overall SFPUC costs to provide water from
the Hetch Hetchy system.
Water supply effects were evaluated for two different scenarios that result from two different
interpretations of the Fourth Agreement. Under scenario 1, storage credits would be reallocated
only if CCSF has a positive credit balance in the water bank account. Under scenario 2, storage
credits would be reallocated even if CCSF has a negative balance in the water bank account. Table
ES-11 shows the average annual water shortage replacement costs for SFPUC that would have
occurred during the 6-year drought from 1987–1992, based on the above assumptions. These
average annual drought-period costs for LSJR Alternatives 2, 3, and 4 are estimated to range from
about $14 million to $30 million per drought year under scenario 1 and from about $35 million to
$208 million per drought-year under scenario 2.
Table ES-11. Estimated Annual SFPUC Replacement Water Purchase Costs under LSJR Alternatives 2, 3, and 4 (Annual Average within Severe 6-Year Drought Period Represented by Years 1987–1992)
Alternative
Scenario 1 a Scenario 2 b
Required Water Transfer (TAF)
Estimated Purchase Cost
Required Water Transfer (TAF)
Estimated Purchase Cost
LSJR Alternative 2 (20% UF) 14 $14,000,000 35 $35,000,000
LSJR Alternative 3 (40% UF) 27 $27,000,000 119 $119,000,000
LSJR Alternative 4 (60% UF) 30 $30,000,000 208 $208,000,000
TAF = thousand acre–feet
UF = unimpaired flow a Scenario 1 is defined as: storage credits would be reallocated only if CCSF has a positive credit balance in the water
bank account. b Scenario 2 is defined as: storage credits would be reallocated even if CCSF has a negative balance in the water bank
account.
Long-term average costs depend on the return period of severe droughts of the magnitude and
duration used in this analysis of SFPUC replacement water costs. The 6-year drought used in this
analysis, 1987–1992, occurred within a 21-year analysis period, 1983–2003, that is hydrologically
consistent with the 94-year, 1922–2015, period of record analyzed in Chapter 21, Drought
Evaluation. This 6-year drought is the driest 6-year period on record with regard to Tuolumne River
flows, and has a return frequency of 1 in 94 years. Assuming a ”worst-case” return period of one 6-
year drought every 21 years, the mean annual costs to purchase replacement water in drought years
shown in Table L.6.1a in Appendix L, City and County of San Francisco Analyses, would be spread
over 21 years, instead of only 6 drought years. The mean annual reduction in water supply
compared to baseline would range from 4 to 9 TAF/y under scenario 1, to 10 to 71 TAF/y under
scenario 2 (Table ES-12). The distributed costs would be similarly reduced. Although calculation of
an average annual cost is useful for evaluating potential effects (both cost and regional economic
effects) relative to ongoing budgetary conditions, the temporal accuracy of calculating an average
annual cost is uncertain.

State Water Resources Control Board California Environmental Protection Agency
Executive Summary
Evaluation of San Joaquin River Flow and Southern Delta Water Quality Objectives and Implementation
ES-38 September 2016
ICF 00427.11
Table ES-12. Estimated Mean Annual SFPUC Replacement Water Purchase Costs under LSJR Alternatives 2, 3, and 4
Alternative
Scenario 1 a Scenario 2 b
Required Water Transfer (TAF)
Estimated Purchase Cost
Required Water Transfer (TAF)
Estimated Purchase Cost
LSJR Alternative 2 (20% UF) 4 $4,000,000 10 $10,000,000
LSJR Alternative 3 (40% UF) 8 $8,000,000 34 $34,000,000
LSJR Alternative 4 (60% UF) 9 $9,000,000 71 $71,000,000
TAF = thousand acre–feet
UF = unimpaired flow a Scenario 1 is defined as: storage credits would be reallocated only if CCSF has a positive credit balance in the water
bank account. b Scenario 2 is defined as: storage credits would be reallocated even if CCSF has a negative balance in the water bank
account.
Benefits of the Flow Proposal
As mentioned in Section ES2.1, Need for Flow Objectives, nearly every feature of habitat that affects
native fish and wildlife is, to some extent, determined by flow (e.g., temperature, water chemistry,
physical habitat complexity). These habitat features, in turn, affect risk of disease, risk of predation,
reproductive success, growth, smoltification, migration, feeding behavior, and other physiological,
behavioral, and ecological factors that determine the viability of native fish. The benefits of
increased instream flows expected from the flow objectives have a functionally useful effect and are
evaluated and quantified in this SED in two key ways.
Increased attainment of beneficial water temperatures for salmonids over space (more river
miles) and time (more days), thus benefitting growth and survival.
Increased floodplain inundation for salmonids, also in space and time, meaning that more
acreage is inundated more of the time, thus benefitting growth and survival.
There are many other benefits of a more natural flow regime during the spring time period, including
the reduced abundance of nonnative fishes and nonnative aquatic vegetation. Additionally it is
expected that large flow pulses during the spring time period will help juvenile salmonids migrate
successfully to the Delta as a result of increased velocities, increased turbidity pulses, and increased
volumes of water, all of which can reduce predation vulnerability. These other expected benefits are
discussed qualitatively in Appendix C, Technical Report on the Scientific Basis for Alternative San
Joaquin River Flow And Southern Delta Salinity Objectives, and in Chapter 19, Analyses of Benefits to
Native Fish Populations from Increased Flow Between February 1 and June 30.
Under the flow proposal, some of the water previously directed towards water supply in the plan
area would instead remain in the rivers, thus restoring instream flows to levels that are closer to
what they were before the extensive development of water projects in the area. Table ES-13
provides the summary mean annual sum of February–June instream flows under baseline, and for
every 5 percent increment of unimpaired flow from 20–60 percent for each tributary and the total
for the three tributaries in the plan area. The change and percent change from baseline for each 5
percent increment of unimpaired flow are also provided. Flows under 40 percent unimpaired flow
(LSJR Alternative 3) and the 30 to 50 percent adaptive range for the plan area are shown as gray
shading in Table ES-13. The table also shows that baseline flows in the plan area are about 56 TAF/y

State Water Resources Control Board California Environmental Protection Agency
Executive Summary
Evaluation of San Joaquin River Flow and Southern Delta Water Quality Objectives and Implementation
ES-39 September 2016
ICF 00427.11
less than would occur at the 20 percent of unimpaired flow (LSJR Alternative 2). The increases in
instream flows are roughly equivalent to the reductions in water supply shown in Table ES-2 above.
They differ slightly because of altered frequency and magnitude of reservoir spills.
Mean annual February–June instream flow for the combined three tributaries in the plan area would
increase by 288 TAF (26 percent), from 1,116 to 1,404 TAF, under 40 percent unimpaired flow (LSJR
Alternative 3). As shown in Table ES-2, this 26 percent overall increase in instream flow comes at a
surface water supply cost of 293 TAF/y (a 14 percent reduction in surface water supply from 2,068
to 1,775 TAF).
As with the surface water supply effects, increases in instream flows are not distributed evenly
among wet and dry years. Table ES-14 shows that instream flows increase most, in an absolute
sense (as opposed to the highest percent increase) in above normal and below normal years,
increasing by 429 and 426 TAF (38 and 62 percent), respectively in the plan area at 40 percent of
unimpaired flow. The biggest percent increase in the plan area, however, occurs in critically dry
years, with a 283 TAF, or 85 percent increase at 40 percent of unimpaired flow. The increases are
biggest in the Tuolumne and Merced Rivers, where critically dry year flows more than double; flows
increase by 124 and 115 percent, respectively, in critically dry years at 40 percent of unimpaired
flow. This means that flows increase the most during times of greatest current deficit, and also at
times of greatest need. Merced River flows nearly double in above normal, below normal, and dry
years at 40 percent of unimpaired flows. Flow increases overall are bigger at 50 percent of
unimpaired flow and smaller at 30 percent of unimpaired flow.
The following sections show how these increases in flow will result in improvements in temperature
and habitat.
Table ES-13. Mean Annual February–June Instream Flows in the Plan Area
Baseline
Percent Unimpaired Flow
20% 25% 30% 35% 40% 45% 50% 55% 60%
Stanislaus
Volume (TAF) 312 309 323 339 341 374 403 440 476 515
Change (TAF) -3 11 27 30 62 91 128 164 203
Change (%) -1 4 9 9 20 29 41 53 65
Tuolumne
Volume (TAF) 562 594 616 647 660 697 734 782 834 895
Change (TAF) 32 53 85 98 135 171 220 271 332
Change (%) 6 10 15 17 24 30 39 48 59
Merced
Volume (TAF) 242 269 284 304 312 333 353 379 405 435
Change (TAF) 27 42 62 70 91 111 137 163 193
Change (%) 11 17 26 29 38 46 57 67 80
Total Three
Tributaries
Volume (TAF) 1,116 1,172 1,223 1,290 1,313 1,404 1,490 1,601 1,715 1,845
Change (TAF)
56 106 174 197 288 373 485 598 728
Change (%) 5 10 16 18 26 33 43 54 65
Note: Gray shading highlights numbers referred to in the text.
TAF = thousand acre-feet

State Water Resources Control Board California Environmental Protection Agency
Executive Summary
Evaluation of San Joaquin River Flow and Southern Delta Water Quality Objectives and Implementation
ES-40 September 2016
ICF 00427.11
Table ES-14. Mean Annual February–June Instream Flow in the Plan Area by Water Year Type
Year Type
Wet Above
Normal Below
Normal Dry Critically Dry
Stanislaus
Baseline (TAF) 455 380 261 232 134
LSJR Alt 3 (30% UF)* (TAF) 519 382 288 231 155
Change (TAF) 64 2 27 -1 21
Change (%) 14% 1% 10% -1% 15%
LSJR Alt 3 (40% UF) (TAF) 555 440 343 234 175
Change (TAF) 100 60 82 2 41
Change (%) 22% 16% 31% 1% 31%
LSJR Alt 3 (50% UF)* (TAF) 661 523 398 265 201
Change (TAF) 206 143 137 33 67
Change (%) 45% 38% 52% 14% 50%
Tuolumne
Baseline (TAF) 1165 575 297 231 132
LSJR Alt 3 (30% UF)* (TAF) 1196 695 415 320 231
Change (TAF) 31 120 118 89 99
Change (%) 3% 21% 40% 39% 75%
LSJR Alt 3 (40% UF) (TAF) 1177 780 514 387 296
Change (TAF) 12 205 217 156 164
Change (%) 1% 36% 73% 68% 124%
LSJR Alt 3 (50% UF)* (TAF) 1226 903 637 473 365
Change (TAF) 61 328 340 242 233
Change (%) 5% 57% 115% 105% 176%
Merced
Baseline (TAF) 541 178 129 98 68 LSJR Alt 3 (30% UF)* (TAF) 583 282 202 150 118 Change (TAF) 42 104 73 52 50 Change (%) 8% 58% 56% 53% 73% LSJR Alt 3 (40% UF) (TAF) 575 342 256 186 146 Change (TAF) 34 164 127 88 78 Change (%) 6% 92% 98% 90% 115% LSJR Alt 3 (50% UF)* (TAF) 606 421 315 226 176 Change (TAF) 65 243 186 128 108 Change (%) 12% 136% 144% 131% 158%
Total Three Tributaries
Baseline (TAF) 2161 1133 687 561 334
LSJR Alt 3 (30% UF)* (TAF) 2298 1359 905 701 503
Change (TAF) 137 226 218 140 169
Change (%) 6% 20% 32% 25% 51%
LSJR Alt 3 (40% UF) (TAF) 2307 1562 1113 807 617
Change (TAF) 146 429 426 246 283
Change (%) 7% 38% 62% 44% 85%
LSJR Alt 3 (50% UF)* (TAF) 2493 1847 1350 965 741
Change (TAF) 332 714 663 404 407
Change (%) 15% 63% 97% 72% 122% UF = unimpaired flow
TAF = thousand acre-feet
*LSJR Alt 3 (30% UF) and LSJR Alt 3 (50% UF) both refer to LSJR alternative 3 with adaptive implementation

State Water Resources Control Board California Environmental Protection Agency
Executive Summary
Evaluation of San Joaquin River Flow and Southern Delta Water Quality Objectives and Implementation
ES-41 September 2016
ICF 00427.11
Temperature Benefits
Figure ES-3 provides an example of how increased flow increases the percent of the time that the
temperature goal for core rearing of salmon, 60.8°F, is achieved in the Merced River in April under
baseline and for each 10 percent increment of unimpaired flow from 30–60 percent.
Figure ES-3. Percent of Time that Temperature Goal for April Core Rearing is Achieved in the Merced River under Baseline (Base) and Different Unimpaired Flow Conditions at Five Different Locations
Figure ES-3 shows that there is no temperature improvement immediately downstream of Crocker
Huffman Dam at river mile 52 for any of the alternatives because the temperature goal of 60.8°F is
already achieved 100 percent of the time under baseline conditions. There are varying levels of
temperature improvement for the reaches downstream. Fourteen miles downstream of Crocker
Huffman Dam, at river mile 38, the 60.8°F temperature goal is achieved 43 percent of the time under
baseline, and 75 percent of the time at 40 percent of unimpaired flow (43 percent for baseline plus
21 percent at 30 percent of unimpaired flow plus 11percent more for 40 percent of unimpaired
flow). This shows almost a doubling (from 43 to 75 percent) in the frequency that the temperature
target is attained at this specific river mile. If one considers the improvement of temperature with
40 percent of unimpaired flow over the entire 52 mile reach of the Merced from Crocker Huffman
Dam to the confluence with the LSJR, the overall attainment of the core rearing temperature target
in the Merced River increases by 332 mile-days in April, from 610 to 943 mile-days. This is an
increase of 54 percent. The unit of mile-days shows the temperature improvement in terms of both
space (miles) and time (days) for a given month. Mile-days can also be considered as the length of
river in compliance with the temperature criteria totaled each day over a given month. Both spatial
and temporal increases in temperature attainment benefit native fish so long as increases do not
come at the expense of native fish at other times. This example represents an improvement in
meeting temperature targets for just one life stage for 1 month in one tributary.
These benefits during the February–June time period can be summarized in terms of space and time
by looking at changes in the average number of mile-days that temperature targets are achieved
22 2539 43
100
57
1721
0
59
9
11
0
14
15
128
0
10
12
75
0
0
20
40
60
80
100
120
0 13 27 38 52
Perc
en
t o
f ti
me
River Mile : zero is confluence with SJR; 52 is at Crocker Huffman Dam
Merced River - April Core Rearing Percent of Time Temperature Goal Achieved
60%
50%
40%
30%
Base
State Water Resources Control Board California Environmental Protection Agency
Executive Summary
Evaluation of San Joaquin River Flow and Southern Delta Water Quality Objectives and Implementation
ES-42 September 2016
ICF 00427.11
each month for various life stages (adult migration, reproduction [including spawning, egg
incubation, and fry emergence], core rearing, smoltification, and summer rearing). Table ES-15
shows the average number of mile-days for all years that these temperature targets are achieved in
all three tributaries, combined, under baseline, and also for unimpaired flows of 20, 30, 40, 50, and
60 percent.
Table ES-15. Summary of Mean Annual Temperature Benefits with Increased Flows February–June in All Years
Life Stage Month
USEPA Criteria (°F)
Total Mile*Days Possible Base
Base
as % of total possible
Percent of possible mile*days for different unimpaired flows
20% 30% 40% 50% 60%
AM Sep 64.4 4,926 1,222 25% 26% 25% 30% 29% 28%
AM Oct 64.4 5,090 3,268 64% 70% 69% 72% 72% 71%
R Oct 55.4 5,090 343 7% 7% 6% 7% 5% 5%
R Nov 55.4 4,926 1,430 29% 31% 29% 30% 28% 26%
R Dec 55.4 5,090 4,677 92% 95% 95% 95% 94% 94%
R Jan 55.4 5,090 4,972 98% 98% 98% 98% 98% 98%
R Feb 55.4 4,762 3,806 80% 80% 81% 83% 84% 85%
R Mar 55.4 5,090 2,574 51% 52% 55% 57% 62% 66%
CR Mar 60.8 5,090 4,382 86% 87% 90% 93% 95% 96%
CR Apr 60.8 4,926 3,388 69% 71% 78% 83% 87% 91%
CR May 60.8 5,090 2,730 54% 60% 68% 73% 78% 82%
S Apr 57.2 4,926 2,353 48% 49% 53% 56% 61% 66%
S May 57.2 5,090 1,612 32% 34% 38% 42% 49% 54%
S Jun 57.2 4,926 851 17% 19% 21% 23% 26% 28%
SR Jun 64.4 4,926 2,275 46% 53% 59% 63% 68% 71%
SR Jul 64.4 5,090 1,387 27% 28% 27% 30% 30% 29%
SR Aug 64.4 5,090 1,007 20% 21% 19% 19% 19% 18%
Note: Gray shading highlights numbers referred to in the text.
Life Stages: AM= adult migration, R= reproduction (spawning, egg incubation, and fry emergence), CR= core rearing, S =
smoltification, SR= summer rearing
The number of mile-days generally increases under all unimpaired flow percents, relative to
baseline. Temperatures targets are already achieved much of the time under baseline during the
cold weather and high flow months of December and January. The biggest improvements occur for
the core rearing life stage in April and May. Under baseline, temperature targets in the three
tributaries are attained 69 and 54 percent of the time in April and May (see gray shading in Table
ES-15), respectively, for this critical core rearing life stage. Attainment increases to 83 and 73
percent of the time, respectively for April and May (see gray shading in Table ES-15), with 40
percent unimpaired flow. This summary statistic of temperature improvement for all year types,
however, masks the benefits in critically dry years when baseline flows are lowest.
Table ES-16 shows the average number of mile-days that these temperature targets are achieved in
all three tributaries, combined, under baseline, and also for unimpaired flows of 20, 30, 40, 50, and
60 percent, for only critically dry years. The improvements from baseline are much bigger than the
average over all years. This is important because low flow conditions in dry years currently have a

State Water Resources Control Board California Environmental Protection Agency
Executive Summary
Evaluation of San Joaquin River Flow and Southern Delta Water Quality Objectives and Implementation
ES-43 September 2016
ICF 00427.11
negative effect on salmon survival. Under baseline, core rearing temperature targets in the three
tributaries are attained 38 and 22 percent of the time in April and May, respectively in critically dry
years (see gray shading in Table ES-16). Attainment of the temperature criteria increases to 64 and
46 percent of the time, respectively for April and May (see gray shading in Table ES-16), with 40
percent unimpaired flow. The temporal and spatial attainment of the temperature targets more than
doubles in May.
Table ES-16. Summary of Mean Annual Temperature Benefits with Increased Flows February–June in Critically Dry Years
Life Stage Month
USEPA Criteria (°F)
Total Mile*Days Possible Base
Base
% of days possible
Percent of possible mile*days for different unimpaired flows
20% 30% 40% 50% 60%
AM Sep 64.4 4,926 353 7% 10% 10% 10% 10% 9%
AM Oct 64.4 5,090 2,627 52% 64% 63% 66% 65% 63%
R Oct 55.4 5,090 235 5% 5% 4% 5% 3% 3%
R Nov 55.4 4,926 1,043 21% 24% 23% 25% 22% 18%
R Dec 55.4 5,090 4,491 88% 96% 96% 96% 96% 94%
R Jan 55.4 5,090 5,011 98% 98% 98% 98% 98% 98%
R Feb 55.4 4,762 3,159 66% 65% 65% 66% 68% 70%
R Mar 55.4 5,090 827 16% 16% 20% 25% 30% 35%
CR Mar 60.8 5,090 3,803 75% 76% 80% 85% 88% 91%
CR Apr 60.8 4,926 1,876 38% 46% 55% 64% 70% 76%
CR May 60.8 5,090 1,135 22% 30% 39% 46% 50% 55%
S Apr 57.2 4,926 818 17% 20% 25% 30% 35% 40%
S May 57.2 5,090 486 10% 12% 16% 20% 22% 26%
S Jun 57.2 4,926 121 2% 4% 6% 7% 7% 8%
SR Jun 64.4 4,926 645 13% 20% 26% 31% 35% 39%
SR Jul 64.4 5,090 361 7% 9% 9% 9% 9% 9%
SR Aug 64.4 5,090 313 6% 8% 8% 8% 7% 7%
Note: Gray shading highlights numbers referred to in the text.
Life Stages: AM= adult migration, R= reproduction (spawning, egg incubation, and fry emergence), CR= core rearing, S =
smoltification, SR= summer rearing
State Water Resources Control Board California Environmental Protection Agency
Executive Summary
Evaluation of San Joaquin River Flow and Southern Delta Water Quality Objectives and Implementation
ES-44 September 2016
ICF 00427.11
Temperature targets that are protective of salmonids are attained more frequently than under
baseline for all life stages from February–June under 30, 40 and 50 percent of unimpaired flow.
These improvements are low estimates of the temperature improvements that can be achieved with
increased flow because flow patterns were not optimized to achieve temperature benefits. Adaptive
implementation of the blocks of water represented by the various percents of unimpaired flow can
result in even larger benefits. Similarly, there are small reductions in temperature attainment in
some months under some unimpaired flow percents. These reductions, however, will not occur with
the flow shifting and optimization of flows allowed under adaptive implementation. Chapter 19,
Analyses of Benefits to Native Fish Populations from Increased Flow Between February 1 and June 30,
shows more of the detailed temperature benefits for each tributary.
Floodplain Benefits
Increased flows generally result in increased stage or water levels in a river, and can therefore have
an effect on floodplain inundation. Floodplain inundation is important because it can improve the
success of juvenile salmon. In general, higher flows would result in increased floodplain inundation.
The specific amount depends on channel and floodplain geometry. Figure ES-4 shows the
relationship between floodplain inundation and flows in the Tuolumne River.
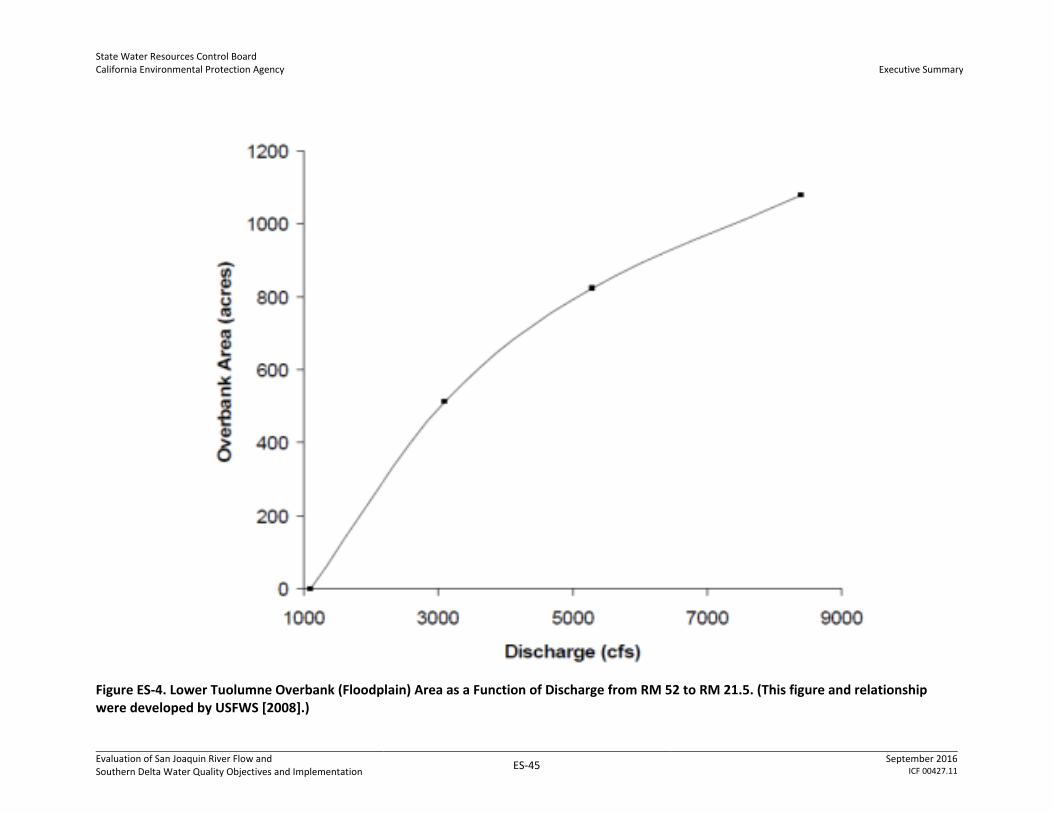
State Water Resources Control Board California Environmental Protection Agency
Executive Summary
Evaluation of San Joaquin River Flow and Southern Delta Water Quality Objectives and Implementation
ES-45 September 2016
ICF 00427.11
Figure ES-4. Lower Tuolumne Overbank (Floodplain) Area as a Function of Discharge from RM 52 to RM 21.5. (This figure and relationship were developed by USFWS [2008].)
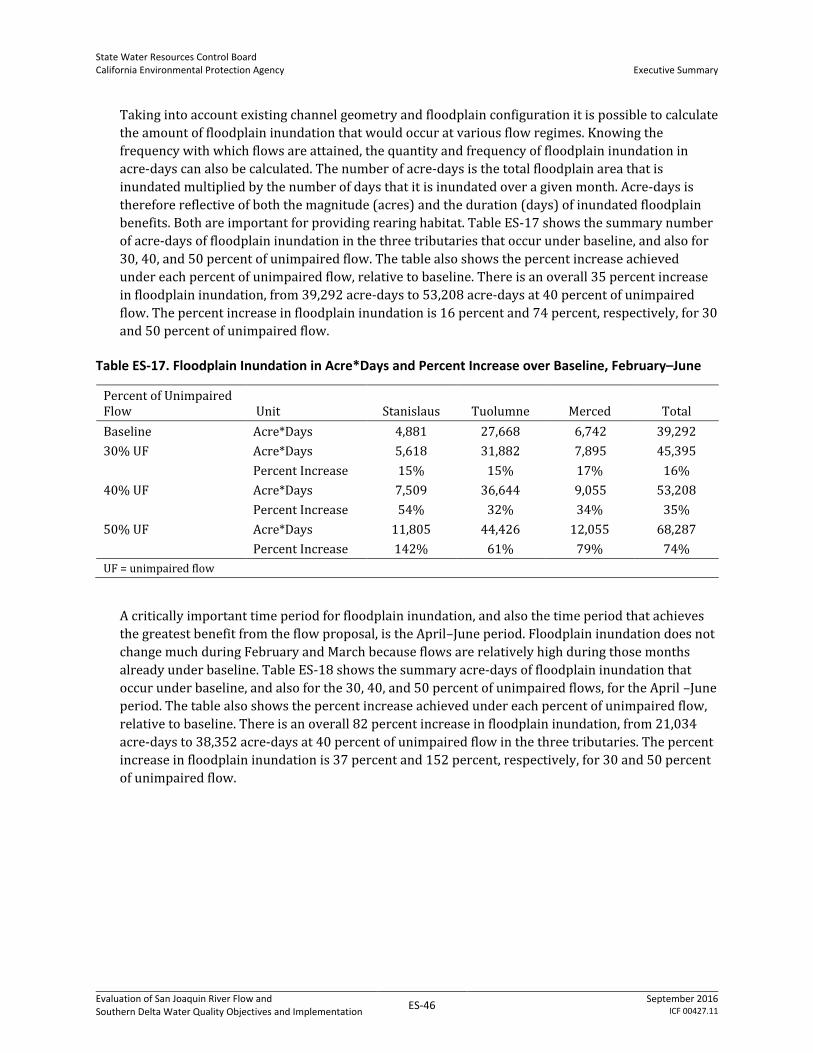
State Water Resources Control Board California Environmental Protection Agency
Executive Summary
Evaluation of San Joaquin River Flow and Southern Delta Water Quality Objectives and Implementation
ES-46 September 2016
ICF 00427.11
Taking into account existing channel geometry and floodplain configuration it is possible to calculate
the amount of floodplain inundation that would occur at various flow regimes. Knowing the
frequency with which flows are attained, the quantity and frequency of floodplain inundation in
acre-days can also be calculated. The number of acre-days is the total floodplain area that is
inundated multiplied by the number of days that it is inundated over a given month. Acre-days is
therefore reflective of both the magnitude (acres) and the duration (days) of inundated floodplain
benefits. Both are important for providing rearing habitat. Table ES-17 shows the summary number
of acre-days of floodplain inundation in the three tributaries that occur under baseline, and also for
30, 40, and 50 percent of unimpaired flow. The table also shows the percent increase achieved
under each percent of unimpaired flow, relative to baseline. There is an overall 35 percent increase
in floodplain inundation, from 39,292 acre-days to 53,208 acre-days at 40 percent of unimpaired
flow. The percent increase in floodplain inundation is 16 percent and 74 percent, respectively, for 30
and 50 percent of unimpaired flow.
Table ES-17. Floodplain Inundation in Acre*Days and Percent Increase over Baseline, February–June
Percent of Unimpaired Flow Unit Stanislaus Tuolumne Merced Total
Baseline Acre*Days 4,881 27,668 6,742 39,292
30% UF Acre*Days 5,618 31,882 7,895 45,395
Percent Increase 15% 15% 17% 16%
40% UF Acre*Days 7,509 36,644 9,055 53,208
Percent Increase 54% 32% 34% 35%
50% UF Acre*Days 11,805 44,426 12,055 68,287
Percent Increase 142% 61% 79% 74%
UF = unimpaired flow
A critically important time period for floodplain inundation, and also the time period that achieves
the greatest benefit from the flow proposal, is the April–June period. Floodplain inundation does not
change much during February and March because flows are relatively high during those months
already under baseline. Table ES-18 shows the summary acre-days of floodplain inundation that
occur under baseline, and also for the 30, 40, and 50 percent of unimpaired flows, for the April –June
period. The table also shows the percent increase achieved under each percent of unimpaired flow,
relative to baseline. There is an overall 82 percent increase in floodplain inundation, from 21,034
acre-days to 38,352 acre-days at 40 percent of unimpaired flow in the three tributaries. The percent
increase in floodplain inundation is 37 percent and 152 percent, respectively, for 30 and 50 percent
of unimpaired flow.

State Water Resources Control Board California Environmental Protection Agency
Executive Summary
Evaluation of San Joaquin River Flow and Southern Delta Water Quality Objectives and Implementation
ES-47 September 2016
ICF 00427.11
Table ES-18. Floodplain Inundation in Acre*Days and Percent Increase over Baseline, April–June
Percent of Unimpaired Flow Unit Stanislaus Tuolumne Merced Total
Baseline Acre*Days 3,217 13,809 4,008 21,034
30% UF Acre*Days 3,844 19,873 5,113 28,831
Percent Increase 19% 44% 28% 37%
40% UF Acre*Days 5,716 26,046 6,589 38,352
Percent Increase 78% 89% 64% 82%
50% UF Acre*Days 9,543 33,939 9,507 52,988
Percent Increase 197% 146% 137% 152%
UF = unimpaired flow
As the flow proposal allows shifting flows in time, flows in February and March, under 40 percent of
unimpaired flow, may be shifted to April and May to achieve levels of floodplain inundation similar
to the 50 percent unimpaired flow. Any such change would have to be balanced against the reduced
benefits of equivalently lower flows in February and March.
As is the case for temperature attainment, the benefits of floodplain inundation are greatest during
dry and critically dry years. Table ES-19 shows the increase in floodplain inundation in the
Tuolumne River for baseline and for each 10 percent increment of unimpaired flow from 20 to 60
percent for each water year type. Under baseline, there was no floodplain inundation in critically dry
years, whereas under 40 percent unimpaired flow there are 4,172 acre- days of floodplain
inundation from April–June. In dry years, floodplain inundation increases by a factor of 14 (1,390
percent), from 602 days to 8,964 acre-days of floodplain inundation. Improvements are similarly
large for the Merced River, where there is no floodplain inundation currently in below normal, dry,
or critically dry years. Improvements are smaller in the Stanislaus River because flows are already
relatively high in dry and critically dry years under baseline.

State Water Resources Control Board California Environmental Protection Agency
Executive Summary
Evaluation of San Joaquin River Flow and Southern Delta Water Quality Objectives and Implementation
ES-48 September 2016
ICF 00427.11
Table ES-19. Average Annual Floodplain Inundation in Acre*Days and Percent Increase over Baseline (April–June) for Tuolumne River
Tuolumne
Percent of Unimpaired Flow Unit
All Year Types Wet
Above Normal
Below Normal Dry Critical
Baseline Acre*Days 13,809 41,553 7,501 555 602 0
20% UF Acre*Days 14,676 43,300 9,318 964 202 0
Percent Increase 6% 4% 24% 74% -66% NA
30% UF Acre*Days 19,873 48,199 19,423 8,465 2,758 1,011
Percent Increase 44% 16% 159% 1424% 358% NA
40% UF Acre*Days 26,046 50,334 30,383 19,862 8,974 4,172
Percent Increase 89% 21% 305% 3477% 1390% NA
50% UF Acre*Days 33,939 56,322 41,223 31,160 16,617 9,411
Percent Increase 146% 36% 450% 5511% 2658% NA
60% UF Acre*Days 41,689 63,025 50,896 40,833 24,441 15,187
Percent Increase 202% 52% 579% 7253% 3957% NA
Note: The percent increase could not be calculated for some river and year type combinations because there was 0
Acre*Days of floodplain under baseline. These value are replaced with NA.
UF = unimpaired flow
Southern Delta Salinity Proposal The current southern Delta salinity objectives are as follows.
0.7 dS/m April–August
1.0 dS/m September–March
There are currently four southern Delta salinity compliance locations at which these objectives
apply.
1. SJR at Brandt Bridge
2. Old River near Middle River
3. Old River at Tracy Road Bridge
4. SJR at Airport Way Bridge near Vernalis (Vernalis)
The first three compliance stations are commonly referred to as the interior Delta salinity
compliance stations. These three stations are in the tidal zone of the Delta and are, therefore, subject
to bidirectional flows, depending on the tides. This distinguishes the interior Delta salinity
compliance stations from the riverine (and non-tidal) station at Vernalis.
The seasonal 0.7 dS/m April–August and 1.0 dS/m September–March salinity objectives at Vernalis
have been routinely met because, as a condition of their water rights permit, the U.S. Bureau of
Reclamation (USBR) releases water from New Melones Reservoir to dilute the salts in the SJR
upstream of Vernalis. In contrast, the 0.7 dS/m objective is frequently not attained at the three
interior Delta salinity compliance locations. Exceedances at the three interior stations occur, in part
State Water Resources Control Board California Environmental Protection Agency
Executive Summary
Evaluation of San Joaquin River Flow and Southern Delta Water Quality Objectives and Implementation
ES-49 September 2016
ICF 00427.11
because the current compliance locations are not representative of salinity in the southern Delta.
The Old River at Tracy Road station, in particular, is affected by local sources of saline water.
Southern Delta Water Quality Alternatives
Analysis of southern Delta water quality and crop salinity requirements have shown that existing
salinity conditions in the overall southern Delta are suitable for all agricultural crops. Because the
existing 0.7 dS/m April–August objective is lower than is needed to reasonably protect the
agricultural beneficial uses, the State Water Board is considering amending the southern Delta
salinity objective to better reflect conditions needed to protect the beneficial use. This SED evaluates
the No Project Alternative (LSJR Alternative 1 and SDWQ Alternative 1) and two other SDWQ
alternatives (SDWQ Alternatives 2 and 3). SDWQ Alternatives 2 and 3 are comprised of a numeric
objective and an associated program of implementation. SDWQ Alternatives 2 and 3 have different
numeric objectives, which are described below. This SED evaluates the water quality needs of the
most salt-sensitive crops grown in the southern Delta, the predominant soil type, and irrigation
practices in the area. Additional information related to these issues is provided in Appendix C,
Technical Report on the Scientific Basis for Alternative San Joaquin River Flow And Southern Delta
Salinity Objectives, and Appendix E, Salt Tolerance of Crops in the Southern Sacramento–San Joaquin
Delta.
No Project Alternative (LSJR Alternative 1 and SDWQ Alternative 1)
SDWQ Alternative 1,together with LSJR Alternative 1,) comprises the No Project Alternative
assumes full compliance with all flow and water quality objectives in the 2006 Bay-Delta Plan as
implemented through D-1641 and the NMFS BO on the Stanislaus River (which is included in the
baseline [See Chapter 4, Introduction to the Analysis, Section 4.7, Baseline, of this SED]). Specifically,
relative to salinity, the No Project Alternative would result in no changes to the existing water
quality objectives for agricultural beneficial uses for the southern Delta established in the 2006 Bay-
Delta Plan and implemented in D-1641 (Table 2 of the Bay-Delta Plan). The 2006 Bay-Delta Plan
states that the maximum 30-day running average of mean daily EC is 0.7 millimhos per centimeter
(mmhos/cm) April 1–August 30 and 1.0 mmhos/cm September 1–March 31 for all water year types
(units of mmhos/cm are equal to units of dS/m). This is applicable to the three interior compliance
stations (C-6, C-8, and P-12) and the compliance station at Vernalis (C-10). Under baseline, these
salinity levels are not always met.
SDWQ Alternative 2
SDWQ Alternative 2 would establish a numeric salinity objective of 1.0 dS/m as a maximum 30-day
running average of mean daily EC for all months in the SJR between Vernalis and Brandt Bridge,
Middle River from Old River to Victoria Canal, and Old River/Grant Line Canal from the Head of Old
River to West Canal.
The southern Delta salinity proposal would also change the locations of the interior southern Delta
salinity compliance locations to the following channel segments:
1. SJR from Vernalis to Brandt Bridge
2. Middle River from Old River to Victoria Canal
3. Old River/Grant Line Canal from Head of Old River to West Canal

State Water Resources Control Board California Environmental Protection Agency
Executive Summary
Evaluation of San Joaquin River Flow and Southern Delta Water Quality Objectives and Implementation
ES-50 September 2016
ICF 00427.11
Substituting these three stream reaches for fixed-point compliance locations is designed to provide
more accurate representations of salinity throughout the southern Delta. The SJR at Airport Way
Bridge near Vernalis compliance location would not change. Revised D-1641 imposes conditions on
USBR’s water rights requiring implementation of EC levels of 0.7 mmhos/cm from April–August and
1.0 mmhos/cm from September–March at Vernalis (units of mmhos/cm are equal to units of dS/m).
USBR would continue to be required to comply with these salinity levels, as a condition of their
water rights, in order to implement and meet the proposed salinity water quality objective in the
interior southern Delta.
The program of implementation for this alternative would continue to require DWR and USBR to
address the impacts of their operations on interior southern Delta salinity levels. Specifically, the
State Water Board would require the development and implementation of a Comprehensive
Operations Plan designed to accomplish the following:
Describe the actions that will fully address the impacts of SWP and CVP export operations on
water levels and flow conditions that may affect salinity conditions in the southern Delta,
including the availability of assimilative capacity for local sources of salinity
Include detailed information regarding the configuration and operations of any facilities relied
upon in the plan
Identify specific performance goals (e.g., water levels, flows) for these facilities
The program of implementation would also require DWR and USBR to conduct studies, and do
monitoring, modeling, and reporting, so that the spatial and temporal distribution of salinity and
associated dynamics of water level and flow conditions in the southern Delta waterways are better
understood and can be better managed. The reporting provisions would require DWR and USBR to
recommend specific alternative compliance locations in, and monitoring protocols for, the three
river segments that comprise the interior southern delta salinity compliance locations.
The SJR flow element complements the southern Delta salinity element by augmenting flow in the
southern delta that would have the incidental benefit of flushing of salts early in the irrigation
season. Spring germination of crops is generally the most salt sensitive crop life stage.
SDWQ Alternative 3
SDWQ Alternative 3 is similar to SDWQ Alternative 2, except the maximum 30-day running average
of mean daily EC is 1.4 dS/m for all months. The compliance locations and all other provisions of
SDWQ Alternative 3 are the same as for SDWQ Alternative 2.
Recommended SDWQ Alternative—Issues to be Resolved
SDWQ Alternative 2, with year-round salinity objectives of 1.0 dS/m at Vernalis and the three interior
Delta compliance locations, is the salinity proposal recommended for adoption. This is a draft proposal
for the State Water Board’s consideration. The State Water Board must consider if the proposed
objective will ensure the reasonable protection of agricultural beneficial uses. This choice between the
different alternatives, which represent different levels of protection that must be weighed against
costs and potential effects, is a primary issue to be resolved by the State Water Board.
State Water Resources Control Board California Environmental Protection Agency
Executive Summary
Evaluation of San Joaquin River Flow and Southern Delta Water Quality Objectives and Implementation
ES-51 September 2016
ICF 00427.11
CEQA Baseline In order to evaluate potential impacts of LSJR and SDWQ alternatives, CEQA requires that the
alternatives be evaluated against an environmental baseline representing the physical
environmental conditions that existed at the time the CEQA process began. The environmental
baseline for this SED is February 2009, the date that the notice of preparation for the SED was
issued. The baseline reflects the physical conditions in 2009 as they existed under the 2006 Bay-
Delta Plan. Each resource chapter in the SED describes the existing environmental conditions
relevant to a particular resource. The modeled baseline allocates flow to comply with the 2006 Bay-
Delta Plan LSJR flow objectives and other flow requirements that existed in 2009, including
implementation of VAMP and the Stanislaus River flow requirements from the NMFS BO. The
baseline does not include the long-term San Joaquin River Restoration Program8 flow requirements;
however, these conditions are considered in the cumulative impacts analysis. The modeled baseline
also includes the flow that the USBR provides to meet the 2006 Bay-Delta Plan salinity objectives at
Vernalis. Because USBR has operated to meet only the Vernalis salinity objectives, periodic
exceedances of salinity objectives at the three interior southern Delta salinity compliance locations
occur in the historical record and likewise remain in the modeled baseline condition. A more
detailed description of the hydrologic setting is provided in Chapter 2, Water Resources.
Summary of Effects This section provides a description of the significant and unavoidable impacts related to the LSJR
and SDWQ alternatives.
LSJR Alternatives
Significant and unavoidable impacts were identified for several resources under the different LSJR
alternatives, including the No Project Alternative (LSJR Alternative 1 and SDWQ Alternative 1)
evaluated in Chapters 5–15. Many of the impacts result from changes in river flows and water
supplies. These changes could occur as a result of releasing stored water, by reducing surface water
diversions through bypassing flows at reservoirs or direct diversion points, or by reoperating
reservoirs, all of which are considered reasonably foreseeable methods of compliance. Changes in
river flow, and water supply effects, will be bigger in the plan area than in the extended plan area.
Separate impact determinations are therefore identified for the plan area and extended plan area.
Table ES-20 summarizes the resources in the plan area that have significant and unavoidable
impacts identified in Chapters 5–15. Table ES-29 at the end of this document summarizes impacts by
resource topics identified in Chapters 5–15. Significant and unavoidable impacts for the extended
plan area, identified in Chapters 5–14, are summarized in Table ES-21. Certain significance
determinations in the extended plan area are different from those identified in the plan area because
the magnitude of the impact can vary between the extended plan area and the plan area. Reservoirs
and streamflows in the extended plan area are smaller than reservoirs and streamflows in the plan
area and, thus, are potentially more susceptible to variations resulting from the LSJR Alternatives 2,
3, or 4 than in the plan area.
8 Implementation of the settlement and the Friant Dam release flows required by the San Joaquin River Restoration Program are expected to increase the existing SJR flows at Stevinson in the near future.
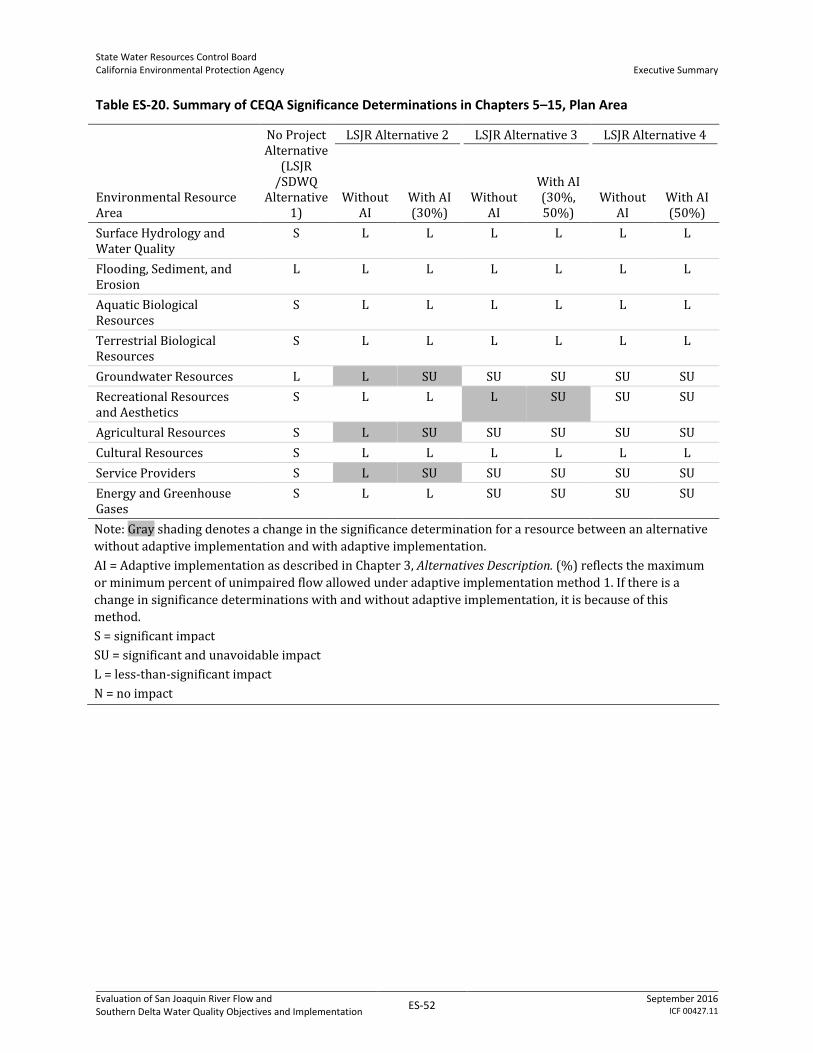
State Water Resources Control Board California Environmental Protection Agency
Executive Summary
Evaluation of San Joaquin River Flow and Southern Delta Water Quality Objectives and Implementation
ES-52 September 2016
ICF 00427.11
Table ES-20. Summary of CEQA Significance Determinations in Chapters 5–15, Plan Area
Environmental Resource Area
No Project Alternative
(LSJR /SDWQ
Alternative 1)
LSJR Alternative 2 LSJR Alternative 3 LSJR Alternative 4
Without AI
With AI (30%)
Without AI
With AI (30%, 50%)
Without AI
With AI (50%)
Surface Hydrology and Water Quality
S L L L L L L
Flooding, Sediment, and Erosion
L L L L L L L
Aquatic Biological Resources
S L L L L L L
Terrestrial Biological Resources
S L L L L L L
Groundwater Resources L L SU SU SU SU SU
Recreational Resources and Aesthetics
S L L L SU SU SU
Agricultural Resources S L SU SU SU SU SU
Cultural Resources S L L L L L L
Service Providers S L SU SU SU SU SU
Energy and Greenhouse Gases
S L L SU SU SU SU
Note: Gray shading denotes a change in the significance determination for a resource between an alternative
without adaptive implementation and with adaptive implementation.
AI = Adaptive implementation as described in Chapter 3, Alternatives Description. (%) reflects the maximum
or minimum percent of unimpaired flow allowed under adaptive implementation method 1. If there is a
change in significance determinations with and without adaptive implementation, it is because of this
method.
S = significant impact
SU = significant and unavoidable impact
L = less-than-significant impact
N = no impact
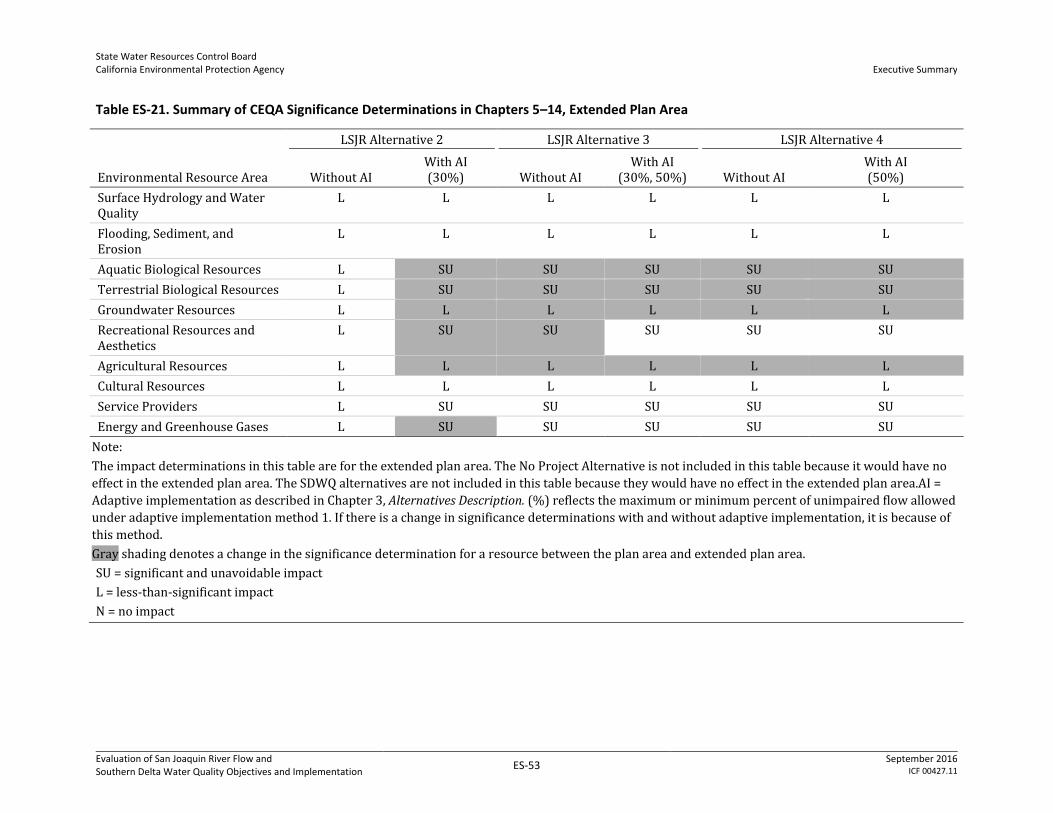
State Water Resources Control Board California Environmental Protection Agency
Executive Summary
Evaluation of San Joaquin River Flow and Southern Delta Water Quality Objectives and Implementation
ES-53 September 2016
ICF 00427.11
Table ES-21. Summary of CEQA Significance Determinations in Chapters 5–14, Extended Plan Area
Environmental Resource Area
LSJR Alternative 2 LSJR Alternative 3 LSJR Alternative 4
Without AI With AI (30%) Without AI
With AI (30%, 50%) Without AI
With AI (50%)
Surface Hydrology and Water Quality
L L L L L L
Flooding, Sediment, and Erosion
L L L L L L
Aquatic Biological Resources L SU SU SU SU SU
Terrestrial Biological Resources L SU SU SU SU SU
Groundwater Resources L L L L L L
Recreational Resources and Aesthetics
L SU SU SU SU SU
Agricultural Resources L L L L L L
Cultural Resources L L L L L L
Service Providers L SU SU SU SU SU
Energy and Greenhouse Gases L SU SU SU SU SU
Note:
The impact determinations in this table are for the extended plan area. The No Project Alternative is not included in this table because it would have no
effect in the extended plan area. The SDWQ alternatives are not included in this table because they would have no effect in the extended plan area.AI =
Adaptive implementation as described in Chapter 3, Alternatives Description. (%) reflects the maximum or minimum percent of unimpaired flow allowed
under adaptive implementation method 1. If there is a change in significance determinations with and without adaptive implementation, it is because of
this method.
Gray shading denotes a change in the significance determination for a resource between the plan area and extended plan area.
SU = significant and unavoidable impact
L = less-than-significant impact
N = no impact
State Water Resources Control Board California Environmental Protection Agency
Executive Summary
Evaluation of San Joaquin River Flow and Southern Delta Water Quality Objectives and Implementation
ES-54 September 2016
ICF 00427.11
The SED discusses the feasibility of implementing mitigation measures to reduce significant impacts.
Significant impacts could generally be reduced by selecting a lower flow alternative or operating at
the lower flow end of the adaptive range. However, as described in Chapters 5–15, mitigation is
either infeasible or will not reduce impacts to a less-than-significant level.
Indirect Actions and Non-Flow Measures
Chapter 16, Evaluation of Other Indirect and Additional Actions, provides a discussion of other
indirect actions and additional actions associated with LSJR Alternatives 2, 3, and 4. The chapter
identifies actions that the regulated community could take to reduce potential reservoir or water
supply effects associated with implementing LSJR Alternatives 2, 3, and 4 and non-flow actions that
are complementary to the flow objectives and that would inform the body of scientific information
potentially used to make adaptive implementation decisions under LSJR Alternatives 2, 3, and 4 (i.e.,
non-flow measures), and analyzes the environmental impacts associated with those actions. The
activities evaluated in Chapter 16 that result in significant and unavoidable impacts include:
Substitution of surface water with groundwater—construction and operation of new
groundwater wells
Recycled water sources for water supply—construction and operation of new recycled
wastewater facilities or increased utilization of existing facilities
In-Delta diversions—construction and operation of new in-delta diversion for SFPUC service
area
Water supply desalinization—construction and operation of desalination plant for SFPUC
service area
New surface water supplies—construction and operation of new surface water reservoirs
Floodplain and riparian habitat restoration—actively restoring floodplain or riparian habitat
adjacent to rivers by creating or expanding existing natural or engineered floodways or flood
bypasses; modifying river or floodplain geometry; planting riparian vegetation; hydrologically
reconnecting historic floodplain; or removal or riprap
Gravel augmentation—artificially adding spawning-size gravel to streams by adding gravel to
streams; modifying river and then adding gravel to streams; or adding larger structures to river
to create hydraulic conditions conducive to gravel deposition and retention
Enhance in-channel complexity—placement of large wood or boulder structures in rivers
Improve temperature conditions—installation or modification of temperature curtains or
shutters in reservoirs
Fish screens—screen existing unscreened diversions with different types of screens in
accordance with established design, operational, and maintenance criteria and guidelines from
wildlife and resource agencies
Physical barrier in the southern Delta—construction and operation of a permanent operable
barrier at the Head of Old River (HORB) barrier in the southern Delta
Predatory fish control—directly remove known predators within the Delta or three eastside
tributaries or modify habitat to remove predator habitat

State Water Resources Control Board California Environmental Protection Agency
Executive Summary
Evaluation of San Joaquin River Flow and Southern Delta Water Quality Objectives and Implementation
ES-55 September 2016
ICF 00427.11
Invasive aquatic vegetation control—small scale and large scale applications of herbicides in the
Delta and small scale mechanical removal of invasive species in the Delta
The construction and operation of the facilities or activities described above could involve impacts
on different resources. The significant and unavoidable impacts of these potential actions are
summarized in Tables ES-22 and ES-23 below. While many of these activities would result in no
impacts or less-than-significant impacts on different resources, the specific impact depends on the
location of the activity, the duration of the activity, the scope of the activity, and the ability of a lead
agency to mitigate potential significant impacts as to whether activities would result in less-than-
significant impacts or significant and unavoidable impacts. Lead agencies or other entities that
undertake the these actions or non-flow measures would be responsible for adopting and
implementing mitigation measures at the appropriate time; however, potential mitigation measures
are proposed in Chapter 16 (Tables 16-38 and 16-39) that lead agencies or other entities can and
should adopt to reduce potentially significant impacts.
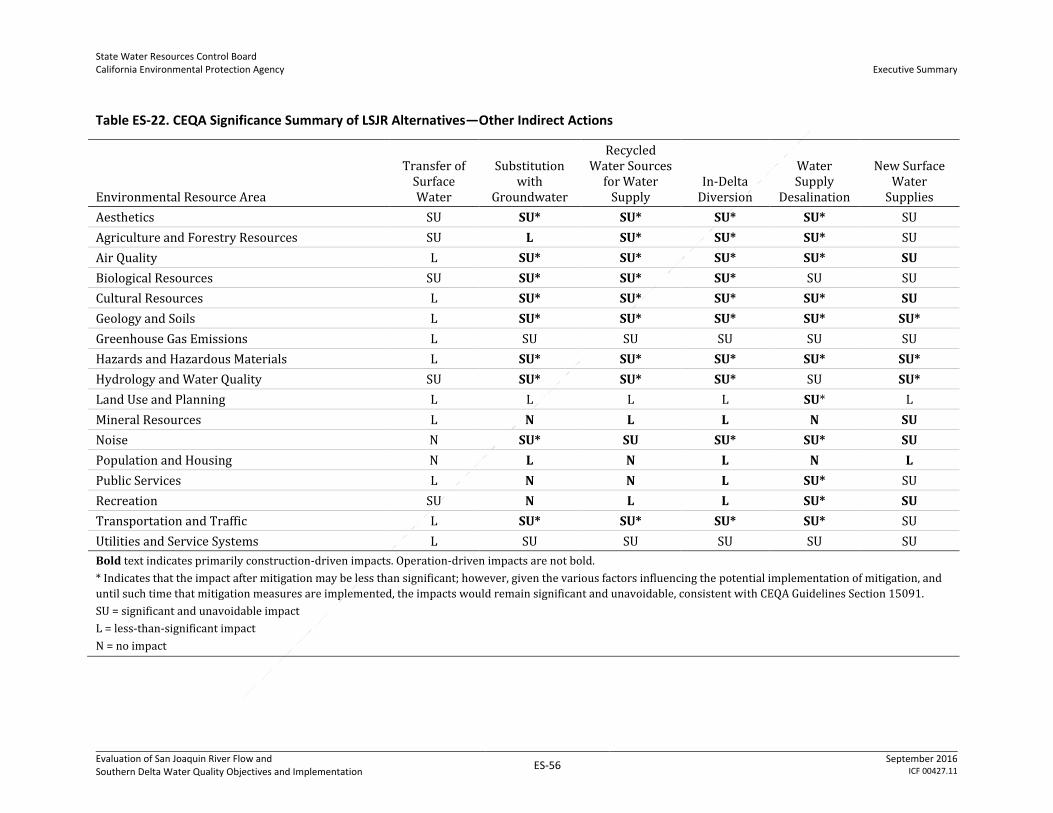
State Water Resources Control Board California Environmental Protection Agency
Executive Summary
Evaluation of San Joaquin River Flow and Southern Delta Water Quality Objectives and Implementation
ES-56 September 2016
ICF 00427.11
Table ES-22. CEQA Significance Summary of LSJR Alternatives—Other Indirect Actions
Environmental Resource Area
Transfer of Surface Water
Substitution with
Groundwater
Recycled Water Sources
for Water Supply
In-Delta Diversion
Water Supply
Desalination
New Surface Water
Supplies
Aesthetics SU SU* SU* SU* SU* SU
Agriculture and Forestry Resources SU L SU* SU* SU* SU
Air Quality L SU* SU* SU* SU* SU
Biological Resources SU SU* SU* SU* SU SU
Cultural Resources L SU* SU* SU* SU* SU
Geology and Soils L SU* SU* SU* SU* SU*
Greenhouse Gas Emissions L SU SU SU SU SU
Hazards and Hazardous Materials L SU* SU* SU* SU* SU*
Hydrology and Water Quality SU SU* SU* SU* SU SU*
Land Use and Planning L L L L SU* L
Mineral Resources L N L L N SU
Noise N SU* SU SU* SU* SU
Population and Housing N L N L N L
Public Services L N N L SU* SU
Recreation SU N L L SU* SU
Transportation and Traffic L SU* SU* SU* SU* SU
Utilities and Service Systems L SU SU SU SU SU
Bold text indicates primarily construction-driven impacts. Operation-driven impacts are not bold.
* Indicates that the impact after mitigation may be less than significant; however, given the various factors influencing the potential implementation of mitigation, and
until such time that mitigation measures are implemented, the impacts would remain significant and unavoidable, consistent with CEQA Guidelines Section 15091.
SU = significant and unavoidable impact
L = less-than-significant impact
N = no impact
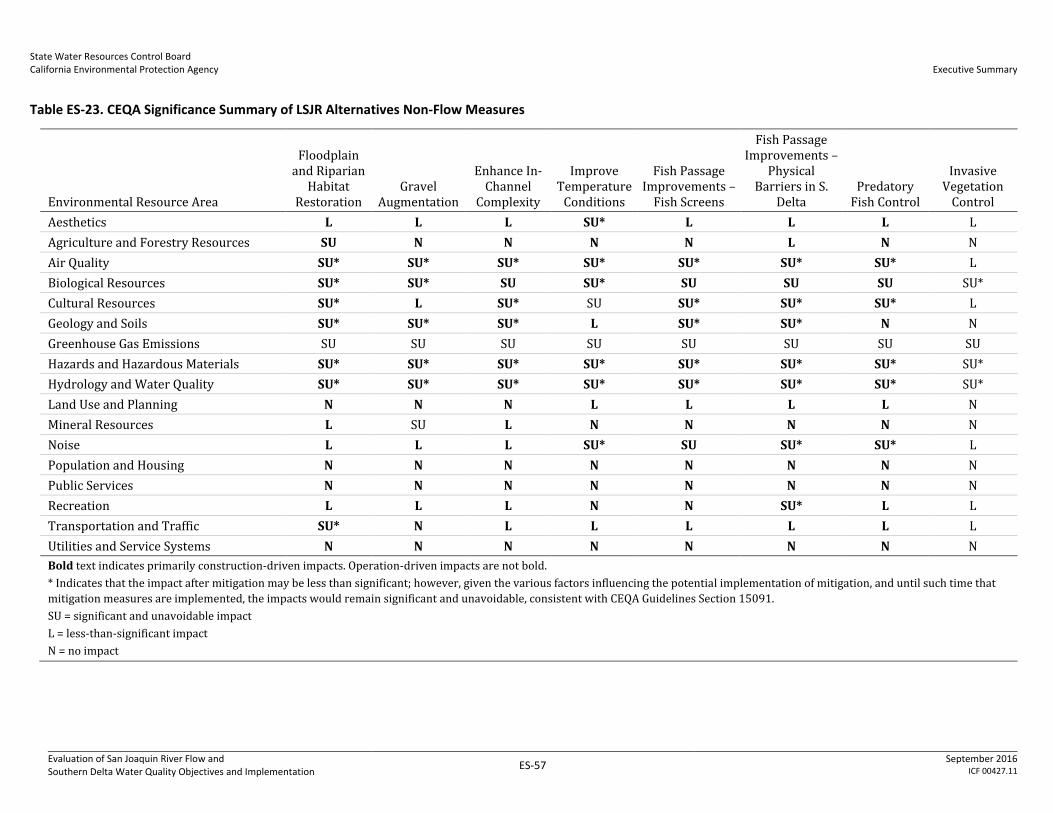
State Water Resources Control Board California Environmental Protection Agency
Executive Summary
Evaluation of San Joaquin River Flow and Southern Delta Water Quality Objectives and Implementation
ES-57 September 2016
ICF 00427.11
Table ES-23. CEQA Significance Summary of LSJR Alternatives Non-Flow Measures
Environmental Resource Area
Floodplain and Riparian
Habitat Restoration
Gravel Augmentation
Enhance In-Channel
Complexity
Improve Temperature
Conditions
Fish Passage Improvements –
Fish Screens
Fish Passage Improvements –
Physical Barriers in S.
Delta Predatory
Fish Control
Invasive Vegetation
Control
Aesthetics L L L SU* L L L L
Agriculture and Forestry Resources SU N N N N L N N
Air Quality SU* SU* SU* SU* SU* SU* SU* L
Biological Resources SU* SU* SU SU* SU SU SU SU*
Cultural Resources SU* L SU* SU SU* SU* SU* L
Geology and Soils SU* SU* SU* L SU* SU* N N
Greenhouse Gas Emissions SU SU SU SU SU SU SU SU
Hazards and Hazardous Materials SU* SU* SU* SU* SU* SU* SU* SU*
Hydrology and Water Quality SU* SU* SU* SU* SU* SU* SU* SU*
Land Use and Planning N N N L L L L N
Mineral Resources L SU L N N N N N
Noise L L L SU* SU SU* SU* L
Population and Housing N N N N N N N N
Public Services N N N N N N N N
Recreation L L L N N SU* L L
Transportation and Traffic SU* N L L L L L L
Utilities and Service Systems N N N N N N N N
Bold text indicates primarily construction-driven impacts. Operation-driven impacts are not bold.
* Indicates that the impact after mitigation may be less than significant; however, given the various factors influencing the potential implementation of mitigation, and until such time that
mitigation measures are implemented, the impacts would remain significant and unavoidable, consistent with CEQA Guidelines Section 15091.
SU = significant and unavoidable impact
L = less-than-significant impact
N = no impact
State Water Resources Control Board California Environmental Protection Agency
Executive Summary
Evaluation of San Joaquin River Flow and Southern Delta Water Quality Objectives and Implementation
ES-58 September 2016
ICF 00427.11
SDWQ Alternatives
As discussed in Chapter 5, Surface Hydrology and Water Quality, the water quality of the southern
Delta under SDWQ Alternatives 2 or 3 would not result in a change to the general range of historical
salinity in the southern Delta (0.2 dS/m–1.2 dS/m). As there is no change to baseline conditions,
there is no change in the existing physical conditions. Table ES-29 presents a summary of impact
determinations primarily associated with water quality discussed in Chapters 5–15. It is reasonably
foreseeable, however, that actions the regulated community could take to comply with the SDWQ
Alternatives 2 and 3, such as the construction and operation of facilities in the southern Delta, may
result in environmental impacts (summarized below Table ES-24). Chapter 16, Evaluation of Other
Indirect and Additional Actions, provides a discussion of the reasonably foreseeable methods of
compliance that the regulated community could take to comply with SDWQ Alternatives 2 and 3 and
the potential environmental effects of those actions. The activities evaluated in Chapter 16 that
result in significant and unavoidable impacts include:
New source water supplies—develop and use alternate low-salinity municipal water supplies
Salinity pretreatment programs—implement industrial and residential salinity source controls
Desalination (wastewater treatment plants)—construct and operate salinity removal facilities at
municipal wastewater treatment plants
Agricultural return flow salinity control (real-time management)—shift the agricultural
discharge timing such that the agricultural return flow released from agricultural lands would
occur during times of high assimilative capacity for the receiving waters. This would require the
construction and operation of detention ponds
Low lift pumping stations—construct and operate either temporary or permanent pumping
system(s) near the Middle River, Grant Line Canal, and/or Old River at Tracy Road Temporary
Barriers Project in the southern Delta
The lead agencies or other entities that undertake the methods of compliance would be responsible
for adopting and implementing mitigation measures at the appropriate time to reduce potentially
significant impacts; however, mitigation measures are proposed in Chapter 16 (Table 16-38) that
lead agencies or other entities can and should adopt to reduce potentially significant impacts.
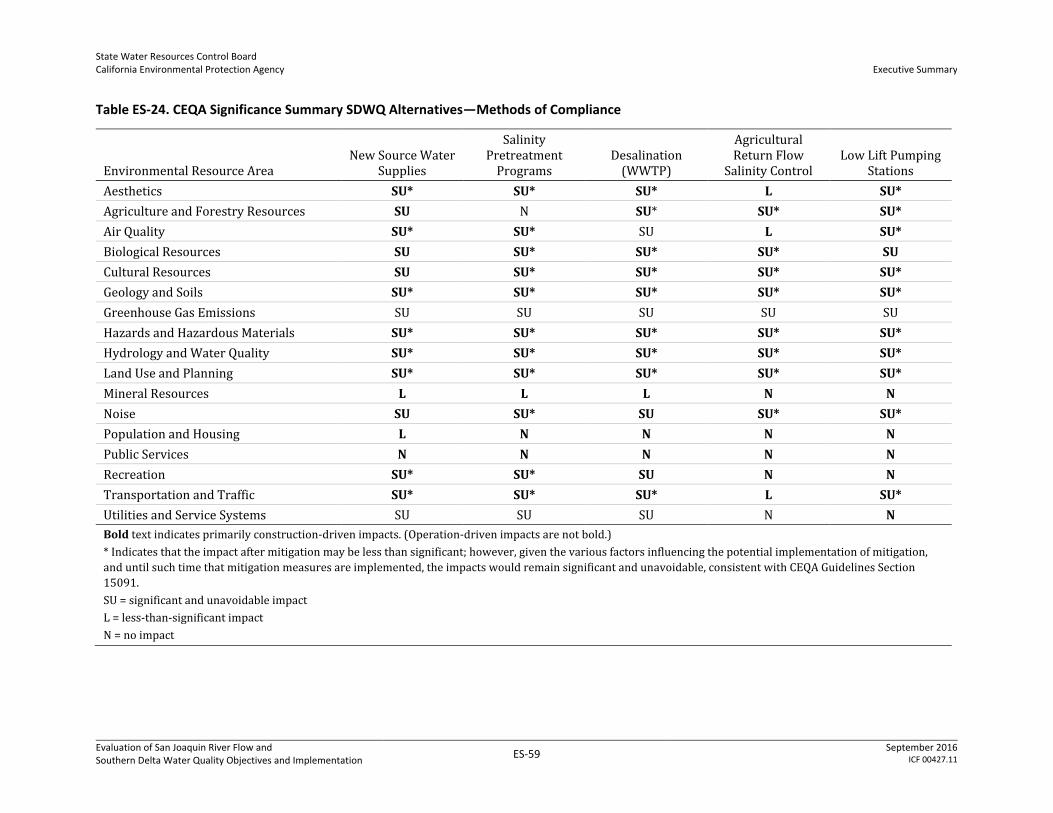
State Water Resources Control Board California Environmental Protection Agency
Executive Summary
Evaluation of San Joaquin River Flow and Southern Delta Water Quality Objectives and Implementation
ES-59 September 2016
ICF 00427.11
Table ES-24. CEQA Significance Summary SDWQ Alternatives—Methods of Compliance
Environmental Resource Area New Source Water
Supplies
Salinity Pretreatment
Programs Desalination
(WWTP)
Agricultural Return Flow
Salinity Control Low Lift Pumping
Stations
Aesthetics SU* SU* SU* L SU*
Agriculture and Forestry Resources SU N SU* SU* SU*
Air Quality SU* SU* SU L SU*
Biological Resources SU SU* SU* SU* SU
Cultural Resources SU SU* SU* SU* SU*
Geology and Soils SU* SU* SU* SU* SU*
Greenhouse Gas Emissions SU SU SU SU SU
Hazards and Hazardous Materials SU* SU* SU* SU* SU*
Hydrology and Water Quality SU* SU* SU* SU* SU*
Land Use and Planning SU* SU* SU* SU* SU*
Mineral Resources L L L N N
Noise SU SU* SU SU* SU*
Population and Housing L N N N N
Public Services N N N N N
Recreation SU* SU* SU N N
Transportation and Traffic SU* SU* SU* L SU*
Utilities and Service Systems SU SU SU N N
Bold text indicates primarily construction-driven impacts. (Operation-driven impacts are not bold.)
* Indicates that the impact after mitigation may be less than significant; however, given the various factors influencing the potential implementation of mitigation,
and until such time that mitigation measures are implemented, the impacts would remain significant and unavoidable, consistent with CEQA Guidelines Section
15091.
SU = significant and unavoidable impact
L = less-than-significant impact
N = no impact
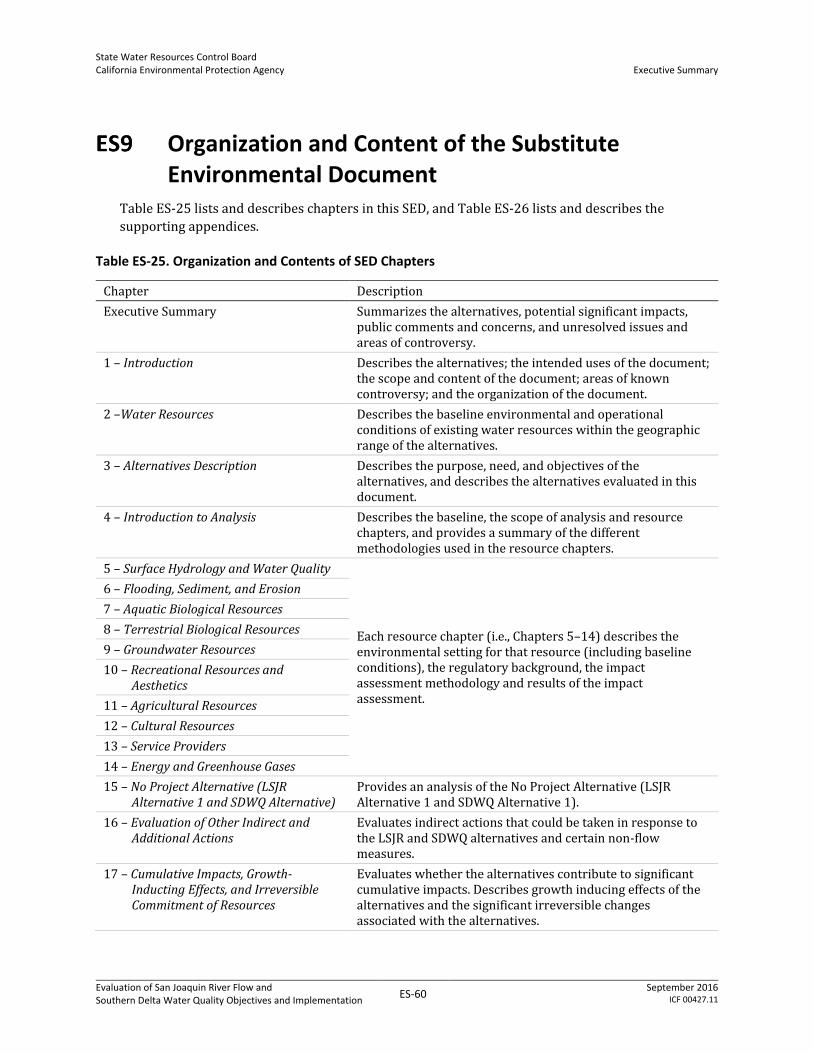
State Water Resources Control Board California Environmental Protection Agency
Executive Summary
Evaluation of San Joaquin River Flow and Southern Delta Water Quality Objectives and Implementation
ES-60 September 2016
ICF 00427.11
Organization and Content of the Substitute Environmental Document
Table ES-25 lists and describes chapters in this SED, and Table ES-26 lists and describes the
supporting appendices.
Table ES-25. Organization and Contents of SED Chapters
Chapter Description
Executive Summary Summarizes the alternatives, potential significant impacts, public comments and concerns, and unresolved issues and areas of controversy.
1 – Introduction Describes the alternatives; the intended uses of the document; the scope and content of the document; areas of known controversy; and the organization of the document.
2 –Water Resources Describes the baseline environmental and operational conditions of existing water resources within the geographic range of the alternatives.
3 – Alternatives Description Describes the purpose, need, and objectives of the alternatives, and describes the alternatives evaluated in this document.
4 – Introduction to Analysis Describes the baseline, the scope of analysis and resource chapters, and provides a summary of the different methodologies used in the resource chapters.
5 – Surface Hydrology and Water Quality
Each resource chapter (i.e., Chapters 5–14) describes the environmental setting for that resource (including baseline conditions), the regulatory background, the impact assessment methodology and results of the impact assessment.
6 – Flooding, Sediment, and Erosion
7 – Aquatic Biological Resources
8 – Terrestrial Biological Resources
9 – Groundwater Resources
10 – Recreational Resources and Aesthetics
11 – Agricultural Resources
12 – Cultural Resources
13 – Service Providers
14 – Energy and Greenhouse Gases
15 – No Project Alternative (LSJR Alternative 1 and SDWQ Alternative)
Provides an analysis of the No Project Alternative (LSJR Alternative 1 and SDWQ Alternative 1).
16 – Evaluation of Other Indirect and Additional Actions
Evaluates indirect actions that could be taken in response to the LSJR and SDWQ alternatives and certain non-flow measures.
17 – Cumulative Impacts, Growth-Inducting Effects, and Irreversible Commitment of Resources
Evaluates whether the alternatives contribute to significant cumulative impacts. Describes growth inducing effects of the alternatives and the significant irreversible changes associated with the alternatives.
State Water Resources Control Board California Environmental Protection Agency
Executive Summary
Evaluation of San Joaquin River Flow and Southern Delta Water Quality Objectives and Implementation
ES-61 September 2016
ICF 00427.11
Chapter Description
18 – Summary of Impacts and Comparison of Alternatives
Summarizes and compares the impacts of each alternative and identifies the environmentally superior alternative.
19 – Analyses of Benefits to Native Fish Populations from Increased Flow Between February 1 and June 30
Describes biologically important and measurable benefits of providing higher and more variable flow during the February 1 through June 30 time period
20 – Economic Analyses Discusses the direct and regional economic costs and benefits associated with the different alternatives.
21 – Drought Evaluation Describes the annual runoff and water supply conditions during the 1922-2003 period and recent period of 2004-2015 used to evaluate drought periods under baseline conditions and the LSJR alternatives.
22 – Integrated Discussion of Potential Municipal and Domestic Water Supply Management Options
Summarizes information related to the groundwater and drinking water supply relied upon for municipal and domestic needs in the plan area and the four primary groundwater subbasins.
23 – Antidegradation Analysis Analyzes the proposed amendments under state and federal antidegradation policies that require the protection of existing high quality waters.
24 – List of Preparers Lists the individuals involved in preparing this SED.
Table ES-26. Organization and Contents of SED Appendices
Appendix Description
A - NOP Scoping and Other Public Meetings
Summarizes scoping and public consultation during the environmental review process.
B - State Water Board’s Environmental Checklist, Appendix A to the State Water Board’s CEQA Regulations
Identifies potential adverse effects of the proposed plan amendments on environmental resources.
C - Technical Report on the Scientific Basis For Alternative San Joaquin River Flow and Southern Delta Salinity Objectives
Provides the scientific basis for developing SJR flow objectives for the protection of fish and wildlife beneficial uses and a program of implementation to achieve those objectives; provides the scientific basis for developing water quality objectives and a program of implementation to protect agricultural beneficial uses in the southern Delta; and describes some of the tools and methods (e.g., Water Supply Effects model) used to analyze the effect of flow and southern Delta water quality alternatives.
D - Evaluation of the No Project Alternative (LSJR Alternative 1 and SDWQ Alternative 1)
Provides a technical evaluation of the No Project Alternative and assumptions used to estimate the changes in flows needed to fully comply with the No Project Alternative (i.e., the 2006 Bay-Delta Plan as implemented through D-1641).
E - Salt Tolerance of Crops in the Southern Sacramento–San Joaquin Delta
Summarizes research regarding the effects of salinity on a variety of irrigated crops grown in the southern Delta and quantifies how the various factors influencing the use of saline water applies to conditions in the southern Delta.
F.1 - Hydrologic and Water Quality Modeling
Describes the hydrologic and water quality modeling methods and results used to evaluate baseline and the LSJR alternatives.
State Water Resources Control Board California Environmental Protection Agency
Executive Summary
Evaluation of San Joaquin River Flow and Southern Delta Water Quality Objectives and Implementation
ES-62 September 2016
ICF 00427.11
Appendix Description
F.2 - Evaluation of Historical Flow and Salinity Measurements of the Lower San Joaquin River and Southern Delta
Describes and evaluates the measured flow and salinity patterns along the LSJR and in the southern Delta for 1984–2011.
G - Agricultural Economic Effects of Lower San Joaquin River Flow Alternatives: Methodology and Modeling Results
Describes the methods and modeling results that estimate potential effects on groundwater, agricultural production, and associated impacts on the LSJR Watershed economy. Estimated changes in allowable surface water diversions and groundwater pumping that result from implementation of the LSJR alternatives are used to derive these impacts.
H -Supporting Materials for Chapter 16 Provides supporting information related to the following discussions in Chapter 16: in-Delta diversions for water supply, desalinization for water supply, and the temporary barrier program.
I - Cultural Resources Overview Provides an overview of the prehistoric and historic cultural setting, as well as the paleontological setting for the northern San Joaquin Valley and the adjacent Sierra Nevada foothills within the plan area.
J - Hydropower and Electric Grid Analysis of Lower San Joaquin River Flow Alternatives
Provides estimates of the potential effects on hydropower generation and electric grid reliability through implementation of the LSJR alternatives.
K - Revised Water Quality Control Plan Presents proposed amendments to the Bay-Delta Plan, focusing on the LSJR flow objectives for the reasonable protection of fish and wildlife beneficial uses and the southern Delta water quality objectives for agricultural beneficial uses, the compliance locations for these objectives, and the Program of Implementation to achieve these objectives.
L - City and County of San Francisco Analyses
Describes possible effects of the LSJR alternatives on CCSF’s water supply, including conditions under which potential water shortages may occur within the CCSF service area and related indirect regional economic effects in the CCSF service area resulting from estimated changes in allowable surface water diversions.
M - Summary of Public Comments on the 2012 Draft SED
Provides a summary of public comments received by the State Water Board regarding the 2012 Draft SED.
Intended Uses of This SED This SED is intended to inform the State Water Board’s decision to adopt proposed amendments to
the 2006 Bay-Delta Plan, which was adopted by the State Water Board by Resolution No. 2006-0098
on December 13, 2006. The State Water Board is the only public agency with discretionary approval
over the proposed amendments to the Bay-Delta Plan and, therefore, no other agencies are expected
to use this SED for decision making. There are no additional decisions, permits, or approvals
required by the State Water Board prior to adopting the proposed amendments. Upon adoption by
the State Water Board, the plan amendments will be submitted to the Office of Administrative Law
for approval and to the U.S. Environmental Protection Agency for approval, as appropriate. Review
and consultation requirements are included in Section ES8.4.

State Water Resources Control Board California Environmental Protection Agency
Executive Summary
Evaluation of San Joaquin River Flow and Southern Delta Water Quality Objectives and Implementation
ES-63 September 2016
ICF 00427.11
This SED fulfills the requirements of CEQA to analyze the environmental effects of a proposed
project, as well as other applicable state law requirements. As discussed above, the State Water
Board’s water quality control planning program is a certified regulatory program and, thus, a SED
may be prepared in lieu of an EIR. The State Water Board has adopted regulations under CEQA that
specify the objectives, criteria, and procedures to be followed in implementing CEQA (Cal. Code
Regs., tit. 23, §§ 3720 -3781). Among other things, the State Water Board’s CEQA regulations provide
the exclusive procedural requirements for the implementation of the State Water Board’s certified
regulatory program (Id. § 3720, subd. (c)(2)). California Code of Regulations, Title 23, Section 3777
requires the SED to include a description of the proposed activity, an identification of any significant
or potentially significant adverse environmental effects, an analysis of reasonable alternatives and
mitigation measures to avoid or reduce any significant or potentially significant adverse
environmental impacts, and an analysis of the reasonably foreseeable methods of compliance.
Section 3777(a) also requires the State Water Board to complete an environmental checklist as part
of its SED. This checklist is provided in Appendix B, State Water Board’s Environmental Checklist, of
this SED.
In addition, the State Water Board must fulfill other obligations when adopting certain rules or
regulations, as described in Public Resources Code Section 21159.9 Section 21159 provides that an
agency shall perform, at the time of the adoption of a rule or regulation requiring the installation of
pollution control equipment, or a performance standard or treatment requirement, an
environmental analysis of the reasonably foreseeable methods of compliance. The statute further
requires that the environmental analysis, at a minimum, include all of the following.
An analysis of the reasonably foreseeable environmental impacts of the methods of compliance
An analysis of reasonably foreseeable feasible mitigation measures
An analysis of reasonably foreseeable alternative means of compliance with the rule or
regulation. (Pub. Resources Code, § 21159(a).)
Section 21159(c) requires that the environmental analysis take into account a reasonable range of
environmental, economic, and technical factors, population and geographic areas, and specific sites.
Public Resources Code Section 21159(d) specifically states that the public agency is not required to
conduct a “project level analysis.” Instead, any project level analysis will be performed in compliance
with CEQA when specific actions are considered to implement the Bay-Delta Plan. Accordingly, the
environmental impacts associated with project-level actions will necessarily depend upon actions
taken to implement the plan.
In addition to CEQA’s requirements, the State Water Board’s amendments to the 2006 Bay-Delta
Plan must be prepared in accordance with applicable water quality planning provisions of the
Porter-Cologne Act, Water Code Section 13000 et seq., and other applicable laws. Section 13241 of
the Porter-Cologne Act identifies certain factors that must be evaluated when establishing water
quality objectives. These factors include: (1) past, present, and probable future beneficial uses of
water; (2) environmental characteristics of the hydrographic unit under consideration, including the
quality of water available thereto; (3) water quality conditions that could reasonably be achieved
through the coordinated control of all factors that affect water quality in the area; (4) economic
considerations; (5) the need for developing housing within the region; and (6) the need to develop
9 The State Water Board’s CEQA regulations (Cal. Code Regs., tit. 23, § 3777) incorporate the key requirements of Public Resources Code Section 21159.
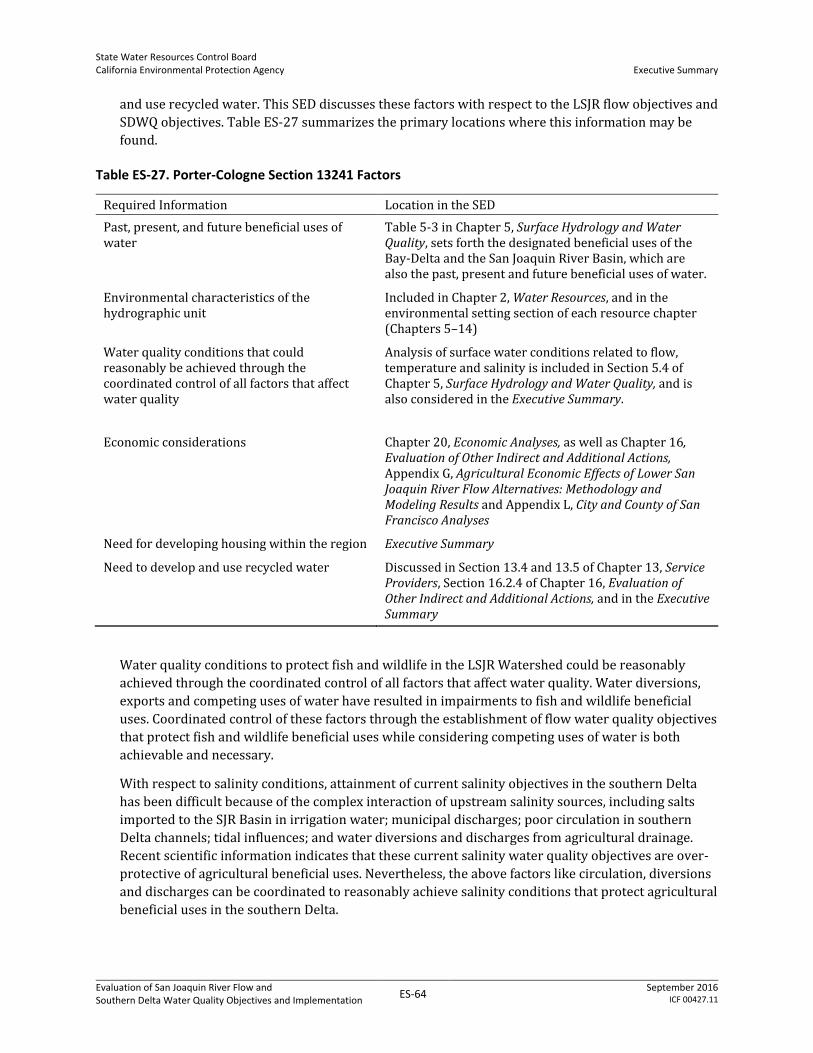
State Water Resources Control Board California Environmental Protection Agency
Executive Summary
Evaluation of San Joaquin River Flow and Southern Delta Water Quality Objectives and Implementation
ES-64 September 2016
ICF 00427.11
and use recycled water. This SED discusses these factors with respect to the LSJR flow objectives and
SDWQ objectives. Table ES-27 summarizes the primary locations where this information may be
found.
Table ES-27. Porter-Cologne Section 13241 Factors
Required Information Location in the SED
Past, present, and future beneficial uses of water
Table 5-3 in Chapter 5, Surface Hydrology and Water Quality, sets forth the designated beneficial uses of the Bay-Delta and the San Joaquin River Basin, which are also the past, present and future beneficial uses of water.
Environmental characteristics of the hydrographic unit
Included in Chapter 2, Water Resources, and in the environmental setting section of each resource chapter (Chapters 5–14)
Water quality conditions that could reasonably be achieved through the coordinated control of all factors that affect water quality
Analysis of surface water conditions related to flow, temperature and salinity is included in Section 5.4 of Chapter 5, Surface Hydrology and Water Quality, and is also considered in the Executive Summary.
Economic considerations Chapter 20, Economic Analyses, as well as Chapter 16, Evaluation of Other Indirect and Additional Actions, Appendix G, Agricultural Economic Effects of Lower San Joaquin River Flow Alternatives: Methodology and Modeling Results and Appendix L, City and County of San Francisco Analyses
Need for developing housing within the region Executive Summary
Need to develop and use recycled water
Discussed in Section 13.4 and 13.5 of Chapter 13, Service Providers, Section 16.2.4 of Chapter 16, Evaluation of Other Indirect and Additional Actions, and in the Executive Summary
Water quality conditions to protect fish and wildlife in the LSJR Watershed could be reasonably
achieved through the coordinated control of all factors that affect water quality. Water diversions,
exports and competing uses of water have resulted in impairments to fish and wildlife beneficial
uses. Coordinated control of these factors through the establishment of flow water quality objectives
that protect fish and wildlife beneficial uses while considering competing uses of water is both
achievable and necessary.
With respect to salinity conditions, attainment of current salinity objectives in the southern Delta
has been difficult because of the complex interaction of upstream salinity sources, including salts
imported to the SJR Basin in irrigation water; municipal discharges; poor circulation in southern
Delta channels; tidal influences; and water diversions and discharges from agricultural drainage.
Recent scientific information indicates that these current salinity water quality objectives are over-
protective of agricultural beneficial uses. Nevertheless, the above factors like circulation, diversions
and discharges can be coordinated to reasonably achieve salinity conditions that protect agricultural
beneficial uses in the southern Delta.
State Water Resources Control Board California Environmental Protection Agency
Executive Summary
Evaluation of San Joaquin River Flow and Southern Delta Water Quality Objectives and Implementation
ES-65 September 2016
ICF 00427.11
The SJR flow element of the proposal complements the southern Delta salinity element by
augmenting flow in the southern delta, particularly in February–June. Increased flows under the
flow alternatives would have the incidental benefit of flushing of salts early in the irrigation season,
and providing low salinity water during spring germination of crops, which is generally the most
salt sensitive crop lifestage.
The proposed flow and salinity objectives do not directly restrict the development of housing in the
plan area and the extended plan area. Also, as explained in Chapter 17, Cumulative Impacts, Growth-
Inducing Effects, and Irreversible Commitment of Resources, of this SED would not induce growth and
new housing development. Depending on the alternative, however, the flow objectives could result
in reduced surface and groundwater supplies such that additional infrastructure to treat or provide
alternative sources of water may need to be constructed, as explained in Chapter 13, Service
Providers. Where alternative sources are not provided, it may affect new housing development
because there may be insufficient supplies to serve the development.
The need to develop and use recycled water will be increasingly important in the state to meet the
demands on water supply placed by increased population, droughts, and climate change. To the
extent that the LSJR alternatives result in reduced surface and groundwater supplies available for
diversion, they will promote the development of recycled water as the need for alternate sources of
water increase. Recycled water could also be used to offset the use of potable water for non-potable
uses such as landscape irrigation, process water and irrigated agriculture for nonhuman
consumptive crops. The SDWQ alternatives would not affect the need for recycled water.
Scope of Content and Analysis
In developing this SED, the State Water Board considered the proposed plan amendments and the
potential environmental effects associated with the amendments, comments received in response to
the notice of preparation and during public consultation, other public comments and information,
and the environmental issues identified in Appendix A of the State Water Board’s CEQA regulations
(Cal. Code Regs., tit. 23, §§ 3720-3781) (Appendix B of this SED). The State Water Board determined
in Appendix B that potentially significant impacts on the following resources could occur as a result
of the LSJR flow objectives or SDWQ objectives. These effects are further evaluated in this SED.
Surface Hydrology and Water Quality
Flooding, Sediment, and Erosion
Aquatic Biological Resources
Terrestrial Biological Resources
Groundwater Resources
Recreational Resources and Aesthetics
Agricultural Resources
Cultural Resources
Energy and Greenhouse Gases
Service Providers
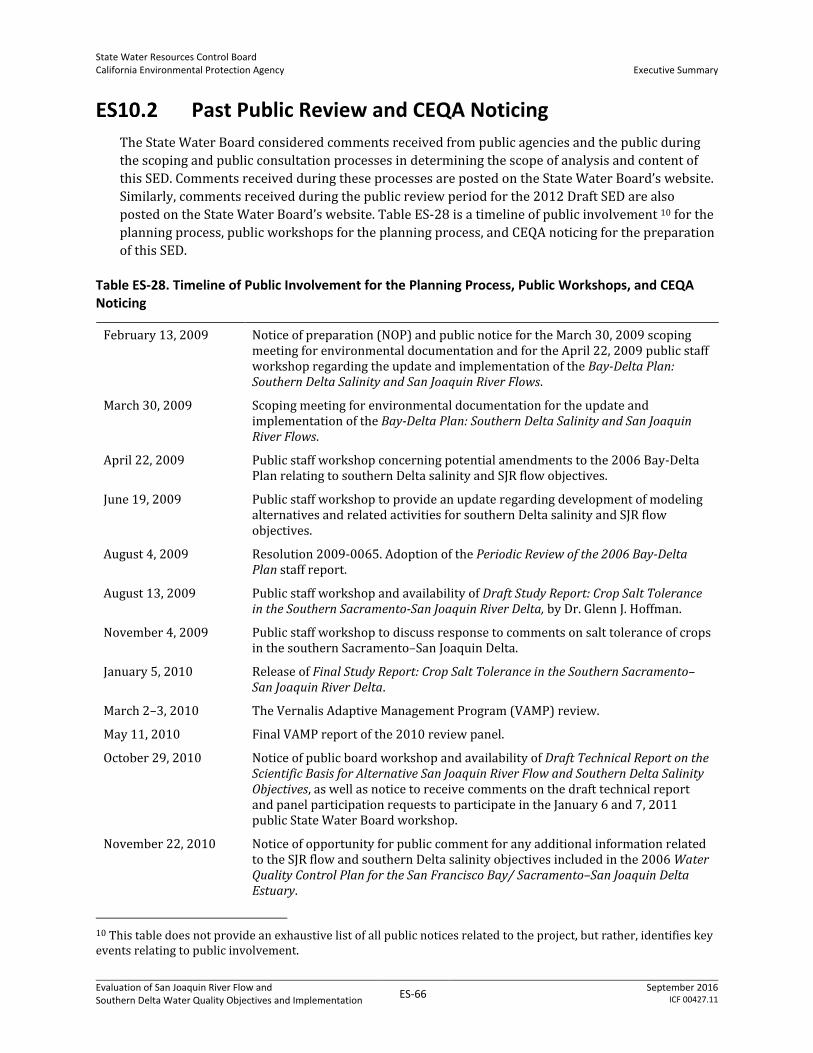
State Water Resources Control Board California Environmental Protection Agency
Executive Summary
Evaluation of San Joaquin River Flow and Southern Delta Water Quality Objectives and Implementation
ES-66 September 2016
ICF 00427.11
Past Public Review and CEQA Noticing
The State Water Board considered comments received from public agencies and the public during
the scoping and public consultation processes in determining the scope of analysis and content of
this SED. Comments received during these processes are posted on the State Water Board’s website.
Similarly, comments received during the public review period for the 2012 Draft SED are also
posted on the State Water Board’s website. Table ES-28 is a timeline of public involvement 10 for the
planning process, public workshops for the planning process, and CEQA noticing for the preparation
of this SED.
Table ES-28. Timeline of Public Involvement for the Planning Process, Public Workshops, and CEQA Noticing
February 13, 2009 Notice of preparation (NOP) and public notice for the March 30, 2009 scoping meeting for environmental documentation and for the April 22, 2009 public staff workshop regarding the update and implementation of the Bay-Delta Plan: Southern Delta Salinity and San Joaquin River Flows.
March 30, 2009 Scoping meeting for environmental documentation for the update and implementation of the Bay-Delta Plan: Southern Delta Salinity and San Joaquin River Flows.
April 22, 2009 Public staff workshop concerning potential amendments to the 2006 Bay-Delta Plan relating to southern Delta salinity and SJR flow objectives.
June 19, 2009 Public staff workshop to provide an update regarding development of modeling alternatives and related activities for southern Delta salinity and SJR flow objectives.
August 4, 2009 Resolution 2009-0065. Adoption of the Periodic Review of the 2006 Bay-Delta Plan staff report.
August 13, 2009 Public staff workshop and availability of Draft Study Report: Crop Salt Tolerance in the Southern Sacramento-San Joaquin River Delta, by Dr. Glenn J. Hoffman.
November 4, 2009 Public staff workshop to discuss response to comments on salt tolerance of crops in the southern Sacramento–San Joaquin Delta.
January 5, 2010 Release of Final Study Report: Crop Salt Tolerance in the Southern Sacramento–San Joaquin River Delta.
March 2–3, 2010 The Vernalis Adaptive Management Program (VAMP) review.
May 11, 2010 Final VAMP report of the 2010 review panel.
October 29, 2010 Notice of public board workshop and availability of Draft Technical Report on the Scientific Basis for Alternative San Joaquin River Flow and Southern Delta Salinity Objectives, as well as notice to receive comments on the draft technical report and panel participation requests to participate in the January 6 and 7, 2011 public State Water Board workshop.
November 22, 2010 Notice of opportunity for public comment for any additional information related to the SJR flow and southern Delta salinity objectives included in the 2006 Water Quality Control Plan for the San Francisco Bay/ Sacramento–San Joaquin Delta Estuary.
10 This table does not provide an exhaustive list of all public notices related to the project, but rather, identifies key events relating to public involvement.

State Water Resources Control Board California Environmental Protection Agency
Executive Summary
Evaluation of San Joaquin River Flow and Southern Delta Water Quality Objectives and Implementation
ES-67 September 2016
ICF 00427.11
January 6–7, 2011 Presentation and discussion of Draft Technical Report on the Scientific Basis for Alternative San Joaquin River Flow and Southern Delta Salinity Objectives.
April 1, 2011 Revised NOP and notice of additional scoping meeting for environmental documentation for the update and implementation of the Bay-Delta Plan: Southern Delta Salinity and San Joaquin River Flows.
June 6, 2011 Workshop on the discussion of the clarified scope and content of the environmental information to be included in the State Water Board’s environmental document relating to the State Water Board’s current review of the 2006 Bay-Delta Plan.
August 12, 2011 Request for scientific peer review of the Technical Report on the Scientific Basis for Alternative San Joaquin River Flow and Southern Delta Salinity Objectives, as well as the study report, Crop Salt Tolerance in the Southern Sacramento–San Joaquin River Delta.
November 21, 2011 Web posting of peer reviews of Technical Report on the Scientific Basis for Alternative San Joaquin River Flow and Southern Delta Salinity Objectives.
February 24, 2012 (updated March 5, 2012)
Notice of availability of draft technical appendices to the 2012 Draft SED for Phase 1 of the update to the 2006 Bay-Delta Plan.
Draft Scientific Basis for San Joaquin River Flow and Southern Delta Salinity Objectives (Scientific Report) (dated February 2012).
Draft Agricultural Economic Effects of Lower San Joaquin River Flow Alternatives (Agricultural Economics Report) (Dated February 2012).
Draft Hydropower and Electric Grid Analysis of Lower San Joaquin River Flow Alternatives (Hydropower Report) (dated February 2012).
February 2012 Release of Final Technical Report on the Scientific Basis for Alternative San Joaquin River Flow and Southern Delta Salinity Objectives.
March 20, 2012 Informational session on the Agricultural Economics Report and the Power Production Report to provide stakeholders an opportunity to gain a better understanding of these two reports that inform the SED analysis.
December 31, 2012 Release of the 2012 Draft Substitute Environmental Document in support of Potential Changes to the Water Quality Control Plan for the San Francisco Bay-Sacramento/San Joaquin Delta Estuary: San Joaquin River Flows and Southern Delta Water Quality (2012 Draft SED).
January 17, 2013 Notice of extension of public comment period for the 2012 Draft SED until March 29, 2013.
March 20–21, 2013 Public hearing for the receipt of oral comments on the adequacy of the 2012 Draft SED in support of Potential Changes to the Water Quality Control Plan for the San Francisco Bay-Sacramento/San Joaquin Delta Estuary: San Joaquin River Flows and Southern Delta Water Quality.
Scientific Review
The scientific basis of any statewide plan, basin plan, plan amendment, guideline, policy, or
regulation must undergo external peer review before adoption by the State Water Board or Regional
Water Boards (Health and Saf. Code, § 57004). Accordingly, the report contained in Appendix C,
Technical Report On The Scientific Basis for Alternative San Joaquin River Flow and Southern Delta

State Water Resources Control Board California Environmental Protection Agency
Executive Summary
Evaluation of San Joaquin River Flow and Southern Delta Water Quality Objectives and Implementation
ES-68 September 2016
ICF 00427.11
Salinity Objectives, has undergone peer review. Appendix C describes the scientific basis for and the
proposed changes to the LSJR flow and southern Delta water quality objectives.
The peer reviewers’ comments on the technical report were largely favorable. All peer reviewers
agreed with the conclusion that under the current altered flow regime, fish and wildlife beneficial
uses are being impaired and that a more natural flow pattern would be beneficial to such beneficial
uses. Also included as attachments to Appendix C are the peer reviews and a summary of the State
Water Board staff’s response. More information on the peer review process can be found at:
http://www.waterboards.ca.gov/water_issues/programs/peer_review/sanjoaquin_river_flow.shtml
Review and Consultation Requirements
Upon completion of this recirculated SED, the State Water Board will release it to the public for
review and conduct a public hearing on its adequacy (Cal. Code Regs., tit. 23, § 3779). The State
Water Board will also consult with other public agencies having jurisdiction by law with respect to
the plan amendments or that exercise authority over resources that may be affected by the plan
amendments, and with persons having special expertise with regard to the potential environmental
effects involved in the plan amendments, and other persons and entities. (See, e.g., Cal. Code Regs.,
tit. 23, § 3778.) This consultation will occur when this SED, including the State Water Board’s
Environmental Checklist (Appendix B, State Water Board’s Environmental Checklist, of this SED) and
revised water quality control plan language (Appendix K, Revised Water Quality Control Plan, of this
SED), are released for public comment. Consulting agencies include USBR, NMFS, DWR, CDFW, the
U.S. Environmental Protection Agency, the Central Valley Water Quality Control Board, the San
Francisco Bay Regional Water Quality Control Board, local public agencies, and other entities.
The State Water Board is the only public agency with discretionary approval over the proposed
amendments to the Bay-Delta Plan. For this reason, there are no responsible agencies as defined in
State CEQA Guidelines Section 15381.
The State CEQA Guidelines define a “Trustee Agency” as a state agency that has jurisdiction by law
over natural resources affected by a project that are held in trust for the people of the State of
California (State CEQA Guidelines, § 15386). CDFW, California Department of Parks and Recreation,
and the State Lands Commission are Trustee Agencies for the plan amendments analyzed in this
SED.
Availability of the Substitute Environmental Document
The public comment period for the recirculated SED is through 12noon on Tuesday, November 15,
2016. The SED chapters, appendices, and reference documents are available for public review
during the comment period, on weekdays from 8:30 a.m. to 5:00 p.m. at: Division of Water Rights
Records Unit, State Water Resources Control Board, 1001 “I” Street, 2nd Floor, Sacramento, CA
95814.
The SED chapters and appendices will also be available for public review after September 15, 2016,
at the following public libraries in Alpine, Alameda, Calaveras, Contra Costa, Madera, Mariposa,
Merced, Sacramento, San Francisco, San Joaquin, Stanislaus, and Tuolumne Counties:
Alameda County Main Library, 2400 Stevenson Blvd., Fremont, CA 94538
Calaveras County Central Library, 1299 Gold Hunter Rd., San Andreas, CA 95249
State Water Resources Control Board California Environmental Protection Agency
Executive Summary
Evaluation of San Joaquin River Flow and Southern Delta Water Quality Objectives and Implementation
ES-69 September 2016
ICF 00427.11
Chavez Central Library, 605 N. El Dorado St., Stockton, CA 95202
Freemont Main Library, 2400 Stevenson Blvd., Fremont, CA, 94538
Markleeville Main Library & Archives, 270 Laramie St., Markleeville, CA 96120
Madera County Library—Madera Headquarters, 121 N. G St., Madera, CA 93637
Mariposa County Library, 4978 10th St., Mariposa, CA 95338
Merced County Library, 2100 O St., Merced, CA 95340
Pleasant Hill Library, 1750 Oak Park Blvd., Pleasant Hill, CA 94523
Sacramento Public Library—Central, 828 “I” St., Sacramento, CA 95814
San Andreas Central Library, 1299 Gold Hunter Road, San Andreas, CA 95249
Stanislaus County Library, 1500 “I” St., Modesto, CA 95354
San Francisco Public Library, 100 Larkin St., San Francisco, CA 94102
Tuolumne County Main Library, 480 Greenley Rd., Sonora, CA 95370
A link to electronic copies of the SED documents is available on the State Water Board’s website at:
www.waterboards.ca.gov/DeltaWQCP-Phase1
Alternatively, for a reasonable cost for copying, the public may obtain an electronic copy of the
documents on disk by contacting the Division of Water Rights Records Unit at (916) 341-5421 or at
Areas of Known Controversy and Changes Made to the 2012 Draft Substitute Environmental Document
Two public scoping meetings were conducted prior to the release of the 2012 Draft SED, on March
30, 2009 and June 6, 2011. These were followed by a number of other public meetings to receive
information regarding the development of southern Delta salinity and flow objectives. Appendix A,
NOP Scoping and Other Public Meetings, provides a summary of the issues raised by agencies and the
public. The following list identifies the areas of controversy based on this initial scoping. Each of
these issues is addressed in this recirculated SED.
Evaluation of a reasonable range of alternatives
Impacts on agricultural resources associated with a potential reduction in surface water
diversions
Impacts on energy production and generation associated with potential changes to hydropower
operation
Economic impacts on the agricultural sector and other sectors associated with the potential
reduction in surface diversions
Interactions with groundwater quantity and quality
Impacts on fisheries resources associated with the proposed LSJR alternatives
State Water Resources Control Board California Environmental Protection Agency
Executive Summary
Evaluation of San Joaquin River Flow and Southern Delta Water Quality Objectives and Implementation
ES-70 September 2016
ICF 00427.11
The 2012 Draft SED was released for public comment on December 31, 2012. The public comment
period ran from December 31, 2012 through March 29, 2013. The State Water Board received
approximately 4,000 responses, most of which are form letters with substantially the same
comments. Of these, the State Water Board identified and selected 119 responses that covered the
range of substantive comments. These comments are summarized in Appendix M, Summary of Public
Comments on the 2012 Draft SED.
These comments on the 2012 Draft SED were considered in the development of this recirculated
SED. Although this SED is intended to address areas of concern on the 2012 Draft SED, this
document does not provide a written response to those comments. The following are concerns
raised regarding the 2012 Draft SED, and for which revisions have been made and are reflected in
this recirculated SED.
Reservoir operation and other assumptions in the WSE model
Effects of the proposed flow objectives municipal water supplies
Groundwater and water supply assumptions associated with agricultural use and SWAP analysis
Geography used for SWAP analysis
Analysis of various economic topics
Use of adaptive implementation
Analysis of dry year and consecutive dry years
Plan area description, and water rights that may be affected
Analysis of the potential effects on CCSF
Non-flow measures
Benefits of the proposed objectives to fish and wildlife
Discussion of multiple fish topics
Baseline
Methods of compliance
Antidegradation analysis
Cumulative analysis
The following are brief descriptions of the revisions made to address to these concerns, including
where more information on the topic can be found.
Reservoir Operation and Water Supply Effects Model Assumptions
The 2012 Draft SED evaluated the water supply effects of the flow proposal, but did not analyze the
change in reservoir operation that could occur in response to a reduction in surface water supplies.
WSE modeling of the alternatives now changes reservoir storages, including end-of-September
storage, based on operations likely to occur with the flow requirements. The CALSIM model
representation of baseline is no longer used in this SED. The WSE model was modified to provide a
representation of baseline conditions and is now used to model both the baseline and the LSJR

State Water Resources Control Board California Environmental Protection Agency
Executive Summary
Evaluation of San Joaquin River Flow and Southern Delta Water Quality Objectives and Implementation
ES-71 September 2016
ICF 00427.11
alternatives for the purpose of impacts analysis in this SED. Diversion demands for major irrigation
districts are now derived from annually and monthly varying consumptive use of applied water
(CUAW) demands from CALSIM, with operational efficiency estimates derived from agricultural
water management plans (AWMPs). Other associated changes are described in Section F.1.2., Water
Supply Effects Modeling Methods, of Appendix F.1, Hydrologic and Water Quality Modeling.
Effects of the Proposed Flow Objectives on Municipal Water Supplies
This SED includes a new chapter, Chapter 22, Integrated Discussion of Potential Municipal and
Domestic Water Supply Management Options, summarizing the overall effect the project is expected
to have on drinking water. This new chapter synthesizes information from other resource chapters,
including Chapter 2, Water Resources, Chapter 9, Groundwater Resources, Chapter 13, Service
Providers, and Chapter 21, Drought Evaluation, in order to provide a clear picture of how drinking
water supplies would be affected by the plan amendments. The chapter discusses both the initial
effects and the potential long-term changes that could occur when SGMA is fully implemented.
Groundwater and Water Supply Assumptions, and the Associated Use of the SWAP Model
The analysis in the 2012 Draft SED did not attempt to determine how much of the surface water
supply deficit that would result from the proposal would be replaced by groundwater. The 2012
Draft SED analyzed both full replacement by groundwater and no replacement, thereby maximizing
the possible effects for both endpoints but did not attempt to determine the most likely surface
water storage reoperation and groundwater replacement response. This recirculated SED now
determines the likely level of groundwater replacement, surface water storage and reservoir
reoperation, and quantity of surface water deficit not replaced by additional groundwater pumping.
This updated analysis relied upon new information provided by water districts, and is reflective of
additional groundwater pumping capacity developed during recent drought years. Although this
estimate is intended to reflect the most likely balance between water supply deficit and additional
groundwater pumping, the precise balance is unknowable. This expanded analysis also evaluates the
potential water quality effects of additional groundwater pumping. The methods and data used for
this updated analysis are provided in Appendix G, Agricultural Economic Effects of the Lower San
Joaquin River Flow Alternatives: Methodology and Modeling Results. The modified net agricultural
water supply effect, after accounting for changes in groundwater pumping, are used in updated
SWAP modeling in Appendix G. The improved data from the groundwater pumping analysis are used
in updated Chapter 9, Groundwater Resources and Chapter 11, Agricultural Resources.
Geography Used for SWAP Analysis
Smaller geographic areas that considered the boundary of irrigation districts are used for the SWAP
analysis as described in Appendix G, Agricultural Economic Effects of the Lower San Joaquin River
Flow Alternatives: Methodology and Modeling Results, and used elsewhere in the document, including
Chapter 11, Agricultural Resources.
State Water Resources Control Board California Environmental Protection Agency
Executive Summary
Evaluation of San Joaquin River Flow and Southern Delta Water Quality Objectives and Implementation
ES-72 September 2016
ICF 00427.11
Analysis of Various Economic Topics
The 2012 Draft SED did not evaluate fiscal effects, cost evaluation of municipal and industrial water
supplies and affected regional economies, and economic effects associated with benefits to fish.
These are now included in the economic analysis in Chapter 20, Economics Analyses, Appendix G,
Agricultural Economic Effects of the Lower San Joaquin River Flow Alternatives: Methodology and
Modeling Results, and Appendix L, City and County of San Francisco Analyses.
Use of Adaptive Implementation
There was concern that adaptive implementation in the 2012 Draft SED lacked adequate bounds and
rigor to constrain changes in the required percent of unimpaired flow required in the adaptive
implementation framework of the 2012 Draft SED. There was also concern that there were no goals
identified that could guide the adaptive implementation. The program of implementation now
includes a requirement to develop tributary-specific numeric biological goals for abundance,
productivity, and population spatial extent, distribution, and structure. These biological goals will be
used to guide adaptive implementation. The methods, process, and approvals needed for adaptive
implementation are described in the proposed flow objectives in Appendix K, Revised Water Quality
Control Plan, and elsewhere throughout the SED.
Analysis of Dry Years and Consecutive Dry Years
Although the 2012 Draft SED analyzed the effects of the flow proposal over an 82-year period of
varied hydrology, including dry years, it did not specifically identify the water supply effects in dry
years and consecutive dry years. This recirculated SED includes a new chapter Chapter 21, Drought
Evaluation. This new chapter provides a dry year and multiple dry year analyses. The drought years
during the 1922–2003 time period that were modeled using the WSE model are compared with the
more recent period of 2004–2015 based on the use of an extended WSE model. This new analysis
provides an examination and evaluation of the effects of the proposed project on reservoir
operations, water supply, and river temperatures for the more recent drought years from 2012
through 2015 to verify that water supply effects of drought conditions were accurately calculated
and evaluated with the WSE model. It also includes a comparison of available water supply and
other parameters during drought periods under baseline conditions and under the LSJR alternatives.
Plan Area Description
The description of the plan area has been clarified as described in Section ES1.4 Plan Area, of this
executive summary. This plan area description also clarifies that the water rights of entities that
receive a portion of their water supply from either the plan area or extended plan area may be
affected by implementation of the proposed flow objectives.
Analyses of the Potential Effects on the City and County of San Francisco
Additional analyses have been conducted to address potential impacts to CCSF that may result from
implementation of the plan amendments. This analysis is included as Appendix L, City and County of
San Francisco Analyses, in this SED and covers projected impacts based on the potential water
State Water Resources Control Board California Environmental Protection Agency
Executive Summary
Evaluation of San Joaquin River Flow and Southern Delta Water Quality Objectives and Implementation
ES-73 September 2016
ICF 00427.11
shortages and related indirect economic effects in the SFPUC service area resulting from estimated
changes in allowable surface water diversions needed to meet the requirements of the LSJR
alternatives. The analysis in Appendix L is based on two different scenarios that result from
different interpretations of the Fourth Agreement between CCSF and the MID and TID, which is an
agreement that describes the details of the water banking and storage operations in New Don Pedro
Reservoir. The two scenarios represent different outcomes regarding CCSF’s responsibility for
additional flow releases that may result from the FERC relicensing process for New Don Pedro
Reservoir. Each of the three LSJR alternatives—LSJR Alternatives 2, 3, and 4—was analyzed under
each of the two scenarios to examine how CCSF’s water bank account in New Don Pedro Reservoir
was affected. Subsequently, the regional effects on the four-county Bay Area regional economy and
ratepayers are evaluated based on the need to obtain replacement water as a result of the LSJR
alternatives.
Non-Flow Measures
The program of implementation in the 2012 Draft SED had a limited list of recommended actions by
other entities, and included a placeholder for additional actions. There has been much concern
expressed that the proposal for protecting fish and wildlife is “flow-centric.” The protection of the
state’s water resources through water quality control and water right actions that address flow,
however, is squarely within the State Water Board’s purview. Nonetheless, the program of
implementation for the updated water quality objectives contained in Appendix K, Revised Water
Quality Control Plan, includes a variety of recommended non-flow measures that could improve
conditions for fish and wildlife in the plan area. These non-flow measures include a wide range of
actions, such as actions to improve habitat conditions in the LSJR Watershed (e.g., gravel
enhancement for spawning habitat), actions to reduce the impact of nonnative predators on
anadromous fish (e.g., structural modifications that reduce predator habitat) and actions that
improve water temperature conditions (e.g. structural improvements at dams). This SED includes a
programmatic analysis of non-flow measures in Chapter 16, Evaluation of Other Indirect and
Additional Actions. Many of the recommended actions may require permits or other approvals from
other agencies prior to implementation, and their inclusion in this SED does not equate to an
expression of jurisdiction over, or approval by, the State Water Board.
Benefits of the Proposed Objectives to Fish and Wildlife
Although the 2012 Draft SED had a qualitative analysis of the benefits of the flow proposal on fish
and wildlife, and the impetus for the flow proposal was provided in the scientific basis report, the
potential benefits were not rigorously quantified. This recirculated SED has a new chapter that
quantitatively analyzes the potential benefits of the flow proposal. Chapter 19, Analyses of Benefits to
Native Fish Populations from Increased Flow Between February 1 and June 30, provides narrative and
quantified expected benefits of the various flow objectives. The chapter describes biologically
important and measurable benefits of providing higher and more variable flow during the February
1–June 30 time period, with a focus on improved water temperature conditions and enhanced
floodplain inundation. The chapter also presents results from a life-history population simulation
model (SalSim) for fall-run Chinook salmon originating from the LSJR and the three tributaries
(Stanislaus, Tuolumne, and Merced Rivers) to provide insight into population level changes that
could be expected under a variety of flow conditions. The results of this evaluation indicate that as
the percentage of unimpaired flow increases during the February–June time period, the number of
State Water Resources Control Board California Environmental Protection Agency
Executive Summary
Evaluation of San Joaquin River Flow and Southern Delta Water Quality Objectives and Implementation
ES-74 September 2016
ICF 00427.11
adult salmon produced by the three tributaries would be expected to increase substantially
compared to baseline conditions during the time period of 1994–2010.
Discussion of Multiple Fish Topics
Chapter 7, Aquatic Biological Resources, now analyzes flow impacts (e.g., cumulative distributions of
weighted usable area values) based on changes in the magnitude and frequency of monthly WSE
model results over the 82-year modeling period instead of using median flows, and incorporates
Instream Flow Incremental Methodology (IFIM) information.
Other Changes
The following clarifications and additions are reflected in this recirculated SED.
Baseline. The definition of, and methods of modeling baseline have been clarified throughout the
document.
Methods of Compliance. The methods of compliance have been clarified throughout the
document.
Antidegradation. An antidegradation analysis has been added to Chapter 23, Antidegradation
Analysis.
Cumulative Analysis. The cumulative effects analysis is presented in Chapter 15, No Project
Alternative (LSJR Alternative 1 and SDWQ Alternative 1), for the No Project Alternative, Chapter
16, Evaluation of Other Indirect and Additional Actions, and Chapter 17, Cumulative Impacts,
Growth-Inducing Effects, and Irreversible Commitment of Resources.
Next Steps Written comments on this SED are due by noon on Tuesday November 15, 2016, and public hearings
will be held on November 2, 4, and 10, 2016 to receive oral comments. Staff will prepare written
responses to issues raised in the comments received during the written comment period and will
respond in writing or orally to comments made during the public hearing. The State Water Board
will consider the information contained in the SED, including comments and responses to
comments, before approving the project. The State Water Board will consider approving the
proposed Bay-Delta Plan amendments at a public meeting that will be held in early 2017.
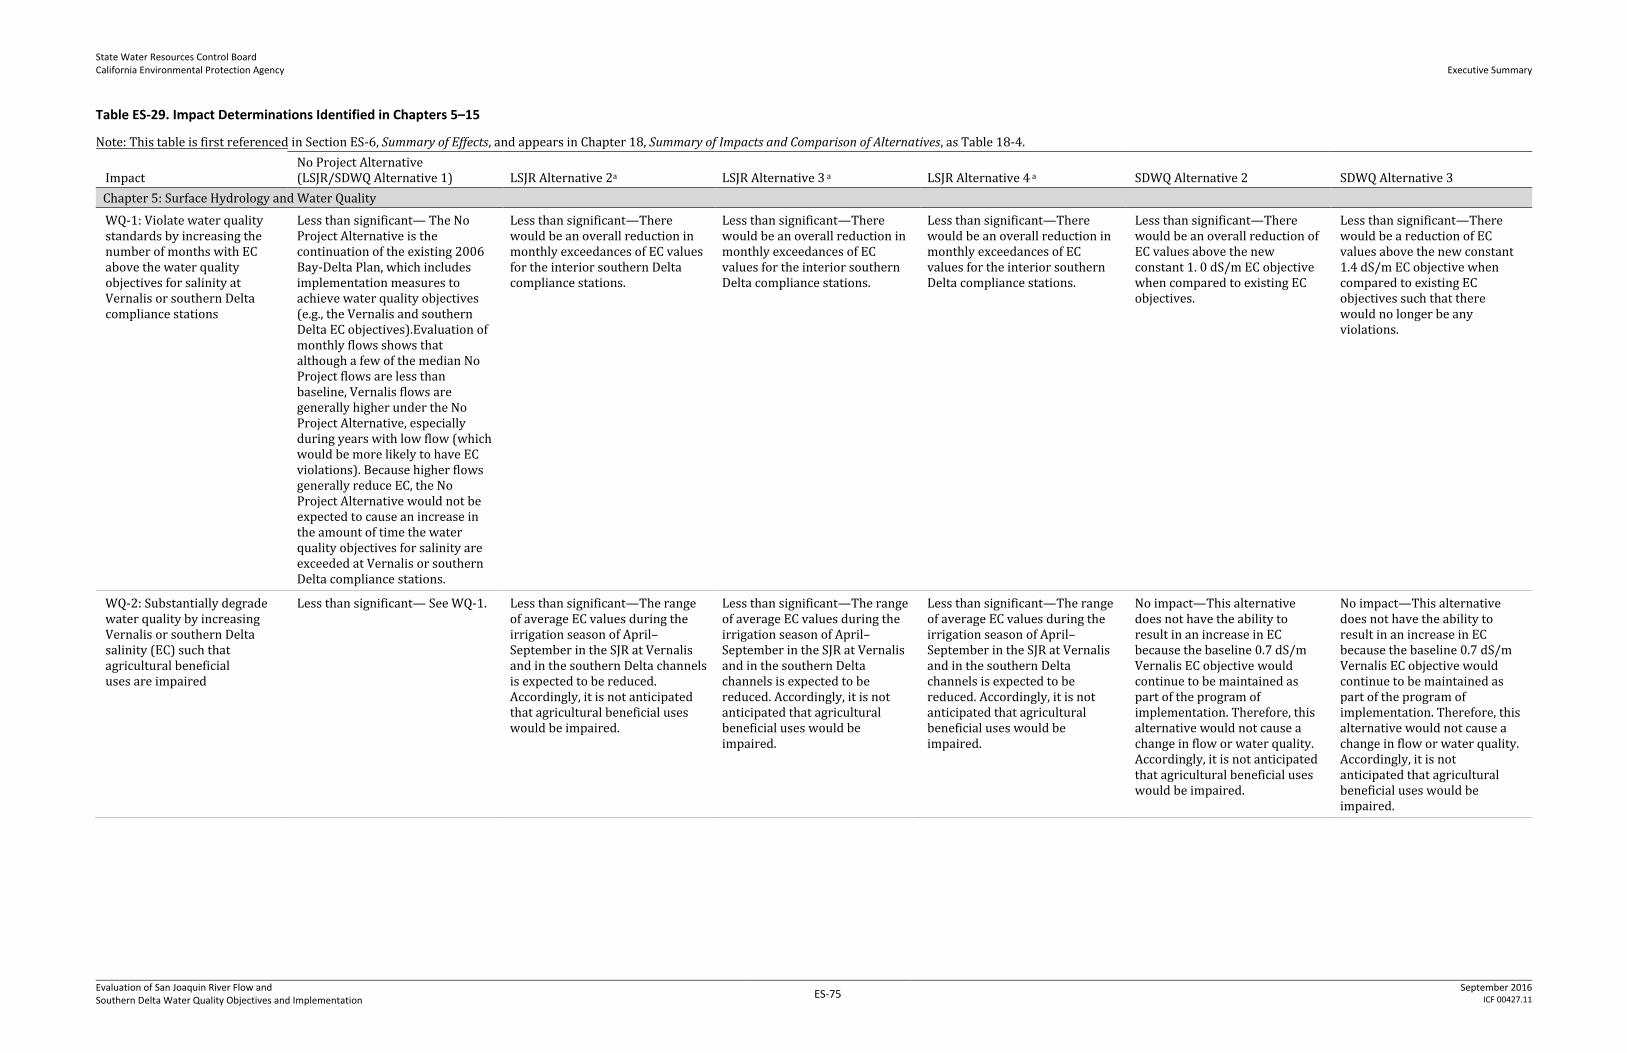
State Water Resources Control Board California Environmental Protection Agency Executive Summary
Evaluation of San Joaquin River Flow and Southern Delta Water Quality Objectives and Implementation
ES-75 September 2016
ICF 00427.11
Table ES-29. Impact Determinations Identified in Chapters 5–15
Note: This table is first referenced in Section ES-6, Summary of Effects, and appears in Chapter 18, Summary of Impacts and Comparison of Alternatives, as Table 18-4.
Impact No Project Alternative (LSJR/SDWQ Alternative 1) LSJR Alternative 2a LSJR Alternative 3 a LSJR Alternative 4 a SDWQ Alternative 2 SDWQ Alternative 3
Chapter 5: Surface Hydrology and Water Quality
WQ-1: Violate water quality standards by increasing the number of months with EC above the water quality objectives for salinity at Vernalis or southern Delta compliance stations
Less than significant— The No Project Alternative is the continuation of the existing 2006 Bay-Delta Plan, which includes implementation measures to achieve water quality objectives (e.g., the Vernalis and southern Delta EC objectives).Evaluation of monthly flows shows that although a few of the median No Project flows are less than baseline, Vernalis flows are generally higher under the No Project Alternative, especially during years with low flow (which would be more likely to have EC violations). Because higher flows generally reduce EC, the No Project Alternative would not be expected to cause an increase in the amount of time the water quality objectives for salinity are exceeded at Vernalis or southern Delta compliance stations.
Less than significant—There would be an overall reduction in monthly exceedances of EC values for the interior southern Delta compliance stations.
Less than significant—There would be an overall reduction in monthly exceedances of EC values for the interior southern Delta compliance stations.
Less than significant—There would be an overall reduction in monthly exceedances of EC values for the interior southern Delta compliance stations.
Less than significant—There would be an overall reduction of EC values above the new constant 1. 0 dS/m EC objective when compared to existing EC objectives.
Less than significant—There would be a reduction of EC values above the new constant 1.4 dS/m EC objective when compared to existing EC objectives such that there would no longer be any violations.
WQ-2: Substantially degrade water quality by increasing Vernalis or southern Delta salinity (EC) such that agricultural beneficial uses are impaired
Less than significant— See WQ-1. Less than significant—The range of average EC values during the irrigation season of April–September in the SJR at Vernalis and in the southern Delta channels is expected to be reduced. Accordingly, it is not anticipated that agricultural beneficial uses would be impaired.
Less than significant—The range of average EC values during the irrigation season of April–September in the SJR at Vernalis and in the southern Delta channels is expected to be reduced. Accordingly, it is not anticipated that agricultural beneficial uses would be impaired.
Less than significant—The range of average EC values during the irrigation season of April–September in the SJR at Vernalis and in the southern Delta channels is expected to be reduced. Accordingly, it is not anticipated that agricultural beneficial uses would be impaired.
No impact—This alternative does not have the ability to result in an increase in EC because the baseline 0.7 dS/m Vernalis EC objective would continue to be maintained as part of the program of implementation. Therefore, this alternative would not cause a change in flow or water quality. Accordingly, it is not anticipated that agricultural beneficial uses would be impaired.
No impact—This alternative does not have the ability to result in an increase in EC because the baseline 0.7 dS/m Vernalis EC objective would continue to be maintained as part of the program of implementation. Therefore, this alternative would not cause a change in flow or water quality. Accordingly, it is not anticipated that agricultural beneficial uses would be impaired.

State Water Resources Control Board California Environmental Protection Agency
Executive Summary
Evaluation of San Joaquin River Flow and Southern Delta Water Quality Objectives and Implementation
ES-76 September 2016
ICF 00427.11
Impact No Project Alternative (LSJR/SDWQ Alternative 1) LSJR Alternative 2a LSJR Alternative 3 a LSJR Alternative 4 a SDWQ Alternative 2 SDWQ Alternative 3
WQ-3: Substantially degrade water quality by increasing pollutant concentrations caused by reduced river flows
Significant—Under the No Project Alternative flows would not be substantially reduced on the Stanislaus, Tuolumne, or LSJR such that contaminant concentrations would increase. However, on the Merced River, flows under the No Project Alternative would be substantially reduced during April and May compared to baseline, which could result in a significant increase in contaminant concentrations above baseline conditions.
Less than significant—Flows would generally increase, and no months with low to median flows (10th and 50th percentiles) would experience flow reductions greater than 33% of the baseline flows on the Stanislaus, Tuolumne or Merced Rivers or the LSJR. Therefore, it is expected that the change in concentrations would not substantially degrade water quality.
Less than significant—Flows would generally increase, and no months with low to median flows (10th and 50th percentiles) would experience flow reductions greater than 33% of the baseline flows on the Stanislaus, Tuolumne or Merced Rivers or the LSJR. Therefore, it is expected that the change in concentrations would not substantially degrade water quality.
Less than significant—Flows would generally increase, and no months with low to median flows (10th and 50th percentiles) would experience flow reductions greater than 33% of the baseline flows on the Stanislaus, Tuolumne or Merced Rivers or the LSJR. Therefore, it is expected that the change in concentrations would not substantially degrade water quality.
No impact – This alternative does not have the ability to result in an increase in pollutant concentrations because the baseline 0.7 dS/m Vernalis EC objective would continue to be maintained as part of the program of implementation. Therefore, this alternative would not cause a change in flow or water quality.
No impact – This alternative does not have the ability to result in an increase in pollutant concentrations because the baseline 0.7 dS/m Vernalis EC objective would continue to be maintained as part of the program of implementation. Therefore, this alternative would not cause in flow or water quality.
Chapter 6: Flooding, Sediment, and Erosion
FLO-1: Substantially alter the existing drainage pattern of the site or area, including through the alteration of the course of a stream or river in a manner that would result in substantial erosion or siltation on- or off-site
Less than Significant— Under the No Project Alternative, flows would be lower than channel capacities on the Stanislaus, Tuolumne, and Merced Rivers as described under LSJR Alternative 4, in Chapter 6, Flooding, Sediment, and Erosion. Sediment transport, bank erosion or meander-bend migration issues and contribution to levee instability would not increase. It is expected that very occasional gravel transport and bank erosion would occur in the upper gravel-bedded reaches of the Stanislaus, Tuolumne, and Merced Rivers. The amount of bank erosion would be limited by flood action levels and existing bank armoring. Impacts would be less than significant.
Less than significant—Substantial erosion is caused by high flow events resulting from flood control releases of peak flows. These flows would not increase under this alternative. On average, the occurrence of monthly flows greater than 1,500 cfs on the Stanislaus River would be similar to baseline and would not influence stream bank erosion. Therefore, substantial alterations of the existing drainage patterns would not occur and would not result in substantial erosion or siltation.
Less than significant—Very occasional gravel transport and bank erosion would occur in the upper gravel-bedded reaches of the three eastside tributaries. The amount of bank erosion is limited by flood stage action levels, which is the river stage at which actions are presumed to occur to reduce flood risk, and existing bank armoring. Flows greater than 1,500 cfs on the Stanislaus River would occur with somewhat greater frequency than baseline, particularly during April to June; however, these flows are not sufficiently high to increase stream bank erosion. Therefore, substantial alterations of the existing drainage patterns would not occur and would not result in substantial erosion or siltation.
Less than significant—Similar to LSJR Alternative 3, there would be occasional gravel transport and bank erosion in the upper gravel-bedded reaches of the three eastside tributaries. The amount of bank erosion is limited by the action stage, which is the river stage at which actions are presumed to occur to reduce flood risk, and existing bank armoring. Flows greater than 1,500 cfs on Stanislaus River would occur with greater frequency than baseline, particularly during April to June; however, these flows are not sufficiently high to increase stream bank erosion. Therefore, substantial alterations of the existing drainage patterns would not occur and would not result in substantial erosion or siltation.
No Impact—Any change in salinity in the southern Delta as a result of southern Delta water quality is expected to be similar to that of the historic range of salinity because Vernalis water quality would be maintained under the SDWQ alternatives through the program of implementation. Furthermore, change in water quality does not affect flooding, sedimentation, or erosion.
No Impact—Any change in salinity in the southern Delta as a result of southern Delta water quality (SDWQ) Alternatives 2 or 3 is expected to be similar to that of the historic range of salinity because Vernalis water quality would be maintained under the SDWQ alternatives through the program of implementation. Furthermore, change in water quality does not affect flooding, sedimentation, or erosion.
FLO-2: Substantially alter the existing drainage pattern of the site or area, including through the alteration of the course of a stream or river, or substantially increase the rate or amount of surface runoff in manner that would result in flooding on- or off-site
Less than significant— Flows would be much lower than channel capacities on the Stanislaus, Tuolumne, and Merced Rivers, as described under LSJR Alternative 4, in Chapter 6, Flooding, Sediment, and Erosion. Therefore, significant flooding impacts would not occur outside of floodways. The No Project Alternative would not change reservoir flood storage capacity and would not violate USACE
Less than significant—Controlled reservoir releases would be much lower than channel capacities and no significant flooding would occur outside of floodway. LSJR Alternative 2 would not change reservoir flood storage capacity and would not violate USACE flood reservation so there would be no changes in flood control operation procedures during major flood events. Therefore, substantial alterations of the existing drainage
Less than significant – Similar to LSJR Alternative 2 with respect to flood control operations. Therefore, substantial alterations of the existing drainage patterns would not occur and would not result in flooding. Consequently, people or structures would not be exposed to a significant risk of loss, injury or death involving flooding.
Less than significant—Similar to LSJR Alternative 2, with respect to flood control operations. Substantial alterations of the existing drainage patterns would not occur and would not result in flooding. Consequently, people or structures would not be exposed to a significant risk of loss, injury or death involving flooding.
No Impact—See FLO-1. No Impact—See FLO-1.
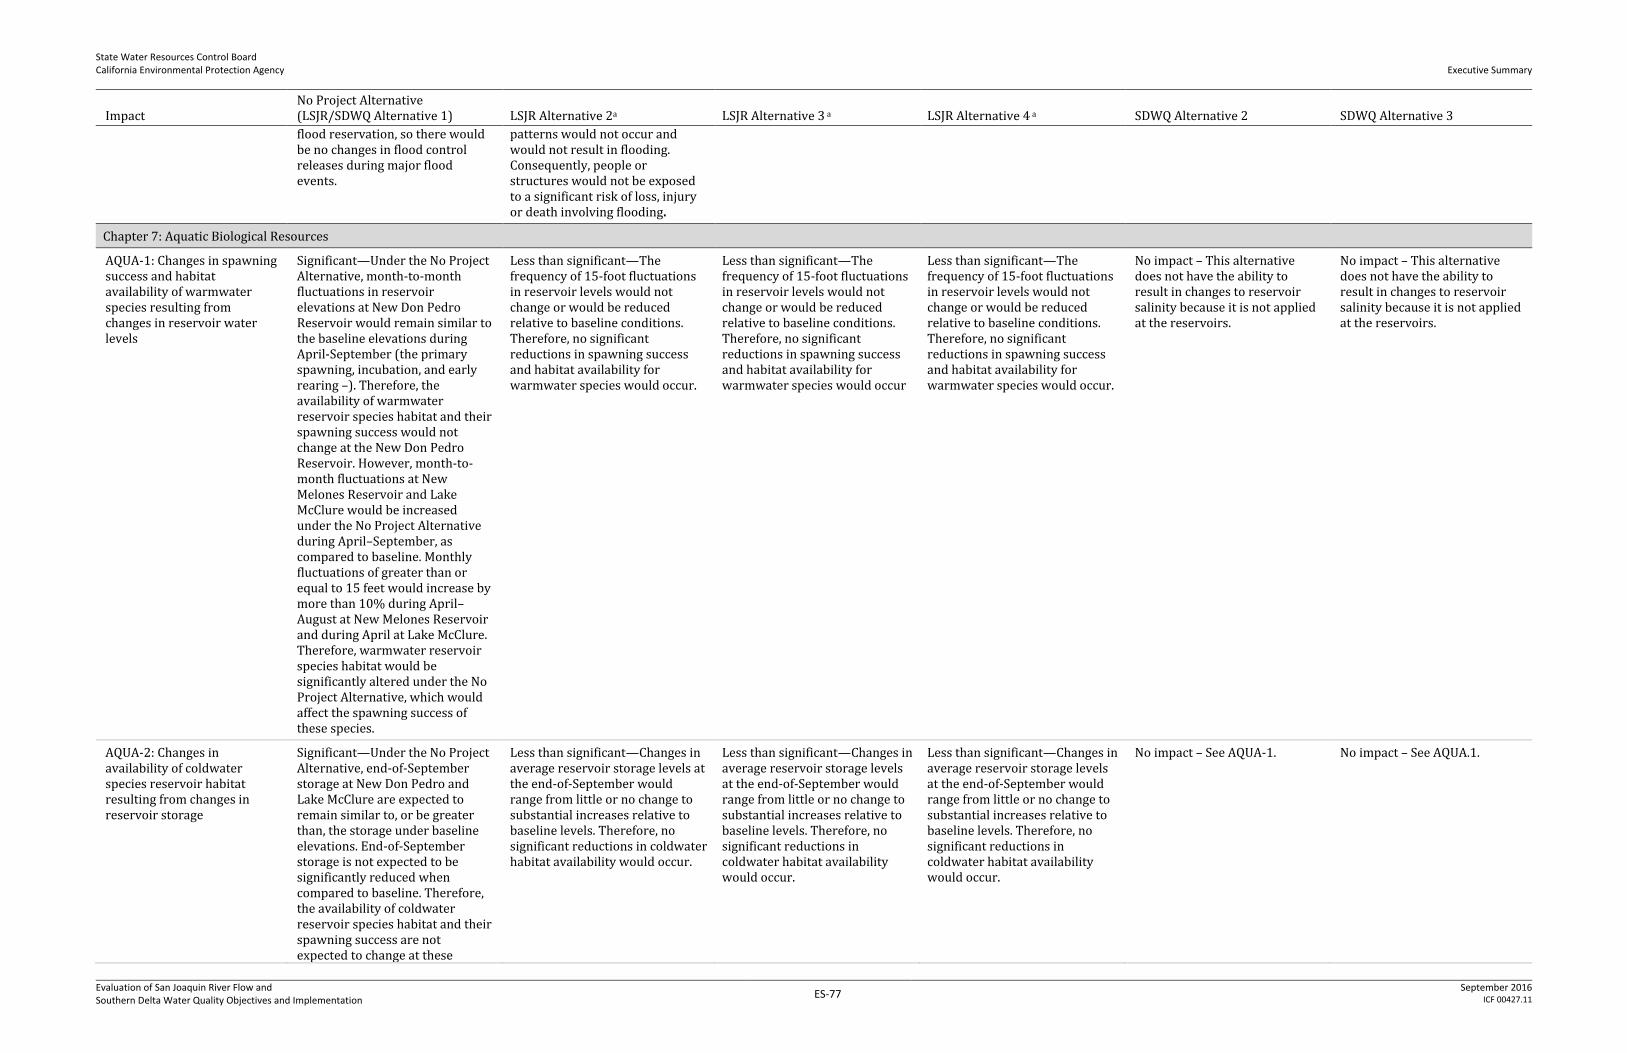
State Water Resources Control Board California Environmental Protection Agency
Executive Summary
Evaluation of San Joaquin River Flow and Southern Delta Water Quality Objectives and Implementation
ES-77 September 2016
ICF 00427.11
Impact No Project Alternative (LSJR/SDWQ Alternative 1) LSJR Alternative 2a LSJR Alternative 3 a LSJR Alternative 4 a SDWQ Alternative 2 SDWQ Alternative 3
flood reservation, so there would be no changes in flood control releases during major flood events.
patterns would not occur and would not result in flooding. Consequently, people or structures would not be exposed to a significant risk of loss, injury or death involving flooding.
Chapter 7: Aquatic Biological Resources
AQUA-1: Changes in spawning success and habitat availability of warmwater species resulting from changes in reservoir water levels
Significant—Under the No Project Alternative, month-to-month fluctuations in reservoir elevations at New Don Pedro Reservoir would remain similar to the baseline elevations during April-September (the primary spawning, incubation, and early rearing –). Therefore, the availability of warmwater reservoir species habitat and their spawning success would not change at the New Don Pedro Reservoir. However, month-to-month fluctuations at New Melones Reservoir and Lake McClure would be increased under the No Project Alternative during April–September, as compared to baseline. Monthly fluctuations of greater than or equal to 15 feet would increase by more than 10% during April–August at New Melones Reservoir and during April at Lake McClure. Therefore, warmwater reservoir species habitat would be significantly altered under the No Project Alternative, which would affect the spawning success of these species.
Less than significant—The frequency of 15-foot fluctuations in reservoir levels would not change or would be reduced relative to baseline conditions. Therefore, no significant reductions in spawning success and habitat availability for warmwater species would occur.
Less than significant—The frequency of 15-foot fluctuations in reservoir levels would not change or would be reduced relative to baseline conditions. Therefore, no significant reductions in spawning success and habitat availability for warmwater species would occur
Less than significant—The frequency of 15-foot fluctuations in reservoir levels would not change or would be reduced relative to baseline conditions. Therefore, no significant reductions in spawning success and habitat availability for warmwater species would occur.
No impact – This alternative does not have the ability to result in changes to reservoir salinity because it is not applied at the reservoirs.
No impact – This alternative does not have the ability to result in changes to reservoir salinity because it is not applied at the reservoirs.
AQUA-2: Changes in availability of coldwater species reservoir habitat resulting from changes in reservoir storage
Significant—Under the No Project Alternative, end-of-September storage at New Don Pedro and Lake McClure are expected to remain similar to, or be greater than, the storage under baseline elevations. End-of-September storage is not expected to be significantly reduced when compared to baseline. Therefore, the availability of coldwater reservoir species habitat and their spawning success are not expected to change at these
Less than significant—Changes in average reservoir storage levels at the end-of-September would range from little or no change to substantial increases relative to baseline levels. Therefore, no significant reductions in coldwater habitat availability would occur.
Less than significant—Changes in average reservoir storage levels at the end-of-September would range from little or no change to substantial increases relative to baseline levels. Therefore, no significant reductions in coldwater habitat availability would occur.
Less than significant—Changes in average reservoir storage levels at the end-of-September would range from little or no change to substantial increases relative to baseline levels. Therefore, no significant reductions in coldwater habitat availability would occur.
No impact – See AQUA-1. No impact – See AQUA.1.

State Water Resources Control Board California Environmental Protection Agency
Executive Summary
Evaluation of San Joaquin River Flow and Southern Delta Water Quality Objectives and Implementation
ES-78 September 2016
ICF 00427.11
Impact No Project Alternative (LSJR/SDWQ Alternative 1) LSJR Alternative 2a LSJR Alternative 3 a LSJR Alternative 4 a SDWQ Alternative 2 SDWQ Alternative 3
reservoirs. However, on average, end-of-September storage at New Melones Reservoir would be reduced by 27%. Therefore, coldwater reservoir species habitat would be significantly altered under the No Project Alternative, which would affect the spawning success of these species.
AQUA-3: Changes in quantity/ quality of physical habitat for spawning and rearing resulting from changes in flow
Less than significant—Under the No Project Alternative, flows on the Stanislaus River would increase, while flows on the Tuolumne River would be similar to baseline flows and thus would not reduce the quantity and quality of spawning and rearing habitat. Under the No Project Alternative, the Merced River would experience a relatively large percentage reduction in flows in April and May compared to baseline. However, predicted changes in flow within this range correspond to only minor increases or decreases in WUA and no changes in floodplain inundation area. Therefore, they are not likely to substantially affect the amount of physical habitat for Chinook salmon juvenile rearing and steelhead fry rearing.
Less than significant—Suitable spawning habitat on the three eastside tributaries would remain unchanged or increase. Therefore, no significant adverse impacts on the amount of spawning habitat for Chinook salmon and steelhead in the Stanislaus, Tuolumne, and Merced Rivers would occur. No reductions in Chinook salmon fry and juvenile rearing habitat are expected on the Stanislaus River or LSJR compared to baseline. In the Tuolumne and Merced Rivers, weighted usable area (WUA) for Chinook salmon fry and juvenile rearing would decrease, but floodplain habitat would increase in response to higher spring flows. No substantial differences would occur in WUA for steelhead fry and juvenile rearing compared to baseline conditions. No long-term reductions in habitat availability for other native fish species would occur. Therefore, no significant adverse impacts on the amount of habitat for Chinook salmon, steelhead, and other native fishes in the Stanislaus, Tuolumne and Merced Rivers and the LSJR would occur.
Less than significant—Reductions in WUA for Chinook salmon spawning would occur in the three eastside tributaries, but higher flows and lower temperatures are expected to improve attraction and migration and the longitudinal extent of suitable spawning habitat. This alternative would substantially improve rearing habitat conditions for Chinook salmon and steelhead in the three eastside streams and LSJR. Considering the overall beneficial effects of higher flows on rearing habitat availability, no significant adverse impacts on Chinook salmon and steelhead populations would occur. Higher spring flows under this alternative would also benefit other native fish species.
Less than significant—Predicted changes in WUA values for Chinook salmon and steelhead spawning in the Stanislaus, Tuolumne, and Merced Rivers would be similar in magnitude to those predicted under LSJR Alternative 3. This alternative would further improve rearing habitat conditions for Chinook salmon and steelhead in the three eastside tributaries and LSJR. Higher spring flows under this alternative would also further improve habitat conditions for other native fish species. Therefore, no significant adverse impacts would occur.
No impact—this alternative does not have the ability to result in changes to flow because it is a water quality objective for salinity; furthermore, the volume of water needed to meet the Vernalis EC objective is included in the modeling results and, thus, in the impact determinations, for the LSJR alternatives.
No impact – this alternative does not have the ability to result in changes to flow because it is a water quality objective for salinity; furthermore the volume of water needed to meet the Vernalis EC objective is included in the modeling results and, thus, in the impact determinations, for the LSJR alternatives.
AQUA-4: Changes in exposure of fish to suboptimal water temperatures resulting from changes in reservoir storage and releases
Significant—Under the No Project Alternative, temperatures would not increase on the Tuolumne because flows and end-of-September storage would be similar to baseline. However, reductions in April and May flows on the Merced River would very likely increase temperatures in
Less than significant—No substantial changes would occur in exposure of Chinook salmon and steelhead adult migration, spawning and incubation, juvenile rearing, and smolt life stages to suboptimal water temperatures in the Stanislaus, Tuolumne, Merced, and LSJR. Therefore, no significant
Less than Significant—Decreases in exposure of Chinook salmon and steelhead life stages to suboptimal water temperatures would occur for spawning/incubation in the Tuolumne River (March); spring rearing in the Tuolumne, Merced, and LSJR (April–May); and
Less than significant—Decreases in exposure of Chinook salmon and steelhead life stages to suboptimal water temperatures would occur for spawning/incubation in the Stanislaus, Tuolumne, and Merced Rivers (February–March); spring rearing in the
No impact – See AQUA-3. No impact – See AQUA-3.

State Water Resources Control Board California Environmental Protection Agency
Executive Summary
Evaluation of San Joaquin River Flow and Southern Delta Water Quality Objectives and Implementation
ES-79 September 2016
ICF 00427.11
Impact No Project Alternative (LSJR/SDWQ Alternative 1) LSJR Alternative 2a LSJR Alternative 3 a LSJR Alternative 4 a SDWQ Alternative 2 SDWQ Alternative 3
the river in more than half the years (mostly below normal and dry years), in which would increase the frequency of stressful temperatures for Chinook salmon and steelhead rearing and smolt life stages. On the Stanislaus River, higher summer and fall release temperatures associated with reduced storage in New Melones Reservoir are also expected to increase the frequency of stressful water temperatures for Chinook salmon and steelhead adult migration, Chinook salmon spawning and incubation, and steelhead rearing life stages, especially in dry years. Flows and water temperatures in the LSJR would remain largely unchanged relative to baseline conditions, which would result in little or no change in exposure of migrating adults and juveniles to stressful water temperatures.
adverse impacts on Chinook salmon and steelhead populations would occur.
summer rearing (steelhead only) in the Stanislaus, Tuolumne, and Merced Rivers (July). Therefore, no significant adverse impacts would occur. This alternative would have beneficial temperature effects on Chinook salmon and steelhead in the Stanislaus, Tuolumne, and Merced Rivers (including Chinook salmon reared at Merced River Hatchery), and the LSJR.
Stanislaus, Tuolumne, Merced, and LSJR (March–May); spring outmigration in the Stanislaus, Tuolumne, and Merced Rivers (April–June); and summer rearing (steelhead only) in the Tuolumne River (July). Therefore, no significant adverse impacts would occur. Overall, this alternative would have beneficial temperature effects on Chinook salmon and steelhead in the Stanislaus, Tuolumne, and Merced Rivers (including Chinook salmon reared at Merced River Hatchery), and the LSJR.
AQUA-5 : Changes in exposure to pollutants resulting from changes in flow
Significant—Under the No Project Alternative, the exposure to pollutants resulting from changes in flow would not increase on the Stanislaus or Tuolumne Rivers because flows in these rivers would generally be similar to, or greater than, baseline flows. However, on the Merced River, reduction in April and May flows under the No Project Alternative, especially during dry periods, would likely increase pollutant exposure to fish on this river compared to the baseline.
Less than significant—Changes in the frequency and magnitude of flows would not be sufficient to result in long-term changes in dilution effects and exposure of fish to potentially harmful contaminants.
Less than significant—Similar or higher 10th and 50th (median) percentile flows in most months would result in similar or reduced long-term exposure of fish to potentially harmful pollutants. Decreases in exposure of Chinook salmon and steelhead life stages to suboptimal water temperatures would contribute to reductions in the potential for adverse effects associated with contaminant exposure.
Less than significant—Dilution would potentially increase as a result of the increase in flows, and temperatures would either be maintained or reduced; thus, an increase in exposure to pollutants would not occur.
No impact– See AQUA-3. No impact – See AQUA-3.
AQUA-6: Changes in exposure to suspended sediment and turbidity resulting from changes in flow
Less than significant—Changes in the frequency, duration, and magnitude of increased suspended sediment and turbidity levels would be minor and within the range of historical levels experienced by native fishes and other aquatic species on the three eastside tributaries and the LSJR. Because the No Project Alternative flows during wet years are expected to be less than those
Less than significant—Changes in the frequency, duration, and magnitude of increased suspended sediment and turbidity levels are expected to be minor and within the range of historical levels experienced by native fishes and other aquatic species on the three eastside tributaries and the LSJR.
Less than significant—Changes in the frequency, duration, and magnitude of increased suspended sediment and turbidity levels are expected to be minor and within the range of historical levels experienced by native fishes and other aquatic species on the three eastside tributaries and the LSJR.
Less than significant—Changes in the frequency, duration, and magnitude of increased suspended sediment and turbidity levels are expected to be minor and within the range of historical levels experienced by native fishes and other aquatic species on the three eastside tributaries and the LSJR.
No impact—See AQUA-3. No impact—See AQUA-3
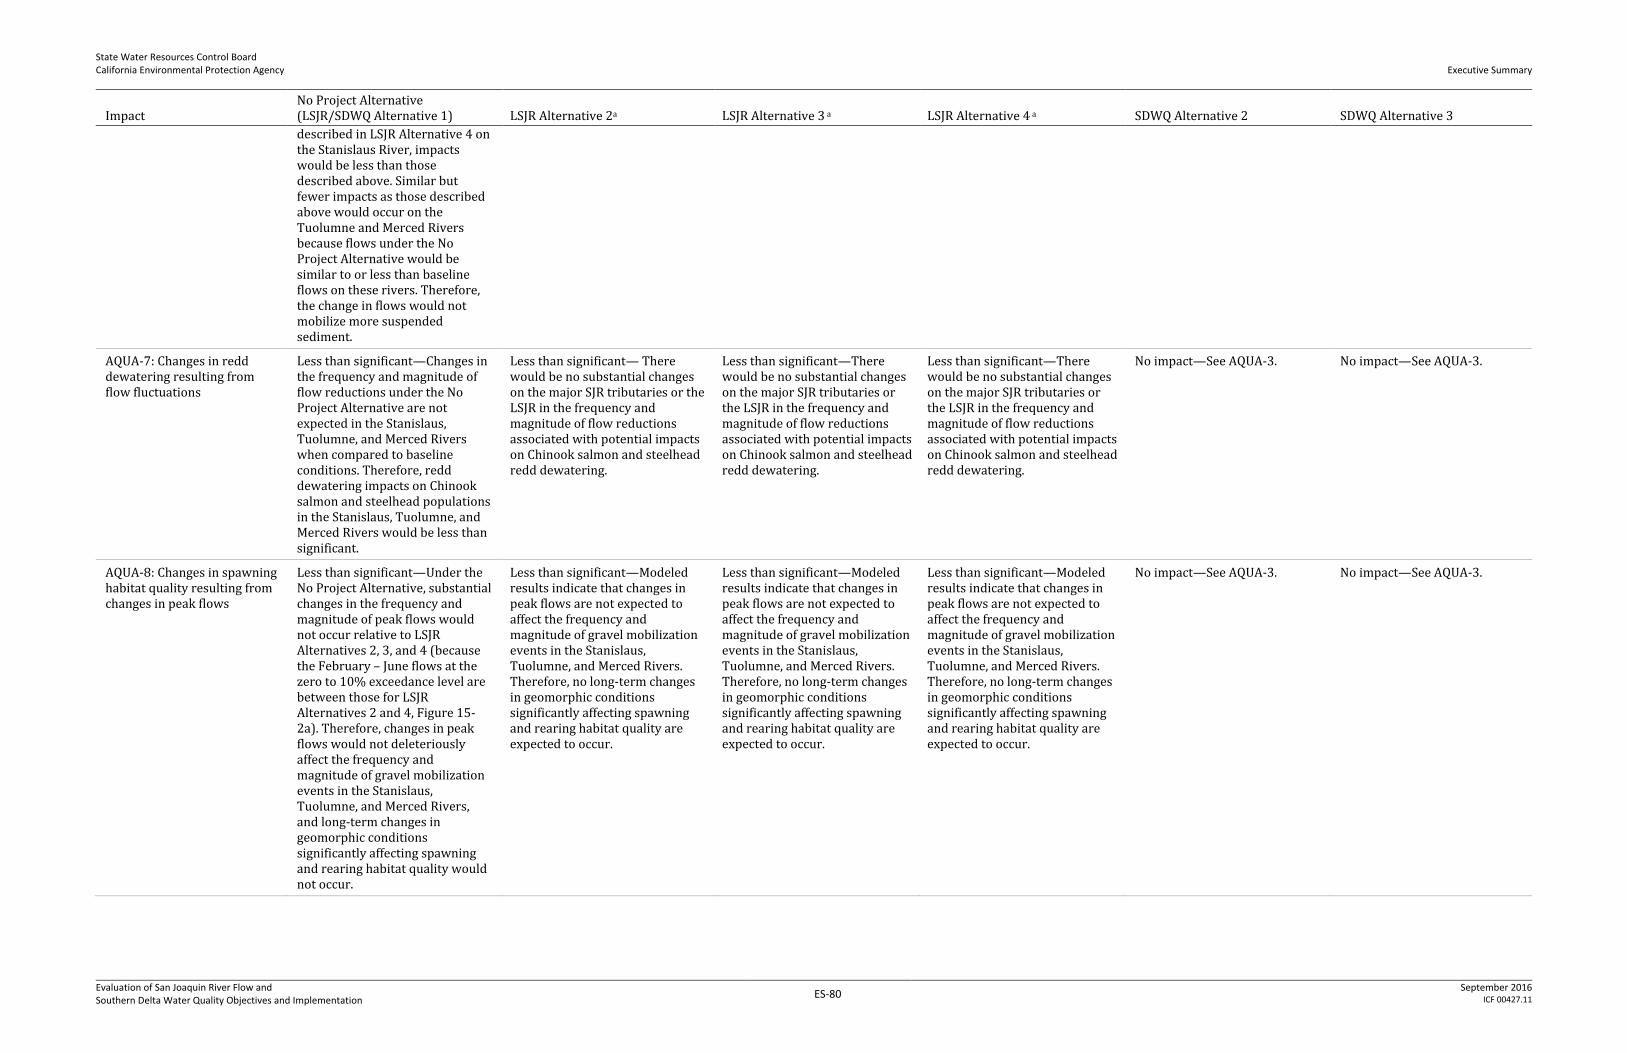
State Water Resources Control Board California Environmental Protection Agency
Executive Summary
Evaluation of San Joaquin River Flow and Southern Delta Water Quality Objectives and Implementation
ES-80 September 2016
ICF 00427.11
Impact No Project Alternative (LSJR/SDWQ Alternative 1) LSJR Alternative 2a LSJR Alternative 3 a LSJR Alternative 4 a SDWQ Alternative 2 SDWQ Alternative 3
described in LSJR Alternative 4 on the Stanislaus River, impacts would be less than those described above. Similar but fewer impacts as those described above would occur on the Tuolumne and Merced Rivers because flows under the No Project Alternative would be similar to or less than baseline flows on these rivers. Therefore, the change in flows would not mobilize more suspended sediment.
AQUA-7: Changes in redd dewatering resulting from flow fluctuations
Less than significant—Changes in the frequency and magnitude of flow reductions under the No Project Alternative are not expected in the Stanislaus, Tuolumne, and Merced Rivers when compared to baseline conditions. Therefore, redd dewatering impacts on Chinook salmon and steelhead populations in the Stanislaus, Tuolumne, and Merced Rivers would be less than significant.
Less than significant— There would be no substantial changes on the major SJR tributaries or the LSJR in the frequency and magnitude of flow reductions associated with potential impacts on Chinook salmon and steelhead redd dewatering.
Less than significant—There would be no substantial changes on the major SJR tributaries or the LSJR in the frequency and magnitude of flow reductions associated with potential impacts on Chinook salmon and steelhead redd dewatering.
Less than significant—There would be no substantial changes on the major SJR tributaries or the LSJR in the frequency and magnitude of flow reductions associated with potential impacts on Chinook salmon and steelhead redd dewatering.
No impact—See AQUA-3. No impact—See AQUA-3.
AQUA-8: Changes in spawning habitat quality resulting from changes in peak flows
Less than significant—Under the No Project Alternative, substantial changes in the frequency and magnitude of peak flows would not occur relative to LSJR Alternatives 2, 3, and 4 (because the February – June flows at the zero to 10% exceedance level are between those for LSJR Alternatives 2 and 4, Figure 15-2a). Therefore, changes in peak flows would not deleteriously affect the frequency and magnitude of gravel mobilization events in the Stanislaus, Tuolumne, and Merced Rivers, and long-term changes in geomorphic conditions significantly affecting spawning and rearing habitat quality would not occur.
Less than significant—Modeled results indicate that changes in peak flows are not expected to affect the frequency and magnitude of gravel mobilization events in the Stanislaus, Tuolumne, and Merced Rivers. Therefore, no long-term changes in geomorphic conditions significantly affecting spawning and rearing habitat quality are expected to occur.
Less than significant—Modeled results indicate that changes in peak flows are not expected to affect the frequency and magnitude of gravel mobilization events in the Stanislaus, Tuolumne, and Merced Rivers. Therefore, no long-term changes in geomorphic conditions significantly affecting spawning and rearing habitat quality are expected to occur.
Less than significant—Modeled results indicate that changes in peak flows are not expected to affect the frequency and magnitude of gravel mobilization events in the Stanislaus, Tuolumne, and Merced Rivers. Therefore, no long-term changes in geomorphic conditions significantly affecting spawning and rearing habitat quality are expected to occur.
No impact—See AQUA-3. No impact—See AQUA-3.
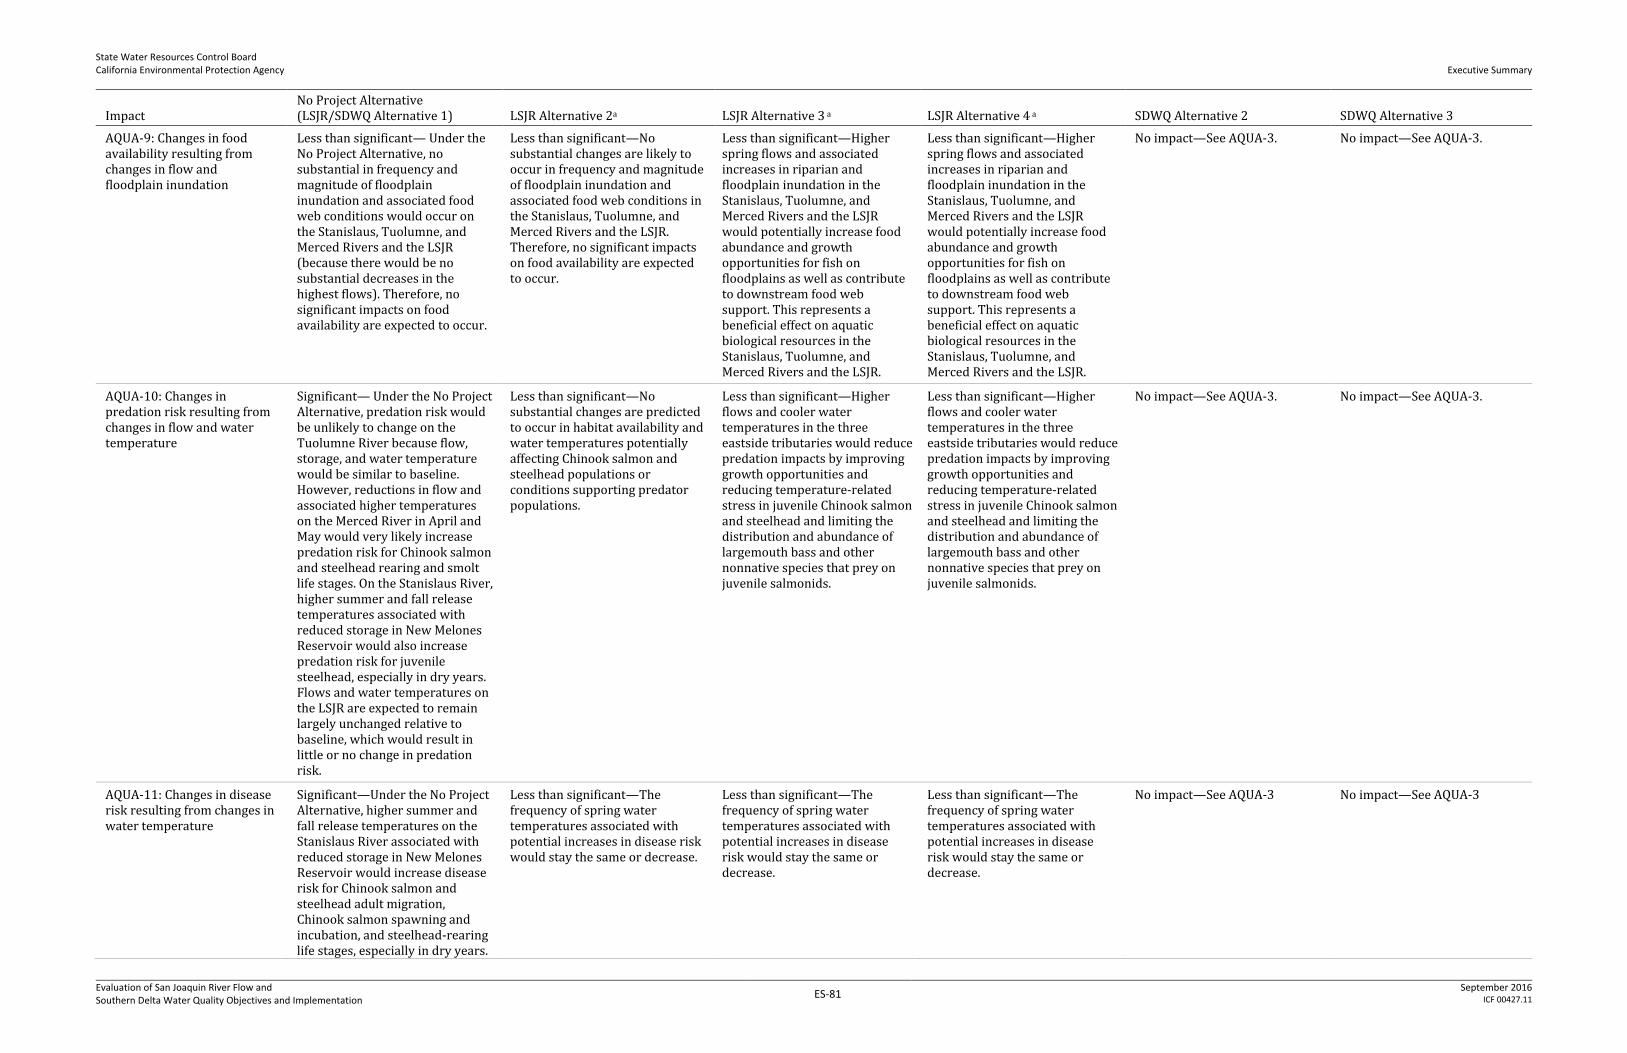
State Water Resources Control Board California Environmental Protection Agency
Executive Summary
Evaluation of San Joaquin River Flow and Southern Delta Water Quality Objectives and Implementation
ES-81 September 2016
ICF 00427.11
Impact No Project Alternative (LSJR/SDWQ Alternative 1) LSJR Alternative 2a LSJR Alternative 3 a LSJR Alternative 4 a SDWQ Alternative 2 SDWQ Alternative 3
AQUA-9: Changes in food availability resulting from changes in flow and floodplain inundation
Less than significant— Under the No Project Alternative, no substantial in frequency and magnitude of floodplain inundation and associated food web conditions would occur on the Stanislaus, Tuolumne, and Merced Rivers and the LSJR (because there would be no substantial decreases in the highest flows). Therefore, no significant impacts on food availability are expected to occur.
Less than significant—No substantial changes are likely to occur in frequency and magnitude of floodplain inundation and associated food web conditions in the Stanislaus, Tuolumne, and Merced Rivers and the LSJR. Therefore, no significant impacts on food availability are expected to occur.
Less than significant—Higher spring flows and associated increases in riparian and floodplain inundation in the Stanislaus, Tuolumne, and Merced Rivers and the LSJR would potentially increase food abundance and growth opportunities for fish on floodplains as well as contribute to downstream food web support. This represents a beneficial effect on aquatic biological resources in the Stanislaus, Tuolumne, and Merced Rivers and the LSJR.
Less than significant—Higher spring flows and associated increases in riparian and floodplain inundation in the Stanislaus, Tuolumne, and Merced Rivers and the LSJR would potentially increase food abundance and growth opportunities for fish on floodplains as well as contribute to downstream food web support. This represents a beneficial effect on aquatic biological resources in the Stanislaus, Tuolumne, and Merced Rivers and the LSJR.
No impact—See AQUA-3. No impact—See AQUA-3.
AQUA-10: Changes in predation risk resulting from changes in flow and water temperature
Significant— Under the No Project Alternative, predation risk would be unlikely to change on the Tuolumne River because flow, storage, and water temperature would be similar to baseline. However, reductions in flow and associated higher temperatures on the Merced River in April and May would very likely increase predation risk for Chinook salmon and steelhead rearing and smolt life stages. On the Stanislaus River, higher summer and fall release temperatures associated with reduced storage in New Melones Reservoir would also increase predation risk for juvenile steelhead, especially in dry years. Flows and water temperatures on the LSJR are expected to remain largely unchanged relative to baseline, which would result in little or no change in predation risk.
Less than significant—No substantial changes are predicted to occur in habitat availability and water temperatures potentially affecting Chinook salmon and steelhead populations or conditions supporting predator populations.
Less than significant—Higher flows and cooler water temperatures in the three eastside tributaries would reduce predation impacts by improving growth opportunities and reducing temperature-related stress in juvenile Chinook salmon and steelhead and limiting the distribution and abundance of largemouth bass and other nonnative species that prey on juvenile salmonids.
Less than significant—Higher flows and cooler water temperatures in the three eastside tributaries would reduce predation impacts by improving growth opportunities and reducing temperature-related stress in juvenile Chinook salmon and steelhead and limiting the distribution and abundance of largemouth bass and other nonnative species that prey on juvenile salmonids.
No impact—See AQUA-3. No impact—See AQUA-3.
AQUA-11: Changes in disease risk resulting from changes in water temperature
Significant—Under the No Project Alternative, higher summer and fall release temperatures on the Stanislaus River associated with reduced storage in New Melones Reservoir would increase disease risk for Chinook salmon and steelhead adult migration, Chinook salmon spawning and incubation, and steelhead-rearing life stages, especially in dry years.
Less than significant—The frequency of spring water temperatures associated with potential increases in disease risk would stay the same or decrease.
Less than significant—The frequency of spring water temperatures associated with potential increases in disease risk would stay the same or decrease.
Less than significant—The frequency of spring water temperatures associated with potential increases in disease risk would stay the same or decrease.
No impact—See AQUA-3 No impact—See AQUA-3

State Water Resources Control Board California Environmental Protection Agency
Executive Summary
Evaluation of San Joaquin River Flow and Southern Delta Water Quality Objectives and Implementation
ES-82 September 2016
ICF 00427.11
Impact No Project Alternative (LSJR/SDWQ Alternative 1) LSJR Alternative 2a LSJR Alternative 3 a LSJR Alternative 4 a SDWQ Alternative 2 SDWQ Alternative 3
On the Tuolumne River, disease risk would be unlikely to change because flow, storage, and water temperature would be very similar to baseline. However, reductions in flow and associated higher temperatures on the Merced River in April and May would very likely increase disease risk for Chinook salmon and steelhead-rearing and smolt life stages. Flows and water temperatures on the LSJR would remain largely unchanged relative to baseline, which would result in little or no change in disease risk
AQUA-12: Changes in southern Delta and estuarine habitat resulting from changes in SJR inflows and export effects
Less than significant—Under the No Project Alternative, Delta operations would continue to be governed by current restrictions on export pumping rates, inflow/export ratios, and Old Middle River (OMR) flows to protect listed fish species from direct and indirect impacts of southern Delta operations. Furthermore, during the primary months of concern for fish using the Delta (December–June), changes in exports would be relatively small and less than the changes under LSJR Alternatives 3 and 4, while average monthly Delta outflow would either be similar to or slightly greater than baseline outflow. Therefore, no significant changes in southern Delta and estuarine habitat are expected to occur under the No Project Alternative.
Less than significant—No substantial changes in southern Delta and estuarine habitat are expected to occur. The combination of monthly changes in pumping rates, SJR flow, and Delta outflow would not have substantial long-term effects on flow patterns in the southern Delta. Furthermore, there would be little effect on Delta outflows and the position of X2c; Delta operations would continue to be governed by current restrictions on export pumping rates, inflow/export ratios, and Old Middle River flows to protect listed fish species from direct and indirect impacts of southern Delta operations.
Less than significant—No substantial changes in southern Delta and estuarine habitat are expected to occur. The combination of monthly changes in pumping rates, SJR flow, and Delta outflow would not have substantial long-term effects on flow patterns in the southern Delta. Furthermore, there would be little effect on Delta outflows and the position of X2; Delta operations would continue to be governed by current restrictions on export pumping rates, inflow/export ratios, and Old Middle River flows to protect listed fish species from direct and indirect impacts of southern Delta operations.
Less than significant —No substantial changes in southern Delta and estuarine habitat are expected to occur. The combination of monthly changes in pumping rates, SJR flow, and Delta outflow would not have substantial long-term effects on flow patterns in the southern Delta. Furthermore, there would be little effect on Delta outflows and the position of X2; Delta operations would continue to be governed by current restrictions on export pumping rates, inflow/export ratios, and Old Middle River flows to protect listed fish species from direct and indirect impacts of southern Delta operations.
No impact—See AQUA-3. No impact—See AQUA-3.
Chapter 8: Terrestrial Biological Resources
BIO-1 : Have a substantial adverse effect on any riparian habitat or other sensitive natural terrestrial communities identified in local or regional plans, policies, regulations or by CDFW and USFWS
Significant—Fluctuations in reservoir elevations would not be substantially different than those that currently occur. Therefore, the No Project Alternative would not have adverse effects on riparian or other sensitive natural terrestrial communities around the reservoirs.
Under the No Project Alternative,
Less than significant—The change in median monthly flows or overall cumulative distribution of flows on the Stanislaus, Tuolumne, and Merced Rivers and the LSJR would not substantially effect riparian habitat or other sensitive terrestrial communities because the plants located within the area of potential effects can survive inundation, are resistant to the
Less than significant—The change in median monthly flows or overall cumulative distribution of flows on the Stanislaus, Tuolumne, and Merced Rivers and the LSJR would not substantially effect riparian habitat or other sensitive terrestrial communities because the plants located within the area of potential effects can
Less than significant—The change in median monthly flows or overall cumulative distribution of flows on the Stanislaus, Tuolumne, and Merced Rivers and the LSJR would not substantially effect riparian habitat or other sensitive terrestrial communities because the plants located within the area of potential effects can
No impact—No ability to result in changes to flow because it is a water quality objective for salinity; furthermore, the volume of water needed to meet the Vernalis EC objective is included in the modeling results and, thus, in the impact determinations for the LSJR alternatives. Finally, salinity in the southern Delta would
No impact—No ability to result in changes to flow because it is a water quality objective for salinity; furthermore, the volume of water needed to meet the Vernalis EC objective is included in the modeling results and, thus, in the impact determinations for the LSJR alternatives. Finally, salinity in the southern Delta would
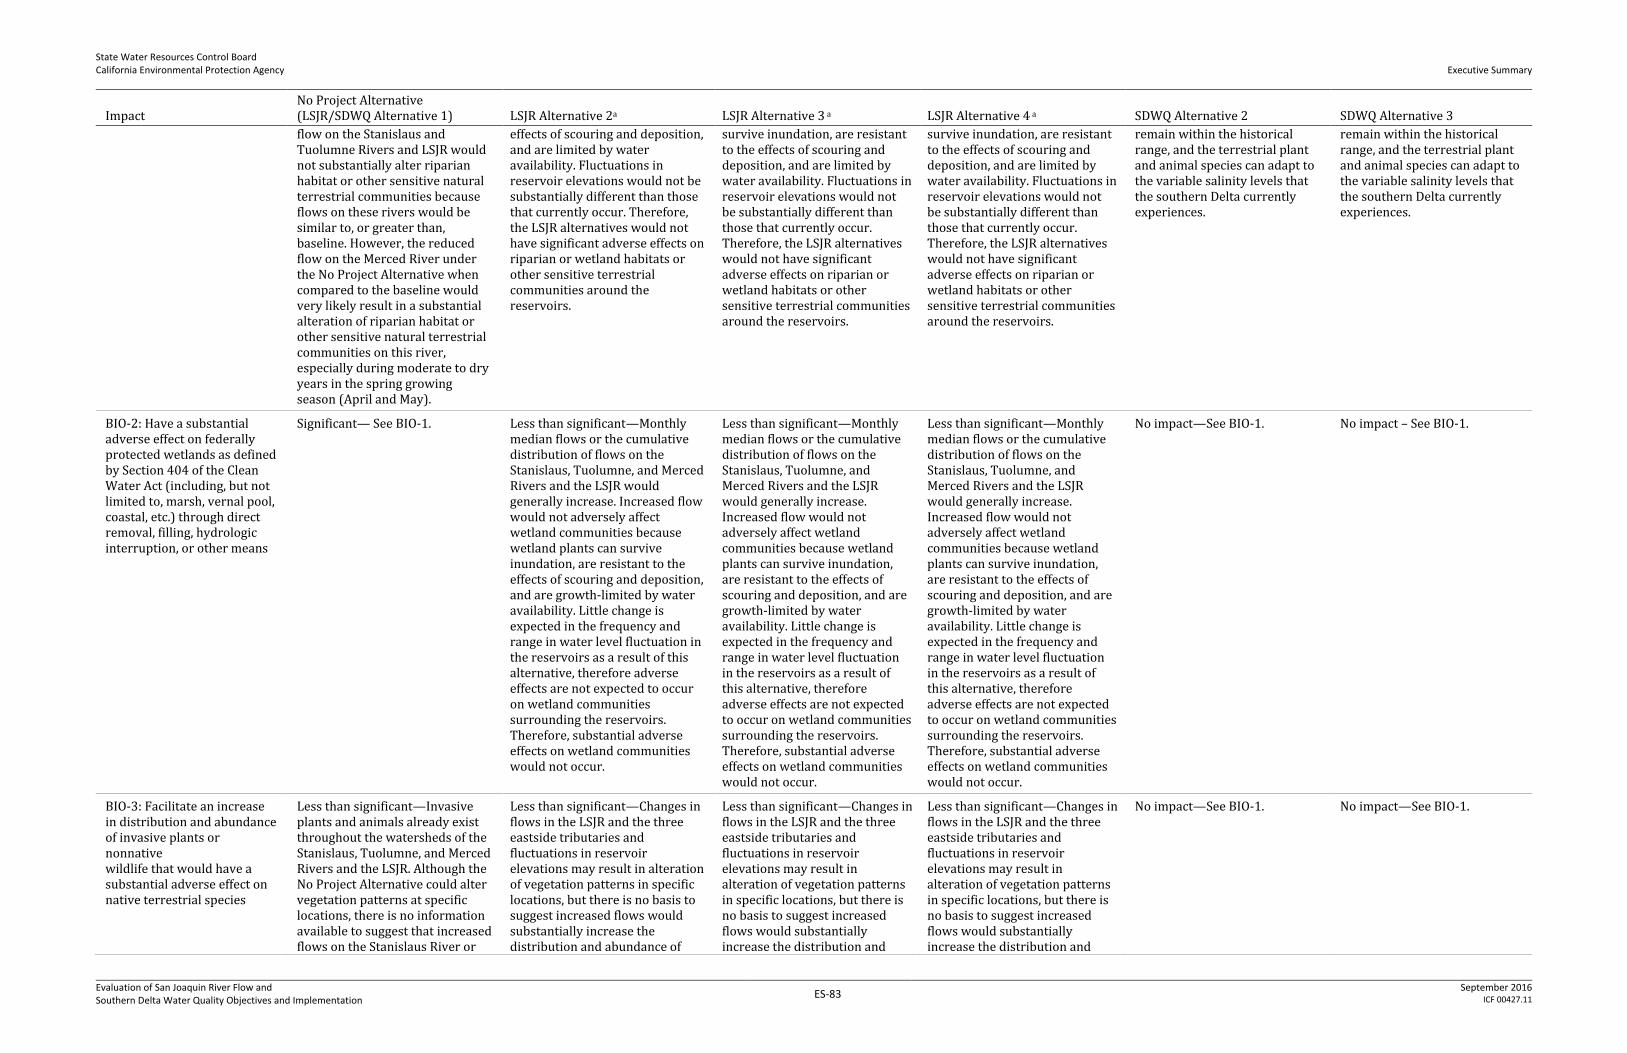
State Water Resources Control Board California Environmental Protection Agency
Executive Summary
Evaluation of San Joaquin River Flow and Southern Delta Water Quality Objectives and Implementation
ES-83 September 2016
ICF 00427.11
Impact No Project Alternative (LSJR/SDWQ Alternative 1) LSJR Alternative 2a LSJR Alternative 3 a LSJR Alternative 4 a SDWQ Alternative 2 SDWQ Alternative 3
flow on the Stanislaus and Tuolumne Rivers and LSJR would not substantially alter riparian habitat or other sensitive natural terrestrial communities because flows on these rivers would be similar to, or greater than, baseline. However, the reduced flow on the Merced River under the No Project Alternative when compared to the baseline would very likely result in a substantial alteration of riparian habitat or other sensitive natural terrestrial communities on this river, especially during moderate to dry years in the spring growing season (April and May).
effects of scouring and deposition, and are limited by water availability. Fluctuations in reservoir elevations would not be substantially different than those that currently occur. Therefore, the LSJR alternatives would not have significant adverse effects on riparian or wetland habitats or other sensitive terrestrial communities around the reservoirs.
survive inundation, are resistant to the effects of scouring and deposition, and are limited by water availability. Fluctuations in reservoir elevations would not be substantially different than those that currently occur. Therefore, the LSJR alternatives would not have significant adverse effects on riparian or wetland habitats or other sensitive terrestrial communities around the reservoirs.
survive inundation, are resistant to the effects of scouring and deposition, and are limited by water availability. Fluctuations in reservoir elevations would not be substantially different than those that currently occur. Therefore, the LSJR alternatives would not have significant adverse effects on riparian or wetland habitats or other sensitive terrestrial communities around the reservoirs.
remain within the historical range, and the terrestrial plant and animal species can adapt to the variable salinity levels that the southern Delta currently experiences.
remain within the historical range, and the terrestrial plant and animal species can adapt to the variable salinity levels that the southern Delta currently experiences.
BIO-2: Have a substantial adverse effect on federally protected wetlands as defined by Section 404 of the Clean Water Act (including, but not limited to, marsh, vernal pool, coastal, etc.) through direct removal, filling, hydrologic interruption, or other means
Significant— See BIO-1.
Less than significant—Monthly median flows or the cumulative distribution of flows on the Stanislaus, Tuolumne, and Merced Rivers and the LSJR would generally increase. Increased flow would not adversely affect wetland communities because wetland plants can survive inundation, are resistant to the effects of scouring and deposition, and are growth-limited by water availability. Little change is expected in the frequency and range in water level fluctuation in the reservoirs as a result of this alternative, therefore adverse effects are not expected to occur on wetland communities surrounding the reservoirs. Therefore, substantial adverse effects on wetland communities would not occur.
Less than significant—Monthly median flows or the cumulative distribution of flows on the Stanislaus, Tuolumne, and Merced Rivers and the LSJR would generally increase. Increased flow would not adversely affect wetland communities because wetland plants can survive inundation, are resistant to the effects of scouring and deposition, and are growth-limited by water availability. Little change is expected in the frequency and range in water level fluctuation in the reservoirs as a result of this alternative, therefore adverse effects are not expected to occur on wetland communities surrounding the reservoirs. Therefore, substantial adverse effects on wetland communities would not occur.
Less than significant—Monthly median flows or the cumulative distribution of flows on the Stanislaus, Tuolumne, and Merced Rivers and the LSJR would generally increase. Increased flow would not adversely affect wetland communities because wetland plants can survive inundation, are resistant to the effects of scouring and deposition, and are growth-limited by water availability. Little change is expected in the frequency and range in water level fluctuation in the reservoirs as a result of this alternative, therefore adverse effects are not expected to occur on wetland communities surrounding the reservoirs. Therefore, substantial adverse effects on wetland communities would not occur.
No impact—See BIO-1. No impact – See BIO-1.
BIO-3: Facilitate an increase in distribution and abundance of invasive plants or nonnative wildlife that would have a substantial adverse effect on native terrestrial species
Less than significant—Invasive plants and animals already exist throughout the watersheds of the Stanislaus, Tuolumne, and Merced Rivers and the LSJR. Although the No Project Alternative could alter vegetation patterns at specific locations, there is no information available to suggest that increased flows on the Stanislaus River or
Less than significant—Changes in flows in the LSJR and the three eastside tributaries and fluctuations in reservoir elevations may result in alteration of vegetation patterns in specific locations, but there is no basis to suggest increased flows would substantially increase the distribution and abundance of
Less than significant—Changes in flows in the LSJR and the three eastside tributaries and fluctuations in reservoir elevations may result in alteration of vegetation patterns in specific locations, but there is no basis to suggest increased flows would substantially increase the distribution and
Less than significant—Changes in flows in the LSJR and the three eastside tributaries and fluctuations in reservoir elevations may result in alteration of vegetation patterns in specific locations, but there is no basis to suggest increased flows would substantially increase the distribution and
No impact—See BIO-1. No impact—See BIO-1.

State Water Resources Control Board California Environmental Protection Agency
Executive Summary
Evaluation of San Joaquin River Flow and Southern Delta Water Quality Objectives and Implementation
ES-84 September 2016
ICF 00427.11
Impact No Project Alternative (LSJR/SDWQ Alternative 1) LSJR Alternative 2a LSJR Alternative 3 a LSJR Alternative 4 a SDWQ Alternative 2 SDWQ Alternative 3
decreased flows on the Merced River would substantially increase the distribution or abundance of invasive plant or nonnative wildlife in a manner that would substantially native terrestrial species.
invasive plant species. Little change is expected in the frequency and range in water level fluctuation in the reservoirs as a result of this alternative. In addition, the potential for invasive plants and nonnative wildlife species to increase due to a reduction in irrigation water supply availability or potential fallowing would not be expected to exceed existing levels because some agricultural lands would be farmed less intensively, fallowed lands can retain growth, and existing invasive species programs would continue to be implemented. Therefore, an increase in the distribution and abundance of invasive plants or nonnative wildlife is not expected to result from implementation of this alternative.
abundance of invasive plant species. Little change is expected in the frequency and range in water level fluctuation in the reservoirs as a result of this alternative. In addition, the potential for invasive plants and nonnative wildlife species to increase due to a reduction in irrigation water supply availability or potential fallowing would not be expected to exceed existing levels because some agricultural lands would be farmed less intensively, fallowed lands can retain growth, and existing invasive species programs would continue to be implemented. Therefore, an increase in the distribution and abundance of invasive plants or nonnative wildlife is not expected to result from implementation of this alternative.
abundance of invasive plant species. Little change is expected in the frequency and range in water level fluctuation in the reservoirs as a result of this alternative In addition, the potential for invasive plants and nonnative wildlife species to increase due to a reduction in irrigation water supply availability or potential fallowing would not be expected to exceed existing levels because some agricultural lands would be farmed less intensively, fallowed lands can retain growth, and existing invasive species programs would continue to be implemented. Therefore, an increase in the distribution and abundance of invasive plants or nonnative wildlife is not expected to result from implementation of this alternative.
BIO-4: Have a substantial adverse effect, either directly or through habitat modifications, on any terrestrial animal species identified as a candidate, sensitive, or special-status species in local or regional plans, policies, or regulations or by CDFW and USFWS
Significant—Under the No Project Alternative, flows on Stanislaus and Tuolumne Rivers and the LSJR would be similar to, or greater than, baseline. Therefore, the special-status animal species on these rivers would not be substantially affected. However, the reduced flow on the Merced River under the No Project Alternative compared to the baseline would very likely result in substantial effects on special-status species reliant on riparian habitat on this river. Therefore, the special-status animal species on the Merced River would be adversely affected.
Less than significant—Most of the special-status animal species present in the area of potential effects are dependent on riparian habitat. As described above for BIO-1, there would not be a substantial change to available riparian habitat. Similarly, the frequency and range in reservoir elevation fluctuation are not expected to change substantially compared to the baseline conditions consequently, adverse effects are not expected to occur to special-status species or their habitat at the reservoirs. A potential reduction in irrigation water supply in the area of potential indirect effects would not have a substantial adverse effect on special status species due to indirect habitat modification because agricultural land cover would not necessarily be fallowed in perpetuity, as lands could be dryland farmed, deficit irrigated, or rotated. This could result in less agricultural intensive practices on
Less than significant—Most of the special-status animal species present in the area of potential effects are dependent on riparian habitat. As described above for BIO-1, there would not be a substantial change to available riparian habitat. Similarly, the frequency and range in reservoir elevation fluctuation are not expected to change substantially compared to the baseline conditions consequently, adverse effects are not expected to occur to special-status species or their habitat at the reservoirs. A potential reduction in irrigation water supply in the area of potential indirect effects would not have a substantial adverse effect on special status species due to indirect habitat modification because agricultural land cover would not necessarily be fallowed in perpetuity, as lands could be dryland farmed, deficit irrigated, or rotated. This could result in less agricultural
Less than significant—Most of the special-status animal species present in the area of potential effects are dependent on riparian habitat. As described above for BIO-1, there would not be a substantial change to available riparian habitat. Similarly, the frequency and range in reservoir elevation fluctuation are not expected to change substantially compared to the baseline conditions consequently, adverse effects are not expected to occur to special-status species or their habitat at the reservoirs. A potential reduction in irrigation water supply in the area of potential indirect effects would not have a substantial adverse effect on special status species due to indirect habitat modification because agricultural land cover would not necessarily be fallowed in perpetuity, as lands could be dryland farmed, deficit irrigated, or rotated. This could result in less agricultural
No impact—See BIO-1. No impact—See BIO-1.
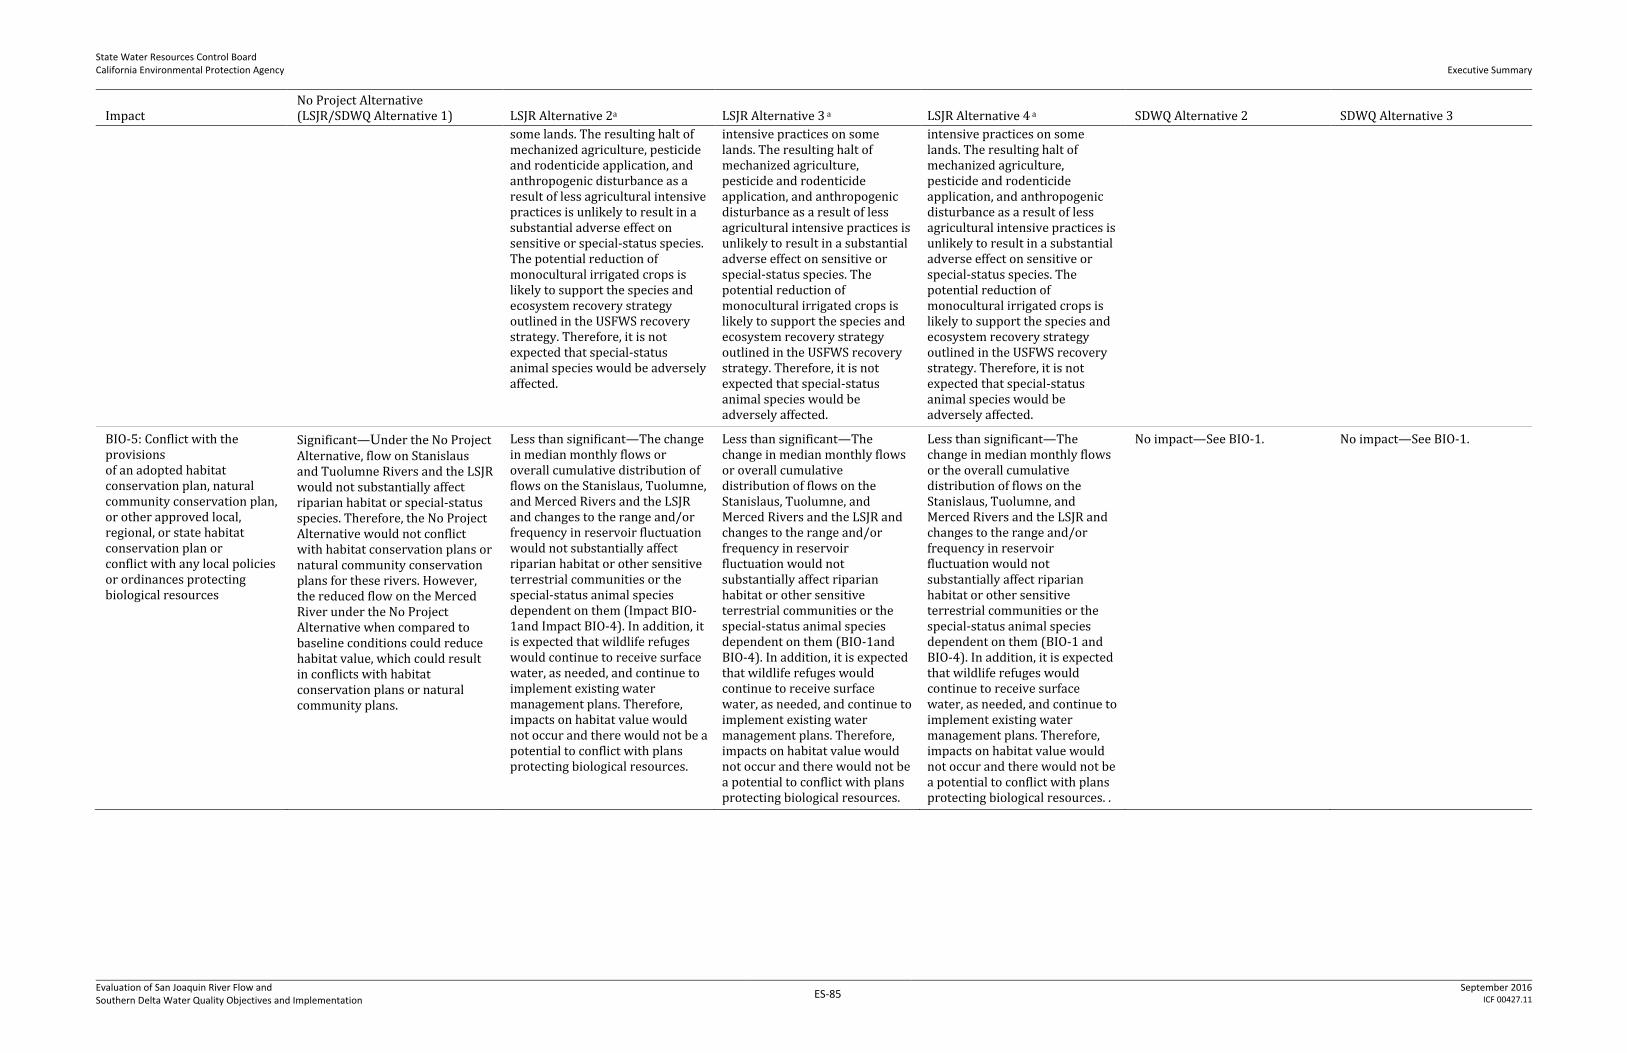
State Water Resources Control Board California Environmental Protection Agency
Executive Summary
Evaluation of San Joaquin River Flow and Southern Delta Water Quality Objectives and Implementation
ES-85 September 2016
ICF 00427.11
Impact No Project Alternative (LSJR/SDWQ Alternative 1) LSJR Alternative 2a LSJR Alternative 3 a LSJR Alternative 4 a SDWQ Alternative 2 SDWQ Alternative 3
some lands. The resulting halt of mechanized agriculture, pesticide and rodenticide application, and anthropogenic disturbance as a result of less agricultural intensive practices is unlikely to result in a substantial adverse effect on sensitive or special-status species. The potential reduction of monocultural irrigated crops is likely to support the species and ecosystem recovery strategy outlined in the USFWS recovery strategy. Therefore, it is not expected that special-status animal species would be adversely affected.
intensive practices on some lands. The resulting halt of mechanized agriculture, pesticide and rodenticide application, and anthropogenic disturbance as a result of less agricultural intensive practices is unlikely to result in a substantial adverse effect on sensitive or special-status species. The potential reduction of monocultural irrigated crops is likely to support the species and ecosystem recovery strategy outlined in the USFWS recovery strategy. Therefore, it is not expected that special-status animal species would be adversely affected.
intensive practices on some lands. The resulting halt of mechanized agriculture, pesticide and rodenticide application, and anthropogenic disturbance as a result of less agricultural intensive practices is unlikely to result in a substantial adverse effect on sensitive or special-status species. The potential reduction of monocultural irrigated crops is likely to support the species and ecosystem recovery strategy outlined in the USFWS recovery strategy. Therefore, it is not expected that special-status animal species would be adversely affected.
BIO-5: Conflict with the provisions of an adopted habitat conservation plan, natural community conservation plan, or other approved local, regional, or state habitat conservation plan or conflict with any local policies or ordinances protecting biological resources
Significant—Under the No Project Alternative, flow on Stanislaus and Tuolumne Rivers and the LSJR would not substantially affect riparian habitat or special-status species. Therefore, the No Project Alternative would not conflict with habitat conservation plans or natural community conservation plans for these rivers. However, the reduced flow on the Merced River under the No Project Alternative when compared to baseline conditions could reduce habitat value, which could result in conflicts with habitat conservation plans or natural community plans.
Less than significant—The change in median monthly flows or overall cumulative distribution of flows on the Stanislaus, Tuolumne, and Merced Rivers and the LSJR and changes to the range and/or frequency in reservoir fluctuation would not substantially affect riparian habitat or other sensitive terrestrial communities or the special-status animal species dependent on them (Impact BIO-1and Impact BIO-4). In addition, it is expected that wildlife refuges would continue to receive surface water, as needed, and continue to implement existing water management plans. Therefore, impacts on habitat value would not occur and there would not be a potential to conflict with plans protecting biological resources.
Less than significant—The change in median monthly flows or overall cumulative distribution of flows on the Stanislaus, Tuolumne, and Merced Rivers and the LSJR and changes to the range and/or frequency in reservoir fluctuation would not substantially affect riparian habitat or other sensitive terrestrial communities or the special-status animal species dependent on them (BIO-1and BIO-4). In addition, it is expected that wildlife refuges would continue to receive surface water, as needed, and continue to implement existing water management plans. Therefore, impacts on habitat value would not occur and there would not be a potential to conflict with plans protecting biological resources.
Less than significant—The change in median monthly flows or the overall cumulative distribution of flows on the Stanislaus, Tuolumne, and Merced Rivers and the LSJR and changes to the range and/or frequency in reservoir fluctuation would not substantially affect riparian habitat or other sensitive terrestrial communities or the special-status animal species dependent on them (BIO-1 and BIO-4). In addition, it is expected that wildlife refuges would continue to receive surface water, as needed, and continue to implement existing water management plans. Therefore, impacts on habitat value would not occur and there would not be a potential to conflict with plans protecting biological resources. .
No impact—See BIO-1. No impact—See BIO-1.

State Water Resources Control Board California Environmental Protection Agency
Executive Summary
Evaluation of San Joaquin River Flow and Southern Delta Water Quality Objectives and Implementation
ES-86 September 2016
ICF 00427.11
Impact No Project Alternative (LSJR/SDWQ Alternative 1) LSJR Alternative 2a LSJR Alternative 3 a LSJR Alternative 4 a SDWQ Alternative 2 SDWQ Alternative 3
Chapter 9: Groundwater Resources
Impact GW-1: Substantially deplete groundwater supplies or interfere substantially with groundwater recharge
Less than significant— Surface water diversions on the Tuolumne and Merced Rivers would be similar under the No Project Alternative and baseline. Because there would be no change in surface water availability, the groundwater subbasins (Modesto, Turlock, and Extended Merced) served by these rivers would not be affected by the No Project Alternative. However, surface water diversions on the Stanislaus River would be reduced by approximately 9% under the No Project Alternative; diversions would also be reduced under LSJR Alternatives 2 and 3 (average reduction of 2% and 12%, respectively). As such, the Eastern San Joaquin Subbasin, with is served by the Stanislaus River, would be affected by the reduced surface water diversions. However, the groundwater impacts associated with LSJR Alternative 3 would be less than significant. Because surface water diversions reductions under No Project Alternative (9%) would be less than surface water diversion reductions under LSJR Alternative 3 (12%, the groundwater affects associated with the No Project Alternative would also be less than significant.
Less than significant—The average annual groundwater balance is expected to be reduced by less than the equivalent of 1 inch across each of the subbasins. This is not expected to produce a measurable decrease in groundwater elevations. Therefore, there would not be a substantial depletion of groundwater supplies or substantial interference with groundwater recharge.
Significant and unavoidable—The average annual groundwater balance could potentially be reduced by more than the equivalent of 1 inch in three subbasins (Modesto, Turlock, and Extended Merced). If this occurred, it would eventually produce a measurable decrease in groundwater elevations. The effect would be more severe during dry years and in areas farther from the SJR, the valley low point toward which groundwater slowly moves. Therefore, there could potentially be a significant and unavoidable depletion of groundwater supplies or substantial interference with groundwater recharge, and resulting potential migration of groundwater contamination under this alternative.
Significant and unavoidable—The average annual groundwater balance could potentially be reduced by more than the equivalent of 1 inch in all four subbasins (Eastern San Joaquin, Modesto, Turlock, and Extended Merced). If this occurred, it would eventually produce a measurable decrease in groundwater elevations. The effect would be more severe during dry years and in areas farther from the SJR, the valley low point toward which groundwater slowly moves. Therefore, there could be a potentially significant and unavoidable depletion of groundwater supplies or substantial interference with groundwater recharge, and resulting potential migration of groundwater contamination under this alternative.
No impact— This alternative would not result in a change in groundwater pumping or groundwater recharge from surface water that currently takes place in the plan area.
No impact— This alternative would not result in a change in groundwater pumping or groundwater recharge from surface water that currently takes place in the plan area.
Impact GW-2: Cause subsidence as a result of groundwater depletion
Less than significant— As described above for impact GW-1, the effect of the No Project Alternative on groundwater supplies is expected to be less than significant. As a result, subsidence resulting from the No Project Alternative is also expected to be less than significant.
Less than significant— The average annual groundwater balance is expected to be reduced by less than the equivalent of 1 inch across each of the subbasins. This is not expected to produce a measurable decrease in groundwater elevations or associated subsidence.
Significant and unavoidable — The average annual groundwater balance could potentially be reduced by more than the equivalent of 1 inch across three subbasins (Modesto, Turlock, and Extended Merced) under LSJR Alternative 3 and across all four subbasins under LSJR Alternative 4. If this occurred, it could worsen subsidence that is already occurring in the Extended Merced Subbasinb. Therefore, there could be a potentially significant and
Significant and unavoidable — The average annual groundwater balance could potentially be reduced by more than the equivalent of 1 inch across three subbasins (Modesto, Turlock, and Extended Merced) under LSJR Alternative 3 and across all four subbasins under LSJR Alternative 4. If this occurred, it could worsen subsidence that is already occurring in the Extended Merced Subbasin. Therefore, there could be a potentially significant and
No impact—See GW-1. No impact—See GW-1.
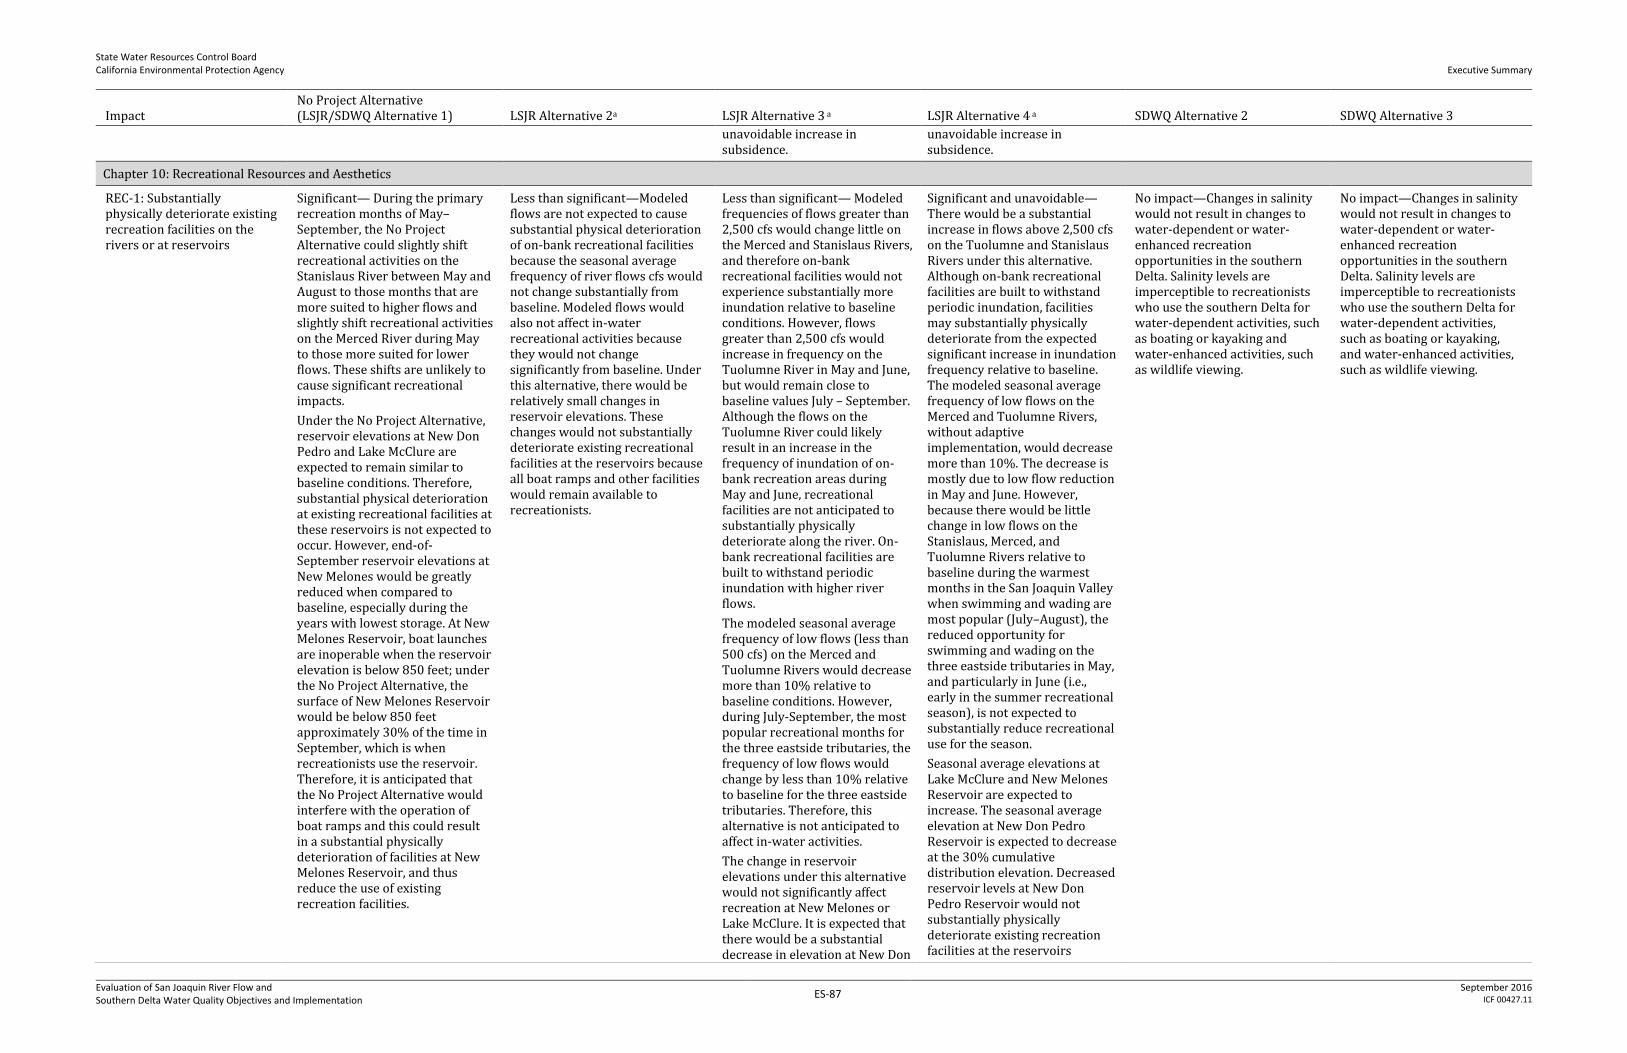
State Water Resources Control Board California Environmental Protection Agency
Executive Summary
Evaluation of San Joaquin River Flow and Southern Delta Water Quality Objectives and Implementation
ES-87 September 2016
ICF 00427.11
Impact No Project Alternative (LSJR/SDWQ Alternative 1) LSJR Alternative 2a LSJR Alternative 3 a LSJR Alternative 4 a SDWQ Alternative 2 SDWQ Alternative 3
unavoidable increase in subsidence.
unavoidable increase in subsidence.
Chapter 10: Recreational Resources and Aesthetics
REC-1: Substantially physically deteriorate existing recreation facilities on the rivers or at reservoirs
Significant— During the primary recreation months of May–September, the No Project Alternative could slightly shift recreational activities on the Stanislaus River between May and August to those months that are more suited to higher flows and slightly shift recreational activities on the Merced River during May to those more suited for lower flows. These shifts are unlikely to cause significant recreational impacts.
Under the No Project Alternative, reservoir elevations at New Don Pedro and Lake McClure are expected to remain similar to baseline conditions. Therefore, substantial physical deterioration at existing recreational facilities at these reservoirs is not expected to occur. However, end-of-September reservoir elevations at New Melones would be greatly reduced when compared to baseline, especially during the years with lowest storage. At New Melones Reservoir, boat launches are inoperable when the reservoir elevation is below 850 feet; under the No Project Alternative, the surface of New Melones Reservoir would be below 850 feet approximately 30% of the time in September, which is when recreationists use the reservoir. Therefore, it is anticipated that the No Project Alternative would interfere with the operation of boat ramps and this could result in a substantial physically deterioration of facilities at New Melones Reservoir, and thus reduce the use of existing recreation facilities.
Less than significant—Modeled flows are not expected to cause substantial physical deterioration of on-bank recreational facilities because the seasonal average frequency of river flows cfs would not change substantially from baseline. Modeled flows would also not affect in-water recreational activities because they would not change significantly from baseline. Under this alternative, there would be relatively small changes in reservoir elevations. These changes would not substantially deteriorate existing recreational facilities at the reservoirs because all boat ramps and other facilities would remain available to recreationists.
Less than significant— Modeled frequencies of flows greater than 2,500 cfs would change little on the Merced and Stanislaus Rivers, and therefore on-bank recreational facilities would not experience substantially more inundation relative to baseline conditions. However, flows greater than 2,500 cfs would increase in frequency on the Tuolumne River in May and June, but would remain close to baseline values July – September. Although the flows on the Tuolumne River could likely result in an increase in the frequency of inundation of on-bank recreation areas during May and June, recreational facilities are not anticipated to substantially physically deteriorate along the river. On-bank recreational facilities are built to withstand periodic inundation with higher river flows.
The modeled seasonal average frequency of low flows (less than 500 cfs) on the Merced and Tuolumne Rivers would decrease more than 10% relative to baseline conditions. However, during July-September, the most popular recreational months for the three eastside tributaries, the frequency of low flows would change by less than 10% relative to baseline for the three eastside tributaries. Therefore, this alternative is not anticipated to affect in-water activities.
The change in reservoir elevations under this alternative would not significantly affect recreation at New Melones or Lake McClure. It is expected that there would be a substantial decrease in elevation at New Don
Significant and unavoidable—There would be a substantial increase in flows above 2,500 cfs on the Tuolumne and Stanislaus Rivers under this alternative. Although on-bank recreational facilities are built to withstand periodic inundation, facilities may substantially physically deteriorate from the expected significant increase in inundation frequency relative to baseline. The modeled seasonal average frequency of low flows on the Merced and Tuolumne Rivers, without adaptive implementation, would decrease more than 10%. The decrease is mostly due to low flow reduction in May and June. However, because there would be little change in low flows on the Stanislaus, Merced, and Tuolumne Rivers relative to baseline during the warmest months in the San Joaquin Valley when swimming and wading are most popular (July–August), the reduced opportunity for swimming and wading on the three eastside tributaries in May, and particularly in June (i.e., early in the summer recreational season), is not expected to substantially reduce recreational use for the season.
Seasonal average elevations at Lake McClure and New Melones Reservoir are expected to increase. The seasonal average elevation at New Don Pedro Reservoir is expected to decrease at the 30% cumulative distribution elevation. Decreased reservoir levels at New Don Pedro Reservoir would not substantially physically deteriorate existing recreation facilities at the reservoirs
No impact—Changes in salinity would not result in changes to water-dependent or water-enhanced recreation opportunities in the southern Delta. Salinity levels are imperceptible to recreationists who use the southern Delta for water-dependent activities, such as boating or kayaking and water-enhanced activities, such as wildlife viewing.
No impact—Changes in salinity would not result in changes to water-dependent or water-enhanced recreation opportunities in the southern Delta. Salinity levels are imperceptible to recreationists who use the southern Delta for water-dependent activities, such as boating or kayaking, and water-enhanced activities, such as wildlife viewing.

State Water Resources Control Board California Environmental Protection Agency
Executive Summary
Evaluation of San Joaquin River Flow and Southern Delta Water Quality Objectives and Implementation
ES-88 September 2016
ICF 00427.11
Impact No Project Alternative (LSJR/SDWQ Alternative 1) LSJR Alternative 2a LSJR Alternative 3 a LSJR Alternative 4 a SDWQ Alternative 2 SDWQ Alternative 3
Pedro Reservoir. However, because all boat ramps would remain operable at the 30% cumulative distribution elevation (e.g., dry years), and some boat ramps in New Don Pedro Reservoir are still operable at minimum reservoir elevations, there would be no physical deterioration nor reduction in the use of existing recreation facilities at this location.
(marinas and boat ramps), and all boat ramps would remain operable. There would be no reduction in use of the facilities at New Don Pedro Reservoir.
Therefore, given the significant increase in the modeled frequency of high seasonal average flows (greater than 2,500 cfs) on the Tuolumne and Stanislaus Rivers associated with LSJR Alternative 4, substantial physical deterioration of existing recreational facilities is expected.
REC-2: Substantially degrade the existing visual character or quality of the reservoirs
Significant— Under the No Project Alternative, reservoir elevations at New Don Pedro and Lake McClure would remain relatively constant and would not be substantially reduced compared to baseline. Therefore, substantial degradation of the visual character and quality of area surrounding these reservoirs would not occur. However, summer elevations at New Melones Reservoir would be reduced when compared to baseline, especially during years with lowest storage. At the 30% cumulative distribution level, the May–September seasonal average No Project Alternative elevation would be reduced by more than 50 feet, well above the 10-foot level identified as the criteria for significance. This reduction would substantially degrade the existing visual character or quality of the New Melones Reservoir.
Less than significant—Under certain conditions, reservoir elevations at Lake McClure and New Melones Reservoir could increase and could result in an improvement to the existing views. The decrease in reservoir elevation that could occur at New Don Pedro Reservoir would not result in a substantial degradation of existing visual character or quality.
Less than significant—Under certain conditions, reservoir elevations would increase at Lake McClure and New Melones Reservoir and could improve the existing views.
At New Don Pedro Reservoir, decreases in water surface elevation during some dry years could cause a substantial degradation of existing visual character or quality; however, views at this location are Class III, and changes to the character of the landscape can be moderate without compromising visual quality.
No impact— This alternative would not apply directly to the reservoirs, and the USBR Vernalis salinity requirement in the program of implementation for this alternatives is the same as under baseline conditions.
No impact—This alternative would not apply directly to the reservoirs, and the USBR Vernalis salinity requirement in the program of implementation for this alternatives is the same as under baseline conditions
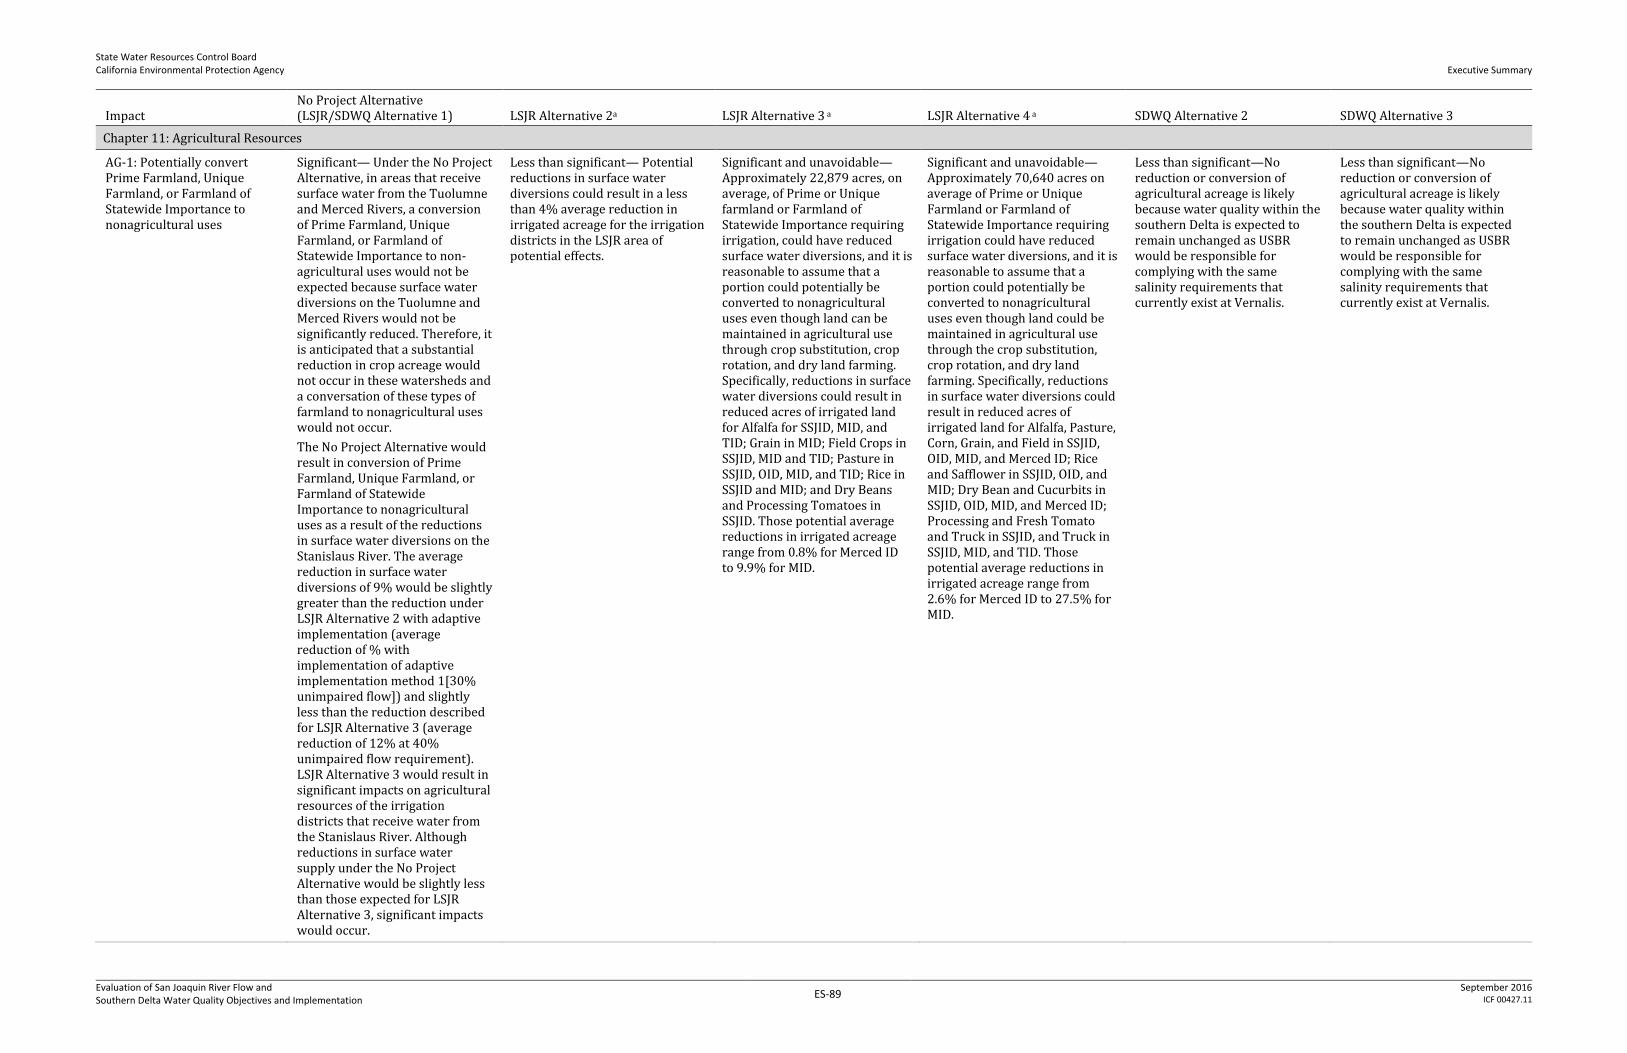
State Water Resources Control Board California Environmental Protection Agency
Executive Summary
Evaluation of San Joaquin River Flow and Southern Delta Water Quality Objectives and Implementation
ES-89 September 2016
ICF 00427.11
Impact No Project Alternative (LSJR/SDWQ Alternative 1) LSJR Alternative 2a LSJR Alternative 3 a LSJR Alternative 4 a SDWQ Alternative 2 SDWQ Alternative 3
Chapter 11: Agricultural Resources
AG-1: Potentially convert Prime Farmland, Unique Farmland, or Farmland of Statewide Importance to nonagricultural uses
Significant— Under the No Project Alternative, in areas that receive surface water from the Tuolumne and Merced Rivers, a conversion of Prime Farmland, Unique Farmland, or Farmland of Statewide Importance to non-agricultural uses would not be expected because surface water diversions on the Tuolumne and Merced Rivers would not be significantly reduced. Therefore, it is anticipated that a substantial reduction in crop acreage would not occur in these watersheds and a conversation of these types of farmland to nonagricultural uses would not occur.
The No Project Alternative would result in conversion of Prime Farmland, Unique Farmland, or Farmland of Statewide Importance to nonagricultural uses as a result of the reductions in surface water diversions on the Stanislaus River. The average reduction in surface water diversions of 9% would be slightly greater than the reduction under LSJR Alternative 2 with adaptive implementation (average reduction of % with implementation of adaptive implementation method 1[30% unimpaired flow]) and slightly less than the reduction described for LSJR Alternative 3 (average reduction of 12% at 40% unimpaired flow requirement). LSJR Alternative 3 would result in significant impacts on agricultural resources of the irrigation districts that receive water from the Stanislaus River. Although reductions in surface water supply under the No Project Alternative would be slightly less than those expected for LSJR Alternative 3, significant impacts would occur.
Less than significant— Potential reductions in surface water diversions could result in a less than 4% average reduction in irrigated acreage for the irrigation districts in the LSJR area of potential effects.
Significant and unavoidable—Approximately 22,879 acres, on average, of Prime or Unique farmland or Farmland of Statewide Importance requiring irrigation, could have reduced surface water diversions, and it is reasonable to assume that a portion could potentially be converted to nonagricultural uses even though land can be maintained in agricultural use through crop substitution, crop rotation, and dry land farming. Specifically, reductions in surface water diversions could result in reduced acres of irrigated land for Alfalfa for SSJID, MID, and TID; Grain in MID; Field Crops in SSJID, MID and TID; Pasture in SSJID, OID, MID, and TID; Rice in SSJID and MID; and Dry Beans and Processing Tomatoes in SSJID. Those potential average reductions in irrigated acreage range from 0.8% for Merced ID to 9.9% for MID.
Significant and unavoidable—Approximately 70,640 acres on average of Prime or Unique Farmland or Farmland of Statewide Importance requiring irrigation could have reduced surface water diversions, and it is reasonable to assume that a portion could potentially be converted to nonagricultural uses even though land could be maintained in agricultural use through the crop substitution, crop rotation, and dry land farming. Specifically, reductions in surface water diversions could result in reduced acres of irrigated land for Alfalfa, Pasture, Corn, Grain, and Field in SSJID, OID, MID, and Merced ID; Rice and Safflower in SSJID, OID, and MID; Dry Bean and Cucurbits in SSJID, OID, MID, and Merced ID; Processing and Fresh Tomato and Truck in SSJID, and Truck in SSJID, MID, and TID. Those potential average reductions in irrigated acreage range from 2.6% for Merced ID to 27.5% for MID.
Less than significant—No reduction or conversion of agricultural acreage is likely because water quality within the southern Delta is expected to remain unchanged as USBR would be responsible for complying with the same salinity requirements that currently exist at Vernalis.
Less than significant—No reduction or conversion of agricultural acreage is likely because water quality within the southern Delta is expected to remain unchanged as USBR would be responsible for complying with the same salinity requirements that currently exist at Vernalis.

State Water Resources Control Board California Environmental Protection Agency
Executive Summary
Evaluation of San Joaquin River Flow and Southern Delta Water Quality Objectives and Implementation
ES-90 September 2016
ICF 00427.11
Impact No Project Alternative (LSJR/SDWQ Alternative 1) LSJR Alternative 2a LSJR Alternative 3 a LSJR Alternative 4 a SDWQ Alternative 2 SDWQ Alternative 3
AG-2: Involve other changes in the existing environment which, due to their location or nature, could result in a conversion of farmland to nonagricultural use
Less than significant—Flows on the Stanislaus River would be increased, which may result in seepage; however, given the small amount of acreage for crops that could be affected, impacts would be less than significant. Similar to conditions under the LSJR alternatives, given the cost of feed input compared to other dairy inputs and the availability of the feed input, the value of dairy production in the LSJR area of potential effects, and the potential use of equitable distributions from local water suppliers, it is unlikely that dairies, as an agricultural use, would be converted to nonagricultural uses. Impacts would be less than significant.
Less than significant—Impacts on irrigated agriculture from a high water table resulting from increased river flows on the Stanislaus River are expected on less than 0.01% of irrigated acreage; therefore, crop production would not be substantially reduced.
Less than significant—Impacts on irrigated agriculture from a high water table resulting from increased river flows on the Stanislaus River are expected on less than 0.1% of irrigated acreage; therefore, crop production would not be substantially reduced. Given cost of feed input compared to other dairy inputs and the availability of the feed input, the value of dairy production in the LSJR area of potential effects, and the potential use of equitable distribution of local water suppliers, it is unlikely dairies, as an agricultural use, would be converted to nonagricultural uses.
Less than significant—Impacts on irrigated agriculture from a high water table resulting from increased river flows on the Stanislaus River are expected on less than 0.1% of irrigated acreage; therefore, crop production would not be substantially reduced. Given cost of feed input compared to other dairy inputs and the availability of the feed input, the value of dairy production in the LSJR area of potential effects, and the potential use of equitable distribution of local water suppliers, it is unlikely dairies, as an agricultural use, would be converted to nonagricultural uses.
Less than significant – Conversion of farmland to nonagricultural use is not expected because water quality within the southern Delta is expected to remain unchanged as USBR would be responsible for complying with the same salinity requirements that currently exist at Vernalis.
Less than significant – Conversion of farmland to nonagricultural use is not expected because water quality within the southern Delta is expected to remain unchanged as USBR would be responsible for complying with the same salinity requirements that currently exist at Vernalis.
AG-3: Conflict with existing zoning for agricultural use or a Williamson Act contract
Less than significant—The No Project Alternative would not conflict with existing zoning for agricultural use or Williamson Act contracts because the No Project Alternative would not change zoning. Lands that are under Williamson Act contracts must be maintained in the compatible uses specified in those contracts until non-renewed, canceled, or otherwise withdrawn from contract. Lands that experience a reduction in surface water supply could be dry farmed, rotated, or fallowed, all of which would be agricultural activities that are consistent with agricultural zoning and Williamson Act contracts.
Less than significant—This alternative would not conflict with existing zoning for agricultural use or Williamson Act contracts because it would not change zoning, and lands that are under Williamson Act contracts must be maintained in the compatible uses specified on those contracts until non-renewed, canceled, or otherwise withdrawn from contract. Lands that experience a reduction in surface water supply could be dryfarmed, rotated, or fallowed, all of which would be agricultural activities that are consistent with agricultural zoning and Williamson Act contracts.
Less than significant—This alternative would not conflict with existing zoning for agricultural use or Williamson Act contracts because it would not change zoning, and lands that are under Williamson Act contracts must be maintained in the compatible uses specified on those contracts until non-renewed, canceled, or otherwise withdrawn from contract. Lands that experience a reduction in surface water supply could be dryfarmed, rotated, or fallowed, all of which would be agricultural activities that are consistent with agricultural zoning and Williamson Act contracts.
Less than significant—This alternative would not conflict with existing zoning for agricultural use or Williamson Act contracts because it would not change zoning, and lands that are under Williamson Act contracts must be maintained in the compatible uses specified on those contracts until non-renewed, canceled, or otherwise withdrawn from contract. Lands that experience a reduction in surface water supply could be dryfarmed, rotated, or fallowed, all of which would be agricultural activities that are consistent with agricultural zoning and Williamson Act contracts.
Less than significant—This alternative would not conflict with existing zoning for agricultural use or Williamson Act contracts because it would not change zoning, and agricultural lands would continue to divert water from existing waterways and rely on suitable water quality to irrigate crops.
Less than significant—This alternative would not conflict with existing zoning for agricultural use or Williamson Act contracts because it would not change zoning, and agricultural lands would continue to divert water from existing waterways and rely on suitable water quality to irrigate crops.
AG-4: Conflict with any applicable land use plan, policy, or regulation related to agriculture of an agency with jurisdiction over a project (including, but not limited to the general plan, specific plan, local coastal program, or zoning ordinance) adopted for the purpose of avoiding or mitigating an environmental
Less than significant— The No Project Alternative would not conflict with applicable land use plans, policies, or regulations because while some agricultural land could be taken out of irrigated agricultural use as a result of the No Project Alternative, many of these lands could actually remain in agricultural use, even if they are
Less than significant— This alternative would not conflict with applicable land use plans, policies, or regulations because it is not proposing amendments to existing land use plans, policies, or regulations. While some agricultural land could be taken out of irrigated agricultural use as a result of this alternative, many of these lands could remain in
Less than significant— This alternative would not conflict with applicable land use plans, policies, or regulations because it is not proposing amendments to existing land use plans, policies, or regulations. While some agricultural land could be taken out of irrigated agricultural use as a result of this alternative, many of these lands could remain
Less than significant— This alternative would not conflict with applicable land use plans, policies, or regulations because it is not proposing amendments to existing land use plans, policies, or regulations. While some agricultural land could be taken out of irrigated agricultural use as a result of this alternative, many of these lands could remain
No impact— This alternative would not conflict with applicable land use plans, policies, or regulations because it would not change zoning, and agricultural lands would continue to divert water from existing waterways and rely on suitable water quality to irrigate crops.
No impact— This alternative would not conflict with applicable land use plans, policies, or regulations because it would not change zoning, and agricultural lands would continue to divert water from existing waterways and rely on suitable water quality to irrigate crops.
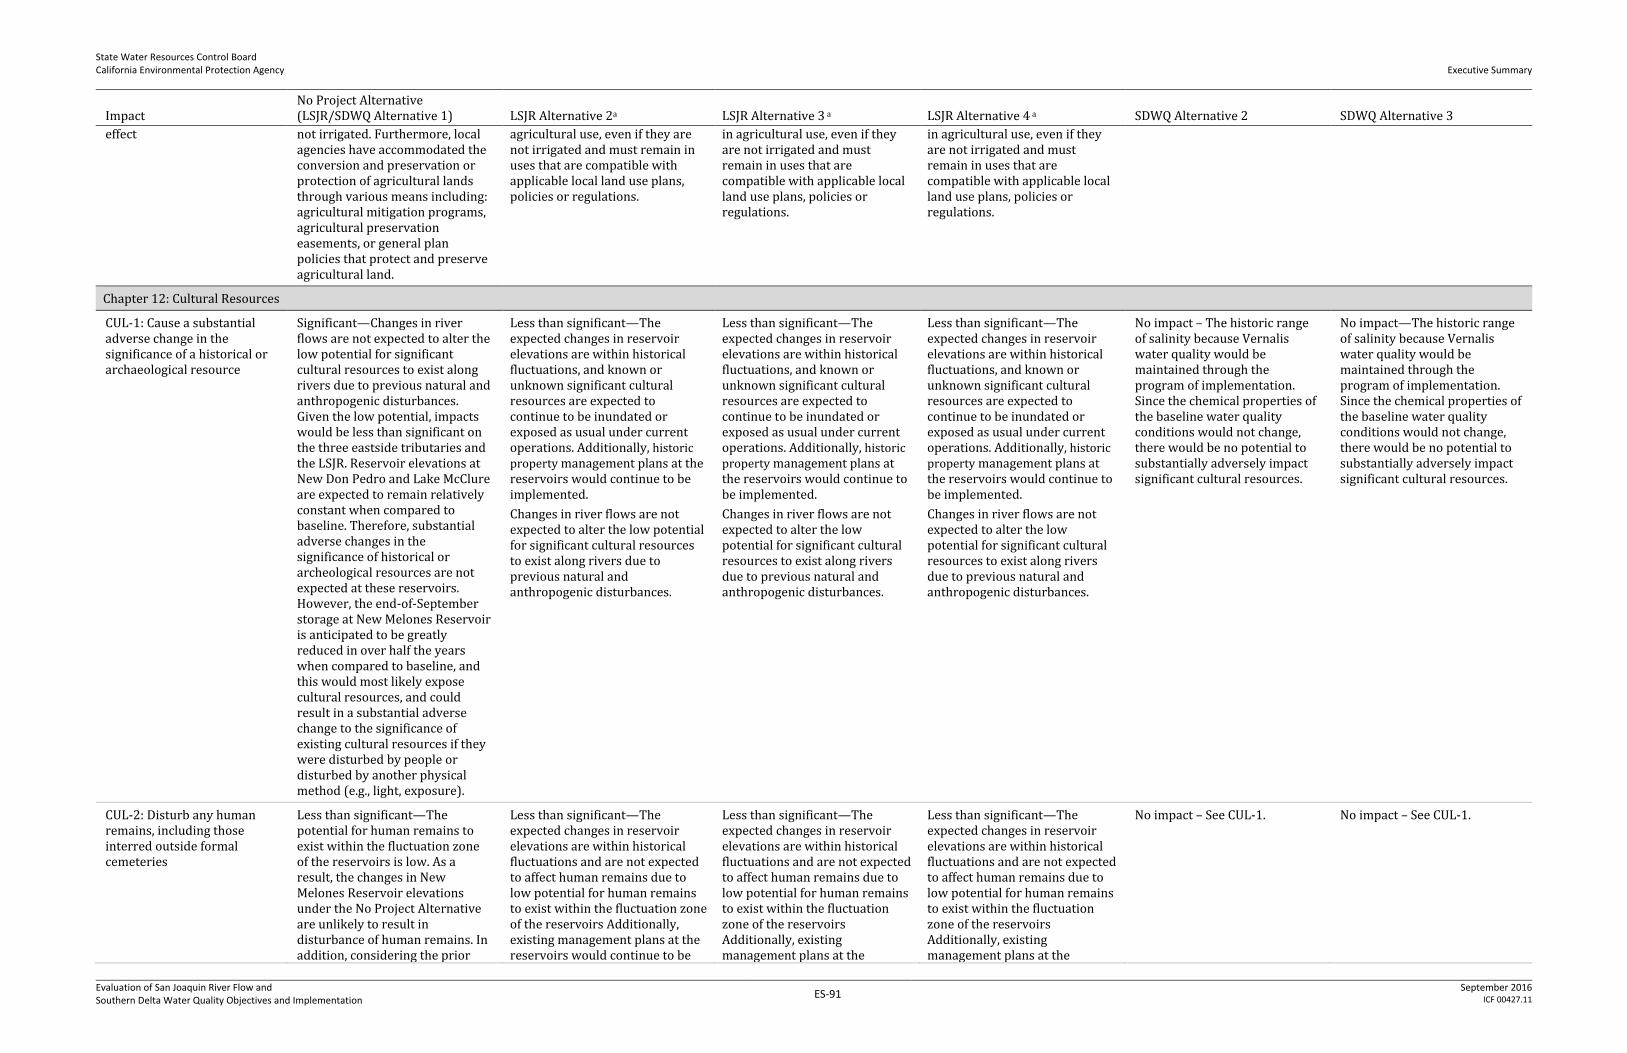
State Water Resources Control Board California Environmental Protection Agency
Executive Summary
Evaluation of San Joaquin River Flow and Southern Delta Water Quality Objectives and Implementation
ES-91 September 2016
ICF 00427.11
Impact No Project Alternative (LSJR/SDWQ Alternative 1) LSJR Alternative 2a LSJR Alternative 3 a LSJR Alternative 4 a SDWQ Alternative 2 SDWQ Alternative 3
effect not irrigated. Furthermore, local agencies have accommodated the conversion and preservation or protection of agricultural lands through various means including: agricultural mitigation programs, agricultural preservation easements, or general plan policies that protect and preserve agricultural land.
agricultural use, even if they are not irrigated and must remain in uses that are compatible with applicable local land use plans, policies or regulations.
in agricultural use, even if they are not irrigated and must remain in uses that are compatible with applicable local land use plans, policies or regulations.
in agricultural use, even if they are not irrigated and must remain in uses that are compatible with applicable local land use plans, policies or regulations.
Chapter 12: Cultural Resources
CUL-1: Cause a substantial adverse change in the significance of a historical or archaeological resource
Significant—Changes in river flows are not expected to alter the low potential for significant cultural resources to exist along rivers due to previous natural and anthropogenic disturbances. Given the low potential, impacts would be less than significant on the three eastside tributaries and the LSJR. Reservoir elevations at New Don Pedro and Lake McClure are expected to remain relatively constant when compared to baseline. Therefore, substantial adverse changes in the significance of historical or archeological resources are not expected at these reservoirs. However, the end-of-September storage at New Melones Reservoir is anticipated to be greatly reduced in over half the years when compared to baseline, and this would most likely expose cultural resources, and could result in a substantial adverse change to the significance of existing cultural resources if they were disturbed by people or disturbed by another physical method (e.g., light, exposure).
Less than significant—The expected changes in reservoir elevations are within historical fluctuations, and known or unknown significant cultural resources are expected to continue to be inundated or exposed as usual under current operations. Additionally, historic property management plans at the reservoirs would continue to be implemented.
Changes in river flows are not expected to alter the low potential for significant cultural resources to exist along rivers due to previous natural and anthropogenic disturbances.
No impact – The historic range of salinity because Vernalis water quality would be maintained through the program of implementation. Since the chemical properties of the baseline water quality conditions would not change, there would be no potential to substantially adversely impact significant cultural resources.
No impact—The historic range of salinity because Vernalis water quality would be maintained through the program of implementation. Since the chemical properties of the baseline water quality conditions would not change, there would be no potential to substantially adversely impact significant cultural resources.
CUL-2: Disturb any human remains, including those interred outside formal cemeteries
Less than significant—The potential for human remains to exist within the fluctuation zone of the reservoirs is low. As a result, the changes in New Melones Reservoir elevations under the No Project Alternative are unlikely to result in disturbance of human remains. In addition, considering the prior
Less than significant—The expected changes in reservoir elevations are within historical fluctuations and are not expected to affect human remains due to low potential for human remains to exist within the fluctuation zone of the reservoirs Additionally, existing management plans at the reservoirs would continue to be
Less than significant—The expected changes in reservoir elevations are within historical fluctuations and are not expected to affect human remains due to low potential for human remains to exist within the fluctuation zone of the reservoirs Additionally, existing management plans at the
Less than significant—The expected changes in reservoir elevations are within historical fluctuations and are not expected to affect human remains due to low potential for human remains to exist within the fluctuation zone of the reservoirs Additionally, existing management plans at the
No impact – See CUL-1. No impact – See CUL-1.
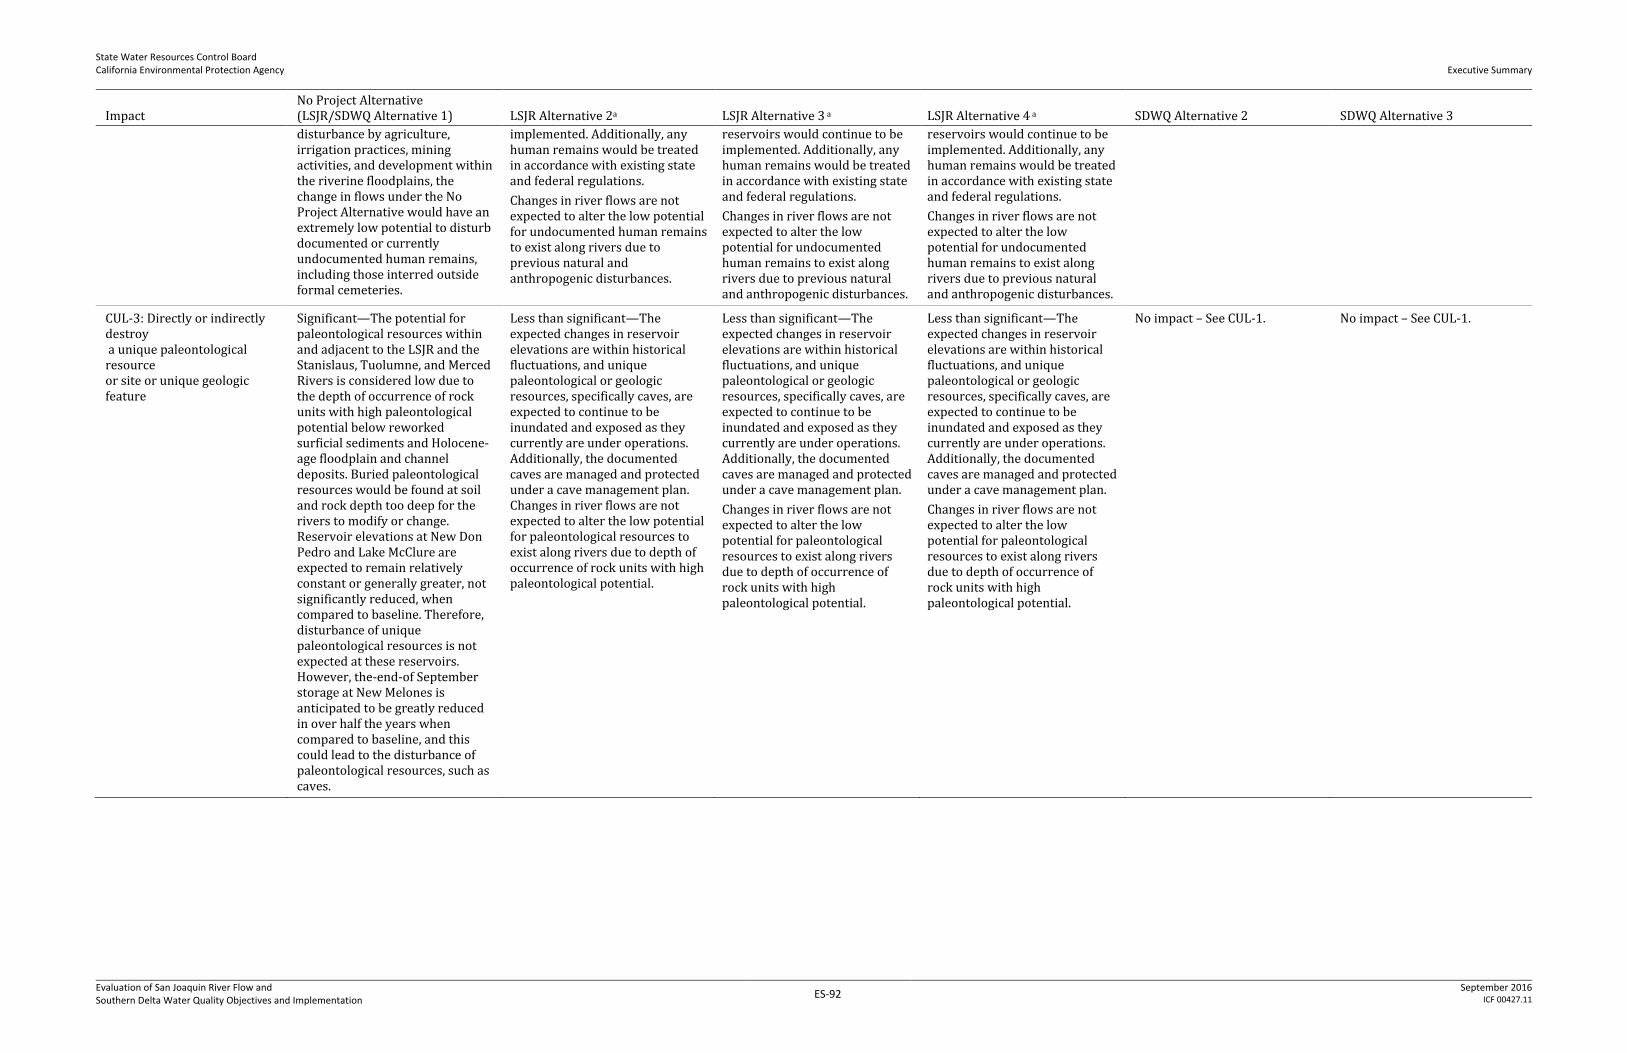
State Water Resources Control Board California Environmental Protection Agency
Executive Summary
Evaluation of San Joaquin River Flow and Southern Delta Water Quality Objectives and Implementation
ES-92 September 2016
ICF 00427.11
Impact No Project Alternative (LSJR/SDWQ Alternative 1) LSJR Alternative 2a LSJR Alternative 3 a LSJR Alternative 4 a SDWQ Alternative 2 SDWQ Alternative 3
disturbance by agriculture, irrigation practices, mining activities, and development within the riverine floodplains, the change in flows under the No Project Alternative would have an extremely low potential to disturb documented or currently undocumented human remains, including those interred outside formal cemeteries.
implemented. Additionally, any human remains would be treated in accordance with existing state and federal regulations.
Changes in river flows are not expected to alter the low potential for undocumented human remains to exist along rivers due to previous natural and anthropogenic disturbances.
reservoirs would continue to be implemented. Additionally, any human remains would be treated in accordance with existing state and federal regulations.
Changes in river flows are not expected to alter the low potential for undocumented human remains to exist along rivers due to previous natural and anthropogenic disturbances.
CUL-3: Directly or indirectly destroy a unique paleontological resource or site or unique geologic feature
Significant—The potential for paleontological resources within and adjacent to the LSJR and the Stanislaus, Tuolumne, and Merced Rivers is considered low due to the depth of occurrence of rock units with high paleontological potential below reworked surficial sediments and Holocene-age floodplain and channel deposits. Buried paleontological resources would be found at soil and rock depth too deep for the rivers to modify or change. Reservoir elevations at New Don Pedro and Lake McClure are expected to remain relatively constant or generally greater, not significantly reduced, when compared to baseline. Therefore, disturbance of unique paleontological resources is not expected at these reservoirs. However, the-end-of September storage at New Melones is anticipated to be greatly reduced in over half the years when compared to baseline, and this could lead to the disturbance of paleontological resources, such as caves.
Less than significant—The expected changes in reservoir elevations are within historical fluctuations, and unique paleontological or geologic resources, specifically caves, are expected to continue to be inundated and exposed as they currently are under operations. Additionally, the documented caves are managed and protected under a cave management plan. Changes in river flows are not expected to alter the low potential for paleontological resources to exist along rivers due to depth of occurrence of rock units with high paleontological potential.
Less than significant—The expected changes in reservoir elevations are within historical fluctuations, and unique paleontological or geologic resources, specifically caves, are expected to continue to be inundated and exposed as they currently are under operations. Additionally, the documented caves are managed and protected under a cave management plan.
Changes in river flows are not expected to alter the low potential for paleontological resources to exist along rivers due to depth of occurrence of rock units with high paleontological potential.
No impact – See CUL-1. No impact – See CUL-1.
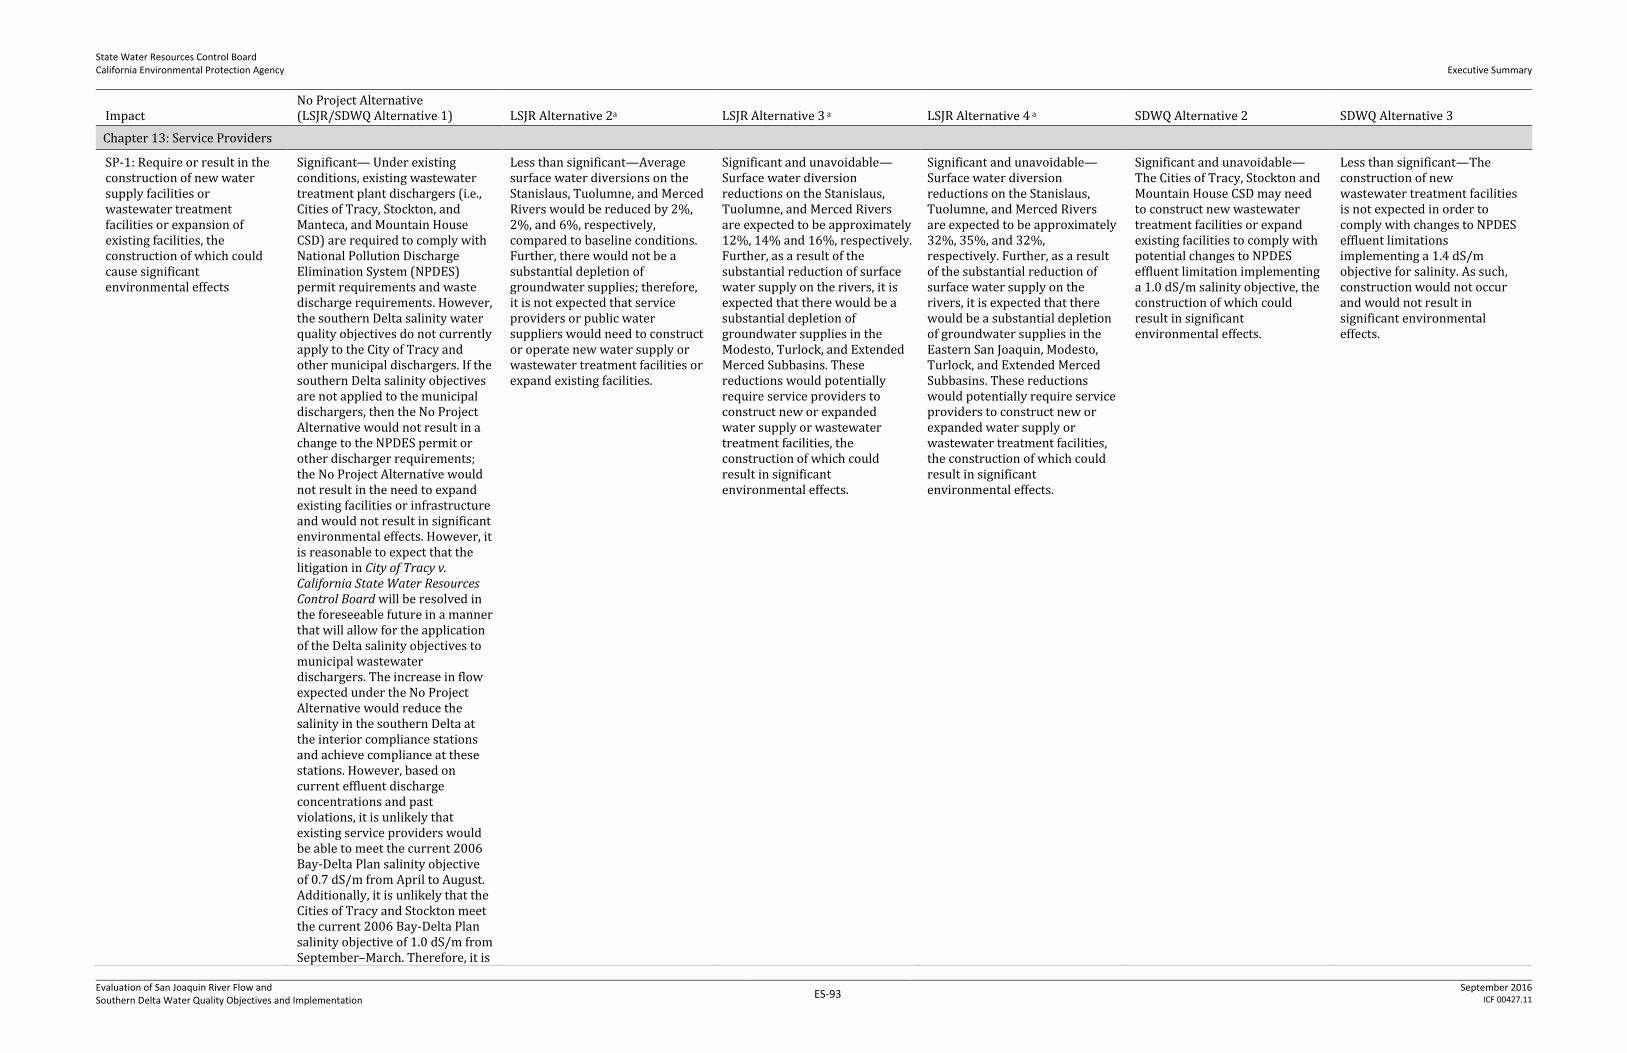
State Water Resources Control Board California Environmental Protection Agency
Executive Summary
Evaluation of San Joaquin River Flow and Southern Delta Water Quality Objectives and Implementation
ES-93 September 2016
ICF 00427.11
Impact No Project Alternative (LSJR/SDWQ Alternative 1) LSJR Alternative 2a LSJR Alternative 3 a LSJR Alternative 4 a SDWQ Alternative 2 SDWQ Alternative 3
Chapter 13: Service Providers
SP-1: Require or result in the construction of new water supply facilities or wastewater treatment facilities or expansion of existing facilities, the construction of which could cause significant environmental effects
Significant— Under existing conditions, existing wastewater treatment plant dischargers (i.e., Cities of Tracy, Stockton, and Manteca, and Mountain House CSD) are required to comply with National Pollution Discharge Elimination System (NPDES) permit requirements and waste discharge requirements. However, the southern Delta salinity water quality objectives do not currently apply to the City of Tracy and other municipal dischargers. If the southern Delta salinity objectives are not applied to the municipal dischargers, then the No Project Alternative would not result in a change to the NPDES permit or other discharger requirements; the No Project Alternative would not result in the need to expand existing facilities or infrastructure and would not result in significant environmental effects. However, it is reasonable to expect that the litigation in City of Tracy v. California State Water Resources Control Board will be resolved in the foreseeable future in a manner that will allow for the application of the Delta salinity objectives to municipal wastewater dischargers. The increase in flow expected under the No Project Alternative would reduce the salinity in the southern Delta at the interior compliance stations and achieve compliance at these stations. However, based on current effluent discharge concentrations and past violations, it is unlikely that existing service providers would be able to meet the current 2006 Bay-Delta Plan salinity objective of 0.7 dS/m from April to August. Additionally, it is unlikely that the Cities of Tracy and Stockton meet the current 2006 Bay-Delta Plan salinity objective of 1.0 dS/m from September–March. Therefore, it is
Less than significant—Average surface water diversions on the Stanislaus, Tuolumne, and Merced Rivers would be reduced by 2%, 2%, and 6%, respectively, compared to baseline conditions. Further, there would not be a substantial depletion of groundwater supplies; therefore, it is not expected that service providers or public water suppliers would need to construct or operate new water supply or wastewater treatment facilities or expand existing facilities.
Significant and unavoidable—Surface water diversion reductions on the Stanislaus, Tuolumne, and Merced Rivers are expected to be approximately 12%, 14% and 16%, respectively. Further, as a result of the substantial reduction of surface water supply on the rivers, it is expected that there would be a substantial depletion of groundwater supplies in the Modesto, Turlock, and Extended Merced Subbasins. These reductions would potentially require service providers to construct new or expanded water supply or wastewater treatment facilities, the construction of which could result in significant environmental effects.
Significant and unavoidable—Surface water diversion reductions on the Stanislaus, Tuolumne, and Merced Rivers are expected to be approximately 32%, 35%, and 32%, respectively. Further, as a result of the substantial reduction of surface water supply on the rivers, it is expected that there would be a substantial depletion of groundwater supplies in the Eastern San Joaquin, Modesto, Turlock, and Extended Merced Subbasins. These reductions would potentially require service providers to construct new or expanded water supply or wastewater treatment facilities, the construction of which could result in significant environmental effects.
Significant and unavoidable—The Cities of Tracy, Stockton and Mountain House CSD may need to construct new wastewater treatment facilities or expand existing facilities to comply with potential changes to NPDES effluent limitation implementing a 1.0 dS/m salinity objective, the construction of which could result in significant environmental effects.
Less than significant—The construction of new wastewater treatment facilities is not expected in order to comply with changes to NPDES effluent limitations implementing a 1.4 dS/m objective for salinity. As such, construction would not occur and would not result in significant environmental effects.
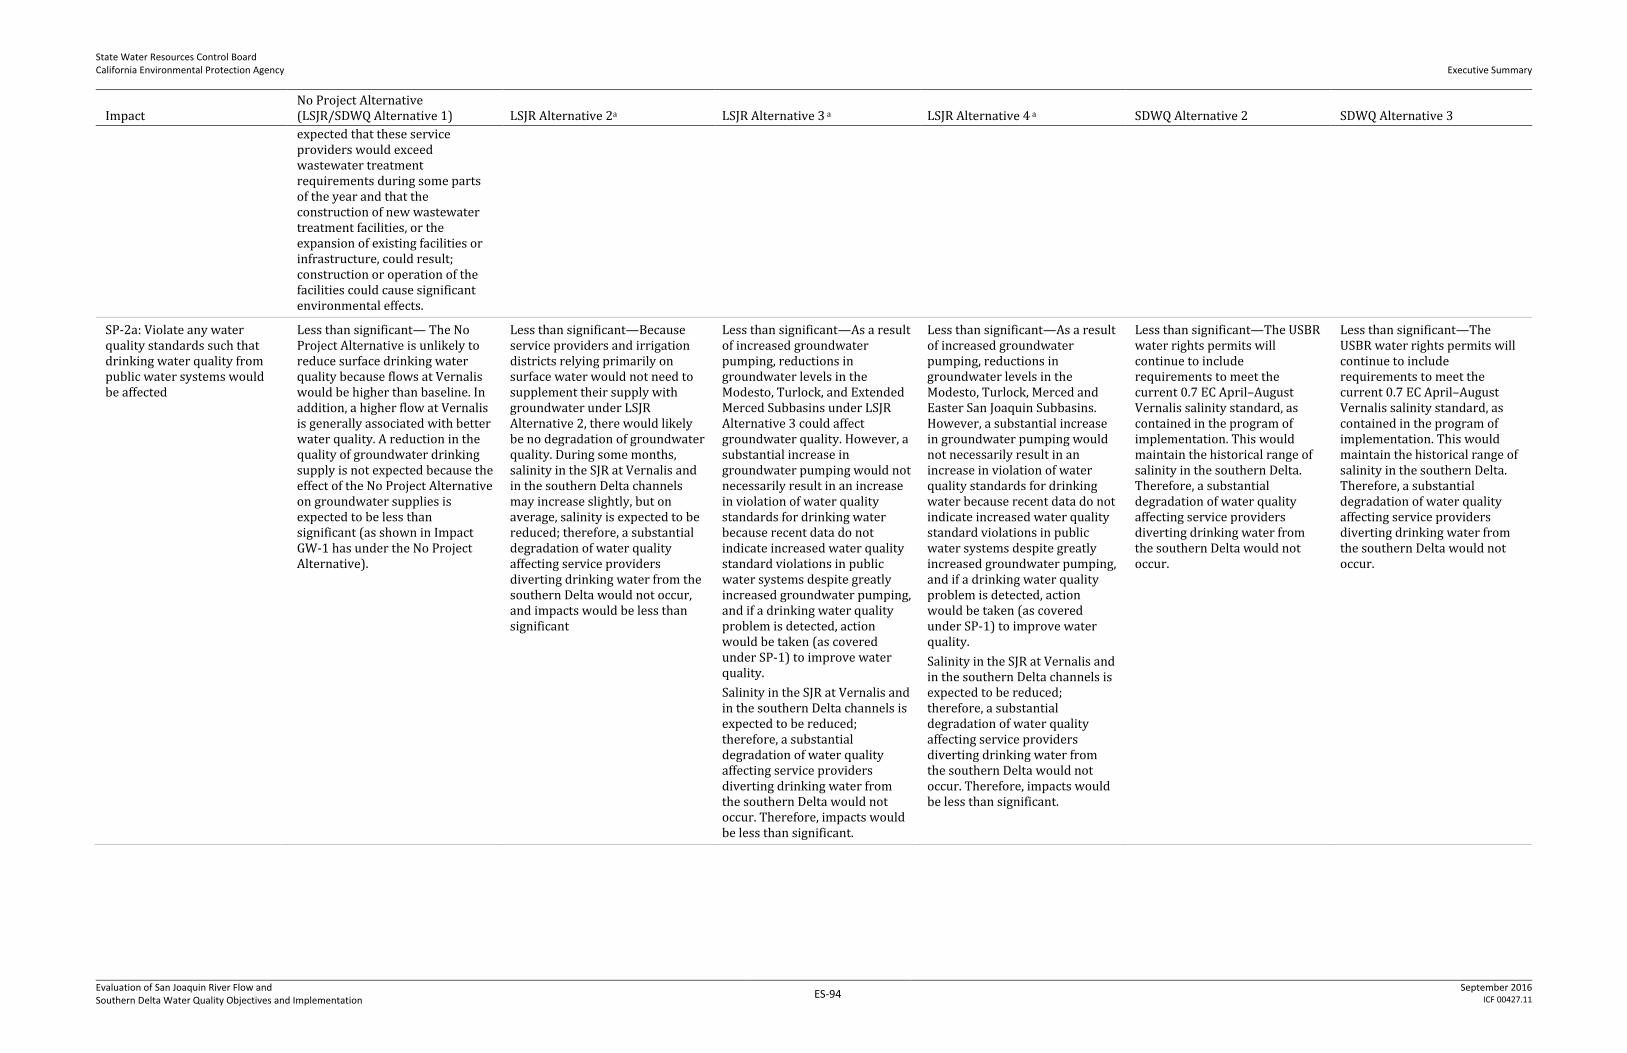
State Water Resources Control Board California Environmental Protection Agency
Executive Summary
Evaluation of San Joaquin River Flow and Southern Delta Water Quality Objectives and Implementation
ES-94 September 2016
ICF 00427.11
Impact No Project Alternative (LSJR/SDWQ Alternative 1) LSJR Alternative 2a LSJR Alternative 3 a LSJR Alternative 4 a SDWQ Alternative 2 SDWQ Alternative 3
expected that these service providers would exceed wastewater treatment requirements during some parts of the year and that the construction of new wastewater treatment facilities, or the expansion of existing facilities or infrastructure, could result; construction or operation of the facilities could cause significant environmental effects.
SP-2a: Violate any water quality standards such that drinking water quality from public water systems would be affected
Less than significant— The No Project Alternative is unlikely to reduce surface drinking water quality because flows at Vernalis would be higher than baseline. In addition, a higher flow at Vernalis is generally associated with better water quality. A reduction in the quality of groundwater drinking supply is not expected because the effect of the No Project Alternative on groundwater supplies is expected to be less than significant (as shown in Impact GW-1 has under the No Project Alternative).
Less than significant—Because service providers and irrigation districts relying primarily on surface water would not need to supplement their supply with groundwater under LSJR Alternative 2, there would likely be no degradation of groundwater quality. During some months, salinity in the SJR at Vernalis and in the southern Delta channels may increase slightly, but on average, salinity is expected to be reduced; therefore, a substantial degradation of water quality affecting service providers diverting drinking water from the southern Delta would not occur, and impacts would be less than significant
Less than significant—As a result of increased groundwater pumping, reductions in groundwater levels in the Modesto, Turlock, and Extended Merced Subbasins under LSJR Alternative 3 could affect groundwater quality. However, a substantial increase in groundwater pumping would not necessarily result in an increase in violation of water quality standards for drinking water because recent data do not indicate increased water quality standard violations in public water systems despite greatly increased groundwater pumping, and if a drinking water quality problem is detected, action would be taken (as covered under SP-1) to improve water quality.
Salinity in the SJR at Vernalis and in the southern Delta channels is expected to be reduced; therefore, a substantial degradation of water quality affecting service providers diverting drinking water from the southern Delta would not occur. Therefore, impacts would be less than significant.
Less than significant—As a result of increased groundwater pumping, reductions in groundwater levels in the Modesto, Turlock, Merced and Easter San Joaquin Subbasins. However, a substantial increase in groundwater pumping would not necessarily result in an increase in violation of water quality standards for drinking water because recent data do not indicate increased water quality standard violations in public water systems despite greatly increased groundwater pumping, and if a drinking water quality problem is detected, action would be taken (as covered under SP-1) to improve water quality.
Salinity in the SJR at Vernalis and in the southern Delta channels is expected to be reduced; therefore, a substantial degradation of water quality affecting service providers diverting drinking water from the southern Delta would not occur. Therefore, impacts would be less than significant.
Less than significant—The USBR water rights permits will continue to include requirements to meet the current 0.7 EC April–August Vernalis salinity standard, as contained in the program of implementation. This would maintain the historical range of salinity in the southern Delta. Therefore, a substantial degradation of water quality affecting service providers diverting drinking water from the southern Delta would not occur.
Less than significant—The USBR water rights permits will continue to include requirements to meet the current 0.7 EC April–August Vernalis salinity standard, as contained in the program of implementation. This would maintain the historical range of salinity in the southern Delta. Therefore, a substantial degradation of water quality affecting service providers diverting drinking water from the southern Delta would not occur.
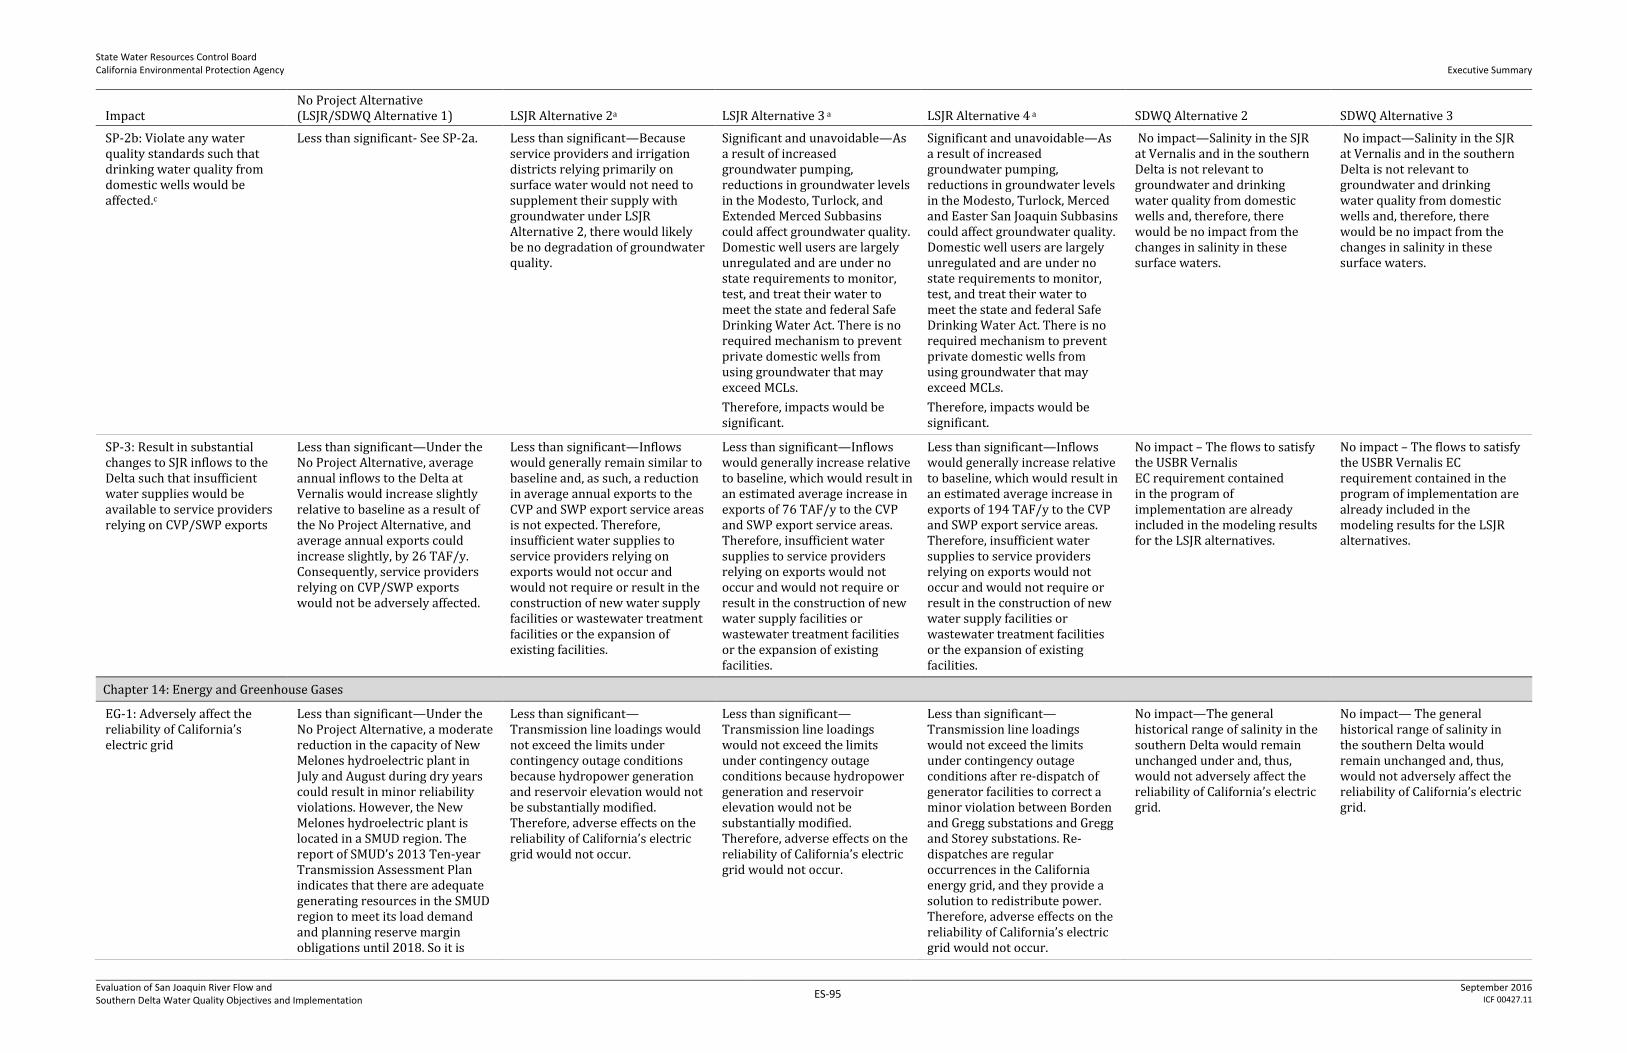
State Water Resources Control Board California Environmental Protection Agency
Executive Summary
Evaluation of San Joaquin River Flow and Southern Delta Water Quality Objectives and Implementation
ES-95 September 2016
ICF 00427.11
Impact No Project Alternative (LSJR/SDWQ Alternative 1) LSJR Alternative 2a LSJR Alternative 3 a LSJR Alternative 4 a SDWQ Alternative 2 SDWQ Alternative 3
SP-2b: Violate any water quality standards such that drinking water quality from domestic wells would be affected.c
Less than significant- See SP-2a. Less than significant—Because service providers and irrigation districts relying primarily on surface water would not need to supplement their supply with groundwater under LSJR Alternative 2, there would likely be no degradation of groundwater quality.
Significant and unavoidable—As a result of increased groundwater pumping, reductions in groundwater levels in the Modesto, Turlock, and Extended Merced Subbasins could affect groundwater quality. Domestic well users are largely unregulated and are under no state requirements to monitor, test, and treat their water to meet the state and federal Safe Drinking Water Act. There is no required mechanism to prevent private domestic wells from using groundwater that may exceed MCLs.
Therefore, impacts would be significant.
Significant and unavoidable—As a result of increased groundwater pumping, reductions in groundwater levels in the Modesto, Turlock, Merced and Easter San Joaquin Subbasins could affect groundwater quality. Domestic well users are largely unregulated and are under no state requirements to monitor, test, and treat their water to meet the state and federal Safe Drinking Water Act. There is no required mechanism to prevent private domestic wells from using groundwater that may exceed MCLs.
Therefore, impacts would be significant.
No impact—Salinity in the SJR at Vernalis and in the southern Delta is not relevant to groundwater and drinking water quality from domestic wells and, therefore, there would be no impact from the changes in salinity in these surface waters.
No impact—Salinity in the SJR at Vernalis and in the southern Delta is not relevant to groundwater and drinking water quality from domestic wells and, therefore, there would be no impact from the changes in salinity in these surface waters.
SP-3: Result in substantial changes to SJR inflows to the Delta such that insufficient water supplies would be available to service providers relying on CVP/SWP exports
Less than significant—Under the No Project Alternative, average annual inflows to the Delta at Vernalis would increase slightly relative to baseline as a result of the No Project Alternative, and average annual exports could increase slightly, by 26 TAF/y. Consequently, service providers relying on CVP/SWP exports would not be adversely affected.
Less than significant—Inflows would generally remain similar to baseline and, as such, a reduction in average annual exports to the CVP and SWP export service areas is not expected. Therefore, insufficient water supplies to service providers relying on exports would not occur and would not require or result in the construction of new water supply facilities or wastewater treatment facilities or the expansion of existing facilities.
Less than significant—Inflows would generally increase relative to baseline, which would result in an estimated average increase in exports of 76 TAF/y to the CVP and SWP export service areas. Therefore, insufficient water supplies to service providers relying on exports would not occur and would not require or result in the construction of new water supply facilities or wastewater treatment facilities or the expansion of existing facilities.
Less than significant—Inflows would generally increase relative to baseline, which would result in an estimated average increase in exports of 194 TAF/y to the CVP and SWP export service areas. Therefore, insufficient water supplies to service providers relying on exports would not occur and would not require or result in the construction of new water supply facilities or wastewater treatment facilities or the expansion of existing facilities.
No impact – The flows to satisfy the USBR Vernalis EC requirement contained in the program of implementation are already included in the modeling results for the LSJR alternatives.
No impact – The flows to satisfy the USBR Vernalis EC requirement contained in the program of implementation are already included in the modeling results for the LSJR alternatives.
Chapter 14: Energy and Greenhouse Gases
EG-1: Adversely affect the reliability of California’s electric grid
Less than significant—Under the No Project Alternative, a moderate reduction in the capacity of New Melones hydroelectric plant in July and August during dry years could result in minor reliability violations. However, the New Melones hydroelectric plant is located in a SMUD region. The report of SMUD’s 2013 Ten-year Transmission Assessment Plan indicates that there are adequate generating resources in the SMUD region to meet its load demand and planning reserve margin obligations until 2018. So it is
Less than significant—Transmission line loadings would not exceed the limits under contingency outage conditions because hydropower generation and reservoir elevation would not be substantially modified. Therefore, adverse effects on the reliability of California’s electric grid would not occur.
Less than significant—Transmission line loadings would not exceed the limits under contingency outage conditions because hydropower generation and reservoir elevation would not be substantially modified. Therefore, adverse effects on the reliability of California’s electric grid would not occur.
Less than significant—Transmission line loadings would not exceed the limits under contingency outage conditions after re-dispatch of generator facilities to correct a minor violation between Borden and Gregg substations and Gregg and Storey substations. Re-dispatches are regular occurrences in the California energy grid, and they provide a solution to redistribute power. Therefore, adverse effects on the reliability of California’s electric grid would not occur.
No impact—The general historical range of salinity in the southern Delta would remain unchanged under and, thus, would not adversely affect the reliability of California’s electric grid.
No impact— The general historical range of salinity in the southern Delta would remain unchanged and, thus, would not adversely affect the reliability of California’s electric grid.
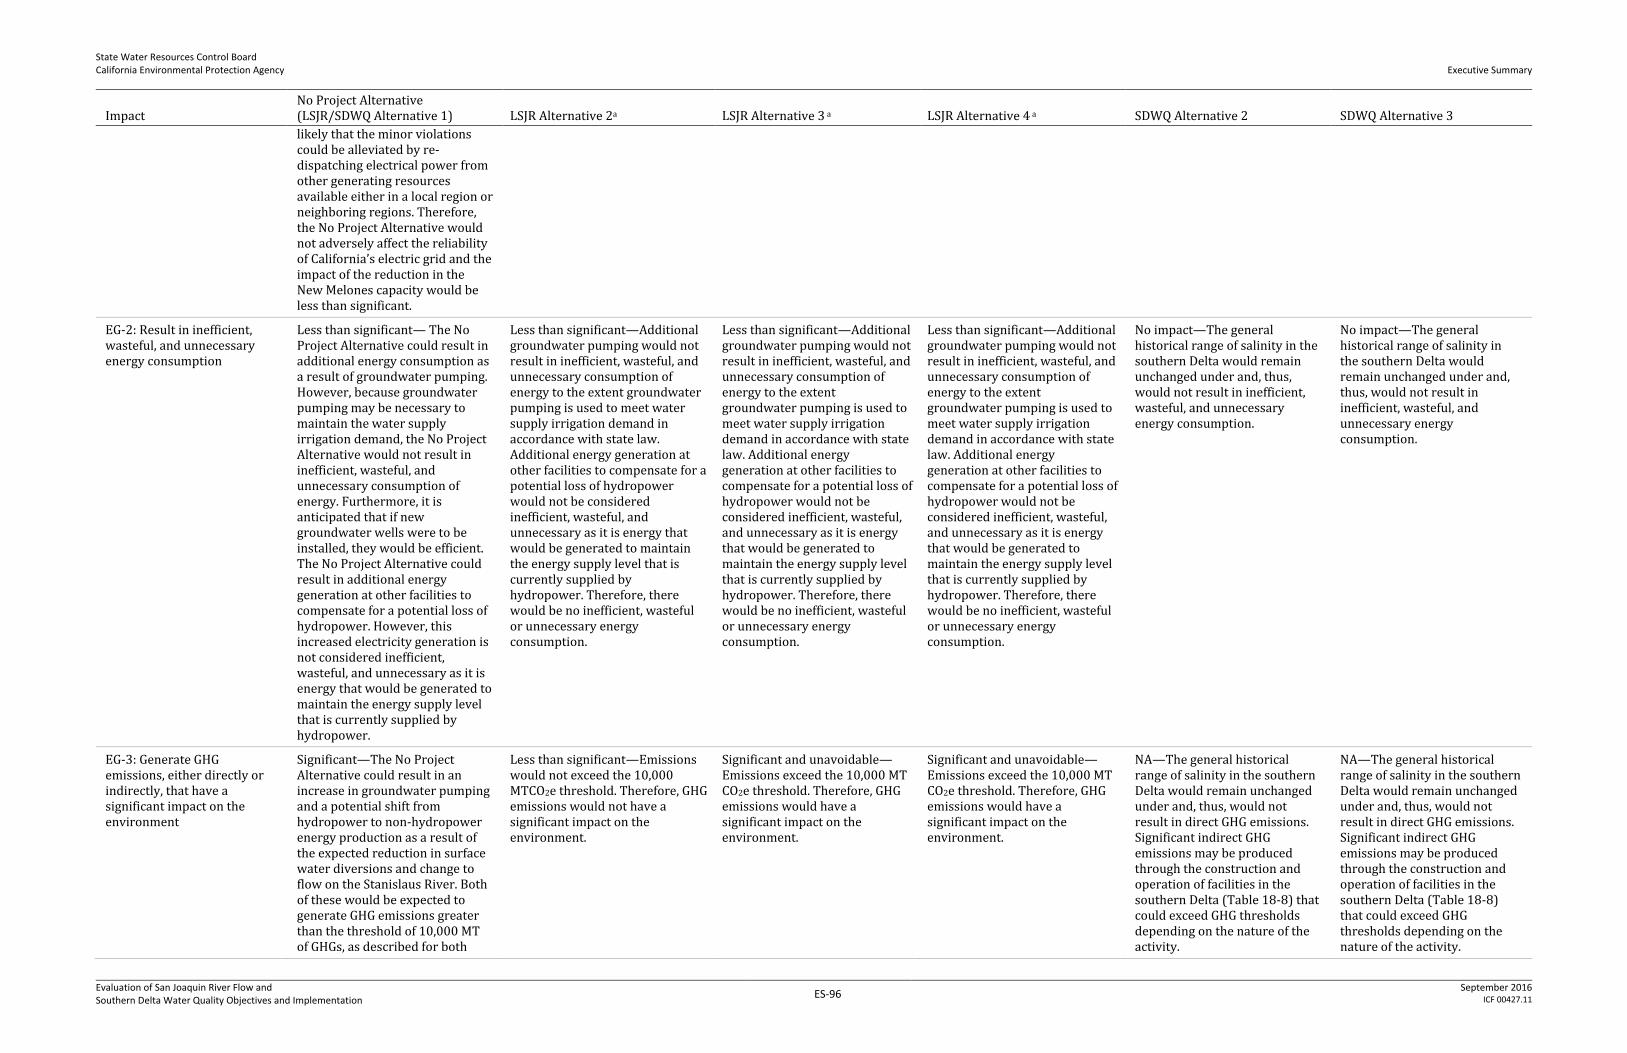
State Water Resources Control Board California Environmental Protection Agency
Executive Summary
Evaluation of San Joaquin River Flow and Southern Delta Water Quality Objectives and Implementation
ES-96 September 2016
ICF 00427.11
Impact No Project Alternative (LSJR/SDWQ Alternative 1) LSJR Alternative 2a LSJR Alternative 3 a LSJR Alternative 4 a SDWQ Alternative 2 SDWQ Alternative 3
likely that the minor violations could be alleviated by re-dispatching electrical power from other generating resources available either in a local region or neighboring regions. Therefore, the No Project Alternative would not adversely affect the reliability of California’s electric grid and the impact of the reduction in the New Melones capacity would be less than significant.
EG-2: Result in inefficient, wasteful, and unnecessary energy consumption
Less than significant— The No Project Alternative could result in additional energy consumption as a result of groundwater pumping. However, because groundwater pumping may be necessary to maintain the water supply irrigation demand, the No Project Alternative would not result in inefficient, wasteful, and unnecessary consumption of energy. Furthermore, it is anticipated that if new groundwater wells were to be installed, they would be efficient. The No Project Alternative could result in additional energy generation at other facilities to compensate for a potential loss of hydropower. However, this increased electricity generation is not considered inefficient, wasteful, and unnecessary as it is energy that would be generated to maintain the energy supply level that is currently supplied by hydropower.
Less than significant—Additional groundwater pumping would not result in inefficient, wasteful, and unnecessary consumption of energy to the extent groundwater pumping is used to meet water supply irrigation demand in accordance with state law. Additional energy generation at other facilities to compensate for a potential loss of hydropower would not be considered inefficient, wasteful, and unnecessary as it is energy that would be generated to maintain the energy supply level that is currently supplied by hydropower. Therefore, there would be no inefficient, wasteful or unnecessary energy consumption.
Less than significant—Additional groundwater pumping would not result in inefficient, wasteful, and unnecessary consumption of energy to the extent groundwater pumping is used to meet water supply irrigation demand in accordance with state law. Additional energy generation at other facilities to compensate for a potential loss of hydropower would not be considered inefficient, wasteful, and unnecessary as it is energy that would be generated to maintain the energy supply level that is currently supplied by hydropower. Therefore, there would be no inefficient, wasteful or unnecessary energy consumption.
Less than significant—Additional groundwater pumping would not result in inefficient, wasteful, and unnecessary consumption of energy to the extent groundwater pumping is used to meet water supply irrigation demand in accordance with state law. Additional energy generation at other facilities to compensate for a potential loss of hydropower would not be considered inefficient, wasteful, and unnecessary as it is energy that would be generated to maintain the energy supply level that is currently supplied by hydropower. Therefore, there would be no inefficient, wasteful or unnecessary energy consumption.
No impact—The general historical range of salinity in the southern Delta would remain unchanged under and, thus, would not result in inefficient, wasteful, and unnecessary energy consumption.
No impact—The general historical range of salinity in the southern Delta would remain unchanged under and, thus, would not result in inefficient, wasteful, and unnecessary energy consumption.
EG-3: Generate GHG emissions, either directly or indirectly, that have a significant impact on the environment
Significant—The No Project Alternative could result in an increase in groundwater pumping and a potential shift from hydropower to non-hydropower energy production as a result of the expected reduction in surface water diversions and change to flow on the Stanislaus River. Both of these would be expected to generate GHG emissions greater than the threshold of 10,000 MT of GHGs, as described for both
Less than significant—Emissions would not exceed the 10,000 MTCO2e threshold. Therefore, GHG emissions would not have a significant impact on the environment.
Significant and unavoidable—Emissions exceed the 10,000 MT CO2e threshold. Therefore, GHG emissions would have a significant impact on the environment.
Significant and unavoidable—Emissions exceed the 10,000 MT CO2e threshold. Therefore, GHG emissions would have a significant impact on the environment.
NA—The general historical range of salinity in the southern Delta would remain unchanged under and, thus, would not result in direct GHG emissions. Significant indirect GHG emissions may be produced through the construction and operation of facilities in the southern Delta (Table 18-8) that could exceed GHG thresholds depending on the nature of the activity.
NA—The general historical range of salinity in the southern Delta would remain unchanged under and, thus, would not result in direct GHG emissions. Significant indirect GHG emissions may be produced through the construction and operation of facilities in the southern Delta (Table 18-8) that could exceed GHG thresholds depending on the nature of the activity.

State Water Resources Control Board California Environmental Protection Agency
Executive Summary
Evaluation of San Joaquin River Flow and Southern Delta Water Quality Objectives and Implementation
ES-97 September 2016
ICF 00427.11
Impact No Project Alternative (LSJR/SDWQ Alternative 1) LSJR Alternative 2a LSJR Alternative 3 a LSJR Alternative 4 a SDWQ Alternative 2 SDWQ Alternative 3
LSJR Alternative 3 and 4.
EG-4: Conflict with an applicable plan, policy, or regulation adopted for the purposes of reducing the GHG emissions
Significant—Since the No Project Alternative would exceed the 10,000 MT GHG threshold, it would conflict with existing applicable plans, policies, or regulations adopted for the purposes of reducing GHG emissions, such as AB32, the California Global Warming Solutions Act.
Less than significant—Since GHG emissions would not exceed the 10,000 MT CO2e threshold, there would be no conflict with applicable plans, policies or regulations adopted for the purpose of reducing GHGs.
Significant and unavoidable— –Since GHG emissions would exceed the 10,000 MT CO2e threshold, there would be a conflict with applicable plans, policies or regulations adopted for the purpose of reducing GHGs.
Significant and unavoidable—Since GHG emissions would exceed the 10,000 MT CO2e threshold, there would be a conflict with applicable plans, policies or regulations adopted for the purpose of reducing GHGs.
No impact – The general historical range of salinity in the southern Delta would remain unchanged and, thus, would not result in GHG emissions or conflict with an applicable plan, policy or regulation adopted for the purpose of reducing GHG emissions.
No impact – The general historical range of salinity in the southern Delta would remain unchanged and, thus, would not result in GHG emissions or conflict with an applicable plan, policy or regulation adopted for the purpose of reducing GHG emissions.
EG-5: Effect of global climate change on the LSJR and SDWQ alternatives
Less than significant—The State Water Board is required to prepare WQCPs. The WCQPs are regularly reviewed to update water quality standards. As a result, the planning process continually accounts for changing conditions related to water quality and water planning, such as climate change. Therefore, the effect of global climate change on the No Project Alternative would be less than significant.
Less than significant—Climate change would not significantly affect LSJR Alternative 2 because adaptive implementation would allow agencies to respond to changing circumstances with respect to flow and water quality that might arise due to climate change. Furthermore, the required review and update of WQCPs, accounted for in the program of implementation, continually accounts for changing conditions related to water quality and water planning such as climate change.
Less than significant—Climate change would not significantly affect LSJR Alternative 3 because adaptive implementation would allow agencies to respond to changing circumstances with respect to flow and water quality that might arise due to climate change. Furthermore, the required review and update of WQCPs, accounted for in the program of implementation, continually accounts for changing conditions related to water quality and water planning such as climate change.
Less than significant—Climate change would not significantly affect LSJR Alternative 4 because adaptive implementation would allow agencies to respond to changing circumstances with respect to flow and water quality that might arise due to climate change. Furthermore, the required review and update of WQCPs, accounted for in the program of implementation, continually accounts for changing conditions related to water quality and water planning such as climate change.
Less than significant—Climate change would not significantly affect SDWQ Alternative 2 because the required review and update of WQCPs, accounted for in the program of implementation, continually accounts for changing conditions related to water quality and water planning, such as climate change.
Less than significant – Climate change would not significantly affect SDWQ Alternative 3 because the required review and update of WQCPs, accounted for in the program of implementation, continually accounts for changing conditions related to water quality and water planning, such as climate change.
NA = not applicable
EC = electrical conductivity (salinity)/
cfs = cubic feet per second
dS/m = deciSiemens per meter
CDFW = California Department of Fish and Wildlife
USFWS = U.S. Fish and Wildlife Service
NPDES = National Pollution Discharge Elimination System
USACE = U.S. Army Corps of Engineers
USBR = United States Bureau of Reclamation
SSJID = South San Joaquin Irrigation District
MID = Modesto Irrigation District
TID = Turlock Irrigation District
OID = Oakdale Irrigation District
Merced ID = Merced Irrigation District
CVP = Central Valley Project
SWP = State Water Project
GHG = greenhouse gas
CO2e = carbon dioxide equivalent
MT = megatons
AB32 = Assembly Bill 32, California Global Warming Solutions Act
WQCP = Water Quality Control Plans a Impact determinations are without adaptive implementation included. For a summary of what
determinations changed with and without adaptive implementation, refer to Table 18-5. b As described in Chapter 9, Groundwater Resources, the Merced Subbasin was extended for the
analysis to include a part of the Chowchilla Subbasin. c X2 is the location of the 2 parts per thousand salinity contour (isohaline), 1 meter off the
bottom of the estuary measured in kilometers upstream from the Golden Gate Bridge. The
abundance of several estuarine species has been correlated with X2. In the 2006 Bay-Delta Plan,
a salinity value--or electrical conductivity (EC) value--of 2.64 millimhos/centimeter
(mmhos/cm) is used to represent the X2 location. Note, in this SED, EC is generally expressed in
deciSiemens per meter (dS/m). The conversion is 1 mmhos/cm = 1 dS/cm.
State Water Resources Control Board California Environmental Protection Agency
Executive Summary
Evaluation of San Joaquin River Flow and Southern Delta Water Quality Objectives and Implementation
ES-98 September 2016
ICF 00427.11
This page intentionally left blank
State Water Resources Control Board California Environmental Protection Agency
Executive Summary
Evaluation of San Joaquin River Flow and Southern Delta Water Quality Objectives and Implementation
ES-99 September 2016
ICF 00427.11
References Cited California Department of Water Resources (DWR). 2003a. California’s Groundwater Bulletin 118,
Update 2003. San Joaquin River Hydrologic Region, San Joaquin Valley Groundwater Basin,
Modesto Subbasin. Last revised: 2006. Sacramento, CA.
———. 2003b. California’s Groundwater Bulletin 118, Update 2003. San Joaquin River Hydrologic
Region, San Joaquin Valley Groundwater Basin, Turlock Subbasin. Last revised: 2006. Sacramento,
CA.
———. 2003c. California’s Groundwater Bulletin 118, Update 2003. San Joaquin River Hydrologic
Region, San Joaquin Valley Groundwater Basin, Merced Subbasin. Last revised: 2006. Sacramento,
CA.
———. 2016. Critically Overdrafted Basins. Final List of Critically Overdrafted Basins. January.
Available: http://www.water.ca.gov/groundwater/sgm/cod.cfm. Accessed: March.
Maven. 2015. The Future of Water Transfers after the 2014 Drought. Available:
http://mavensnotebook.com/2015/01/14/the-future-of-water-transfers-after-the-2014-
drought/. Accessed: September 23, 2015.
Public Policy Institute of California (PPIC). 2011. Managing California’s Water from Conflict to
Reconciliation. Available: http://www.ppic.org/content/pubs/report/R_211EHChapter2R.pdf.
U.S. Fish and Wildlife Service (USFWS). 2008. New Don Pedro Project, FERC No. 2299 FWS Filing of
Final Report Relating to Flow-Overbank Inundation Relationship on the Tuolumne River.
September 16.


