
Patients First, Partners Always
SAMHS eMSM Update 1 Nov 2015
Damon G. Baine
Colonel, USA, MS Chief Operating Officer, SAMHS eMSM
Patients First, Partners Always Patients First, Partners Always
Agenda
• Review of eMSM CONOPS and Governance SAMHS Update – Business Plan – SAMHS Performance Examples – eMSM “Victories”
• Common eMSM Challenges • Key eMSM Executive Skills

Patients First, Partners Always Patients First, Partners Always
MHS Governance Reform Journey
3
DoD Task Force on MHS Governance
September 2011
18th study over 62 years 7th rec “added central
authority” DHA model for MHS
governance
DepSecDef Planning Memo
March 2012
Directed I-Planning for MHS Governance Reform— OASD(HA) DHA Shared Services JTF-CapMed transition eMSMs
DepSecDef “Nine Commandments” Memo
March 2013
Directed implementation of MHS Governance Reform— OASD(HA) & TMA
transition DHA (as CSA) Shared Services NCR Directorate eMSMs
Historical MHS Governance Studies
17 studies over 57 years 8 recs for unified
service/unified joint command 6 recs for added central
authority 3 recs “keep separate
Service lines
1949 - 2006

Patients First, Partners Always Patients First, Partners Always
Evolution to the SAMHS eMSM
4
MSMO
2004
Multi-Service Market Offices established Support new TRICARE
Managed Care Support Contracts
BRAC Law
2005-2007
Mandated several changes Relocated inpatient
medical functions from WHMC to BAMC Transitioned WHMC to
WHASC
Joint Military Medical Command
Execution challenges Many victories: Integrated GME programs
through SAUSHEC STRAC
1987-1991
SAMHS and SAMHS eMSMs
2011 - 2013
2011: SAMHS established by MOA signed by Army and Air Force Chiefs of Staff 2013: DepSecDef memo
established eMSMs—empowered with new authorities
5
Patients First, Partners Always Patients First, Partners Always
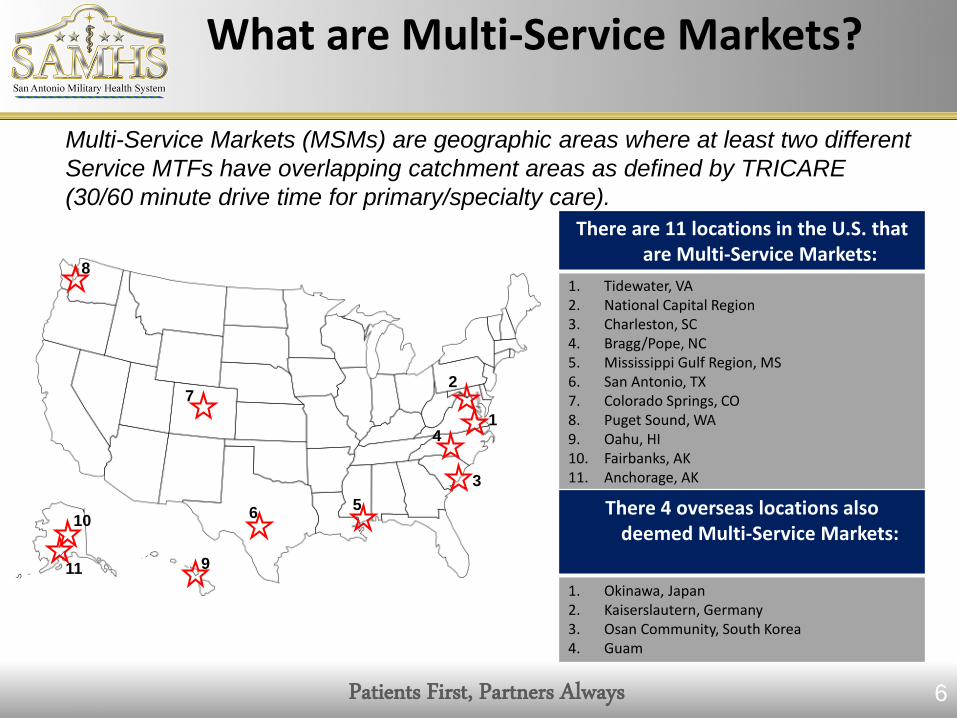
What are Multi-Service Markets?
Multi-Service Markets (MSMs) are geographic areas where at least two different Service MTFs have overlapping catchment areas as defined by TRICARE (30/60 minute drive time for primary/specialty care).
There are 11 locations in the U.S. that are Multi-Service Markets:
1. Tidewater, VA 2. National Capital Region 3. Charleston, SC 4. Bragg/Pope, NC 5. Mississippi Gulf Region, MS 6. San Antonio, TX 7. Colorado Springs, CO 8. Puget Sound, WA 9. Oahu, HI 10. Fairbanks, AK 11. Anchorage, AK
There 4 overseas locations also deemed Multi-Service Markets:
1. Okinawa, Japan 2. Kaiserslautern, Germany 3. Osan Community, South Korea 4. Guam
1
2
3
4
5 6
7
8
9
10
11
6
Patients First, Partners Always Patients First, Partners Always
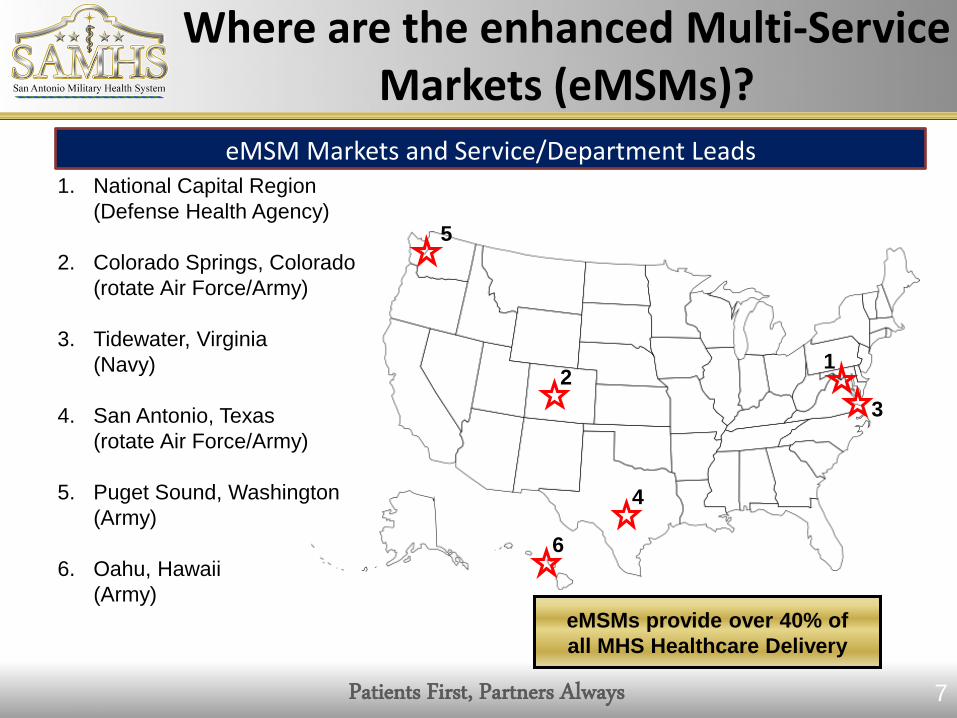
Where are the enhanced Multi-Service Markets (eMSMs)?
eMSM Markets and Service/Department Leads 1. National Capital Region (Defense Health Agency) 2. Colorado Springs, Colorado (rotate Air Force/Army) 3. Tidewater, Virginia (Navy) 4. San Antonio, Texas (rotate Air Force/Army) 5. Puget Sound, Washington (Army) 6. Oahu, Hawaii (Army)
5
2 1
3
4
6
7
eMSMs provide over 40% of all MHS Healthcare Delivery

Patients First, Partners Always Patients First, Partners Always
What is “Enhanced”?
8
No easy task to evolve legacy processes
Single Market Manager Within each eMSM, an appointed market manager has the authority to:
• Manage the allocation of the budget for the market
• Direct common clinical and business functions for the market
• Direct the movement of workload and workforce among the medical treatment facilities
• Develop, execute and monitor the business performance plan
Single Market Plan Within each eMSM, 5-year Business Performance Plans will be: •Fully-integrated across the entire market and will replace current MTF based business plans •Based on a 5-year planning cycle, as opposed to the current 3-year plan •Aligned with budget execution process to ensure continuity

Patients First, Partners Always Patients First, Partners Always
eMSM Concept of Operations
9
Relationships are still evolving
eMSM office sets Business Performance Plan objectives and submission--seeks out opportunities to improve all facets of healthcare delivery while reducing costs.
Market components work with eMSM office to assist in Business Performance Plan execution. Disconnects resolved locally or at MDAG.
MDAG
eMSM Office
MTFs eMSM Partners (Services)
MDAG provides authority to eMSM office to investigate, analyze, and initiate changes across the market.
MTFs provide feedback to eMSM office on what works and what does not—collaborative approach is critical to success.

Patients First, Partners Always
Senior Market Manager
Director
Admin/ITSupport
Directorate ofClinical Operations
Appointing andReferral
Management
Direct CareOptimization/
Capability
Population Health
Case & DiseaseManagement
Readiness
Health Education & Training Ancillary Services
Directorate ofMarket Analysis & Evaluation
MarketPerformancePlanning &Reporting
Data Analysis &Program
Evaluation
Business ProcessReengineering
Directorate ofBusiness Operations
Manpower &Budget
Management
MCSC Operations/Recapture
Management
EmergencyResponse Planning
MOUs/MOAs/Contracting &
Venture Capital
IM/IT Telehealth
FederalPartnerships/Community
Relations
Market BusinessWorkloadReporting/Enrollment
Strategic Communications/
PatientSatisfaction
** Central CLRProcessing
** Central
Appointing** Expanded Functions
eMSM Functional Organizational Structure
Clinical Standardization
Quality Management
Risk Management
Patient Safety
Research
Logistics
Strategic Planning
Reference eMSM CONOPS Organizational Structure
10

Womack AMC
MDAG
Services DHA
ASD(HA)
MOG/MBOG/ MPOG/SAG
eMSM LG
eMSMs
NCR Dir
eMSM
CO
NO
PS eM
SM CO
NO
PS
eMSM MTFs
DepSecDef Memo
DepSecDef Memo
ADCON
OPCON TACON
OPCON TACON
OPCON TACON
NMC San Diego
Tidewater
Puget Sound
San Antonio
Colorado Springs
Hawai’i
As developed and inferred from: • Deputy Secretary of Defense Memorandum, Implementation of Military Health System Governance Reform, 11 Mar 13 • Enhanced Multi-Service Market Concept of Operations, 11 Mar 14 • Includes eMSMs “+2” of Naval Medical Center San Diego and Womack Army Medical Center

Patients First, Partners Always Patients First, Partners Always
eMSM Governance Structure
Senior Leader Council
BAMC Commander COL Renz
Other Army Clinics
SAMMC DCCS Col
Pendergrass
WHASC CD COL Ekstrand
Other Air Force Clinics
Clinical Operations
Col Lloyd
Business Operations LTC DeVries
Board of Directors
Chief Operating Officer COL Baine
SAMHS Maj Gen Iddins – MM
BG Holcomb– Vice MM
59th MDW Commander Maj Gen Iddins
Chief Nurse Executive Col Foulk
Allied Health COL Fryar
eMSM Business Planning
eMSM Analytics
Sr Enlisted Liaison SGM Adams

Patients First, Partners Always Patients First, Partners Always
MTF Footprint
13
Patients First, Partners Always Patients First, Partners Always
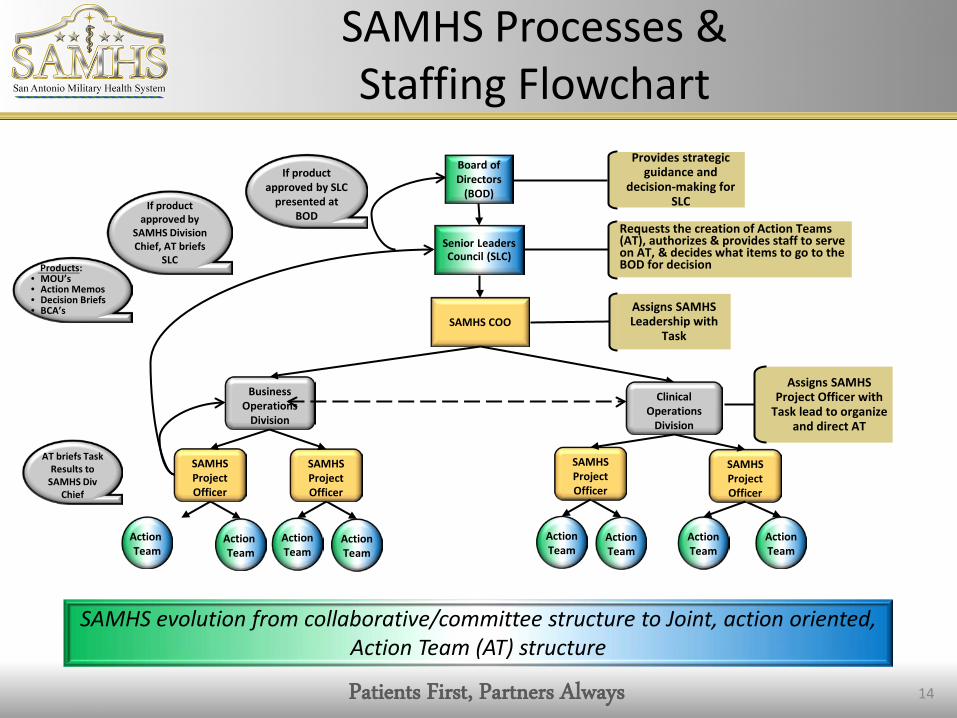
SAMHS Processes & Staffing Flowchart
14
SAMHS evolution from collaborative/committee structure to Joint, action oriented, Action Team (AT) structure
Board of Directors
(BOD)
Senior Leaders Council (SLC)
Provides strategic guidance and
decision-making for SLC
SAMHS COO
Clinical Operations
Division
Business Operations
Division
SAMHS Project Officer
Action Team
Action Team
SAMHS Project Officer
Action Team
Action Team
SAMHS Project Officer
Action Team
Action Team
SAMHS Project Officer
Action Team
Action Team
Requests the creation of Action Teams (AT), authorizes & provides staff to serve on AT, & decides what items to go to the BOD for decision
Assigns SAMHS Leadership with
Task
Assigns SAMHS Project Officer with
Task lead to organize and direct AT
If product approved by
SAMHS Division Chief, AT briefs
SLC
AT briefs Task Results to
SAMHS Div Chief
If product approved by SLC
presented at BOD
Products: • MOU’s • Action Memos • Decision Briefs • BCA’s

Patients First, Partners Always Patients First, Partners Always 15
SAMHS Action Teams
SAMHS Lines of Effort Access
to Care
Behavioral
Health
Data Quality
Orthopedic R
ecapture
Patient E
xperie
nce
Primary
Care
Pharmacy
Quality & Sa
fety
Strategic C
ommunicatio
n & M
arketin
g
Surgica
l
Reporting ScheduleTransform Access Safety & Quality Patient Experience Enrollment Growth Behavioral Health Pharmacy PT Recapture
Communities of Interest:
Research
Clinical Support: LAB/RADMedical Education & Training
SAMHS Action Teams & Lines
of Effort Matrix

Patients First, Partners Always Patients First, Partners Always
The eMSM Business Plan

- 17 -
For Official Use Only
The eMSM Performance Review Process
1. Develop & send Performance Plan & data to DHA Analytics Cell
3. Analyze issues, develop
actionable recommendations
4. Leaders review & take action on
recommendations
MARKETS DHA ANALYTICS LEADERS
2. Collect data, develop eMSM
Report Card

Patients First, Partners Always
FY15-19 Business Performance Plan Executive Summary
Capability Overview
• # ORs: Physical: 144 Staffed: 136 • # Total Beds:
• Physical: 1,791 Staffed: 1,508 • # Skill Type 1 & 2: 4831.39 • Total DHP Direct Care Funding*: $5.8B *(including MILPERS)
FY14 Population Eligible MTF-Enrolled MCSC-Enrolled
1,724,135 877,455 150,396
Mod Study Target
Recapture ($)
Annual Recapture ($M)
Total FY15 FY16 FY17 FY18 FY19
961.2 130.2 197.1 239.2 257.0 259.1 1,082.7
Total 5-Yr Prime Enrollment Change 109 K*
Enrollment Target
Targeted Annual Enrollment (K) Total 5-Yr
Change FY15 FY16 FY17 FY18 FY19
1,039 943 993 1,038 1,050 1,052 109
Total 5-Yr Recapture $1.08B**
Impact on Quadruple Aim Readiness Health Healthcare Cost
28 Total Market Initiatives 22 of 28
initiatives address
14 of 28 initiatives address
25 of 28 initiatives address
25 of 28 initiatives address
Total 5-Yr Productivity Change (Work) 1.17 M 271,859
Productivity Target
Targeted Annual Productivity (work RVUs) (K) Total 5-Yr
Change FY15 FY16 FY17 FY18 FY19
829 9,075 9,699 10,073 10,227 10,244 1,172
Total 5-Yr Net Estimated Savings $1.02 B
Financial Impact (Savings) ($M)
FY15 FY16 FY17 FY18 FY19 5-Yr Total
Savings 137.3 205.7 249.2 267.3 269.3 1,129.0 Costs 15.4 22.3 25.1 25.3 25.4 113.6 Net 121.9 183.3 224.0 241.9 243.8 1,015.3
*Calculated as projected market enrollment in FY19-projected enrollment in FY15. Enrollment numbers include Prime and Plus.
**Excludes all pharmacy-related dollars, as pharmacy is not included in the Mod Study target
18

Patients First, Partners Always
APPROVED SAMHS FY15-19 Business Performance Plan— Executive Summary
Capability Overview
• # MTFs: __10__ • # ORs: Physical:__33__ Staffed:_32___ • # Total Beds: Physical: _425_ Staffed:_366__ • # Skill Type 1 & 2: _888.96_ • Total DHP Direct Care Funding*: $1.6B *(including MILPERS)
FY14 Population Eligible MTF-Enrolled MCSC-Enrolled
247,969 123,326 15,736
Total 5-Yr Net Estimated Savings
$173.3M
Mod Study Target Recapture ($)
Annual Recapture ($M) Total FY15 FY16 FY17 FY18 FY19
$272.3M $34.2M $51.5M $53.9M $53.9M $53.9M $247.6M
Financial Impact (Savings) ($M)
FY15 FY16 FY17 FY18 FY19 5-Yr Total
Savings $34.2M $51.5M $53.9M $53.9M $53.9M $247.6M
Costs $10.3M $15.4M $16.1M $16.1M $16.1M $74.2M
Net $23.9M $36.0M $37.7M $37.7M $37.7M $173.3M
Total 5-Yr Prime Enrollment Change
6,334
Enrollment Target
Targeted Annual Enrollment (K) Total 5-
Yr Change
FY15 FY16 FY17 FY18 FY19
138K 133K 138K 140K 140K 140K 6K
Total 5-Yr Recapture
$247.6M
Initiative
Impact on Quadruple Aim Net Cost Savings ($000)
Imple-mentation
Costs ($000)
Total Produc-
tivity Change
Total Enroll-ment
Change
Total Recapture ($000) Readi-ness Health
Health-care
Cost
Inpatient Transfer X X X $32.3M $13.8M 2,839 RWPS N/A $46.1M
Behavioral Health Recapture
X X X X $14.6M $6.3M
18,615 MH Bed Days 128,000 paRVUs
N/A $20.9M
Orthopedics Recapture X X X $8.6M $3.7M 60,600 paRVUs
N/A $12.3M
Enrollment Growth X X X - *TBD - 6,334 -
Productivity Enhancement Plan (Less BH, Ortho and Inpt)
X X X X $117.7M $50.4M
Production Plan RWPS,
pa RVUS, APCS and MH Bed
Days
- $168.2M
Pharmacy Recapture** X $121.5M $36.5M N/A N/A $173.6M
AGGREGATE TOTAL: $294.7M $110.7M - 6,334 $421.1M
TOTAL LESS PHARMACY: $173.2M $74.2M - 6,334 $247.6M
Total 5-Yr Productivity Change (Work)
271,859
Productivity Target
Targeted Annual Productivity (work RVUs) (M) Total 5-Yr
Change FY15 FY16 FY17 FY18 FY19
343,614 2.34M 2.47M 2.61M 2.61M 2.61M 271,859
- Decimal rounding results in numbers total discrepancies - Enrollment Change is difference between FY15 Target and FY19 Target; present day growth is 11,147 (PRIME) - Skill Type I & II is A & B MEPRS Only; - Pharmacy included in initiatives for tracking; 4% decrease year over year prescribed for FY14-FY18 BPP - Implementation cost is the DHA Prescribed 30% planning factor - ** Pharmacy Recapture not to be counted in totals as will be accounted for through Shared Service - SAMHS Assessment on recapture is ~$247.6M of the $272.3M Modernization Target and 271K work RVUS of the 343K Target.

Patients First, Partners Always Patients First, Partners Always
SAMHS eMSM Performance
Examples
Patients First, Partners Always Patients First, Partners Always
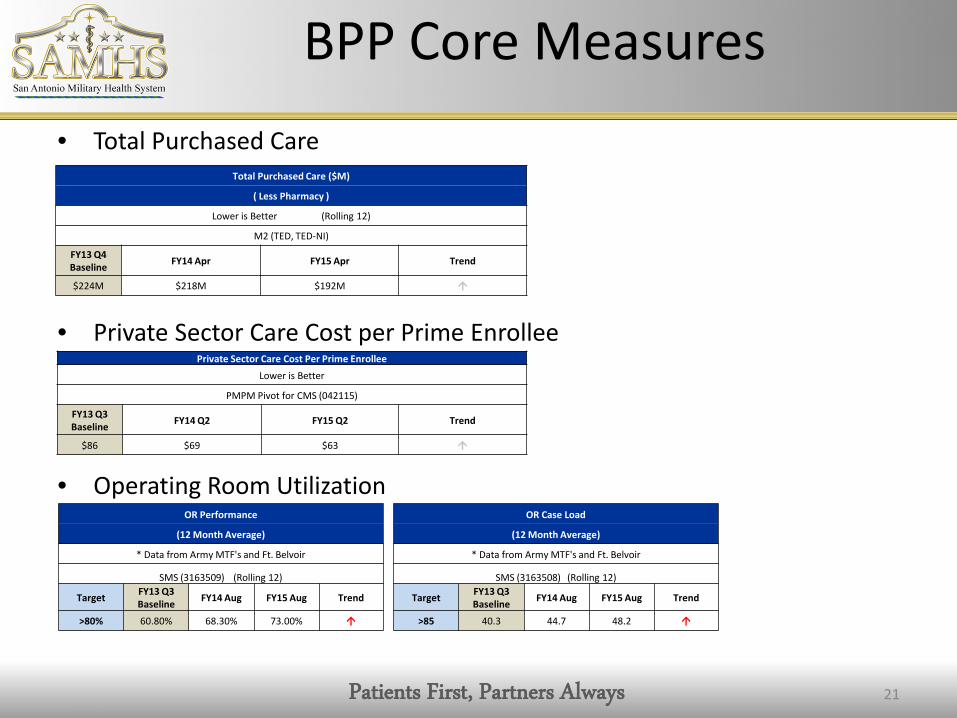
BPP Core Measures
21
• Total Purchased Care
• Private Sector Care Cost per Prime Enrollee
• Operating Room Utilization
Total Purchased Care ($M)
( Less Pharmacy )
Lower is Better (Rolling 12)
M2 (TED, TED-NI)
FY13 Q4 Baseline FY14 Apr FY15 Apr Trend
$224M $218M $192M
Private Sector Care Cost Per Prime Enrollee Lower is Better
PMPM Pivot for CMS (042115)
FY13 Q3 Baseline FY14 Q2 FY15 Q2 Trend
$86 $69 $63
OR Performance
(12 Month Average)
* Data from Army MTF's and Ft. Belvoir
SMS (3163509) (Rolling 12)
Target FY13 Q3 Baseline FY14 Aug FY15 Aug Trend
>80% 60.80% 68.30% 73.00%
OR Case Load
(12 Month Average)
* Data from Army MTF's and Ft. Belvoir
SMS (3163508) (Rolling 12)
Target FY13 Q3 Baseline FY14 Aug FY15 Aug Trend
>85 40.3 44.7 48.2

Patients First, Partners Always Patients First, Partners Always
BPP Core Measures continued
22
• Prime Enrollment
• Non-Prime Primary Care Workload
• Overall Satisfaction w/ Healthcare – Inpatient
Prime Enrollment Higher is Better
M2 (TRICARE Detail)
Target FY13 Q3 Baseline FY14 Sep FY15 Sep Trend
133,763 119,958 124,968 126,858
Non Enrollee Primary Care Workload (FFS)
(RVUs + APCs, Excludes Coast Guard & VA)
Higher is Better (Rolling 12)
IRIS Database Pull
Target FY13 Q3 Baseline FY14 Aug FY15 Jul Trend
686,373 648,252 597,462
Overall Satisfaction - Inpatient (Recommend Hospital)
Higher is Better
TRISS
Target FY13 Q3 Baseline FY15 Q1 FY15 Q2 Trend
71.00% 85% 83.30% 82.70%
Overall Satisfaction - Inpatient
(Rate Hospital)
Higher is Better
TRISS
Target FY13 Q3 Baseline FY15 Q1 FY15 Q2 Trend
71.00% 81.00% 80.00% 78.80%

Patients First, Partners Always Patients First, Partners Always 23
• Per Member Per Month
• Percent Retail Pharmacy Spend
• Primary Care Leakage
Per Member Per Month
(Dollar Amount)
Lower is Better
PMPM Pivot for CMS (042115)
FY13 Q3 Baseline FY14 Q2 FY15 Q2 Trend
$419 $438 $464
Per Member Per Month Growth Rate
(Percent Change Quarter Over Quarter)
Lower is Better
PMPM Pivot for CMS (042115)
Target FY13 Q3 Baseline FY14 Q2 FY15 Q2 Trend
<=2.0% 5.60% -1.10% 5.60%
Percent Retail Pharmacy Spend Lower is Better (1 Month)
M2 (PDTS)
Target By FY18
FY13 Q3 Baseline FY14 Apr FY15 Apr Trend
25% 31.10% 30.00% 52.20%
Primary Care Leakage Lower is Better
PCM Leakage data_16FEB2015
Target FY13 Q3 Baseline FY14 Feb FY15 Feb Trend
<24% 26.10% 29.00% 30.00%
BPP Core Measures continued
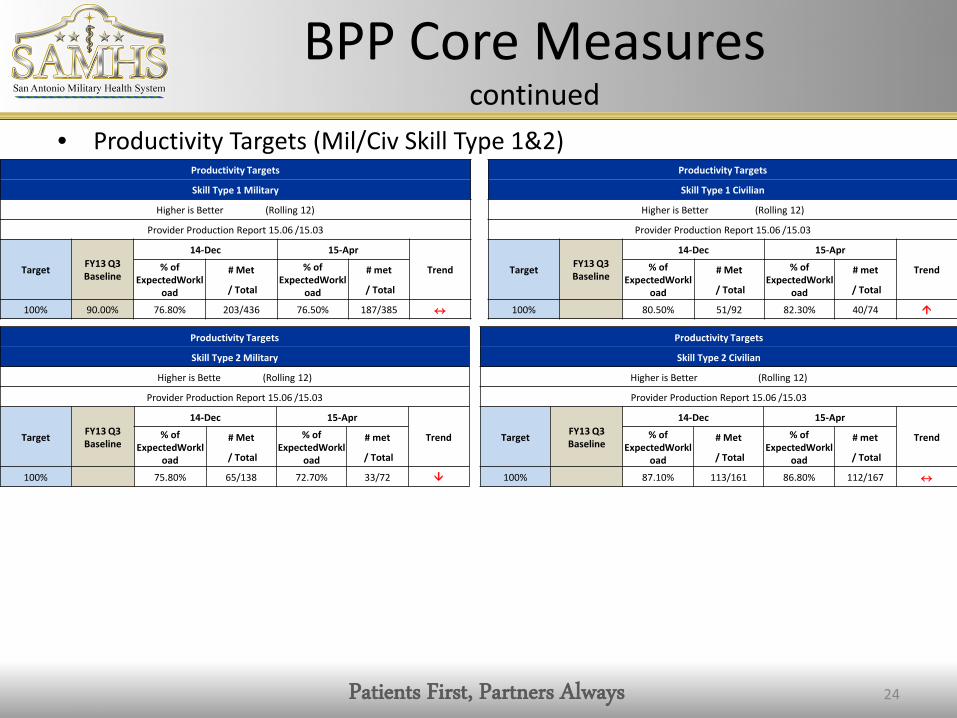
Patients First, Partners Always Patients First, Partners Always 24
• Productivity Targets (Mil/Civ Skill Type 1&2)
Productivity Targets
Skill Type 1 Military
Higher is Better (Rolling 12)
Provider Production Report 15.06 /15.03
Target FY13 Q3 Baseline
14-Dec 15-Apr
Trend % of ExpectedWorkl
oad
# Met % of ExpectedWorkl
oad
# met
/ Total / Total
100% 90.00% 76.80% 203/436 76.50% 187/385 ↔
Productivity Targets
Skill Type 1 Civilian
Higher is Better (Rolling 12)
Provider Production Report 15.06 /15.03
Target FY13 Q3 Baseline
14-Dec 15-Apr
Trend % of ExpectedWorkl
oad
# Met % of ExpectedWorkl
oad
# met
/ Total / Total
100% 80.50% 51/92 82.30% 40/74
Productivity Targets
Skill Type 2 Military
Higher is Bette (Rolling 12)
Provider Production Report 15.06 /15.03
Target FY13 Q3 Baseline
14-Dec 15-Apr
Trend % of ExpectedWorkl
oad
# Met % of ExpectedWorkl
oad
# met
/ Total / Total
100% 75.80% 65/138 72.70% 33/72
Productivity Targets
Skill Type 2 Civilian
Higher is Better (Rolling 12)
Provider Production Report 15.06 /15.03
Target FY13 Q3 Baseline
14-Dec 15-Apr
Trend % of ExpectedWorkl
oad
# Met % of ExpectedWorkl
oad
# met
/ Total / Total
100% 87.10% 113/161 86.80% 112/167 ↔
BPP Core Measures continued

Patients First, Partners Always
SAMHS Right of First Refusal TRO-South

Patients First, Partners Always
TOP SPECIALTIES BASED ON NUMBER OF REFERRALS (italicized
rows include ties)
ROFRs Referred to
MTF1
ROFRs Accepted by
MTF2
% ROFRs Accepted by
MTF
ROFRs Actively
Rejected by MTF3
% ROFRs Actively
Rejected by MTF
ROFRs Passively Rejected by MTF4
Physical Therapy, general 229 47 21% 182 79% 0Dermatology, general 144 97 67% 47 33% 0Gynecology (Non-Maternity) 99 94 95% 5 5% 0Ophthalmology, general 95 92 97% 3 3% 0Ear Nose & Throat, general 88 87 99% 1 1% 0Cardiology, general 83 81 98% 2 2% 0Orthopedics, knee & shoulder 64 43 67% 21 33% 0Urology, general 53 52 98% 1 2% 0Neurosurgery, general 45 41 91% 4 9% 0General Surgery 41 40 98% 1 2% 0
Monthly TotalApr 15 545 356 65% 189 35% 0May 15 488 254 52% 234 48% 0Jun 15 580 296 51% 284 49% 0
Quarterly Total 1613 906 56% 707 44% 0
'This table shows the number of non-urgent referrals by specialty that were sent to the MTF for this quarter and how many referrals were accepted or rejected.1ROFRs Referred- number of referrals that were sent to the MTF for acceptance 2ROFRs Accepted – number of referrals the MTF accepted3ROFRs Rejected- Number of referrals rejected by the MTF (including the passive denials- MTF takes no action within one business day)4ROFRs Passively Rejected: number of referrals the MTF passively denied (MTF takes no action within one business day)
'ROFR data extracted from Humana Military Report Gallery for Apr- Jun 2015
SAMHS eMSM- TOP 10 SPECIALTIES BASED ON NUMBER OF REFERRALS (italicized rows include ties)
SAMHS Right of First Refusal TRO-South –Top 10
Patients First, Partners Always
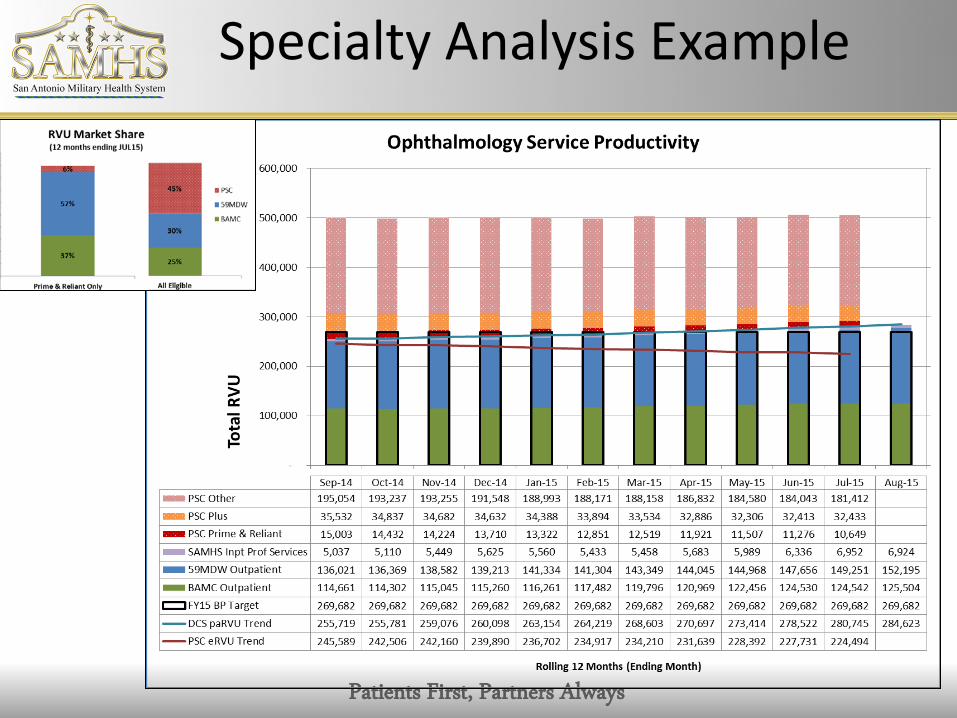
Specialty Analysis Example

Patients First, Partners Always Patients First, Partners Always 28
Specialty Analysis Example Continued

Patients First, Partners Always Patients First, Partners Always 29
Specialty Analysis Example Continued
-
2,000
4,000
6,000
8,000
10,000
12,000KI
M,Y
U HY
ON
HAYE
S,BA
RTLE
TT H
TOW
NLE
Y,JA
MES
RIC
HARD
III
SUHR
,ABR
AHAM
WO
NDU
KW
ELCH
,MAR
KSM
ITH,
BEN
JAM
IN H
EBER
CALD
WEL
L,M
ATTH
EW C
RUBI
NAT
E,LA
URA
STEI
GLE
MAN
,WAL
TER
AGR
ANT,
AARO
N D
ANIE
LEV
ANGE
LIST
A,CH
ARIS
MA
BAUT
ISTA
BRAM
BLET
T,GR
EGO
RY T
HOM
ASGE
DWIL
VALE
NTI
N,F
RAN
K E
SHER
OL
VEGD
IETH
OM
AS,S
COTT
AM
AUFF
RAY,
RAN
DY O
DRAY
PAU
CRO
SJN
FRIE
DMAN
,MIR
IAM
SMIT
H,RO
BERT
EBA
SKIN
,DAR
RELL
ECH
ACKO
,BEN
JAM
INKO
HDAV
JOHN
SON
,AN
THO
NY
JAM
ESAN
DERS
ON
,DAN
IEL
MHA
RRJN
ROBE
RTS,
SAN
FORD
EBO
WES
,HAR
RISO
N N
ESBI
T JR
DAVI
ES,B
RETT
WAP
SEYD
VUVI
NPA
NDA
Y,VA
SUDH
A AR
UNA
MIT
TELB
CRO
LEY,
JAN
IS K
HAAA
ROLE
UJES
STH
EJAR
LAUC
YNCA
LDCH
RIGR
AKEN
ROHL
UI
HERR
MAR
CGR
OVE
S,LU
CAS
LEE
RODR
IGU
EZ,C
HRIS
TOPH
ER J
MO
SES,
ARIA
N A
ROE,
JOSH
UA
RO
DEA,
TAM
ANN
AM
ADSE
N,M
ICHA
EL H
OW
ARD
LUTM
ER,S
EAN
MIC
HAEL
BEN
NIO
N,JO
HN L
MIC
HEL,
RYAN
JOSE
PHPO
WEL
L,M
ARIO
N R
CRO
SKRE
Y,JA
SON
AGI
LLIS
,JOHN
FGA
LLAG
HER,
COLI
N F
RAN
CIS
Wor
k RV
Us (
Actu
al in
clud
es P
rimar
y an
d Ad
ditio
nal P
rovi
der)
Individual Provider Productivity Ophthalmology SEP14 to AUG14
Actual Work RVU Target
Annual work RVU Target: AD, CIV: 4,731
CON: 5,144
[-----------Residents--------------
Individual Provider Data by Name

Patients First, Partners Always Patients First, Partners Always 30
Specialty Analysis Example Continued
Provider Information Productivity (M2) Distribution of Time (DMHRSi)
Provider Name Prov Type Actual Work RVU
Months (>10 RVU) Target MGMA
(Annual FY16) Paid FTE Clinical Time GME Time Admin Time Other Available Non Available
KIM,YU HYON Active Duty 10,114 12 4,731 4,731 HAYES,BARTLETT H Active Duty 7,219 12 4,731 4,731 TOWNLEY,JAMES RICHARD III Active Duty 6,820 12 4,731 4,731 SUHR,ABRAHAM WONDUK Active Duty 6,610 12 4,731 4,731 WELCH,MARK Active Duty 6,477 12 4,731 4,731 SMITH,BENJAMIN HEBER Active Duty 5,966 12 4,731 4,731 CALDWELL,MATTHEW C Active Duty 5,196 12 4,731 4,731 RUBINATE,LAURA Active Duty 5,107 12 4,731 4,731 STEIGLEMAN,WALTER A Active Duty 4,249 12 4,731 4,731 GRANT,AARON DANIEL Active Duty 3,960 12 4,731 4,731
EVANGELISTA,CHARISMA BAUTISTA Active Duty 3,764 10 3,943 4,731
BRAMBLETT,GREGORY THOMAS Active Duty 3,532 12 4,731 4,731 GEDWIL Civilian 3,519 12 4,731 4,731 VALENTIN,FRANK E Active Duty 3,477 12 4,731 4,731 SHEROL Contractor 3,106 12 5,144 5,144 VEGDIE Contractor 3,043 12 5,144 5,144 THOMAS,SCOTT A Contractor 3,000 12 5,144 5,144 MAUFFRAY,RANDY O Active Duty 2,798 12 4,731 4,731 DRAYPAU Active Duty 2,511 9 3,548 4,731 CROSJN Active Duty 2,395 9 3,548 4,731 FRIEDMAN,MIRIAM Contractor 2,364 12 5,144 5,144 SMITH,ROBERT E Contractor 2,340 12 5,144 5,144 BASKIN,DARRELL E Active Duty 2,168 8 3,154 4,731 CHACKO,BENJAMIN Contractor 1,545 12 5,144 5,144 KOHDAV Contractor 1,429 12 5,144 5,144 JOHNSON,ANTHONY JAMES Active Duty 1,214 7 2,760 4,731 ANDERSON,DANIEL M Active Duty 1,010 7 2,760 4,731 HARRJN Active Duty 960 12 4,731 4,731 ROBERTS,SANFORD E Contractor 714 12 5,144 5,144 BOWES,HARRISON NESBIT JR Contractor 679 11 4,715 5,144 DAVIES,BRETT W Active Duty 608 3 1,183 4,731 APSEYD Contractor 594 12 5,144 5,144 VUVIN Active Duty 514 7 2,760 4,731 PANDAY,VASUDHA ARUNA Contractor 490 5 2,143 5,144 MITTELB Active Duty 361 6 2,366 4,731 CROLEY,JANIS K Contractor 333 12 5,144 5,144 HAAARO Active Duty 202 5 1,971 4,731 LEUJESS Active Duty 188 3 1,183 4,731 THEJAR Active Duty 14 1 394 4,731
Individual Providers by
Name

Patients First, Partners Always Patients First, Partners Always
SAMHS eMSM “Victories”
• Single, Unified Business Plan • Standardized 2 Appointment Types
– Family Medicine, Pediatrics, Internal Medicine
• Integrated Dermatology, Cytology • Single Consult Review • Roll-up dashboards • Distributed Care Collaboration • Wilford Hall Academy • One Call Resolution • Inpatient Integration Initiative

Patients First, Partners Always Patients First, Partners Always
Common eMSM Challenges • Leadership: perspective, maturity, development • Strategy: eMSM Strategy vs Service priorities
– High Reliability Organization(s)? – Integrated vs Federated vs other? – The “Service-led” eMSM?
• Performance: Performance Management System (synergistic) – Data overload: MTFs, eMSM, regional HQ, TRO, Services, DHA, etc. = Noisy – Incentive Systems: IRIS, etc.
• Drivers: – Enrollment….Access to Care…Productivity….Containment/Recapture – Patient Satisfaction – Collision of Compliance, Accreditation, and Governance
• Distribution of Assets – Integrated manning documents – Movement of personnel, equipment, monies
• Governance Structures and Workflow – Issue identification, Prioritization, and Decision Making
• System Support to eMSMs – Intermediate Headquarters’ processes
Patients First, Partners Always Patients First, Partners Always
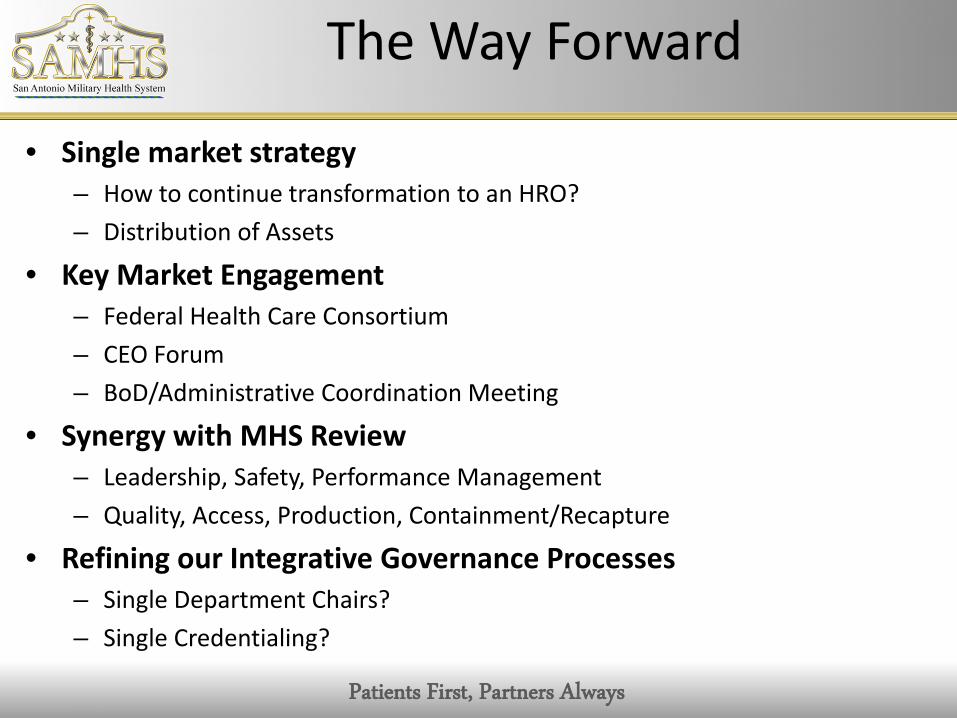
The Way Forward
• Single market strategy – How to continue transformation to an HRO? – Distribution of Assets
• Key Market Engagement – Federal Health Care Consortium – CEO Forum – BoD/Administrative Coordination Meeting
• Synergy with MHS Review – Leadership, Safety, Performance Management – Quality, Access, Production, Containment/Recapture
• Refining our Integrative Governance Processes – Single Department Chairs? – Single Credentialing?
Patients First, Partners Always Patients First, Partners Always
Executive Skills

Patients First, Partners Always Patients First, Partners Always
Key Skills in an eMSM
• Using Perspective: eMSM-wide and/or MHS-wide • Leading Transformation & Change
– Leadership – Management
• Trusting and Relying on Partnership – Cooperation/Collaboration vs Command/Control
• Leveraging novel workflows – eMSM workflow vs MTF workflow – Formal vs Informal; minimizing beuracracy
• Find “common ground” – Obvious consensus vs what is needed/what is right
• Communicating effectively • Exhibiting patience, stamina, and tenacity

Patients First, Partners Always Patients First, Partners Always
Key Takeaways
• The greatest transformation in MHS History • A fully Integrated, High-Performing Health System Team • While Cost is important……focus on the patient and the care
team is key – Medically & Dentally Ready Force – Ready Medical and Dental Force – Quality, Clinical Outcomes and a “System of Health”
• Courage to “Do the Right Thing” • Developing, shaping, and empowering strategically informed
leaders is imperative to our success
36

Patients First, Partners Always
Federal Healthcare Consortium


