For the very latest specifications visit www.aeroflex.com
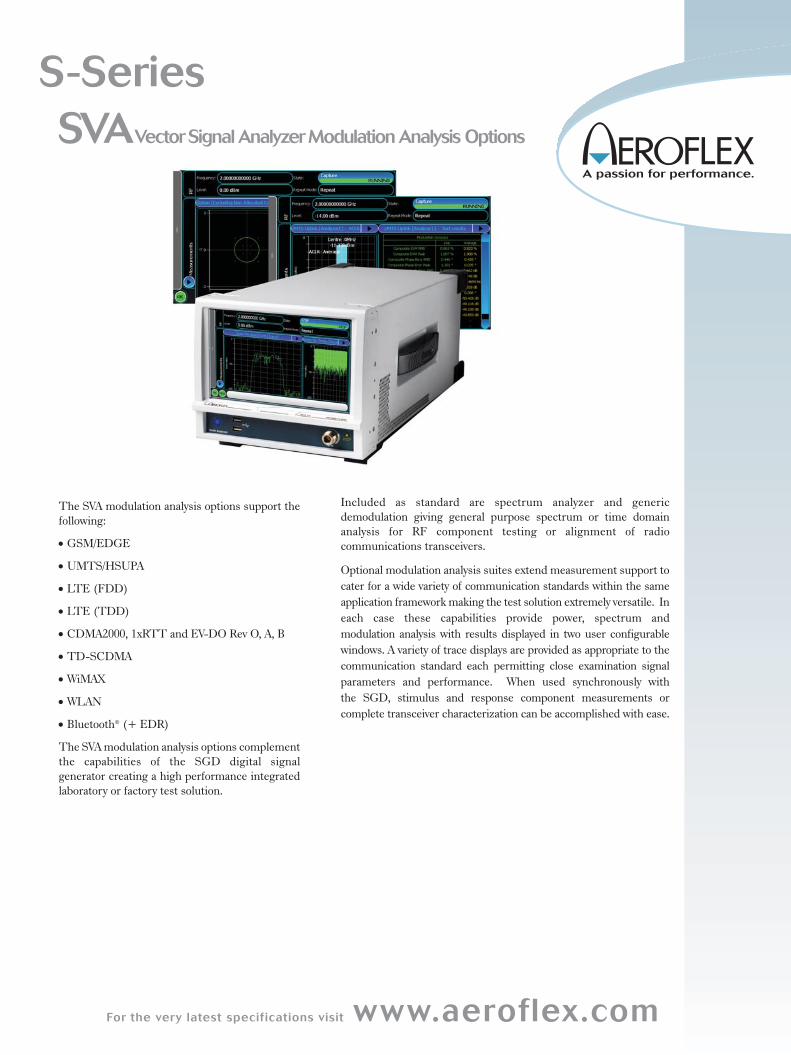
S-SeriesSVAVector Signal Analyzer Modulation Analysis Options
The SVA modulation analysis options support the
following:
• GSM/EDGE
• UMTS/HSUPA
• LTE (FDD)
• LTE (TDD)
• CDMA2000, 1xRTT and EV-DO Rev O, A, B
• TD-SCDMA
• WiMAX
• WLAN
• Bluetooth® (+ EDR)
The SVA modulation analysis options complement
the capabilities of the SGD digital signal
generator creating a high performance integrated
laboratory or factory test solution.
Included as standard are spectrum analyzer and generic
demodulation giving general purpose spectrum or time domain
analysis for RF component testing or alignment of radio
communications transceivers.
Optional modulation analysis suites extend measurement support to
cater for a wide variety of communication standards within the same
application framework making the test solution extremely versatile. In
each case these capabilities provide power, spectrum and
modulation analysis with results displayed in two user configurable
windows. A variety of trace displays are provided as appropriate to the
communication standard each permitting close examination signal
parameters and performance. When used synchronously with
the SGD, stimulus and response component measurements or
complete transceiver characterization can be accomplished with ease.
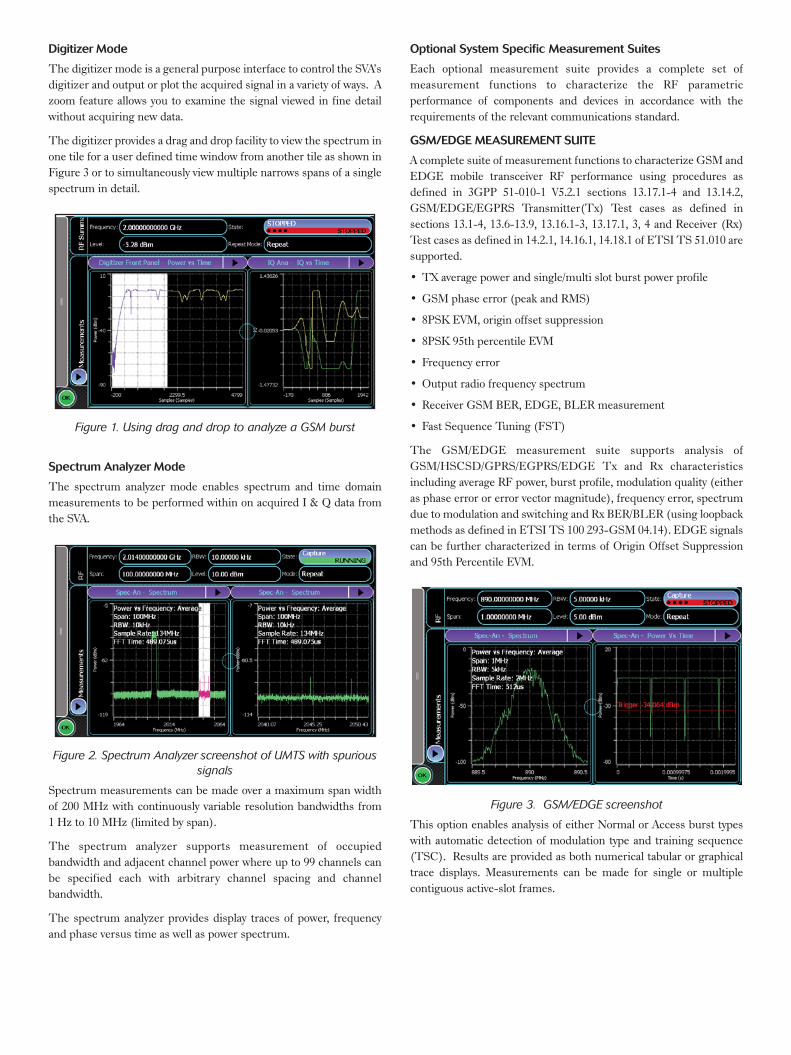
Digitizer Mode
The digitizer mode is a general purpose interface to control the SVA’s
digitizer and output or plot the acquired signal in a variety of ways. A
zoom feature allows you to examine the signal viewed in fine detail
without acquiring new data.
The digitizer provides a drag and drop facility to view the spectrum in
one tile for a user defined time window from another tile as shown in
Figure 3 or to simultaneously view multiple narrows spans of a single
spectrum in detail.
Figure 1. Using drag and drop to analyze a GSM burst
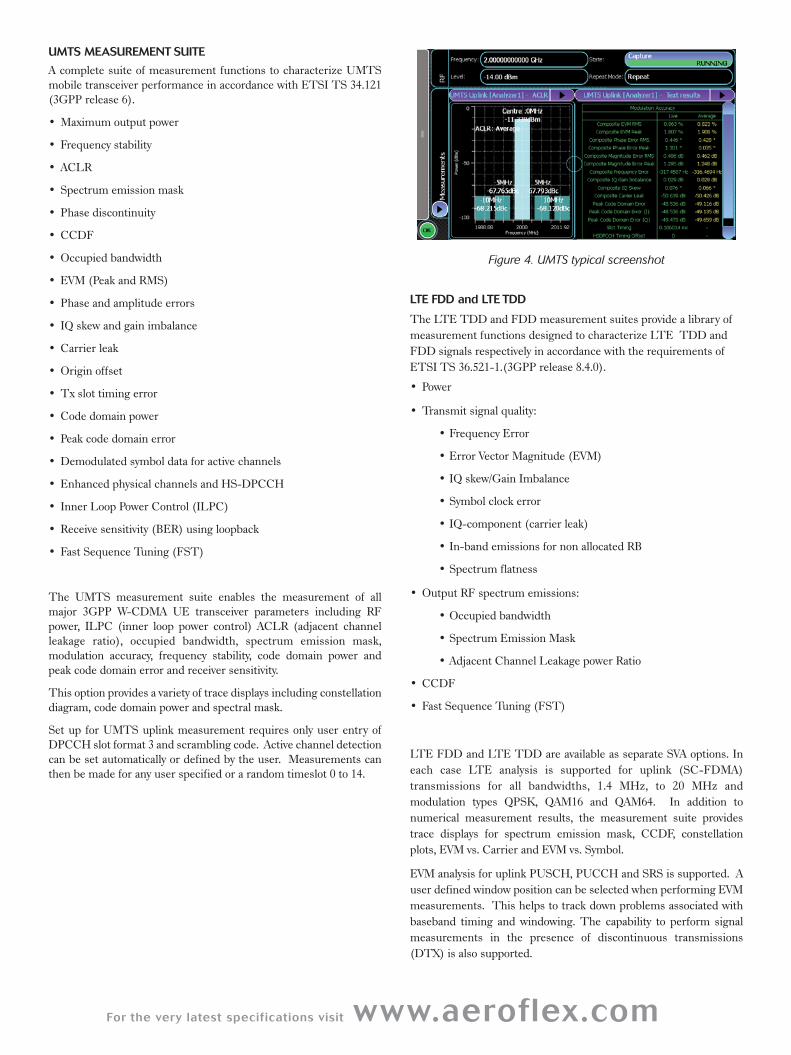
Spectrum Analyzer Mode
The spectrum analyzer mode enables spectrum and time domain
measurements to be performed within on acquired I & Q data from
the SVA.
Figure 2. Spectrum Analyzer screenshot of UMTS with spurioussignals
Spectrum measurements can be made over a maximum span width
of 200 MHz with continuously variable resolution bandwidths from
1 Hz to 10 MHz (limited by span).
The spectrum analyzer supports measurement of occupied
bandwidth and adjacent channel power where up to 99 channels can
be specified each with arbitrary channel spacing and channel
bandwidth.
The spectrum analyzer provides display traces of power, frequency
and phase versus time as well as power spectrum.
Optional System Specific Measurement Suites
Each optional measurement suite provides a complete set of
measurement functions to characterize the RF parametric
performance of components and devices in accordance with the
requirements of the relevant communications standard.
GSM/EDGE MEASUREMENT SUITE
A complete suite of measurement functions to characterize GSM and
EDGE mobile transceiver RF performance using procedures as
defined in 3GPP 51-010-1 V5.2.1 sections 13.17.1-4 and 13.14.2,
GSM/EDGE/EGPRS Transmitter(Tx) Test cases as defined in
sections 13.1-4, 13.6-13.9, 13.16.1-3, 13.17.1, 3, 4 and Receiver (Rx)
Test cases as defined in 14.2.1, 14.16.1, 14.18.1 of ETSI TS 51.010 are
supported.
• TX average power and single/multi slot burst power profile
• GSM phase error (peak and RMS)
• 8PSK EVM, origin offset suppression
• 8PSK 95th percentile EVM
• Frequency error
• Output radio frequency spectrum
• Receiver GSM BER, EDGE, BLER measurement
• Fast Sequence Tuning (FST)
The GSM/EDGE measurement suite supports analysis of
GSM/HSCSD/GPRS/EGPRS/EDGE Tx and Rx characteristics
including average RF power, burst profile, modulation quality (either
as phase error or error vector magnitude), frequency error, spectrum
due to modulation and switching and Rx BER/BLER (using loopback
methods as defined in ETSI TS 100 293-GSM 04.14). EDGE signals
can be further characterized in terms of Origin Offset Suppression
and 95th Percentile EVM.
Figure 3. GSM/EDGE screenshot
This option enables analysis of either Normal or Access burst types
with automatic detection of modulation type and training sequence
(TSC). Results are provided as both numerical tabular or graphical
trace displays. Measurements can be made for single or multiple
contiguous active-slot frames.
For the very latest specifications visit www.aeroflex.com
UMTS MEASUREMENT SUITE
A complete suite of measurement functions to characterize UMTS
mobile transceiver performance in accordance with ETSI TS 34.121
(3GPP release 6).
• Maximum output power
• Frequency stability
• ACLR
• Spectrum emission mask
• Phase discontinuity
• CCDF
• Occupied bandwidth
• EVM (Peak and RMS)
• Phase and amplitude errors
• IQ skew and gain imbalance
• Carrier leak
• Origin offset
• Tx slot timing error
• Code domain power
• Peak code domain error
• Demodulated symbol data for active channels
• Enhanced physical channels and HS-DPCCH
• Inner Loop Power Control (ILPC)
• Receive sensitivity (BER) using loopback
• Fast Sequence Tuning (FST)
The UMTS measurement suite enables the measurement of all
major 3GPP W-CDMA UE transceiver parameters including RF
power, ILPC (inner loop power control) ACLR (adjacent channel
leakage ratio), occupied bandwidth, spectrum emission mask,
modulation accuracy, frequency stability, code domain power and
peak code domain error and receiver sensitivity.
This option provides a variety of trace displays including constellation
diagram, code domain power and spectral mask.
Set up for UMTS uplink measurement requires only user entry of
DPCCH slot format 3 and scrambling code. Active channel detection
can be set automatically or defined by the user. Measurements can
then be made for any user specified or a random timeslot 0 to 14.
Figure 4. UMTS typical screenshot
LTE FDD and LTE TDD
The LTE TDD and FDD measurement suites provide a library of
measurement functions designed to characterize LTE TDD and
FDD signals respectively in accordance with the requirements of
ETSI TS 36.521-1.(3GPP release 8.4.0).
• Power
• Transmit signal quality:
• Frequency Error
• Error Vector Magnitude (EVM)
• IQ skew/Gain Imbalance
• Symbol clock error
• IQ-component (carrier leak)
• In-band emissions for non allocated RB
• Spectrum flatness
• Output RF spectrum emissions:
• Occupied bandwidth
• Spectrum Emission Mask
• Adjacent Channel Leakage power Ratio
• CCDF
• Fast Sequence Tuning (FST)
LTE FDD and LTE TDD are available as separate SVA options. In
each case LTE analysis is supported for uplink (SC-FDMA)
transmissions for all bandwidths, 1.4 MHz, to 20 MHz and
modulation types QPSK, QAM16 and QAM64. In addition to
numerical measurement results, the measurement suite provides
trace displays for spectrum emission mask, CCDF, constellation
plots, EVM vs. Carrier and EVM vs. Symbol.
EVM analysis for uplink PUSCH, PUCCH and SRS is supported. A
user defined window position can be selected when performing EVM
measurements. This helps to track down problems associated with
baseband timing and windowing. The capability to perform signal
measurements in the presence of discontinuous transmissions
(DTX) is also supported.
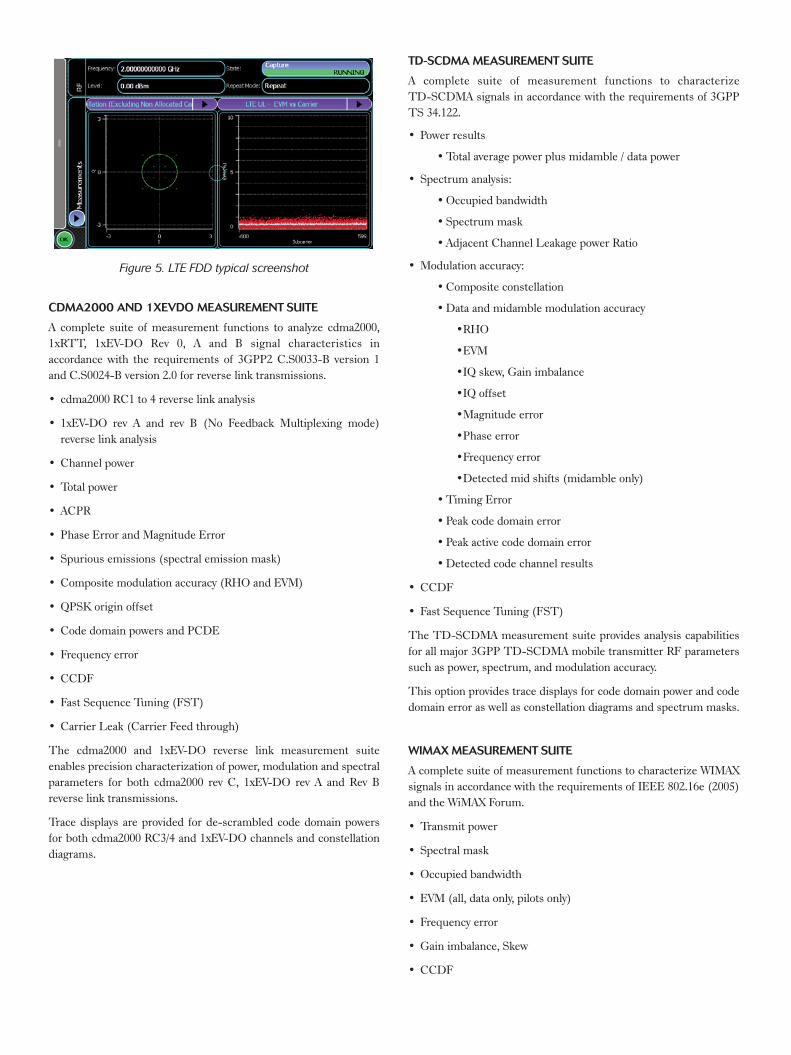
Figure 5. LTE FDD typical screenshot
CDMA2000 AND 1XEVDO MEASUREMENT SUITE
A complete suite of measurement functions to analyze cdma2000,
1xRTT, 1xEV-DO Rev 0, A and B signal characteristics in
accordance with the requirements of 3GPP2 C.S0033-B version 1
and C.S0024-B version 2.0 for reverse link transmissions.
• cdma2000 RC1 to 4 reverse link analysis
• 1xEV-DO rev A and rev B (No Feedback Multiplexing mode)
reverse link analysis
• Channel power
• Total power
• ACPR
• Phase Error and Magnitude Error
• Spurious emissions (spectral emission mask)
• Composite modulation accuracy (RHO and EVM)
• QPSK origin offset
• Code domain powers and PCDE
• Frequency error
• CCDF
• Fast Sequence Tuning (FST)
• Carrier Leak (Carrier Feed through)
The cdma2000 and 1xEV-DO reverse link measurement suite
enables precision characterization of power, modulation and spectral
parameters for both cdma2000 rev C, 1xEV-DO rev A and Rev B
reverse link transmissions.
Trace displays are provided for de-scrambled code domain powers
for both cdma2000 RC3/4 and 1xEV-DO channels and constellation
diagrams.
TD-SCDMA MEASUREMENT SUITE
A complete suite of measurement functions to characterize
TD-SCDMA signals in accordance with the requirements of 3GPP
TS 34.122.
• Power results
• Total average power plus midamble / data power
• Spectrum analysis:
• Occupied bandwidth
• Spectrum mask
• Adjacent Channel Leakage power Ratio
• Modulation accuracy:
• Composite constellation
• Data and midamble modulation accuracy
•RHO
•EVM
•IQ skew, Gain imbalance
•IQ offset
•Magnitude error
•Phase error
•Frequency error
•Detected mid shifts (midamble only)
• Timing Error
• Peak code domain error
• Peak active code domain error
• Detected code channel results
• CCDF
• Fast Sequence Tuning (FST)
The TD-SCDMA measurement suite provides analysis capabilities
for all major 3GPP TD-SCDMA mobile transmitter RF parameters
such as power, spectrum, and modulation accuracy.
This option provides trace displays for code domain power and code
domain error as well as constellation diagrams and spectrum masks.
WIMAX MEASUREMENT SUITE
A complete suite of measurement functions to characterize WIMAX
signals in accordance with the requirements of IEEE 802.16e (2005)
and the WiMAX Forum.
• Transmit power
• Spectral mask
• Occupied bandwidth
• EVM (all, data only, pilots only)
• Frequency error
• Gain imbalance, Skew
• CCDF

For the very latest specifications visit www.aeroflex.com
• Symbol/chip clock frequency error
• Carrier leakage
• Spectral flatness
The WiMAX measurement suite enables measurement of all major
signal characteristics of WiMAX CPE devices including power,
modulation accuracy and spectral parameters.
Configuration for each zone and burst within the sub-frame is made
easily configurable using point and click/drag and drop. Color is used
to differentiate between modulation types.
Complex EVM results can be viewed as a function of sub-carrier or
symbol for each burst in a multi-burst frame. Markers can be used
to link between EVM vs sub-carrier and sub-carrier EVM vs symbol
views.
Spectral measurements are displayed and checked against standard
compliant or user defined spectral mask.
Spectral flatness results provide a pass/fail indication independently
for each portion of the mask and check the relative level between
successive sub-carriers as well as providing trace data with markers.
WLAN MEASUREMENT SUITE
A comprehensive suite of measurement tools enabling the analysis of
all WLAN OFDM, DSSS and DSSS-OFDM RF signal characteristics
in accordance with the requirements of IEEE 802.11a,b PMD 1999,
IEEE 802.11g PMD 2003 and IEEE 802.11n /D7.0.
• Transmit power
• Transmit burst length
• Transmit power on, off timing
• Spectral mask
• Occupied bandwidth
• Frequency tolerance
• Symbol / chip clock frequency tolerance
• Carrier suppression/leakage
• Skew/Gain imbalance
• Modulation accuracy (EVM)
• Spectral flatness
Figure 6. WLAN typical screenshot
Data rates and corresponding modulation and encoding formats up to
450 Mb/s are supported. Modulation format, data rate and
modulation type are all determined automatically from preamble and
header decoding thus requiring no user set-up making using the
option easy to operate and integrate within a test application.
Measurements may be performed with/without compensation for
pilot time, amplitude and phase tracking enabled.
For 802.11n testing, modulation and coding schemes (MCS) 0
through 23 and 32 through 52 are supported which correspond to a
maximum of three spatial streams.
BLUETOOTH® (+EDR) MEASUREMENT SUITE
A suite of measurement functions to characterize Bluetooth® and
Bluetooth® EDR radio transceivers in accordance with the
requirements of Bluetooth® Specification 1.2 / 2.0 / 2.0+EDR / 2.1 /
2.1+EDR revision 2.1E1(2008).
The Bluetooth® measurement suite enables fast measurement of key
signal characteristics of Bluetooth® and Bluetooth® EDR transceivers
such as burst power, PSK modulation accuracy, initial and maximum
frequency error and origin offset and Receive sensitivity (BER).
• Burst position and power
• EDR relative Tx power
• Spectrum
• -20 dB bandwidth
• Power density
• Occupied bandwidth
• Adjacent channel power
• EDR spurious emissions
• Modulation characteristics
• Initial carrier frequency tolerance
• Carrier frequency drift and drift Rate
• Burst profile
• Modulation accuracy
• CW measurements
• Receive Sensitivity (BER)using loopback
The Bluetooth® measurement suite is suitable for characterizing
devices operated in test mode. Measurement results for burst length,
position, rise and fall times and power are provided for the entire
packet as well as the individual GFSK and PSK modulated elements
within the packet. For PSK modulation, the DEVM is reported
together with max frequency error and origin offset. Time domain
trace displays are provided for burst power, GFSK frequency
deviation and DEVM. Additionally PSK modulation can be viewed as
a constellation diagram.
Receiver sensitivity (BER) test for signals adhering to Test Suite
Structure (TSS) and Test Purposes (TP) System Specification
1.2/2.0/2.0 + EDR/2.1/2.1 + EDR can be performed either in single
ended or loopback mode. In loopback mode the device is configured
to re-transmit received packets and the measurement suite performs
the measurement and displays the result. In this case receiver and
transmitter measurements can be performed concurrently.
SPECIFICATIONS
SPECTRUM ANALYZER
Frequency Span
Variable between 2 kHz to 200 MHz and zero span
Resolution 1 Hz
Resolution Bandwidth
Variable between 1 Hz to 10 MHz (depending on span)
Resolution 1 Hz
Window Type
NEBW: Gaussian 3 dB: Gaussian fixed: Blackman Harris 5 term
Zero Span Time (Search length)
Up to 333 seconds (sample rate dependent)
Resolution 4 ns
MEASUREMENTS
Channel Power and Adjacent Channel Power
Adjacent channels: 2 upper and 2 lower or user defined up to 99
Channel filter alpha: 0.0 to 1.0
Channel spacing: up to 15 MHz
Channel width: up to 25 MHz
Occupied Bandwidth (OBW)
Percentage range: 1% to 99.99%
N Peaks
Frequency and power output for up to 10 signal peaks sorted in orderof descending power
Average Power
The RMS average power over the selected search length
Markers
4 markers plus delta marker
Marker Functions
Marker power and frequency with peak search, next peak, peak track
Power and time
Frequency and time
Traces
Spectrum trace, Occupied bandwidth, Adjacent channel power, Power
versus time trace, Frequency versus time trace, Phase versus time.
Measurement Results
Adjacent Channel Power
Occupied Bandwidth
Average Power
Peak Values
GSM/EDGE (OPTION 152)
All specifications are defined in any GSM band between 400 MHz and
2000 MHz. GSM/EDGE BER/BLER measurements additionally require
an SGD digital RF signal generator
CONFIGURATION
The following table provides a summary of the relationship between
system and band, power control level, absolute radio frequency
channel number (ARFCN) and uplink frequency ranges.
For the very latest specifications visit www.aeroflex.com
*Note: for the PCS1900 band the PCL range 16-29 is reserved.
Burst Type
GMSK: Auto or Manual (Normal / Access)
8PSK: Normal
TSC
Uplink: Auto or Manual (0 to 7)
Path Loss Correction
Tx and Rx (dB)
Acquisition Trigger Source
Immediate (free run), Burst (video), Ext (LVDS, TTL)
Synchronisation (Auto Burst Detection)
Burst Detection threshold (dB)
Search length (ms)
Burst Timing Latency Compensation
0 to ±78.125 symbols
BER/BLER Loopback (requires 302x)(2)
GSM (Mode A/B)
Number of Speech Frames: 1 to 250
GSM (Mode C)
Number of Burst Frames: 1 to 1000
GPRS
Number of Radio Blocks: 1 to 100,000
EDGE
Number of Radio Blocks: 1 to 100,000
Downlink Signal Mode
GSM, GPRS, EDGE
EDGE Modulation and Coding Scheme
MCS1 to 9
GPRS Coding Scheme
CS1 to 4
Measurement Display Types
Spectrum (RBW 10 kHz, 30 kHz, 100 kHz)
Captured power versus time
Power Profile (complete, useful, rising, failing, guard)
Phase error versus time
EVM versus time
ORFS Relative/Absolute (Spectrum due to Modulation)
ORFS Relative/Absolute (Spectrum due to Switching)
MEASUREMENTS:
GSM / EDGE AVERAGE BURST POWER
The transmitter output power is the average value of the power over
the time that the useful information bits of one burst are transmitted
Fast Burst Power is measured without midamble synchronization.
Indication
GMSK Average burst power in dBm
EDGE, Current Avg power, long term average power or estimated long
term average power dBm
Detected burst type and TSC
Burst Timing Error (symbols)
GSM / EDGE POWER PROFILE
Measurement can be performed for upto 7 contiguous active slots, of
same modulation type.
Complete Frame
Power versus time traces
Rising/falling edge
Complete
Measurement Results
Complete Profile (Pass/Fail)
Rising/Falling part (Pass/Fail)
Complete Profile Fail time (in symbols)
Rising/Falling Fail time (in US)
Burst (each active slot)
Power versus time traces
Useful part
Guard
Measurement Results
Useful Part/Guard (Pass/Fail)
Useful Part/Guard Fail time (in symbols)
Useful Part/Guard Fail level (in dB)
Values with closest proximity to mask or worst case failure for the
complete, rising edge, falling edge, guard and useful parts of the burst.
Dynamic Range
Typically -80 dBc (for input levels >0 dBm)
Accuracy (rising falling edges)
Level: Typically ±0.1 dB/10 dB(1) (relative to peak power)
Time accuracy <0.5 μs
Accuracy (useful part)
Level: Typically ±0.02 dB (relative to peak power)
Time accuracy <0.25 symbol
Accuracy (Guard)
Level: Typically ±0.1 dB/10 dB(1) (relative to peak power)
Time Accuracy <0.25 symbol
GMSK MODULATION
GMSK phase error measurements performed for a single slot
Phase Error Range
0 to 100 RMS
0 to 400 peak
System Type Power Control
Level (PCL)
ARFCN Uplink Frequency
(MHz)
GSM400 0-31 259-293306-340
450.6-457.4
GSM700 0-31 438-511 747.2-761.8
GSM850 0-31 128-251 824.2-848.8
GSM900 0-31 0-124975-1023
890.0-914.8880.2-889.8
DCS1800 0-31 512-885 1710.2-1784.8
PCS1900* 0-1530-31
512-810 1850.2-1909.8
Indication
Results are expressed as numerical values for RMS + Peak phase
error
Traces
Peak phase error versus time
Accuracy
Typically ±0.5° rms phase error ±1.0° peak phase error
8PSK MODULATION
The minimum RMS magnitude of the error vector is calculated for a
single slot.
Burst Type
Normal only
EVM Range
0 to 20% EVM RMS
0 to 40% EVM peak
Indication
EVM % (rms and peak), phase error degrees (rms and peak), 95th
percentile EVM %, origin offset suppression, and droop
Accuracy
±0.4% RMS ±1% peak
Offset Origin Suppression Range
>20 dB to 60 dB (floor)
Offset Origin Suppression Accuracy
Typically ±0.5 dB at 33 dB
FREQUENCY ERROR
Measurements can be performed for single or multiple active slots.
The frequency error measured is the difference between the input
signal and the nominal 3030 tuned frequency.
Frequency Error Range
Typically ±300 kHz GMSK (GSM)
Typically ±100 kHz 8PSK (EDGE)
Frequency Error Accuracy
±5 Hz + (Tx freq x freq standard error)
SPECTRUM DUE TO MODULATION & SWITCHING
This measurement determines the peak power and the time gated
average power at up to 20 specified frequency offsets.
Burst Type
Normal
Range Offset
Up to ±10 MHz
Measurement Range (typical)
Spectrum Due to Modulation
GMSK 8PSK
Carrier Frequency 1 GHz 2 GHz 1 GHz 2 GHz
Frequency Offset dBc dBc dBc dBc
100 kHz -76 -70 -73 -67
200 kHz -81 -75 -78 -72
250 kHz -82 -76 -79 -73
400 kHz -83 -77 -80 -74
1.8 MHz -84 -79 -81 -76
6 MHz -85 -79 -82 -76
Spectrum Due to Switching
GMSK 8PSK
Carrier Frequency 1 GHz 2 GHz 1 GHz 2 GHz
Frequency Offset dBc dBc dBc dBc
400 kHz -73 -67 -70 -64
1.8 MHz -74 -69 -71 -66
Indication
Table of values;
Reference power (dBm), frequency offset (Hz) and level (dBc) relative
to reference power
Accuracy
Typically ±0.05 dB/10 dB(1)
BLER
Measurement Results
Block Error Rate (%)
Number of Radio Blocks Tested
Number of Radio Blocks in Error
Number of Active Slots Analyzed per frame
BER, BER II, RBER II, FER
Measurement Results
Mode C burst loopback
Number of bits examined
Number of error bits found
Bit Error Rate (%)
Mode A/B Speech loopback
Number of frames examined
Erased Speech Frames
Speech Frame Erasure Rate (%)
Notes
(1) Excluding the effects of noise
(2) For EDGE or GPRS BLER, the loopback mode is not selectable
For the very latest specifications visit www.aeroflex.com
UMTS UL (OPTION 152)
All specifications are defined in all WCDMA 3GPP FDD bands.
CONTROL PARAMETERS
Scrambling Code
0 to 10000
Power Control Mode
Disable/Drive to level
Analysis Mode
Random or specific slot
Specific Slot Number: 0 to 14
DPCCH Slot Format
0 to 3
SLOT POWER
Measurement Range
Up to +30 dBm at digitizer input
Indication
Average Power in dBm
Slot Power in dBm (random or specific)
OCCUPIED BANDWIDTH
Measurement of the bandwidth containing 99% of the total power of
the transmitted spectrum
Indication
Hz
Accuracy
<100 kHz
SPECTRUM EMISSION MASK
The spectral density of the transmitted signal should lie within the
relevant spectral mask for each WCDMA 3GPP FDD band or a user
defined mask.
Measurement BW
30 kHz and 1 MHz depending on frequency offset
Measurement Range
±12.5 MHz
Indication
Global Pass / Fail
The worst case dBc level value and its corresponding frequency relative
to the mask
Traces
FFT power spectrum and selected mask values
PHASE DISCONTINUITY
Phase difference between measured slot and the preceeding slot
Indication
Degrees, slot number
ADJACENT CHANNEL LEAKAGE RATIO
ACLR due to modulation is the ratio of the channel power to the power
measured in the upper and lower adjacent and alternate channel.
Number Channels
Time domain: 1 to 5
Frequency domain: 1, 3, 5
Dynamic Range
Residual noise in 3.84 MHz BW: typically better than -68 dB
Indication
Reference channel power dBm
1st upper and lower adjacent channel power dBc
2nd upper and lower adjacent channel power dBc
Accuracy
<±0.05 dB/10 dB(1)
FREQUENCY STABILITY
The frequency error measured is the difference between the input
signal and the nominal 3030 tuned frequency
Frequency Error Range
±7 kHz (±3 kHz for HSPA)
Frequency Error Accuracy
<±(10 Hz + (Freq Standard Error x Transmitter Freq))
TRANSMIT MODULATION
Modulation Accuracy
Modulation accuracy results are provided for either composite modula-
tion or for QPSK modulation. Composite EVM results are provided for
either a specific or random slot number.
Composite EVM Peak/rms
In %
Residual Error
<±1%
Composite Modulation Results
Magnitude Error Peak/rms
In %
Frequency Error
In Hz
Phase Error Peak/rms
In degrees
IQ Gain Imbalance
In dB
IQ Skew
In degrees
Carrier Leak
In dB
Slot Timing
In ms
HS-DPCCH Timing Offset
PEAK CODE DOMAIN ERROR
Code domain errors are computed over user specified spreading factor.
The peak code domain errors are defined as the maximum values for
the computed code domain errors. The measurements interval is 1 slot
(2560 chips).
CDE Spreading Factor
2,4,8,16,32,64,128,256
Trace
Power(dBc) versus code for I and Q channels
Results
Peak code domain error for I and Q channels (in dB)
CCDF
Complimentary cumulative distribution function
Trace
Peak to average power (dB) versus probability (%)
DEMODULATED SYMBOLS
Symbol data is available for each active channel
Channel Types
DPCCH
DPDCH1 to 6
HS-DPCCH
E-DPCCH
E-DPDCH1 to 4
CHANNEL DETECTION RESULTS
Spreading Factor
Code number
Gain factor
Number of bits
Branch: I/Q
TX SLOT TIMING ERROR
Measured relative to an external trigger input with a result expressed in
samples
CODE DOMAIN POWER
Code domain power is computed providing dBc readings for 256
orthogonal channels.
Indication
Code domain power versus code number
ILPC (Inner Loop Power Control)
The purpose of the measurement is to ensure that the User Equipmentbeing tested is able to respond accurately to Power Control Commandsgiven by the Radio Base Station.
SETUP
Test Segment
ABC (Power Control Algorithm 2, 1 dB step size)
EF (Power Control Algorithm 1, 1 dB step size)
GH (Power Control Algorithm 1, 2 dB step size)
Initial Power Tolerance
1 to 10 dB
Measurement Results
ILPC Absolute Power Vs. Slot Table
Slot No
Slot Power (dBm)
Step (Pass/Fail)
Ten Step (Pass/Fail)
ILPC Relative Power Vs. Slot Table
Slot No
Step Power (dB)
Step (Pass/Fail)
Ten Step Power (dB)
Ten Step (Pass/Fail)
ILPC Overall
Result (Pass/Fail)
Fail Reason
ILPC Power
Max Power (dBm)
Min Power (dBm)
Traces
ILPC Relative Power vs. Slot
ILPC Absolute Power vs. Slot
ILPC Relative Power vs. Slot (10 steps).
BER
Measurement Results
Bit error rate (%)
Number of bits examined
Number of bits in error
Number of blocks examined
Number of blocks in error
Block error rate (%)
Setup
Number of DTCH blocks: Up to 100
Number of bits to compare: Up to 24,400
Reference data pattern type: all ones, all zeros, PRBS PN9 or PN15
Notes(1) Excluding the effects of noise
LTE FDD AND TDD (OPTIONS 107 AND 108)
All specifications are defined in all LTE 3GPP FDD and TDD bands. The
LTE FDD and LTE TDD are available as separate measurement suites.
CONFIGURATION
Nominal Bandwidth
1.4, 3, 5, 10, 15, 20 MHz
Subframes (link direction)
Uplink
BURST SET UP
Burst Type
Uplink PUSCH: Normal data
MEASUREMENT SET-UP
Cell ID
0 to 503
Cyclic Prefix Type
Normal or Extended
EVM Window Position
Low, Middle or High
Analysis Mode
Random slot or Specific slot
Number of Slots to Analyze
Dependent on measurement interval
Spectrum Analysis Mode(1)
Measure All IQ Data, Measure Analyzed Slots
Signal Composition(2)
Uplink and Downlink, Uplink
Uplink Cyclic Prefix Type(2)
Normal or Extended
Downlink Cyclic Prefix Type(2)
Normal or Extended
Uplink-Downlink Configuration(2)
1 to 6 (as defined in table 4.2-2 of 3GPP TS36.211 v8.6.0 (2009-
03))
Special Subframe Configuration (2)
1 to 8 (as defined in table 4.2-1 of 3GPP TS36.211 v8.6.0 (2009-
03))
Synchronization Slot (for specific slot analysis only)
0 to 19
For the very latest specifications visit www.aeroflex.com
Half Subcarrier Shift
On/Off
DTX Present(1)
On/Off
PILOT TRACKING
Phase Tracking
On/Off
Amplitude Tracking
On/Off
Symbol Time Tracking
On/Off
PUSCH SETUP
PUSCH Present
On/Off
DMRS Dss
0 to 29
n(1)DMRS
0,2,3,4,6,8,9,10
PUCCH SETUP
PUCCH Present
On/Off
Delta Shift Dss
1 to 3
Cyclic Shift
0 to 7
Resource Index 2
0 to 1175
Number of Reserved Resource Blocks
1 to 503
SRS SETUP
SRS Present
On/Off
Cyclic Shift
0 to 7
Transmission Combination
0 to 1
Slot Configuration
RB Auto Detect
On/off
Channel Type
OFF, PUSCH, PUCCH
Number of RBs
1 to max number of RBs for selected Bandwidth
RB Offset
0 to max-1
Modulation Type
QPSK, 16QAM, 64QAM
n(2)DMRS
0,2,3,4,6,8,9,10
POWER
Indication
dBm
Trace
Captured power vs. time
Power vs slot
Power vs resource block
FREQUENCY ERROR
Modulated carrier frequency error over one sub-frame excluding the
guard period (Cyclic prefix).
Indication
Hz
Accuracy
As per reference frequency
EVM
The difference between the reference waveform and the measured
waveform corrected by the sample timing offset and RF frequency
offset with origin offset removed.
Indication
%/dB
Exclude Exclusion Period
On/Off
Traces
EVM (rms) vs. sub-carrier
EVM (rms) vs. symbol
EVM (rms) for non allocated RB
Constellation (with/without non allocated carriers)
Measurement Results
EVM (rms)
EVM PUCCH (rms)
EVM PUSCH (rms)
EVM DMRS (rms)
EVM SRS (rms)
EVM Non Allocated Carriers
Indication
%
Accuracy
<-40 dB residual EVM
IQ COMPONENT
IQ Origin Offset (in dB)
IQ gain imbalance (in dB)
IQ skew (in degrees)
Symbol Clock Error
Indication
ppm
SPECTRUM FLATNESS
Mask Type
Normal conditions
Extreme conditions
User defined
Indication
For each slot analyzed:-
Mask Pass/Fail
Mask Upper Pass/Fail
Mask Lower Pass/Fail
Traces
dBr values for each sub-carrier
SYMBOL / CHIP CLOCK TOLERANCE
Indication
ppm
Accuracy
As per reference frequency
OBW
Occupied bandwidth is defined as the bandwidth containing 99% of
the total integrated mean power of the transmitted spectrum on the
assigned channel.
Indication
Hz
SPECTRAL EMISSION MASK
The spectral density of the transmitted signal should lie within thespectral mask
The mask is frequency aligned to the maximum spectrum density
Mask Type
General, NS_03, NS_04, or NS_06
Measurement BW
As determined by Mask Type selected
Indication
Global Pass/Fail
The worst case dBc level value and its corresponding frequency
relative to the mask are reported
Traces
FFT power spectrum and mask values
ACLR
Number Channels
1 to 5
Indication
Reference channel power dBm
1st upper and lower adjacent channel power dBc
2nd upper and lower adjacent channel power dBc
Notes
(1) Available in LTE FDD only
(2) Available in LTE TDD only
CDMA2000R 1XRTT AND 1XEV-DO REV 0, A AND B(OPTION 102)
All specifications are defined when operating in cdmaOne, cdma2000
and 1xEVDO band classes BC0 to BC15.
CONTROL PARAMETERS
Long Code Mask
Long code mask range: 0 to 4,398,046,511,103
Radio Configuration Mode (cdma2000 only)
RC1/RC2 or RC3/RC4
Slot Number (1xEVDO only)
0 to 15
Subtype Configuration (1xEV-DO only)
Subtype 0, 1, 2 and 3
POWER MEASUREMENT
Channel Power
The channel power is the power measured in the 1.23 MHz
bandwidth. Channel power is measured concurrent with ACPR
measurement.
Average Power
The broadband average power is measured for a user defined
segment.
Burst Power
For bursted signals, the peak power is measured together with burst
duration, burst position, power on and power off times.
Indication
Channel power, average power, burst power in dBm
Burst duration and burst position in samples
Power on time and power off time in seconds
ADJACENT CHANNEL POWER RATIO MEASUREMENT
The power to the power measured at frequency offsets relative to the
reference channel power.
(Not supported for 1xEV-DO Subtype 3).
Offsets
4 fixed or 4 user defined
Fixed Offsets
±885 kHz, ±1980 kHz
User Offsets
Up to ±4 MHz
Dynamic Range
-82 dBc (for 303x input levels >-10 dBm)
Indication
Ref Channel Power in dBm (1.23 MHz channel bandwidth)
Offset power in dBc (30 kHz RBW)
Accuracy
Typically 0.05 dB/10 dB(1)
SPECTRAL EMISSION MASK
The power spectrum of the transmitted signal is compared to a mask.
Mask Type
Cellular, PCS, User defined.
Adjacent Carriers (1xEV-DO Subtype 3 only), Two carriers maximum
frequency separation (1xEV-DO Subtype 3 only)
For the very latest specifications visit www.aeroflex.com
Indication
Pass/fail
Frequency + dBr mask value with closest proximity to mask
Spectral trace + mask trace
Number of failed points
Accuracy
Typically 0.05 dB/10 dB(1)
TRANSMIT MODULATION
Modulation Accuracy
The modulation accuracy can be measured for composite RHO, EVM
as per 3GPP2 C.50011_A or 3GPP2 C.S0033-A.
1xEV-DO composite RHO is computed for default or user channel
settings. When set to user channel settings, RHO is measured only on
the selected channel subset.
The modulation accuracy is a measure of the difference between the
measured waveform and the theoretical modulated waveform (the error
vector).
The minimum measurement interval for composite rho / EVM is 500 μs
(cdma200 RC1/2), 3.2 ms (cdma200 RC3/4), 1xEV-DO or user
defined).
COMPOSITE RHO
Mode(1xEVDO only)
Random / Specific slot 0 to 15
rho Range
0.9 to 1
Indication
32 bit floating point
Accuracy
Better than ±0.003 for rho values between 0.9 and 1.0
Amplitude Error
In dB
Carrier Leak (Carrier Feed Through)
In dB
Time Error
In μs
EVM
Composite EVM Range
0 to 20% RMS
0 to 40% Peak
Residual Error
Typically 1%
Magnitude Error Peak/rms (2)
In dB
Phase Error Peak/rms (2)
In degrees
ORIGIN OFFSET
Range
0 to 20%
Residual Error
Typically 1%
FREQUENCY ERROR
The frequency error is derived from modulation quality measurement
and is the frequency relative to the SVA tuned frequency.
Frequency Error Range
RC1-2: ±5 kHz
RC3-4: ±2 kHz
1xEV-DO: ±2 kHz
QPSK: ±10 kHz
Frequency Error Accuracy
Typically ±(10 Hz + (Freq standard error x transmitter freq))
CODE DOMAIN POWER (RC3/RC4, 1XEVDO)
Code domain power is a measure of the power in each code channel
of a CDMA channel. Code domain power gives the distribution of
signal energy among the code channels, normalized by the total signal
energy.
Indication
Pilot channel power (dB)
Data channel power (dB)
Ack channel power (dB), (1xEVDO only)
DRC channel power (dB), (1xEVDO only)
Trace
Power dBm versus code channel (dB)
Peak Code Domain Error
Code domain error is a measure of the code domain distribution oferror power, provided by a code domain power measurement of theerror signal. Peak code domain error is the largest power in the error.
Indication
Peak Code Domain Error I (dB)
Peak Code Domain Error Q (dB)
(1) Excluding the effects of noise
(2) CDMA2000 only
TD-SCDMA (OPTION 109)
All specifications are defined when operating in TD-SCDMA band
classes 0-12.
CONTROL PARAMETERS
Auto-detect Basic Midamble Code
Auto-detect Channel Configuration
Sync Mode
Pilot or Midamble
Channel Threshold and Slot Threshold
Auto or Manual (dB)
Slots to Analyze
TS0 to TS6, DwPTS (TS7) and UpPTS (TS8)
System Code Configuration
Sync downlink code
Sync uplink code
Scramble code
Basic Midamble code
Any code
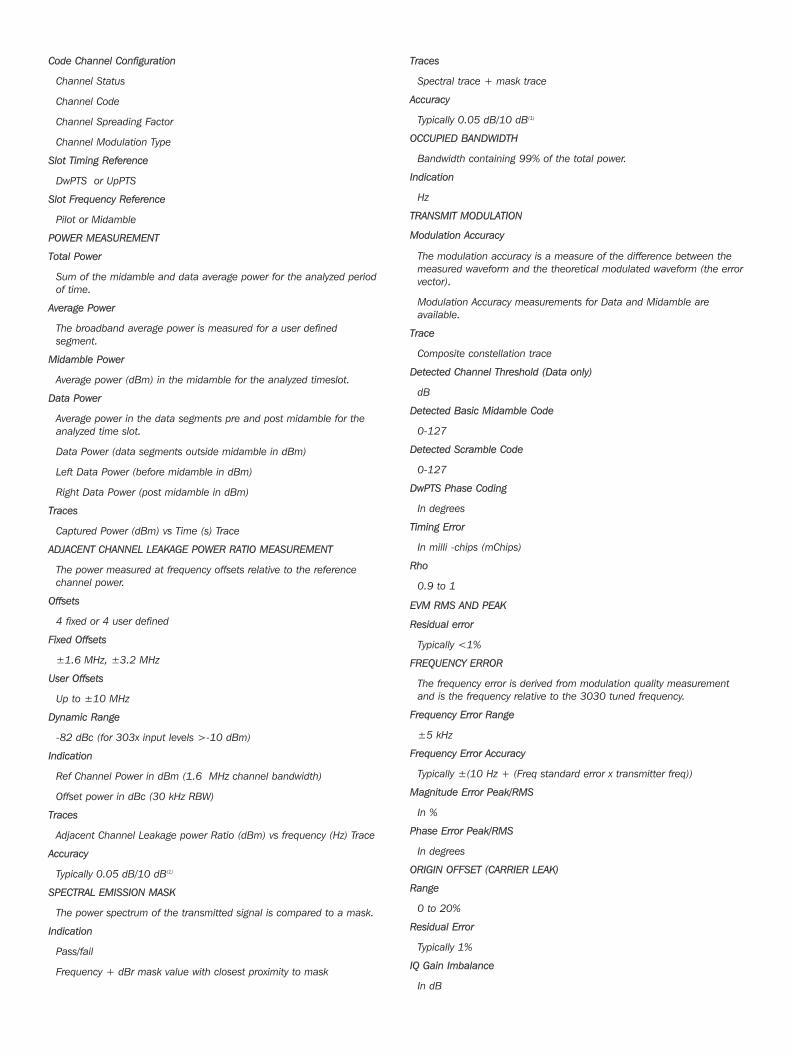
Code Channel Configuration
Channel Status
Channel Code
Channel Spreading Factor
Channel Modulation Type
Slot Timing Reference
DwPTS or UpPTS
Slot Frequency Reference
Pilot or Midamble
POWER MEASUREMENT
Total Power
Sum of the midamble and data average power for the analyzed period
of time.
Average Power
The broadband average power is measured for a user defined
segment.
Midamble Power
Average power (dBm) in the midamble for the analyzed timeslot.
Data Power
Average power in the data segments pre and post midamble for the
analyzed time slot.
Data Power (data segments outside midamble in dBm)
Left Data Power (before midamble in dBm)
Right Data Power (post midamble in dBm)
Traces
Captured Power (dBm) vs Time (s) Trace
ADJACENT CHANNEL LEAKAGE POWER RATIO MEASUREMENT
The power measured at frequency offsets relative to the reference
channel power.
Offsets
4 fixed or 4 user defined
Fixed Offsets
±1.6 MHz, ±3.2 MHz
User Offsets
Up to ±10 MHz
Dynamic Range
-82 dBc (for 303x input levels >-10 dBm)
Indication
Ref Channel Power in dBm (1.6 MHz channel bandwidth)
Offset power in dBc (30 kHz RBW)
Traces
Adjacent Channel Leakage power Ratio (dBm) vs frequency (Hz) Trace
Accuracy
Typically 0.05 dB/10 dB(1)
SPECTRAL EMISSION MASK
The power spectrum of the transmitted signal is compared to a mask.
Indication
Pass/fail
Frequency + dBr mask value with closest proximity to mask
Traces
Spectral trace + mask trace
Accuracy
Typically 0.05 dB/10 dB(1)
OCCUPIED BANDWIDTH
Bandwidth containing 99% of the total power.
Indication
Hz
TRANSMIT MODULATION
Modulation Accuracy
The modulation accuracy is a measure of the difference between the
measured waveform and the theoretical modulated waveform (the error
vector).
Modulation Accuracy measurements for Data and Midamble are
available.
Trace
Composite constellation trace
Detected Channel Threshold (Data only)
dB
Detected Basic Midamble Code
0-127
Detected Scramble Code
0-127
DwPTS Phase Coding
In degrees
Timing Error
In milli -chips (mChips)
Rho
0.9 to 1
EVM RMS AND PEAK
Residual error
Typically <1%
FREQUENCY ERROR
The frequency error is derived from modulation quality measurement
and is the frequency relative to the 3030 tuned frequency.
Frequency Error Range
±5 kHz
Frequency Error Accuracy
Typically ±(10 Hz + (Freq standard error x transmitter freq))
Magnitude Error Peak/RMS
In %
Phase Error Peak/RMS
In degrees
ORIGIN OFFSET (CARRIER LEAK)
Range
0 to 20%
Residual Error
Typically 1%
IQ Gain Imbalance
In dB
For the very latest specifications visit www.aeroflex.com
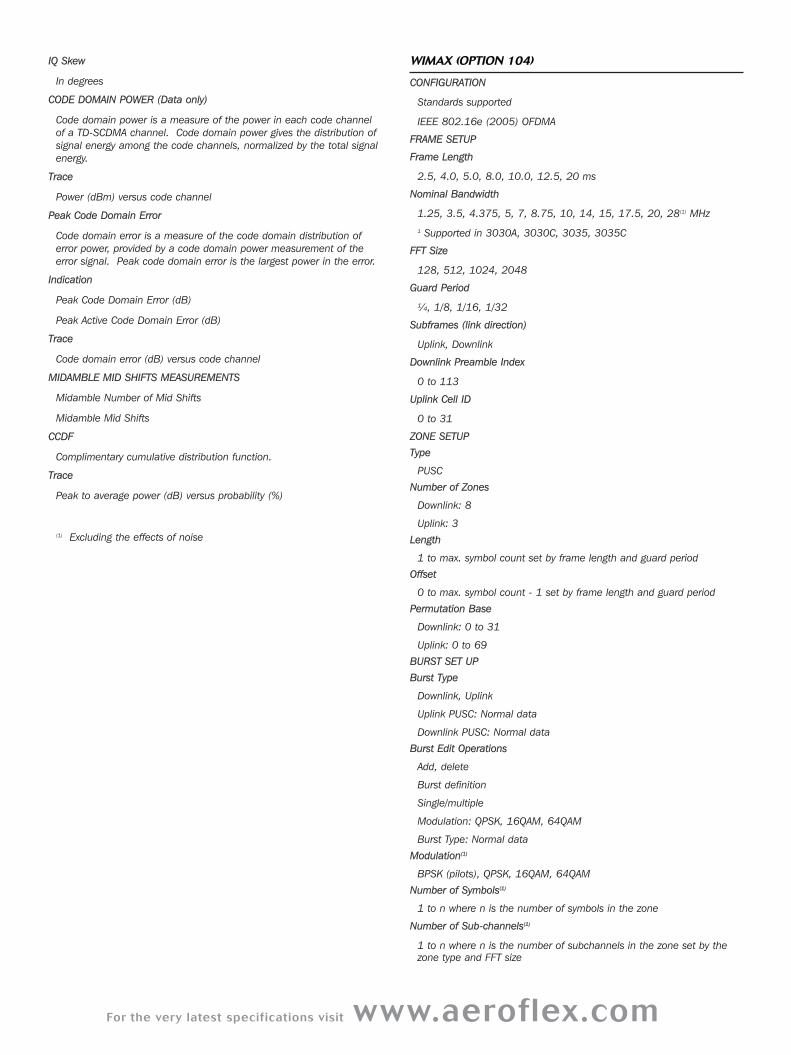
IQ Skew
In degrees
CODE DOMAIN POWER (Data only)
Code domain power is a measure of the power in each code channel
of a TD-SCDMA channel. Code domain power gives the distribution of
signal energy among the code channels, normalized by the total signal
energy.
Trace
Power (dBm) versus code channel
Peak Code Domain Error
Code domain error is a measure of the code domain distribution of
error power, provided by a code domain power measurement of the
error signal. Peak code domain error is the largest power in the error.
Indication
Peak Code Domain Error (dB)
Peak Active Code Domain Error (dB)
Trace
Code domain error (dB) versus code channel
MIDAMBLE MID SHIFTS MEASUREMENTS
Midamble Number of Mid Shifts
Midamble Mid Shifts
CCDF
Complimentary cumulative distribution function.
Trace
Peak to average power (dB) versus probability (%)
(1) Excluding the effects of noise
WIMAX (OPTION 104)
CONFIGURATION
Standards supported
IEEE 802.16e (2005) OFDMA
FRAME SETUP
Frame Length
2.5, 4.0, 5.0, 8.0, 10.0, 12.5, 20 ms
Nominal Bandwidth
1.25, 3.5, 4.375, 5, 7, 8.75, 10, 14, 15, 17.5, 20, 28(1) MHz
1 Supported in 3030A, 3030C, 3035, 3035C
FFT Size
128, 512, 1024, 2048
Guard Period
¼, 1/8, 1/16, 1/32
Subframes (link direction)
Uplink, Downlink
Downlink Preamble Index
0 to 113
Uplink Cell ID
0 to 31
ZONE SETUP
Type
PUSC
Number of Zones
Downlink: 8
Uplink: 3
Length
1 to max. symbol count set by frame length and guard period
Offset
0 to max. symbol count - 1 set by frame length and guard period
Permutation Base
Downlink: 0 to 31
Uplink: 0 to 69
BURST SET UP
Burst Type
Downlink, Uplink
Uplink PUSC: Normal data
Downlink PUSC: Normal data
Burst Edit Operations
Add, delete
Burst definition
Single/multiple
Modulation: QPSK, 16QAM, 64QAM
Burst Type: Normal data
Modulation(1)
BPSK (pilots), QPSK, 16QAM, 64QAM
Number of Symbols(1)
1 to n where n is the number of symbols in the zone
Number of Sub-channels(1)
1 to n where n is the number of subchannels in the zone set by the
zone type and FFT size
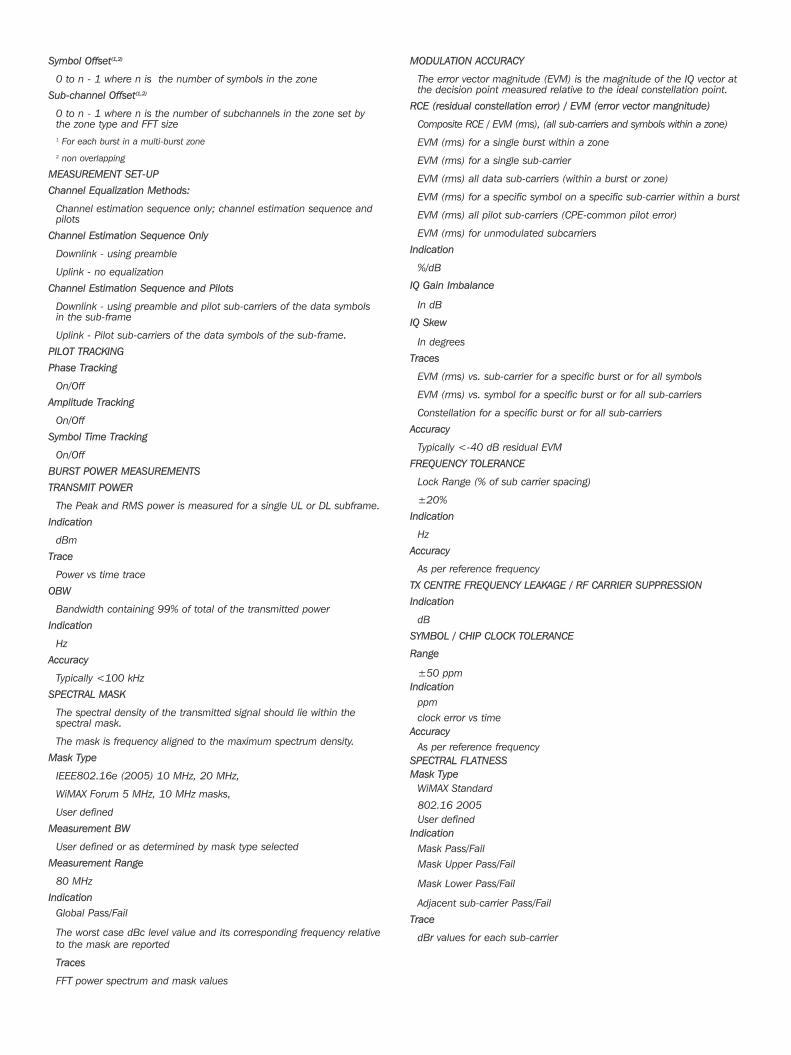
Symbol Offset(1,2)
0 to n - 1 where n is the number of symbols in the zone
Sub-channel Offset(1,2)
0 to n - 1 where n is the number of subchannels in the zone set bythe zone type and FFT size
1 For each burst in a multi-burst zone
2 non overlapping
MEASUREMENT SET-UP
Channel Equalization Methods:
Channel estimation sequence only; channel estimation sequence andpilots
Channel Estimation Sequence Only
Downlink - using preamble
Uplink - no equalization
Channel Estimation Sequence and Pilots
Downlink - using preamble and pilot sub-carriers of the data symbolsin the sub-frame
Uplink - Pilot sub-carriers of the data symbols of the sub-frame.
PILOT TRACKING
Phase Tracking
On/Off
Amplitude Tracking
On/Off
Symbol Time Tracking
On/Off
BURST POWER MEASUREMENTS
TRANSMIT POWER
The Peak and RMS power is measured for a single UL or DL subframe.
Indication
dBm
Trace
Power vs time trace
OBW
Bandwidth containing 99% of total of the transmitted power
Indication
Hz
Accuracy
Typically <100 kHz
SPECTRAL MASK
The spectral density of the transmitted signal should lie within thespectral mask.
The mask is frequency aligned to the maximum spectrum density.
Mask Type
IEEE802.16e (2005) 10 MHz, 20 MHz,
WiMAX Forum 5 MHz, 10 MHz masks,
User defined
Measurement BW
User defined or as determined by mask type selected
Measurement Range
80 MHz
Indication
Global Pass/Fail
The worst case dBc level value and its corresponding frequency relative
to the mask are reported
Traces
FFT power spectrum and mask values
MODULATION ACCURACY
The error vector magnitude (EVM) is the magnitude of the IQ vector atthe decision point measured relative to the ideal constellation point.
RCE (residual constellation error) / EVM (error vector mangnitude)
Composite RCE / EVM (rms), (all sub-carriers and symbols within a zone)
EVM (rms) for a single burst within a zone
EVM (rms) for a single sub-carrier
EVM (rms) all data sub-carriers (within a burst or zone)
EVM (rms) for a specific symbol on a specific sub-carrier within a burst
EVM (rms) all pilot sub-carriers (CPE-common pilot error)
EVM (rms) for unmodulated subcarriers
Indication
%/dB
IQ Gain Imbalance
In dB
IQ Skew
In degrees
Traces
EVM (rms) vs. sub-carrier for a specific burst or for all symbols
EVM (rms) vs. symbol for a specific burst or for all sub-carriers
Constellation for a specific burst or for all sub-carriers
Accuracy
Typically <-40 dB residual EVM
FREQUENCY TOLERANCE
Lock Range (% of sub carrier spacing)
±20%
Indication
Hz
Accuracy
As per reference frequency
TX CENTRE FREQUENCY LEAKAGE / RF CARRIER SUPPRESSION
Indication
dB
SYMBOL / CHIP CLOCK TOLERANCE
Range
±50 ppm
Indication
ppm
clock error vs time
Accuracy
As per reference frequency
SPECTRAL FLATNESS
Mask Type
WiMAX Standard
802.16 2005
User defined
Indication
Mask Pass/Fail
Mask Upper Pass/Fail
Mask Lower Pass/Fail
Adjacent sub-carrier Pass/Fail
Trace
dBr values for each sub-carrier
For the very latest specifications visit www.aeroflex.com
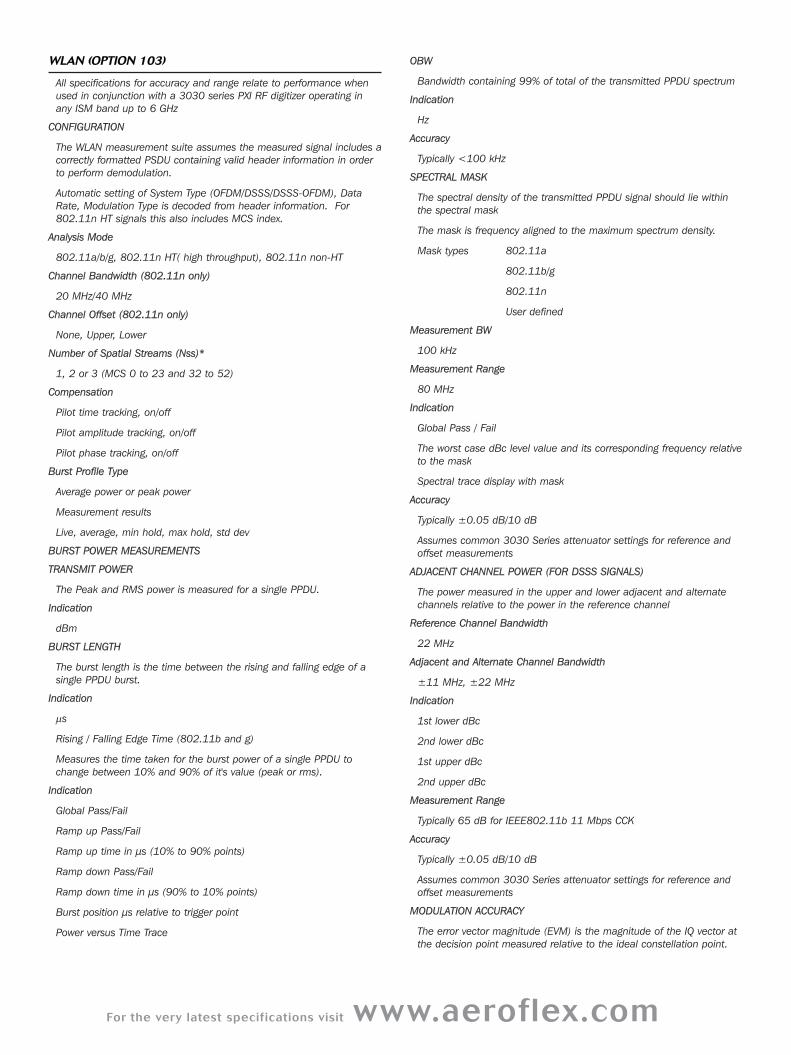
WLAN (OPTION 103)
All specifications for accuracy and range relate to performance when
used in conjunction with a 3030 series PXI RF digitizer operating in
any ISM band up to 6 GHz
CONFIGURATION
The WLAN measurement suite assumes the measured signal includes a
correctly formatted PSDU containing valid header information in order
to perform demodulation.
Automatic setting of System Type (OFDM/DSSS/DSSS-OFDM), Data
Rate, Modulation Type is decoded from header information. For
802.11n HT signals this also includes MCS index.
Analysis Mode
802.11a/b/g, 802.11n HT( high throughput), 802.11n non-HT
Channel Bandwidth (802.11n only)
20 MHz/40 MHz
Channel Offset (802.11n only)
None, Upper, Lower
Number of Spatial Streams (Nss)*
1, 2 or 3 (MCS 0 to 23 and 32 to 52)
Compensation
Pilot time tracking, on/off
Pilot amplitude tracking, on/off
Pilot phase tracking, on/off
Burst Profile Type
Average power or peak power
Measurement results
Live, average, min hold, max hold, std dev
BURST POWER MEASUREMENTS
TRANSMIT POWER
The Peak and RMS power is measured for a single PPDU.
Indication
dBm
BURST LENGTH
The burst length is the time between the rising and falling edge of a
single PPDU burst.
Indication
μs
Rising / Falling Edge Time (802.11b and g)
Measures the time taken for the burst power of a single PPDU to
change between 10% and 90% of it's value (peak or rms).
Indication
Global Pass/Fail
Ramp up Pass/Fail
Ramp up time in μs (10% to 90% points)
Ramp down Pass/Fail
Ramp down time in μs (90% to 10% points)
Burst position μs relative to trigger point
Power versus Time Trace
OBW
Bandwidth containing 99% of total of the transmitted PPDU spectrum
Indication
Hz
Accuracy
Typically <100 kHz
SPECTRAL MASK
The spectral density of the transmitted PPDU signal should lie within
the spectral mask
The mask is frequency aligned to the maximum spectrum density.
Mask types 802.11a
802.11b/g
802.11n
User defined
Measurement BW
100 kHz
Measurement Range
80 MHz
Indication
Global Pass / Fail
The worst case dBc level value and its corresponding frequency relative
to the mask
Spectral trace display with mask
Accuracy
Typically ±0.05 dB/10 dB
Assumes common 3030 Series attenuator settings for reference and
offset measurements
ADJACENT CHANNEL POWER (FOR DSSS SIGNALS)
The power measured in the upper and lower adjacent and alternate
channels relative to the power in the reference channel
Reference Channel Bandwidth
22 MHz
Adjacent and Alternate Channel Bandwidth
±11 MHz, ±22 MHz
Indication
1st lower dBc
2nd lower dBc
1st upper dBc
2nd upper dBc
Measurement Range
Typically 65 dB for IEEE802.11b 11 Mbps CCK
Accuracy
Typically ±0.05 dB/10 dB
Assumes common 3030 Series attenuator settings for reference and
offset measurements
MODULATION ACCURACY
The error vector magnitude (EVM) is the magnitude of the IQ vector at
the decision point measured relative to the ideal constellation point.
EVM
Composite EVM** (% rms) and RCE (rms dB)
EVM (% rms) and RCE (rms dB) all data carriers
EVM (% rms) and RCE (rms dB) all pilot carriers
EVM (Peak) - 802.11b/g only
Traces
Constellation display
Trace of EVM values versus sub carrier or symbol number
System Type, Modulation Type, Data Rate, Number of PSDU
bits/symbols HT format (Greenfield or Mixed), 802.11N –HT mode only
Accuracy
Typically <40 dB residual EVM
IQ Gain Imbalance
In dB
IQ Skew
In degrees
Carrier Leak
in dB
FREQUENCY TOLERANCE
Lock Range
±50 ppm
Indication
Hz
Accuracy
As per reference frequency
TX CENTRE FREQUENCY LEAKAGE / RF CARRIER SUPPRESSION
Indication
dB
SYMBOL / CHIP CLOCK TOLERANCE
Range
±50 ppm
Indication
ppm
Accuracy
As per reference frequency
SPECTRAL FLATNESS (FOR NON-DSSS SIGNALS)
Indication
Pass/Fail
Upper Pass/Fail
Lower Pass/Fail
Trace display of dBr versus sub carrier and mask
HT CROSS POWER
Support for up to two spatial streams
Indication
dBm
CCDF
Complimentary cumulative distribution function.
Trace
Peak to average power (dB) versus probability (%)
* Support for Nss = 2 or higher requires the presence of an Aeroflex
3061 RF combiner
** For all enabled antennas
BLUETOOTH® & BLUETOOTH® EDR (OPTION 106)
Performance is specified over the frequency range 2400 MHz to
2483.5 MHz when used in conjunction with any 3030 Series RF
digitizer and where applicable any 3020 series RF signal generator.
Measurements are performed in accordance with the requirements of
Bluetooth® Specification 1.2/2.0/2.0+EDR/2.1/2.1+EDR.
CONFIGURATION
Channel Number/Frequency
0 to 78 or Hz
Packet Types
DHx, 2-DHx, 2-EVx, 3-DHx (where x = 1,3, or 5), 2-EV3, 2-EV5
Payload Length
Up to 1021 bytes
Payload Bit Pattern
10101010, 11110000, PN9
Synchronisation (Demodulation)
RF burst and P0
EDR Blocks (x 50 symbols)
1 to 99999
Path Loss
In dB
BLUETOOTH® MEASUREMENTS
Output Power
Average power across a burst (dBm)
Peak power within a burst (dBm)
Accuracy
Typically ±0.3 dB
Power Density
Measurements: Peak power density (dBm) per 100 kHz
TX Output Spectrum –20 dB Bandwidth
Measurements: -20 dB bandwidth (kHz)
TX Output Spectrum Adjacent Channel Power
Measurements: Adjacent channel power(s) in ±N channels
Modulation Characteristics
Measurements: Δfavg (Hz), Δfmax (Hz)
Packet type: longest supported (DH1, DH3, DH5)
Initial Carrier Frequency Tolerance
Measurements: ICFT, carrier behaviour at burst turn on
Carrier Frequency Drift
Measurements: carrier drift (per packet), drift rate in payload (per 50
μs)
Packet Type: DH1, DH3, DH5
Payload: 10101010
For the very latest specifications visit www.aeroflex.com
BLUETOOTH® EDR MEASUREMENTS
Packet Types
2-DHx, 2-EVx, 3-DHx
EDR Relative Transmit Power
Measurements:
a) GFSK (header) Avg power (dBm)
b) PSK payload Avg power (dBm)
c) relative power (dB) between a) and b)
EDR Carrier Frequency Stability and Modulation Accuracy
Measurements: (taken per packet and EDR Blocks)
Worst case carrier frequency error (ωo) for all packets (Carrier
frequency stability)
Worst case carrier frequency error (ωi) for all blocks
(ωo+ω
i ) for all blocks
DEVM (rms & peak)
99% DEVM
Measurement uncertainties:
Frequency error, typically 2 Hz excluding frequency reference error
EDR In-band Spurious Emissions
Adjacent channel powers dBm / dBc in ±N channel (Max N =5)
GENERAL BURST ANALYSIS
Measurement Results
Burst position (leading Pav
–3 dB point relative to start of burst) μs
Burst length (between Pav
-3 dB points) μs
Burst power (Pav
and PPk
) dBm
Rise time (10% Pav
to 90% Pav
) μs
Fall time (90% Pav
to 10% Pav
) μs
Measurement Uncertainty
Burst length, Rise time, fall time <2 samples
Burst power. As per specified 303x level accuracy
OCCUPIED BANDWIDTH
Bandwidth containing 99% of total transmitted burst power
Indication
In Hz
Measurement Range
1 MHz
TRACES
Captured I&Q power (dBm) versus time
Burst power (dBm) versus time
GFSK frequency offset versus time
DPSK DEVM (%) versus symbol
DPSK measured and ideal constellation diagrams
Burst spectrum
BER
Measurement Results
Number of bits analyzed
Block error rate (%)
Number of error bits
Number of packets analyzed
Number of invalid packets
Packet error rate (%)
Number of error packets
Number of missing packets
Number of CRC error packets
Setup
Number of bits to analyze: 1 to 2,000,000
ORDERING
SVA is supplied as standard with RF Digitizer, Signal Spectrum Analyzer,
and Generic Demod.
Optional measurement suites may be purchased with the SVA at time
of order or purchased as an upgrade to the SVA.
GSM/EDGE, UMTS Uplink
When purchased with a SVA, order as: SVA option 152
When purchased as an upgrade, then order as: RTROPT152/SVA
CDMA2000 and 1xEVDO Rev A/B
When purchased with SVA, order as: SVA option 102
When purchased as an upgrade, then order as: RTROPT102/SVA
WLAN
When purchased with SVA, order as: SVA option 103
When purchased as an upgrade, then order as: RTROPT103/SVA
WiMAX
When purchased with SVA, order as: SVA option 104
When purchased as an upgrade, then order as: RTROPT104/SVA
Bluetooth®
When purchased with a SVA, order as: SVA option 106
When purchased as an upgrade, then order as: RTROPT106/SVA
LTE (FDD)
When purchased with a SVA, order as: SVA option 107
When purchased as an upgrade, then order as: RTROPT107/SVA
LTE (TDD)
When purchased with a SVA, order as: SVA option 108
When purchased as an upgrade, then order as: RTROPT108/SVA
TD-SCDMA
When purchased with a SVA, order as: SVA option 109
When purchased as an upgrade, then order as: RTROPT109/SVA

Part No. 46891/465, Issue 1, 11/11
CHINA BeijingTel: [+86] (10) 6539 1166Fax: [+86] (10) 6539 1778
CHINA ShanghaiTel: [+86] 21 2028 3588Fax: [+86] 21 2028 3558
CHINA ShenzhenTel: [+86] (755) 3301 9358 Fax: [+86] (755) 3301 9356
FINLANDTel: [+358] (9) 2709 5541Fax: [+358] (9) 804 2441
FRANCETel: [+33] 1 60 79 96 00 Fax: [+33] 1 60 77 69 22
GERMANYTel: [+49] 89 99641 0 Fax: [+49] 89 99641 160
HONG KONGTel: [+852] 2832 7988Fax: [+852] 2834 5364
INDIATel: [+91] 80 [4] 115 4501Fax: [+91] 80 [4] 115 4502
JAPANTel: [+81] (3) 3500 5591 Fax: [+81] (3) 3500 5592
KOREA Tel: [+82] (2) 3424 2719Fax: [+82] (2) 3424 8620
SCANDINAVIATel: [+45] 9614 0045 Fax: [+45] 9614 0047
SINGAPORETel: [+65] 6873 0991 Fax: [+65] 6873 0992
TAIWAN Tel: [+886] 2 2698 8058Fax: [+886] 2 2698 8050
UK StevenageTel: [+44] (0) 1438 742200Fax: [+44] (0) 1438 727601Freephone: 0800 282388
USATel: [+1] (316) 522 4981 Fax: [+1] (316) 522 1360Toll Free: 800 835 2352
w w w . a e r o f l e x . c o m
i n f o - t e s t @ a e r o f l e x . c o m
As we are always seeking to improve our products,the information in this document gives only a generalindication of the product capacity, performance andsuitability, none of which shall form part of any con-tract. We reserve the right to make design changeswithout notice. All trademarks are acknowledged. Parent company Aeroflex, Inc. ©Aeroflex 2011.
Our passion for performance is defined by three
attributes represented by these three icons:
solution-minded, performance-driven and customer-focused.


