
J. Agr. Sci. Tech. (2022) Vol. 24(2): 247-259
247
Effects of Different Types of Labor Hiring on Economic
Performance and Efficiency of Farms in Kaş District of
Antalya Province, Turkey
C. Yildrim1*
, H. Turkten1, S. Ulhaq
2, and V. Ceyhan
1
ABSTRACT
The purposes of the study were: (i) To comparatively estimate the economic
performance and productive efficiency of owner and sharecroppers in Kaş District of
Antalya Province in Turkey, (ii) To find out the factors affecting the profitability of owner
operators and sharecroppers, and (iii) To formulate the policy options in the light of
findings. Research data were collected from randomly selected 58 owner operators and 45
sharecroppers by using questionnaire. Cluster analysis was performed to select similar
sharecropper and owner operator in terms of farmers’ profile, farm income, and land
size. Data envelopment analysis (DEA) was used to estimate the efficiency measures.
Research result showed that labor cost of sample farm had largest share in total farm
expenses. The tomato and pepper yield of sharecroppers were higher than that of owners.
Net farm income of owner operator and sharecroppers per hectare were $44518.3 and
$51248.8, respectively. The mean technical, allocative and economic efficiency of owner
operators were 0.724, 0.729 and 0.528, respectively, while that of sharecroppers was 0.851,
0.598 and 0.509, respectively. Sharecroppers had higher technical efficiency score
compared to owners, but reverse was the case for allocative and cost efficiency scores.
According to the research findings, farmers can increase their technical competence, if
both owner operator and sharecropper improved their skills by participating in training
and extension programs. Implementing performance-based earning systems may
accelerate improving farmers’ technical capability. Reorganizing of farm and controlling
marketing cost may also be beneficial for increasing economic efficiency in the research
area.
Keywords: Data envelopment analysis, Greenhouse production, Production cost,
Sharecropping, Technical efficiency.
_____________________________________________________________________________ 1 Department of Agricultural Economics, Ondokuz Mayıs University, Samsun, Turkey.
2 Department of Economics and Business Administration, Division of Arts and Social Sciences, University
of Education, Lahore, Pakistan.
*Corresponding author, e-mail: [email protected]
INTRODUCTION
Labor is one of the most significant inputs in
agricultural production (Rufai et al., 2018). In
agricultural production, labor costs have an
important share in total production costs. How
it is measured and valued is critical for
establishing the cost of producing agricultural
commodities and accurately defining labor's
relative share of the total cost of production.
Knowing the values of labor force is important
in terms of controlling input usage and
planning works. Since the labor in agriculture
is critically important, many previous
researchers examined it. In literature, some
previous studies have focused on values of
labor utilization in agricultural farms (Çolak
and Erdoğan, 1991; Evcim, 1990; Özkan and
Kuzgun, 1996; Yılmaz, 1996; Esengül et al.,
2007; Çanakçı, 2009). In other dimension,
some research explored the share of labor in
total production cost. These studies reported
that labor costs constituted about 20-50% of
[ D
ownl
oade
d fr
om ja
st.m
odar
es.a
c.ir
on
2022
-03-
12 ]
1 / 13

______________________________________________________________________ Yildirim et al.
248
total production cost. Several studies have
been carried out to reveal detail information
about labor use in farms (Esengül, 1987;
Isıtan, 1990; Ünver, 1992; Tatlıdil, 1992;
Peker, 1993; Özkan, 1993; Şahin and Yıldırım,
2002; Dedeoğlu and Yıldırım, 2006). On the
other dimension, some researchers used the
labor as a restriction when eliciting optimum
farm plan (Cinemre, 1990; Tatlıdil, 1992;
Kızıloğlu, 2001; Şahin and Miran, 2008).
After entering the millennium, research related
labor has moved up to different dimension.
The agricultural labor has been modeled
econometrically in some studies (Benjamin et
al., 1996; Günden, 2005; Malchow-Møller and
Svarer, 2005; Takasaki, 2007), while some
studies have focused on labor productivity in
connection with rural development (Grantham,
1993; Hunt, 2000).
Tenant pattern has spatially differed
worldwide. The forms of farm labor in
agricultural production are completely based
on hired labor, tenant contract, exchange, and
unpaid family labor (USDA, 2016). Three
major categories of farm labor were proposed
such as hired labor without farm ownership
claims, unpaid farm labor and salaried farm
labor having ownership claims and
sharecropping. Sharecropping is the way of
farming in which a landlord gives a share to
shareholder to cultivate the land under fixed
sharing arrangements. In most of the
developing countries, the agrarian structure is
such that the land distribution is skewed, and
the proportion of small farmers is huge, as a
result, sharecropping has emerged as the
widespread phenomenon (Anwar et al., 2002;
Braido, 2006). The performance of
sharecropping contracts highly depends on the
type of contract, resource allocation and
incentives provided by the owners to
sharecroppers and contract length (Dacnet,
2007). For a long time and in many different
countries, much of agricultural production has
taken place under sharecropping, in which a
tenant supplies his labor (and perhaps some of
the other inputs) in return for a share of the
crop (Reid, 1977).
Up to now, many researchers have focused
on the relationship between productivity and
tenant pattern and tested the Marshallian
inefficiency (Bell, 1977; Shaban, 1987;
Laffont and Matoussi, 1995; Sadaulet et al.,
1997; Holden and Bezabih, 2008; Kassie and
Holden, 2008; Jacoby and Mansuri, 2009;
Ghebru and Holden, 2012; Deininger and
Goyal, 2012). The production efficiency could
be different in alternative cultivation
arrangements because of the differences in
their objectives and interests. It is commonly
believed that the production efficiency of
owner operators and sharecroppers slightly
differ, and owners are believed to be more
efficient in their production than sharecroppers
(Chaudhuri and Maitra, 2006; Khan et al.,
2008). It is, however, also believed that the
sharecropping contracts can yield better
returns depending on the contract
arrangements of costs and returns. Cost
sharing and existence of off farm employment
opportunities have positive impact on the share
received by the sharecroppers, thus have
implication on the efficiency of share cropped
farms (Delgado et al., 2003). There has been
still limited information on production
efficiency of owner operators and
sharecroppers using parametric or non-
parametric methods in literature. Especially,
lack of information on the relationship
between tenant pattern and efficiency in the
production under cover and in greenhouse is
an acute problem. Very limited information on
the relationship between tenant pattern and
efficiency measures motivated this study.
Production in greenhouse is very important
agricultural activity in Turkey due to high
level of productivity and contribution to the
unemployment reduction. Greenhouses in
Turkey covers 69.2 thousand hectares of
land, 62.8 thousand hectares of which is
allocated to vegetables production and 24%
of vegetables has been produced in Antalya
(TURKSTAT, 2016). Greenhouse farming is
an important employment area. In Turkey,
30.6% of the population live in rural areas in
Antalya. A large part of this population is
working in the agricultural sector. Labor
participation rate in Antalya is 56.4% and
above the average of Turkey. Significant
portion of the employees in agriculture are
[ D
ownl
oade
d fr
om ja
st.m
odar
es.a
c.ir
on
2022
-03-
12 ]
2 / 13
Labor Hiring and Economic Performance _______________________________________
249
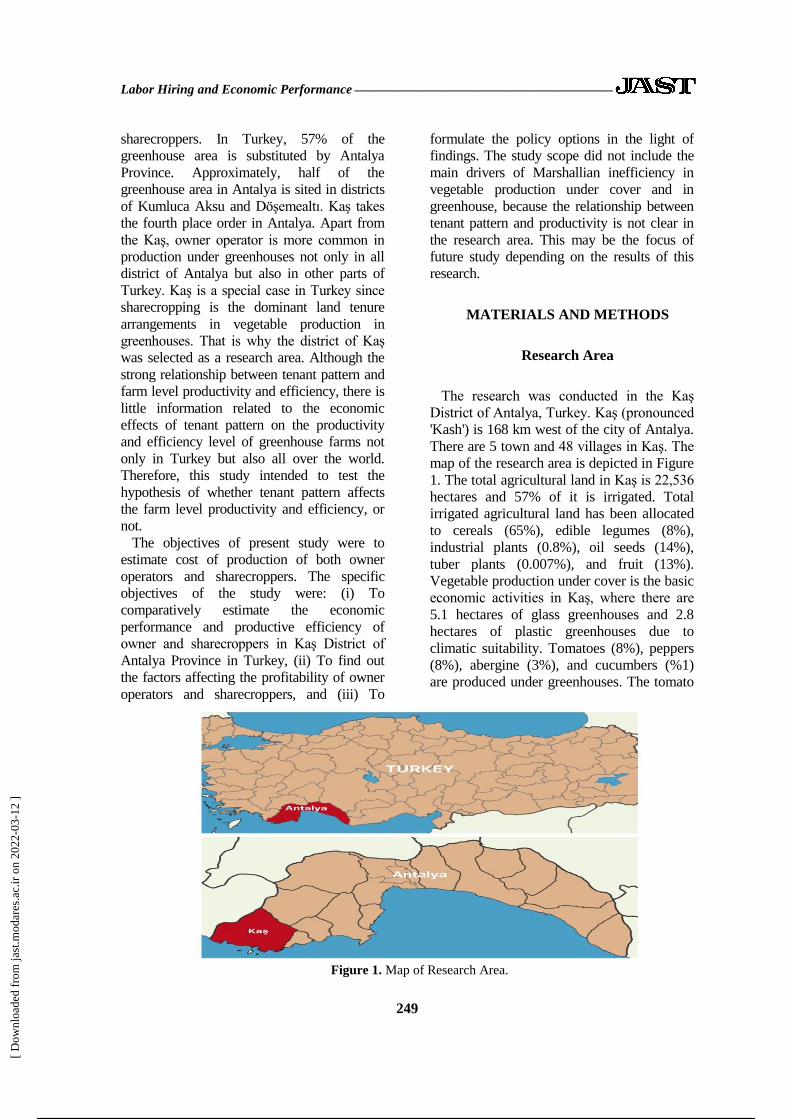
Figure 1. Map of Research Area.
sharecroppers. In Turkey, 57% of the
greenhouse area is substituted by Antalya
Province. Approximately, half of the
greenhouse area in Antalya is sited in districts
of Kumluca Aksu and Döşemealtı. Kaş takes
the fourth place order in Antalya. Apart from
the Kaş, owner operator is more common in
production under greenhouses not only in all
district of Antalya but also in other parts of
Turkey. Kaş is a special case in Turkey since
sharecropping is the dominant land tenure
arrangements in vegetable production in
greenhouses. That is why the district of Kaş
was selected as a research area. Although the
strong relationship between tenant pattern and
farm level productivity and efficiency, there is
little information related to the economic
effects of tenant pattern on the productivity
and efficiency level of greenhouse farms not
only in Turkey but also all over the world.
Therefore, this study intended to test the
hypothesis of whether tenant pattern affects
the farm level productivity and efficiency, or
not.
The objectives of present study were to
estimate cost of production of both owner
operators and sharecroppers. The specific
objectives of the study were: (i) To
comparatively estimate the economic
performance and productive efficiency of
owner and sharecroppers in Kaş District of
Antalya Province in Turkey, (ii) To find out
the factors affecting the profitability of owner
operators and sharecroppers, and (iii) To
formulate the policy options in the light of
findings. The study scope did not include the
main drivers of Marshallian inefficiency in
vegetable production under cover and in
greenhouse, because the relationship between
tenant pattern and productivity is not clear in
the research area. This may be the focus of
future study depending on the results of this
research.
MATERIALS AND METHODS
Research Area
The research was conducted in the Kaş
District of Antalya, Turkey. Kaş (pronounced
'Kash') is 168 km west of the city of Antalya.
There are 5 town and 48 villages in Kaş. The
map of the research area is depicted in Figure
1. The total agricultural land in Kaş is 22,536
hectares and 57% of it is irrigated. Total
irrigated agricultural land has been allocated
to cereals (65%), edible legumes (8%),
industrial plants (0.8%), oil seeds (14%),
tuber plants (0.007%), and fruit (13%).
Vegetable production under cover is the basic
economic activities in Kaş, where there are
5.1 hectares of glass greenhouses and 2.8
hectares of plastic greenhouses due to
climatic suitability. Tomatoes (8%), peppers
(8%), abergine (3%), and cucumbers (%1)
are produced under greenhouses. The tomato
[ D
ownl
oade
d fr
om ja
st.m
odar
es.a
c.ir
on
2022
-03-
12 ]
3 / 13

______________________________________________________________________ Yildirim et al.
250
production is 330,000 tons per year, while
that of pepper is 50,000 tons (TURKSTAT,
2016). Kaş has a special importance in
Turkey since sharecropping is dominant land
tenure arrangements in vegetable production
in greenhouses. Therefore, the main reason of
examining the district of Kaş is that nearly
half of the greenhouse operators is
sharecroppers in Kaş. Sharecroppers supply
labor, skills, and knowledge, while owners
supply land access, all agricultural tools,
machinery, irrigation tools and working
capital in the research area. The pattern of
sharecropping in Kaş is based on 20/80
sharing arrangements. When comparing the
patterns of sharecropping in the research area
with other countries in Central Asia, there are
many similarities apart from sharing
arrangements. In 19th century, tenants
supplied labor, while owners supplied
farmland, agricultural tools, water, inputs,
and food in central Asia. The patterns of
output allocation varied spatially. In general,
half of the production was allocated to tenants
in the most common form. The basic
incentives for the tenants were using
agricultural infrastructure of landlord in this
century. Changing world has produced
different patterns of tenants in central Asia. In
20th century, tenants supplied inputs, labor
and agricultural tools, while owners supplied
only land. Harvest was divided equally
among shareholders. The incentives of
tenants have also changed. Cost reduction,
risk sharing, and joint work became a basic
incentive of tenants. Beginning from the
1990’s, tenants supplied labor, skills,
knowledge, and tools while owners supplied
all production infrastructure such as land
access, machinery and irrigation tools. The
basic incentives for the tenants were gaining
fixed wages and benefiting from byproducts.
In central Asia, hybrid sharecropping was
found in both Uzbekistan and Kazakhstan
based on 50/50 and 30/70 sharing
arrangements, often related to rights for
second cropping. The free land or the land
available after the first crop is given to
workers to plant any crops they want
(Mukhamedova and Pomfret, 2019).
Research Data
Research data were collected from two
different target groups such as owner operators
and sharecroppers by using face-to-face
questionnaire during the production period of
2015. Optimum sample size for owner
operators was calculated by using simple
random sampling method. In calculation of the
optimum sample size, the precision level and
confidence level were 10 and 99%,
respectively. Based on the results of simple
random sampling, 58 owner operators out of
1080 were randomly selected using random
numbers. Regarding the sharecroppers,
structured questionnaires were administered
to all sharecroppers (45 farms) in Kaş.
The variables measured in the study were
divided into two broad groups such as farmer’s
characteristics (age, education level, farming
and greenhouse cultivation experience, and
working time at farm) and farm characteristics
(family size, operational land, tomato and
pepper land, prize, yield, farm income,
variable cost, fixed cost, total production cost,
labor costs, and sharecropping costs).
Measuring and Comparing the
Economic Performance of the Sample
Farms
The classical economic analysis procedure
was followed when calculating the annual
economic performance of the farms
managed by owner operator and farms
sharecropper. The production value, gross
farm income, gross margin and net farm
income were used as an indicator for
economic performance. Production value
was calculated by multiplying the quantity
of the produced field and animal product
with corresponding prices of the products.
The rent of the building, which was 5% of
the value of building, and the off-farm
income were summed to reach gross income.
Total production costs were expressed as the
amounts used per hectare. Total production
costs were divided into two groups: variable
and fixed costs. The variable cost included
[ D
ownl
oade
d fr
om ja
st.m
odar
es.a
c.ir
on
2022
-03-
12 ]
4 / 13

Labor Hiring and Economic Performance _______________________________________
251
costs for seed and seedling, manure,
pesticide, irrigation, electricity, version
planting, fuel, marketing, shattering-
solarization, frost protection, shading, insect
netting, rope, labor, and biological control
cost. Besides, depreciation, family labor,
sharecropper, greenhouse, building,
machinery depreciation and building repair
were included into fixed costs. Gross margin
was calculated by subtracting variable costs
from gross production value. Net farm
income was found by subtracting total
production cost from gross income. The
straight-line method was used when
calculating depreciation cost.
In this study, farm owner operators were
compared to sharecroppers in terms of
measured variables. Student t test was used
to test the mean of two farm groups. Before
comparison of these two farm groups, the
distribution of the continuous research
variables was tested whether they were
normally distributed, or not, by using
Kolmogorov Smirnov test.
Efficiency Model for Sample Farms
Cluster analysis was used to select similar
farms form the farm groups of owner
operators and that of sharecroppers in order
to set ceteris paribus conditions. The profile
of farm managers, which was created by
compounding variables such as age,
education, experience in agriculture, the
variable of greenhouse production area, and
the variable of return on equity were
included in the cluster analysis. Based on the
results of the cluster analysis, we determined
that 23 owner operators’ farms and 24
sharecropper farms were similar. Then, we
used them for measuring the efficiency
measures and comparison.
Data Envelopment Analysis (DEA), a
nonparametric method for estimating
efficiency measures, was followed to
calculate efficiency scores due to producing
good results with limited data and having
flexibility when determining the best
functional form and distribution of error
term for production frontier function (Coelli
et al., 2005). Since Stochastic Frontier
Analysis (SFA) requires a large sample size
to estimations comparing to DEA, the study
preferred to adopt DEA model to estimate
efficiency measures. The distance between
input–output ratio of the examined farm and
the input–output ratio of farm on frontier is
attributed to the relative efficiency. When
estimating the production efficiency
measures, the relative efficiency approach
suggested by Farrell (1957) was adopted in
the study. Input-orientated efficiency
measurement was preferred due to high
control capability of the sample farmers over
their inputs rather than their outputs.
Economic efficiency of sample farms
consists of Technical Efficiency (TE) and
Allocative Efficiency (AE). TE is a measure
of operators’ ability to transform inputs to
output, while AE is an indicator of an
operators’ ability to use production factors
in optimal proportions considering their
respective prices. TE was divided in two
components of Scale Efficiency (SE) and
Pure Technical Efficiency (PTE). PTE
reflects the management success of operator,
while SE is a measure of distance to
optimum production scale. The Farrell
measure equals 1 for efficient operator, and
then decreases with inefficiency (Farrell,
1957).
Based on the suggestions of Charnes et al.
(1978) and Banker et al. (1984), we assumed
that each farm produced tomato and/or
pepper (Yi) using the most important inputs
of fixed cost and variable cost (xi*). Input
oriented efficiency scores under Variable
Return to Scale (VRS) were estimated by
running the linear programming depicted
below:
Minimum λ., xi* wiT (xi
*)
Subject to -yi+Yλ ≥ 0
xi*-X λ ≥ 0
λ≥ 0
In the above equation, wi is the vector of
an input price for i-th farm; T, Transpose of
function, and xi*, input price, with output
level, yi, minimum cost of input level was
calculated via linear programming for each
[ D
ownl
oade
d fr
om ja
st.m
odar
es.a
c.ir
on
2022
-03-
12 ]
5 / 13

______________________________________________________________________ Yildirim et al.
252
farm. This equation revealed the minimum
cost under Variable Return to Scale (VRS).
Cost Efficiency for each farm was estimated
by using the formula of (CE)=
(wiT×xi
*)/(wi
T×xi). Allocative Efficiency was
calculated by using the formula of AE=
CE/TE (Coelli et all., 1998). DEAP 2.1
package program which was developed by
Coelli (1996) was used for the estimation of
efficiency level.
Statistical Analysis
The Student’s t-test was used to test the
hypothesis that means of owners and
sharecroppers were equal in terms of
research variables when comparing the
tenant patterns. Before performing t-test,
Kolmogorov Simirnov normality test was
used for checking whether each research
variable was normally distributed. Statistical
tests were performed with the Statistical
Package for the Social Sciences (SPSS).
RESULTS AND DISCUSSION
Research results revealed that the typical
farmers was 49 years old, with 7 years of
schooling, on average. There were
statistically significant differences between
the groups in terms of farming experience,
greenhouse cultivation experience and
working time at farm (p<0.05). Based on the
research findings, it was clear that
sharecroppers had much more agricultural
and greenhouse cultivation experience than
the owners. This finding confirmed the
results of previous study conducted by
Hassan et al. (2016) in Pakistan. However,
our finding related to experience did not
confirm the results of Ul Haq (2019), who
stated that experience level of sharecroppers
of tea farmers was lower compared with the
owners in Rize Province of Turkey. In the
research area, the education level of owner
operators was higher than the sharecroppers
(P< 0.10). Our findings related the education
corroborated with the results of Hassan et al.
(2016), while the reverse was the case for Ul
Haq (2019). The mean family size of owner
operator and sharecropper was about 4
persons (P> 0.10). The results of
comparative analysis showed that the
amount of farmland differed depending on
farm groups (P< 0.01). The size of farmland
in owners’ group was smaller compare to
sharecroppers in the research area.
Incoherent results were reported in some
previous studies (Hassan et al. 2016), while
the results of the study conducted by Ul Haq
(2019) corroborated with the research
finding related farmland. In the research
area, the average land allocated by owner
operator to tomato and pepper production
was 0.5 and 0.3 hectares, respectively, while
that of sharecropper was 1.6 and 0.9
hectares, respectively (P< 0.05). The
production value of tomato at owner
operator farms was greater than that of
sharecroppers (P< 0.05). Regarding the crop
yield, the tomato and pepper yield of
sharecroppers were higher than that of
owners (Table 3). This finding corroborated
with the statement of fixed-rent tenancy
gives the right incentive to achieve higher
productivity suggested by Marshall.
Similarly, Ul Haq (2019) suggested that the
productivity level of the sharecroppers was
higher than that of the owners. However,
Ahmed and Billah (2018) stated that output
of owners was larger compared to
sharecroppers in Bangladesh.
Based on the results of the economic
analysis, total production expenses per
hectare for owner operator and sharecropper
groups were $49317.9 and $35804.2,
respectively. The difference between
sharecroppers and owners in terms of total
production expenses was statistically
significant at 1% level. Results suggested by
Ul Haq (2019) for tea farmers in Turkey and
Hassan et al. (2016) for wheat farmers in
Pakistan differed from our finding. Ul Haq
(2019) and Hassan et al. (2016) stated that
total production expenses of sharecroppers
were larger than owners. About 66% of the
total production expenses was fixed cost,
while 34% of it was variable cost in both
[ D
ownl
oade
d fr
om ja
st.m
odar
es.a
c.ir
on
2022
-03-
12 ]
6 / 13

Labor Hiring and Economic Performance _______________________________________
253
owner operator and sharecropping. There
were statistically significant differences
between the owner operator and
sharecropper farmers in terms of labor cost
and sharecropping payment at farm (P<
0.01). In the research area, labor cost of
owners was higher compared to
sharecropper. This finding confirmed the
results of Ul Haq (2019) and Hassan et al.
(2016) (Table 1).
Capital structures of the sample farms are
depicted in Table 2. Total assets of the
owner operators and sharecroppers per
hectare were $409472.7 and $479549.8,
respectively. In addition, the current debt of
sharecroppers was higher than that of owner
operators. There were statistically significant
differences between the farm groups in
terms of total assets and current debt in the
research area (P< 0.01). Total asset and debt
per hectare of sharecroppers was larger than
that of owners. In both groups, the share of
the equity was approximately 91% and
difference between them was statistically
insignificant (Table 2).
Annual economic performances of the
sample farms are depicted in Table 3.
Production value of sample farms per
hectare was $66174.2, on average. All farms
benefited from government support per
hectare by $946.0 for biological pest control,
$324.3 for bumblebee and $29.7 for
fertilizer, fuel. The mean gross farm income
of owner operator and sharecropping per
hectare were $69843.8 and $58052.3,
respectively, in the research area. Regarding
the net farm income, farms owner operators
gained lower net farm income compared to
sharecropping (P< 0.01). Net farm income
of owner operator and sharecroppers per
hectare were $44518.3 and $51248.8,
respectively (Table 3). Our finding related to
net farm income confirmed the results of Ul
Haq (2019). However, the reverse was the
case in Pakistan. Hassan et al. (2016) stated
that the net revenue of sharecroppers was
larger compared to owners.
The efficiency measures varied depending
on the tenant pattern in the research area.
Efficiency analysis showed that the mean
technical efficiency scores for owners and
sharecroppers were 0.724 and 0.851,
respectively. Sharecroppers had better
technical efficiency scores than that of
owner operators (P< 0.05). The positive
relationship between technical efficiency
and tenant pattern found in the study
corroborated with the statement of
Marshallian efficiency. Similarly, Sadoulet
et al. (1997) in Philippines and Kassie and
Holden (2008) in Ethiopia reported the
positive relationship between productivity
and sharecropping. They stated that
sharecropping gave the right incentive to
achieve higher productivity and efficiency.
However, some previous studies pointed out
the presence of Marshallian inefficiency.
Ghebru and Holden (2012) in Ethiopia and
Holden and Bezabih (2008) in Ethiopia
showed the presence of Marshallian
inefficiency. Also, some studies conducted
in India, Tunisia and Pakistan explored least
partial support for Marshallian inefficiency
(Bell, 1977; Shaban, 1987; Deininger and
Goyal, 2012; Laffont and Matoussi,1995;
Jacoby and Mansuri, 2009). Jacoby and
Mansuri (2009) inferred that the presence of
unobserved plot-level characteristics and the
endogeneity of contract choice were
potential sources of bias in the background
of exploring least partial support for
Marshallian inefficiency. Based on the
results of the decomposition of technical
efficiency, the basic technical inefficiency
source was pure technical inefficiency for
both owner operator and sharecroppers,
meaning that managerial performance of
operators in the research area was lower than
expected level (Table 4).
Based on the scores of scale efficiency,
52.2% of owner operator and 91.7% of
sharecroppers had increasing returns to
scale. The percentage of the owners who had
decreasing return to scale was 34.8%, while
that of sharecroppers was 8.3%, indicating
that the scale of approximately one-third of
owners was larger than optimum scale. As
expected, none of the sharecroppers had
constant returns to scale. However, 13.0% of
the owner operator had constant returns to
[ D
ownl
oade
d fr
om ja
st.m
odar
es.a
c.ir
on
2022
-03-
12 ]
7 / 13

______________________________________________________________________ Yildirim et al.
254
Table 1. Socio- economic characteristics of sample farmers.
Owner Sharecropper
Farmers' characteristics Mean Std dev Mean Std dev
The age of the farm operator (Year) 48.1 11.0 50.6 8.6
Education level of the farm operator (Year)* 6.4 2.5 7.3 3.5
Farming experience (Year)*** 19.8 10.8 25.1 11.0
Greenhouse cultivation experience (Year) *** 17.6 8.3 23.9 10.9
Working time at farm (Months per year) ** 9.9 0.4 9.4 1.7
Farm characteristics
Family size (Person) 4.1 1.2 3.8 1.4
Farmland (ha)*** 0.4 0.4 1.3 2.6
Land allocated to tomato (ha)** 0.5 0.4 1.6 2.8
Land allocated to pepper (ha)** 0.3 0.3 0.9 0.3
Tomato price (¢ kg-1
) ** 297.3 114.2 270.3 98.1
Pepper price (¢ kg-1
) 621.6 126.2 621.6 211.3
Tomato yield (kg ha-1
) 203787.9 30285.9 205000.0 20163.8
Pepper yield (kg ha-1
) ** 111400.0 17767.0 121666.7 43550.7
Tomato production value ($ ha-1
) ** 60586.1 22572.3 55411.5 18367.5
Pepper production value (($ ha-1
) 69246.2 31131.0 75628.0 34172.7
Labor cost ($ ha-1
) *** 27886.2 21777.3 6052.8 5363.4
Shareholder payment ($ ha-1
) *** 0.0 0.0 13438.8 6760.2
*** P< 0.01, ** P< 0.05, * P< 0.10.
Table 2. Capital structures of the sample farms.
Owner Sharecropper
Capital items Mean Std dev Mean Std dev
Noncurrent assets ($ ha-1
)* 326533.2 232371.3 345064.2 230490.8
Total land capital ($ ha-1
) ** 137616.9 92946.9 184159.7 57203.5
Land improvement ($ ha-1
) ** 8550.4 4647.4 9208.0 2860.2
Building capital ($ ha-1
) 142725.0 223638.7 148474.0 213812.5
Greenhouse capital ($ ha-1
) * 37099.2 3112.7 2614.0 1820.1
Machinery capital ($ ha-1
) * 541.7 876.6 608.5 549.3
Current assets (($ ha-1
)* 82939.5 99510.9 134485.6 131173.8
Field inventory-stock ($ ha-1
) 17362.5 4946.4 12921.5 2622.4
Stock ($ ha-1
)*** 420.6 1676.5 2512.5 5689.6
Cash money ($ ha-1
)*** 57615.1 96401.1 110132.2 128135.6
Borrowed money ($ ha-1
)*** 7541.3 9333.8 8919.4 6307.1
Total assets ($ ha-1
)*** 409472.7 270101.8 479549.8 285134.0
Current debt ($ ha-1
)* 31503.7 89832.2 45499.7 68887.2
Equity ($ ha-1
)** 377969.0 267928.1 434050.1 260576.3
Total liability (($ ha-1
)*** 409472.7 270101.8 479549.8 285134.0
*** P< 0.01, ** P< 0.05, * P< 0.10.
scale. Scale efficient owner operators had
higher farm income than that of
sharecroppers due to scale advantageous
(Table 5).
Net farm income of owner operator farms
and sharecroppers having increasing return
to scale per hectare were $39682.6 and
$46433.3, respectively. Similar situation was
the case for decreasing return to scale
scenario. Net farm income of owner operator
farms and sharecroppers having decreasing
return to scale per hectare were $24247.1
and $31092.6, respectively (Table 5).
Regarding the allocative and economic
efficiencies, owners had larger allocative
and economic efficiency scores compared to
sharecroppers. The mean allocative
efficiency scores for owners and
[ D
ownl
oade
d fr
om ja
st.m
odar
es.a
c.ir
on
2022
-03-
12 ]
8 / 13

Labor Hiring and Economic Performance _______________________________________
255
Table 3. Annual economic performances of the sample farms.
Economic variables Owner Sharecropper
Mean Std dev Mean Std dev
Crop production value (1) (($ ha-1
)** 66174.2 29547.3 57381.2 27754.9
Off farm income (2) ($ ha-1
)) 2634.8 19512.2 0.0 0.0
Total agricultural support (3) ($/ha)*** 1034.8 453.2 671.1 437.0
Gross farm income (4= 1+2+3) ($ ha-1
)** 69843.8 42608.8 58052.3 29013.2
Total production expenses (5) ($ ha-1
)*** 49317.9 23223.0 35804.2 10552.8
Net output (6= 4-5) ($ ha-1
) 20165.9 46231.4 22248.1 21795.1
Family labor (7) ($ ha-1
)*** 26216.4 18227.8 6052.8 5363.4
Agricultural income (8= 6+7) ($ ha-1
)*** 46382.3 21741.0 28300.9 12364.9
Variable costs (9) ($ ha-1
)*** 16965.1 6097.5 11326.6 2611.5
Fixed costs (10) ($ ha-1
)** 32352.8 20561.6 24477.6 10084.0
Gross margin (11= 1-9) ($ ha-1
) 49209.1 30620.7 46054.6 27652.1
Opportunity cost of equity (12) ($ ha-1
) 27662.2 46231.4 29671.8 21795.1
Net farm income (13= 1-5+12) ($ ha-1
) 44518.3 37902.6 51248.8 21750.5
Cost-benefit ratio (%) 1.6 1.1 1.6 0.4
Return on asset (%)** 8.3 12.5 7.5 7.0
Return on equity (%) 6.7 29.6 9.1 9.2
*** P< 0.01, ** P< 0.05, * P< 0.10.
Table 4. Efficiency scores associated with tenant pattern.
Owner Sharecropper
Score Std dev Score Std dev
Technical Efficiency (TE)** 0.724 0.187 0.851 0.103
Allocative Efficiency (AE)** 0.729 0.197 0.598 0.116
Economic Efficiency (EE)** 0.528 0.259 0.509 0.083
Scale Efficiency (SE)** 0.876 0.119 0.575 0.176
Pure Technical Efficiency (PTE)** 0.634 0.153 0.489 0.111
** P<0.05.
Table 5. Summary of returns to scale results for sample farmers.a
Number
of the farms
Farm income
($ ha-1
)
Variable cost
(($ ha-1
)
Fixed cost
(($ ha-1
)
Net income (($
ha-1
)
N % Mean Std
dev Mean
Std
dev Mean
Std
dev Mean Std dev
Ow
ner
CRS 3 13.0 133213.
8
130293.
3 15026.3 1261.8 22427.8 22334.8 80849.2 40148.9
DRS 8 34.8 34114.8 10785.9 18631.7 3533.5 30494.1 19042.8 24247.1 13407.6
IRS 12 52.2 46556.4 12035.1 13280.9 1554.2 25301.9 14906.2 39682.6 21294.4
Sh
arec
rop
per
DRS 2 8.3 17863.7 4765.8 17504.5 4096.1 16303.4 1910.3 31092.6 15010.6
IRS 22 91.7 39749.0 25033.4 10797.0 922.7 26339.2 9580.2 46433.3 24526.1
a CRS: Constant Returns to Scale, DRS: Decreasing Returns to Scale, IRS: Increasing Returns to
Scale.
[ D
ownl
oade
d fr
om ja
st.m
odar
es.a
c.ir
on
2022
-03-
12 ]
9 / 13

______________________________________________________________________ Yildirim et al.
256
sharecroppers were 0.729 and 0.598,
respectively, while that of economic
efficiency were 0.528 and 0.509,
respectively. Even though owner operator
had better efficiency scores, their net profit
was relatively low due to having less total
production expenses compared to owner
operator. It was clear based on the results of
the efficiency analysis that the reason behind
the low-level allocative and economic
efficiency was weakness of operators in
monitoring the input markets in both groups
in the research area (Table 4).
CONCLUSIONS
In this research, the socio- economic
characteristics, capital structures and annual
economic performance of sharecropping and
owner operator in vegetable production in
greenhouse were compared. The results of
the study suggest that economic
performance and productivity of owner
operator was lower than that of
sharecroppers due to high production cost.
Therefore, owners’ net income was low
compared to sharecroppers, resulting in
having lower level of technical efficiency.
Regarding productivity and technical
efficiency, it was clear that there was no
Marshallian inefficiency in the research area
since productivity and technical efficiency
level of sharecroppers was higher than the
owner ones. However, the reverse was the
case for the allocative and economic
efficiency scores. In the light of the research
finding, if inefficient sharecroppers reduced
their input cost by 49% in vegetable
production, sharecroppers would become
economically full efficient. The labor cost of
owners was about twice that of farms
sharecroppers in the research area and this
made the owners turn to sharecropping as a
special tenant pattern. The study also
explored the need of increasing production
scale of farms to reach optimum production
level, indicating that land size affected the
landlord switching preference to
sharecropping. In this context, the provision
of low-cost crop management technologies
and labor use may also be helpful to reduce
production cost. Based on the results, it can
be recommended that there need appropriate
support of the government and community
as well to improve the productivity of
agricultural land via increasing labor use
efficiency. Also, farmers can increase their
technical competence, if both owner
operator and sharecropper improved their
skills via participating in training and
extension programs. Implementing
performance-based earning systems may
accelerate improving farmers’ technical
capability. Reorganizing farm and
controlling marketing cost may also be
beneficial for increasing economic
efficiency in the research area. Future
studies focusing on the tenant patterns in a
detail and main determinants of economic
inefficiency.
REFERENCES
1. Ahmed, M. F. and Billah, M. M. 2018.
Impact of Sharecropping on Rice
Productivity in Some Areas of Khulna
District. Bangladesh Journal of Agricultural
Research, 43(3): 417-430.
2. Anwar T.S., Qureshi, K. and H. Ali. 2002.
Landlessness and Rural Poverty in Pakistan.
Pak. Dev. Rev., 35(4): 1-20.
3. Banker, R. D., Charnes, A. and Cooper, W.
W. 1984. Models for Estimating Technical
and Scale Efficiencies. Manage. Sci., 30:
1078-1092.
4. Bell, C. 1977. Alternative Theories of
Sharecropping: Some Tests Using Evidence
from Northeast India. J. Dev. Stud., 13(4):
317-346.
5. Benjamin, C., Corsi, A. and Guyomard, H.
1996. Modelling Labor Decisions of French
Agricultural Households. Appl. Econ.,
28(12): 1577-1589.
6. Braido, L. H. B. 2006. Insurance and
Incentives in Sharecropping. In:
“Forthcoming in Competitive Failures in
Insurance Markets”, (Eds.): Chiappori, P-A.
and Gollier, Ch. Working Paper Version,
MIT Press.
7. Çanakcı, M. and Akıncı, İ. 2009. Antalya İli
Sera Sebze Yetiştiriciliğinde Uygulanan
[ D
ownl
oade
d fr
om ja
st.m
odar
es.a
c.ir
on
2022
-03-
12 ]
10 / 13

Labor Hiring and Economic Performance _______________________________________
257
Tarımsal İşlemler ve İnsan İşgücü Kullanımı.
J. Agric. Machin. Sci., 5(2): 193-202.
8. Charnes, A., Cooper, W. W. and Rhodes, E.
1978. Measuring the Efficiency of Decision
Making Units. Eur. Rev. Agric. Econ., 49:
429-444.
9. Chaudhuri, A. and Maitra, P. 2006. Share
Cropping Contracts in Rural India: A Note. J.
Contemp. Asia, 30(1): 99-107.
10. Cinemre, H. A. 1990. Şanlıurfa (Akçakale) Tarımsal Üretim Planlaması. Doktora Tezi,
Fen ilimleri Enstitüsü, Anakara
Üniversitesi, 188s.
11. Coelli, T. 1996. A Guide to DEAP Version
2.1: A Data Envelopment Analysis
(Computer) Program. CEPA Working Paper
96/08, Department of Economics, Universty
of New England, Armidale.
12. Coelli, T. 1998. A Multi-Stage Methodology
for the Solution of Orientated DEA Models.
Oper. Res. Lett., 23(3-5): 143-149.
13. Coelli, T., Rao, D. S. P., O'Donnell, C. J. and
Battese, G. E. 2005. An Introduction to
Efficiency and Productivity Analysis.
Springer Science & Business Media.
14. Çolak, A. and Erdoğan, D. 1991. Tarla itkileri Tarımında İnsan İşgücü
Gereksiniminin, Mekanizasyon Açısından
Değerlendirilmesi. Ziraat Fakültesi Yayınları
No: 1207, Ankara Üniversitesi, Ankara.
15. DACNET. 2007. Country-Wise Normal Area,
Production and Productivity of Wheat: Wheat
Production. Directorate of Wheat
Development, Ministry of Agriculture, Deptt.
Agric. & Coop. Ghaziabad, Uttar Pradesh,
India.
16. Dedeoğlu, M. and Yıldırım, İ. 2006. Emek Tarımsal Kalkınma Kooperatifine Ortak
Işletmelerin Ekonomik Analizi.
Bilimleri Dergisi (J. Agric. Sci.), 16(1): 39-
48.
17. Deininger, K. and Goyal, A. 2012. Going
Digital: Credit Effects of Land Registry
Computerization in India. J. Develop. Econ.,
99(2): 236-243.
18. Delgado, C. L., Narrod, C. A and Tiongco,
M. M. 2003. Project on Livestock
Industrialization, Trade and Social-Health-
Environment Aspects in Developing
Countries. Final Research Report of Phase II.
Submitted to Food and Agricultural
Organization (FAO) of United States by
IFPRI.
19. Esengül, K. 1987. Tokat İli Merkez İlçesi Tarım İşletmelerinde İşgücü Varlığı ve
Değerlendirme Durumu Üzerine ir
Araştırma. Yüksek isans Tezi, Fen ilimleri
Enstitüsü, Cumhuriyet Üniversitesi, 87s.
20. Esengül, K., Gündüz, O. and Gülistan, E.
2007. Input-Output Energy Analysis in Dry
Apricot Production of Turkey. Energy
Convers. Manag., 48: 592-598.
21. Evcim, Ü. 1990 Tarımsal Mekanizasyon İşletmeciliği ve Planlaması Veri Tabanı.
Ziraat Fakültesi Yayınları No: 495, Ege
Üniversitesi, ornova, İzmir.
22. Farrell, M. J. 1957. The Measurement of
Productive Efficiency. J. R. Stat. Soc. Ser. A
Stat. Soc., 120(3): 253-281.
23. Ghebru, H. H. and Holden, S. T. 2012.
Reverse Share-Tenancy and Marshallian
Inefficiency: Bargaining Power of
Landowners and the Sharec opp ’
Productivity. Centre for Land Tenure Studies
Working Paper No. 02/12, Norwegian
University of Life Sciences (NMBU).
24. Grantham, G. W. 1993. Divisions of Labor:
Agricultural Productivity and Occupational
Specialization in Pre-Industrial France. Econ.
Hist. Rev., 46(3): 478-502.
25. Günden, C. 2005. ireysel İşletme, Grup ve ölge azında Uygulamaya Elverişli Esnek
Üretim Planlarının ulanık Çok Amaçlı
Doğrusal Programlama Yöntemiyle Elde
Edilmesi Üzerine ir Araştırma: İzmir İli
Torbalı İlçesi Örneği. Doktora Tezi, Fen
ilimleri Enstitüsü, Ege Üniversitesi, 441s.
26. Hassan, S., Mahmood, I., Qasim, M., Zahra,
N. and Ali, M. 2016. Comparative Economics
of Owner Operators and Sharecroppers In
Wheat Farming Arrangements: A Case Of
Rawalpindi District In Pakistan. J. Agric.
Res., 54(1).
27. Holden, S. T. and Bezabih, M. 2008. Gender
and Land Productivity on Rented Land in
Ethiopia. “The Emergence of Land Markets
in Africa: Impacts on Poverty, Equity and
Efficiency”. Resources For the Future Press,
Routledge, PP. 179-196.
28. Hunt, R. C. 2000. Labor Productivity and
Agricultural Development: Boserup
Revisited. Hum. Ecol., 28(2): 251-277.
29. Isıtan, D. 1990. A.Ü. Ziraat Fakültesi
Araştırma Uygulama Çiftliği Sığır ve Kuzu
esicilik Faaliyetlerinin Ekonomik Analizi ve
İşgücü İstekleri Üzerine ir Araştırma.
Yüksek isans Tezi, Fen il. Enstitüsü,
Anakara Üniversitesi, 111s.
[ D
ownl
oade
d fr
om ja
st.m
odar
es.a
c.ir
on
2022
-03-
12 ]
11 / 13

______________________________________________________________________ Yildirim et al.
258
30. Jacoby, H. G. and Mansuri, G. 2009.
Incentives, Supervision, and Sharecropper
Productivity. J. Dev. Econ., 88(2): 232-241.
31. Kassie, M. and Holden, S. T. 2008. Kinship,
Tenure Insecurity, Input Use, and Land
Productivity. “The Emergence of Land
Markets in Africa: Impacts on Poverty,
Equity, and Efficiency”. Taylor&Francis
Groups, Routledge, 197.
32. Khan M. J., Ahmad, S. and Saddozai, K.N.
2008. Economic Analysis of Wheat
Profitability in Peshawar Valley, NWFP. Pak.
J. Life Soc. Sci., 6(2): 112-117.
33. Kızıloğlu, S. 2001. Kuzgun arajından
Yararlanan Tarım Işletmelerinde Uretim
Planlaması. o o
Sempozyumu, 19-22 Eylül 2001, Adana)
Bildirileri.
34. Laffont, J. and Matoussi, M. S. 1995. Moral
Hazard, Financial Constraints and
Sharecropping in El Oulja. Rev. Econ. Stud.,
62(3): 381–399.
35. Malchow-Møller, N. and M. Svarer. 2005.
Wage–Labor Activities by Agricultural
Households in Nicaragua. J. Dev. Stud.,
41(7): 1221-1246.
36. Mukhamedova, N. and Pomfret, R. 2019.
Why Does Sharecropping Survive? Agrarian
Institutions and Contract Choice in
Kazakhstan and Uzbekistan. Comp. Econ.
Stud., 61(4): 576-597.
37. Özkan, . 1993. Aksu Sulama Projesi Alanına Giren Tarım İşletmelerinin
Ekonomik Analizi ve Ürün Desenini
Etkileyen Faktörler. Doktora Tezi, Fen
ilimleri Enstitüsü, Çukurova Üniversitesi,
215s.
38. Özkan, . and Kuzgun, M. 1996. Antalya’da Pamuk Üretim Maliyeti ve Geliri. Akd. Üniv.
Ziraat Fak. Derg., 9: 162-171.
39. Peker, K. 1993. Pasinler İlçesi Tarım
İşletmelerinde Atıl İşgücünün Tespiti ve
İşgücünü Değerlendirme İmkanları. Yüksek
isans Tezi, Fen ilimleri Enstitüsü, Atatürk
Üniversitesi, 68s.
40. Reid Jr, J. D. 1977. The Theory of Share
Tenancy Revisited-Again. J. Polit. Econ.,
85(2): 403-407.
41. Rufai, A. M., Salman, K. K. and Salawu, M.
B. 2018. Input Utilization and Agricultural
Labor Productivity: A Gender Analysis. In:
“Building a Resilient and Sustainable
Agriculture in Sub-Saharan Africa”, (Eds.):
Shimeles A., Verdier-Chouchane A., Boly A.
Palgrave Macmillan, Cham.
https://doi.org/10.1007/978-3-319-76222-7_4
42. Sadoulet, E., De Janvry, A. and Fukui, S.
1997. The Meaning of Kinship in
Sharecropping Contracts. Am. J. Agric. Econ.,
79(2): 394-406.
43. Shaban, R. A. 1987. Testing between
Competing Models of Sharecropping. J.
Polit. Econ., 95(5): 893-920.
44. Şahin, A. and Yıldırım, İ. 2002. Economic
Analysis of Sheep Farms in Center Town of
Van Province.
Derg., 12(2): 47-52.
45. Şahin, A. and Miran, . 2008. Tarım İşletmelerinde Üretim Dallarına Göre İşgücü
Kullanımının Çok oyutlu Analizi: ayındır
İlçesi Örneği. Ege Üni. Ziraat Fak. Derg.,
45(1): 37-47.
46. Takasaki, Y. 2007. Dynamic Household
Models of Forest Clearing under Distinct
Land and Labor Market Institutions: Can
Agricultural Policies Reduce Tropical
Deforestation? Environ. Dev. Econ., 12(3):
423-443.
47. Tatlıdil, F.F. 1992. Konya İli Sulu ve Kuru
Koşullardaki Tarım İşletmelerinde İşgücü,
Döner Sermaye ve Traktör Güçlerine Göre
Optimal İşletme üyüklüğün Tespiti.
Doktora Tezi, Fen ilimleri Enstitüsü,
Anakara Üniversitesi, 165s.
48. TURKSTAT, 2016. Türkiye Bitkisel Üretim
T. C. Türkiye İstatistik Kurumu,
Ankara.
49. Ul Haq, S. 2019. Factors Influencing
Shareholder Farming System in Tea
Production and Its Effects on Sustainability in
Rize Province. PhD Thesis, Agricultural
Economics, Institute of Science, Ondokuz
Mayıs University, 160 PP.
50. Ünver, E. 1992. Tekirdağ İli Merkez İlçesi Tarım İşletmelerinde İşgücü Varlığı ve
Kullanım Durumu Üzerine ir Araştırma.
Yüksek isans Tezi, Fen ilimleri Enstitüsü,
Anakara Üniversitesi, 87s.
51. USDA. 2016. The National Agricultural
Statistics Service (NASS). Agricultural
Statistics Board, United States Department of
Agriculture (USDA), Released November 17,
2016.
52. Yılmaz, İ. 1996. Antalya İlinde Serada Domates, iber ve Patlıcan Yetiştiriciliğinde
Girdi Kullanımı ve Üretim Maliyetleri.
Çukurova Üniv. Ziraat Fak. Derg., 11(4):
155-164.
[ D
ownl
oade
d fr
om ja
st.m
odar
es.a
c.ir
on
2022
-03-
12 ]
12 / 13
Labor Hiring and Economic Performance _______________________________________
259
در "کاش"اثر وع استخذام کارگر روی عولکرد اقتصادی و کارآیی هزارع در احیه
استاى آتالیا در ترکیه
س. اولحک، و و. سیهاىس. ایلذیرین، ه. ترکتي،
چکیذه
ای ػولکرد اقتصادی کارآیی تلیذی ( ترآرد هقایس1اذاف ایي پژص ػثارت تد از:)
(productive efficiency( هالکیي سام داراى )sharecroppers) کاش"در احی" ( (Kas در
( owner operator) ( تؼییي ػاهل هثر تر سدهذی اپراترای هالک2استاى آتالیا در ترکی، )
( تذیي اتخاب ا ترای اتخار سیاست هاسة تر اساس تایج ت دست آهذ. داد ای 3سام داراى، )
آری ضذ. ترای اتخاب ساهذار جوغ 45اپراتر هالک 55ایي پژص تا استفاد از یک پرسطاه از
اذاز زهیي هطات ساهذاراى اپراترای هالک ک از ظر هطخصات کطارزاى، درآهذ هسرػ،
یکذیگر تاضذ، از تحلیل خض ای استفاد ضذ. در ترآرد سج ای کارایی ، رش تحلیل پضطی داد
( ت کار رفت. تایج تحقیق طاى داد ک سی کارگری هسارع و تیطتریي سن را در سی DEAا )
اى تیطتر از هارد هرتط ت هالکیي تد. هقذار ای هسرػ داضتذ. ػولکرد گج فرگی فلفل ساهذار
دلار 5/51245 3/44515اپراترای هالک سام داراى در ر کتار ت ترتیة تراتر درآهذ خالص
44/0تد. هیاگیي کارایی ای فی، تخصیصی اقتصادی هرتط ت اپراترای هالکیي تراتر تد تا
تد. 506/0، 565/0 ،551/0اد در هرد ساهذاراى تراتر در حالیک ایي اػذ 525/0 426/0،
ساهذاراى در هقایس تا هالکاى اهتیازکارآیی فی تیطتری داضتذ لی درهرد کارآیی تخصیصی
اقتصادی ایي هقایس تر ػکس تد.. طثق تایج ت دست آهذ، چاچ ر د گر اپراتر ای هالک
هزضی تریجی ضرکت کذ هارت خد را تثد دذ، خاذ تاست ساهذار در تراه ای آ
صلاحیت فی خد را تیافسایذ. اجرای ساها کسة درآهذ تر هثای ػولکرد هوکي است تثد تاایی
فی کطارزاى را ضتاب تخطذ. تجذیذ سازهاذی هسرػ کترل سی ای تازاریاتی یس هوکي است در
کارآیی اقتصادی در هطق هطالؼ ضذ هفیذ تاضذ. افسایص
[ D
ownl
oade
d fr
om ja
st.m
odar
es.a
c.ir
on
2022
-03-
12 ]
Powered by TCPDF (www.tcpdf.org)
13 / 13


