
1
LABORATORY TESTING AND MODELING FOR STRUCTURAL PERFORMANCE OF FULLY PERMEABLE PAVEMENTS: FINAL REPORT
RESEARCH REPORT
CALTRANS DOCUMENT NO.: CTSW-RT-10-249.04
UCPRC DOCUMENT NO.: UCPRC-RR-2010-01
November 30, 2010
California Department of Transportation
Division of Environmental Analysis
Storm Water Program
1120 N Street, Sacramento, California, 95814
http://www.dot.ca.gov/hq/env/stormwater/index.ht


Laboratory Testing and Modeling for Structural Performance of Fully Permeable Pavements Final Report, November 2010
i
1. Report No.
CTSW-RT-10-249.04
2. Type of Report
Research Report
3. Report Phase and Edition
Final 4. Title and Subtitle
Laboratory Testing and Modeling for Structural Performance of Fully Permeable Pavements: Final Report
5. Report Date
November 30, 2010
6. Author(s)
D. Jones, J. Harvey, H. Li, T. Wang, R. Wu and B. Campbell
7. Caltrans Project Coordinator
Bhaskar Joshi 9. RTA No.
249 Amendment No.
8. Performing Organization Names and Addresses
Department of Civil and Environmental Engineering One Shields Avenue, EUIII University of California Davis, CA 95616
UC Davis Report Number: UCPRC-RR-2010-01
10. Contract No.
43A0249 11. Sponsoring Agency Name and Address
California Department of Transportation Division of Environmental Analysis, Storm Water Program 1120 N Street Sacramento, California, 95814
12. Caltrans Functional Reviewers
Bhaskar Joshi, DEA Karl Dreher, DEA Ram Gupta, DEA Mehdi Parvini, PPM Kee Foo, PPM Doran Glauz, PPM Agustin Perez, Construction Mike Marti, District 3
13. Supplementary Notes
Project conducted in cooperation with Department of Civil and Environmental Engineering at UC Davis
14. External Reviewers
15. Abstract
This report presents a summary of the results of laboratory testing, computer performance modeling, and life-cycle cost analysis of fully permeable pavements. The use of these types of pavement is being considered as a potential best management practice for managing stormwater on California highways. The deliverables from this research are a preliminary design procedure and an example set of catalogue-type design tables that can be used to design pilot and experimental fully permeable pavement test sections in California. The results obtained from the analyses in this study indicate that fully permeable pavements could be a cost-effective stormwater best management practice alternative as a shoulder retrofit on highways, and for maintenance yards, parking lots, and other areas with slow moving truck traffic. However, these results need to be validated in controlled experimental test sections and pilot studies before wider-scale implementation is considered. It is recommended that accelerated pavement tests and pilot studies on in-service roadways be designed, using the procedure discussed in this report, and then constructed and monitored under traffic. The findings from these full-scale experiments should be used to identify situations where fully permeable pavements are an appropriate best management practice, validate and refine the design method, undertake detailed life-cycle cost and environmental life-cycle assessments, and to prepare guideline documentation for the design and construction of fully permeable pavements. This document is not intended to be used as a guideline for the design, construction and maintenance of fully permeable pavements.
16. Key Words
Concrete, asphalt, fully permeable pavement, performance test, compaction.
17. Distribution Statement
18. No. of pages
213

Laboratory Testing and Modeling for Structural Performance of Fully Permeable Pavements Final Report, November 2010
ii
For individuals with sensory disabilities, this document is available in alternate formats upon request.
Please call or write to: Stormwater Liaison, Caltrans Division of Environmental Analysis, MS 27, P.O. Box 942874, Sacramento, CA 94274-0001, (916) 653-8896 Voice, or dial 711 to use a relay service.

Laboratory Testing and Modeling for Structural Performance of Fully Permeable Pavements Final Report, November 2010
iii
DISCLAIMER
This document is disseminated in the interest of information exchange. The contents of this report reflect
the views of the authors who are responsible for the facts and accuracy of the data presented herein. The
contents do not necessarily reflect the official views or policies of the State of California or the Federal
Highway Administration. This publication does not constitute a standard, specification or regulation. This
report does not constitute an endorsement by the Department of any product described herein.
This document is not intended to be used as a guideline for the design, construction and maintenance of
fully permeable pavements.
PROJECT OBJECTIVES
The objective of this project, titled “Laboratory Testing and Modeling for Structural Performance of
Permeable Pavements under Heavy Traffic,” is to develop preliminary designs for fully permeable
pavements in California.
This objective will be met after completion of five tasks:
1. Evaluate the structural performance characteristics of all the materials potentially used in
permeable pavement designs, namely porous asphalt, concrete, base, and subgrade materials.
2. Perform detailed performance modeling of these various designs based upon (1).
3. Develop recommended designs for subsequent accelerated pavement testing and field test
sections on the UC Davis campus which are reasonably likely to perform satisfactorily, are
constructible, and within reason, economical.
4. Based upon these designs, perform a preliminary life-cycle cost analysis (LCCA) and life-cycle
analysis (LCA) of the various options.
5. Compile all the information gathered in this study into a comprehensive final report.
This research report summarizes all of the tasks.
The objectives did not include the preparation of guidelines for the design, construction and maintenance
of fully permeable pavements, or any research into the influence of the design of fully permeable
pavements on water quality.

Laboratory Testing and Modeling for Structural Performance of Fully Permeable Pavements Final Report, November 2010
iv

Laboratory Testing and Modeling for Structural Performance of Fully Permeable Pavements Final Report, November 2010
v
TABLE OF CONTENTS
TABLE OF CONTENTS ........................................................................................................................... v
LIST OF TABLES ..................................................................................................................................... ix
LIST OF FIGURES ................................................................................................................................... xi
LIST OF TEST METHODS AND SPECIFICATIONS.......................................................................xiii
Chapter 1 Focus of the Report........................................................................................................... 1
Chapter 2 Introduction....................................................................................................................... 3
2.1 Background .............................................................................................................................. 3
2.2 Objectives................................................................................................................................. 4
2.2.1 Fully Permeable Pavement Development Program Objectives................................... 4
2.2.2 Objectives of this Project............................................................................................. 5
2.3 Companion Hydraulic Design Study........................................................................................ 6
Chapter 3 Summary of Existing Information .................................................................................. 7
3.1 Manuals and Specifications...................................................................................................... 7
3.1.1 National Asphalt Paving Association (NAPA)............................................................ 7
3.1.2 American Concrete Pavement Association (ACPA) ................................................... 8
3.1.3 Interlocking Concrete Pavement Institute (ICPI) ........................................................ 9
3.2 Relevant Literature ................................................................................................................. 10
3.3 Meetings with Industry and Caltrans......................................................................................10
3.3.1 American Concrete Pavement Association (ACPA) ................................................. 10
3.3.2 National Asphalt Paving Association (NAPA).......................................................... 10
3.3.3 Interlocking Concrete Pavement Institute (ICPI) ...................................................... 10
3.3.4 Caltrans Maintenance ................................................................................................ 10
3.3.5 Asphalt Interlayer Association .................................................................................. 11
3.3.6 Contractors ................................................................................................................ 11
Chapter 4 Materials Characterization............................................................................................ 13
4.1 Introduction ............................................................................................................................ 13
4.2 Experiment Plans.................................................................................................................... 13
4.3 Summary of Materials Characterization................................................................................. 13
4.3.1 Subgrade Soils ........................................................................................................... 13
4.3.2 Base Course Materials ............................................................................................... 28
4.3.3 Open-Graded Hot-Mix Asphalt ................................................................................. 34

Laboratory Testing and Modeling for Structural Performance of Fully Permeable Pavements Final Report, November 2010
vi
4.3.4 Open-Graded Portland Cement Concrete .................................................................. 56
4.3.5 Cast Portland Cement Concrete................................................................................. 64
Chapter 5 Performance Modeling ................................................................................................... 71
5.1 Introduction ............................................................................................................................ 71
5.2 Portland Cement Concrete Surfaced Fully Permeable Pavement........................................... 72
5.2.1 Example Results ........................................................................................................ 77
5.3 Hot-mix Asphalt Surfacing ....................................................................................................78
5.3.1 Example Results ........................................................................................................ 84
Chapter 6 Proposed Structural Design Procedure ........................................................................ 85
6.1 Introduction ............................................................................................................................ 85
6.2 Example Design Procedures................................................................................................... 86
6.2.1 Example 1: RHMA-O Shoulder Retrofit in Sacramento Area .................................. 89
6.2.2 Example 2: HMA-O Shoulder Retrofit in Los Angeles ............................................ 93
6.2.3 Example 3: PCC-O Shoulder Retrofit in Sacramento Area....................................... 97
6.2.4 Example 4: Cast PCC Maintenance Yard Service Road in Sacramento Area......... 101
6.2.5 Accelerated Pavement Test and Pilot Study Test Section Design........................... 101
Chapter 7 Life-Cycle Considerations ............................................................................................ 105
7.1 Introduction .......................................................................................................................... 105
7.2 Life-Cycle Cost Analysis ..................................................................................................... 105
7.2.1 Introduction ............................................................................................................. 105
7.2.2 Basic Elements of Life-Cycle Cost Analysis........................................................... 106
7.2.3 LCCA Analysis Software ........................................................................................ 109
7.2.4 LCCA Calculations ................................................................................................. 109
7.2.5 Comparison of Life-Cycle Costs ............................................................................. 110
7.3 Framework for Environmental Life-Cycle Assessment ....................................................... 118
7.3.1 Introduction ............................................................................................................. 118
7.3.2 Goal and Scope Definition ...................................................................................... 119
7.3.3 Life-Cycle Inventory ............................................................................................... 121
7.3.4 Impact Assessment .................................................................................................. 121
Chapter 8 Summary, Conclusions and Recommendations ......................................................... 125
8.1 Summary .............................................................................................................................. 125
8.2 Conclusions .......................................................................................................................... 125
8.3 Preliminary Recommendations for Design, Construction and Maintenance........................ 127
8.3.1 Design...................................................................................................................... 127
Laboratory Testing and Modeling for Structural Performance of Fully Permeable Pavements Final Report, November 2010
vii
8.3.2 Construction and Maintenance ................................................................................ 128
8.4 Recommendations for Future Work ..................................................................................... 129
8.4.1 Accelerated Pavement Testing and Pilot Studies .................................................... 129
8.4.2 Life-Cycle Considerations....................................................................................... 129
8.4.3 Other Pavement Type Consideration....................................................................... 129
Chapter 9 References...................................................................................................................... 131
Appendix A: HMA-O Frequency Sweep Test Results ..................................................................... 135
Appendix B: Preliminary Hydraulic Design Tables......................................................................... 139
Appendix C: Preliminary Structural Design Tables for PCC-O Surfaces ..................................... 141
Appendix D: Preliminary Structural Design Tables for Cast PCC Surfaces................................. 145
Appendix E: Preliminary Structural Design Tables for RHMA-O Surfaces with no Subbase.... 149
Appendix F: Preliminary Structural Design Tables for RHMA-O Surfaces with Subbase......... 157
Appendix G: Preliminary Structural Design Tables for G125 HMA-O Surfaces, no Subbase .... 165
Appendix H: Preliminary Structural Design Tables for G125 HMA-O Surfaces, with Subbase. 173
Appendix I: Preliminary Structural Design Tables for HMA-O Surfaces, no Subbase .............. 181
Appendix J: Preliminary Structural Design Tables for HMA-O Surfaces, with Subbase........... 189

Laboratory Testing and Modeling for Structural Performance of Fully Permeable Pavements Final Report, November 2010
viii

Laboratory Testing and Modeling for Structural Performance of Fully Permeable Pavements Final Report, November 2010
ix
LIST OF TABLES
Table 4.1: Summary of Test Plan for Subgrade Materials and Permeable Gravel Base ............................ 14
Table 4.2: Summary of Test Plan for Permeable Concrete Subbase.......................................................... 14
Table 4.3: Summary of Test Plan for Permeable Asphalt Wearing Course ............................................... 15
Table 4.4: Summary of Test Plan for Permeable Concrete Wearing Course ............................................. 16
Table 4.5: Summary of Test Plan for Precast/Cast In-Place Concrete Wearing Course ............................ 17
Table 4.6: Subgrade Soil Atterberg Limits and Classification................................................................... 19
Table 4.7: Optimum Moisture content and Maximum Density of Silt and Clay ....................................... 19
Table 4.8: Testing Sequence for Resilient Modulus of Subgrade Soil....................................................... 21
Table 4.9: Silt Subgrade: Results of Resilient Modulus Testing................................................................ 22
Table 4.10: Clay Subgrade: Results of Resilient Modulus Testing............................................................ 23
Table 4.11: Testing Sequence of Permanent Deformation for Subgrade Soil............................................ 26
Table 4.12: Triaxial Specimen Details ....................................................................................................... 31
Table 4.13: Resilient Modulus Testing Sequence (Modified from AASHTO T-307) ............................... 32
Table 4.14: Resilient Modulus Model Parameters ..................................................................................... 33
Table 4.15: Mix Designs Used in Phase 1 and Phase 2 Testing................................................................. 36
Table 4.16: Aggregate Gradations of Mixes Tested................................................................................... 37
Table 4.17: Properties of Mixes Tested...................................................................................................... 38
Table 4.18: Test Methods for Asphalt Materials........................................................................................ 39
Table 4.19: Ranked Results of Permeability, Moisture Sensitivity, and Rutting Resistance Tests............ 40
Table 4.20: Ranked Results of Raveling Resistance and Fatigue Resistance Tests. .................................. 41
Table 4.21: Ranked Results for Flexural Frequency Sweep Tests ............................................................. 41
Table 4.22: Flexural Fatigue Test Results for Three HMA-O Mixes ........................................................ 53
Table 4.23: Summary of Master Curves and Time-Temperature Relationships ........................................ 55
Table 4.24: Test Methods for PCC Materials............................................................................................. 57
Table 4.25: Phase 1 Testing Mix Proportions. ........................................................................................... 57
Table 4.26: Test Results from Preliminary Testing.................................................................................... 58
Table 4.27: Comprehensive Testing Mix Proportions. .............................................................................. 60
Table 4.28: Average Strength and Permeability Values for Comprehensive Test Specimens................... 61
Table 4.29: Average Fatigue Life Values for Comprehensive Test Specimens......................................... 61
Table 4.30: Supplementary Testing Mix Proportions. ............................................................................... 62
Table 4.31: Test Results from Supplementary Testing .............................................................................. 63

Laboratory Testing and Modeling for Structural Performance of Fully Permeable Pavements Final Report, November 2010
x
Table 4.32: Test Methods for Cast PCC Materials..................................................................................... 65
Table 4.33: Modulus of Rupture for Beams and Splitting Strength for Cylinders..................................... 67
Table 4.34: Comparison of Modulus of Rupture for Beams and Beams with Holes ................................. 68
Table 5.1: Summary of Experimental Design for Performance Modeling of PCC.................................... 73
Table 5.2: Load Spectrum Factors for PCC Structures .............................................................................. 75
Table 5.3: Summary of Experimental Design for Performance Modeling of Hot-mix Asphalt ................ 79
Table 5.4: Factors for Granular Base Stiffness Calculation in GT-Pave.................................................... 82
Table 5.5: Parameters of Uzan Model for Granular Base in GT-Pave (Alluvial) ...................................... 83
Table 5.6: Load Spectrum Factors for HMA-O Structures ........................................................................ 83
Table 6.1: Example 1 Design Chart for Hydraulic Performance (Appendix B) ........................................ 90
Table 6.2: Example 1 Design Chart for Selecting RHMA-O Thickness (Appendix E)............................. 91
Table 6.3: Example 1 Design Chart for Checking Stress-to-Strength Ratio at Top of Subgrade .............. 92
Table 6.4: Example 2 Design Chart for Hydraulic Performance (Appendix B) ........................................ 94
Table 6.5: Example 2 Design Chart for Selecting HMA-O Thickness (Appendix H) ............................... 95
Table 6.6: Example 2 Design Chart for Checking Stress-to-Strength Ratio at Top of Subgrade .............. 96
Table 6.7: Example 3 Design Chart for Hydraulic Performance (Appendix B) ........................................ 98
Table 6.8: Example 3 Design Chart for Selecting PCC-O Thickness (Appendix C) ................................. 99
Table 6.9: Example 4 Design Chart for Hydraulic Performance (Appendix B) ...................................... 102
Table 6.10: Example 4 Design Chart for Selecting Cast PCC Thickness (Appendix D)......................... 103
Table 7.1: Recommended Analysis Periods for Comparing Alternatives................................................ 106
Table 7.2: Computation of Annual Runoff Volume for Different Scenarios in Sacramento Area .......... 109
Table 7.3: Currently Available BMP Cost per Cubic Meter of Water Treated........................................ 112
Table 7.4: NPV of Currently Available BMPs per Cubic Meter of Water Treated (in 2007$)................ 113
Table 7.5: Summary of Currently Available BMP NPV Costs for Total Runoff (Sacramento Example)113
Table 7.6: NPV of Fully Permeable Pavement for Total Runoff (Sacramento Example) ....................... 114
Table 7.7: Summary of Fully Permeable Pavement NPV Costs for Total Runoff (Sacramento Example)
................................................................................................................................................................... 116

Laboratory Testing and Modeling for Structural Performance of Fully Permeable Pavements Final Report, November 2010
xi
LIST OF FIGURES
Figure 4.1: Subgrade materials grading analysis ....................................................................................... 18
Figure 4.2: Saturated hydraulic conductivity vs. compaction level of silt and clay................................... 20
Figure 4.3: Silt: Resilient modulus vs. compaction moisture content for different confining pressure..... 23
Figure 4.4: Silt: Resilient modulus vs. compaction moisture content for different deviator stresses. ....... 23
Figure 4.5: Silt: Resilient modulus vs. confining pressure. ....................................................................... 24
Figure 4.6: Clay: Resilient modulus vs. compaction. ................................................................................ 25
Figure 4.7: Clay: Resilient modulus vs. compaction moisture content for different confining pressure... 25
Figure 4.8: Clay: Resilient modulus vs. compaction moisture content for different deviator stresses. ..... 25
Figure 4.9: Clay: Resilient modulus vs. deviator stress. ............................................................................ 25
Figure 4.10: Silt: Permanent deformation using confining pressure of 14 kPa. ........................................ 27
Figure 4.11: Clay: Permanent deformation using confining pressure of 14 kPa. ...................................... 27
Figure 4.12: Photographs of aggregates indicating size distribution and shape. ....................................... 29
Figure 4.13: Grading analysis base course materials. ................................................................................ 30
Figure 4.14: Grading analysis comparison with NAPA manual materials (6)........................................... 30
Figure 4.15: Resilient modulus of base materials. ..................................................................................... 33
Figure 4.16: Permeability testing on compacted slabs............................................................................... 39
Figure 4.17: Summary plot of ranked permeability results for all mixes. .................................................43
Figure 4.18: Comparison of effect of maximum aggregate size on permeability......................................44
Figure 4.19: Comparison of effect of different binders on permeability. .................................................. 44
Figure 4.20: Comparison of effect of better compaction on permeability (4.75 mm mixes)..................... 44
Figure 4.21: Comparison of effect of different aggregate types on permeability. ..................................... 44
Figure 4.22: Summary plot of ranked HWTT results for all mixes. .......................................................... 46
Figure 4.23: Comparison of effect of maximum aggregate size on moisture sensitivity........................... 47
Figure 4.24: Comparison of effect of different binders on moisture sensitivity. ....................................... 47
Figure 4.25: Comparison of effect of better compaction on moisture sensitivity (4.75 mm mixes). ........ 47
Figure 4.26: Comparison of effect of different aggregate types on moisture sensitivity........................... 47
Figure 4.27: Summary plot of ranked shear stiffness (45°C & 70 kPa shear stress) results for all mixes. 49
Figure 4.28: Comparison of effect of maximum aggregate size on shear stiffness. .................................. 50
Figure 4.29: Comparison of effect of different binders on shear stiffness................................................. 50
Figure 4.30: Comparison of effect of different aggregate types on shear stiffness.................................... 51
Figure 4.31: Summary plot of ranked raveling resistance results for all mixes......................................... 52

Laboratory Testing and Modeling for Structural Performance of Fully Permeable Pavements Final Report, November 2010
xii
Figure 4.32: Summary of HMA fatigue life equations for fully permeable pavements. ........................... 54
Figure 4.33: Summary of flexural stiffness master curves for HMA materials. ........................................ 55
Figure 4.34: Time-temperature shift relationships for HMA materials. .................................................... 55
Figure 4.35: Gradations of six preliminary mix proportions. .................................................................... 58
Figure 4.36: Test results from preliminary testing..................................................................................... 59
Figure 4.37: Strength vs. time for comprehensive specimens. .................................................................. 61
Figure 4.38: Tensile strength vs. permeability for comprehensive specimens. ......................................... 61
Figure 4.39: Fatigue life of comprehensive specimens.............................................................................. 62
Figure 4.40: Top view of cast porous concrete pavement. ........................................................................ 64
Figure 4.41: Top view of laboratory scale cast porous beam specimen. ................................................... 65
Figure 4.42: Cast beam specimen molds. .................................................................................................. 66
Figure 4.43: Demolded cast beam specimen. ............................................................................................ 66
Figure 4.44: Horizontal stress contour after crack has propagated 0.35 in. (9.0 mm). .............................. 69
Figure 4.45: Load displacement curve for FEM model shown in Figure 4.44. ......................................... 69
Figure 4.46: Bottom view of beam with holes (RTA249-PEA-PB6) after strength test............................ 70
Figure 5.1: Pavement structures analyzed.................................................................................................. 71
Figure 5.2: Analysis process for developing structural designs for fully permeable PCC pavements. ..... 72
Figure 5.3: Example thermal gradient calculation for PCC pavements. .................................................... 74
Figure 5.4: Fatigue life of open-graded concrete pavement (PCC-O). ...................................................... 77
Figure 5.5: Analysis process for developing structural designs for fully permeable HMA pavements..... 78
Figure 5.6: Example one-third depth temperatures for hot-mix asphalt pavements. ................................. 80
Figure 5.7: Example stiffness test results of PCC-O subbase material (B2 grading). ............................... 82
Figure 6.1: Example fully permeable pavement shoulder retrofit #1. ....................................................... 87
Figure 6.2: Example fully permeable pavement shoulder retrofit #2. ....................................................... 88
Figure 7.1: NPV comparison for BMP and Fully Permeable Pavement (Low and High Cost Options). 117
Figure 7.2: Stages for life-cycle assessment. ........................................................................................... 119
Figure 7.3: Proposed framework for pavement LCA............................................................................... 123

Laboratory Testing and Modeling for Structural Performance of Fully Permeable Pavements Final Report, November 2010
xiii
LIST OF TEST METHODS AND SPECIFICATIONS
AASHTO T-11 Standard Method of Test for Materials Finer Than 75-µm (No. 200) Sieve in Mineral Aggregates by Washing
AASHTO T-27 Standard Method of Test for Sieve Analysis of Fine and Coarse Aggregates AASHTO T-89 Standard Method of Test for Determining the Liquid Limit of Soils AASHTO T-90 Standard Method of Test for Determining the Plastic Limit and Plasticity Index of
Soils AASHTO T-99 Standard Method of Test for Moisture-Density Relations of Soils Using a 2.5-kg
(5.5-lb) Rammer and a 305-mm (12-in.) Drop AASHTO T-166 Standard Method of Test for Bulk Specific Gravity of Compacted Hot Mix Asphalt
(HMA) Using Saturated Surface-Dry Specimens AASHTO T-198 Standard Method of Test for Splitting Tensile Strength of Cylindrical Concrete
Specimens AASHTO T-209 Standard Method of Test for Theoretical Maximum Specific Gravity and Density of
Hot Mix Asphalt (HMA) AASHTO T-215 Standard Method of Test for Permeability of Granular Soils (Constant Head) AASHTO T-245 Standard Method of Test for Resistance to Plastic Flow of Bituminous Mixtures
Using Marshall Apparatus AASHTO T-269 Standard Method of Test for Percent Air Voids in Compacted Dense and Open
Asphalt Mixtures AASHTO T-307 Standard Method of Test for Determining the Resilient Modulus of Soils and
Aggregate Materials AASHTO T-320 Standard Method of Test for Determining the Permanent Shear Strain and Stiffness
of Asphalt Mixtures using the Superpave Shear Tester AASHTO T-321 Standard Method of Test for Determining the Fatigue Life of Compacted Hot-Mix
Asphalt (HMA) Subjected to Repeated Flexural Bending AASHTO T-324 Standard Method of Test for Hamburg Wheel-Track Testing of Compacted Hot-Mix
Asphalt (HMA) AASHTO T-331 Standard Method of Test for Bulk Specific Gravity and Density of Compacted Hot-
mix Asphalt (HMA) using Automatic Vacuum Sealing Method AASHTO T-336 Standard Method of Test for Coefficient of Thermal Expansion of Hydraulic
Cement Concrete ASTM PS 129 Standard Provisional Test Method for Measurement of Permeability of Bituminous
Paving Mixtures Using a Flexible Wall Permeameter ASTM C-31 Standard Practice for Making and Curing Concrete Test Specimens in the Field ASTM C-39 Standard Test Method for Compressive Strength of Cylindrical Concrete Specimens ASTM C-78 Standard Test Method for Flexural Strength of Concrete (Using Simple Beam with
Third-Point Loading) ASTM D 7064 Standard Practice for Open-Graded Friction Course (OGFC) Mix Design CT-216 Method of Test for Relative Compaction of Untreated and Treated Soils and
Aggregates


Laboratory Testing and Modeling for Structural Performance of Fully Permeable Pavements Final Report, November 2010
1
Chapter 1 Focus of the Report
The California Department of Transportation (Caltrans) initiated a laboratory and modeling investigation
under Master Agreement 65A0108 to evaluate the structural performance of fully permeable pavements.
This report summarizes all the work undertaken on the project and includes information from the
following Technical Memoranda prepared at the end of specific tasks in this study, as well as from a
research report prepared as part of a companion study on hydraulic modeling of fully permeable
pavements:
Summary of Laboratory Tests to Assess Mechanical Properties of Permeable Pavement Materials (1).
Summary of a Computer Modeling Study to Understand the Performance Properties of Fully Permeable Pavements (2).
A framework for Life-Cycle Cost Analyses and Environmental Life-Cycle Assessments for Fully Permeable Pavements (3).
Hydraulic Performance Evaluation of Fully Permeable Pavements under Heavy Load and Heavy Traffic (4).
This report is organized as follows: 1. Introduction 2. Summary of existing information 3. Materials characterization 4. Structural design 5. Life-cycle considerations 6. Conclusions and recommendations 7. Appendices
The results included in this report complete all of the objectives for this project.
NOTE
This research report summarizes the laboratory testing and analysis completed to date by
the University of California Pavement Research Center on fully permeable pavements.
The preliminary design procedure and preliminary design tables should be used to design
experimental test sections, which should be monitored to evaluate performance under
typical highway loads and rainfall events. The results of this monitoring will be used to
validate or modify the tables, and to make recommendations on implementation as a
stormwater best management practice. This document should not be considered as a
guideline for the design, construction and maintenance of fully permeable pavements.

Laboratory Testing and Modeling for Structural Performance of Fully Permeable Pavements Final Report, November 2010
2

Laboratory Testing and Modeling for Structural Performance of Fully Permeable Pavements Final Report, November 2010
3
Chapter 2 Introduction
2.1 Background
Fully permeable pavements are defined for the purposes of this study as those in which all layers are
intended to be permeable and the pavement structure serves as a reservoir to store water during storm
periods in order to minimize the adverse effects of stormwater runoff. The California Department of
Transportation (Caltrans) is interested in investigating the viability and risks of fully permeable pavement
designs as a potential stormwater management best management practice (BMP).
Since the late 1970s, a variety of fully permeable pavement projects have been constructed in a number of
U.S. states for low traffic areas and light vehicles. Most of the information available in the literature is
about successes, while few failures have been reported for these applications. Observations of several
projects by the authors indicate that failures have occurred in localized areas due to clogging of the
permeable surface, and to construction processes that have resulted in severe raveling (loss of particles
from the surface) or cracking.
As noted, most applications of fully permeable pavements in North America have been for pavements that
are not subjected to high-speed traffic or truck traffic, such as parking lots, which reflects road owner
concerns about durability. Structural design methods have been empirical in nature, with little or no long-
term monitoring data to support the empiricism. Purely empirical design methods require good
comprehensive empirical data for all of the expected design conditions, which has limited the speed of
technology development for fully permeable pavements because of the high cost of learning from
inevitable failures. For this reason it is difficult for purely empirical design methods to consider different
materials, climates, subgrades, and structural cross sections because of the need for a large factorial set of
performance data that considers all of these design variable permutations. A review of design practice
across the United States (5) shows the very limited scope of current applications for fully permeable
pavements, even by the leading design firms specializing in this type of design. The limited scope of
current applications is also reflected in the recently produced National Asphalt Pavement Association
(NAPA) (6), American Concrete Pavement Association (7), and Interlocking Concrete Pavement
Institute (8) manuals for design of porous asphalt, pervious concrete pavements, and permeable
interlocking concrete pavements, respectively.

Laboratory Testing and Modeling for Structural Performance of Fully Permeable Pavements Final Report, November 2010
4
The mechanistic-empirical approach used in this project for the development of new fully permeable
pavement designs will increase the speed of technology development. The mechanistic-empirical design
development process consists of determining relevant material properties in the laboratory, and then using
them in inexpensive and risk-free computer models to evaluate pavement performance, followed by
empirical validation and calibration of failure mechanisms and performance of the most promising
designs through accelerated pavement testing and field test sections.
There is limited published data on life-cycle cost analysis (LCCA) of fully permeable pavements that
include actual costs and performance, and also little information regarding environmental life-cycle
assessments (LCA) of fully permeable pavements. There have been several analyses of comparative
initial costs for fully permeable pavements compared with conventional pavements, which indicate that
the cost of constructing fully permeable pavements is greater than the cost of conventional pavements for
residential streets; however some studies indicate that the total initial costs are similar or less because the
fully permeable pavements do not require stormwater drainage systems. All of the studies in the
literature are for slow-speed facilities with few trucks, and compare different fully permeable pavement
systems with different conventional pavements for different applications (streets, parking lots, and other
paved areas). None of the studies considered shoulder retrofit of a highway (3).
2.2 Objectives
2.2.1 Fully Permeable Pavement Development Program Objectives
The study discussed in this report is part of a larger development program being undertaken by the
University of California Pavement Research Center (UCPRC) for Caltrans with the objective of
developing guidelines, and inputs for specification language, for the appropriate use of fully permeable
pavements as a potential BMP for controlling stormwater runoff from highways, maintenance yards, rest
stops, and other pavements that Caltrans owns and manages.
This objective will be met after completion of laboratory testing to characterize the mechanical and
hydrological properties of fully permeable pavement materials, structural and hydrological performance
modeling to develop initial designs, life-cycle cost analyses and environmental life-cycle assessment
studies, and full-scale testing in the field and/or using accelerated pavement testing (using the Caltrans
Heavy Vehicle Simulator [HVS]) to validate the structural and hydrological designs, or if necessary to
calibrate them to match the observed field performance. This step-wise development process of first
performing laboratory testing and computer modeling, followed by full-scale validation with the HVS and

Laboratory Testing and Modeling for Structural Performance of Fully Permeable Pavements Final Report, November 2010
5
field test sections is the typical process being used for development of other pavement technologies for
Caltrans. Caltrans pavement designers have been involved in the process of reviewing the results of this
development process, and the planning for this current project. As with any other new pavement
technology, there is no commitment by Caltrans to implement it until the development process has
reached a point at which the uncertainties have been sufficiently addressed to reduce the risk of pilot
section failure on the state highway network to an acceptable level.
Successful completion of this project will provide Caltrans with structural design procedures,
performance estimates, life-cycle cost analyses, and an environmental life-cycle assessment framework to
compare fully permeable pavement BMPs with existing approved BMPs.
2.2.2 Objectives of this Project
The goal of the project covered in this current task order (RTA249), entitled Laboratory Testing and
Modeling for Structural Performance of Permeable Pavements under Heavy Traffic is to develop
preliminary fully permeable pavement designs that can be tested in pilot studies under typical California
traffic and environmental conditions (9). This goal will be achieved on completion of the following tasks:
1. Review the latest literature. 2. Prepare and test specimens in the laboratory for the structural properties necessary for undertaking
a mechanistic-empirical design of fully permeable pavement structures. Develop new testing methods if required to evaluate non-traditional materials. Include the materials testing properties in the Mechanistic-Empirical Pavement Design materials database developed by the University of California Pavement Research Center (UCPRC) for Caltrans.
3. Prepare additional specimens for hydraulic performance testing in the laboratory as part of the companion task order (RTA247, Laboratory Testing and Modeling for Hydraulic Performance of Permeable Pavements under Heavy Traffic).
4. Estimate pavement performance for prototype designs using the laboratory test results in pavement performance models.
5. Perform a preliminary life-cycle cost analysis and environmental life-cycle assessment of the various options.
6. Based on the results of the computer model analysis, develop detailed structural designs for HVS and field test sections that include pavement dimensions and material specifications.
This report summarizes the work undertaken in all of the tasks.
More detailed life-cycle cost analysis (LCCA) and life-cycle assessment (LCA) will need to be performed
after construction, evaluation, and performance validation of accelerated pavement test sections and field
test sections to provide more realistic initial cost information and improved maintenance and
rehabilitation cost estimates.

Laboratory Testing and Modeling for Structural Performance of Fully Permeable Pavements Final Report, November 2010
6
2.3 Companion Hydraulic Design Study
A parallel study (RTA247) was undertaken in conjunction with the study discussed in this report to
evaluate the hydraulic performance of fully permeable pavements (4).
Hydraulic performance was assessed by determining the minimum required thickness of the aggregate
base course to capture and retain stormwater during rainfall events. Performance was evaluated by
simulation under varying hydrological, material, and geometric conditions. Hydraulic simulations were
performed using the commercially available HYDRUS software, which uses unsaturated flow theory and a
finite element analysis process. The simulations were performed for three representative rainfall regions
in California using data from Eureka, Sacramento, and Riverside, and 24-hour rainfall intensity based on
actual or mechanically generated rainfall. Critical aggregate depth was determined for two-, fifty- and
one-hundred year storm recurrence duration.
Results obtained from the hydraulic simulations, which were used as inputs in developing the design
procedure described in this report, can be summarized as follows (4):
The critical aggregate reservoir layer depth to capture all the runoff generated by typical rainfall events in California ranges from less than 3.0 ft (1.0 m) to about 10 ft (3.0 m).
The minimum aggregate thickness in Eureka was about 50 percent higher than the minimum aggregate thickness required for the Sacramento and Riverside areas. Longer recurrence periods (50 and 100 years) required thicker aggregate bases (i.e., reservoir layers) compared with the two-year period. Simulations using natural rainfall required slightly thicker base layers compared to those where mechanically generated rainfall simulations were used. The use of actual data is therefore recommended to obtain a more conservative layer thickness estimation.
Saturated soil hydraulic conductivity is the most sensitive factor when determining critical aggregate layer thickness. A soil permeability of less than 10-5 cm/sec was found to be impractical for the design of fully permeable pavements.
In general, the required thickness of the aggregate base doubles with additional lanes (i.e., increasing a two-lane road to a four-lane road requires a doubling of the base layer thickness). The increase in aggregate thickness for Eureka was higher compared to Sacramento and Riverside.
If the subgrade soil is still wet from earlier rainfall events and additional rainfall occurs, then the aggregate layer thickness needs to be increased by an additional 80 percent (compared to the dry condition). Alternatively, allowance needs to be made for two or three surface overflows on an annual basis.
The critical layer thicknesses determined during 24-hour rainfall simulations were verified through annual storm event simulations. The results show that the critical aggregate thicknesses determined in the study are sufficient. A reduction in layer thickness would result in periodic overflows. These overflows will increase significantly when the subgrade soil hydraulic conductivity is less than 10-4 cm/sec.
The simulation results showed that a significant reduction in the air-voids in the pavement surface layer (i.e., severe clogging) and consequent significant reduction in the surface pavement hydraulic conductivity would be needed before the pavement would be classified as impermeable (i.e., water flows over the permeable surfacing and off the edge of the road instead of through the road).

Laboratory Testing and Modeling for Structural Performance of Fully Permeable Pavements Final Report, November 2010
7
Chapter 3 Summary of Existing Information
A number of comprehensive literature reviews on fully permeable pavements, a generic term covering
porous asphalt, pervious concrete, and permeable interlocking concrete pavement, have been undertaken
on behalf of the California Department of Transportation Division of Environmental Analysis (e.g.,
10,11). Consequently, only relevant literature made available after these reports was reviewed, with a
special focus on the design of fully permeable pavements as opposed to general case studies.
3.1 Manuals and Specifications
3.1.1 National Asphalt Paving Association (NAPA)
NAPA offers an Information Series document entitled Porous Asphalt Pavements for Stormwater
Management to guide the design, construction and maintenance of porous asphalt pavements (6). The
guideline is primarily focused on parking lots and very low-volume community access roads and paths
(e.g., golf courses and park trails, etc.) and does not cover higher traffic volume roads or shoulders on
higher traffic volume roads. The design process is essentially based on empirical procedures developed
from project experience.
Structural Design
The NAPA guide recommends a pavement structure with an open-graded HMA surface over an asphalt-
treated permeable base (ATPB), over a permeable gravel subbase. An optional 25-mm thick choker
course of small aggregate between the subbase and base can be considered to provide a level construction
surface. Layer thickness design is based on the use of suggested layer coefficients (based on field
observations of a limited number of experiments) for estimating the thickness of the various layers using
the AASHTO Flexible Pavement Design Method. The guide also recommends different HMA
thicknesses for different types of traffic, based on field observations, as follows:
Parking lots with little or no truck traffic: 2.5 in. (60 mm) Residential streets with some trucks: 4.0 in. (100 mm) Heavy trucks: 6.0 in. (150 mm)
Other factors that need to be considered in the design include:
Soil infiltration rates should be between 0.1 and 10 in./hr (2.5 mm/hr and 250 mm/hr). The subgrade/bottom of the excavation for the permeable structure should be flat to maximize the
infiltration area. The maximum slope of the pavement surface should not exceed five percent.

Laboratory Testing and Modeling for Structural Performance of Fully Permeable Pavements Final Report, November 2010
8
An overflow system should be included in the design to prevent water in the stone base course from rising into the pavement surface layer during extreme storm events.
The stone recharge bed should be able to drain within 12 and 72 hours.
Materials
The NAPA guide provides recommendations for geotextile (used to prevent migration of fines from the
subgrade into the base), open-graded aggregate base/subbase (also termed the stone recharge bed), and
porous asphalt, covering both the surfacing and the ATPB:
Geotextiles. For the geotextile filter fabric between the subgrade and the stone recharge bed, grab tensile strength (≥120 lb [55 kg]), Mullen burst strength (≥225 psi [1.5 MPa]), flow rate (≥95 gal/min/ft2) [3,870 L/min/m2]), and UV resistance limits (≥70 percent) are provided.
Stone Recharge Bed. A coarse, single-sized grading is recommended for the stone recharge bed. AASHTO No.3 stone is preferred, but No.2 or No.1 stone are both permissible, provided that a minimum air-void content of 40 percent is obtained. A maximum of two percent passing the No.100 sieve is recommended to ensure that fines will not clog the voids. An optional 1.0 in. (25 mm) thick choker course (No.57 stone) can be used on top of the coarser recharge bed aggregate as a leveling course if required.
Asphalt Treated Permeable Base. Use State DOT design. Asphalt Surfacing. Use State DOT design.
Construction
The NAPA guide provides general construction guidelines. Key points include:
Subgrade soils should not be compacted. State DOT procedures and specifications should be followed. The completed road should not be trafficked in the first 24 hours. Care should be taken to ensure that sediment laden water does not flow over the pavement.
Maintenance
The NAPA guide provides general maintenance guidelines. Key points include:
Pavements should be vacuum swept twice annually. High-pressure water cleaning should not be used to unclog the pavement. Sand should not be used for de-icing. Appropriate signage should be erected to ensure that inappropriate maintenance actions are not
performed.
3.1.2 American Concrete Pavement Association (ACPA)
The ACPA guide (7) provides very general information on the design of fully permeable pavements. No
specific information is provided on structural design, materials, construction, or maintenance.

Laboratory Testing and Modeling for Structural Performance of Fully Permeable Pavements Final Report, November 2010
9
3.1.3 Interlocking Concrete Pavement Institute (ICPI)
Permeable interlocking concrete pavements (i.e., permeable blocks or permeable gaps between blocks)
were excluded from the scope of this project by Caltrans. However, design information is available. ICPI
offers a guideline entitled Permeable Interlocking Concrete Pavements to guide the design, construction,
and maintenance of these types of pavements (8). The guideline is primarily focused on parking lots and
very low-volume community access roads and does not cover higher traffic volume roads or shoulders on
higher traffic volume roads. The design process is essentially based on empirical procedures developed
from project experience.
Structural Design
The ICPI guide recommends a pavement structure with permeable concrete paving blocks, over a
permeable gravel base and subbase. The design is essentially focused on stormwater infiltration rate
rather than traffic loading requirements.
Materials
The ICPI guide provides recommendations for geotextile, used to prevent migration of fines from the
subgrade into the base, open-graded aggregate base/subbase, and permeable paving blocks:
Geotextiles. Similar recommendation to the NAPA guide. Aggregate Base/Subbase. A course, single-sized grading is recommended for the base and
subbase. AASHTO No.2 stone is preferred for the subbase and No.57 stone for the base. Aggregates should have 90 percent fractured faces, a Los Angeles Abrasion value greater than 40, an effective porosity of 0.32, and a California Bearing Ratio of at least 80 percent. Open-graded stabilized layers can be included. A 50 mm (2.0 in.) No.8 base bedding layer on top of the base is required before the pavers are laid.
Permeable Pavers. Select according to use.
Construction
The ICPI guide provides general construction guidelines and a checklist is provided. Key points include:
Subgrade soils should not be compacted. If they are compacted to improve structural capacity, compaction should not exceed 95 percent of standard Proctor density, and additional drains should be provided to deal with overflows resulting from the reduced permeability.
State DOT procedures and specifications should be followed. Care should be taken to ensure that sediment laden water does not flow over the pavement.
Maintenance
The ICPI guide provides general maintenance guidelines. Key points include:
Pavements should be vacuum swept once annually. Localized repairs should be undertaken as necessary.

Laboratory Testing and Modeling for Structural Performance of Fully Permeable Pavements Final Report, November 2010
10
3.2 Relevant Literature
A review of recent published conference and journal proceedings revealed that no significant advances in
the mechanistic design of fully permeable pavements had been made since the earlier literature reviews.
The 2010 Transportation Research Board Annual Meeting Proceedings (12) included numerous papers
pertaining to pervious concrete, porous asphalt, and fully permeable pavements. Many of the papers
focused on the surface layer only, and most concentrated on the aggregate grading, asphalt binder/cement
content, and reduction in permeability over time due to clogging. There were no papers on structural
design of fully permeable pavements, and those papers covering fully permeable pavements referred to
parking lots or very low volume traffic roads only. A number of case studies were also reviewed.
However, all of these pertained to very low-volume traffic roads and parking lots.
3.3 Meetings with Industry and Caltrans
3.3.1 American Concrete Pavement Association (ACPA)
The authors held a number of discussions with Mr. Craig Hennings and Mr. David Akers from the ACPA
and Mr. Guy Collignon, an experienced contractor in the Sacramento area regarding fully permeable
pavement design criteria, concrete mix designs, and construction practices. Representatives from the
Portland Cement Association (PCA) also attended the meetings. Also discussed was a draft specification
from the National Ready Mixed Concrete Association (NRMCA).
3.3.2 National Asphalt Paving Association (NAPA)
The authors held a number of discussions with Mr. Kent Hansen from NAPA. Additional information
supporting that provided in the NAPA guide was obtained.
3.3.3 Interlocking Concrete Pavement Institute (ICPI)
The authors held a number of discussions with Mr. David Smith from ICPI. Additional information
supporting that provided in the ICPI guide was obtained.
3.3.4 Caltrans Maintenance
A meeting was held with Mr. Steve Price from Caltrans District 5 Maintenance to discuss realistic
maintenance programs for fully permeable roadways and shoulders. Notes from the meeting include:
Currently there is little or no funding dedicated specifically to shoulder maintenance on Caltrans highways. Typically, maintenance on dense-graded HMA shoulders includes one or two sweepings per year and an asphalt emulsion spray every five years.

Laboratory Testing and Modeling for Structural Performance of Fully Permeable Pavements Final Report, November 2010
11
Although the mechanical brooms used by Caltrans have a vacuum action, very little fine and organic material is collected, and consequently the current equipment used will probably not significantly prevent the clogging of fully permeable pavements if they were installed.
If a BMP is installed for stormwater management, the agency is obliged to keep it functioning and must be able to prove that it is functioning effectively and as designed. BMPs are subject to Environmental Protection Agency (EPA) audits. This requires a Caltrans staff commitment to verify performance.
Shoulder backing and maintenance of embankments will need to meet specifications to ensure optimal performance of retrofitted fully permeable shoulders. The specifications may need to be modified/updated to meet the needs of the fully permeable pavement design, and thereafter more strictly enforced.
3.3.5 Asphalt Interlayer Association
A meeting was held with Mr. Ray Myers to discuss the selection of appropriate drainage and drainage
barrier materials for use in fully permeable pavements. Recommendations for specific materials have
been included in the proposed cross sections.
3.3.6 Contractors
Meetings were held with two other contractors (Granite and Teichert) to discuss constructability of fully
permeable pavements for shoulder retrofit of highways. Teichert provided estimated example costs for
the construction of a typical fully permeable structure described in the following chapters.

Laboratory Testing and Modeling for Structural Performance of Fully Permeable Pavements Final Report, November 2010
12

Laboratory Testing and Modeling for Structural Performance of Fully Permeable Pavements Final Report, November 2010
13
Chapter 4 Materials Characterization
4.1 Introduction
The approach used for development of detailed pavement designs in this study is referred to as
“mechanistic-empirical” or “ME.” Caltrans is in the process of implementing this approach as a
replacement for the empirical R-value design method. The assumptions of R-value designs (levels of
compaction, pavement structural layering, etc.) are also not appropriate for fully permeable pavements.
The structural properties of interest include stiffness, strength, durability, fatigue performance, and rutting
performance.
4.2 Experiment Plans
The proposed (9) and actual testing plans followed in the laboratory testing study are shown in Table 4.1
through Table 4.5. Differences between the proposed and actual test plans and justification for the
inclusion/exclusion of tests and material types are discussed in the technical memorandum on laboratory
testing (1).
4.3 Summary of Materials Characterization
4.3.1 Subgrade Soils
Subgrade materials are generally the in situ soils below a pavement structure. On existing pavements,
they are usually compacted as densely as possible to provide a platform for the overlying pavement layers
and to provide added structural integrity to the pavement. However, on fully permeable pavements,
compaction of the subgrade is generally restricted where possible to facilitate infiltration of water. This
requires a thicker overlying pavement structure to compensate for the reduced subgrade strength. Testing
of subgrade materials focused on the influence of different levels of compaction and different moisture
contents on the stiffness of those materials.
Material Sampling
Clay subgrade material was sampled from an undisturbed area near the UCPRC research facility. The silt
material was sampled from an undisturbed area near Stockton. The materials were considered
representative of clay and silt materials in California. Sandy materials were not tested because they
generally have adequate permeability and strength.

Laboratory Testing and Modeling for Structural Performance of Fully Permeable Pavements Final Report, November 2010
14
Table 4.1: Summary of Test Plan for Subgrade Materials and Permeable Gravel Base
Layer Properties of
Interest Test Type
Materials Compaction
(%) Saturation Gradation
Moisture Content
Replicate Total Tests1
Proposed Test Plan
Stiffness AASHTO-
T3072 1 x Silt, 2 x Clays 80, 90 Saturated,
Unsaturated As excavated OMC4, OMC -2% 1 24
Subgrade Rutting
resistance TRLT3 1 x Silt, 2 x Clays 80, 90
Saturated, Unsaturated
As excavated OMC, OMC -2% 1 24
Base Stiffness AASHTO-
T307
1 x Crushed gravel 1 x Recycled concrete
1 x Recycled glass 1 x Recycled tire blend
n/a Saturated,
Unsaturated 3 n/a 1 24
Actual Test Plan
Stiffness AASHTO-
T307 1 x Silt
1 x Clay
90, 95 80, 85, 90,
95
Saturated Unsaturated
As excavated OMC, OMC -2%, OMC +3% OMC, OMC -2%, OMC + 3%,
+8% 1 44
Subgrade Rutting
resistance TRLT
1 x Silt 1 x Clay
80, 90 Saturated
Unsaturated As excavated
OMC, OMC -2%, OMC +3% OMC, OMC -2%, OMC + 3%,
+8% 1 28
Base Stiffness
Permeability AASHTO-
T307 3 x Crushed gravel n/a
Saturated Unsaturated
As supplied n/a 2 12 1 Total tests = Compaction x Saturation x Gradations x Moisture Contents x Materials x Test Variables. 2 Triaxial Stiffness Test. 3 Triaxial Repeated Load Test. 4 Optimum moisture content.
Table 4.2: Summary of Test Plan for Permeable Concrete Subbase
Layer Properties of Interest Test Type Materials Air-voids
(%) Gradations
Test Variables
Total Tests1
Proposed Test Plan
Compressive strength ASTM C-392 1 x Recycled concrete 20 25
3 3 replicates 18
Fatigue resistance ASTM C-783 1 x Recycled concrete 20 25
3 3 replicates 18 Surface
Flexural strength ASTM C-784 1 x Recycled concrete 20 25
3 3 replicates 18
Actual Test Plan Subbase Compressive strength ASTM C-39 1 x Crushed Gravel n/a5 6 3 replicates 18 1 Total tests = Materials x Air-Voids x Gradations x Test Variables. 2 Compressive Strength Test. 3 Flexural Controlled-Deformation Fatigue Test. 4 Flexural Beam Test. 5 Air-void content is dependent on gradation.

Laboratory Testing and Modeling for Structural Performance of Fully Permeable Pavements Final Report, November 2010
15
Table 4.3: Summary of Test Plan for Permeable Asphalt Wearing Course
Layer Properties of
Interest Test Type Materials Mixes
Air-voids (%)
Gradations Test Variables Total Tests
Proposed Test Plan
Stiffness AASHTO
T-3211 1 x Crushed aggregate 1 x HMA-O
1 x R-HMA-O 15 20
2 3 x temperatures 1 x strain level 1 x replicates
24
Fatigue resistance AASHTO
T-3212 1 x Crushed aggregate 1 x HMA-O
1 x R-HMA-O 15 20
2 1 x temperatures 2 x strain level 2 x replicates
32
Rutting resistance
Asphalt Wearing Course
Moisture sensitivity
AASHTO T-3243 1 x Crushed aggregate
1 x HMA-O 1 x R-HMA-O
15 20
2 1 x temperatures 2 x strain level 2 x replicates
48
Actual Test Plan
Permeability ASTM PS
129 3 x Crushed aggregate 174 n/a5 n/a5 3 x replicates 51
Flexural Stiffness AASHTO
T-3211 3 x Crushed aggregate 17 n/a n/a 3 x temperatures 1 x strain level 2 x replicates
102
Fatigue resistance AASHTO
T-3212 4 x Crushed aggregate 4 n/a n/a 1 x temperature 2 x strain levels 3 x replicates
24
Rutting resistance AASHTO
T-3206 3 x Crushed aggregate 17 n/a n/a
1 x temperatures 1 x stress level 3 x replicates
51
Moisture sensitivity AASHTO
T-3243 3 x Crushed aggregate 17 n/a n/a 3 x replicates 51
Asphalt Wearing Course
Raveling resistance ASTM D70647 3 x Crushed aggregate 17 n/a n/a
3 x conditions 3 x replicates
153 1 Flexural Frequency Sweep Test. 2 Flexural Controlled-Deformation Fatigue Test. 3 Hamburg Wheel Track Test. 4 Includes a range of aggregate sizes, sources, binder types, and fillers. 5 Air-voids dependent on gradation. 6 Repeated simple shear test. 7 Standard Practice for Open-Graded Friction Course (OGFC) Mix Design (Cantabro Test).

Laboratory Testing and Modeling for Structural Performance of Fully Permeable Pavements Final Report, November 2010
16
Table 4.4: Summary of Test Plan for Permeable Concrete Wearing Course
Layer Properties of Interest
Test Type Materials Air-voids (%)
Gradations Cement Content
Test Variables
Total Tests
Proposed Test Plan Compressive strength ASTM C-39 1 x Crushed aggregate 15
20 3 1 3 replicates 18
Fatigue resistance ASTM C-78 1 x Crushed aggregate 15 20
3 1 3 replicates 18
Flexural strength ASTM C-78 1 x Crushed aggregate 15 20
3 1 3 replicates 18
PCC Wearing Course
Coefficient of thermal expansion
AASHTO T-336 2 x Crushed aggregate 15 20
3 1 2 replicates 24
Actual Test Plan Phase 1
Permeability ASTM PS 129 1 x Crushed aggregate n/a1 6 1 3 replicates 18 Compressive strength 1 x Crushed aggregate n/a 6 1 5 replicates 30
Phase 2 Permeability ASTM PS 129 1 x Crushed aggregate n/a 3 1 3 replicates 9
Compressive strength ASTM C-39 1 x Crushed aggregate n/a 3 1 3 replicates 9 Split tensile strength ASTM T-198 1 x Crushed aggregate n/a 3 1 5 replicates 15
Flexural strength ASTM C-78 1 x Crushed aggregate n/a 3 1 3 replicates 15 Fatigue resistance ASTM C-78 1 x Crushed aggregate n/a 3 1 3 replicates 9
Phase 3 Permeability ASTM PS 129 3 x Crushed aggregate n/a 3 2 3 replicates 9
Compressive strength ASTM C-78 3 x Crushed aggregate n/a 3 2 3 replicates 9 Split tensile strength ASTM T-198 3 x Crushed aggregate n/a 3 2 5 replicates 9
PCC Wearing Course
Coefficient of thermal expansion
AASHTO T-336 2 x Crushed aggregate n/a 3 2 replicates 24
1 Air-void content is dependent on gradation.

Laboratory Testing and Modeling for Structural Performance of Fully Permeable Pavements Final Report, November 2010
17
Table 4.5: Summary of Test Plan for Precast/Cast In-Place Concrete Wearing Course
Layer Properties of
Interest Test Type Materials Hole Types
Hole Configurations
Gradations Test
Variables Total Tests1
Proposed Test Plan
Fatigue resistance ASTM C-782 1 x Crushed aggregate 2 4 1 3 replicates 24 PCC Wearing Course Flexural strength ASTM C-783 1 x Crushed aggregate 2 10 1 2 replicates 40
Actual Test Plan
Permeability ASTM PS 129 1 x Crushed aggregate 1 1 1 3 replicates 3
Fatigue resistance ASTM C-78 1 x Crushed aggregate 1 1 1 3 replicates 3 PCC Wearing Course
Flexural strength ASTM C-78 1 x Crushed aggregate 1 1 1 2 replicates 2 1 Total tests = Hole Types x Hole Configurations x Gradations x Test Variables. 2 Flexural Controlled-Deformation Fatigue Test. 3 Flexural Beam Test.

Laboratory Testing and Modeling for Structural Performance of Fully Permeable Pavements Final Report, November 2010
18
Test Results: Grading Analysis
The grading analysis was carried out following AASHTO Test Method T-11. The results for the two
soils are shown in Figure 4.1. The gradings are typical for these soil types and were considered to
provide a good representation of subgrade soils in the Central Valley of California. They should be
representative of other areas of the state as well, and provide an adequate variation to understand behavior
in terms of fully permeable pavements.
0
10
20
30
40
50
60
70
80
90
100
0.01 0.1 1 10
Percent Pasiing (%
)
Sieve Size (mm)
SiltClay
Figure 4.1: Subgrade materials grading analysis
Test Results: Atterberg Limits
The Atterberg limits were determined following AASHTO Test Methods T-89 and T-90. The Atterberg
limits for the two soils and their soil classification based on the grading analysis and Atterberg limits are
summarized in Table 4.6. The difference between the two soil types was considered sufficient for
distinguishing performance trends. Although clays with much higher plasticity indices are common in
California, the testing of these clays was not considered necessary as they would typically not be
considered suitable for supporting fully permeable pavement structures.

Laboratory Testing and Modeling for Structural Performance of Fully Permeable Pavements Final Report, November 2010
19
Table 4.6: Subgrade Soil Atterberg Limits and Classification
Atterberg Limits Soil Type Liquid Limit Plastic Limit Plasticity Index
Silt Clay
Soil pat slips 30.9
Non-plastic 18.5
0 12.4
Classification Soil Type
USCS1 AASHTO2 Silt
Clay ML CL
A-2-4 A-6
1 USCS – Unified Soil Classification System 2 AASHTO – American Association of State Highway and Transport Officials
Test Results: Density-Moisture Relationships
The maximum dry density and optimum moisture content of each material were determined using
AASHTO Test Method T-99 (Method A) and Caltrans Test Method CT-216. Results are summarized in
Table 4.7. The results show that the densities obtained using the Caltrans method were approximately five
percent higher than those determined using the AASHTO method. The optimum moisture contents of the
silt material were the same for both test methods, but were significantly different for the clay material
(Caltrans method was four percent lower). The differences were attributed to the different compaction
energies and amount of shearing in the two methods. The AASHTO densities and optimum moisture
content were selected for all further work as this provided a more conservative representation of field
conditions.
Table 4.7: Optimum Moisture content and Maximum Density of Silt and Clay
Wet Density1
(kg/m3) Dry Density1
(kg/m3) Optimum Moisture Content
(%) Soil Type AASHTO Caltrans AASHTO Caltrans AASHTO Caltrans
Silt Clay
2,070 2,100
2,150 2,170
1,850 1,800
1,920 1,910
12 17
12 14
1 Densities rounded to nearest 10 kg/m3
Test Results: Permeability
Permeability of the silt and clay materials for a range of compaction levels was determined using
AASHTO Test Method T-215 (constant head method). The relationship between permeability and soil
compaction for the silt and clay is summarized in Figure 4.2. Permeability on both materials was poor and
decreased with increasing compaction, as expected. The clay material was more consistent than the silt,
which was attributed to the finer gradation. The reduction in permeability with increasing compaction
was not as significant for the silt as it was for the clay. The permeability of the clay decreased from 10-
2 cm/s (natural, uncompacted in situ soil) to 10-5cm/s (100 percent of laboratory determined maximum dry
density) over the range of compactions tested.

Laboratory Testing and Modeling for Structural Performance of Fully Permeable Pavements Final Report, November 2010
20
70 75 80 85 90 95 100 105Compaction Level (%)
10-5
10-4
10-3
10-2
Sa
tura
ted
Hyd
rau
lic C
on
duct
ivity
Ks
(cm
/s)
Silt
Clay
Figure 4.2: Saturated hydraulic conductivity vs. compaction level of silt and clay. (Note permeability determined using AASHTO T-215 [constant head])
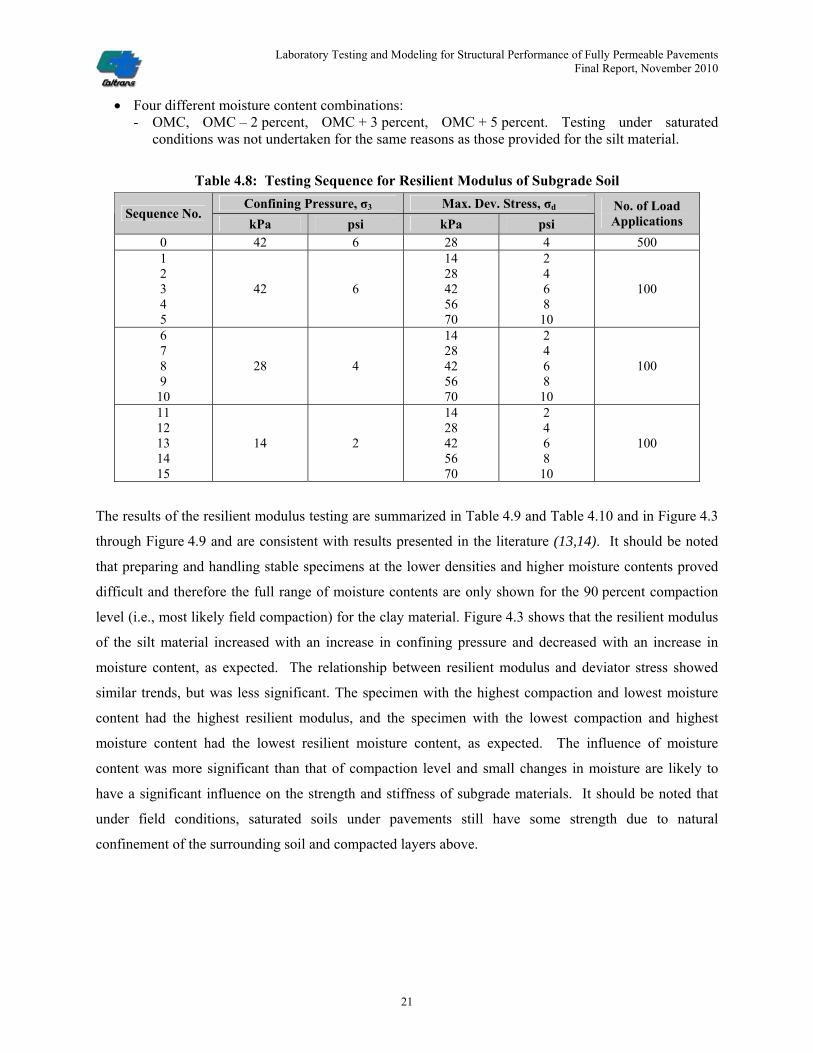
Test Results: Resilient Modulus
The resilient modulus of each material was assessed using AASHTO Test Method T-307, using the
testing sequence summarized in Table 4.8. Specimens were prepared using the moisture content and
density determined earlier in the study as a baseline, with additional specimens prepared with different
density and moisture content combinations. Specimens for determining the resilient modulus of the silt
material were prepared as follows:
Two different density combinations: - 90 and 95 percent of the previously determined AASHTO density. Densities below 90 percent
were not considered for tests on the silt material as it is unlikely that such a low density would be found on a highway given the natural compaction of the soil and additional compaction through unavoidable movements of the construction equipment.
Three different optimum moisture content (OMC) combinations: - OMC, OMC – 2 percent, and OMC + 3 percent. Testing in the saturated condition was not
undertaken due to difficulties in preparing specimens (specimens “failed” before testing started) and the knowledge gained from testing at the three selected moisture contents, which indicated that the soils would have little or no bearing capacity at higher moisture contents.
Specimens for determining the resilient modulus of the clay material were prepared as follows:
Four different density combinations: - 80, 85, 90, and 95 percent of the previously determined AASHTO density. Densities below
90 percent were considered for tests on the clay materials. Although it is unlikely that such a low density would be found on a highway given the natural compaction of the soil and additional compaction through unavoidable movements of the construction equipment, possible worst case conditions representing high rainfall events, or prolonged rainfall, at the lower densities were assessed.
Laboratory Testing and Modeling for Structural Performance of Fully Permeable Pavements Final Report, November 2010
21
Four different moisture content combinations: - OMC, OMC – 2 percent, OMC + 3 percent, OMC + 5 percent. Testing under saturated
conditions was not undertaken for the same reasons as those provided for the silt material.
Table 4.8: Testing Sequence for Resilient Modulus of Subgrade Soil
Confining Pressure, σ3 Max. Dev. Stress, σd Sequence No.
kPa psi kPa psi No. of Load Applications
0 42 6 28 4 500 1 2 3 4 5
42 6
14 28 42 56 70
2 4 6 8
10
100
6 7 8 9
10
28 4
14 28 42 56 70
2 4 6 8
10
100
11 12 13 14 15
14 2
14 28 42 56 70
2 4 6 8
10
100
The results of the resilient modulus testing are summarized in Table 4.9 and Table 4.10 and in Figure 4.3
through Figure 4.9 and are consistent with results presented in the literature (13,14). It should be noted
that preparing and handling stable specimens at the lower densities and higher moisture contents proved
difficult and therefore the full range of moisture contents are only shown for the 90 percent compaction
level (i.e., most likely field compaction) for the clay material. Figure 4.3 shows that the resilient modulus
of the silt material increased with an increase in confining pressure and decreased with an increase in
moisture content, as expected. The relationship between resilient modulus and deviator stress showed
similar trends, but was less significant. The specimen with the highest compaction and lowest moisture
content had the highest resilient modulus, and the specimen with the lowest compaction and highest
moisture content had the lowest resilient moisture content, as expected. The influence of moisture
content was more significant than that of compaction level and small changes in moisture are likely to
have a significant influence on the strength and stiffness of subgrade materials. It should be noted that
under field conditions, saturated soils under pavements still have some strength due to natural
confinement of the surrounding soil and compacted layers above.
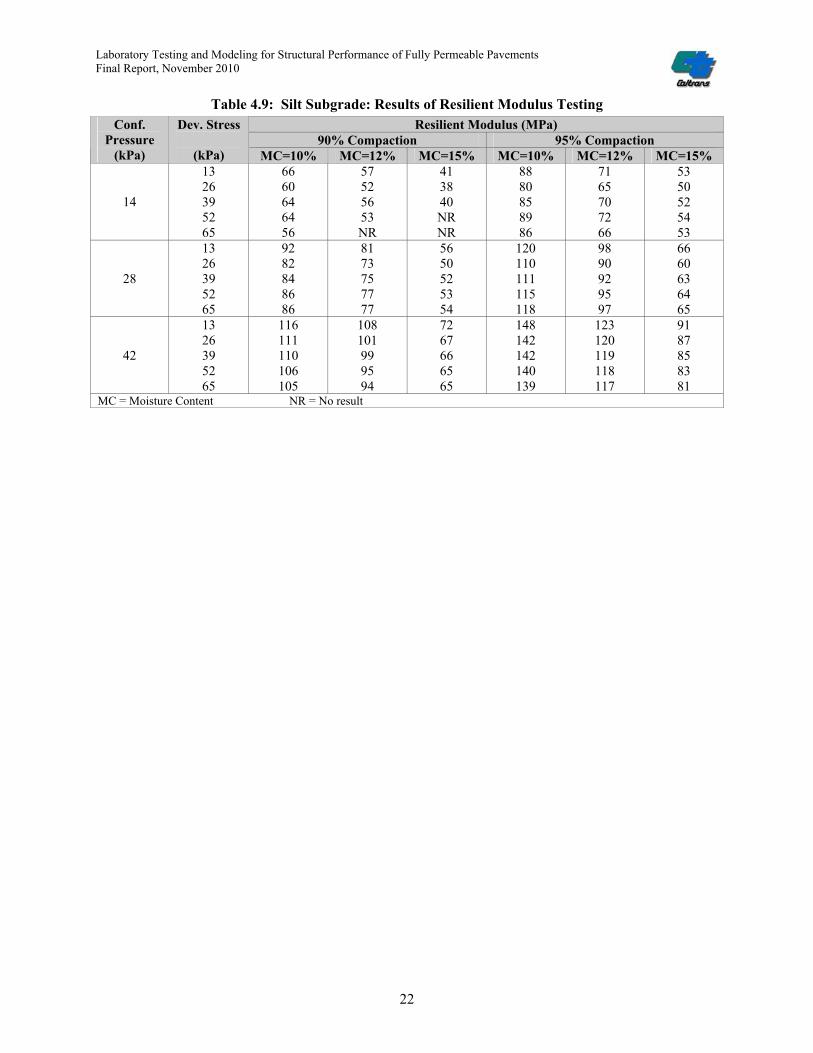
Laboratory Testing and Modeling for Structural Performance of Fully Permeable Pavements Final Report, November 2010
22
Table 4.9: Silt Subgrade: Results of Resilient Modulus Testing Resilient Modulus (MPa)
90% Compaction 95% Compaction Conf.
Pressure (kPa)
Dev. Stress
(kPa) MC=10% MC=12% MC=15% MC=10% MC=12% MC=15%
14
13 26 39 52 65
66 60 64 64 56
57 52 56 53 NR
41 38 40 NR NR
88 80 85 89 86
71 65 70 72 66
53 50 52 54 53
28
13 26 39 52 65
92 82 84 86 86
81 73 75 77 77
56 50 52 53 54
120 110 111 115 118
98 90 92 95 97
66 60 63 64 65
42
13 26 39 52 65
116 111 110 106 105
108 101 99 95 94
72 67 66 65 65
148 142 142 140 139
123 120 119 118 117
91 87 85 83 81
MC = Moisture Content NR = No result

Laboratory Testing and Modeling for Structural Performance of Fully Permeable Pavements Final Report, November 2010
23
Table 4.10: Clay Subgrade: Results of Resilient Modulus Testing Resilient Modulus (MPa)
80% Compaction 85% Compaction 90% Compaction 95% Compaction Conf.
Pressure (kPa)
Dev. Stress (kPa) MC=15% MC=17% MC=15% MC=17% MC=15% MC=17% MC=20% MC=25% MC=15% MC=17%
14
13 26 39 52 65
105 87 79 71 66
87 73 63 56 51
130 114 104 97 91
103 88 78 70 65
179 161 151 142 135
118 101 90 82 76
101 87 78 73 68
NR NR NR NR NR
201 185 175 167 160
140 117 105 95 88
28
13 26 39 52 65
110 94 83 75 70
95 77 66 58 53
141 122 111 102 95
113 95 82 73 67
192 171 157 147 139
125 107 94 85 79
107 89 81 74 71
NR NR NR NR NR
215 194 183 172 164
146 126 110 98 91
42
13 26 39 52 65
112 97 85 77 71
93 79 67 59 53
141 125 113 103 96
108 91 81 73 67
190 171 158 148 139
128 111 98 87 80
107 97 89 80 73
19 13 10 10 NR
217 198 185 173 163
149 128 112 101 92
MC = Moisture Content NR = No result
0
20
40
60
80
100
120
140
160
8 9 10 11 12 13 14 15 16
Moisture Content (%)
Res
ilie
nt
Mo
du
lus
(MP
a)
90% - 14kPa 90% - 28kPa 90% - 42kPa
95% - 14kPa 95% - 28kPa 95% - 42kPa
0
20
40
60
80
100
120
140
160
8 9 10 11 12 13 14 15 16
Moisture Content (%)
Res
ilie
nt
Mo
du
lus
(MP
a)
90% - 14kPa 90% - 28kPa 90% - 42kPa
95% - 14kPa 95% - 28kPa 95% - 42kPa
Figure 4.3: Silt: Resilient modulus vs. compaction moisture content for different confining pressure.
Figure 4.4: Silt: Resilient modulus vs. compaction moisture content for different deviator stresses.

Laboratory Testing and Modeling for Structural Performance of Fully Permeable Pavements Final Report, November 2010
24
0
20
40
60
80
100
120
140
160
0 5 10 15 20 25 30 35 40 45 50
Confining Pressure (kPa)
Re
sili
ent
Mo
du
lus
(MP
a)
90% - MC=10% 90% - MC=12% 90% - MC=15%
95% - MC=10% 95% - MC=12% 95% - MC=15%
Figure 4.5: Silt: Resilient modulus vs. confining pressure.

Laboratory Testing and Modeling for Structural Performance of Fully Permeable Pavements Final Report, November 2010
25
0
20
40
60
80
100
120
140
160
180
200
75 80 85 90 95 100
Compaction (% Max Dry Density)
Res
ilien
t M
od
ulu
s (M
Pa)
MC=15% MC=17%
0
25
50
75
100
125
150
175
200
225
13 14 15 16 17 18 19 20 21 22 23 24 25 26
Moisture Content (%)
Res
ilien
t M
od
ulu
s (M
Pa
)
80% - 14kPa 80% - 28kPa 80% - 42kPa 85% - 14kPa
85% - 28kPa 85% - 42kPa 90% - 14kPa 90% - 28kPa
90% - 42kPa 95% - 14kPa 95% - 28kPa 95% - 42kPa
Figure 4.6: Clay: Resilient modulus vs. compaction. Figure 4.7: Clay: Resilient modulus vs. compaction moisture content for different confining pressure.
0
25
50
75
100
125
150
175
200
225
13 14 15 16 17 18 19 20 21 22 23 24 25 26
Moisture Content (%)
Res
ilien
t M
od
ulu
s (M
Pa
)
80% - 14kPa 80% - 28kPa80% - 42kPa 85% - 14kPa85% - 28kPa 85% - 42kPa90% - 14kPa 90% - 28kPa90% - 42kPa 90% - 56kPa95% - 14kPa 95% - 28kPa95% - 42kPa
0
20
40
60
80
100
120
140
160
180
200
220
240
0 5 10 15 20 25 30 35 40 45 50 55 60 65 70 75
Deviator Stress (kPa)
Res
ilie
nt
Mo
du
lus
(MP
a)
80% - MC=15% 80% - MC=17% 85% - MC=15%85% - MC=17% 90% - MC=15% 90% - MC=17%90% - MC=20% 95% - MC=15% 95% - MC=17%
Figure 4.8: Clay: Resilient modulus vs. compaction moisture content for different deviator stresses.
Figure 4.9: Clay: Resilient modulus vs. deviator stress.

Laboratory Testing and Modeling for Structural Performance of Fully Permeable Pavements Final Report, November 2010
26
Test Results: Permanent Deformation
Repeated load permanent deformation test specimens were prepared using the moisture contents and
densities determined earlier in the study. The permanent deformation of each specimen was assessed
using the testing sequence summarized in Table 4.11. Lower loads were used on the high moisture
content specimens to limit very early failures.
Table 4.11: Testing Sequence of Permanent Deformation for Subgrade Soil
Confining Pressure, σ3 Max. Deviator Stress, σd Moisture Content
Sequence No. kPa psi kPa psi
No. of Load Applications
Silt
10%, 12%
1 2 3 4 5
14 2
28 42 56 70 84
4 6 8
10 12
1,000 2,000 3,000 5,000 9,000
Total 20,000
15%
1 2 3 4 5 6
14 2
14 28 42 56 70 84
2 4 6 8
10 12
1,000 1,000 2,000 3,000 5,000 9,000
Total 21,000 Clay
15%, 17%
1 2 3 4 5
14 2
42 70 98 126 154
6 10 14 18 22
1,000 2,000 3,000 5,000 9,000
Total 20,000
20%, 25%
1 2 3 4 5 6
14 2
21 42 70 98 154 154
3 6
10 14 22 22
1,000 1,000 2,000 3,000 5,000 9,000
Total 21,000
The results of the repeated load permanent deformation tests on the silt and clay materials are shown in
Figure 4.10 and Figure 4.11 respectively and show that both materials will add very little strength
(permanent deformation resistance) to a pavement structure, with performance negatively influenced with
increasing moisture content.

Laboratory Testing and Modeling for Structural Performance of Fully Permeable Pavements Final Report, November 2010
27
0
1
2
3
4
5
6
7
8
9
10
0 5,000 10,000 15,000 20,000Repetitions
Per
man
ent
Def
orm
atio
n (
mm
)
0.0
0.3
0.7
1.0
1.3
1.6
2.0
2.3
2.6
3.0
3.3
Per
man
ent
Str
ain
(%
)
90% - MC=10%90% - MC=12%90% - MC=15%95% - MC=10%95% - MC=12%95% - MC=15%
Figure 4.10: Silt: Permanent deformation using confining pressure of 14 kPa.
0
1
2
3
4
5
6
7
8
9
10
0 5,000 10,000 15,000 20,000
Repetitions
Per
man
ent
Def
orm
atio
n (
mm
)
0.0
0.3
0.7
1.0
1.3
1.6
2.0
2.3
2.6
3.0
3.3
Per
man
ent
Str
ain
(%
)
80% - MC=15%80% - MC=17%90% - MC=15%90% - MC=17%90% - MC=20%90% - MC=25%
Figure 4.11: Clay: Permanent deformation using confining pressure of 14 kPa.

Laboratory Testing and Modeling for Structural Performance of Fully Permeable Pavements Final Report, November 2010
28
Summary of Test Results on Subgrade Soils
The results of tests on two different subgrade soils common in the Central Valley of California indicate
that both soil types will add very little support to a pavement structure, and that the stiffness and the
associated strength of the materials will decrease significantly as the moisture content increases. Any
fully permeable pavement structure on these materials will need to compensate for this poor bearing
capacity with thicker base and surfacing layers. Testing was not undertaken in the saturated condition
given the already poor performance recorded at compaction moisture contents, and the difficulty in
preparing specimens for testing (i.e., specimens “failed” before the test could be started). It should be
noted that under field conditions, saturated soils under pavements still have some strength due to natural
confinement of the surrounding soil and compacted layers above. Since testing under saturated conditions
was not feasible, a worst case soil strength under saturated conditions was used for modeling the
performance of fully permeable pavements (Chapter 5) and for developing the structural design
procedures discussed in Chapter 6.
4.3.2 Base Course Materials
The base course separates the wearing course and subgrade materials and provides much of the bearing
capacity in any pavement. On existing non-permeable pavements, base courses typically have a very
dense grading and are usually compacted as densely as possible to provide a platform for the overlying
wearing course layers and to provide the maximum possible structural integrity to the pavement.
However, on fully permeable pavements, an open-graded base course is used to maximize water storage.
This influences the degree of compaction and resultant strength that can be achieved. The base course
will therefore typically need to be thicker to compensate for the lower strengths and stiffnesses associated
with the less dense grading. Testing of base course materials focused on the stiffness of those materials.
Material Sampling
Four different commercially available aggregate samples of different geological origin (granite [two
gradings], basalt, and alluvial) were sourced from three different suppliers in northern California. These
materials were considered to be representative of sources in the Central Valley and coastal regions of the
state. Photographs of the various aggregates are shown in Figure 4.12. The basalt and granite materials
were sourced from a hard-rock quarry and were angular in shape. The basalt particles were
predominantly flaky compared to the granite, which was predominantly blocky in shape. The alluvial
material consisted of primarily smooth, rounded particles, although most had at least one crushed face.

Laboratory Testing and Modeling for Structural Performance of Fully Permeable Pavements Final Report, November 2010
29
Granite (1) Granite (2)
Basalt Alluvial
Figure 4.12: Photographs of aggregates indicating size distribution and shape.
Test Results: Grading Analysis
The grading analysis was carried out following AASHTO Test Methods T-11 and T-27. The results for
the four materials are shown in Figure 4.13. The results are compared with those discussed in the NAPA
manual (6) and the work done at the University of Illinois (15,16) in Figure 4.14.

Laboratory Testing and Modeling for Structural Performance of Fully Permeable Pavements Final Report, November 2010
30
0
10
20
30
40
50
60
70
80
90
100
0.01 0.1 1 10 100Sieve Size (mm)
Pe
rcen
t P
ass
ing
Aluvial - 3/4"
Basalt - 3/4"
Granite - 1" x #4
Granite - 2"
Figure 4.13: Grading analysis base course materials.
0
10
20
30
40
50
60
70
80
90
100
0.01 0.1 1 10 100
Sieve Size (mm)
Pe
rce
nt
Pa
ssin
g
Aluvial - 3/4"Basalt - 3/4"Granite - 1" x #4Granite - 2"ASTM No. 1-middleASTM No. 2-middleASTM No. 3-middleASTM No. 57-middle (choker)Tutumuller #1Tutumuller #2
Figure 4.14: Grading analysis comparison with NAPA manual materials (6).
The results show that the alluvial and basalt materials had a similar grading with no significant variation
in particle sizes. The finer granite material (1 in. x #4) had a larger range of particle sizes. The coarse
granite (similar to railway ballast) contained significantly larger aggregates than the other materials, with
very little variation in particle size, and was closer to the aggregate size typically recommended in the
literature (6).

Laboratory Testing and Modeling for Structural Performance of Fully Permeable Pavements Final Report, November 2010
31
Three of the four materials selected for testing were generally finer than those described in the NAPA
manual (6), with the exception of the ASTM No.57 material, which had a similar grading to the finer
granite. The coarse granite had a similar grading to the ASTM No.3 material, both of which were finer
compared to the ASTM No.1 and No.2 materials.
Test Results: Permeability
Permeability of the four aggregates was determined using ASTM-PS 129. The materials had a void ratio
between 20 and 25 percent and all had a permeability close to 0.1 cm/s, which appears to be sufficient for
typical California conditions (4).
Test Results: Resilient Modulus
There are no published specimen preparation or testing procedures for the triaxial testing of coarse open-
graded materials. The AASHTO T-307 test method was therefore adapted as follows:
1. Weigh sufficient material for the preparation of one specimen (about 11 kg). 2. Place a thick rubber membrane inside the mold and place it on the vibration table. 3. Place the material into the mold in six separate lifts, rodding each lift 20 times to orient the
material and optimize particle interlock. Weigh the remaining material. 4. Place the specimen on the testing frame. 5. Remove the mold from the specimen and measure height and diameter according to AASHTO
T-307. 6. Position the transducers and test according to AASHTO T-307.
Specimen details for the four materials are summarized in Table 4.12. However, the coarse granite could
not be tested as the aggregates were too large to prepare a satisfactory 6.0 in. (152 mm) specimen.
Table 4.12: Triaxial Specimen Details
Material Mass (kg)
Diameter (mm)
Height (mm)
Density (kg/m3)
Specific Gravity
Void Content (%)
Alluvial – ¾ in. Basalt – ¾ in. Granite – 1 in. x #4 Granite – 2 in.
9.929 9.340 10.275 8.890
152 152 152 152
315 312 318 304
1,737 1,650 1,781 1,612
2.762 2.670 2.761 2.761
37 38 36 42
Testing was carried out according to AASHTO T-307, but with the addition of one extra confinement
sequence at the beginning of the test (Sequence 00 in Table 4.13) to prevent premature disintegration of
the specimen.

Laboratory Testing and Modeling for Structural Performance of Fully Permeable Pavements Final Report, November 2010
32
Table 4.13: Resilient Modulus Testing Sequence (Modified from AASHTO T-307)
Confining Pressure, σ3 Max. Dev. Stress, σd Sequence No.
(kPa) (psi) (kPa) (psi) No. of Load Applications
00 103.4 15 0 0 200 sec 0 1 2 3 4 5 6 7 8 9
10 11 12 13 14 15
103.4 20.7 20.7 20.7 34.5 34.5 34.5 68.9 68.9 68.9 103.4 103.4 103.4 137.9 137.9 137.9
15 3 3 3 5 5 5 10 10 10 15 15 15 20 20 20
103.4 20.7 41.4 62.0 34.5 68.9 103.4 68.9 137.9 206.8 68.9 103.4 206.8 103.4 137.9 275.8
15 3 6 9 5 10 15 10 20 30 10 15 30 15 20 40
500 100 100 100 100 100 100 100 100 100 100 100 100 100 100 100
The average results of resilient modulus testing on the three materials are presented in Figure 4.15. The
results show that there was very little difference in performance between the three material types,
although the finer, more graded samples had a slightly higher resilient modulus, as expected. The
resilient modulus values were considerably lower than those typically obtained from testing conventional
dense-graded aggregate base course materials. Results were compared to a selection of other results from
the literature (15,16). The resilient moduli of the materials tested in this study generally fell between
those tested in the other studies, but showed similar trends in terms of the effects of grading and particle
size on resilient modulus.
The stress dependency parameters for the K-θ and Universal resilient modulus models, which were used
in the mechanistic-empirical pavement analyses, are listed in Table 4.14.
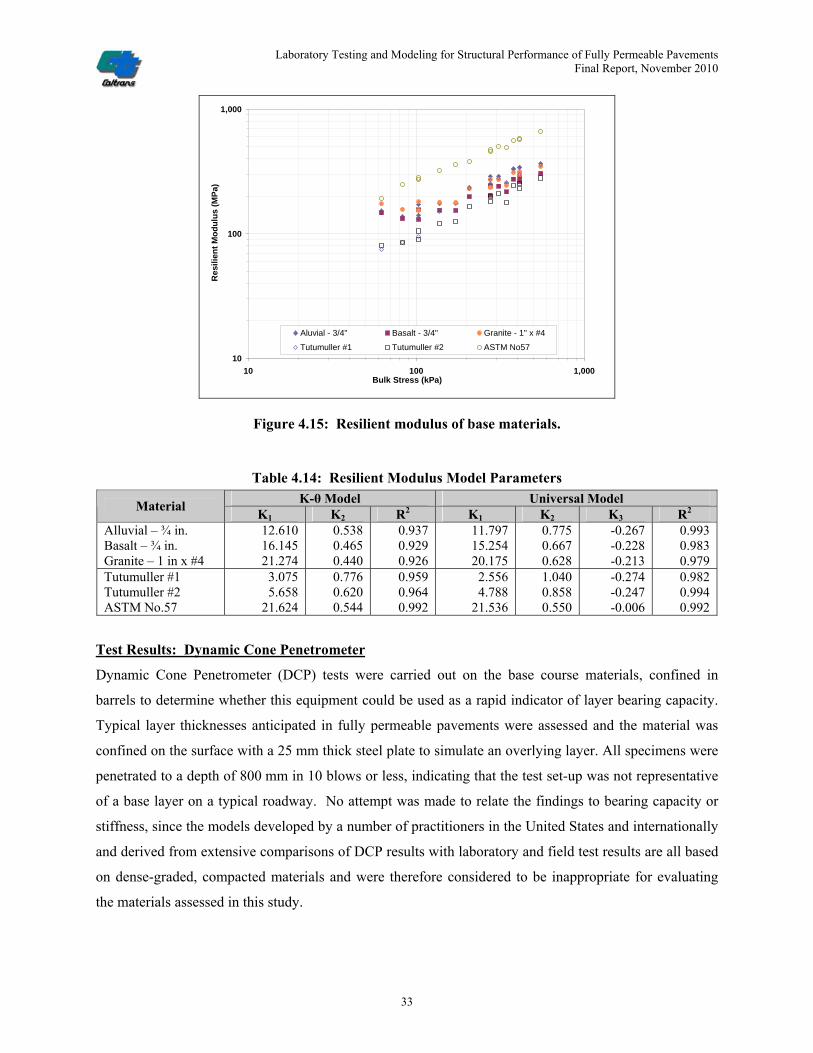
Laboratory Testing and Modeling for Structural Performance of Fully Permeable Pavements Final Report, November 2010
33
10
100
1,000
10 100 1,000Bulk Stress (kPa)
Re
sili
ent
Mo
du
lus
(MP
a)
Aluvial - 3/4" Basalt - 3/4" Granite - 1" x #4
Tutumuller #1 Tutumuller #2 ASTM No57
Figure 4.15: Resilient modulus of base materials.
Table 4.14: Resilient Modulus Model Parameters
K-θ Model Universal Model Material
K1 K2 R2 K1 K2 K3 R2 Alluvial – ¾ in. Basalt – ¾ in. Granite – 1 in x #4
12.610 16.145 21.274
0.538 0.465 0.440
0.937 0.929 0.926
11.797 15.254 20.175
0.775 0.667 0.628
-0.267 -0.228 -0.213
0.993 0.983 0.979
Tutumuller #1 Tutumuller #2 ASTM No.57
3.075 5.658
21.624
0.776 0.620 0.544
0.959 0.964 0.992
2.556 4.788
21.536
1.040 0.858 0.550
-0.274 -0.247 -0.006
0.982 0.994 0.992
Test Results: Dynamic Cone Penetrometer
Dynamic Cone Penetrometer (DCP) tests were carried out on the base course materials, confined in
barrels to determine whether this equipment could be used as a rapid indicator of layer bearing capacity.
Typical layer thicknesses anticipated in fully permeable pavements were assessed and the material was
confined on the surface with a 25 mm thick steel plate to simulate an overlying layer. All specimens were
penetrated to a depth of 800 mm in 10 blows or less, indicating that the test set-up was not representative
of a base layer on a typical roadway. No attempt was made to relate the findings to bearing capacity or
stiffness, since the models developed by a number of practitioners in the United States and internationally
and derived from extensive comparisons of DCP results with laboratory and field test results are all based
on dense-graded, compacted materials and were therefore considered to be inappropriate for evaluating
the materials assessed in this study.

Laboratory Testing and Modeling for Structural Performance of Fully Permeable Pavements Final Report, November 2010
34
Summary of Test Results on Base Course Materials
The results of tests on four different commercially available permeable base-course aggregates indicate
that these materials will probably provide sufficient support for typical traffic loads in parking lots, basic
access streets and driveways, and on highway shoulders, whilst serving as a reservoir layer for the
pavement structure. Although three of the four materials tested had smaller maximum aggregate sizes
than those typically discussed in the literature, the permeability was still adequate for California rainfall
events.
4.3.3 Open-Graded Hot-Mix Asphalt
Considerable research on porous asphalt has been undertaken in past years by a number of institutions
worldwide, and so-called open-graded friction courses are commonly used as a maintenance and
pavement preservation strategy in California. Benefits include reduced splash and spray, improved skid
resistance, and lower noise. However, all past research has been based on the existence of a dense-
graded, impermeable layer underneath the porous asphalt layer, with water draining to the edge of the
road and then into existing drainage structures.
The research discussed in this section describes the work undertaken to determine optimum mix designs
for open-graded asphalt concrete wearing courses (or bases) for use in fully permeable pavements. This
part of the study was undertaken in conjunction with another laboratory project being undertaken on
behalf of Caltrans by the UCPRC to assess the properties of noise-reducing wearing courses, which
allowed the testing of a far larger experimental matrix than originally planned. Testing was carried out in
two phases. The first phase, carried out on 19 different mixes, focused on permeability, rutting resistance,
moisture sensitivity, and durability (resistance to raveling). The three best mixes were then subjected to
fatigue testing to assess resistance to fatigue cracking, and to frequency sweep tests to characterize the
influence of temperature and time of loading on stiffness. The stiffness and fatigue results were inputs for
the structural analysis calculations described in Chapter 5 of this report.
Material Sampling
Three different commercially available aggregate samples of different geological origin (granite, basalt,
and alluvial) were sourced from the same three suppliers discussed earlier. These materials were
considered to be representative of sources in the Central Valley and coastal regions of the state. The
European mix specimens sampled from the test track in Spain contained porphyry (coarse aggregates) and
limestone (sand and fine fraction).

Laboratory Testing and Modeling for Structural Performance of Fully Permeable Pavements Final Report, November 2010
35
Five different binders, sourced from two different refineries, representing those typically used in
California and other states were used in this study:
PG64-16. This is a standard PG grade used in California and is widely used for open-graded mixes since it is the specified grade when placement temperatures are greater than 70°F (21°C) in the North Coast, Low Mountain, and South Mountain regions (Table 632.1 of the Highway Design Manual, per Design Information Bulletin 86, November 30, 2006). It is also widely used where PG64-10 binders are specified (e.g., South Coast, Central Coast, and Inland Valley regions), since it exceeds the specifications of the PG64-10, but allows the refineries to save costs by producing one instead of two binders. PG64-16 is also the base stock binder for most of the rubberized asphalt specified by Caltrans.
PG58-34PM. This is a standard PG grade used in California, and is the recommended grade for open-graded wearing courses in all regions of the state when the placement temperature is less than 70°F (21°C). The PM indicates that the binder is polymer-modified. It is softer than PG64-16 at both high and low temperatures.
PG76-22PM. This is a much stiffer binder than PG58-34PM at both high and low temperatures, and is also polymer-modified. This binder is specified in Georgia DOT Standard Specifications for use in open-graded friction course mixes, which have reportedly performed very well and deserved assessment for use in California.
PG76-22TR. This binder has similar stiffness to PG76-22, but is modified with between 10 and 15 percent recycled tire rubber instead of polymer. The rubber is blended into the binder at the refinery and is known as terminal blend rubberized asphalt binder.
Asphalt Rubber. Asphalt rubber binders typically contain between 15 and 20 percent recycled tire rubber (19 percent in this study). These binders are produced at the asphalt plant using a wet process.
Mix Designs
The mix designs used in the study were selected from a comprehensive literature search on the topic, past
experience in California, as well as some experimentation. The mixes tested in the first phase are
summarized in Table 4.15. The D125 mix is a Caltrans conventional dense-graded mix included for
comparison with the permeable open-graded mixes. The G125, RW95 and AR95 mixes were tested in
Phase 2, together with a European mix not tested in Phase 1 (these specimens were sawn from a test track
in Spain and shipped to UCPRC for another project, but had sufficient permeability to warrant testing in
this study).
Mix designs for all of the open-graded mixes, except the Georgia and Arizona mixes, were performed
following California Test Method CT-368, (Standard Method for Determining Optimum Bitumen Content
(OBC) for Open-Graded Asphalt Concrete). In this test, the binder contents are determined based on the
calculation of the approximate bitumen ratio determined from surface area estimates calculated from the
aggregate gradation, and a “drain-down” test. The binder contents for the mixes with rubberized asphalt
binders were also determined following CT-368, in which the binder content determined for conventional
binders is increased by a factor of 1.2 for rubberized binders.

Laboratory Testing and Modeling for Structural Performance of Fully Permeable Pavements Final Report, November 2010
36
Table 4.15: Mix Designs Used in Phase 1 and Phase 2 Testing
Mix ID Mix Description Aggregate Nominal Max.
Aggregate Size (mm)
Binder Comments
D125 12.5 PG64-16 Dense-graded control mix. All other mixes are open-graded. RW19 19.0 PG64-16 - RW125 12.5 PG64-16 - RW95 9.5 PG64-16 - RW475 4.75 PG64-16 - AR95 9.5 AR - AR475 4.75 AR - AR475P 4.75 AR Coarser aggregate than other 4.75 mm gradations. P475LM 4.75 PG64-16 Contains hydrated lime for moisture resistance. TR475 4.75 PG76-22TR - P58LF 4.75 PG58-34PM Contains cellulose fibers to hold binder in mix and hydrated lime for moisture resistance. P475 4.75 PG76-22PM -
G125 12.5 PG76-22PM Georgia DOT mix. Coarser gradation than Caltrans 12.5 mm. Contains mineral fibers to hold
more binder in mix and hydrated lime for moisture resistance.
AZ95 9.5 AR Arizona mix. Slightly finer gradation than Caltrans 9.5 mm. Contains hydrated lime for
moisture resistance. E8
Basalt
8.0 PG64-16 Danish mix. Contains some cellulose fibers to hold more binder in mix. PG95T 9.5 PG64-16 - AR475T
Alluvial 4.75 AR -
AR95W 9.5 AR - PG475W
Granite 4.75 PG64-16 -
Cedex Porphyry 12.5 N/A Spanish mix. Binder was classified as BM-3c.

Laboratory Testing and Modeling for Structural Performance of Fully Permeable Pavements Final Report, November 2010
37
The mix design for the dense-graded control mix was performed following Caltrans standard practice.
The mix design for the Georgia mix was performed following Georgia test method GDT-114. The mix
design for the Arizona mix followed a method documented in the literature.
Aggregate gradations for each mix are shown in Table 4.16. The 12.5 mm, 9.5 mm and 4.75 mm open
gradations are the same for each maximum size aggregate to permit comparison of other variables, except
for the Arizona, Georgia, Danish, and AR475P mixes.
Table 4.16: Aggregate Gradations of Mixes Tested Percent Passing
Mix ID 19-mm
12.5-mm
9.5-mm
4.75-mm
2.36-mm
1.18-mm
0.6-mm
0.3-mm
0.15-mm
0.075-mm
NMAS1
(mm)
D125 100 97.5 87.5 62.5 46 35 22.5 16 9 5 12.5 RW19 RW125 RW95 RW475 AR95 AR475 AR475P P475LM TR475 P58LF P475 G125 AZ95 E8
95 100 100 100 100 100 100 100 100 100 100 100 100 100
54 97.5 100 100 100 100 100 100 100 100 100
92.5 100 100
36 83.5
95 100 95
100 100 100 100 100 100 65
100 100
20 32.5 32.5
91 32.5
91 65 91 91 91 91 20 40 29
15 12.5 12.5
14 12.5
14 14 14 14 14 14 7.5
9 9
10 5 5
12 5
12 12 12 12 12 12
5 5 8
7 5 5
10 5
10 10 10 10 10 10
5 4 8
5 4 4 8 4 8 7 8 8 8 8 4 3 8
4 3 3 7 3 7 6 7 7 7 7 3 2 8
2 1.5 1.5
6 1.5
6 5 6 6 6 6 3 2 8
19.0 12.5 9.5
4.75 9.5
4.75 4.75+
4.75 4.75 4.75 4.75 12.5 9.5 8.0
PG95T AR475T
100 100
100 100
95 100
32.5 91
12.5 14
5 12
5 10
4 8
3 7
1.5 6
9.5 4.75
AR95W PG475W
100 100
100 100
95 100
32.5 91
12.5 14
5 12
5 10
4 8
3 7
1.5 6
9.5 4.75
Cedex2 100 100 80 24 19 - 10 - - 7 N/A 1 Nominal maximum aggregate size 2 Gradings are approximate, converted from European metric sieve sizes.
The binder contents, lime contents, filler contents, and mixing and compaction temperatures are shown in
Table 4.17, together with the Fineness Modulus, Coefficient of Curvature (Cc) and Coefficient of
Uniformity (Cu) for each mix.
The Fineness Modulus is a measure of the uniformity of the aggregate gradation. The higher the fineness
modulus, the coarser the asphalt mix (a higher percentage of coarse material) and the more uniform the
gradation.

Laboratory Testing and Modeling for Structural Performance of Fully Permeable Pavements Final Report, November 2010
38
The Coefficient of Curvature (Cc) is a measure of the shape of a gradation curve. In the Unified Soil
Classification System (USCS), a Coefficient of Curvature value between one and three is considered to be
well graded. The Coefficient of Curvature is defined as:
Cc = D302/(D10 * D60) (4.1)
Where D10 is the sieve size (mm) through which 10 percent of the aggregate passes D30 is the sieve size (mm) through which 30 percent of the aggregate passes D60 is the sieve size (mm) through which 60 percent of the material passes.
The Coefficient of Uniformity (Cu = D60/D10) is used to distinguish between open- and more dense-
graded mixes. Lower coefficients indicate that most of the material is approximately the same size,
resulting in a uniform or open gradation, while higher values indicate that the gradation has a range of
particle sizes resulting in a more well-graded or dense-graded mix.
Table 4.17: Properties of Mixes Tested
Mix ID Binder
Content (%)
Fiber1 (%)
Hydrated Lime (%)
Mixing Temp (ºC)
Compact Temp (ºC)
Fineness Modulus
Cc2 Cu
3
D125 6.0 0 0 144 125 4.22 1.19 25.60 RW19 RW125 RW95 RW475 AR95 AR475 AR475P P475LM TR475 P58LF P475 G125 AZ95 E8
5.0 5.9 5.9 7.9 7.1 9.5 8.4 7.9 9.5 7.9 7.9 6.3 9.2 6.4
0 0 0 0 0 0 0 0 0
0.30 CF 0
0.40 MF 0
0.25 CF
0 0 0 0 0 0 0
1.5 0
1.5 0
1.4 1.0 1.5
135 135 135 135 163 163 163 135 163 155 163 165 163 135
125 125 125 125 149 149 149 125 149 138 149 160 149 125
6.08 5.55 5.43 4.58 5.43 4.58 4.86 4.58 4.58 4.58 4.58 5.91 5.37 5.30
0.70 1.38 1.47 0.91 1.47 0.91 0.91 0.91 0.91 0.91 0.91 1.32 1.03 1.37
2.14 3.72 3.48 1.60 3.48 1.60 1.91 1.60 1.60 1.60 1.60 3.16 2.60 2.75
PG95T AR475T
5.9 9.5
None None
0 0
135 163
125 149
5.43 4.58
1.47 0.91
3.48 1.60
AR95W PG475W
7.1 7.9
None None
0 0
163 135
149 125
5.43 4.58
1.47 0.91
3.48 1.60
Cedex 5.3 None None N/A N/A N/A N/A N/A 1 CF = Cellulose Fiber and MF = Mineral Fiber 2 Cc = Coefficient of Curvature 3 Cu = Coefficient of Uniformity
In the basalt aggregate mixes, the binder contents increase with decreasing aggregate maximum size (e.g.,
RW19, RW125, RW95, and RW475). This is attributed to smaller size aggregates having a larger surface
area-to-density ratio, and allows for more binder in the mix for a given mass of aggregate. The increase
in binder content for asphalt rubber binders using the Caltrans open-graded mix design procedure can be
seen by comparing RW475 (conventional binder) with AR475 (rubberized) and RW95 (conventional
binder) with AR95 and AR95W (both rubberized).

Laboratory Testing and Modeling for Structural Performance of Fully Permeable Pavements Final Report, November 2010
39
Test Methods
Laboratory testing included measurement of permeability, shear, moisture sensitivity, and durability on
prepared specimens of all mixes. Limited beam fatigue and flexural frequency sweep testing was then
carried out on the three mixes with the best performance in the other tests. Only three mixes were selected
due to the time and complexity of fatigue testing, and the limited time available for this testing. The bulk
specific gravity and bulk density of the specimens were also measured to determine air-void contents.
AASHTO or ASTM standard test methods were followed during testing as shown in Table 4.18.
Permeability testing is illustrated in Figure 4.16
Table 4.18: Test Methods for Asphalt Materials
Attribute Test Test Method Permeability Rutting resistance Fatigue cracking resistance Moisture sensitivity Raveling resistance Max. Specific Gravity Bulk Specific Gravity Air-void Content
Permeability Repeated Simple Shear Test Beam fatigue Hamburg Wheel Track Cantabro Test Max. Specific Gravity Bulk Specific Gravity Air-void Content
ASTM PS 129-01 AASHTO T-320 AASHTO T-321 AASHTO T-324 ASTM D7064 x2 AASHTO T-209 AASHTO T-331 AASHTO T-269
Figure 4.16: Permeability testing on compacted slabs.
Test Results
The results for each set of tests are discussed in the following sections. Results shown are average values
of the replicates. Plots include a bar indicating plus and minus one standard deviation variability of the
results. Ranked results for permeability, moisture sensitivity, rutting resistance (shear strength), and
raveling resistance on all mixes and beam fatigue and flexural frequency sweep on three mixes are
summarized in Table 4.19 through Table 4.21.

Laboratory Testing and Modeling for Structural Performance of Fully Permeable Pavements Final Report, November 2010
40
Table 4.19: Ranked Results of Permeability, Moisture Sensitivity, and Rutting Resistance Tests
Permeability (cm/s)
Moisture Sensitivity (Hamburg Wheel Track) (Repetitions to 10 mm rut)
Rutting Resistance (Shear Modulus) (MPa)
Mix Average Std Deviation Mix Average Std Deviation Mix Average Std Deviation
D125 TR475 AZ95 P475 AR95W PG475W P58LF AR475 AR475P P475LM AR475T AR95 RW475 PG95T E8 RW125 G125 RW95 RW19
0.0009 0.0284 0.0337 0.0529 0.0581 0.0582 0.0638 0.0640 0.0758 0.0865 0.0919 0.1103 0.1714 0.2144 0.2551 0.3006 0.3120 0.3223 0.5833
0.0007 0.0054 0.0067 0.0094 0.0170 0.0102 0.0377 0.0559 0.0194 0.0287 0.0294 0.0244 0.0211 0.0677 0.0486 0.0866 0.0807 0.1174 0.3252
PG475W PG95T RW125 P475LM RW95 E8 RW475 TR475 AR475 P58LF AR475P AR95 AR475T AZ95 P475 D125 RW19 AR95W G125
317 377 425 681 725 861 919 2,013 2,565 2,827 2,930 3,030 3,200 3,967 4,482 5,170 5,250 6,222 17,981
159.1 88.4 77.8 51.6 318.2 139.3 128.7 108.9 233.3 243.9 21.2 169.7 0.0 272.2 944.0 650.5 424.3 328.8 3,119.8
P58LF P475 TR475 PG95T AR475P AR475T AR95W AR475 RW125 AZ95 RW95 RW475 G125 E8 RW19 PG475W P475LM D125 AR95
29.2 56.7 57.5 63.5 63.7 63.9 65.0 65.3 65.8 66.9 69.4 92.9 93.9 104.8 110.2 120.3 123.0 369.8
-
6.6 0.0 6.0 6.1 6.9 1.6 2.3 0.0 1.2 0.6 3.3 2.1 1.0 2.8 37.3 4.7 9.8 0.0 -

Laboratory Testing and Modeling for Structural Performance of Fully Permeable Pavements Final Report, November 2010
41
Table 4.20: Ranked Results of Raveling Resistance and Fatigue Resistance Tests.
Raveling Resistance (% Loss)
Fatigue Resistance (Fatigue Life)
Mix Average1 Std Deviation Mix Average Std Deviation
P58LF AR475T TR475 AR475P P475 PG475W P475LM AR475 RW475 AZ95 D125 AR95W G125 RW125 PG95T AR95 E8 RW95 RW19
2.4 2.7 3.6 8.1
10.4 12.3 17.1 19.4 20.2 20.3 20.9 28.3 32.9 45.8 50.9 53.2 54.7 59.1 63.2
Not determined
for summation of
three conditions
G125 AR95 RW95
See Table 4.22
1 Summation of three conditions (unaged, aged, and freeze-thaw cycle). 2 Average of four tests after highest and lowest excluded.
Table 4.21: Ranked Results for Flexural Frequency Sweep Tests
Average Flexural Frequency Sweep Values (E*) (MPa)1 Mix 15 Hz 10 Hz 5 Hz 2 Hz 1 Hz 0.5 Hz 0.2 Hz 0.1 Hz 0.05 Hz 0.02 Hz 0.01 Hz
G125 2,768 2,640 2,367 1,998 1,743 1,501 1,232 1,052 899 723 619 RW95 2,779 2,635 2,312 1,870 1,567 1,282 970 766 588 398 292 AR95 1,088 1,066 970 811 525 603 491 419 361 297 257 Standard Deviation G125 1,381 1,368 1,288 1,167 1,078 980 859 769 685 575 515 RW95 1,824 1,797 1,684 1,496 1,337 1,165 961 797 657 480 354 AR95 578 563 526 465 399 381 332 293 262 219 198 1 Average of six beam specimens

Laboratory Testing and Modeling for Structural Performance of Fully Permeable Pavements Final Report, November 2010
42
Test Results: Permeability
Permeability results for all mixes are plotted in Figure 4.17. Comparisons with a parallel study of
hydraulic calculations for pervious pavements (4) indicates that a permeability of 0.1 cm/second would be
sufficient for typical rainfall events in California, and with multiple traffic lanes draining into a 10 ft
(3.0 m) wide shoulder. Many of the mixes included in this study have permeabilities near that value.
Variables that will need to be used with these test results to determine which mixes will provide sufficient
permeability include the extent of clogging over time (being investigated in the parallel study [4]), and
the number of lanes of traffic that need to be drained. The permeability for the control dense-graded mix
(D125) is shown for comparison.
Figure 4.18 shows the comparison of the aggregate size for open-graded mixes with four aggregate sizes
(3/4, 1/2, 3/8 in., and #4 sieves [19, 12.5, 9.5 and 4.75 mm]). The results show that permeability tends to
increase with increasing aggregate size. However, all of the mixes with conventional PG64-16 binder
appeared to have sufficient initial permeability.
Figure 4.19 shows the comparison of mixes with different binders and 4.75 mm (#4) and 9.5 mm (3/8 in.)
open-graded aggregate gradations. Permeability of the higher binder content asphalt rubber 9.5 mm mix
(AR95) was lower than that of the same mix with conventional binder (RW95). Mixes with polymer-
modified binders and with fibers also tended to reduce the permeability of the 4.75 mm mixes compared
with the conventional binder mix (RW475).
Figure 4.20 shows that additional compaction to obtain an air-void content of approximately 15 percent
(instead of between 18 and 22 percent) did not decrease the permeability of the two 4.75 mm mixes with
asphalt rubber binder.
Figure 4.21 plots permeability against aggregate type. There was no consistent or significant trend of
permeability in terms of aggregate source, although both of the mixes with granite aggregates had
somewhat lower permeabilities than the corresponding mixes with basalt aggregate. This was attributed
to the different shapes of the two aggregate sources.

Laboratory Testing and Modeling for Structural Performance of Fully Permeable Pavements Final Report, November 2010
43
0.0001
0.001
0.01
0.1
1
D125
TR475
AZ95P47
5AR95
WPG47
5WP58
LFAR47
5AR47
5PAR47
5PD
P475L
MAR47
5TAR95
AR47
5DRW
475
PG95T E8
RW12
5G12
5RW
95RW
19
Mix
Per
mea
bili
ty (
cm/s
)
Figure 4.17: Summary plot of ranked permeability results for all mixes.
(Note log scale for permeability)

Laboratory Testing and Modeling for Structural Performance of Fully Permeable Pavements Final Report, November 2010
44
0.0
0.1
0.2
0.3
0.4
0.50.6
0.7
0.8
0.9
RW475 RW95 RW125 RW19
Mix
Per
mea
bili
ty (
cm/s
)
0.0
0.1
0.2
0.3
0.4
0.5
0.6
0.7
0.8
0.9
RW475 P475LM TR475 P475 AR475 P58LF RW95 AR95
Mix
Pe
rme
ab
ilit
y (c
m/s
)
NMAS=9.5 mm: RW95, AR95NMAS=4.75 mm: all other mixes
Figure 4.18: Comparison of effect of maximum aggregate size on permeability.
(Results for mixes with basalt aggregate and PG64-16 binder)
Figure 4.19: Comparison of effect of different binders on permeability.
(Results for mixes with basalt aggregate and 4.75 mm and 9.5 mm maximum aggregate size)
0.0
0.1
0.2
0.3
0.4
0.5
0.6
0.7
0.8
0.9
AR475 AR475P AR475PD AR475DMix
Per
mea
bili
ty (
cm/s
)
0.0
0.1
0.2
0.3
0.4
0.5
0.6
0.7
0.8
0.9
AR475 AR475T RW475 PG475W RW95 PG95T AR95 AR95W
Mix
Pe
rme
ab
ilit
y (
cm
/s)
Basalt: AR475, RW 475, RW95, AR95Aluvial: AR475T, PG95TGranite: PG475W, AR95W
Figure 4.20: Comparison of effect of better compaction on permeability (4.75 mm mixes).
Figure 4.21: Comparison of effect of different aggregate types on permeability.
(Results for PG64-16 and asphalt rubber mixes with 4.75 mm and 9.5 mm maximum aggregate sizes)

Laboratory Testing and Modeling for Structural Performance of Fully Permeable Pavements Final Report, November 2010
45
Test Results: Moisture Sensitivity
Hamburg Wheel Tracking Test (HWTT) results for all mixes are shown in Figure 4.22. It is interesting to
note that the Georgia DOT open-graded mix (G125) had the best results, even higher than those of the
control dense-graded mix, despite having nearly the highest permeability. This was attributed to the
polymer-modified binder and use of fibers. Other open-graded mixes that had better HWTT results than
the control mix were AR95W (attributed to rubberized binder) and RW19 (attributed to larger aggregate
size).
Figure 4.23 shows the effects of aggregate size with the control mix (D125) for comparison. Generally
the open-graded mixes had less rutting and moisture sensitivity resistance at high temperatures under
soaked conditions compared to the dense-graded mix under the same conditions, which is expected.
Figure 4.24 shows the results for mixes with different binders and 4.75 mm (#4) and 9.5 mm (3/8 in)
gradations. The polymer-modified mix and asphalt rubber mixes appeared to offer superior resistance for
the 4.75 mm mixes. Similarly the asphalt rubber mix appeared to be better than the same mix with
conventional binder for the 9.5 mm mixes.
Figure 4.25 shows the effects of better compaction for 4.75 mm asphalt rubber mixes with two different
gradations. The results indicate that the better compaction improved the results for both gradations,
despite both gradations showing similar permeabilities (see Figure 4.20).
Figure 4.26 shows the effects of different aggregate types on moisture sensitivity. There was no clear
trend when the alluvial and granite aggregates were compared with mixes with basalt aggregate.

Laboratory Testing and Modeling for Structural Performance of Fully Permeable Pavements Final Report, November 2010
46
0
1,000
2,000
3,000
4,000
5,000
6,000
7,000
8,000
9,000
10,000
PG475W
PG95T
RW12
5P47
5LM
RW95 E8
RW47
5TR47
5AR47
5P58
LFAR47
5PAR95
AR47
5TAR47
5DAR47
5PD
AZ95P47
5D12
5RW
19AR95
W
G125
Mix
Rep
etit
ion
s to
10
mm
ru
t
Figure 4.22: Summary plot of ranked HWTT results for all mixes.

Laboratory Testing and Modeling for Structural Performance of Fully Permeable Pavements Final Report, November 2010
47
0
2,000
4,000
6,000
8,000
10,000
RW475 RW95 D125 RW125 RW19
Mix
Rep
eti
tio
ns
to
10
mm
ru
t
0
2,000
4,000
6,000
8,000
10,000
RW475 P475LM TR475 P475 AR475 P58LF RW95 AR95
Mix
Re
pet
itio
ns
to
10
mm
ru
t
Figure 4.23: Comparison of effect of maximum aggregate size on moisture sensitivity.
(Results for mixes with basalt aggregate and PG64-16 binder.)
Figure 4.24: Comparison of effect of different binders on moisture sensitivity.
(Results for mixes with basalt aggregate and 4.75 mm and 9.5 mm maximum aggregate size.)
0
2,000
4,000
6,000
8,000
10,000
AR475 AR475P AR475D AR475PD
Mix
Rep
eti
tio
ns
to
10
mm
ru
t
0
2,000
4,000
6,000
8,000
10,000
AR475 AR475T RW475 PG475W RW95 PG95T AR95 AR95W
Mix
Re
pe
titi
on
s t
o 1
0 m
m r
ut
Figure 4.25: Comparison of effect of better compaction on moisture sensitivity (4.75 mm mixes).
Figure 4.26: Comparison of effect of different aggregate types on moisture sensitivity.
(Results for PG64-16 and asphalt rubber mixes with 4.75 mm and 9.5 mm maximum aggregate size.)

Laboratory Testing and Modeling for Structural Performance of Fully Permeable Pavements Final Report, November 2010
48
Test Results: Rutting Resistance
Figure 4.27 shows results for all mixes tested for shear stiffness at 113°F (45°C) and 0.1 second loading
time. The control dense-graded mix was considerably stiffer than the open-graded mixes, as expected.
Ten of the eighteen open-graded mixes had similar stiffnesses. Generally, the courser mixes (>1/2 in
[ 12.5 mm]) and some of the mixes with lime had higher stiffnesses. Fibers did not appear to have a
significant influence on stiffness. Pavement thickness design will be dependent on stiffness; however,
lower stiffness can be compensated for by a thicker asphalt layer, provided that the material also provides
adequate rutting resistance (as indicated for example by the HWTT).
Figure 4.28 provides a comparison of the effects of maximum aggregate size on shear stiffness (45°C and
70 kPa) for mixes with basalt aggregate and PG64-16 binder. The 19 mm (3/4 in.) mix was somewhat
stiffer than the mixes with smaller aggregates, but it also had more variability between replicate
specimens. Stiffnesses were similar in the other three mixes, with a slight decrease in stiffness with
increasing aggregate size.
Figure 4.29 provides a comparison of the effects of different binders on shear stiffness (45°C and 70 kPa)
for mixes with basalt aggregate and 4.75 mm (#4) and 9.5 mm (3/8 in.) maximum aggregate size. Mixes
with conventional binders appeared to have slightly higher stiffnesses than those with rubber or polymer
modification.
Figure 4.30 provides a comparison of the effect of different aggregate sources (4.75 and 9.5 mm
maximum aggregate size only) on shear stiffness (45°C and 70 kPa) for the mixes with PG64-16 and
asphalt rubber binders. There was no clear trend in the results, although the more cubical granite
aggregate tended to have a slightly higher stiffness for the same aggregate size and binder compared to
the other two aggregates.

Laboratory Testing and Modeling for Structural Performance of Fully Permeable Pavements Final Report, November 2010
49
0
50
100
150
200
250
300
350
400
P58LF
P475
TR475
PG95T
AR475P
AR475T
AR95W
AR475
RW125
AZ95RW95RW47
5G12
5 E8RW19
PG475W
P475LM D12
5
Mix
Shea
r Mod
ulus
(MPa
)
Figure 4.27: Summary plot of ranked shear stiffness (45°C & 70 kPa shear stress) results for all mixes.
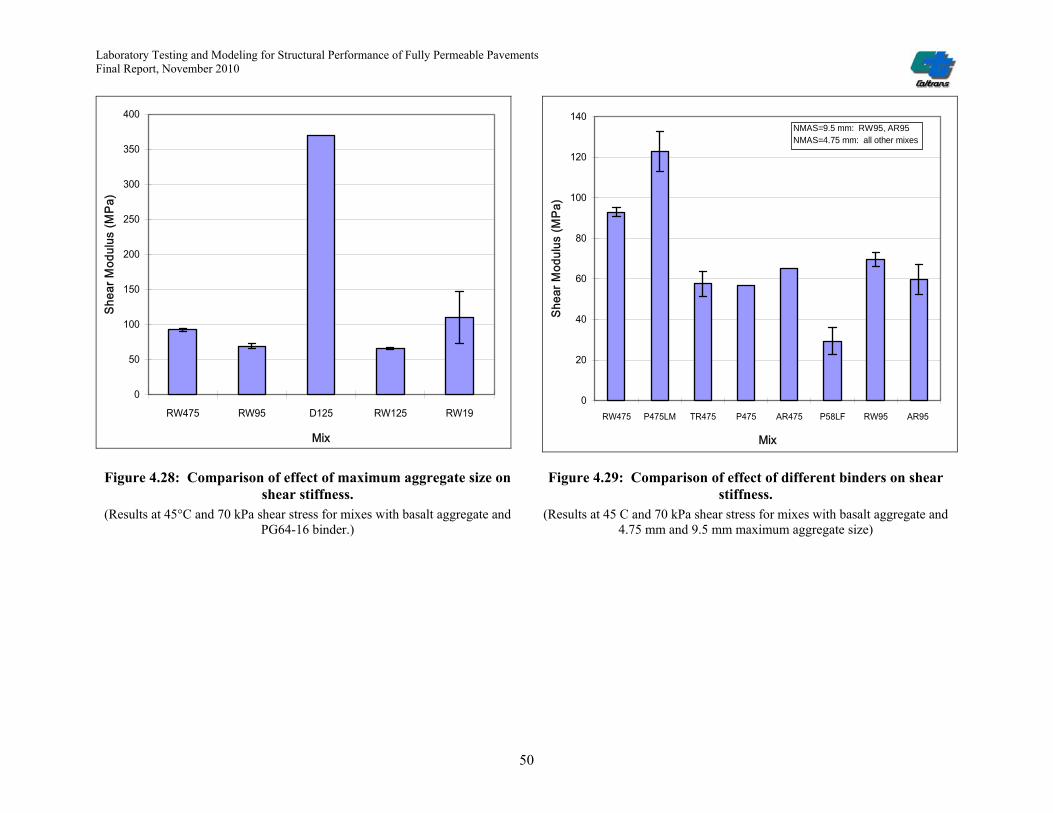
Laboratory Testing and Modeling for Structural Performance of Fully Permeable Pavements Final Report, November 2010
50
0
50
100
150
200
250
300
350
400
RW475 RW95 D125 RW125 RW19
Mix
Shea
r Mod
ulus
(MPa
)
0
20
40
60
80
100
120
140
RW475 P475LM TR475 P475 AR475 P58LF RW95 AR95
Mix
Shea
r Mod
ulus
(MPa
)
NMAS=9.5 mm: RW95, AR95NMAS=4.75 mm: all other mixes
Figure 4.28: Comparison of effect of maximum aggregate size on shear stiffness.
(Results at 45°C and 70 kPa shear stress for mixes with basalt aggregate and PG64-16 binder.)
Figure 4.29: Comparison of effect of different binders on shear stiffness.
(Results at 45 C and 70 kPa shear stress for mixes with basalt aggregate and 4.75 mm and 9.5 mm maximum aggregate size)

Laboratory Testing and Modeling for Structural Performance of Fully Permeable Pavements Final Report, November 2010
51
0
20
40
60
80
100
120
140
AR475 AR475T RW475 PG475W RW95 PG95T AR95 AR95W
Mix
Shea
r Mod
ulus
(MPa
)
Basalt: AR475, RW 475, RW95, AR95Alluvial: AR475T, PG95T Granite: PG475W, AR95W
Figure 4.30: Comparison of effect of different aggregate types on shear stiffness.
(Results at 45°C and 70 kPa shear stress for mixes with PG64-16 and asphalt rubber binders and 4.75 mm and 9.5 mm maximum aggregate size.)
Test Results: Raveling Resistance
Raveling resistance was determined for both unaged and aged specimens, as well as for selected
specimens subjected to one freeze/thaw cycle (specimens were selected based on best overall
performance in earlier tests). Figure 4.31 shows the average raveling resistance for each condition. The
results indicate that raveling generally increases with increasing aggregate size. Mixes with modified
binders (rubberized or polymer-modified) performed better than those with unmodified binders. The
addition of lime and fibers also appeared to result in some improvement in performance. The 12.5 mm
(1/2 in.) dense-graded control mix performed better than the open-graded 12.5 mm mixes tested, but was
outperformed by the mixes with finer aggregates and modified binders.

Laboratory Testing and Modeling for Structural Performance of Fully Permeable Pavements Final Report, November 2010
52
P5
8L
F
TR
47
5
AR
47
5T
P4
75
AZ
95
AR
47
5P
AR
47
5
PG
47
5W
P4
75
LM
RW
47
5
D1
25
AR
95
W
AR
95
G1
25
RW
12
5
E8
RW
95
RW
19
PG
95
T
UnagedAgedOne Freeze-Thaw0
10
20
30
40
50
60
70
80
90
100C
an
tab
ro L
oss
(%
)
Mix
Unaged
Aged
One Freeze-Thaw
Figure 4.31: Summary plot of ranked raveling resistance results for all mixes.

Laboratory Testing and Modeling for Structural Performance of Fully Permeable Pavements Final Report, November 2010
53
Test Results: Fatigue Cracking Resistance
Due to the complexity of specimen preparation and duration of the test, only three mixes were selected for
fatigue testing. The three mixes chosen for testing of fatigue cracking resistance were the G125, AR95,
and RW95 mixes. The AR95 mix was selected as a control, as this is a commonly used mix in current
Caltrans OGFC projects. The G125 and RW95 mixes were selected based on their overall performance in
the other tests, with particular emphasis on permeability, Hamburg Wheel Track Test, and shear stiffness
performance.
The fatigue cracking resistance test results for the six specimens from each mix are shown in Table 4.22.
All tests were conducted at a nominal temperature of 67°F (20°C), with two nominal strains of 400 and
700 microstrain, and three replicates at each strain. The deformation frequency was 10 Hz as detailed in
the AASHTO T-321 test method.
Table 4.22: Flexural Fatigue Test Results for Three HMA-O Mixes Specimen Temperature
(°C)
Tensile Strain Phase Angle
(degrees)
Initial Stiffness
(MPa)
Repetitions to 50% Stiffness Reduction
(Nf) AR95-3A2 AR95-4B1 AR95-6B1 AR95-2B1 AR95-2B2 AR95-3A1
23.5 19.8 19.7 19.8 19.8 21.2
0.000473 0.000407 0.000411 0.000711 0.00071 0.000717
26.3 29.6 24.0 26.2 28.3 30.0
1176 686 967 977 1051 895
6,615,354 832,549 6,472,341 87,319 170,856 323,646
G125-1A1 G125-1A2 G125-2b1 G125-3A1 G125-3A2 G125-6B1
19.7 21.4 21.2 19.6 19.8 20.5
0.000409 0.000413 0.000429 0.000708 0.000706 0.000739
22.8 29.0 25.5 26.3 23.4 28.6
1943 1645 1987 2091 2346 1849
5,879,064 2,246,757 14,749,979 105,029 132,488 58,270
RW95-1A1 RW95-2B2 RW95-6B1 RW95-2B1 RW95-3A2 RW95-6B2
20.3 19.9 20.4 20.1 21.4 20.1
0.000425 0.000402 0.000421 0.000716 0.000709 0.000709
31.7 29.6 35.0 30.9 30.4 35.1
2241 2285 1499 2140 2328 1525
67,626 53,651 179,343 7,013 8,748 33,587
The results for the AR95 and RW95 mixes had greater variability than is typical for dense-graded HMA,
likely due to the open-graded nature of the material and resultant high air-void content, which tends to
result in more erratic performance compared to dense-graded mixes. The variability for the G125 mix was
less than that of the other two mixes. The results indicate that the G125 mix and AR95 mixes had similar
performance, with the G125 mix with polymers and fibers outperforming the Caltrans rubberized AR95
mix (RHMA-O) mix at the smaller strain, and the AR95 mix performing somewhat better at the larger
strain (Figure 4.32). Both the G125 and AR95 mixes significantly outperformed the Caltrans RW95 mix

Laboratory Testing and Modeling for Structural Performance of Fully Permeable Pavements Final Report, November 2010
54
(HMA-O) with conventional binder at both strains. It must be remembered that these laboratory results
indicate fatigue performance at a given strain, and that the expected performance of the mix in the
pavement structure, and the strain under a given load for each mix, will depend largely on the stiffness of
that mix.
y = 2E-19x-7.5307
R2 = 0.9101y = 3E-12x-5.3569
R2 = 0.6778
y = 1E-07x-3.5268
R2 = 0.694
1E+2
1E+3
1E+4
1E+5
1E+6
1E+7
1E+8
0.0001 0.001
Test Strain
Fat
igu
e L
ife
(Nf)
AR95 G125 RW95
RW95
G125 AR95
Figure 4.32: Summary of HMA fatigue life equations for fully permeable pavements.
Test Results: Flexural Stiffness
The dynamic stiffness of the G125, AR95, and RW95 mixes were measured at different temperatures and
strain frequencies using flexural frequency sweep testing. Results are tabled in Appendix A. The
frequency sweep results were fitted with a Gamma function to create stiffness master curves, which permit
calculation of dynamic stiffness for any temperature and frequency. A summary of the master curves and
time-temperature relationships is provided in Table 4.23. The data and master curve fits are shown in
Figure 4.33, and the time-temperature shift factors for use with the master curve equations are shown in
Figure 4.34.
The results indicate that the G125 mix was stiffer than the other two mixes except at short loading times
(higher speed/frequencies), which also corresponds to colder temperatures, where the conventional
Caltrans HMA-O mix (RW95) had similar stiffness. The Caltrans RHMA-O (AR95) mix generally had
lower stiffness than the other two mixes, which results in higher tensile strains from truck loads, but lower
tensile strains from cold temperatures.

Laboratory Testing and Modeling for Structural Performance of Fully Permeable Pavements Final Report, November 2010
55
Table 4.23: Summary of Master Curves and Time-Temperature Relationships
Master Curve Time-Temperature
Relationship Mix Type
N A B C D A B AR95 G125 RW95
3 3 3
21,478.93 22,927.80 8,420.84
15.77917 10.79402 3.976235
-9.57447 -10.01293 -5.32720
94.4856 147.9806 143.6314
-17.8532 12.0135 7.62143
53.2251 -35.4865 -24.3910
Notes: 1. The reference temperature is 20°C. 2. The flexural controlled-deformation frequency sweep tests were conducted at following testing conditions: Frequencies: 15, 10, 5, 2, 1, 0.5, 0.2, 0.1, 0.05, 0.02, and 0.01 Hz; Temperatures: 10°C, 20°C, and 30°C; and Strain level: 100 or 200 microstrain. Master curve Gamma fitting equations:
If n = 3, 2
2* 1 exp 1
2
x C x Cx CE D A
B B B
,
where aTfreqx lnln
3. Time-temperature relationship:
B
TrefTAaT exp1ln
0
500
1,000
1,500
2,000
2,500
3,000
3,500
4,000
4,500
5,000
-10 -8 -6 -4 -2 0 2 4 6 8
Ln(frequency) (Hz)
Sti
ffn
ess,
E*
(MP
a)
AR95 G125 RW95 Gamma Fitted Lines
-5
-4
-3
-2
-1
0
1
2
3
4
5
-15 -10 -5 0 5 10 15
T-Tref (Tref = 20C)
Ln
aT
AR95
G125
RW95
Figure 4.33: Summary of flexural stiffness master curves for HMA materials.
Figure 4.34: Time-temperature shift relationships for HMA materials.
Summary of Testing on Open-Graded Hot-Mix Asphalt
Test results indicate that the aggregate particle size distribution in the mix and the binder type will be the
two most critical factors in designing permeable asphalt concrete wearing courses. Sufficient permeability
for anticipated needs in California (4) was obtained on a range of mixes tested. Adequate resistance to
rutting of the surface material appears to be mostly a problem for the RW95 with conventional binder and
the AR95 mix with rubberized binder, based on shear modulus. The AR95 and G125 mixes had better
rutting resistance in the Hamburg Wheel Tracking Test (which also considers moisture sensitivity), in
particular the G125 mix containing polymers and fibers. Some moisture sensitivity was evident, but this
can be overcome by the use of appropriate anti-strip treatments. Most of the mixes of interest had

Laboratory Testing and Modeling for Structural Performance of Fully Permeable Pavements Final Report, November 2010
56
adequate durability (resistance to raveling) compared to the dense-graded control. Fatigue cracking
resistance at a given strain was better for the rubberized and polymer-modified mixes (AR95 and G125)
compared with the conventional mix at a given strain. The polymer-modified G125 mix was stiffest at
higher temperatures and under slower traffic (lower frequency of loading), while the conventional RW95
mix had similar stiffness to the G125 mix at lower temperatures and under faster traffic. The rubberized
AR95 mix generally had lower stiffness than the other two mixes. The flexural stiffness and the fatigue
test results must be used together to simulate cracking behavior under truck loading to determine expected
fatigue cracking life in a pavement structure.
4.3.4 Open-Graded Portland Cement Concrete
Portland cement concrete (PCC) materials are an alternative to hot-mix asphalt (HMA) as a wearing
course. They provide a more rigid surface than HMA and are therefore typically more rut-resistant but
more prone to cracking. As with HMA wearing courses, the material grading needs to be optimized to
provide a balance between strength and permeability. The testing of PCC wearing course materials in this
study focused on tensile, compressive, and flexural strengths, and associated permeability. A phased
approach was followed in that preliminary testing (Phase 1) was carried out on a broad range of gradings
identified in the literature. This was followed by more comprehensive testing (Phase 2) on specimens
prepared with the three most promising gradings identified in Phase 1. Additional testing (Phase 3) was
then carried out to assess the effects of a number of other parameters including cement content, water-to-
cement ratio, and particle shape.
Material Sampling
Three different commercially available aggregate samples of different geological origin (granite, basalt,
and alluvial) were sourced from the same three suppliers discussed in Section 4.3.2. These materials were
considered to be representative of sources in the Central Valley and coastal regions of the state. The first
two phases of testing were carried out on the granite material, while Phase 3 testing was carried out on the
basalt and alluvial materials.
Test Methods
Laboratory testing consisted of measurement of compressive strength, tensile strength, flexural strength,
fatigue resistance, and permeability on prepared specimens. The bulk specific gravity and bulk density of
the specimens were also measured to determine the air-void content of the specimens. AASHTO or
ASTM standard test methods were followed during testing as shown in Table 4.24.

Laboratory Testing and Modeling for Structural Performance of Fully Permeable Pavements Final Report, November 2010
57
Table 4.24: Test Methods for PCC Materials
Test Test Method Preliminary Specimens
Comprehensive Specimens
Supplementary Specimens
Specimen preparation Compressive Strength Split Tensile Strength Flexural Strength Fatigue Resistance Max. Specific Gravity Bulk Specific Gravity Air-void Content Permeability
ASTM C-31 ASTM C-39
AASHTO T-198 ASTM C-78
Mod ASTM C-78 AASHTO T-209 AASHTO T-331 AASHTO T-269 ASTM PS 129-01
30 30 -- -- -- 29 29 29
All specimens
33 15 (5 per mix) 15 (5 per mix) 3 (1 per mix) 3 (1 per mix)
-- -- --
All specimens
18 9 (3 per mix) 9 (3 per mix)
-- --
6 (2 per mix) 6 (2 per mix) 6 (2 per mix) All specimens
Specimen Preparation
All concrete was mixed in a 9.0ft3 (0.25 m3) electric concrete mixer using Type II portland cement. Water
content was adjusted to obtain zero slump to better control the density of the concrete. The tamping rod
method was chosen over the Modified Proctor method for compacting the specimens based on results and
recommendations in the literature. Specimens were cured at 68°F (20°C) in a wet cure room for 28 or 56
days, depending on the phase of testing. Bulk specific gravity and bulk density were determined after
curing.
Phase 1: Preliminary Testing
The six gradations for preliminary testing were chosen to maximize the connected voids in the specimens
and are summarized in Table 4.25 and Figure 4.35. The Bailey Method, often used in HMA mix design
for optimizing air-void contents, was used for two of the gradations.
Table 4.25: Phase 1 Testing Mix Proportions.
Mix Proportions (kg/m3) Parameter Mix 1
trial Mix 2
9.5 Mix 3 4.75s
Mix 4 Bailey-1
Mix 5 Bailey-2
Mix 6 9.5s
Aggregate
12.5 mm 9.5 mm
4.75 mm 2.36 mm 1.18 mm
0.6 mm 0.3 mm
0.15 mm 0.075 mm
4.5 87.0
1,387.5 7.5 1.5 0.0 0.0 1.5 1.5
0.0 1,500.0
0.0 0.0 0.0 0.0 0.0 0.0 0.0
4.5 87.0
1,387.5 18.4 23.7 24.0 20.5 13.9
5.5
0.0 900.0 600.0 10.9 22.2 24.0 20.5 12.4
4.0
0.0 900.0 600.0 21.8 44.4 48.0 41.0 24.8
8.0
0.0 1,500.0
0.0 10.9 22.2 24.0 20.5 12.4
4.0 Cement Water W/C ratio
- - -
455.0 98.0 0.22
350.0 105.0 0.30
350.0 98.0 0.28
350.0 98.0 0.28
350.0 98.0 0.28
350.0 98.0 0.28

Laboratory Testing and Modeling for Structural Performance of Fully Permeable Pavements Final Report, November 2010
58
0%
10%
20%
30%
40%
50%
60%
70%
80%
90%
100%
0.010.1110100
Sieve Size (mm)
Pe
rce
nt
Pas
sin
g
Mix 6
Mix 5
Mix 4
Mix 3
Mix 2
Mix 1
Figure 4.35: Gradations of six preliminary mix proportions.
Test results are summarized in Table 4.26 and Figure 4.36. The average permeability tended to increase
with increasing air-void content and the compressive strength tended to decrease with increasing air-void
content, as expected. The standard deviations for the permeability values were relatively large compared
to the average values. This was attributed to variations in the interconnectivity of the voids between
specimens. The air-void contents were similar within each of the mix gradations, but differed by up to
25 percent between gradations. Mix 2 (uniform gradation using 9.5 mm aggregate) had the highest air-
void content, greatest permeability, and lowest compressive strength of all the specimens. Strengths were
generally significantly lower than comparative typical dense-graded concrete. It should be noted that
permeability is highly dependent on void connectivity and consequently high variability when testing
laboratory specimens is expected.
Table 4.26: Test Results from Preliminary Testing Air-Void Content (%) Permeability (cm/s) Compressive Strength (MPa) Mix
Average Std. Dev Average Std. Dev Average Std. Dev 1 2 3 4 5 6
29.8 35.4 31.7 30.7 28.6 29.1
0.00 0.94 0.63 2.00 0.53 1.27
4.52 6.75 5.23 5.84 3.97 4.53
2.94 3.75 0.97 3.06 1.46 2.48
4.48 1.45 2.71 4.33 5.06 3.99
0.33 0.35 0.38 1.58 0.72 0.72
Based on these results, Mixes 4, 5 and 6, which showed the best balance between strength and
permeability, were selected for more comprehensive testing. Initial results indicate that the permeability
exceeded requirements (4) and that the gradings could be densified (i.e., permeability reduced) to improve
strength.
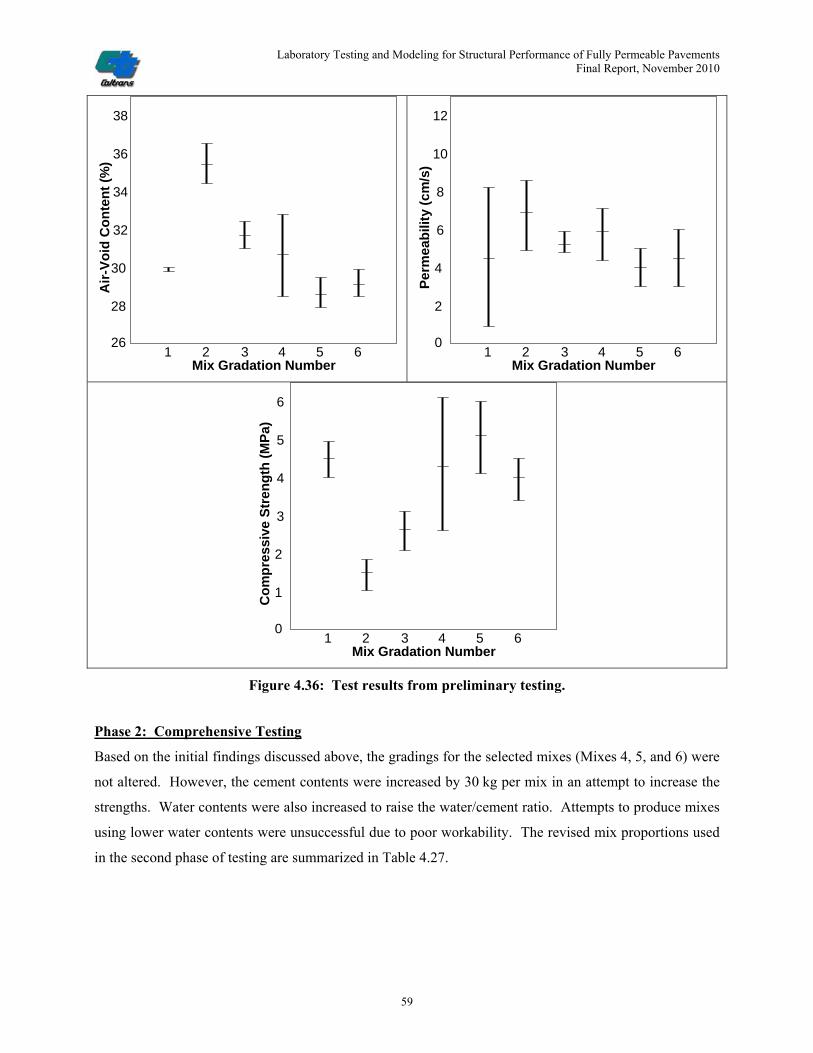
Laboratory Testing and Modeling for Structural Performance of Fully Permeable Pavements Final Report, November 2010
59
38
21
36
34
32
30
28
263 4 5 6
Mix Gradation Number
Air
-Vo
id C
on
ten
t (%
)
12
21
10
8
6
4
2
03 4 5 6
Mix Gradation Number
Per
mea
bili
ty (
cm/s
)
6
21
5
4
3
2
1
03 4 5 6
Mix Gradation Number
Co
mp
ress
ive
Str
eng
th (
MP
a)
Figure 4.36: Test results from preliminary testing.
Phase 2: Comprehensive Testing
Based on the initial findings discussed above, the gradings for the selected mixes (Mixes 4, 5, and 6) were
not altered. However, the cement contents were increased by 30 kg per mix in an attempt to increase the
strengths. Water contents were also increased to raise the water/cement ratio. Attempts to produce mixes
using lower water contents were unsuccessful due to poor workability. The revised mix proportions used
in the second phase of testing are summarized in Table 4.27.

Laboratory Testing and Modeling for Structural Performance of Fully Permeable Pavements Final Report, November 2010
60
Table 4.27: Comprehensive Testing Mix Proportions.
Mix Proportions (kg/m3) Parameter Mix 4
Bailey-1 Mix 5
Bailey-2 Mix 6
9.5+sand
Aggregate
9.5 mm 4.75 mm 2.36 mm 1.18 mm
0.6 mm 0.3 mm
0.15 mm 0.075 mm
900.0 600.0 10.9 22.2 24.0 20.5 12.4
4.0
900.0 600.0 21.8 44.4 48.0 41.0 24.8
8.0
1,500.0 0.0
10.9 22.2 24.0 20.5 12.4
4.0 Cement Water W/C ratio
- - -
380.0 120.0 0.32
380.0 121.0 0.32
380.0 128.0 0.34
Test results are summarized in Table 4.28 and Table 4.29. Figure 4.37 provides a graphical display of the
variance of strength with time, showing only a marginal increase in strength over the second 28-day
curing period. The trend between tensile strength and permeability is shown in Figure 4.38, with a general
decrease in tensile strength with increase in permeability evident, as expected. The fatigue life of the
different mixes at the different stress ratios is plotted in Figure 4.39. Results from other studies (17-21)
are plotted for comparative purposes. The eight percent increase in cement content between the
preliminary and comprehensive test specimens caused an increase of approximately 97 to 150 percent in
compressive strength and a decrease in permeability of approximately 55 to 60 percent. An exception was
the Bailey-1 mix, which had lower strengths compared to the other two mixes. The compressive strength
of this mix only increased approximately 10 percent with the increase in cement content. The specimens
did not gain a significant amount of additional strength between 28 and 56 days.
Although the compressive strengths increased significantly with the higher cement content, they were still
considerably lower than typical dense-graded mixes tested at the UCPRC in other projects (28-day
compressive strengths of between 28 MPa and 30 MPa were obtained [22]). Flexural strengths were also
lower than comparative dense-graded mixes. The Bailey-2 and 9.5 + sand mixes had higher flexural
strengths than the Bailey-1 mix. However, these strengths were about 1.2 MPa lower than strengths
obtained on dense-graded mixes (22).
Fatigue performance was very dependent on the stress ratio, as expected. Performance compared
favorably with dense-graded mixes in certain field studies conducted elsewhere in the United States
(17,18,19), but poorer when compared to other studies (20,21). The Bailey-2 had the best fatigue
performance, followed by the 9.5 + sand and Bailey-1 mixes.

Laboratory Testing and Modeling for Structural Performance of Fully Permeable Pavements Final Report, November 2010
61
Table 4.28: Average Strength and Permeability Values for Comprehensive Test Specimens
28-Day Compressive Strength (MPa)
56-Day Compressive Strength (MPa)
28-Day Tensile Strength (MPa)
56-Day Tensile Strength (MPa)
56-Day Flexural Strength (MPa)
Permeability (cm/s) Mix
Average Std. Dev. Average Std. Dev. Average Std. Dev. Average Std. Dev. Average Std. Dev. Average Std. Dev. Bailey-1 Bailey-2
9.5 + sand
4.74 9.95 9.97
0.30 1.48 0.84
5.35 9.58 11.28
0.76 0.01 0.11
0.97 2.03 2.56
0.06 0.14 0.37
1.10 2.25 2.39
0.34 0.10 0.03
1.25 2.33 2.35
- - -
2.64 1.62 1.81
2.41 1.02 1.05
Table 4.29: Average Fatigue Life Values for Comprehensive Test Specimens
Fatigue Life at Different Stress Ratios Mix
0.85 0.70 0.55 Bailey-1 Bailey-2
9.5 + sand
28 84 26
5,932,036 5,352,649
Specimen broke
1,931,252 6,319,311 3,056,037
2.0
4.0
6.0
8.0
10.0
12.0
20 25 30 35 40 45 50 55 60
Time (days)
Co
mp
ress
ive
Str
eng
th (
MP
a)
0.5
1.0
1.5
2.0
2.5
3.0
3.5
4.0
Te
ns
ile
an
d F
lex
ura
l Str
eng
th (
MP
a)
Bailey 1-Compressive
Bailey 2-Compressive
9.5 Sand-Compressive
Bailey 1-Tensile
Bailey 2-Tensile
9.5 Sand-Tensile
Bailey 1-Flexural
Bailey 2 Flexural
9.5 Sand-Flexural
0.0
0.5
1.0
1.5
2.0
2.5
3.0
3.5
0.0 0.5 1.0 1.5 2.0 2.5 3.0 3.5 4.0
Permeability (cm/s)
Te
ns
ile S
tre
ng
th (
MP
a)
Figure 4.37: Strength vs. time for comprehensive specimens. Figure 4.38: Tensile strength vs. permeability for comprehensive specimens.

Laboratory Testing and Modeling for Structural Performance of Fully Permeable Pavements Final Report, November 2010
62
1.E‐01
1.E+00
1.E+01
1.E+02
1.E+03
1.E+04
1.E+05
1.E+06
1.E+07
1.E+08
1.E+09
1.E+10
1.E+11
1.E+12
1.E+13
1.E+14
1.E+15
0.1 0.2 0.3 0.4 0.5 0.6 0.7 0.8 0.9 1.0 1.1 1.2
Stress Ratio
Repetitions
B1
B2
9.5s
Zero‐Maintenance
Roesler
PCA
Darter Fiels Slabs
Vesic and Saxena
Figure 4.39: Fatigue life of comprehensive specimens.
Phase 3: Supplementary Testing
In this phase, the influence on performance of different aggregate type and additional cement was
investigated. Two additional, different aggregate types and one additional cement content were
investigated. The 9.5 mm aggregate-with-sand gradation (Mix 6) was chosen for this testing because it
showed the best combination of strength and permeability in the Phase 2 testing. The revised mix
proportions are summarized in Table 4.30. A slightly lower water/cement content ratio was used
compared to the Phase 2 testing to assess the impact of this variable on workability, permeability, and
strength. Permeability was measured after 28 days of curing, while the compressive and tensile strengths
were determined after 56 days of curing. The results are summarized in Table 4.31.
Table 4.30: Supplementary Testing Mix Proportions.
Mix Proportions (kg/m3) Parameter Different
Aggregate Additional
Cement
Aggregate
9.5 mm 4.75 mm 2.36 mm 1.18 mm
0.6 mm 0.3 mm
0.15 mm 0.075 mm
1,500.0 0.0
10.9 22.2 24.0 20.5 12.4
4.0
1,500.0 0.0
10.9 22.2 24.0 20.5 12.4
4.0 Cement Water W/C ratio
- - -
380.0 108.0 0.28
410.0 115.0 0.28

Laboratory Testing and Modeling for Structural Performance of Fully Permeable Pavements Final Report, November 2010
63
Table 4.31: Test Results from Supplementary Testing
Compressive Strength (MPa) Tensile Strength (MPa) Permeability (cm/s) Mix Average Std. Dev. Average Std. Dev. Average Std. Dev.
Granite Basalt
Alluvial Add. cement
5.59 9.11 6.00 3.89
- - - -
4.44 6.83
- 4.02
- - - -
1.78 1.17 1.48 2.95
1.14 0.50
- 2.95
The Phase 3 compressive strengths were considerably lower than the Phase 2 (comprehensive testing)
results for the granite material that was used in both tests as well as in the test to assess the influence of
additional cement. The compressive strength of the alluvial material was higher than that of the granite in
this phase of testing, but lower compared to the results obtained in the Phase 2 testing. Tensile strength
values from the supplementary testing were between 1.5 and 2.5 times higher than the tensile strength
values obtained in Phase 2.
Lower permeability values were obtained with the basalt and alluvial materials compared to the granite,
probably due to the aggregate shape. Permeability increased with increasing cement content, which was
not expected. The increase in permeability and decrease in strength for the specimens with additional
cement was attributed to the lower water-to-cement ratio, which led to clumping of the cement during
mixing and consequent poor coating of the aggregate. The drier clumps of cement also reduced the
workability of the concrete, leading to poor consolidation during rodding.
It should be noted that although no durability testing was carried out, some stone loss was evident on
most of the specimens during handling, indicating that the mixes are likely to have some susceptibility to
raveling under traffic. Since completion of the laboratory testing, the use of revised mix designs and
proprietary additives has been discussed with a number of readymix suppliers as a means to limit raveling.
These should be considered when constructing full-scale experiments, with recommendations for
laboratory durability testing and, if appropriate, restrictions on areas of use based on the results of these
experiments.
Summary of Test Results on Open Graded Concrete
Test results indicate a clear relationship between aggregate grading, cement content, water-to-cement
ratio, and strength and permeability. All specimens tested exceeded the anticipated permeability
requirements, indicating that aggregate gradings and cement contents can be adjusted to increase the
strength of the material while still retaining adequate water flow through the pavement. The water-to-
cement ratio appears to be critical in ensuring good constructability and subsequent performance of the

Laboratory Testing and Modeling for Structural Performance of Fully Permeable Pavements Final Report, November 2010
64
pavement. Although no durability testing was carried out, the mixes are likely to have some susceptibility
to raveling under traffic.
4.3.5 Cast Portland Cement Concrete
Testing in this phase investigated the use of standard dense-graded portland cement concrete with precast
or cast-in-place holes. Careful consideration needed to be given to the design of the holes to ensure
sufficient strength, adequate drainage of water, and safe use for bicycle, motorcycle, motor vehicle, and
possibly pedestrian traffic. Testing focused on a comparison of tensile and flexural strengths between
specimens with and without holes.
Beam Design
A number of hole/slot configurations were considered. However, the production of laboratory-scale slabs
proved to be extremely difficult in terms of removing the mold from the slab and damage to the slab
during handling. These problems are not anticipated for slabs cast in place. Ultimately only one design
was pursued for laboratory testing. The general design followed is shown in Figure 4.40, based on a 12 ft
(3.6 m) wide by 15 ft (4.5 m) long slab. Drain holes are 2.0 in. (50 mm) apart and 0.5 in. (12.5 mm) in
diameter and are staggered so as to catch all the water that flows across the slab in a transverse or
longitudinal direction. The surface-to-void ratio, defined as the ratio between surface drainage area
(holes) and total surface area, was 3.1 percent.
0 5 10 150
2
4
6
8
10
12Overall Surface void ratio = 0.031, DX=2.0", DY=2.0", Diameter = 0.500"
Figure 4.40: Top view of cast porous concrete pavement.

Laboratory Testing and Modeling for Structural Performance of Fully Permeable Pavements Final Report, November 2010
65
The design of a laboratory scale beam, using actual hole size and hole spacing, is shown in Figure 4.41.
The design was based on the assumption that at least five holes across the slab would be necessary to
provide an indication of potential behavior in the field. Accommodating five holes across the beam plus
sufficient space between the edge of the slab and the first set of holes required a beam width of 11 in.
(275 mm). A beam length of 37 in. (925 mm) was used to maintain appropriate beam geometry. The
depth of the beam was set at 6.0 in. (150 mm), in line with standard laboratory practice for producing
concrete beams.
0 2 4 6 8 10 12 14 16 18 20 22 24 26 28 30 32 34 36-5
0
5
Length Direction (inch)
Wid
th D
irec
tio
n (i
nch
)
p p p
Figure 4.41: Top view of laboratory scale cast porous beam specimen.
Material Sampling
All testing was carried out with the alluvial materials discussed in the previous sections.
Test Methods
Laboratory testing consisted of measurement of compressive tensile and flexural strength, and
permeability on prepared specimens. AASHTO or ASTM standard test methods were followed during
testing as shown in Table 4.32. The permeability of the specimens was tested using the same procedure
discussed in the previous sections.
Table 4.32: Test Methods for Cast PCC Materials
Test Test Method No. of Specimens Specimen preparation Split Tensile Strength Flexural Strength
ASTM C-31 AASHTO T-198
ASTM C-78
12 12 6
All specimens were tested under monotonic loading with peak load at failure recorded. Efforts were
made to record the complete load-displacement curve, including the post-peak response; however, this
was beyond the capability of the testing frame.

Laboratory Testing and Modeling for Structural Performance of Fully Permeable Pavements Final Report, November 2010
66
Beam Fabrication
Two custom wooden molds were fabricated to cast the specimens (Figure 4.42). This final design was
selected after a number of earlier attempts that failed for a number of reasons, including
bending/alignment/breakages of the vertical dowels, problems with removing the mold after fabrication,
poor distribution of the concrete in the mold (i.e., cavities around dowels and along beam edges), and
damage to the specimen during handling after fabrication. The final design incorporates steel dowels with
rubber pipe sleeves. Waterproof lubricants were applied between the rubber sleeves and steel dowels as
well as the outside surface of the rubber sleeves. It is anticipated that full-scale construction would use
plastic tubes for hole casting and that these tubes would remain in the concrete after casting.
A standard Caltrans half-inch maximum aggregate size design was used, although water contents were
increased to improve flow within the mold and reduce the formation of cavities. Practice preparation
revealed that a generally smooth specimen with no serious cavities could be produced (Figure 4.43).
Figure 4.42: Cast beam specimen molds. Figure 4.43: Demolded cast beam specimen.
Three sets of specimens were prepared for the study, with each set including four standard beams
(impermeable), four cylinders (impermeable), and two permeable beams. Specimens were cured in a
moisture room at 68°F (20°C) for 36 days. Testing after curing was carried out after seven days on the
first set of specimens and after 134 days on the second and third sets of specimens.
Test Results
Test results are summarized in Table 4.33. The results clearly show that splitting strength (1.6 MPa on
average) was significantly lower than the modulus of rupture (3.4 MPa on average for 43-days and
5.0 MPa on average for 170-days). This trend was expected although the ratio between splitting strength

Laboratory Testing and Modeling for Structural Performance of Fully Permeable Pavements Final Report, November 2010
67
and modulus of rupture was lower than expected. The minimal increase in splitting strength with increase
in age was also unexpected.
Table 4.33: Modulus of Rupture for Beams and Splitting Strength for Cylinders
Specimen Type
Set Batch Specimen
Age (days)
Setup1
Result2
(MPa)
1 1
RTA249-PEA-B1 RTA249-PEA-B2 RTA249-PEA-B3 RTA249-PEA-B4
43
4PB, no weight correction 3PB, weight corrected, 1" notch
3PB, weight corrected 3PB, weight corrected
2.7 3.4 3.3 4.1
2 1 RTA249-PEA-B5 RTA249-PEA-B6
170 3PB, weight corrected, 1” notch 4.6 5.0
2 2 RTA249-PEA-B7 RTA249-PEA-B8
170 3PB, weight corrected, 1” notch
3PB, weight corrected 4.8 5.0
3 1 RTA249-PEA-B9
RTA249-PEA-B10 165 3PB, weight corrected
5.0 4.7
Beam
3 2 RTA249-PEA-B11 RTA249-PEA-B12
165 3PB, weight corrected 5.0 5.3
1 1
RTA249-PEA-C1 RTA249-PEA-C2 RTA249-PEA-C3 RTA249-PEA-C4
43
2.1 1.2 1.6 1.4
2 1 RTA249-PEA-C5 RTA249-PEA-C6
170 1.4 1.8
2 2 RTA249-PEA-C7 RTA249-PEA-C8
170 1.8 1.4
3 1 RTA249-PEA-C9
RTA249-PEA-C10 165
2.1 1.0
Cylinder
3 2 RTA249-PEA-C11 RTA249-PEA-C12
165
Indirect Tension
1.4 1.9
1 2 RTA249-PEA-PB1 RTA249-PEA-PB2
44 3PB, weight corrected 3.9 3.7
2 1 RTA249-PEA-PB3 170 3PB, weight corrected, 1” notch 3.6 2 2 RTA249-PEA-PB4 170 3PB, weight corrected 3.2 3 1 RTA249-PEA-PB5 165 3PB, weight corrected 2.9
Beam + holes
3 2 RTA249-PEA-PB6 165 3PB, weight corrected 1.9 1 3PB = Three Point Bending, 4PB = Four Point Bending 1 Weight corrected indicates bottom support placed at 1/3 division points to balance the self-weight of beams during testing. 1 1” notch was sawn from the bottom. 2 Modulus of rupture/splitting strength for cylinders calculated after accounting for geometry but not self-weight.
The comparison of modulus of rupture between regular beams and beams with holes is shown in
Table 4.34 for the three sets of specimens. The ratio between the modulus of rupture for the two types of
beam ranged between 0.48 and 1.12 for the three sets of results. The ratio based on the second set of
specimens was selected for use in further analyses, given that the beams with holes in the first set of
specimens were prepared in a different batch from the regular beams, while those in the third set of
specimens were cured under different conditions. It is therefore concluded that the strength ratio between
the beams with holes and regular beams is about 0.71.

Laboratory Testing and Modeling for Structural Performance of Fully Permeable Pavements Final Report, November 2010
68
The permeability was considered adequate for typical California rainfall events (4). Cast beams are
unlikely to ravel, although spalling around the holes may be a problem over time.
Table 4.34: Comparison of Modulus of Rupture for Beams and Beams with Holes
Modulus of Rupture (MPa) Set Regular Beam Beam with Holes
Ratio
1 2 3
3.4 4.8 5.0
3.8 3.4 2.4
1.12 0.71 0.48
Finite Element Analysis
Finite Element Analysis (FEA) was undertaken to establish the link between regular beam strength (in
terms of modulus of rupture) and that of the beams with holes. This was accomplished by evaluating the
effect of a circular hole on overall specimen strength. An FEA technique known as the “embedded
discontinuity method (EDM)” in the class of strong discontinuity approaches (SDA) was used in a Matlab
software program to carry out the related analysis (23).
Concrete is a quasi-brittle material that can be described by a cohesive crack model (24). Once the peak
strength is reached, residual traction across the crack faces remains in effect although its magnitude
decreases with the amount of crack opening. The total specific energy required for a crack to propagate a
unit length in concrete is assumed to be a constant. A typical value for peak strength is 3.0 MPa, and a
typical value for the energy required is 0.1 N/mm. It is also assumed that the softening function is
exponential.
A simplification of the analysis on beams with holes is achieved by analyzing a horizontal slice at the
bottom of the test beam, subjected to approximately uniform uniaxial tension over the total area. A further
simplification is reached by isolating a 4.0 in. (100 mm) long by 2.0 in. (50 mm) wide area centered
around one of the circular holes from the bottom of the slice and then excluding all but the central hole.
The simplified model is subjected to uniaxial tension in the horizontal direction. After considering
symmetry, a 4.0 in. (100 mm) long by 1.0 in. (25 mm) wide finite element mesh is used to analyze the
model (Figure 4.44).
The load displacement curve is shown in Figure 4.45. The peak load for a 0.04 in. (1.0 mm) thick
horizontal slice shown in Figure 4.44 is 54.4 N, which corresponds to 73 percent of the peak load
(3.0 N/mm2 x 25 mm x 1 mm = 75 N) for the case without the hole. Since the crack propagates along the
narrowest cross section, the presence of a circular hole leads to a 25 percent reduction in effective cross

Laboratory Testing and Modeling for Structural Performance of Fully Permeable Pavements Final Report, November 2010
69
section for the finite element model. The stress concentration around the circular hole leads to an
additional two percent reduction in peak load.
Figure 4.44: Horizontal stress contour after crack has propagated 0.35 in. (9.0 mm).
(Crack indicated by the thick blue line, red area is tension, and blue area is compression).
0 0.01 0.02 0.03 0.04 0.05 0.06 0.070
10
20
30
40
50
60
Horizontal displacement (mm)
Tot
al H
oriz
ont
al F
orc
e A
pplie
d (
mm
)
Peak Load 54.4-N
Figure 4.45: Load displacement curve for FEM model shown in Figure 4.44.
Based on the above analysis, it was concluded that weakening in the beams with holes is mostly caused
by a reduction in resisting tension area. The bottom view of a cracked beam with holes is shown in
Figure 4.46, which indicates that cracks propagate through the holes in a transverse direction and then
interconnect in a skewed angle. Since cracks are forced to interconnect along a longer skewed path, a
more conservative (larger) effective cross section reduction of 23 percent can be used
(5 x 0.5 in. / 11 in. = 23%). In other words, the strength of a beam with holes is approximately 77 percent
that of a regular beam. This is slightly higher than the observed values (i.e., 71 percent). The difference
can be explained partly by the stress concentration effect caused by the circular holes and partly due to

Laboratory Testing and Modeling for Structural Performance of Fully Permeable Pavements Final Report, November 2010
70
fabrication issues in that it is more difficult to cast a perfect beam with holes given the proximity of the
steel pins to each other.
Figure 4.46: Bottom view of beam with holes (RTA249-PEA-PB6) after strength test.
Results were used as input for the computer modeling study and structural design tables discussed in
Chapter 5 and Chapter 6 respectively.
Summary of Test Results on Cast Concrete Slabs
The limited results from this study indicate that small-scale permeable beams exhibit a modulus of
rupture about 71 percent of that measured for regular beams mixed and cured under exactly the same
conditions. Based on a finite element analysis, weakening of the permeable beams is mostly caused by a
reduction in crack resistance cross section, while the effect of stress concentration can be ignored. This
implies that modulus of rupture values for permeable beams should be about 77 percent that of regular
beams. This relatively small discrepancy between observed and calculated values (71 percent vs.
77 percent) is believed to be attributed to poorer consistency in the permeable beams compared to regular
beams. For this particular drainage pattern, a 70 percent strength ratio is recommended for use in design.
Permeable concrete pavements with similar surface void ratio (3.1 percent in this study) can be designed
the same way as regular non-permeable concrete pavements. The effect of the vertical drainage holes can
be accommodated by reducing the modulus of rupture value. This reduction can be estimated by
calculating the reduction in crack resisting cross section normal to the direction of maximum principle
stress induced by truck traffic. An additional 10 percent reduction in design modulus of rupture is
recommended to account for the lower homogeneity caused by the existence of the drainage holes.

Laboratory Testing and Modeling for Structural Performance of Fully Permeable Pavements Final Report, November 2010
71
Chapter 5 Performance Modeling
5.1 Introduction
The approach used for development of detailed pavement designs in this study is referred to as
“mechanistic-empirical” or “ME.” Caltrans is in the process of implementing this approach as a
replacement for the empirical R-value design method for flexible (asphalt-surfaced) pavement designs,
and has replaced the previous design tables for rigid (concrete-surfaced) pavements with a new catalog of
designs based on ME analysis. The assumptions of the R-value design method for flexible pavements,
including standard compaction and pavement structural layering, are also not appropriate for asphalt-
surfaced fully permeable pavements.
For this project, the ME approach was used for both flexible and two types of rigid fully permeable
pavements to produce a set of designs for different Traffic Indexes (TI), climate, and soil conditions. The
different pavement types are summarized in Figure 5.1. The two types of rigid pavements were those
surfaced with open-graded PCC (PCC-O) in which the surface is permeable because of the aggregate
gradation, and those surfaced with ordinary dense-graded PCC in which the surface has drainage holes
cast into it during construction (cast PCC). The results of the analyses were used to produce a catalog of
designs, similar to the catalog designs prepared by the UCPRC for the Caltrans Rigid Pavement Design
Catalog currently used in the Caltrans Highway Design Manual (HDM). All calculations considered two
subbase options:
No subbase 0.5 ft (150 mm) thick open-graded portland cement concrete subbase to provide support to the
granular layer, and help protect the saturated subgrade.
Permeable surface Permeable surface
Permeable base/reservoir layer
Permeable base/reservoir layer
PCC-O subbase
Subgrade Subgrade
No subbase
With subbase
Figure 5.1: Pavement structures analyzed.

Laboratory Testing and Modeling for Structural Performance of Fully Permeable Pavements Final Report, November 2010
72
5.2 Portland Cement Concrete Surfaced Fully Permeable Pavement
The factorial for performance modeling of fully permeable pavement surfaced with open-graded portland
cement concrete (PCC-O) or cast PCC with drainage holes is summarized in Table 5.1. A total of 1,536
different cases were run. Variables for the PCC layer include surface material type (PCC-O or cast PCC),
slab thickness, slab length, material properties, climate zone, season, diurnal peak temperature gradient,
axle type, axle load, load location, and traffic volume. The analysis process followed is summarized in
Figure 5.2.
Structural Design(Thickness & Length of
PCC-O/Cast Slab)
Laboratory Testing Phase(Test Results: Mechanical
Properties)
Hydraulic Design(Thickness of Base + PCC-O)
Design Fully Permeable Pavement
Hydraulic Properties
Identify Critical Factors
Simulate Hydraulic Behavior
Calculate Hydraulic Responses
Determine Hydraulic Performance
Fully Permeable PCC Pavement Design
Get Mechanical Properties(Materials: PCC-O/Cast Slab,
Gravel, PCC-O Subbase, Subgrade Soils.
Properties: Fatigue, Strength, Stiffness, etc.)
Identify Critical Factors(Region, PCC type, Structure
Type, Thickness, k-values, Load, etc.)
Calculate Mechanical Responses(Tensile Stress in PCC-O/Cast
Slab.)[Tool: EverFE]
Calculate Fatigue Life (TI) inPCC-O/Cast Slab
(Tool: Miner’s Law)
Draw Design Plots of TI vs. Slab thickness/slab length
Interpolation(TI interpolation for different Slab thickness & length using Bilinear
Interpolation Function)
Figure 5.2: Analysis process for developing structural designs for fully permeable PCC pavements.

Laboratory Testing and Modeling for Structural Performance of Fully Permeable Pavements Final Report, November 2010
73
Table 5.1: Summary of Experimental Design for Performance Modeling of PCC
Layer Label Material
(M)
Slab/Layer Thickness
(Th)
Slab Length
(L)
Properties
(MP)
Climate Zone (C)
Season
(S)
Diurnal Peak1 (DP)
Axle Type2
(AT)
Axle Load2
(AL)
Load Location
(LL)
Traffic Volume
(TV)
PCC-O 9.5s 0.25m 0.35m 0.50m
3.0 x 3.5m 4.5 x 3.5m
E= 10 GPa, v=0.2 CTE=6.5-6/°C ρ=2,000kg/m3
Sac LA
Winter Summer
Day Night
Dual/single Dual/tandem
0.8L ~ L3 L ~ Max4
Corner Mid edge
1
Surface
Cast slab Slab 0.25m 0.35m 0.50m
3.0 x 3.5m 4.5 x 3.5m
E= 30 GPa, v=0.2 CTE=6.5-6/°C ρ=2,000kg/m3
Sac LA
Winter Summer
Day Night
Dual/single Dual/tandem
0.8L ~ L3 L ~ Max4
Corner Mid edge
1
Support layer
Base, subbase & subgrade
- - - k=50MPa k=80MPa
- - - Dual/single
Dual/tandem 0.8L ~ L3 L ~ Max4
- 1
Base Base Alluvial Basalt Granite
0.5m 1.0m 1.5m
- Mr=30 MPa, v=0.4
Mr=100 MPa, v=0.4 Mr=200 MPa, v=0.4
- - - - - - -
Subbase Subbase In situ PCC-O
0.0m 0.15m
- -
E=10 GPa, v=0.2 - - - - - - -
Subgrade Subgrade Silt - - Mr=20 MPa, v=0.45 Mr=50 MPa, v=0.45 Mr=100 MPa, v=0.45
- - - - - - -
Number of Calculations Label M Th L MP C S DP AT AL LL Total
1 3 2 1 2 2 2 2 2 2 384 Surface 1 3 2 1 2 2 2 2 2 2 384
Support layer 1 1 1 2 1 1 1 1 1 1 2 Base 3 3 1 3 1 1 1 1 1 1 27 Subbase 2 2 1 1 1 1 1 1 1 1 4 Subgrade 2 1 1 3 1 1 1 1 1 1 6
1 Diurnal Peak Calculations 2 Load Geometric Configuration Zone Thickness (m) Season DayA NightA
Jan 29.3 19.2 Axle Type Load bin
Load (kN)
Tire Pavement Contact5
(mm) 0.25
Jul 70.9 -56.5 0.8L ~ L3 75 179 x 150 Jan 18.9 -12.9
Dual Single L ~ Max4 93 221 x 150
0.35 Jul 48.7 -37.2 0.8L ~ L3 135 161 x 150 Jan 13.8 -9.3
Dual Tandem L ~ Max4 155 185 x 150
Sac
0.50 Jul 36.5 -25.8 Jan 38.4 -23.9
0.25 Jul 45.8 -30.6 Jan 25.3 -15.7
0.35 Jul 31.1 -20.4 Jan 18.7 -11.1
LA
0.50 Jul 23.4 -14.0
A Thermal Gradient of PCC (°C/m) 30-year average
(1961-1990) 3 Load midway between the legal load and the maximum load 4 Load midway between 0.8 times the legal load and the legal load 5 Tire pavement contact length x width

Laboratory Testing and Modeling for Structural Performance of Fully Permeable Pavements Final Report, November 2010
74
Material properties for each of the layers were obtained from the laboratory study (1). Climate details
were obtained from a database of California climatic data, and the thermal gradient values were calculated
from 30 years (1961 to 1990) of data using the Enhanced Integrated Climate Model (EICM). The
maximum, minimum, and average of the 30-year thermal gradient at each hour in each day for January
and July were calculated as shown in Figure 5.3. The maximum and minimum of the average day for
those two months were chosen as the day thermal gradient and night thermal gradients for calculation,
respectively (example in Figure 5.3). Axle loads were obtained from a database of California weigh-in-
motion (WIM) stations. The rigid pavements were modeled as two layer systems, the slab and the
supporting layers, with a composite k-value (modulus of subgrade reaction) simulating all layers below the
slab acting together. A separate factorial for the supporting layers was used to derive two different input
k-factors for the supporting layers.
Figure 5.3: Example thermal gradient calculation for PCC pavements.
Due to the thousands of calculations required to determine critical stresses and strains using layer elastic
theory for HMA-surfaced pavements and finite element analysis for open-graded concrete and cast
concrete, the traffic loads included in the calculations were reduced to two each for both single and
tandem axles:
The traffic repetitions between the 50th percentile load and the legal maximum load, with the representative load taken approximately halfway between the 80th percentile load and the legal maximum load. The representative load selected imparts some conservatism to the designs.
The traffic repetitions between the legal maximum load and the maximum load (neglecting a few outliers that are heavier), with the representative load taken approximately halfway between the legal maximum load and the maximum load. The representative load selected imparts some conservatism to the designs.

Laboratory Testing and Modeling for Structural Performance of Fully Permeable Pavements Final Report, November 2010
75
Steering single and tridem axle loads were not considered because they contribute very little to damage,
based on the calculations from the UCPRC/Caltrans weigh-in-motion database (WIM)(25). These loads
were selected based on the understanding that the vast majority of pavement damage is caused by the
heaviest loads, particularly for concrete, and examination of typical axle-load spectra from the
UCPRC/Caltrans WIM database which showed that the first load group shown above was representative
of a significant percentage of the loaded axles found on California highways, and the second load group
was representative of the few loads that cause the most damage.
The allowable truck traffic (ESAL or TI) during the design life was calculated using a set of factors,
including seasonal factor (winter or summer), day/night factor, axle type factor (single or tandem), ESAL
factor (the average ESALs per axle), and load bin factor (percent of total axle repetitions for each axle in
each load range) as shown in Table 5.2. The value of each factor was determined based on the statistical
analysis of statewide traffic information from the UCPRC/Caltrans Weigh-in-Motion database (25). As
mentioned previously, axle loads less than half the legal load were ignored in order to keep the number of
required calculations to an acceptable value, which was considered reasonable since they contribute very
little to fatigue damage.
Table 5.2: Load Spectrum Factors for PCC Structures Seasonal Factor Day/Night Factor Axle Type Factor ESAL Factor
Winter Summer Day Night Single Tandem Single Tandem 0.5 0.5 0.45 0.55 0.2 0.8 0.17 0.3
Load Bin Factor Single Tandem
0.8Legal~Legal (75 kN)
Legal~Max (93 kN)
0.8Legal~Legal (135 kN)
Legal~Max (155 kN)
0.492 0.008 0.46 0.04
The various factors listed in Table 5.2 are explained as follows:
Seasonal Factor. UCPRC WIM data study (25) indicated that axle loads were evenly distributed across all months.
Day/Night Factor. UCPRC WIM study indicated that more loaded trucks travel at night than during daylight hours.
Axle Type Factor. UCPRC weigh-in-motion data study indicated that Truck Type 5 (typically with a steering single and one loaded single axle) and Truck Type 9 (typically with a steering axle and two loaded tandem axles) dominate the truck composition on California highways, and that there are twice as many Type 9 than Type 5 trucks on average across the state. This results in one third of the trucks having one single axle, and two thirds of the trucks having two tandem axles, resulting in 20 percent single axles and 80 percent tandem axles in the total population of axles shown in the table. (See Figure 12 in Reference 25 for further information).
ESAL Factor. The ESAL factor provides the number of equivalent single axle loads (ESAL, based on 18,000 lb [80 kN] single axle) per axle repetition, calculated for each axle type on a statewide average of all Caltrans WIM stations between 1993 and 2001 (25). The ESAL calculations used an

Laboratory Testing and Modeling for Structural Performance of Fully Permeable Pavements Final Report, November 2010
76
exponent of 3.8, recommended by the Federal Highway Administration, rather than the 4.2 exponent normally used by Caltrans (25). This factor converts the ESALs in the Traffic Index into total axle repetitions. (See Figure 35 in Reference 25 for further information).
Load Bin Factor: The load bin factor indicates the percentage of axle repetitions for each axle type out of the total repetitions of that axle type for the two load ranges used in the calculations: half the legal load to the legal load, and the legal load to the maximum load.
Cracking due to tensile stresses in the slab was the distress type modeled. Four locations were considered:
Mid-slab edge at the top of the slab. Mid-slab edge at the bottom of the slab. Near the corner of the slab at the top of the slab. Near the corner of the slab at the bottom of the slab.
Mechanical responses in terms of tensile stress in the slab from different load configurations were
determined using the EverFE software package (26) for finite element analysis of concrete pavement. The
stiffness of cast slabs in EverFE was estimated from conventional PCC by a factor of 0.92 (i.e., 30 GPa
0.92 = 27.6 GPa) (27). The stresses from EverFE were given a factor of 3.0 to reflect the stress
concentration around the holes in the cast slabs, based on separate finite element analyses completed prior
to the EverFE calculations.
The results of the EverFE stress calculations were then used as input in a Miner’s Law equation to
calculate the fatigue performance of the slabs. The Miner’s Law equation (27), also referred to as the
Linear Cumulative Damage (LCD) equation, was used to calculate the fatigue damage under specific
conditions (pavement structure, traffic loading, climate conditions). The actual repetitions to failure, n,
were calculated using the Miner’s Law equation to determine the number of ESALs (later converted to
Traffic Index, D = 1.0 in Equation 5.1) for each combination of pavement type, slab dimensions,
thicknesses, and climate region. The actual repetitions for failure were then converted back into ESALs,
and then into Traffic Index.
The Miner’s Law equation is shown in Equation 5.1.
i i
i
N
nD (5.1)
where: D = Damage from fatigue; ni = The actual repetitions under ith condition of axle type, climate condition, and
pavement structure, calculated from load spectrum; Ni = The allowable repetition under ith condition, calculated from fatigue equation.
and,
LBESALaxletypenightdayseasonali FFFFFESALn /1/ (5.2)

Laboratory Testing and Modeling for Structural Performance of Fully Permeable Pavements Final Report, November 2010
77
where: ESAL = ESALs for the Traffic Index. Fseasonal = Seasonal factor. Fday/night = Day/night factor. Faxletype = Axle type factor. FESAL = ESALs per axle repetition per ESAL coefficient (calculated for average state
network by Lu (Equation 3) using 3.8 exponent and the values used were taken from Figure 35 for years 1991 to 2000).
FLB = Load bin factor.
Based on the laboratory fatigue testing results from this project (Figure 5.4)(2), the Zero-Maintenance
fatigue equation (17) was used to calculate the allowable repetitions under ith condition (combination of
factors shown in Equation 5.2) as follows (Equation 5.3):
)/1(61.1710 MRi
iN (5.3)
where: σi = Maximum tensile stress in the slab under ith condition; MR = Modulus of rupture (flexural strength) (MR=2.3 MPa for PCC-O based on
testing results [Table 4.28], and MR=2.6 MPa; for cast slabs considering stress concentration based on finite element analysis).
1.E+00
1.E+01
1.E+02
1.E+03
1.E+04
1.E+05
1.E+06
1.E+07
1.E+08
1.E+09
1.E+10
0.1 0.2 0.3 0.4 0.5 0.6 0.7 0.8 0.9 1.0 1.1 1.2
Stress Ratio
Re
pe
titi
on
s
B1B29.5sZero-Maintenance
Figure 5.4: Fatigue life of open-graded concrete pavement (PCC-O).
5.2.1 Example Results
Example predictions of design life (Traffic Index [TI]) for various combinations of variables in the
experimental design (open-graded PCC, cast slabs, climatic zone, and base stiffness in terms of k-values)
are shown in the Technical Memorandum on Performance Modeling (2). The design of fully permeable
pavements with a PCC-O or cast concrete surfacing using the data collected in this task is discussed in
Chapter 6.

Laboratory Testing and Modeling for Structural Performance of Fully Permeable Pavements Final Report, November 2010
78
5.3 Hot-mix Asphalt Surfacing
The factorial for performance modeling of permeable hot-mix asphalt wearing courses is summarized in
Table 5.3. A total of 15,552 different cases were run. The analysis process is summarized in Figure 5.5.
Variables for the hot-mix asphalt layer include material type, layer thickness, material properties, climate
zone, season, diurnal peak temperature, axle type, axle load, traffic speed, and traffic volume.
Structural Design(HMA + base + subbase
thickness)
Laboratory Testing Phase(Test Results: Mechanical
Properties)
Hydraulic Design(Thickness of base + subbase)
Design Fully Permeable Pavement
Hydraulic Properties
Identify Critical Factors
Simulate Hydraulic Behavior
Calculate Hydraulic Responses
Determine Hydraulic Performance
Fully Permeable HMA Pavement Design
Get Mechanical Properties(Materials: HMA,
Gravel, PCC-O Subbase, Subgrade Soils.
Properties: Fatigue, Strength, Stiffness, etc.)
Identify Critical Factors(Region, HMA type, Structure
Type, Thickness, Load, Speed, etc.)
Calculate Mechanical Responses(Tensile Strain at bottom of HMA and vertical stress at top of SG.)
[Tool: LEAP & GT-Pave]
Calculate Fatigue Life (TI) of HMA (Tool: Miner’s Law)
Draw Design Plots ofTI vs. HMA thickness x base
thickness
Interpolation(TI/SR Interpolation for different HMA and base thickness using Bilinear Interpolation Function)
Calculate Stress/Strength Ratio(Ratio of shear stress to shear
strength of SG soil)
Figure 5.5: Analysis process for developing structural designs for fully permeable HMA pavements.

Laboratory Testing and Modeling for Structural Performance of Fully Permeable Pavements Final Report, November 2010
79
Table 5.3: Summary of Experimental Design for Performance Modeling of Hot-mix Asphalt
Layer Label Material
(M)
Layer Thickness
(Th)
Properties
(MP)
Climate Zone (C)
Season
(S)
Diurnal Peak1 (DP)
Axle Type2
(AT)
Axle Load2
(kN) (AL)
Traffic Speed (km/h)
(TS)
Traffic Volume
(TV)
Surface HMA-O AR95 G125 RW95
0.2m 0.3m 0.4m 0.5m
E* v=0.35
Sac LA
Winter Spring
Summer
Day Night
Dual/single Dual/tandem
0.8L ~ L3 L ~ Max4
7 40
1
Base Base Alluvial Basalt Granite
0.5m 1.0m 1.5m
Mr=60 MPa, v=0.4 Mr=90 MPa, v=0.4 Mr=120 MPa, v=0.4
- - - Dual/tandem - - -
Subbase Subbase In situ PCC-O
0.0m 0.15m
- E=6 GPa, v=0.2
- - - Dual/tandem - - -
Subgrade Subgrade Clay (winter) Clay (spring)
Clay (summer) -
Mr=20 MPa, v=0.45 Mr=50 MPa, v=0.45
Mr=100 MPa, v=0.45 -
Winter Spring
Summer - Dual/tandem - - -
Number of Calculations Label M Th MP C S DP AT AL TS Total Surface 3 3 1 2 3 2 2 2 2 864 Base 1 2 1 1 1 1 1 1 1 9 Subbase 1 2 1 1 1 1 1 1 1 2 Subgrade 1 1 1 1 1 1 1 1 1 1
15,552 1 Diurnal Peak Temperature Calculations (°C) 2 Load Geometric Configuration
Zone Thickness Season DayA NightA Axle Type Load bin Load (kN) Diameter5 (mm) Jan 15.4 8.2 0.8L ~ L3 75 185 Apr 44.4 25.6
Dual Single L ~ Max4 93 206 0.2
Jul 30.0 15.9 0.8L ~ L3 135 175 Jan 14.4 8.7
Dual Tandem L ~ Max4 155 188
Apr 42.1 27.1 3 Traffic Volume Calculation 0.3 Jul 28.3 16.8 Jan 12.7 9.7
A Temperature at 1/3 depth of HMA (°C)
30-year average (1961-1990)
Travel lane Shoulder Drive Time # of lanes Drained
Apr 37.8 30.0
Sac
0.5 Jul 24.9 18.9 Jan 23.6 14.3 Apr 35.5 23.2
Low Medium
Low Medium
High
1 week 1 month 1 year
10 years
1 2 3 4 0.2
Jul 29.5 17.5 Jan 22.2 14.8 Apr 34.0 24.0 0.3 Jul 28.0 18.2 Jan 19.8 16.1 Apr 31.0 25.7
LA
0.5 Jul 25.0 19.9
3 Load midway between the legal load and the maximum load 4 Load midway between 0.8 times the legal load and the legal load 5 Tire pavement contact diameter

Laboratory Testing and Modeling for Structural Performance of Fully Permeable Pavements Final Report, November 2010
80
Material properties for each of the layers were obtained from the laboratory study (1). Three types of
open-graded hot-mix asphalt were considered in the calculations. Climate details were obtained from a
database of California climatic data, and the temperatures at one-third of the depth of the hot-mix asphalt
layer were calculated from 30 years (1961 to 1990) of data using the Enhanced Integrated Climate Model
(EICM). The maximum, minimum, and average of the 30-year temperatures at one-third depth at each
hour in each day for January, April and July were calculated as shown in Table 5.3. The maximum and
minimum of the average day for each of those three months were chosen as the day and night
temperatures for layer elastic theory calculations, respectively. Axle loads were obtained from a database
of California WIM stations (25).
Two truck traffic speeds (4 and 24 mph [7 and 40 km/h]) were included in the calculations. The slower
speed was selected to represent truck operations during traffic congestion on highways (in this case a
detour onto the shoulder) and in maintenance yards or parking areas. The faster speed was selected to
represent truck operations on a street or on a shoulder which has had traffic diverted on to it but which is
not severely congested. Each of these speeds is somewhat slower than the average speed might be for
each of these conditions. This provides a conservative assumption because HMA is less stiff under slower
speeds, which increases the strains causing fatigue cracking of the HMA layer, and increases the stresses
in the granular base and subgrade, which cause rutting.
Figure 5.6: Example one-third depth temperatures for hot-mix asphalt pavements.
The stiffness of the hot-mix asphalt was calculated from the master curves for each combination of
temperature and load frequency corresponding to loading time from flexural beam frequency sweep
testing during the laboratory study (1). The loading frequency at one-third thickness of the hot-mix

Laboratory Testing and Modeling for Structural Performance of Fully Permeable Pavements Final Report, November 2010
81
asphalt layer was calculated using Equation 5.4. The stiffness of each type of hot-mix hot-mix asphalt
material was averaged for the thickness of each layer to reduce the number of calculation combinations.
Consequently, the stiffness of the hot-mix asphalt used in the calculations was independent of the
thickness of the layer. A summary of the master curves and time-temperature relationships used is
provided in Table 4.23.
3/2
11
ThD
v
L
v
vLt
freq
(5.4)
Where: t = loading time L = loading distance v = loading speed D = loading tire/pavement contact diameter Th = thickness of HMA layer
The distresses analyzed included fatigue cracking of the HMA layer associated with the tensile strain at
the bottom of the HMA layer, and unbound layer rutting associated with the vertical stresses at the top of
the base, subbase (where included) and subgrade. Mechanical responses in terms of tensile strains at the
bottom of the HMA layer from different load configurations were determined using the layer elastic model
in the LEAP software package (29).
Vertical stresses at the top of the subgrade were also calculated using LEAP. The stiffness of the
cemented subbase (PCC-O) was estimated from flexural strength test results (example for the B2 grading
shown in Figure 5.7). Prior to the layer elastic analysis, the stiffness of the granular base was evaluated
using non-linear elastic models in the GT-Pave software package (13). A range of values for different
structural factors were selected for the structural response values of the granular base stiffness (Table 5.4).
The Uzan model (30) was used to consider the non-linear behavior of the granular base using GT-Pave.
The procedure proposed by Tutumuller and Thompson (31) was used to obtain cross-anisotropic
parameters of the granular base for GT-Pave (Table 5.5). Based on the results of these calculations, three
representative values of granular base stiffness, namely 60 MPa, 90 MPa, and 120 MPa, were chosen for
the final structural calculations. The equation for the Uzan model is shown in Equation 5.5.
321
0 0
( ) ( )KK dRM K
p p
(5.5)
where MR = resilient modulus (MPa) = σ1+ σ2+ σ3=bulk stress (kPa) σd = σ1- σ3=deviator stress (kPa) p0 = unit reference pressure (1 kPa or 1 psi) K1, K2, K2 = material constants obtained from repeated-load triaxial tests performed on granular materials.

Laboratory Testing and Modeling for Structural Performance of Fully Permeable Pavements Final Report, November 2010
82
Figure 5.7: Example stiffness test results of PCC-O subbase material (B2 grading).
(Figure shows stiffness time from flexural strength test.)
Table 5.4: Factors for Granular Base Stiffness Calculation in GT-Pave
Stiffness Thickness Layer
MPa psi mm inches
HMA-O (v=0.35)
1,000 3,000a 5,000
145,138 435,414a 725,689
200 300a 500
8 12a 20
Granular Base (v=0.40)
Uzan Model (Table 5.5)
500 1,000a 1,500
20 40a 60
PCC-O Subbase (v=0.20)
6,000 870,827 0
150 0 6
Subgrade (v=0.45)
20 50a 100
2,903 7,257a 14,514
NA
Single Axial Load Tire/Pavement Contact Radius Loadb (Single-Single) kN lb mm inches
Tire Pressure p=100psi
68 78
90a
15,287 17,535 20,232
125 132 145
4.9 5.2
5.7a Note: a -- Default fixed values during combination calculations. b -- Axisymmetric Modeling for calculations.

Laboratory Testing and Modeling for Structural Performance of Fully Permeable Pavements Final Report, November 2010
83
Table 5.5: Parameters of Uzan Model for Granular Base in GT-Pave (Alluvial)
Strain Type Uzan (Universal) Model (Equation 3.5) K1-V K2-V K3-V
(MPa) (psi) (kPa) (psi) (kPa) (psi) Vertical
45.0 6,531 4.0 0.628 -1.0 -0.213 K1-H K2-H K3-H
(MPa) (psi) (kPa) (psi) (kPa) (psi) Horizontal
3.9 565 22.0 3.128 -19.0 -2.713 K1-S K2-S K3-S
(MPa) (psi) (kPa) (psi) (kPa) (psi) Shear
12.6 1,831 6.0 0.828 -3.0 -0.413
The allowable truck traffic (ESAL or TI) during the design life was calculated using a set of factors,
including seasonal factor, day/night factor, axle type factor, ESAL factor (the average ESALs per axle),
and load bin factor (percent of total axles in each load range) as shown in Table 5.6. The value for each
factor was determined based on the statistical analysis of statewide traffic information from the
UCPRC/Caltrans Weigh-in-Motion database (25). Axle loads less than half the legal load were ignored in
order to keep the number of required calculations to an acceptable value, which was considered reasonable
since they contribute very little to the fatigue damage.
Table 5.6: Load Spectrum Factors for HMA-O Structures
Season Factor Day/Night Factor Axle Type Factor ESAL Factor Winter Spring Summer Day Night Single Tandem Single Tandem
0.33 0.25 0.42 0.45 0.55 0.5 0.5 0.17 0.3 Load Bin Factor
Single Tandem 0.8Legal~Legal (75 kN) Legal~Max (93 kN) 0.8Legal~Legal (135 kN) Legal~Max (155 kN)
0.492 0.008 0.46 0.04
Justification for the selection of factors was the same as that for the PCC-O pavement analysis. However,
in the seasonal factor, three seasons were used for the HMA pavement calculations to better capture the
changes in stiffness that occur in HMA with temperature and the changes in subgrade stiffness and shear
strength that control subgrade rutting for a fully permeable pavement.
These data were then used as input in a Miner’s Law equation (Equations 5.1 and 5.2) to calculate the
fatigue performance of the HMA in terms of an allowable traffic index. The fatigue equations for the
three types of HMA-O are shown in Figure 4.32. As with the PCC-O analysis discussed previously, the
actual repetitions to failure, n, were calculated using the Miner’s Law equation to determine the number of
ESALs (later converted to Traffic Index, D = 1.0 in Equation 5.1) for each combination of HMA-O type,
thicknesses, and climate region. The actual repetitions for failure were then converted back into ESALs,
and then into Traffic Index.

Laboratory Testing and Modeling for Structural Performance of Fully Permeable Pavements Final Report, November 2010
84
The ratio of shear stress to shear strength at the top of subgrade was estimated to evaluate the permanent
deformation potential of the subgrade. Based on the Federal Aviation Administration (FAA) subgrade soil
evaluation report (14) and personal communication with Dr. Manuel Bejarano, the shear stress was
estimated as half the vertical stress at the top of subgrade. The saturated shear strength for clay was
estimated as 7.5 psi (51.7 kPa) (i.e., a worst case scenario, but taking natural confinement in the pavement
into consideration). Continued permanent deformation of the subgrade after initial densification under
traffic is unlikely when the stress/strength ratio (SR) is less than 0.3 (29), which was the design criteria
selected for this project. Continual rutting at a steady rate after initial embedment is expected when the
stress/strength ratio is less than 0.7 but greater than 0.3 times the shear strength.
Results from these calculations were plotted to assess the influence of pavement layer combinations on the
subgrade stress/strength ratio (2). Stress/strength ratio values for different HMA-O and base thicknesses
were then interpolated to identify a range of appropriate layer thicknesses for the heaviest traffic loads and
each traffic speed and temperature condition. The structural design selection process involves using both
the fatigue life results and the subgrade stress/strength results.
5.3.1 Example Results
Example predictions of the shear stress/strength ratio at the top of the subgrade, which is the main
contributing factor to permanent deformation (rutting) of the granular base and subgrade, for various
combinations of variables in the experimental design (mix type, subbase inclusion, traffic speed, climatic
zone), as well as example plots of the fatigue design life of the same pavements are provided in the
Technical Memorandum on Performance Modeling (2). The design of fully permeable pavements with
open-graded hot-mix asphalt surfacing using the data collected in this task is discussed in Chapter 6.

Laboratory Testing and Modeling for Structural Performance of Fully Permeable Pavements Final Report, November 2010
85
Chapter 6 Proposed Structural Design Procedure
6.1 Introduction
A preliminary catalogue-type design procedure based on region (rainfall), storm event design period,
design , traffic, design truck speed, surfacing (HMA or PCC), subbase type, and the shear stress-to-shear
strength ratio at the top of the subgrade has been developed for preliminary design of fully permeable
pavement test sections in California. The example design tables provided in Appendix B through
Appendix J were prepared from the computer modeling cases and calculations run as part of the computer
modeling task described in Chapter 5. The example hydraulic design table (Appendix B) includes 2-year,
50-year, and 100-year storm design events (considering infiltration and draw down for full storm duration
and repeat storm events) for three California regions (Sacramento, Los Angeles, and Eureka, as described
in the companion hydrological modeling study [see Chapter 5 in Reference 4]). These three storm design
events were selected to test the sensitivity of the design to a wide range of events (e.g., effect of storm
intensity, storm duration, geometry, draw down, and degree of clogging on infiltration) and were not
necessarily intended to be representative of typical Caltrans storm event design procedures. Example
design tables for PCC-O and Cast PCC (Appendix C and Appendix D respectively) include two regions
(Sacramento and Los Angeles), and two truck speeds (4 mph [7 km/h] and 25 mph [40 km/h]). Example
design tables for asphalt concrete (Appendix E through Appendix J) include three different mix designs
(HMA-O, RHMA-O, and G125), the same two regions and truck speeds as the PCC options, and two
subbase options (with PCC-O subbase and no subbase). All example tables assume a shoulder width of
10 ft (3.0 m) and cover designs up to a TI of 18. The shoulder is considered as lane for drainage design
purposes. The design tables have not been validated in full-scale experiments and are only intended for
the design of experimental test sections.
The proposed procedure generally entails the following:
1. Select the permeability of the subgrade, region, storm design event period, and number of lanes drained. For HMA pavements, selection of a subbase option is also required. This information is used to determine the thickness of the gravel base/reservoir layer in terms of hydraulic performance. Consideration should be given to whether occasional overflows are permitted (e.g., during a series of heavy storms on consecutive days, prolonged rainfall, etc.) or not, as this will influence the choice of storm design period and dictate the thickness of the base/reservoir layer. Permeabilities should be measured for each project at a range of depths around the expected depth of the top of the subgrade after excavation of material for the reservoir layer(s). The lowest permeability should be used in the design. It should be noted that clay lenses between silt layers are common in the Central Valley of California, and these will influence permeability.

Laboratory Testing and Modeling for Structural Performance of Fully Permeable Pavements Final Report, November 2010
86
2. Select the surface type. For PCC pavements, slab length, base thickness, design traffic (note that design life is dependent on project circumstances), and design speed are then used to identify the thickness of the surfacing layer. For HMA pavements, base thickness, design traffic, and design speed are used to identify the thickness of the HMA layer. Once the HMA layer thickness has been determined, this and base thickness are used to determine whether the shear stress-to-shear strength ratio at the top of the subgrade is adequate to prevent permanent deformation in the subgrade.
The design method assumes that water should only reach the top of the granular base layer for the design
storm, and not be stored in the surface layer during the infiltration period, in order to improve the
durability of the surface material.
These preliminary tables can be used for designs of test sections for both shoulder retrofit of highways
and for parking lots, maintenance yards, and similar facilities. Two typical cross sections for shoulder
retrofits were developed (Figure 6.1 and Figure 6.2) and two contractors asked to review them in terms of
constructability. Both contractors indicated that construction appeared to be feasible and that they would
be comfortable to bid on projects with similar designs. The selection of the most appropriate structure
will depend on whether the existing pavement structure can maintain a vertical cut face equal to the
height of the fully permeable pavement shoulder structure or not. If it can, then the cross section shown
in Figure 6.2 would be the preferred option, providing a greater reservoir area for the permeable pavement.
If the cut face cannot be maintained, then the cross section shown in Figure 6.1 should be used. A drain
(e.g. Multi-Flow [www.varicore.com]) between the existing travelled way and the new fully permeable
shoulder will need to be installed to allow any water in the travelled way to drain away from the road,
while not allowing any water from the permeable area to flow into the pavement structure. The different
layer options in the fully permanent pavement structure are shown in Figure 5.1. An impermeable
composite liner is included in the diagrams to prevent water flowing sideways from the reservoir layer
and causing a slip failure in the embankment. The inclusion of this liner will be project dependent and
not always required.
6.2 Example Design Procedures
Four design examples were prepared to illustrate the combined use of the structural and hydraulic design
results developed as part of this project:
An example RHMA-O shoulder retrofit structure with no subbase An example HMA-O shoulder retrofit structure with a PCC-O subbase An example PCC-O shoulder retrofit structure with no subbase An example cast PCC maintenance yard/service road structure with no subbase

Laboratory Testing and Modeling for Structural Performance of Fully Permeable Pavements Final Report, November 2010
87
Travelled lane (Shoulder Paint Line) Permeable Shoulder Embankment
Permeable shoulder(Design dependent on
site and traffic)
New surfacing
Existing surfacing
Existing base & subbase
Subgrade
New edge drain
Impermeable composite liner
Filter fabric/geogrid
Impermeable composite liner(optional)
Plan View
Side View
Not to scale
Existing shoulder structure
Figure 6.1: Example fully permeable pavement shoulder retrofit #1.
(Portion of existing shoulder is retained to prevent damage to pavement layers and to maintain separation from reservoir)

Laboratory Testing and Modeling for Structural Performance of Fully Permeable Pavements Final Report, November 2010
88
Permeable Shoulder Embankment
New surfacing
Existing surfacing
Existing base & subbase
Subgrade
New edge drain
Impermeable composite liner
Filter fabric/geogrid
Impermeable composite liner(optional)
Plan View
Side View
Not to scale
Permeable shoulder(Design dependent on
site and traffic)
Travelled lane (Shoulder Paint Line)
Figure 6.2: Example fully permeable pavement shoulder retrofit #2.
(Permeable shoulder placed against pavement layers with fabric separator)

Laboratory Testing and Modeling for Structural Performance of Fully Permeable Pavements Final Report, November 2010
89
6.2.1 Example 1: RHMA-O Shoulder Retrofit in Sacramento Area
Project Design
RHMA-O shoulder retrofit of three lanes of highway, without subbase, in Sacramento area:
Compacted subgrade permeability: 10-4 cm/s. Storm design: 50 years Design Traffic Index: 13 (design life dependent on project circumstances) Design truck speed: 4 mph (7 km/h) due to congestion. Surface layer: 9.5 mm (3/8 in.) nominal maximum aggregate size (NMAS) open-graded rubberized
hot-mix asphalt (RHMA-O) Subbase: No subbase
Design Procedure
The design procedure discussed below refers to a series of tables in Appendix B through Appendix J. The
tables referred to are provided on the following pages. Cells that are referred to in the tables are circled
and highlighted in orange.
Step 1: Choose base thickness based on hydraulic performance.
Using Table 6.1 (Table B.1 in Appendix B), select the minimum thickness of granular
base for a subgrade soil permeability of 10-4 cm/s, 50-year design storm, and Sacramento
region. These variables require a minimum base/reservoir layer thickness of 680 mm for
a shoulder retrofit of a highway draining three lanes plus the shoulder (i.e., select 4 lanes
in the table).
Step 2: Choose RHMA-O layer thickness based on RHMA-O fatigue damage for given TI.
Using Table 6.2 (Table E.5 in Appendix E), select the minimum RHMA-O layer
thickness for a base thickness of 700 mm (rounded up from 680 mm from Step 1), and a
TI of 13. The minimum required thickness of RHMA-O is 395 mm.
Step 3: Check the stress/strength ratio at the top of the subgrade.
Using Table 6.3 (Table E.6 in Appendix E), check the shear stress-to-shear strength ratio
at the top of subgrade based on the minimum required thickness of granular base of
700 mm and minimum required thickness of RHMA-O of 395 mm. The stress/strength
ratio is “G,” which implies that the shear stress is less than 0.3 of the shear strength.
Consequently, permanent deformation in the subgrade should not be a problem for this
pavement design.
Therefore, in this example, the minimum required thickness of granular base is 700 mm and the minimum
thickness of RHMA-O is 395 mm for the design requirements and site conditions.

Laboratory Testing and Modeling for Structural Performance of Fully Permeable Pavements Final Report, November 2010
90
Table 6.1: Example 1 Design Chart for Hydraulic Performance (Appendix B)
Table B.1: Preliminary Granular Base Thickness based on Hydraulic Performance Simulations
Rainfall Region
Sacramento (Sac) Riverside (LA) Eureka
Thickness of Granular Base + PCC-O Subbase (mm)
Thickness of Granular Base + PCC-O Subbase (mm)
Thickness of Granular Base + PCC-O Subbase (mm)
Number of highway lanes2 Number of highway lanes2 Number of highway lanes2
Subgrade soil permeability
(cm/s)1
Storm design (years)
(Full storm duration)
2 3 4 5 2 3 4 5 2 3 4 5
1.00E-05 270 450 600 700 270 400 480 680 600 900 1270 1570
1.00E-04 130 180 250 420 130 150 320 400 350 650 850 1200
1.00E-03
2
130 130 130 130 130 130 130 130 130 130 130 150
1.00E-05 480 700 1050 1250 580 860 1180 1600 800 1270 1720 2150
1.00E-04 190 420 680 950 360 700 950 1350 500 850 1300 1770
1.00E-03
50
130 130 130 130 130 130 130 230 130 130 220 500
1.00E-05 600 800 1150 1430 680 1050 1300 1800 1150 1720 2300 2900
1.00E-04 210 500 750 1070 400 850 1200 1450 830 1300 1890 2500
1.00E-03
100
130 130 130 150 130 130 150 320 130 220 650 950 1 Note that draw down times will vary significantly and are dependent primarily on subgrade soil permeabilities, but also on other factors such as number of lanes drained, storm recurrence interval, etc as well. Draw down times could vary between one hour for subgrades with a permeability of 1.00E-03 to several months for subgrades with a permeability of 1.00E-05 and higher. Refer to Reference 4 for discussion on the calculation of drain down times. 2 The number of highway lanes must include the shoulder. Shoulder width is 10 ft. (3.0 m).

Laboratory Testing and Modeling for Structural Performance of Fully Permeable Pavements Final Report, November 2010
91
Table 6.2: Example 1 Design Chart for Selecting RHMA-O Thickness (Appendix E)
Table E.5: Preliminary TI for HMA-O Fatigue Damage=1, Sacramento County (RHMA-O, no Subbase, E_GB = 60 MPa, Speed = 7 km/h)
Granular Base (GB) Layer Thickness (mm)
500 550 600 650 700 750 800 850 900 950 1000 1050 1100 1150 1200 1250 1300 1350 1400 1450 1500
200 7.0 7.0 7.0 7.0 7.0 7.0 7.0 7.0 7.0 7.0 7.0 7.0 7.0 7.0 7.0 7.0 7.0 7.0 7.0 7.0 7.0 215 7.5 7.5 7.5 7.5 7.5 7.5 7.5 7.5 7.5 7.5 7.5 7.5 7.5 7.5 7.5 7.5 7.5 7.5 7.5 7.5 7.5 230 8.0 8.0 8.0 8.0 8.0 8.0 8.0 8.0 8.0 8.0 8.0 8.0 8.0 8.0 8.0 8.0 8.0 8.0 8.0 8.0 8.0 245 8.5 8.5 8.5 8.5 8.5 8.5 8.5 8.5 8.5 8.5 8.5 8.5 8.5 8.5 8.5 8.5 8.5 8.5 8.5 8.5 8.5 260 9.0 9.0 9.0 9.0 9.0 9.0 9.0 9.0 9.0 9.0 9.0 9.0 9.0 9.0 9.0 9.0 9.0 9.0 9.0 9.0 9.0 275 9.5 9.5 9.5 9.0 9.5 9.5 9.5 9.0 9.5 9.5 9.5 9.5 9.5 9.0 9.5 9.5 9.5 9.0 9.5 9.5 9.5 290 9.5 9.5 9.5 9.5 9.5 9.5 9.5 9.5 9.5 9.5 9.5 9.5 9.5 9.5 9.5 9.5 9.5 9.5 9.5 9.5 9.5 305 10.0 10.0 10.0 10.0 10.0 10.0 10.0 10.0 10.0 10.0 10.0 10.0 10.0 10.0 10.0 10.0 10.0 10.0 10.0 10.0 10.0 320 10.5 10.5 10.5 10.5 10.5 10.5 10.5 10.5 10.5 10.5 10.5 10.5 10.5 10.5 10.5 10.5 10.5 10.5 10.5 10.5 10.5 335 11.0 11.0 11.0 11.0 11.0 11.0 11.0 11.0 11.0 11.0 11.0 11.0 11.0 11.0 11.0 11.0 11.0 11.0 11.0 11.0 11.0 350 11.5 11.5 11.5 11.5 11.5 11.5 11.5 11.5 11.5 11.5 11.5 11.5 11.5 11.5 11.5 11.5 11.5 11.5 11.5 11.5 11.5 365 12.0 12.0 12.0 12.0 12.0 12.0 12.0 12.0 12.0 12.0 12.0 12.0 12.0 12.0 12.0 12.0 12.0 12.0 12.0 12.0 12.0 380 12.5 12.5 12.5 12.5 12.5 12.5 12.5 12.5 12.5 12.5 12.5 12.5 12.5 12.5 12.5 12.5 12.5 12.5 12.5 12.5 12.5 395 13.0 13.0 13.0 13.0 13.0 13.0 13.0 13.0 13.0 13.0 13.0 13.0 13.0 13.0 13.0 13.0 13.0 13.0 13.0 13.0 13.0 410 13.5 13.5 13.5 13.5 13.5 13.5 13.5 13.5 13.5 13.5 13.5 13.5 13.5 13.5 13.5 13.5 13.5 13.5 13.5 13.5 13.5 425 14.0 14.0 14.0 13.5 14.0 14.0 14.0 13.5 14.0 14.0 14.0 14.0 14.0 14.0 14.0 14.0 14.0 14.5 14.5 14.5 14.5 440 14.0 14.0 14.0 14.0 14.0 14.0 14.0 14.0 14.0 14.0 14.0 14.5 14.5 14.5 14.5 15.0 15.0 15.0 15.0 15.5 15.5 455 14.5 14.5 14.5 14.5 14.5 14.5 14.5 14.5 14.5 14.5 14.5 15.0 15.0 15.0 15.5 15.5 15.5 16.0 16.0 16.0 16.5 470 15.0 15.0 15.0 15.0 15.0 15.0 15.0 15.0 15.0 15.0 15.0 15.5 15.5 15.5 16.0 16.0 16.5 16.5 17.0 17.0 17.0 485 15.5 15.5 15.5 15.5 15.5 15.5 15.5 15.5 15.5 15.5 15.5 16.0 16.0 16.5 16.5 17.0 17.0 17.5 17.5 18.0 18.0
HM
A L
ayer
Th
ick
nes
s (m
m)
500 16.0 16.0 16.0 16.0 16.0 16.0 16.0 16.0 16.0 16.0 16.0 16.5 16.5 17.0 17.0 17.5 18.0 18.0 18.0 18.0 18.0

Laboratory Testing and Modeling for Structural Performance of Fully Permeable Pavements Final Report, November 2010
92
Table 6.3: Example 1 Design Chart for Checking Stress-to-Strength Ratio at Top of Subgrade
Table E.6: Preliminary Stress-to-Strength Ratio at Top of Subgrade for HMA-O Structure, Sacramento County (RHMA-O, no Subbase, E_GB = 60 MPa, Speed = 7 km/h)
Granular Base (GB) Layer Thickness (mm)
500 550 600 650 700 750 800 850 900 950 1000 1050 1100 1150 1200 1250 1300 1350 1400 1450 1500
200 Y Y Y Y Y G G G G G G G G G G G G G G G G 215 Y Y Y Y G G G G G G G G G G G G G G G G G 230 Y Y Y Y G G G G G G G G G G G G G G G G G 245 Y Y Y G G G G G G G G G G G G G G G G G G 260 Y Y Y G G G G G G G G G G G G G G G G G G 275 Y Y G G G G G G G G G G G G G G G G G G G 290 Y G G G G G G G G G G G G G G G G G G G G 305 G G G G G G G G G G G G G G G G G G G G G 320 G G G G G G G G G G G G G G G G G G G G G 335 G G G G G G G G G G G G G G G G G G G G G 350 G G G G G G G G G G G G G G G G G G G G G 365 G G G G G G G G G G G G G G G G G G G G G 380 G G G G G G G G G G G G G G G G G G G G G 395 G G G G G G G G G G G G G G G G G G G G G 410 G G G G G G G G G G G G G G G G G G G G G 425 G G G G G G G G G G G G G G G G G G G G G 440 G G G G G G G G G G G G G G G G G G G G G 455 G G G G G G G G G G G G G G G G G G G G G 470 G G G G G G G G G G G G G G G G G G G G G 485 G G G G G G G G G G G G G G G G G G G G G
HM
A L
ayer
Th
ick
nes
s (m
m)
500 G G G G G G G G G G G G G G G G G G G G G Note: G--Stress-to-Strength Ratio <0.3; Y--0.3= < Stress-to-Strength Ratio < = 0.7; R--Stress-to-Strength Ratio > 0.7

Laboratory Testing and Modeling for Structural Performance of Fully Permeable Pavements Final Report, November 2010
93
6.2.2 Example 2: HMA-O Shoulder Retrofit in Los Angeles
Project Design
HMA-O shoulder retrofit of five lanes of highway, with 150 mm PCC-O subbase, in Los Angeles area:
Compacted subgrade permeability: 10-5 cm/s. Storm design: 2 years Design Traffic Index: 18 (design life dependent on project circumstances) Design truck speed: 25 mph (40 km/h) simulating speed of traffic diverted onto shoulder. Surface layer: 1/2 in. (12.5 mm) nominal maximum aggregate size (NMAS) open-graded hot-mix
asphalt (HMA-O) Subbase: 6.0 in (150 mm) PCC-O subbase
Design Procedure
Step 1: Choose base thickness based on hydraulic performance.
Using Table 6.4 (Table B.1 in Appendix B), select the minimum thickness of granular
base (i.e., base plus subbase) for a subgrade soil permeability of 10-5 cm/s, two-year
design storm, and Los Angeles region. These variables require a minimum base/reservoir
layer thickness of 680 mm (rounded up to 700 mm) for a shoulder retrofit of a highway
draining four lanes plus the shoulder (i.e., 5 lanes in the table). Subtract the thickness of
the PCC-O subbase (150 mm), giving a minimum granular base thickness of 550 mm.
Step 2: Choose HMA-O layer thickness based on HMA-O fatigue damage for given TI.
Using Table 6.5 (Table H.3 in Appendix H), select the minimum HMA-O layer thickness
for a minimum granular base thickness of 550 mm (i.e., total base thickness minus
subbase thickness) and a TI of 18. The minimum required thickness of HMA-O is
260 mm.
Step 3: Check the stress/strength ratio at the top of the subgrade.
Using Table 6.6 (Table H.4 in Appendix H), check the shear stress-to-shear strength ratio
at the top of subgrade based on the minimum thickness of granular base (i.e., base minus
subbase) of 550 mm and minimum thickness of HMA of 260 mm. The stress/strength
ratio is “G,” which implies that the shear stress is less than 0.3 of the shear strength.
Consequently, permanent deformation in the subgrade should not be a problem for this
pavement design.
Therefore, in this example, the minimum required combined granular base and subbase thickness is
700 mm (i.e., total thickness of base is 550 mm granular base plus 150 mm PCC-O subbase) and the
minimum thickness of HMA-O is 260 mm for the design requirements and site conditions.

Laboratory Testing and Modeling for Structural Performance of Fully Permeable Pavements Final Report, November 2010
94
Table 6.4: Example 2 Design Chart for Hydraulic Performance (Appendix B)
Table B.1: Preliminary Granular Base Thickness based on Hydraulic Performance Simulations
Rainfall Region
Sacramento (Sac) Riverside (LA) Eureka
Thickness of Granular Base + PCC-O Subbase (mm)
Thickness of Granular Base + PCC-O Subbase (mm)
Thickness of Granular Base + PCC-O Subbase (mm)
Number of highway lanes2 Number of highway lanes2 Number of highway lanes2
Subgrade soil permeability
(cm/s)1
Storm design (years)
(Full storm duration)
2 3 4 5 2 3 4 5 2 3 4 5
1.00E-05 270 450 600 700 270 400 480 680 600 900 1270 1570
1.00E-04 130 180 250 420 130 150 320 400 350 650 850 1200
1.00E-03
2
130 130 130 130 130 130 130 130 130 130 130 150
1.00E-05 480 700 1050 1250 580 860 1180 1600 800 1270 1720 2150
1.00E-04 190 420 680 950 360 700 950 1350 500 850 1300 1770
1.00E-03
50
130 130 130 130 130 130 130 230 130 130 220 500
1.00E-05 600 800 1150 1430 680 1050 1300 1800 1150 1720 2300 2900
1.00E-04 210 500 750 1070 400 850 1200 1450 830 1300 1890 2500
1.00E-03
100
130 130 130 150 130 130 150 320 130 220 650 950 1 Note that draw down times will vary significantly and are dependent primarily on subgrade soil permeabilities, but also on other factors such as number of lanes drained, storm recurrence interval, etc as well. Draw down times could vary between one hour for subgrades with a permeability of 1.00E-03 to several months for subgrades with a permeability of 1.00E-05 and higher. Refer to Reference 4 for discussion on the calculation of drain down times. 2 The number of highway lanes must include the shoulder. Shoulder width is 10 ft. (3.0 m).

Laboratory Testing and Modeling for Structural Performance of Fully Permeable Pavements Final Report, November 2010
95
Table 6.5: Example 2 Design Chart for Selecting HMA-O Thickness (Appendix H)
Table H.3: Preliminary TI for HMA-O Fatigue Damage=1, Los Angeles County (G125, with Subbase, E_GB= 60 MPa, Speed = 40 km/h)
Granular Base (GB) Layer Thickness (mm)
500 550 600 650 700 750 800 850 900 950 1000 1050 1100 1150 1200 1250 1300 1350 1400 1450 1500
200 13.0 13.0 13.0 12.5 12.5 12.5 12.5 12.5 12.0 12.0 12.0 12.0 12.0 12.0 12.0 12.0 12.0 12.0 12.0 12.0 12.0 215 14.5 14.5 14.0 14.0 14.0 14.0 14.0 13.5 13.5 13.5 13.5 13.5 13.5 13.5 13.5 13.5 13.5 13.5 13.5 13.5 13.5 230 15.5 15.5 15.5 15.5 15.5 15.0 15.0 15.0 15.0 15.0 14.5 14.5 14.5 14.5 14.5 14.5 14.5 14.5 14.5 14.5 14.5 245 17.0 17.0 17.0 17.0 16.5 16.5 16.5 16.5 16.5 16.0 16.0 16.0 16.0 16.0 16.0 16.0 16.0 16.0 16.0 16.0 16.0 260 18.5 18.5 18.0 18.0 18.0 18.0 18.0 17.5 17.5 17.5 17.5 17.5 17.5 17.5 17.5 17.5 17.5 17.5 17.5 17.5 17.5 275 290 305 320 335 350 365 380 395 410 425 440 455 470 485
HM
A L
ayer
Th
ick
nes
s (m
m)
500

Laboratory Testing and Modeling for Structural Performance of Fully Permeable Pavements Final Report, November 2010
96
Table 6.6: Example 2 Design Chart for Checking Stress-to-Strength Ratio at Top of Subgrade
Table H.4: Preliminary Stress-to-Strength Ratio at Top of Subgrade, Los Angeles County (G125, with Subbase, E_GB = 60 MPa, Speed = 40 km/h)
Granular Base (GB) Layer Thickness (mm)
500 550 600 650 700 750 800 850 900 950 1000 1050 1100 1150 1200 1250 1300 1350 1400 1450 1500
200 G G G G G G G G G G G G G G G G G G G G G 215 G G G G G G G G G G G G G G G G G G G G G 230 G G G G G G G G G G G G G G G G G G G G G 245 G G G G G G G G G G G G G G G G G G G G G 260 G G G G G G G G G G G G G G G G G G G G G 275 G G G G G G G G G G G G G G G G G G G G G 290 G G G G G G G G G G G G G G G G G G G G G 305 G G G G G G G G G G G G G G G G G G G G G 320 G G G G G G G G G G G G G G G G G G G G G 335 G G G G G G G G G G G G G G G G G G G G G 350 G G G G G G G G G G G G G G G G G G G G G 365 G G G G G G G G G G G G G G G G G G G G G 380 G G G G G G G G G G G G G G G G G G G G G 395 G G G G G G G G G G G G G G G G G G G G G 410 G G G G G G G G G G G G G G G G G G G G G 425 G G G G G G G G G G G G G G G G G G G G G 440 G G G G G G G G G G G G G G G G G G G G G 455 G G G G G G G G G G G G G G G G G G G G G 470 G G G G G G G G G G G G G G G G G G G G G 485 G G G G G G G G G G G G G G G G G G G G G
HM
A L
ayer
Th
ick
nes
s (m
m)
500 G G G G G G G G G G G G G G G G G G G G G Note: G--Stress-to-Strength Ratio < 0.3; Y--0.3 = < Stress-to-Strength Ratio < = 0.7; R--Stress-to-Strength Ratio > 0.7

Laboratory Testing and Modeling for Structural Performance of Fully Permeable Pavements Final Report, November 2010
97
6.2.3 Example 3: PCC-O Shoulder Retrofit in Sacramento Area
Project Design
PCC-O shoulder retrofit of five lanes of highway, with no subbase, in Sacramento area:
Compacted subgrade permeability: 10-5 cm/s. Storm design: 100 years Design Traffic Index: 18 (design life dependent on project circumstances) Design truck speed: 25 mph (40 km/h) simulating speed of traffic diverted onto shoulder. Surface layer: Jointed, no dowels, PCC-O with 12 ft (3.6 m) slab length, and k-value of 0.05 MPa.
Note that joints are either sawn or formed to link with existing joints in the adjacent lanes. Subbase: no subbase
Design Procedure
Step 1: Choose base thickness based on hydraulic performance.
Using Table 6.7 (Table B.1 in Appendix B), select the minimum thickness of granular
base for a subgrade soil permeability of 10-5 cm/s, 100-year design storm, and
Sacramento region. These variables require a minimum base/reservoir layer thickness of
1,430 mm for a shoulder retrofit of a highway draining four lanes plus the shoulder (i.e., 5
lanes in the table).
Step 2: Choose PCC-O slab thickness based on PCC-O fatigue damage for given TI.
Using Table 6.8 (Table C.3 in Appendix C), select the minimum PCC-O slab thickness
for a slab length of 3,600 mm and TI of 18. The minimum required slab thickness of
PCC-O is 280 mm.
Therefore, in this example, the minimum required granular base thickness is 1,450 mm and the minimum
thickness of PCC-O is 280 mm for the design requirements and site conditions.

Laboratory Testing and Modeling for Structural Performance of Fully Permeable Pavements Final Report, November 2010
98
Table 6.7: Example 3 Design Chart for Hydraulic Performance (Appendix B)
Table B.1: Preliminary Granular Base Thickness based on Hydraulic Performance Simulations
Rainfall Region
Sacramento (Sac) Riverside (LA) Eureka
Thickness of Granular Base + PCC-O Subbase (mm)
Thickness of Granular Base + PCC-O Subbase (mm)
Thickness of Granular Base + PCC-O Subbase (mm)
Number of highway lanes2 Number of highway lanes2 Number of highway lanes2
Subgrade soil permeability
(cm/s)1
Storm design (years)
(Full storm duration)
2 3 4 5 2 3 4 5 2 3 4 5
1.00E-05 270 450 600 700 270 400 480 680 600 900 1270 1570
1.00E-04 130 180 250 420 130 150 320 400 350 650 850 1200
1.00E-03
2
130 130 130 130 130 130 130 130 130 130 130 150
1.00E-05 480 700 1050 1250 580 860 1180 1600 800 1270 1720 2150
1.00E-04 190 420 680 950 360 700 950 1350 500 850 1300 1770
1.00E-03
50
130 130 130 130 130 130 130 230 130 130 220 500
1.00E-05 600 800 1150 1430 680 1050 1300 1800 1150 1720 2300 2900
1.00E-04 210 500 750 1070 400 850 1200 1450 830 1300 1890 2500
1.00E-03
100
130 130 130 150 130 130 150 320 130 220 650 950 1 Note that draw down times will vary significantly and are dependent primarily on subgrade soil permeabilities, but also on other factors such as number of lanes drained, storm recurrence interval, etc as well. Draw down times could vary between one hour for subgrades with a permeability of 1.00E-03 to several months for subgrades with a permeability of 1.00E-05 and higher. Refer to Reference 4 for discussion on the calculation of drain down times. 2 The number of highway lanes must include the shoulder. Shoulder width is 10 ft. (3.0 m).

Laboratory Testing and Modeling for Structural Performance of Fully Permeable Pavements Final Report, November 2010
99
Table 6.8: Example 3 Design Chart for Selecting PCC-O Thickness (Appendix C)
Table C.3: Preliminary TI for PCC Fatigue Damage=1, Sacramento County (PCC-O, k= 0.05 MPa/mm)
Slab Length (mm) 3000 3100 3200 3300 3400 3500 3600 3700 3800 3900 4000 4100 4200 4300 4400 4500
250 10.0 9.5 9.5 9.0 9.0 8.5 8.5 8.0 8.0 7.5 7.5 7.0 7.0 6.5 6.5 6.0 260 14.0 13.5 13.0 13.0 12.5 12.0 11.5 11.0 11.0 10.5 10.0 9.5 9.5 9.0 8.5 8.0 270 18.0 17.5 17.0 16.5 16.0 15.5 15.0 14.5 14.0 13.5 13.0 12.5 12.0 11.0 10.5 10.0 280 18.0 17.5 17.0 16.0 15.5 15.0 14.0 13.5 13.0 12.5 290 18.5 17.5 16.5 16.0 15.0 14.5 300 18.5 17.5 16.5 310 18.5 320 330 340 350 360 370 380 390 400 410 420 430 440 450 460 470 480 490
PC
C L
ayer
Th
ick
nes
s (m
m)
500 Note: Slab Width = 3.5m

Laboratory Testing and Modeling for Structural Performance of Fully Permeable Pavements Final Report, November 2010
100

Laboratory Testing and Modeling for Structural Performance of Fully Permeable Pavements Final Report, November 2010
101
6.2.4 Example 4: Cast PCC Maintenance Yard Service Road in Sacramento Area
Project Design
Cast permeable PCC maintenance yard two-lane service road with no subbase, in Sacramento area:
Compacted subgrade permeability: 10-4 cm/s Storm design: 50 years Design Traffic Index: 1 (design life dependent on project circumstances) Design truck speed: 4 mph (7 km/h) simulating speed of vehicles moving around a maintenance
yard Surface layer: Cast PCC with 11 ft (3.3 m) slab length, and k-value of 0.08 MPa Subbase: no subbase
Design Procedure
Step 1: Choose base thickness based on hydraulic performance.
Using Table 6.9 (Table B.1 in Appendix B), select the minimum thickness of granular
base for a subgrade soil permeability of 10-4 cm/s, 50-year design storm, and Sacramento
region. This requires a minimum base/reservoir layer thickness of 200 mm (i.e., rounded
up from 190 mm) for the service road (i.e., 2 lanes in the table).
Step 2: Choose Cast PCC slab thickness based on PCC-O Fatigue Damage for Given TI.
Using Table 6.10 (Table D.3 in Appendix D), select the minimum cast PCC slab
thickness for a slab length of 3,300 mm and TI of 1. The minimum slab thickness of cast
PCC is 350 mm.
Therefore, in this example, the minimum required granular base thickness is 200 mm and the minimum
thickness of cast PCC is 350 mm for the design requirements and site conditions.
6.2.5 Accelerated Pavement Test and Pilot Study Test Section Design
Specific designs for accelerated pavement test and pilot study test sections have not been developed.
These can be designed using the approach described in this chapter once test locations and test parameters
have been indentified.

Laboratory Testing and Modeling for Structural Performance of Fully Permeable Pavements Final Report, November 2010
102
Table 6.9: Example 4 Design Chart for Hydraulic Performance (Appendix B)
Table B.1: Preliminary Granular Base Thickness based on Hydraulic Performance Simulations
Rainfall Region
Sacramento (Sac) Riverside (LA) Eureka
Thickness of Granular Base + PCC-O Subbase (mm)
Thickness of Granular Base + PCC-O Subbase (mm)
Thickness of Granular Base + PCC-O Subbase (mm)
Number of highway lanes2 Number of highway lanes2 Number of highway lanes2
Subgrade soil permeability
(cm/s)1
Storm design (years)
(Full storm duration)
2 3 4 5 2 3 4 5 2 3 4 5
1.00E-05 270 450 600 700 270 400 480 680 600 900 1270 1570
1.00E-04 130 180 250 420 130 150 320 400 350 650 850 1200
1.00E-03
2
130 130 130 130 130 130 130 130 130 130 130 150
1.00E-05 480 700 1050 1250 580 860 1180 1600 800 1270 1720 2150
1.00E-04 190 420 680 950 360 700 950 1350 500 850 1300 1770
1.00E-03
50
130 130 130 130 130 130 130 230 130 130 220 500
1.00E-05 600 800 1150 1430 680 1050 1300 1800 1150 1720 2300 2900
1.00E-04 210 500 750 1070 400 850 1200 1450 830 1300 1890 2500
1.00E-03
100
130 130 130 150 130 130 150 320 130 220 650 950 1 Note that draw down times will vary significantly and are dependent primarily on subgrade soil permeabilities, but also on other factors such as number of lanes drained, storm recurrence interval, etc as well. Draw down times could vary between one hour for subgrades with a permeability of 1.00E-03 to several months for subgrades with a permeability of 1.00E-05 and higher. Refer to Reference 4 for discussion on the calculation of drain down times. 2 The number of highway lanes must include the shoulder. Shoulder width is 10 ft. (3.0 m).

Laboratory Testing and Modeling for Structural Performance of Fully Permeable Pavements Final Report, November 2010
103
Table 6.10: Example 4 Design Chart for Selecting Cast PCC Thickness (Appendix D)
Table D.4: Preliminary TI for PCC Fatigue Damage=1, Sacramento County (Cast Slab, k= 0.08 MPa/mm)
Slab Length (mm) 3000 3100 3200 3300 3400 3500 3600 3700 3800 3900 4000 4100 4200 4300 4400 4500
250 0.0 0.0 0.0 0.0 0.0 0.0 0.0 0.0 0.0 0.0 0.0 0.0 0.0 0.0 0.0 0.0 260 0.0 0.0 0.0 0.0 0.0 0.0 0.0 0.0 0.0 0.0 0.0 0.0 0.0 0.0 0.0 0.0 270 0.0 0.0 0.0 0.0 0.0 0.0 0.0 0.0 0.0 0.0 0.0 0.0 0.0 0.0 0.0 0.0 280 0.5 0.5 0.5 0.0 0.0 0.0 0.0 0.0 0.0 0.0 0.0 0.0 0.0 0.0 0.0 0.0 290 0.5 0.5 0.5 0.5 0.5 0.5 0.0 0.0 0.0 0.0 0.0 0.0 0.0 0.0 0.0 0.0 300 0.5 0.5 0.5 0.5 0.5 0.5 0.5 0.5 0.0 0.0 0.0 0.0 0.0 0.0 0.0 0.0 310 0.5 0.5 0.5 0.5 0.5 0.5 0.5 0.5 0.5 0.0 0.0 0.0 0.0 0.0 0.0 0.0 320 0.5 0.5 0.5 0.5 0.5 0.5 0.5 0.5 0.5 0.5 0.0 0.0 0.0 0.0 0.0 0.0 330 1.0 0.5 0.5 0.5 0.5 0.5 0.5 0.5 0.5 0.5 0.5 0.0 0.0 0.0 0.0 0.0 340 1.0 1.0 1.0 0.5 0.5 0.5 0.5 0.5 0.5 0.5 0.5 0.0 0.0 0.0 0.0 0.0 350 1.0 1.0 1.0 1.0 0.5 0.5 0.5 0.5 0.5 0.5 0.5 0.5 0.0 0.0 0.0 0.0 360 3.0 3.0 2.5 2.5 2.0 2.0 2.0 1.5 1.5 1.5 1.0 1.0 0.5 0.5 0.5 0.0 370 5.0 4.5 4.5 4.0 3.5 3.5 3.0 3.0 2.5 2.0 2.0 1.5 1.5 1.0 0.5 0.5 380 7.0 6.5 6.0 5.5 5.0 4.5 4.5 4.0 3.5 3.0 2.5 2.5 2.0 1.5 1.0 0.5 390 8.5 8.0 7.5 7.0 6.5 6.0 5.5 5.0 4.5 4.0 3.5 3.0 2.5 2.0 1.5 1.0 400 10.5 10.0 9.5 8.5 8.0 7.5 7.0 6.0 5.5 5.0 4.0 3.5 3.0 2.5 1.5 1.0 410 12.5 12.0 11.0 10.5 9.5 9.0 8.0 7.5 6.5 6.0 5.0 4.0 3.5 2.5 2.0 1.0 420 14.5 13.5 13.0 12.0 11.0 10.0 9.5 8.5 7.5 6.5 6.0 5.0 4.0 3.0 2.5 1.5 430 16.5 15.5 14.5 13.5 12.5 11.5 10.5 9.5 8.5 7.5 6.5 5.5 4.5 3.5 2.5 1.5 440 18.5 17.5 16.0 15.0 14.0 13.0 12.0 10.5 9.5 8.5 7.5 6.0 5.0 4.0 3.0 2.0 450 18.0 16.5 15.5 14.0 13.0 12.0 10.5 9.5 8.0 7.0 5.5 4.5 3.0 2.0 460 18.5 17.0 15.5 14.0 13.0 11.5 10.0 9.0 7.5 6.0 5.0 3.5 2.0 470 18.5 17.0 15.5 14.0 12.5 11.0 9.5 8.0 7.0 5.5 4.0 2.5 480 18.5 16.5 15.0 13.5 12.0 10.5 9.0 7.5 5.5 4.0 2.5 490 18.0 16.5 14.5 13.0 11.0 9.5 8.0 6.0 4.5 3.0
PC
C L
ayer
Th
ick
nes
s (m
m)
500 17.5 15.5 14.0 12.0 10.0 8.5 6.5 5.0 3.0 Note: Slab Width = 3.5m

Laboratory Testing and Modeling for Structural Performance of Fully Permeable Pavements Final Report, November 2010
104

Laboratory Testing and Modeling for Structural Performance of Fully Permeable Pavements Final Report, November 2010
105
Chapter 7 Life-Cycle Considerations
7.1 Introduction
In this project, life-cycle analysis is defined to include a cost analysis and an environmental assessment.
For the cost analysis, a preliminary Life-Cycle Cost Analysis (LCCA) is undertaken to evaluate the net
present value (NPV) economic costs of each project alternative, while in the environmental assessment
part, a preliminary Life-Cycle Assessment (LCA) is performed to understand the environmental impacts
of each alternative. As decision-assisting tools, LCCA and LCA both provide information for decision
making, but not the decision itself. Conclusions from both these analyses need to be coordinated to
support a final decision when choosing an appropriate best management practice (BMP) for stormwater
management.
7.2 Life-Cycle Cost Analysis
7.2.1 Introduction
LCCA allows the costs associated with each project alternative to be equitably compared against one
another. To perform an LCCA, the future cost is converted to present value through a discount rate,
thereby taking the time value of money into account. Since LCCA should be performed on alternatives
which carry out the same function, it is assumed that fully permeable pavements and currently available
treatment BMPs will have the same performance in accommodating stormwater runoff and in the
treatment of pollutants from runoff.
Two fully permeable pavement scenarios are considered in this chapter:
Shoulder retrofit for high-speed highway scenario: Comparison of conventional pavement shoulders on a two-lane highway and a six-lane highway (three lanes in each direction) with a conventional treatment BMP versus a fully permeable pavement shoulder. The example project length was one direction for one lane-mile (1,600 m) and the shoulder is 10 ft (3.0 m) wide.
Low-speed highway or parking lot/maintenance yard scenario: Conventional pavement for low-speed traffic with a conventional treatment BMP versus fully permeable pavement. The example project has an area of 107,000 ft2 (10,000 m2).
These scenarios were considered for an example project in the Sacramento region to provide an example
for LCCA for fully permeable pavement and comparison with LCCA for other BMPs.

Laboratory Testing and Modeling for Structural Performance of Fully Permeable Pavements Final Report, November 2010
106
7.2.2 Basic Elements of Life-Cycle Cost Analysis
The basic elements of life-cycle cost analysis include analysis period, discount rate, costs, and salvage
value. Each element is briefly discussed in the following sections.
Analysis Period
The analysis period is a fundamental component of the life-cycle cost analysis process and is essentially a
policy decision dependent on the agency, circumstances, and infrastructure involved. It should be long
enough to include the maintenance, rehabilitation, and necessary reconstruction activities that are a
consequence of the initial strategy selected, but the period should not fall outside what can be reliably
predicted into the future from historical records. Furthermore, any costs anticipated far into the future that
are discounted back to present worth will become negligible in terms of the other costs earlier on in the
life-cycle. The analysis period is usually longer than the design life.
A general rule to determine the analysis period is approximately 1.5 times the design life of the strategy
selected. The recommended analysis periods for comparing alternatives from the California Life-Cycle
Cost Analysis Procedures Manual are listed in Table 7.1 (32). These periods vary from 20 to 55 years,
depending on the different pavement service life. Since this project needs to compare the fully permeable
pavement and conventional treatment BMPs, the analysis period is constrained by the information of
these treatment BMPs. The design life for BMPs currently used in California is generally fixed at 20 years
(33,34). When it has reached this design life, the treatment BMP is demolished and a new treatment BMP
is constructed. Therefore, to make an equitable comparison between fully permeable pavement (which
would typically have a project life of more than 20 years) and currently used BMPs, an analysis period of
40 years was used in this study. It was assumed that a specific treatment BMP would be constructed twice
during this period, and that the surface of the fully permeable pavement would be replaced every 10 to 20
years. The same 40-year analysis period was used for the comparison of all alternatives. For the purposes
of this study, the costs of installing and maintaining treatment BMPs were annualized to simplify
comparisons.
Table 7.1: Recommended Analysis Periods for Comparing Alternatives
CAPM1 10-Year 15-20 Year 20-40 Year Alternative Design Life Analysis Period in Years
CAPM1
10-Year 15 to 20-Year 20 to 40-Year
20 20 20 -
20 20 35 55
20 35 35 55
- 55 55 55
1 Capital Asset Preventative Maintenance

Laboratory Testing and Modeling for Structural Performance of Fully Permeable Pavements Final Report, November 2010
107
Discount Rate
The discount rate takes the time value of money into account and is essentially the difference between
inflation and the interest rate. The selection of an appropriate discount rate is critical since it essentially
determines the portion of future cost (maintenance, rehabilitation, and reconstruction) relative to the cost
of initial construction. If the discount rate is set too low, then the future cost will dominate the total cost.
Conversely, if the discount rate is set too high, the initial construction cost will dominate the total cost.
Caltrans typically uses four percent in its LCCA studies. In this project, zero percent and four percent
discount rates were both used for calculation to assess the influence that this parameter has on the
calculation outcome.
Salvage Value
Salvage value is used to make equitable comparisons between alternative pavement designs with different
service lives. The salvage value of a pavement represents its economic value at the end of the analysis
period. The Federal Highway Administration (FHWA) characterizes the salvage value as the cost of the
last rehabilitation activity multiplied by the ratio of years until the end of the analysis period to the years
until the next activity (e.g., rehabilitation or reconstruction) beyond the analysis period. This is
essentially a straight line depreciation of the pavement asset (35). Salvage values are typically small in
comparison with the other costs associated with the life-cycle of a pavement. The Caltrans LCCA
software used in this study also adopts a straight line depreciation to the end of the project’s design life.
In this study, the salvage value at the end of the analysis period was assumed to be zero because the
analysis period is either four times or two times the design life.
Costs
The cost of a project usually includes agency cost and user cost. Agency costs include initial construction,
maintenance and rehabilitation, salvage value at the end of the design period (discussed in the previous
section), administration, traffic control, etc. User costs are basically the costs that the road user incurs,
including vehicle operating costs, time delay cost, damage to freight when transporting goods on rough
roads, etc. However, because of the high uncertainty in calculating user costs and given that user cost is
unlikely to change significantly between the choices of BMP, only agency costs were analyzed in this
project.
Mr. Bill Clarkson of Teichert Construction in Sacramento, California, volunteered to develop cost
estimates for each of the example scenarios. Thickness designs were taken from the structural design
calculations for open-graded hot-mix asphalt (HMA-O), open-graded portland cement concrete (PCC-O)

Laboratory Testing and Modeling for Structural Performance of Fully Permeable Pavements Final Report, November 2010
108
and cast PCC pavements. The agency cost estimates from Teichert Construction include the following
components:
Mobilization of equipment Temporary K-Rail construction (only for shoulder retrofit) Roadway excavation Pavement material and construction (These costs include conventional HMA, rubberized hot-mix
asphalt [RHMA-O], PCC-O, granular base, PCC-O subbase, Class-2 aggregate base [only with conventional HMA surface], and relevant construction costs.)
Other material and placement (These costs include geofabrics [Mirafi NT100 Fabric, Mirafi 140NC Fabric], drainage systems [Multiflow 1200 Drainage Media, and Multiflow 12003 Outlet], membrane placement, and drainage placement).
The cost of scheduled maintenance and rehabilitation for conventional HMA was determined using the
Caltrans Life-Cycle Cost Analysis Procedures Manual (32). The annual maintenance schedule for fully
permeable pavement was determined from a study performed by the United States Environmental
Protection Agency (U.S. EPA) (36), which suggests vacuum sweeping twice per year. The cost of
vacuum sweeping is about $400 to $500 per year per half acre in total (37). Therefore, an annual
maintenance cost of $0.02/ft2 ($0.22/m2) was used for fully permeable pavement. Design lives of 10 years
and 20 years were both used for calculation to assess the influence of this parameter on the calculation
outcome, and to assist with designing cost-effective fully permeable pavement structures.
The construction cost and operation and maintenance (O&M) cost for unit volume of annual runoff
treatment capacity for the treatment BMPs in this project were imported from the Caltrans report BMP
Retrofit Pilot Program – Final Report (33) and the Caltrans’ technical memorandum BMP Operation and
Maintenance Cost Analysis (34), both of which are based on individual BMP projects (including Wet
Basin, Austin Sand Filter, etc) that were evaluated in Caltrans Districts 7 and 11. The total construction,
operation, and maintenance cost were acquired by multiplying the unit cost (sourced from the above
mentioned reports) by the annual runoff volume from a particular pavement section to obtain the total cost
for the BMPs. The cost information from these reports is based on 1999 dollars, which was converted to
2007 dollars using a Consumer Price Index (CPI) conversion factor of 0.804 (38). Table 7.2 shows an
example runoff calculation for the Sacramento area, sourced from the results of the companion project (4)
to this study which investigated hydraulic performance of fully permeable pavements.
It must be emphasized that the example cost comparisons included in this technical memorandum are
based on current available relevant information for the Sacramento area, which is limited, and that these
example comparisons are also likely to vary widely over time and between regions, and will depend on
the specific constraints of a given project. These constraints will include but are not limited to the

Laboratory Testing and Modeling for Structural Performance of Fully Permeable Pavements Final Report, November 2010
109
distance from available materials, traffic control requirements, site conditions, number of contractors
interested in building these types of pavements, etc.
Table 7.2: Computation of Annual Runoff Volume for Different Scenarios in Sacramento Area
Input Parameter Value Annual rainfall for Sacramento Shoulder width Lane width Project length Runoff coefficient1
0.43 m/yr 3.0 m 3.7 m
1,600 m 1
Drained area: 2-lane road with shoulders (one direction) Drained area: 6-lane road with shoulders (one direction) Drained area: Maintenance yard/parking lot
10,780 m2 20,434 m2 10,000 m2
Runoff Volume: 2-lane road with shoulders (one direction) Runoff Volume: 6-lane road with shoulder (one direction) Runoff Volume: Maintenance yard
4,636 m3/yr 8,787 m3/yr 4,300 m3/yr
1 Highway is highly impervious
7.2.3 LCCA Analysis Software
The Caltrans RealCost LCCA software (32) was used for calculating the pavement-related costs. Inputs
include agency cost of each activity (including initial construction, maintenance, and rehabilitation, and
reconstruction), design life, annual maintenance cost, discount rate, and analysis period. Output from the
analysis is the Net Present Value (NPV), which is used to compare difference project alternatives.
7.2.4 LCCA Calculations
In this project, the standard engineering economics method was used to calculate the NPV. Each cash
flow is discounted back to its present value, and the sum of these values is the NPV. The function for
calculating present value is shown in Equation 7.1. The Caltrans RealCost LCCA software (32) was used
to check the results.
(1 )t
t
RNPV
(7.1)
Where: t is the time of cash flow, is the discount rate, and Rt is the net cash flow.
Conventional HMA Pavement with BMP
Table 7.3 shows the BMP cost per cubic meter of water processed for a range of currently used BMPs.
Pavement construction costs are not included as it is assumed that the BMPs are constructed adjacent to
existing pavements. Construction and operation and maintenance cost data are only available for certain
treatments and consequently only those treatment BMPs with both these costs were used for the life-cycle
cost calculation. Table 7.4 shows the NPV for different BMPs for the first year of construction per cubic
meter of water processed. In the 40-year analysis period, a treatment BMP will be constructed twice (i.e.,

Laboratory Testing and Modeling for Structural Performance of Fully Permeable Pavements Final Report, November 2010
110
in the first year and in the 21st year), based on a 20-year design life. These two construction events and all
follow-up maintenance and operation are assumed the same in both design periods. In each 20-year period,
the present value of the total cost was calculated for the first year of this period, and then these values
were discounted to the first year of the 40-year analysis period to get final NPVs. These NPVs were then
multiplied by the annual volume of runoff from the one-mile pavement section example in the
Sacramento area (see Table 7.2) to obtain the total NPVs, also shown in Table 7.4 (last column). It is
clear from Table 7.4 that there is a significant difference in the life-cycle costs of the different
technologies over the design life of a pavement. Table 7.5 provides a summary of the highest and lowest
NPVs for the three design scenarios over a 40-year analysis period. It should be noted that certain
treatment BMPs may not be feasible in certain locations (e.g., there may not be sufficient space to
construct a specific BMP technology), and local costs may differ from those used in these example
comparisons.
Fully Permeable Pavement
The three pavement design scenarios included in the structural analysis part of this project, namely open-
graded asphalt, open-graded concrete, and jointed plain concrete with holes cast into it were each costed
separately (Table 7.6). The costs of removing any existing stormwater drainage infrastructure were not
considered. The highest and lowest NPVs for each scenario were then extracted from the cost analysis for
comparison with conventional asphalt pavement with a BMP, as shown in Table 7.7. The type of
pavement used in Table 7.3 through Table 7.5 were not stated because of the lack of historical cost data
for the different kinds of pavement structure, and were intended to only provide a reasonable range for
comparison with the conventional pavements with a currently available BMP technology. The costs in
Table 7.6 and Table 7.7 indicate that there is not a significant difference in the life-cycle costs of the three
different surfacings, and that choice of surfacing may be driven by operational issues rather than cost
issues.
7.2.5 Comparison of Life-Cycle Costs
A comparison of the life-cycle cost estimates of currently available BMPs installed adjacent to existing
pavements (Table 7.4) with those of fully permeable pavements (Table 7.6) indicate that the fully
permeable pavement appears to be more cost effective than currently available BMPs in most instances
for both the shoulder retrofit and maintenance yard/parking lot scenarios (Figure 7.1). Fully permeable
shoulders draining single lanes were on the order of two-thirds the cost of the lowest cost currently
available BMP; fully permeable shoulders draining three lanes were on the order of half the cost; while
fully permeable maintenance yards/parking lots were of a similar cost when lowest costs were compared,

Laboratory Testing and Modeling for Structural Performance of Fully Permeable Pavements Final Report, November 2010
111
assuming that the fully permeable system is replaced after 10 years in all instances. If highest costs are
compared, fully permeable pavement systems are significantly more cost-effective than currently
available BMP technologies. It must be emphasized again that these cost comparisons are intended as
examples for order of magnitude comparison only, that costs will vary depending on a number of factors
(e.g., depth of excavation required, thickness of aggregate reservoir, haul distance for reservoir aggregate,
haul distance for disposal of excess excavated material, contractor establishment costs, contractor
experience, traffic control, traffic delays, etc.) and that the findings will need to be validated in full-scale
field experiments. A project-specific LCCA should be performed for each project to ensure that
appropriate technologies are compared.

Laboratory Testing and Modeling for Structural Performance of Fully Permeable Pavements Final Report, November 2010
112
Table 7.3: Currently Available BMP Cost per Cubic Meter of Water Treated
Average Construction Cost Construction Cost per m3 Water BMP Type
1999$ 2007$ 1999$ 2007$
Annual O and M Cost (2007$)
Annual O and M Cost per m3 Water
(2007$) Wet Basin
Multi-chambered Treatment Train Oil-Water Separator Delaware Sand Filter
Storm-Filter Austin Sand Filter - Concrete
Biofiltration Swale Biofiltration Strip Infiltration Trench
Extended Detention Basin Infiltration Basin Drain Inlet Insert
Austin Sand Filter - Earthen Traction Sand Trap
Gross Solids Removal Device
448,412 275,616 128,305 230,145 305,355 242,799 57,818 63,037 146,154 172,737 155,110 370 No data No data No data
557,726 342,806 159,583 286,250 379,795 301,989 71,913 78,404 181,784 214,847 192,923 460 No data No data No data
1,731 1,875 1,970 1,912 1,572 1,447 752 748 733 590 369 10
No data No data No data
2,153 2,332 2,450 2,378 1,955 1,800 935 930 912 734 459 12 543 1,860 760
21,206 7,147 No data 2,497 No data 2,553 4,124 671 1,982 4,999 3,728 No data 3,129 1,823 4,963
40 14
No Data 5
No Data 5 8 1 4 9 7
No Data 6 3 9
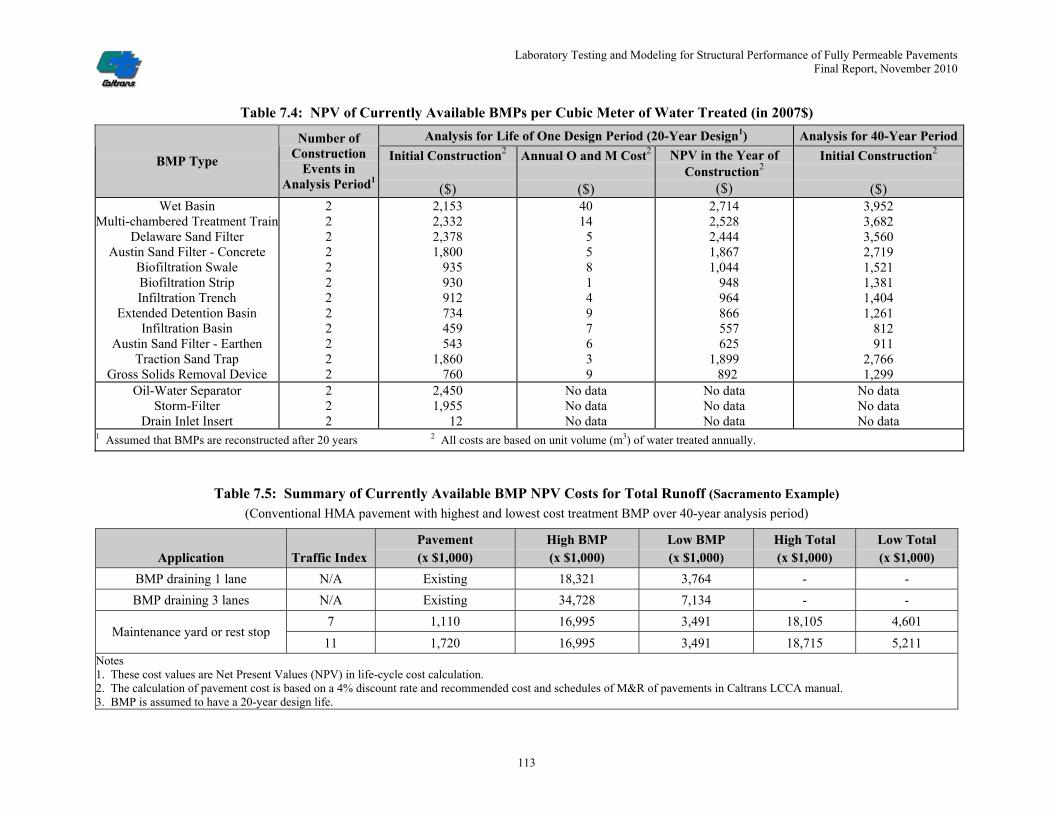
Laboratory Testing and Modeling for Structural Performance of Fully Permeable Pavements Final Report, November 2010
113
Table 7.4: NPV of Currently Available BMPs per Cubic Meter of Water Treated (in 2007$)
Analysis for Life of One Design Period (20-Year Design1) Analysis for 40-Year Period
BMP Type
Number of Construction
Events in Analysis Period1
Initial Construction2
($)
Annual O and M Cost2
($)
NPV in the Year of Construction2
($)
Initial Construction2
($) Wet Basin
Multi-chambered Treatment Train Delaware Sand Filter
Austin Sand Filter - Concrete Biofiltration Swale Biofiltration Strip Infiltration Trench
Extended Detention Basin Infiltration Basin
Austin Sand Filter - Earthen Traction Sand Trap
Gross Solids Removal Device
2 2 2 2 2 2 2 2 2 2 2 2
2,153 2,332 2,378 1,800 935 930 912 734 459 543 1,860 760
40 14 5 5 8 1 4 9 7 6 3 9
2,714 2,528 2,444 1,867 1,044 948 964 866 557 625 1,899 892
3,952 3,682 3,560 2,719 1,521 1,381 1,404 1,261 812 911 2,766 1,299
Oil-Water Separator Storm-Filter
Drain Inlet Insert
2 2 2
2,450 1,955 12
No data No data No data
No data No data No data
No data No data No data
1 Assumed that BMPs are reconstructed after 20 years 2 All costs are based on unit volume (m3) of water treated annually.
Table 7.5: Summary of Currently Available BMP NPV Costs for Total Runoff (Sacramento Example) (Conventional HMA pavement with highest and lowest cost treatment BMP over 40-year analysis period)
Application Traffic Index Pavement (x $1,000)
High BMP (x $1,000)
Low BMP (x $1,000)
High Total (x $1,000)
Low Total (x $1,000)
BMP draining 1 lane N/A Existing 18,321 3,764 - -
BMP draining 3 lanes N/A Existing 34,728 7,134 - -
7 1,110 16,995 3,491 18,105 4,601 Maintenance yard or rest stop
11 1,720 16,995 3,491 18,715 5,211 Notes 1. These cost values are Net Present Values (NPV) in life-cycle cost calculation. 2. The calculation of pavement cost is based on a 4% discount rate and recommended cost and schedules of M&R of pavements in Caltrans LCCA manual. 3. BMP is assumed to have a 20-year design life.

Laboratory Testing and Modeling for Structural Performance of Fully Permeable Pavements Final Report, November 2010
114
Table 7.6: NPV of Fully Permeable Pavement for Total Runoff (Sacramento Example)
Application Traffic Index
Surface Type
Subbase Structure
Surface Thickness
(mm)
Granular Base (mm)
Subbase (mm)
Initial Construction
(x $1,000)
Remove & Replace
(x $1,000)
Annual Maintenance
(x $1,000)
10-Year, 0%
(x $1,000)
10-Year, 4%
(x $1,000)
20-Year, 0%
(x $1,000)
20-Year, 4%
(x $1,000)
PCC-O 200 530 150 1,323 577 2 3,139 2,198 1,986 1,631 RHMA-O
No subbase 200 680 0 1,146 577 2 2,962 2,021 1,809 1,454
PCC-O 250 530 150 1,496 801 2 3,986 2,694 2,383 1,906 PCC-O
No subbase 250 680 0 1,319 801 2 3,809 2,518 2,207 1,729
PCC-O 420 530 150 2,500 0 2 2,586 2,544 2,586 2,544
7
Cast PCC No subbase 420 680 0 2,323 0 2 2,409 2,367 2,409 2,367
PCC-O 260 530 150 1,417 683 2 3,552 2,445 2,186 1,773 RHMA-O
No subbase 305 680 0 1,310 763 2 3,685 2,453 2,159 1,702
PCC-O 270 530 150 1,533 846 2 4,157 2,796 2,465 1,963 PCC-O
No subbase 270 680 0 1,356 846 2 3,980 2,619 2,288 1,786
PCC-O 460 530 150 2,523 0 2 2,609 2,567 2,609 2,567
Highway shoulder retrofit,
1 lane
11
Cast PCC No subbase 460 680 0 2,346 0 2 2,432 2,390 2,432 2,390
PCC-O 200 1,000 150 1,519 577 2 3,335 2,394 2,182 1,827 RHMA-O
No subbase 200 1,150 0 1,338 577 2 3,153 2,212 2,000 1,645
PCC-O 250 1,000 150 1,691 801 2 4,181 2,889 2,578 2,101 PCC-O
No subbase 250 1,150 0 1,509 801 2 3,999 2,708 2,396 1,919
PCC-O 420 1,000 150 2,694 0 2 2,779 2,738 2,779 2,738
7
Cast PCC No subbase 420 1,150 0 2,512 0 2 2,598 2,556 2,598 2,556
PCC-O 260 1,000 150 1,613 683 2 3,748 2,641 2,382 1,969 RHMA-O
No subbase 305 1,150 0 1,501 763 2 3,877 2,644 2,350 1,893
PCC-O 270 1,000 150 1,728 846 2 4,352 2,991 2,660 2,158 PCC-O
No subbase 270 1,150 0 1,546 846 2 4,170 2,809 2,478 1,976
PCC-O 460 1,000 150 2,717 0 2 2,803 2,761 2,803 2,761
Highway shoulder retrofit,
3 lane
11
Cast PCC No subbase 460 1,150 0 2,535 0 2 2,621 2,579 2,621 2,579

Laboratory Testing and Modeling for Structural Performance of Fully Permeable Pavements Final Report, November 2010
115
Application Traffic Index
Surface Type
Subbase Structure
Surface Thickness
(mm)
Granular Base (mm)
Subbase (mm)
Initial Construction
(x $1,000)
Remove & Replace
(x $1,000)
Annual Maintenance
(x $1,000)
10-Year, 0%
(x $1,000)
10-Year, 4%
(x $1,000)
20-Year, 0%
(x $1,000)
20-Year, 4%
(x $1,000)
PCC-O 200 530 150 1,593 635 4 3,664 2,593 2,394 1,968 RHMA-O
No subbase 200 680 0 1,277 635 4 3,348 2,277 2,077 1,652
PCC-O 250 530 150 1,694 826 4 4,338 2,969 2,686 2,156 PCC-O
No subbase 250 680 0 1,377 826 4 4,022 2,653 2,369 1,840
PCC-O 420 530 150 3,398 0 4 3,564 3,483 3,564 3,483 Cast PCC
No subbase 420 680 0 3,082 0 4 3,247 3,167 3,247 3,167
7
HMA2 No subbase 120 370 0 609 1,721 1,110
PCC-O 260 530 150 1,747 808 4 4,338 2,996 2,721 2,201 RHMA-O
No subbase 305 680 0 1,546 938 4 4,526 2,982 2,649 2,059
PCC-O 270 530 150 1,742 1,194 4 5,488 3,546 3,101 2,371 PCC-O
No subbase 270 680 0 1,425 1,194 4 5,171 3,229 2,784 2,055
PCC-O 460 530 150 3,435 0 4 3,600 3,520 3,600 3,520 Cast PCC
No subbase 460 680 0 3,119 0 4 3,284 3,204 3,284 3,204
Maintenance yard, rest stop, or parking lot
11
HMA2 No subbase 160 560 0 829 2332 1,720 Notes 1. The cost values are Net Present Values (NPV) in life-cycle cost calculation. 2. The cost and schedule for maintenance and replacement are from the Caltrans LCCA manual, which are not listed here. They are not necessarily 10-year or 20-year based design life. 3. 10 years and 20 years are the surface layer replacement period.

Laboratory Testing and Modeling for Structural Performance of Fully Permeable Pavements Final Report, November 2010
116
Table 7.7: Summary of Fully Permeable Pavement NPV Costs for Total Runoff (Sacramento Example) (Fully permeable pavement with highest and lowest cost over 40-Year Design)
Application Traffic Index Cost 10-Year Replacement (x $1,000) 20-Year Replacement (x $1,000)
High PCC-O 2,694 Cast PCC 2,544 7
Low RHMA-O 2,021 RHMA-O 1,454
High PCC-O 2,796 Cast PCC 2,567
Highway shoulder retrofit, 1 lane
11 Low Cast PCC 2,390 RHMA-O 1,702
High PCC-O 2,889 Cast PCC 2,738 7
Low RHMA-O 2,212 RHMA-O 1,645
High PCC-O 2,991 Cast PCC 2,761
Highway shoulder retrofit, 3 lane
11 Low Cast PCC 2,579 RHMA-O 1,893
High Cast PCC 3,483 Cast PCC 3,483 7
Low RHMA-O 2,277 RHMA-O 1,652
High PCC-O 3,546 Cast PCC 3,520 Maintenance yard or rest stop
11 Low RHMA-O 2,982 PCC-O 2,055
Notes 1. These cost values are Net Present Values (NPV) in life-cycle cost calculation. 2. The calculation of pavement is based on a 4% discount rate 3. All cast PCC concrete pavements in this table have a 40-year life. 10-year and 20-year replacement are only for RHMA-O and PCC-O. 4. Conventional HMA is not included.

Laboratory Testing and Modeling for Structural Performance of Fully Permeable Pavements Final Report, November 2010
117
0
5,000
10,000
15,000
20,000
25,000
30,000
35,000
40,000
1 Lane 3 Lanes Maint. Yard
Net
Pre
sen
t V
alu
e ($
x1,0
00)
BMP Lowest Cost BMP Highest Cost Permeable Lowest Cost Permeable Highest Cost
Figure 7.1: NPV comparison for BMP and Fully Permeable Pavement (Low and High Cost Options).
(for TI 11, 40 year analysis, BMP is replaced every 20 years, permeable pavement is replaced every 10years)

Laboratory Testing and Modeling for Structural Performance of Fully Permeable Pavements Final Report, November 2010
118
7.3 Framework for Environmental Life-Cycle Assessment
7.3.1 Introduction
Life-cycle assessment (LCA) is an approach for assessing the life-cycle of a product from cradle to grave,
and investigates and evaluates all the inputs and outputs from raw material production to the final end-of-
life phase of the product. It provides a comprehensive and defendable means of evaluating the total
environmental impacts of a product. LCA is a separate process from LCCA and uses different analysis
approaches and inputs.
Although the International Organization for Standardization (ISO) has established a series of standards
for conducting LCA, applying these general guidelines to long-life infrastructure such as pavements is
constrained by the lack of current knowledge and the definition of system boundaries. Although several
LCA studies have been undertaken on pavement projects, there is a general lack of consistency in the
methodology followed and in how the system boundaries are defined. Other inconsistencies include poor
identification of pavement life-cycle phases, unclear functional units, and poor interpretation of inventory.
Consequently, the findings are debatable and, like other forms of environmental and cost analysis, can be
influenced by the way that the input values are used and interpreted. Decisions made based on the
outputs of such analyses can lead to unanticipated longer-term consequences. Therefore, this study
strives to improve current knowledge and make recommendations towards dealing with some of the
controversial inputs and system boundary definitions relevant to fully permeable pavements. Similar
problems are encountered with assessing BMP devices and to date, no documented LCAs have been
undertaken on treatment BMPs. Consequently, only a pavement-oriented LCA framework has been
developed in this study. Furthermore, since many of these problems are still under discussion, no
quantified results will be given here.
The life-cycle assessment discussed in this report follows the guidelines described in ISO 14044 –
Environmental Management – Life-cycle Assessment – Requirement and Guidelines (39). The basic
stages of performing an LCA include goal and scope definition, life-cycle inventory, impact assessment,
and interpretation (Figure 7.2). Since the interpretation stage is essentially an analysis procedure to draw
conclusions, make recommendations, or assist decision-making, it is integrated into the description of all
other stages.
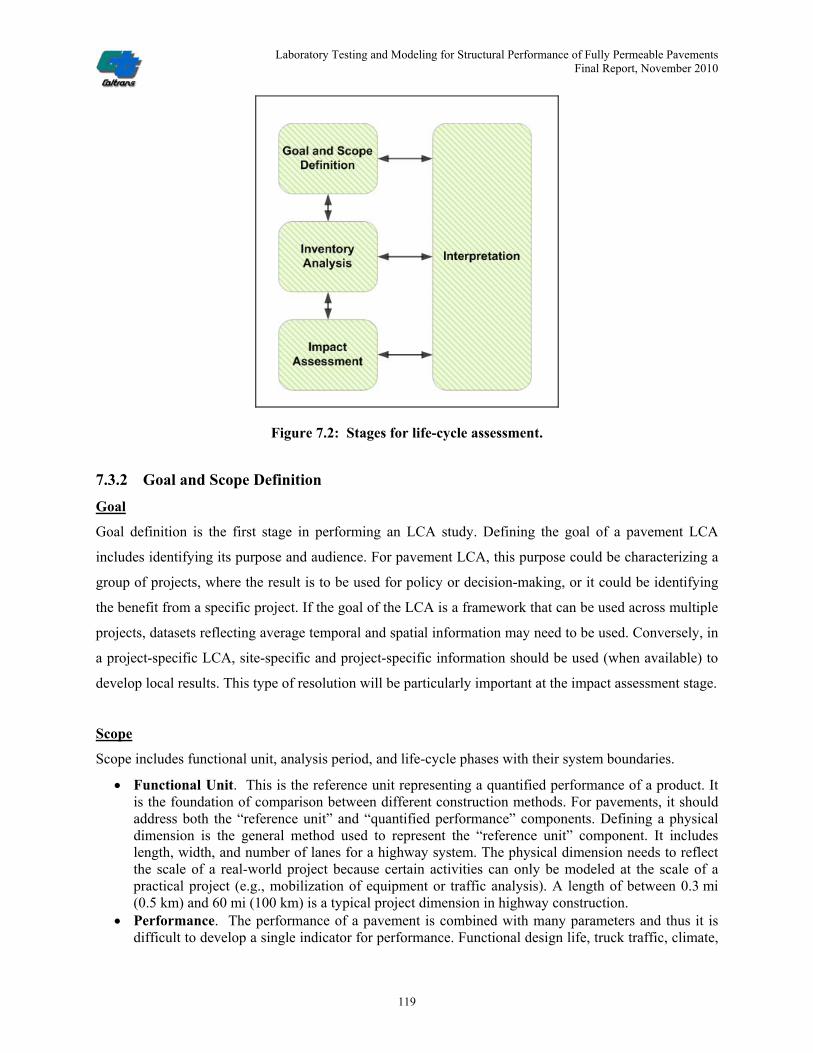
Laboratory Testing and Modeling for Structural Performance of Fully Permeable Pavements Final Report, November 2010
119
Figure 7.2: Stages for life-cycle assessment.
7.3.2 Goal and Scope Definition
Goal
Goal definition is the first stage in performing an LCA study. Defining the goal of a pavement LCA
includes identifying its purpose and audience. For pavement LCA, this purpose could be characterizing a
group of projects, where the result is to be used for policy or decision-making, or it could be identifying
the benefit from a specific project. If the goal of the LCA is a framework that can be used across multiple
projects, datasets reflecting average temporal and spatial information may need to be used. Conversely, in
a project-specific LCA, site-specific and project-specific information should be used (when available) to
develop local results. This type of resolution will be particularly important at the impact assessment stage.
Scope
Scope includes functional unit, analysis period, and life-cycle phases with their system boundaries.
Functional Unit. This is the reference unit representing a quantified performance of a product. It is the foundation of comparison between different construction methods. For pavements, it should address both the “reference unit” and “quantified performance” components. Defining a physical dimension is the general method used to represent the “reference unit” component. It includes length, width, and number of lanes for a highway system. The physical dimension needs to reflect the scale of a real-world project because certain activities can only be modeled at the scale of a practical project (e.g., mobilization of equipment or traffic analysis). A length of between 0.3 mi (0.5 km) and 60 mi (100 km) is a typical project dimension in highway construction.
Performance. The performance of a pavement is combined with many parameters and thus it is difficult to develop a single indicator for performance. Functional design life, truck traffic, climate,

Laboratory Testing and Modeling for Structural Performance of Fully Permeable Pavements Final Report, November 2010
120
subgrade, and criteria for functional performance should be included as parameters in any study to quantify performance. - Analysis Period. This refers to the time horizon used to inventory the inputs and outputs
related with the functional unit. Since each initial construction will often have a different functional design life, and may be followed by a series of maintenance and rehabilitation activities, setting the analysis period correctly presents a challenge in quantifying the total effects in a life-cycle of a pavement. Some proposed methods to determine the analysis period include: Using 1.5 times the longest functional design life among all alternatives. This method comes
from the analysis period in LCCA. Adopting this method may result in greater compatibility between the LCCA and LCA results, and allow integrated analyses.
Selecting the minimal activity required for next major rehabilitation. This method serves to make a “fair” comparison between two rehabilitation activities with different design lives. Within the same period for each alternative, activities with a shorter design life will be penalized by a higher construction frequency.
Annualizing/amortizing construction events. This method also creates a “fair” comparison between alternatives by allocating one construction into the design life.
- System Boundaries. The life-cycle phases of pavement include material production, construction, use, maintenance and rehabilitation, and end-of-life phase. A framework showing this process is presented in Figure 7.3. Material production. In the material production phase, the inputs and outputs from the
production process of all the materials (such as quarrying, or mixing, and the transport of materials) should be included. The allocation of impacts during asphalt production is, however, difficult since asphalt is a by-product of oil refining, and correctly allocating the energy consumption and pollutant emission to asphalt presents a challenge.
Construction, maintenance, and rehabilitation. Since maintenance and rehabilitation is essentially a construction process, it will have essentially the same system boundaries as the construction phase. In these phases, the inputs and outputs from transporting the materials and equipment and equipment usage are included. Important factors include the transport of water and water use during construction, which are often omitted in many studies. The additional fuel consumption and emission from vehicles affected by construction is also taken into consideration. Other energy use includes lighting during night construction and building the roadway lighting system.
Use. The factors considered in the use phase include increasing vehicle operating costs as the pavement deteriorates, heat island effect from solar reflection and evaporative cooling, non-greenhouse gas climate change effects, including radiated heat forcing from pavement surfaces, carbonation of cement (CO2 absorption), and water pollution from leachate and runoff. The most significant part in this phase is thought to be the extra fuel use due to increased rolling resistance as the pavement deteriorates. However, there is currently no state-of-art model to simulate this problem and consequently it is difficult to quantify the effect.
End-of-life phase. In end-of-life phase, demolition and recycling are considered. For demolition, the emissions and fuel use during the hauling of demolished material are included. However, recycling imposes a critical problem regarding the allocation of net input/output between the system that generates the “waste” and the system that recycles the “waste.” Currently there are a number of methods for doing this, but only two that are commonly used. One method assumes that each construction event is responsible for the materials it uses. This implies that the construction event that uses virgin material is assigned all the environmental burdens for consuming that virgin material. Thus, all subsequent construction events that use recycled materials are only responsible for the recycling process and transport of the recycled materials. The other method allocates half the burden of

Laboratory Testing and Modeling for Structural Performance of Fully Permeable Pavements Final Report, November 2010
121
producing and disposing of virgin materials to the first construction event and half to the final construction event, which uses recycled forms of the virgin material.
7.3.3 Life-Cycle Inventory
The life-cycle inventory stage involves data collection and modeling of the product based on the life-cycle
phases and system boundaries identified in the previous stage. It includes all the inputs and outputs
related to the product and its environment, within the boundary and based on the functional units defined
in the first stage. However, currently a life-cycle inventory which meets the goal defined at the first stage
(policy-level or project-level) is still under investigation. Some common categories of inventory include:
Energy Consumption. Energy consumption should include all the energy used during the life-cycle, including feedstock energy and combusted energy. Feedstock energy is the embodied energy in a material which is usually utilized until combusted. Feedstock energy must be recorded because it can often be utilized when the material is burned for energy. In pavement, asphalt binder has very high feedstock energy; however, it is rarely burned for energy.
Greenhouse Gas Emissions. This category quantifies the climate change effect in the impact assessment stage. Major greenhouse gas emissions, including CO2, CH4, and N2O, need to be recorded. In addition, NOX, particulates and other pollutants that are emerging as critical climate change factors should also be included as the scientific consensus develops on their effects/global warming potential.
Material Flows, including fossil/non-renewable resource flows, and water flow. Air Pollutants, including NOX, VOC (Volatile Organic Compounds), PM10, PM2.5, SO2, CO, and
lead. Water Pollutants and Solid Waste Flows, including toxics or hazardous waste.
7.3.4 Impact Assessment
The impact assessment stage provides comprehensive information to help assess the product’s inventory
results. The first step in this stage is to assign the appropriate inventory results to the selected impact
categories, such as global warming, ozone depletion, etc. Then, the results that fall into the same category
are characterized and calculated by a category indicator, such as Global Warming Potential (GWP),
Ozone Depletion Potential (ODOP), etc. Usually a reference substance with a standard impact is set for
each impact category, and all other substances are converted based on its impact over the reference level.
For example, in global warming, CO2 is set as the reference substance, and all other greenhouse gases will
be converted to CO2-equivalents based on their impact on global warming relative to CO2. The final step
is valuation, which integrates across impact categories using weights or other approaches enabling
decision-makers to assimilate and consider the full range of relevant outcomes. However, because this
step contains very high uncertainty and variability, and the second step is usually based on scientifically
reliable research, many studies stop at the second step as a “mid-point” assessment. Some common
impact categories include:

Laboratory Testing and Modeling for Structural Performance of Fully Permeable Pavements Final Report, November 2010
122
Climate Change. The inventory of greenhouse gases should be tracked and reported in CO2-equivalents or a similarly well-understood climate change indicator – preferably one that accounts for the timing of emissions. The source of method and time horizon used to calculate CO2-equivalents must be reported in the analysis.
Resource Depletion. This translates the inventory of material flows into categories of consumption, such as non-renewable use or abiotic resource use.
Other impact categories, such as effects on human health, or environmental impact categories such as ozone depletion potential or acidification potential.

Laboratory Testing and Modeling for Structural Performance of Fully Permeable Pavements Final Report, November 2010
123
Figure 7.3: Proposed framework for pavement LCA.

Laboratory Testing and Modeling for Structural Performance of Fully Permeable Pavements Final Report, November 2010
124

Laboratory Testing and Modeling for Structural Performance of Fully Permeable Pavements Final Report, November 2010
125
Chapter 8 Summary, Conclusions and Recommendations
8.1 Summary
This final report summarizes the following testing, calculations, and analyses performed for this project:
Review of available information regarding fully permeable pavements; Laboratory testing to characterize materials for fully permeable pavements, including subgrade,
permeable granular base, open-graded hot-mix asphalt (HMA-O), open-graded portland cement concrete (PCC-O), and PCC slabs with cast-in holes;
Mechanistic-empirical computer modeling for structural designs for three types of surface material (HMA-O, PCC-O, and cast slabs) considering different traffic loading based on typical California highway traffic, different traffic speeds, several typical California climate regions, and materials properties developed from the laboratory testing;
Development of a preliminary design method and preliminary design tables considering both hydraulic and structural performance, with hydraulic performance information sourced from a companion project;
Examples of the use of the preliminary design method and tables; Example life-cycle cost analyses comparing fully permeable pavement with other best management
practices (BMPs), and A suggested framework for environmental life-cycle assessment.
The results included in this report complete all of the objectives for this project. Note that the deliverable
from this research is a preliminary design procedure and an example set of catalogue-type design tables
that can be used to design fully permeable pavement pilot and experimental test sections in California.
Recommendations towards the implementation of fully permeable pavements as a stormwater best
management practice in California and preparation of guidelines for the design, construction and
maintenance of these pavements will only be possible after an evaluation of performance and
maintenance requirements in full-scale field experiments and pilot studies.
8.2 Conclusions
Key findings from the laboratory testing phase include:
The results of tests on two different subgrade soils (clay and silt) common in the Central Valley of California and much of the rest of the most populated areas of the state indicate that both soil types will offer very little support to a pavement structure, and that the stiffness and associated strength of the materials will decrease significantly as moisture content increases. The fully permeable pavement structures constructed on these materials discussed in this project have been developed to compensate for this poor bearing capacity, with thicker base and surfacing layers, and the optional inclusion of a PCC subbase.
Saturated hydraulic conductivity (permeability) of the two soil types was dependent on construction compaction, as expected. The reduction in permeability with increasing compaction
Laboratory Testing and Modeling for Structural Performance of Fully Permeable Pavements Final Report, November 2010
126
was not as significant for the silt as it was for the clay. The permeability of the clay decreased from 10-2 cm/s (natural, uncompacted in situ soil) to 10-5cm/s (100 percent of laboratory determined maximum dry density) over the range of compacted densities tested.
The results of tests on four different commercially available permeable base-course aggregates indicate that these materials will probably provide sufficient support for typical traffic loads and speeds in parking lots, basic access streets and driveways, and on highway shoulders, while serving as a reservoir layer for the pavement structure. Although three of the four materials tested had smaller maximum aggregate sizes than those typically recommended in the literature, the permeabilities and reservoir capacities were still adequate for California rainfall events.
For open-graded hot-mix asphalt materials (HMA-O), test results indicate that the aggregate particle size distribution in the mix, and the binder type will be the two most critical factors in selecting appropriate mixes. Sufficient permeability for anticipated needs in California was obtained on a range of mixes tested. Adequate resistance to rutting of the surface material appears to be mostly a problem for the HMA-O (RW95 in this report) with conventional binder and the RHMA-O (AR95 in this report) mix with rubberized binder, based on shear modulus. The AR95 and Georgia (G125 in this report) mixes had better rutting resistance in the Hamburg Wheel Tracking test (which also considers moisture sensitivity), in particular the G125 mix containing polymers and fibers. Some moisture sensitivity was evident, but this can be overcome by the use of appropriate anti-strip mechanisms. Most of the mixes of interest had adequate durability (resistance to raveling) compared to the dense-graded control. Flexural stiffness and fatigue cracking resistance of the various mixes were tested for use in the structural design calculations.
The results from tests on open-graded portland cement concrete (PCC-O) indicate a clear relationship between aggregate grading, cement content, water-to-cement ratio, and strength and permeability. All specimens tested exceeded the anticipated permeability requirements, indicating that aggregate gradings and cement contents can be adjusted to increase the strength of the material while still retaining adequate water flow through the pavement. The water-to-cement ratio appears to be critical in ensuring good constructability and subsequent performance of the pavement. Although no durability testing was carried out, the mixes are likely to have some susceptibility to raveling under traffic. Coefficient of thermal expansion of the various mixes was assumed to be 1.2(10-5)/°F (6.5[10-6]/°C) for the design calculations included in this report.
The results from tests on the slabs cast with holes using conventional PCC showed reduced flexural strength compared with conventional PCC slabs without holes, as expected. A 70 percent strength ratio is recommended for use in design for the drainage pattern used in this study. Based on a finite element analysis, weakening of the permeable beams is mostly caused by a reduction in crack resistance cross section, while the effect of stress concentration can be ignored. Permeable concrete pavements with similar surface void ratio (3.1 percent in this study) can be designed the same way as regular non-permeable concrete pavements. The effect of the vertical drainage holes can be accommodated by reducing the modulus of rupture value. This reduction can be estimated by calculating the reduction in crack-resisting cross section normal to the direction of maximum principle stress induced by truck traffic. An additional 10 percent reduction in design modulus of rupture is recommended to account for the lower homogeneity caused by the existence of the drainage holes.
Key findings from the computer modeling of structural capacity and development of structural designs
phase include:
The use of mechanistic-empirical pavement design equations developed in this project was effective in estimating required structural thicknesses for fully permeable pavements to carry slow moving (up to 25 mph [40 km/h]) truck traffic. Thousands of finite element calculations to find critical stresses in fully permeable concrete pavements (PCC-O and cast permeable concrete), and

Laboratory Testing and Modeling for Structural Performance of Fully Permeable Pavements Final Report, November 2010
127
tens of thousands of layer elastic theory calculations to find critical stresses and strains in fully permeable asphalt pavements were performed in order to estimate thicknesses required for structural capacity. Statewide truck axle load spectra from Caltrans weigh-in-motion (WIM) measurements (captured in a UCPRC database) were used to select representative axle loads. Representative pavement temperatures were selected from a database of Enhanced Integrated Climate Model (EICM) calculations to estimate asphalt stiffnesses and temperature gradients in concrete slabs.
The results of stress calculations in concrete and strain calculations in asphalt were used to estimate the required thicknesses for preventing fatigue cracking. Nonlinear layer elastic theory calculations were used to estimate the stiffness of the granular base, which were then used to estimate shear stress-to-strength ratios in the subgrade. Together, these results were used to develop structural design tables that can be used with hydraulic design calculations from the companion project to determine required layer thicknesses. The pavement structures were considered feasible, with all pavement structures less than 5 ft (1.5 m) in total thickness, and most concrete slabs less than 1.5 ft (0.46 m) thick for the heaviest traffic. The use of the PCC-O subbase offers considerably greater protection against the risk of subgrade rutting for asphalt pavements.
Preliminary design tables for pilot studies were developed considering structural and hydraulic performance for the design input variables: - Subgrade permeability, - Truck traffic level in terms of Traffic Index, - Two temperature climate regions (Sacramento and Los Angeles), - Two traffic speeds (4 mph [7 km/h] and 24 mph [40 km/h]), - Three design storms (2, 50, and 100 years) for three climate regions, and - Various numbers of adjacent impermeable lanes.
Design cross sections developed for shoulder retrofit of highways as well as low-speed trafficked areas such as parking lots and maintenance yards were reviewed by construction and maintenance experts and were considered to be feasible to construct and maintain.
Key findings from life-cycle analyses include:
Example life-cycle cost analysis (LCCA) comparisons with conventional stormwater best management practices (BMPs) for the Sacramento region indicated that fully permeable pavements should cost less than conventional BMPs over a 40-year life-cycle. LCCA should be undertaken on a project-by-project basis because alternatives and costs for different types of fully permeable pavement will vary by region and over time.
A framework for environmental life-cycle analysis (LCA) was reviewed; however, it was found that insufficient data were available at this time to complete an example LCA for fully permeable pavements.
8.3 Preliminary Recommendations for Design, Construction and Maintenance of
Pilot Sections
8.3.1 Design
Recommendations regarding design and specifications for fully permeable pavement test sections, based
on the findings of this project, include:
Life-cycle cost analyses should be performed for all projects and the results used to develop criteria for the selection of pavement type and materials. The LCCA comparison results will depend on

Laboratory Testing and Modeling for Structural Performance of Fully Permeable Pavements Final Report, November 2010
128
materials costs at the time, contractor experience, and project-specific conditions (climate region, traffic level, subgrade conditions, etc.).
ASTM specifications for granular materials recommended in the NAPA and ACPA manuals should not be used, unless those materials are locally available, and are found to be the most cost-effective. Instead, it is recommended that locally available materials such as those considered in this study be considered and costed.
A subgrade compaction of between 90 and 92 percent (i.e., target 91% ± 1% tolerance) of laboratory determined maximum density, following Caltrans Test Method 216, is recommended. Compaction in the field should be performed dry of optimum water content. Variability of compaction within the tolerance, the sensitivity of the permeability to variations in compaction, and the relationship between laboratory and field determined densities should be closely monitored in full-scale experiments. Any post-construction consolidation of the reservoir layers and subgrade under trafficking should also be closely monitored.
PCC-O mixes similar to those recommended in this project should be specified, with smaller maximum aggregate sizes and greater cement contents permissible, as long as they provide a minimum permeability of 1.5 cm/s, which satisfies permeability requirements for California rain events and includes a factor for clogging over time. Minimum flexural strengths on the order of 325 psi (2.25 MPa) and/or minimum splitting tensile strengths of 290 psi (2.0 MPa) are recommended for use with the structural design tables included in this report. The use of the splitting tensile strength for mix design was found convenient and cost-effective and is recommended over flexural or compressive strength testing, provided that replicate specimens are tested and variation in test results is appropriately assessed.
The Georgia DOT (G125 in this project) open-graded asphalt mix should be considered first for higher Traffic Index designs, followed by the RHMA-O (AR95 in this report) for lower Traffic Index designs. The HMA-O mix (RW95 in this report) will likely have a higher risk of raveling, rutting, and cracking.
The design cross sections for shoulder retrofit shown in Figure 6.1 and Figure 6.2 are recommended as starting points for producing a design that maintains adequate drainage, structural integrity of the traveled lanes, and constructability.
The use of appropriate Caltrans-specified geotextiles is recommended for use as a filter layer between the subgrade and granular base or subgrade and PCC-O subbase. Appropriate drainage systems with outlets are recommended between the traveled lanes pavement and the impermeable membrane for shoulder retrofit projects. The use of an appropriate Caltrans-specified impermeable membrane fabric is recommended for separation of the permeable shoulder from trafficked lanes.
The number of permitted overflows will need to be determined by Caltrans for each project. This will influence the thickness of the gravel base/reservoir layer and will depend on storm intensity, duration and frequency.
8.3.2 Construction and Maintenance of Pilot Sections
Recommendations regarding construction and maintenance for fully permeable pavement pilot sections,
based on the findings of this project, include:
Permeability tests on the subgrade should be performed at the design depth of the top of the subgrade in the completed structure, and as many permeability tests as possible should be performed across the project to ascertain that sufficient permeability is available for the fully permeable pavement to function effectively. Many subgrades are non-uniform in permeability both laterally and with depth because of the nature of sediment deposition.
For permeable concrete pavements it is recommended that all of the curing and sawing (or other appropriate crack initiation process) recommendations included in the American Concrete

Laboratory Testing and Modeling for Structural Performance of Fully Permeable Pavements Final Report, November 2010
129
Pavement Association (ACPA) guide be followed. Joints in the shoulder should match the joints in the pavement.
Construction traffic should be kept to a minimum on the subgrade after compaction is completed in order to help preserve permeability and prevent rutting.
Conventional street sweeping equipment should not be used on fully permeable pavement because it tends to break organic materials (leaves, seeds, etc.) into smaller particles that will likely clog the surface of the pavement and reduce its permeability. Instead, it is recommended that low-pressure cleaning/vacuuming equipment be used annually to clean the pavement surface.
8.4 Recommendations for Future Work
8.4.1 Accelerated Pavement Testing and Pilot Studies
It is recommended that the preliminary design method and cross sections to meet hydraulic and structural
performance requirements developed in this project be used for the appropriate design of test sections for
accelerated pavement testing (with Heavy Vehicle Simulator [HVS]) and pilot study field validation for
both hydraulic and structural design considerations. The actual designs for those sections (following the
procedure discussed in Chapter 6) will depend on the subgrade soil permeability, climate, and design
truck traffic levels. The pavements should be instrumented to monitor stresses, strains, deflections,
temperatures, thermal gradients, moisture content, and water quality. In PCC-O test sections, optimal mix
designs and the use of proprietary additives should be discussed with readymix suppliers. Distresses such
as raveling, clogging, brooming, and other issues that will impact on the maintenance of these pavements
should also be monitored.
8.4.2 Life-Cycle Considerations
More detailed LCCA and LCA should be performed after construction, evaluation, and performance
validation of HVS and field test sections, which will provide more realistic initial cost information and
improved maintenance and rehabilitation cost estimates.
8.4.3 Other Pavement Type Consideration
It is recommended that this study be extended through another project to consider permeable interlocking
concrete blocks instead of cast concrete as an alternative to asphalt- and concrete-surfaced pavement. It is
recommended that an LCCA be performed as part of that study to provide example information for
comparison with the pavement types considered in this project.

Laboratory Testing and Modeling for Structural Performance of Fully Permeable Pavements Final Report, November 2010
130

Laboratory Testing and Modeling for Structural Performance of Fully Permeable Pavements Final Report, November 2010
131
Chapter 9 References
1. JONES, D., Harvey, J., Li, H. and Campbell, B. 2009. Summary of Laboratory Tests to Assess
Mechanical Properties of Permeable Pavement Materials. Davis and Berkeley, CA: University
of California Pavement Research Center. (CTSW-TM-09-249.01 / UCPRC-TM-2009-05).
2. LI, H., Harvey J. and Jones, D. 2010. Summary of a Computer Modeling Study to Understand
the Performance Properties of Fully Permeable Pavements. Davis and Berkeley, CA:
University of California Pavement Research Center. (CTSW-TM-09-249.02 / UCPRC-TM-2010-
04).
3. WANG, T., Jones, D. and Harvey, J. 2010. A Framework for Life-Cycle Cost Analyses and
Environmental Life-Cycle Assessments for Fully Permeable Pavements. Davis and Berkeley,
CA: University of California Pavement Research Center. (CTSW-TM-09-249.03 / UCPRC-TM-
2010-05).
4. KAYHANIAN, M., Chai, L. and Givens, B. 2010. Hydraulic Performance Evaluation of
Permeable Pavement under Heavy Load and Heavy Traffic. Davis, CA: University of
California, Davis. (CTSW-RT-10-247.03D).
5. HANSEN, B. 2007. Storm-Water Management: Porous Pavement Increases Storage Area at
Portland Marine Terminal. Civil Engineering, Vol.77, No3. Reston, VA: American Society of
Civil Engineers.
6. HANSEN, K. 2008. Porous Asphalt Pavements for Stormwater Management. Lanham, MD:
National Asphalt Pavement Association. (Information Series 131).
7. Stormwater Management with Pervious Concrete Pavement. 2009. Skokie, IL: American
Concrete Pavement Association.
8. SMITH, D.R. 2006. Permeable Interlocking Concrete Pavements. Selection, Design,
Construction, and Maintenance. Herndon, VA. Interlocking Concrete Pavement Institute.
9. JONES, D., Signore, J., Harvey, J.T, and Kayhanian, M. 2008. Laboratory Testing and
Modeling for Structural Performance of Permeable Pavements under Heavy Traffic. Davis
and Berkeley, CA: University of California Pavement Research Center. (Proposal and workplan
prepared for Caltrans Division of Environmental Analysis).
10. SANTERO, N.J., Signore, J., Harvey, J.T. and Kayhanian, M. 2006. Performance Evaluation of
Permeable Pavement Materials for Water Quality Under Heavy Traffic. Task 1: Literature
Review. Davis and Berkeley, CA: University of California Pavement Research Center. (CTSW-
RT-06-168.01D).

Laboratory Testing and Modeling for Structural Performance of Fully Permeable Pavements Final Report, November 2010
132
11. Fully Permeable Pavement Study. 2009. Sacramento, CA: California Department of
Transportation, Division of Environmental Analysis. (CTSW-TM-09-0172.55.1D).
12. TRB 89th Annual Meeting: Compendium of Papers DVD. 2010. Washington, DC:
Transportation Research Board.
13. TUTUMLUER, E. 1995. Predicting Behaviour of Flexible Pavements with Granular Bases.
Atlanta, GA: Georgia Institute of Technology. (Ph.D. dissertation).
14. BEJARANO, M.O. and Thompson, M.R. 1999. Subgrade Soil Evaluation for the Design of
Airport Flexible Pavements. University Illinois at Urbana Champaign. (Report to Federal
Aviation Administration Center of Excellence for Airport Pavements. COE Report No. 8).
15. TUTUMLUER, E. and Seyhan, U. 1999. Laboratory Determination of Anisotropic Aggregate
Resilient Moduli Using an Innovative Test Device. Transportation Research Record: Journal
of the Transportation Research Board. Washington, DC: Transportation Research Board.
(TRR 1687).
16. Resilient Modulus Testing Open-Graded Drainage Layer Aggregates. 2005. Toronto, ON:
Applied Research Associates.
17. DARTER, M.I., and Barenberg, E.J. 1977. Design of Zero-Maintenance Plain Jointed Concrete
Pavement, Volume 1: Development of Design Procedures. Washington, DC: Federal Highway
Administration. (Report FHWA-RD-77-III).
18. DARTER, M.I. 1989. A Comparison between Corps of Engineers and ERES Consultants,
Inc. Rigid Pavement Design Procedures. Champaign, IL: ERES Consultants, Inc.
19. PACKARD, R.G., and Tayabji, S.D. 1985. New PCA Thickness Design Procedure for Concrete
Highway and Street Pavements. 1985. Proc., 3rd International Conference on Concrete
Pavement Design. West Lafayette, IN: Purdue University. (pp. 225-236).
20. ROESLER, J.R. 1998. Fatigue of Concrete Beams and Slabs. Urbana-Champaign, IL:
University of Illinois. (Ph.D. thesis).
21. VESIC, A.S. and Saxena, S.K. 1969. Analysis of Structural Behaviour of Road Test Rigid
Pavements. Highway Research Record 291. Washington, D.C.: Highway Research Board,
National Research Council. (pp. 156-158.)
22. ZHANG, J., Harvey, J.T., Ali, A. and Roesler, J. 2004. Goal 4 Long Life Pavement Rehabilitation
Strategies - Rigid: Laboratory Strength, Shrinkage, and Thermal Expansion of Hydraulic Cement
Concrete Mixes. Berkeley, CA: University of California Pavement Research Center. (UCPRC-RR-
2004-01).

Laboratory Testing and Modeling for Structural Performance of Fully Permeable Pavements Final Report, November 2010
133
23. WU, R., Denneman, E. and Harvey, J.T. 2009. Evaluation of an embedded discontinuity method
for finite element analysis of hot-mix asphalt concrete cracking. Transportation Research
Record, 2127. Washington, DC: Transportation Research Board. (pp. 82-89).
24. BAZANT, Z.P. and Planas, J. 1998. Fracture and Size Effect in Concrete and Other
Quasibrittle Materials. CRC Press.
25. LU, Q. 2002. Truck Traffic Analysis using Weigh-In-Motion (WIM) Data in California. Davis
and Berkeley, CA: University of California Pavement Research Center.
26. DAVIDS, W.G., Turkiyyah, G.M. and Mahoney, J.P. 1998. EverFE - Rigid Pavement Three-
Dimensional Finite Element Analysis Tool. Design and Rehabilitation of Pavements 1998
(1629). (pp. 41-49).
27. SIGNORE J. et.al. 2007. Performance Evaluation of Permeable Pavements for Water Quality
Under Heavy Traffic. Davis and Berkeley, CA: University of California Pavement Research
Center. (UCPRC-RR-2007-02).
28. MINER, M.A. 1945. Cumulative Damage in Fatigue. Journal of Applied Mechanics 12. (pp
A159–A164).
29. LEAP 2.0: A Layered Elastic Analysis Program. 2004. Berkeley, CA: Symplectic Engineering
Corporation. (Release 2.0, March 2004).
30. UZAN, J. 1985. Characterization of Granular Material. In Transportation Research Record
1022. Washington, D.C.: Transportation Research Board, National Research Council. (pp. 52–
59).
31. TUTUMLUER, E. and Thompson, M.R. 1998. Anisotropic Modeling of Granular Bases.
Champaign, IL: University Illinois at Urbana Champaign. (Final Report to Federal Aviation
Administration Center of Excellence for Airport Pavements. COE Report No. 2).
32. Life-Cycle Cost Analysis Procedures Manual. 2007. Sacramento, CA: California Department of
Transportation.
33. BMP Retrofit Pilot Program: Final Report. 2004. Sacramento, CA: California Department of
Transportation.
34. BMP Operation and Maintenance Cost Analysis. 2009. Sacramento, CA: California Department
of Transportation.
35. Life-Cycle Cost Analysis in Pavement Design: In Search of Better Investment Decisions. 1998.
Washington, D.C.: Federal Highway Administration, United States Department of Transportation.
36. Storm Water Technology Fact Sheet for Porous Pavement. 1999. Washington, DC: U.S.
Environmental Protection Agency, Office of Water. EPA 832-F-99-023.

Laboratory Testing and Modeling for Structural Performance of Fully Permeable Pavements Final Report, November 2010
134
37. Low Impact Best Management Practice (BMP) Information Sheet. 2008. Weston, MA:
Charles River Watershed Association. (http://www.crwa.org/projects/bmpfactsheets/).
38. SAHR, R. Inflation Conversion Factors for Dollars 1774 to Estimated 2019. 2009. Corvalis,
OR: Oregon State University. (http://oregonstate.edu/cla/polisci/sahr/sahr).
39. ISO 14044 Environmental Management - Life-Cycle Assessment - Requirements and
Guidelines. 2006. Geneva, Switzerland: International Organization for Standardization. pp46.

Laboratory Testing and Modeling for Structural Performance of Fully Permeable Pavements Final Report, November 2010
135
Appendix A: HMA-O Frequency Sweep Test Results
Table A.1: Summary of Frequency Sweep Test Results: AR95 (RHMA-O)
AR95-1A2 (AV = 18.4%; 10°C) AR95-5A1 (AV = 19.8%; 10°C)
Freq. (Hz)
Stress (MPa)
Strain Temp. (°C)
Phase Angle
(Degree)
E* (MPa)
Freq. (Hz)
Stress (MPa)
Strain Temp. (°C)
Phase Angle
(Degree)
E* (MPa)
Avg. E*
(MPa)
15.16 0.1812 0.000104 9.88 15.32 1737 15.16 0.1991 0.000104 9.56 15.91 1909 1823 10.01 0.1770 0.000104 0.83 14.55 1702 10.01 0.1934 0.000104 9.52 15.47 1866 1784 5.01 0.1644 0.000104 0.78 16.08 1577 5.00 0.1781 0.000104 9.47 16.17 1704 1641 2.00 0.1343 0.000099 0.88 15.62 1350 2.00 0.1456 0.000099 9.43 16.66 1465 1407 1.00 0.1178 0.000097 10.04 17.29 121 1.00 0.1288 0.000099 9.36 16.49 1295 1252 0.50 0.1050 0.000100 10.02 17.28 1053 0.50 0.1125 0.000099 9.33 18.77 1136 1095 0.20 0.0884 0.000099 9.98 19.61 893 0.20 0.0931 0.000099 9.30 19.06 944 918 0.10 0.0764 0.000098 9.89 18.60 776 0.10 0.0803 0.000098 9.23 20.79 820 798 0.05 0.0669 0.000098 9.78 22.40 684 0.05 0.0696 0.000097 9.38 21.03 715 699 0.02 0.0554 0.000098 9.91 20.22 568 0.02 0.0572 0.000097 9.38 22.76 588 578 0.01 0.0496 0.000098 9.90 22.56 505 0.01 0.0198 0.000097 9.36 24.22 513 509
AR95-4B2 (AV = 19.5%; 20°C) AR95-5A2 (AV = 19.8%; 20°C)
Freq. (Hz)
Stress (MPa)
Strain Temp. (°C)
Phase Angle
(Degree)
E* (MPa)
Freq. (Hz)
Stress (MPa)
Strain Temp. (°C)
Phase Angle
(Degree)
E* (MPa)
Avg. E*
(MPa)
15.16 0.1013 0.000106 19.72 23.96 951 15.15 0.1173 0.000109 19.79 22.36 1080 1015 9.99 0.0982 0.000107 19.74 22.84 914 10.01 0.1112 0.000105 19.66 20.27 1061 987 5.00 0.0865 0.000106 19.85 23.84 815 5.00 0.0994 0.000106 19.61 20.63 938 876 2.00 0.0674 0.000102 19.79 23.17 664 2.00 0.0790 0.000102 19.66 20.91 776 720 1.00 0.0556 0.000099 19.57 24.22 562 1.00 0.0637 0.000099 19.79 22.40 644 603 0.50 0.0454 0.000098 19.57 24.36 465 0.50 0.0547 0.000098 19.76 23.54 557 511 0.20 0.0347 0.000096 19.65 24.65 360 0.20 0.0428 0.000098 19.63 25.08 436 398 0.10 0.0277 0.000096 19.81 28.58 289 0.10 0.0355 0.000098 19.66 23.57 363 326 0.05 0.0231 0.000094 19.64 28.27 246 0.05 0.0289 0.000097 19.64 29.06 298 272 0.02 0.0189 0.000093 19.70 33.38 204 0.02 0.0223 0.000096 19.70 30.68 232 218 0.01 0.0156 0.000093 19.71 36.04 167 0.01 0.0188 0.000097 19.68 33.86 194 180
AR95-1A1 (AV = 18.7%; 30°C) AR95-6B2 (AV = 20.4%; 30°C)
Freq. (Hz)
Stress (MPa)
Strain Temp. (°C)
Phase Angle
(Degree)
E* (MPa)
Freq. (Hz)
Stress (MPa)
Strain Temp. (°C)
Phase Angle
(Degree)
E* (MPa)
Avg. E*
(MPa)
15.14 0.1047 0.000209 29.63 33.45 500 15.13 0.1052 0.000207 29.62 34.34 509 504 10.00 0.1055 0.000208 29.73 28.92 506 9.99 0.1042 0.000210 29.67 31.16 496 501 5.01 0.0939 0.000205 29.72 26.88 458 5.00 0.0912 0.000206 29.55 29.09 443 450 2.00 0.0718 0.000197 29.80 28.63 364 2.00 0.0702 0.000197 29.57 29.27 356 360 1.00 0.0600 0.000195 29.73 29.50 308 1.00 0.0572 0.000195 29.60 30.49 294 301 0.50 0.0493 0.000199 29.80 27.76 248 0.50 0.0483 0.000199 29.78 31.49 243 246 0.20 0.0380 0.000199 29.81 30.14 191 0.20 0.0364 0.000197 29.65 32.42 185 188 0.10 0.0330 0.000198 29.69 35.42 167 0.10 0.0294 0.000198 29.58 30.76 149 158 0.05 0.0266 0.000198 29.68 35.92 135 0.05 0.0251 0.000197 29.63 32.04 128 131 0.02 0.0215 0.000198 29.67 32.08 109 0.02 0.0189 0.000196 29.66 36.95 96 103 0.01 0.0175 0.000197 29.69 35.03 89 89

Laboratory Testing and Modeling for Structural Performance of Fully Permeable Pavements Final Report, November 2010
136
Table A.2: Summary of Frequency Sweep Test Results: G125
G125-5A2 (AV = 17.0%; 10°C) G125-4B1 (AV = 16.8%; 20°C)
Freq. (Hz)
Stress (MPa)
Strain Temp. (°C)
Phase Angle
(Degree)
E* (MPa)
Freq. (Hz)
Stress (MPa)
Strain Temp. (°C)
Phase Angle
(Degree)
E* (MPa)
Avg. E*
(MPa)
15.17 0.2572 0.000058 10.57 13.15 4423 15.14 0.2619 0.000066 10.48 12.26 3972 4198 10.00 0.4398 0.000102 10.53 13.30 4292 10.00 0.4020 0.000104 10.44 13.05 3865 4078 5.00 0.4032 0.000103 10.46 13.75 3921 5.00 0.3649 0.000103 10.37 13.68 3545 3733 2.00 0.3345 0.000098 10.42 15.07 3417 2.00 0.3071 0.000099 10.34 14.78 3095 3256 1.00 0.2986 0.000097 10.35 15.79 3064 1.00 0.2691 0.000097 10.28 16.08 2764 2914 0.50 0.2729 0.000101 10.33 16.48 2713 0.50 0.2436 0.000100 10.26 15.93 2448 2580 0.20 0.2292 0.000099 10.28 17.58 2306 0.20 0.2041 0.000099 10.21 17.78 2071 2188 0.10 0.1971 0.000097 10.21 18.91 2022 0.10 0.1776 0.000098 10.15 18.31 1817 1920 0.05 0.1734 0.000098 10.09 19.98 1767 0.05 0.1558 0.000098 10.05 19.44 1595 1681 0.02 0.1438 0.000098 9.94 21.56 1463 0.02 0.1281 0.000098 9.88 22.23 1309 1386 0.01 0.1269 0.000099 9.86 22.86 1286 0.01 0.1134 0.000098 9.88 24.83 1153 1220
G125-4B1 (AV = 16.8%; 20°C) G125-4B2 (AV = 16.8%; 20°C)
Freq. (Hz)
Stress (MPa)
Strain Temp. (°C)
Phase Angle
(Degree)
E* (MPa)
Freq. (Hz)
Stress (MPa)
Strain Temp. (°C)
Phase Angle
(Degree)
E* (MPa)
Avg. E*
(MPa)
15.16 0.2249 0.000083 19.87 17.14 2722 15.16 0.2032 0.000070 19.49 15.32 2890 2806 10.00 0.2666 0.000104 19.89 18.54 2563 10.01 0.2776 0.000102 19.50 18.23 2725 2644 5.00 0.2380 0.000104 19.73 18.90 2282 5.00 0.2513 0.000103 19.53 18.68 2437 2359 2.00 0.1894 0.000100 19.71 20.14 1893 2.00 0.2051 0.000102 19.54 19.82 2018 1956 1.00 0.1591 0.000098 19.79 21.92 1628 1.00 0.1728 0.000100 19.56 21.49 1726 1677 0.50 0.1370 0.000100 19.79 23.44 1366 0.50 0.1462 0.000100 19.56 23.57 1461 1413 0.20 0.1073 0.000098 19.65 24.38 1095 0.20 0.1146 0.000099 19.58 23.89 1153 1124 0.10 0.0886 0.000098 19.62 24.83 904 0.10 0.0935 0.000099 19.60 24.01 947 925 0.05 0.0723 0.000097 19.81 30.00 745 0.05 0.0784 0.000098 19.65 28.21 802 773 0.02 0.0556 0.000097 19.73 30.21 574 0.02 0.0595 0.000097 19.73 28.15 612 593 0.01 0.0450 0.000096 19.72 31.99 467 0.01 0.0473 0.000097 19.73 30.57 486 477
G125-6B2 (AV = 18.9%; 30°C) G125-4B2 (AV = 16.8%; 30°C)
Freq. (Hz)
Stress (MPa)
Strain Temp. (°C)
Phase Angle
(Degree)
E* (MPa)
Freq. (Hz)
Stress (MPa)
Strain Temp. (°C)
Phase Angle
(Degree)
E* (MPa)
Avg. E*
(MPa)
15.15 0.2507 0.000213 29.67 30.87 1175 15.15 0.2826 0.000203 29.61 28.73 1391 1283 10.00 0.2252 0.000208 29.73 29.37 1084 10.01 0.2643 0.000207 29.55 28.13 1279 1181 5.00 0.1869 0.000205 29.68 29.88 911 5.00 0.2218 0.000206 29.53 28.64 1078 994 2.00 0.1380 0.000198 29.75 31.30 697 2.00 0.1669 0.000198 29.66 30.43 842 770 1.00 0.1107 0.000199 29.58 33.35 557 1.00 0.1340 0.000197 29.56 31.60 679 618 0.50 0.0889 0.000201 29.69 35.10 443 0.50 0.1093 0.000203 29.67 32.79 539 491 0.20 0.0633 0.000199 29.69 36.38 318 0.20 0.0804 0.000200 29.66 34.05 402 360 0.10 0.0502 0.000199 29.63 37.71 253 0.10 0.0641 0.000199 29.59 37.80 321 287 0.05 0.0396 0.000198 29.62 37.74 200 0.05 0.0507 0.000199 29.63 37.05 255 227 0.02 0.0300 0.000197 29.63 38.73 152 0.02 0.0381 0.000199 29.61 39.49 192 172 0.01 0.0242 0.000198 29.64 44.91 122 0.01 0.0314 0.000199 29.64 36.60 158 140

Laboratory Testing and Modeling for Structural Performance of Fully Permeable Pavements Final Report, November 2010
137
Table A.3: Summary of Frequency Sweep Test Results: RW95 (HMA-O)
RW95-4B2 (AV = 19.3%; 10°C) RW95-5A2 (AV = 22.8%; 10°C)
Freq. (Hz)
Stress (MPa)
Strain Temp. (°C)
Phase Angle
(Degree)
E* (MPa)
Freq. (Hz)
Stress (MPa)
Strain Temp. (°C)
Phase Angle
(Degree)
E* (MPa)
Avg. E*
(MPa)
15.27 0.2542 0.000049 9.85 12.24 5168 15.16 0.2758 0.000082 9.80 15.47 3376 4272 10.00 0.5224 0.000104 9.89 12.52 5027 9.99 0.3371 0.000103 9.87 15.31 3276 4152 5.00 0.4675 0.000102 9.99 13.74 4605 5.00 0.3034 0.000103 9.82 17.07 2948 3776 2.00 0.3890 0.000098 9.95 16.47 3971 2.00 0.2456 0.000099 9.79 19.16 2480 3225 1.00 0.3416 0.000098 9.97 18.18 3483 1.00 0.2071 0.000098 9.93 21.84 2123 2803 0.50 0.2996 0.000101 10.03 21.27 2972 0.50 0.1797 0.000100 9.92 23.55 1801 2387 0.20 0.2382 0.000100 10.00 23.99 2394 0.20 0.1393 0.000099 9.83 28.06 1401 1898 0.10 0.1937 0.000099 9.84 26.86 1962 0.10 0.1088 0.000097 9.90 28.34 1118 1540 0.05 0.1553 0.000098 9.95 34.56 1580 0.05 0.0872 0.000098 9.85 35.05 892 1236 0.02 0.1107 0.000099 9.94 39.81 1121 0.02 0.0614 0.000097 9.93 37.11 634 877 0.01 0.0814 0.000098 9.91 43.31 828 0.01 0.0449 0.000098 9.87 44.80 459 644
RW95-3A1 (AV = 18.6%; 20°C) RW95-4B2 (AV = 19.3%; 20°C)
Freq. (Hz)
Stress (MPa)
Strain Temp. (°C)
Phase Angle
(Degree)
E* (MPa)
Freq. (Hz)
Stress (MPa)
Strain Temp. (°C)
Phase Angle
(Degree)
E* (MPa)
Avg. E*
(MPa)
15.14 0.3064 0.000108 20.80 27.54 2845 15.18 0.1390 0.000045 19.54 23.37 3115 2980 9.99 0.2862 0.000109 20.82 27.18 2628 9.98 0.3021 0.000105 19.63 23.81 2880 2754 5.00 0.2390 0.000108 20.79 28.96 2216 5.00 0.2542 0.000104 19.77 26.06 2440 2328 1.99 0.1742 0.000105 20.32 31.66 1653 2.00 0.1849 0.000099 19.74 31.26 1859 1756 1.00 0.1333 0.000103 20.40 35.64 1296 1.00 0.1444 0.000099 19.55 35.33 1454 1375 0.50 0.0999 0.000101 20.60 40.15 990 0.50 0.1030 0.000094 19.55 36.45 1101 1046 0.20 0.0653 0.000099 20.72 45.58 657 0.20 0.0715 0.000098 19.61 46.84 731 694 0.10 0.0471 0.000099 20.61 44.53 476 0.10 0.0495 0.000099 19.76 49.90 503 489 0.05 0.0302 0.000099 20.50 50.95 306 0.05 0.0343 0.000097 19.67 58.22 355 330 0.02 0.0179 0.000095 20.46 52.55 189 0.02 0.0199 0.000096 19.70 54.72 207 198 0.01 0.0147 0.000104 20.60 44.62 142 0.01 0.0131 0.000096 19.69 68.28 136 139
RW95-5A1 (AV = 22.0%; 30°C) RW95-3A1 (AV = 18.6%; 30°C)
Freq. (Hz)
Stress (MPa)
Strain Temp. (°C)
Phase Angle
(Degree)
E* (MPa)
Freq. (Hz)
Stress (MPa)
Strain Temp. (°C)
Phase Angle
(Degree)
E* (MPa)
Avg. E*
(MPa)
15.15 0.1212 0.000210 29.83 50.84 576 15.15 0.2207 0.000204 29.64 44.27 1084 830 10.01 0.1092 0.000210 29.61 46.98 520 9.99 0.1930 0.000206 29.52 44.45 938 729 5.01 0.0827 0.000206 29.61 46.46 401 5.00 0.1427 0.000205 29.53 47.33 696 548 2.00 0.0523 0.000199 29.59 48.29 262 2.00 0.0880 0.000197 29.58 51.36 446 354 1.00 0.0378 0.000197 29.57 53.28 192 1.00 0.0608 0.000198 29.53 56.33 307 250 0.50 0.0261 0.000200 29.61 52.78 131 0.50 0.0398 0.000200 29.63 54.51 199 165 0.20 0.0156 0.000199 29.70 49.55 78 0.20 0.0237 0.000199 29.67 55.97 119 99 0.10 0.0119 0.000199 29.69 45.26 60 0.10 0.0146 0.000199 29.68 60.55 74 67 0.05 0.0075 0.000198 29.63 53.72 38 38

Laboratory Testing and Modeling for Structural Performance of Fully Permeable Pavements Final Report, November 2010
138

Laboratory Testing and Modeling for Structural Performance of Fully Permeable Pavements Final Report, November 2010
139
Appendix B: Preliminary Hydraulic Design Tables
Table B.1: Preliminary Granular Base Thickness based on Hydraulic Performance Simulations
Rainfall region
Sacramento (Sac) Riverside (LA) Eureka
Thickness of Granular Base +
PCC-O Subbase (mm)
Thickness of Granular Base +
PCC-O Subbase (mm)
Thickness of Granular Base +
PCC-O Subbase (mm)
Number of highway lanes2 Number of highway lanes2 Number of highway lanes2
Subgrade soil permeability
(cm/s)1
Storm design (years)
(Full storm duration)
2 3 4 5 2 3 4 5 2 3 4 5
1.00E-05 270 450 600 700 270 400 480 680 600 900 1270 1570
1.00E-04 130 180 250 420 130 150 320 400 350 650 850 1200
1.00E-03
2
130 130 130 130 130 130 130 130 130 130 130 150
1.00E-05 480 700 1050 1250 580 860 1180 1600 800 1270 1720 2150
1.00E-04 190 420 680 950 360 700 950 1350 500 850 1300 1770
1.00E-03
50
130 130 130 130 130 130 130 230 130 130 220 500
1.00E-05 600 800 1150 1430 680 1050 1300 1800 1150 1720 2300 2900
1.00E-04 210 500 750 1070 400 850 1200 1450 830 1300 1890 2500
1.00E-03
100
130 130 130 150 130 130 150 320 130 220 650 950 1 Note that draw down times will vary significantly and are dependent primarily on subgrade soil permeabilities, but also on other factors such as number of lanes drained, storm recurrence interval, etc as well. Draw down times could vary between one hour for subgrades with a permeability of 1.00E-03 to several months for subgrades with a permeability of 1.00E-05 and higher. Refer to Reference 4 for discussion on the calculation of drain down times. 2 The number of highway lanes must include the shoulder. Shoulder width is 10 ft. (3.0 m).

Laboratory Testing and Modeling for Structural Performance of Fully Permeable Pavements Final Report, November 2010
140

Laboratory Testing and Modeling for Structural Performance of Fully Permeable Pavements Final Report, November 2010
141
Appendix C: Preliminary Structural Design Tables for PCC-O Surfaces
Table C.1: Preliminary TI for PCC Fatigue Damage=1, Los Angeles County (PCC-O, k= 0.05 MPa/mm)
Slab Length (mm) 3000 3100 3200 3300 3400 3500 3600 3700 3800 3900 4000 4100 4200 4300 4400 4500
250 12.0 12.0 11.5 11.5 11.0 11.0 11.0 10.5 10.5 10.0 10.0 10.0 9.5 9.5 9.0 9.0 260 16.0 16.0 15.5 15.0 15.0 14.5 14.5 14.0 14.0 13.5 13.0 13.0 12.5 12.5 12.0 11.5 270 18.5 18.5 18.0 17.5 17.0 16.5 16.5 16.0 15.5 15.0 15.0 14.5 280 18.5 18.0 17.5 17.0 290 300 310 320 330 340 350 360 370 380 390 400 410 420 430 440 450 460 470 480 490
PC
C L
ayer
Th
ick
nes
s (m
m)
500 Note: Slab Width = 3.5 m

Laboratory Testing and Modeling for Structural Performance of Fully Permeable Pavements Final Report, November 2010
142
Table C.2: Preliminary TI for PCC Fatigue Damage=1, Los Angeles County (PCC-O, k= 0.08 MPa/mm)
Slab Length (mm) 3000 3100 3200 3300 3400 3500 3600 3700 3800 3900 4000 4100 4200 4300 4400 4500
250 13.5 13.5 13.0 13.0 13.0 13.0 12.5 12.5 12.5 12.5 12.0 12.0 12.0 12.0 11.5 11.5 260 17.5 17.5 17.0 17.0 16.5 16.5 16.0 16.0 15.5 15.5 15.0 15.0 14.5 14.5 14.0 14.0 270 18.5 18.0 18.0 17.5 17.0 17.0 16.5 280 290 300 310 320 330 340 350 360 370 380 390 400 410 420 430 440 450 460 470 480 490
PC
C L
ayer
Th
ick
nes
s (m
m)
500 Note: Slab Width = 3.5 m

Laboratory Testing and Modeling for Structural Performance of Fully Permeable Pavements Final Report, November 2010
143
Table C.3: Preliminary TI for PCC Fatigue Damage=1, Sacramento County (PCC-O, k= 0.05 MPa/mm)
Slab Length (mm) 3000 3100 3200 3300 3400 3500 3600 3700 3800 3900 4000 4100 4200 4300 4400 4500
250 10.0 9.5 9.5 9.0 9.0 8.5 8.5 8.0 8.0 7.5 7.5 7.0 7.0 6.5 6.5 6.0 260 14.0 13.5 13.0 13.0 12.5 12.0 11.5 11.0 11.0 10.5 10.0 9.5 9.5 9.0 8.5 8.0 270 18.0 17.5 17.0 16.5 16.0 15.5 15.0 14.5 14.0 13.5 13.0 12.5 12.0 11.0 10.5 10.0 280 18.0 17.5 17.0 16.0 15.5 15.0 14.0 13.5 13.0 12.5 290 18.5 17.5 16.5 16.0 15.0 14.5 300 18.5 17.5 16.5 310 18.5 320 330 340 350 360 370 380 390 400 410 420 430 440 450 460 470 480 490
PC
C L
ayer
Th
ick
nes
s (m
m)
500 Note: Slab Width = 3.5 m

Laboratory Testing and Modeling for Structural Performance of Fully Permeable Pavements Final Report, November 2010
144
Table C.4: Preliminary TI for PCC Fatigue Damage=1, Sacramento County (PCC-O, k= 0.08 MPa/mm)
Slab Length (mm) 3000 3100 3200 3300 3400 3500 3600 3700 3800 3900 4000 4100 4200 4300 4400 4500
250 11.0 11.0 10.5 10.5 10.0 10.0 10.0 9.5 9.5 9.0 9.0 9.0 8.5 8.5 8.0 8.0 260 15.0 14.5 14.0 14.0 13.5 13.5 13.0 12.5 12.5 12.0 11.5 11.5 11.0 10.5 10.5 10.0 270 18.5 18.0 17.5 17.0 16.5 16.0 15.5 15.0 14.5 14.5 14.0 13.5 13.0 12.5 12.0 280 18.5 18.0 17.5 17.0 16.5 15.5 15.0 14.5 14.0 290 18.0 17.5 16.5 16.0 300 18.0 310 320 330 340 350 360 370 380 390 400 410 420 430 440 450 460 470 480 490
PC
C L
ayer
Th
ick
nes
s (m
m)
500 Note: Slab Width = 3.5 m

Laboratory Testing and Modeling for Structural Performance of Fully Permeable Pavements Final Report, November 2010
145
Appendix D: Preliminary Structural Design Tables for Cast PCC Surfaces
Table D.1: Preliminary TI for PCC Fatigue Damage=1, Los Angeles County (Cast Slab, k= 0.05 MPa/mm)
Slab Length (mm) 3000 3100 3200 3300 3400 3500 3600 3700 3800 3900 4000 4100 4200 4300 4400 4500
250 0.0 0.0 0.0 0.0 0.0 0.0 0.0 0.0 0.0 0.0 0.0 0.0 0.0 0.0 0.0 0.0 260 0.0 0.0 0.0 0.0 0.0 0.0 0.0 0.0 0.0 0.0 0.0 0.0 0.0 0.0 0.0 0.0 270 0.5 0.5 0.5 0.5 0.5 0.5 0.0 0.0 0.0 0.0 0.0 0.0 0.0 0.0 0.0 0.0 280 0.5 0.5 0.5 0.5 0.5 0.5 0.5 0.5 0.5 0.0 0.0 0.0 0.0 0.0 0.0 0.0 290 1.0 0.5 0.5 0.5 0.5 0.5 0.5 0.5 0.5 0.5 0.5 0.0 0.0 0.0 0.0 0.0 300 1.0 1.0 1.0 1.0 0.5 0.5 0.5 0.5 0.5 0.5 0.5 0.5 0.0 0.0 0.0 0.0 310 1.0 1.0 1.0 1.0 1.0 1.0 0.5 0.5 0.5 0.5 0.5 0.5 0.0 0.0 0.0 0.0 320 1.5 1.5 1.0 1.0 1.0 1.0 1.0 0.5 0.5 0.5 0.5 0.5 0.5 0.0 0.0 0.0 330 1.5 1.5 1.5 1.5 1.0 1.0 1.0 1.0 0.5 0.5 0.5 0.5 0.5 0.0 0.0 0.0 340 2.0 1.5 1.5 1.5 1.5 1.0 1.0 1.0 1.0 0.5 0.5 0.5 0.5 0.0 0.0 0.0 350 2.0 2.0 1.5 1.5 1.5 1.5 1.0 1.0 1.0 1.0 0.5 0.5 0.5 0.5 0.0 0.0 360 4.0 4.0 3.5 3.5 3.0 3.0 2.5 2.5 2.0 2.0 1.5 1.5 1.5 1.0 1.0 0.5 370 6.0 5.5 5.5 5.0 4.5 4.5 4.0 4.0 3.5 3.0 3.0 2.5 2.0 2.0 1.5 1.0 380 8.0 7.5 7.0 7.0 6.5 6.0 5.5 5.0 4.5 4.5 4.0 3.5 3.0 2.5 2.0 2.0 390 10.0 9.5 9.0 8.5 8.0 7.5 7.0 6.5 6.0 5.5 5.0 4.5 4.0 3.5 3.0 2.5 400 12.0 11.5 11.0 10.0 9.5 9.0 8.5 8.0 7.0 6.5 6.0 5.5 5.0 4.0 3.5 3.0 410 14.0 13.5 12.5 12.0 11.0 10.5 10.0 9.0 8.5 8.0 7.0 6.5 5.5 5.0 4.5 3.5 420 16.0 15.0 14.5 13.5 13.0 12.0 11.5 10.5 9.5 9.0 8.0 7.5 6.5 6.0 5.0 4.0 430 18.0 17.0 16.0 15.5 14.5 13.5 12.5 12.0 11.0 10.0 9.0 8.5 7.5 6.5 5.5 5.0 440 18.0 17.0 16.0 15.0 14.0 13.0 12.0 11.0 10.5 9.5 8.5 7.5 6.5 5.5 450 17.5 16.5 15.5 14.5 13.5 12.5 11.5 10.5 9.0 8.0 7.0 6.0 460 18.0 17.0 16.0 14.5 13.5 12.5 11.0 10.0 9.0 8.0 6.5 470 18.5 17.0 16.0 14.5 13.5 12.0 11.0 9.5 8.5 7.0 480 18.5 17.0 16.0 14.5 13.0 12.0 10.5 9.0 8.0 490 18.5 17.0 15.5 14.0 12.5 11.5 10.0 8.5
PC
C L
ayer
Th
ick
nes
s (m
m)
500 18.0 16.5 15.0 13.5 12.0 10.5 9.0 Note: Slab Width = 3.5 m

Laboratory Testing and Modeling for Structural Performance of Fully Permeable Pavements Final Report, November 2010
146
Table D.2: Preliminary TI for PCC Fatigue Damage=1, Los Angeles County (Cast Slab, k= 0.08 MPa/mm)
Slab Length (mm) 3000 3100 3200 3300 3400 3500 3600 3700 3800 3900 4000 4100 4200 4300 4400 4500
250 0.0 0.0 0.0 0.0 0.0 0.0 0.0 0.0 0.0 0.0 0.0 0.0 0.0 0.0 0.0 0.0 260 0.0 0.0 0.0 0.0 0.0 0.0 0.0 0.0 0.0 0.0 0.0 0.0 0.0 0.0 0.0 0.0 270 0.0 0.0 0.0 0.0 0.0 0.0 0.0 0.0 0.0 0.0 0.0 0.0 0.0 0.0 0.0 0.0 280 0.5 0.5 0.5 0.0 0.0 0.0 0.0 0.0 0.0 0.0 0.0 0.0 0.0 0.0 0.0 0.0 290 0.5 0.5 0.5 0.5 0.5 0.5 0.0 0.0 0.0 0.0 0.0 0.0 0.0 0.0 0.0 0.0 300 0.5 0.5 0.5 0.5 0.5 0.5 0.5 0.5 0.0 0.0 0.0 0.0 0.0 0.0 0.0 0.0 310 0.5 0.5 0.5 0.5 0.5 0.5 0.5 0.5 0.5 0.0 0.0 0.0 0.0 0.0 0.0 0.0 320 0.5 0.5 0.5 0.5 0.5 0.5 0.5 0.5 0.5 0.5 0.0 0.0 0.0 0.0 0.0 0.0 330 1.0 0.5 0.5 0.5 0.5 0.5 0.5 0.5 0.5 0.5 0.5 0.0 0.0 0.0 0.0 0.0 340 1.0 1.0 1.0 0.5 0.5 0.5 0.5 0.5 0.5 0.5 0.5 0.0 0.0 0.0 0.0 0.0 350 1.0 1.0 1.0 1.0 0.5 0.5 0.5 0.5 0.5 0.5 0.5 0.5 0.0 0.0 0.0 0.0 360 3.0 3.0 3.0 2.5 2.5 2.0 2.0 2.0 1.5 1.5 1.5 1.0 1.0 1.0 0.5 0.5 370 5.5 5.0 4.5 4.5 4.0 4.0 3.5 3.0 3.0 2.5 2.5 2.0 1.5 1.5 1.0 1.0 380 7.5 7.0 6.5 6.0 5.5 5.5 5.0 4.5 4.0 3.5 3.5 3.0 2.5 2.0 1.5 1.0 390 9.5 9.0 8.5 8.0 7.5 7.0 6.5 6.0 5.5 5.0 4.0 3.5 3.0 2.5 2.0 1.5 400 11.5 11.0 10.5 9.5 9.0 8.5 8.0 7.0 6.5 6.0 5.0 4.5 4.0 3.5 2.5 2.0 410 14.0 13.0 12.5 11.5 11.0 10.0 9.0 8.5 7.5 7.0 6.0 5.5 4.5 4.0 3.0 2.5 420 16.0 15.0 14.0 13.5 12.5 11.5 10.5 10.0 9.0 8.0 7.0 6.5 5.5 4.5 3.5 3.0 430 18.0 17.0 16.0 15.0 14.0 13.0 12.0 11.0 10.0 9.0 8.0 7.0 6.0 5.0 4.0 3.0 440 18.0 17.0 16.0 14.5 13.5 12.5 11.5 10.0 9.0 8.0 7.0 6.0 4.5 3.5 450 18.5 17.5 16.0 15.0 14.0 12.5 11.5 10.0 9.0 7.5 6.5 5.0 4.0 460 18.0 16.5 15.0 14.0 12.5 11.0 10.0 8.5 7.0 5.5 4.5 470 18.0 16.5 15.0 13.5 12.0 10.5 9.0 7.5 6.5 5.0 480 18.0 16.0 14.5 13.0 11.5 10.0 8.5 7.0 5.0 490 17.5 15.5 14.0 12.5 10.5 9.0 7.5 5.5
PC
C L
ayer
Th
ick
nes
s (m
m)
500 18.5 17.0 15.0 13.0 11.5 9.5 8.0 6.0 Note: Slab Width = 3.5 m

Laboratory Testing and Modeling for Structural Performance of Fully Permeable Pavements Final Report, November 2010
147
Table D.3: Preliminary TI for PCC Fatigue Damage=1, Sacramento County (Cast Slab, k= 0.05 MPa/mm)
Slab Length (mm) 3000 3100 3200 3300 3400 3500 3600 3700 3800 3900 4000 4100 4200 4300 4400 4500
250 0.0 0.0 0.0 0.0 0.0 0.0 0.0 0.0 0.0 0.0 0.0 0.0 0.0 0.0 0.0 0.0 260 0.0 0.0 0.0 0.0 0.0 0.0 0.0 0.0 0.0 0.0 0.0 0.0 0.0 0.0 0.0 0.0 270 0.0 0.0 0.0 0.0 0.0 0.0 0.0 0.0 0.0 0.0 0.0 0.0 0.0 0.0 0.0 0.0 280 0.5 0.5 0.5 0.0 0.0 0.0 0.0 0.0 0.0 0.0 0.0 0.0 0.0 0.0 0.0 0.0 290 0.5 0.5 0.5 0.5 0.5 0.5 0.0 0.0 0.0 0.0 0.0 0.0 0.0 0.0 0.0 0.0 300 0.5 0.5 0.5 0.5 0.5 0.5 0.5 0.5 0.0 0.0 0.0 0.0 0.0 0.0 0.0 0.0 310 0.5 0.5 0.5 0.5 0.5 0.5 0.5 0.5 0.5 0.0 0.0 0.0 0.0 0.0 0.0 0.0 320 0.5 0.5 0.5 0.5 0.5 0.5 0.5 0.5 0.5 0.5 0.0 0.0 0.0 0.0 0.0 0.0 330 1.0 0.5 0.5 0.5 0.5 0.5 0.5 0.5 0.5 0.5 0.5 0.0 0.0 0.0 0.0 0.0 340 1.0 1.0 1.0 0.5 0.5 0.5 0.5 0.5 0.5 0.5 0.5 0.0 0.0 0.0 0.0 0.0 350 1.0 1.0 1.0 1.0 0.5 0.5 0.5 0.5 0.5 0.5 0.5 0.5 0.0 0.0 0.0 0.0 360 3.0 3.0 2.5 2.5 2.5 2.0 2.0 2.0 1.5 1.5 1.5 1.0 1.0 1.0 0.5 0.5 370 5.0 5.0 4.5 4.5 4.0 3.5 3.5 3.0 3.0 2.5 2.0 2.0 1.5 1.5 1.0 1.0 380 7.0 7.0 6.5 6.0 5.5 5.0 5.0 4.5 4.0 3.5 3.0 3.0 2.5 2.0 1.5 1.0 390 9.5 9.0 8.0 7.5 7.0 6.5 6.0 5.5 5.0 4.5 4.0 3.5 3.0 2.5 2.0 1.5 400 11.5 10.5 10.0 9.5 9.0 8.0 7.5 7.0 6.5 5.5 5.0 4.5 4.0 3.0 2.5 2.0 410 13.5 12.5 12.0 11.0 10.5 9.5 9.0 8.5 7.5 7.0 6.0 5.5 4.5 4.0 3.0 2.5 420 15.5 14.5 14.0 13.0 12.0 11.0 10.5 9.5 8.5 8.0 7.0 6.0 5.5 4.5 3.5 3.0 430 17.5 16.5 15.5 14.5 13.5 13.0 12.0 11.0 10.0 9.0 8.0 7.0 6.0 5.0 4.0 3.0 440 18.5 17.5 16.5 15.5 14.5 13.0 12.0 11.0 10.0 9.0 8.0 7.0 5.5 4.5 3.5 450 18.0 17.0 16.0 14.5 13.5 12.0 11.0 10.0 8.5 7.5 6.5 5.0 4.0 460 18.5 17.5 16.0 14.5 13.5 12.0 11.0 9.5 8.5 7.0 5.5 4.5 470 17.5 16.0 14.5 13.0 12.0 10.5 9.0 7.5 6.0 5.0 480 17.5 16.0 14.5 13.0 11.0 9.5 8.0 6.5 5.0 490 18.5 17.0 15.5 13.5 12.0 10.5 9.0 7.0 5.5
PC
C L
ayer
Th
ick
nes
s (m
m)
500 18.0 16.5 14.5 13.0 11.0 9.5 7.5 6.0 Note: Slab Width = 3.5 m

Laboratory Testing and Modeling for Structural Performance of Fully Permeable Pavements Final Report, November 2010
148
Table D.4: Preliminary TI for PCC Fatigue Damage=1, Sacramento County (Cast Slab, k= 0.08 MPa/mm)
Slab Length (mm) 3000 3100 3200 3300 3400 3500 3600 3700 3800 3900 4000 4100 4200 4300 4400 4500
250 0.0 0.0 0.0 0.0 0.0 0.0 0.0 0.0 0.0 0.0 0.0 0.0 0.0 0.0 0.0 0.0 260 0.0 0.0 0.0 0.0 0.0 0.0 0.0 0.0 0.0 0.0 0.0 0.0 0.0 0.0 0.0 0.0 270 0.0 0.0 0.0 0.0 0.0 0.0 0.0 0.0 0.0 0.0 0.0 0.0 0.0 0.0 0.0 0.0 280 0.5 0.5 0.5 0.0 0.0 0.0 0.0 0.0 0.0 0.0 0.0 0.0 0.0 0.0 0.0 0.0 290 0.5 0.5 0.5 0.5 0.5 0.5 0.0 0.0 0.0 0.0 0.0 0.0 0.0 0.0 0.0 0.0 300 0.5 0.5 0.5 0.5 0.5 0.5 0.5 0.5 0.0 0.0 0.0 0.0 0.0 0.0 0.0 0.0 310 0.5 0.5 0.5 0.5 0.5 0.5 0.5 0.5 0.5 0.0 0.0 0.0 0.0 0.0 0.0 0.0 320 0.5 0.5 0.5 0.5 0.5 0.5 0.5 0.5 0.5 0.5 0.0 0.0 0.0 0.0 0.0 0.0 330 1.0 0.5 0.5 0.5 0.5 0.5 0.5 0.5 0.5 0.5 0.5 0.0 0.0 0.0 0.0 0.0 340 1.0 1.0 1.0 0.5 0.5 0.5 0.5 0.5 0.5 0.5 0.5 0.0 0.0 0.0 0.0 0.0 350 1.0 1.0 1.0 1.0 0.5 0.5 0.5 0.5 0.5 0.5 0.5 0.5 0.0 0.0 0.0 0.0 360 3.0 3.0 2.5 2.5 2.0 2.0 2.0 1.5 1.5 1.5 1.0 1.0 0.5 0.5 0.5 0.0 370 5.0 4.5 4.5 4.0 3.5 3.5 3.0 3.0 2.5 2.0 2.0 1.5 1.5 1.0 0.5 0.5 380 7.0 6.5 6.0 5.5 5.0 4.5 4.5 4.0 3.5 3.0 2.5 2.5 2.0 1.5 1.0 0.5 390 8.5 8.0 7.5 7.0 6.5 6.0 5.5 5.0 4.5 4.0 3.5 3.0 2.5 2.0 1.5 1.0 400 10.5 10.0 9.5 8.5 8.0 7.5 7.0 6.0 5.5 5.0 4.0 3.5 3.0 2.5 1.5 1.0 410 12.5 12.0 11.0 10.5 9.5 9.0 8.0 7.5 6.5 6.0 5.0 4.0 3.5 2.5 2.0 1.0 420 14.5 13.5 13.0 12.0 11.0 10.0 9.5 8.5 7.5 6.5 6.0 5.0 4.0 3.0 2.5 1.5 430 16.5 15.5 14.5 13.5 12.5 11.5 10.5 9.5 8.5 7.5 6.5 5.5 4.5 3.5 2.5 1.5 440 18.5 17.5 16.0 15.0 14.0 13.0 12.0 10.5 9.5 8.5 7.5 6.0 5.0 4.0 3.0 2.0 450 18.0 16.5 15.5 14.0 13.0 12.0 10.5 9.5 8.0 7.0 5.5 4.5 3.0 2.0 460 18.5 17.0 15.5 14.0 13.0 11.5 10.0 9.0 7.5 6.0 5.0 3.5 2.0 470 18.5 17.0 15.5 14.0 12.5 11.0 9.5 8.0 7.0 5.5 4.0 2.5 480 18.5 16.5 15.0 13.5 12.0 10.5 9.0 7.5 5.5 4.0 2.5 490 18.0 16.5 14.5 13.0 11.0 9.5 8.0 6.0 4.5 3.0
PC
C L
ayer
Th
ick
nes
s (m
m)
500 17.5 15.5 14.0 12.0 10.0 8.5 6.5 5.0 3.0 Note: Slab Width = 3.5 m

Laboratory Testing and Modeling for Structural Performance of Fully Permeable Pavements Final Report, November 2010
149
Appendix E: Preliminary Structural Design Tables for RHMA-O Surfaces with no Subbase
Table E.1: Preliminary TI for HMA-O Fatigue Damage=1, Los Angeles County (RHMA-O, no Subbase, E_GB= 60 MPa, Speed= 7 km/h)
Granular Base (GB) Layer Thickness (mm)
500 550 600 650 700 750 800 850 900 950 1000 1050 1100 1150 1200 1250 1300 1350 1400 1450 1500
200 8.0 8.0 8.0 8.0 8.0 8.0 8.0 8.0 8.0 8.0 8.0 8.0 8.0 8.0 8.0 8.0 8.0 8.0 8.0 8.0 8.0 215 8.5 8.5 8.5 8.5 8.5 8.5 8.5 8.5 8.5 8.5 8.5 8.5 8.5 8.5 8.5 8.5 8.5 8.5 8.5 8.5 8.5 230 9.0 9.0 9.0 9.0 9.0 9.0 9.0 9.0 9.0 9.0 9.0 9.0 9.0 9.0 9.0 9.0 9.0 9.0 9.0 9.0 9.0 245 9.5 9.5 9.5 9.5 9.5 9.5 9.5 9.5 9.5 9.5 9.5 9.5 9.5 9.5 9.5 9.5 9.5 9.5 9.5 9.5 9.5 260 10.0 10.0 10.0 10.0 10.0 10.0 10.0 10.0 10.0 10.0 10.0 10.0 10.0 10.0 10.0 10.0 10.0 10.0 10.0 10.0 10.0 275 10.5 10.5 10.5 10.0 10.5 10.5 10.5 10.0 10.5 10.5 10.5 10.5 10.5 10.0 10.5 10.5 10.5 10.0 10.5 10.5 10.5 290 10.5 10.5 10.5 10.5 10.5 10.5 10.5 10.5 10.5 10.5 10.5 10.5 10.5 10.5 10.5 10.5 10.5 10.5 10.5 10.5 10.5 305 11.0 11.0 11.0 11.0 11.0 11.0 11.0 11.0 11.0 11.0 11.0 11.0 11.0 11.0 11.0 11.0 11.0 11.0 11.0 11.0 11.0 320 12.0 12.0 12.0 12.0 12.0 12.0 12.0 12.0 12.0 12.0 12.0 12.0 12.0 12.0 12.0 12.0 12.0 12.0 12.0 12.0 12.0 335 12.5 12.5 12.5 12.5 12.5 12.5 12.5 12.5 12.5 12.5 12.5 12.5 12.5 12.5 12.5 12.5 12.5 12.5 12.5 12.5 12.5 350 13.0 13.0 13.0 13.0 13.0 13.0 13.0 13.0 13.0 13.0 13.0 13.0 13.0 13.0 13.0 13.0 13.0 13.0 13.0 13.0 13.0 365 13.5 13.5 13.5 13.5 13.5 13.5 13.5 13.5 13.5 13.5 13.5 13.5 13.5 13.5 13.5 13.5 13.5 13.5 13.5 13.5 13.5 380 14.0 14.0 14.0 14.0 14.0 14.0 14.0 14.0 14.0 14.0 14.0 14.0 14.0 14.0 14.0 14.0 14.0 14.0 14.0 14.0 14.0 395 15.0 15.0 15.0 15.0 15.0 15.0 15.0 15.0 15.0 15.0 15.0 15.0 15.0 15.0 15.0 15.0 15.0 15.0 15.0 15.0 15.0 410 15.5 15.5 15.5 15.5 15.5 15.5 15.5 15.5 15.5 15.5 15.5 15.5 15.5 15.5 15.5 15.5 15.5 15.5 15.5 15.5 15.5 425 16.0 16.0 16.0 16.0 16.0 16.0 16.0 16.0 16.0 16.0 16.0 16.0 16.0 16.0 16.5 16.5 16.5 16.5 16.5 16.5 17.0 440 16.5 16.5 16.5 16.5 16.5 16.5 16.5 16.5 16.5 16.5 16.5 16.5 17.0 17.0 17.0 17.0 17.5 17.5 17.5 17.5 18.0 455 17.0 17.0 17.0 17.0 17.0 17.0 17.0 17.0 17.0 17.0 17.0 17.5 17.5 17.5 18.0 18.0 18.0 18.5 18.5 18.5 470 18.0 18.0 18.0 18.0 18.0 18.0 18.0 18.0 18.0 18.0 18.0 18.0 18.0 18.5 18.5 485 18.5 18.5 18.5 18.5 18.5 18.5 18.5 18.5 18.5 18.5 18.5 18.5
HM
A L
ayer
Th
ick
nes
s (m
m)
500

Laboratory Testing and Modeling for Structural Performance of Fully Permeable Pavements Final Report, November 2010
150
Table E.2: Preliminary Stress-to-Strength Ratio at Top of Subgrade, Los Angeles County (RHMA-O, no Subbase, E_GB= 60 MPa, Speed = 7 km/h)
Granular Base (GB) Layer Thickness (mm)
500 550 600 650 700 750 800 850 900 950 1000 1050 1100 1150 1200 1250 1300 1350 1400 1450 1500
200 Y Y Y Y G G G G G G G G G G G G G G G G G 215 Y Y Y G G G G G G G G G G G G G G G G G G 230 Y Y Y G G G G G G G G G G G G G G G G G G 245 Y Y G G G G G G G G G G G G G G G G G G G 260 Y G G G G G G G G G G G G G G G G G G G G 275 G G G G G G G G G G G G G G G G G G G G G 290 G G G G G G G G G G G G G G G G G G G G G 305 G G G G G G G G G G G G G G G G G G G G G 320 G G G G G G G G G G G G G G G G G G G G G 335 G G G G G G G G G G G G G G G G G G G G G 350 G G G G G G G G G G G G G G G G G G G G G 365 G G G G G G G G G G G G G G G G G G G G G 380 G G G G G G G G G G G G G G G G G G G G G 395 G G G G G G G G G G G G G G G G G G G G G 410 G G G G G G G G G G G G G G G G G G G G G 425 G G G G G G G G G G G G G G G G G G G G G 440 G G G G G G G G G G G G G G G G G G G G G 455 G G G G G G G G G G G G G G G G G G G G G 470 G G G G G G G G G G G G G G G G G G G G G 485 G G G G G G G G G G G G G G G G G G G G G
HM
A L
ayer
Th
ick
nes
s (m
m)
500 G G G G G G G G G G G G G G G G G G G G G Note: G--Stress-to-Strength Ratio <0.3; Y--0.3=<Stress-to-Strength Ratio <=0.7; R--Stress-to-Strength Ratio >0.7

Laboratory Testing and Modeling for Structural Performance of Fully Permeable Pavements Final Report, November 2010
151
Table E.3: Preliminary TI for HMA-O Fatigue Damage=1, Los Angeles County (RHMA-O, no Subbase, E_GB= 60 MPa, Speed = 40 km/h)
Granular Base (GB) Layer Thickness (mm)
500 550 600 650 700 750 800 850 900 950 1000 1050 1100 1150 1200 1250 1300 1350 1400 1450 1500
200 9.0 9.0 9.0 9.0 9.0 9.0 9.0 9.0 9.0 9.0 9.0 9.0 9.0 9.0 9.0 9.0 9.0 9.0 9.0 9.0 9.0 215 9.5 9.5 9.5 9.5 9.5 9.5 9.5 9.5 9.5 9.5 9.5 9.5 9.5 9.5 9.5 9.5 9.5 9.5 9.5 9.5 9.5 230 10.0 10.0 10.0 10.0 10.0 10.0 10.0 10.0 10.0 10.0 10.0 10.0 10.0 10.0 10.0 10.0 10.0 10.0 10.0 10.0 10.0 245 11.0 11.0 11.0 11.0 11.0 11.0 11.0 11.0 11.0 11.0 11.0 11.0 11.0 11.0 11.0 11.0 11.0 11.0 11.0 11.0 11.0 260 11.5 11.5 11.5 11.5 11.5 11.5 11.5 11.5 11.5 11.5 11.5 11.5 11.5 11.5 11.5 11.5 11.5 11.5 11.5 11.5 11.5 275 12.0 12.0 12.0 12.0 12.0 12.0 12.0 12.0 12.0 12.0 12.0 12.0 12.0 12.0 12.0 12.0 12.0 12.0 12.0 12.0 12.0 290 12.5 12.5 12.5 12.5 12.5 12.5 12.5 12.5 12.5 12.5 12.5 12.5 12.5 12.5 12.5 12.5 12.5 12.5 12.5 12.5 12.5 305 13.5 13.5 13.5 13.0 13.5 13.5 13.5 13.0 13.5 13.5 13.5 13.5 13.5 13.0 13.5 13.5 13.5 13.0 13.5 13.5 13.5 320 14.0 14.0 14.0 14.0 14.0 14.0 14.0 14.0 14.0 14.0 14.0 14.0 14.0 14.0 14.0 14.0 14.0 14.0 14.0 14.0 14.0 335 15.0 15.0 14.5 14.5 15.0 15.0 15.0 14.5 14.5 15.0 15.0 15.0 14.5 14.5 15.0 15.0 15.0 14.5 14.5 15.0 15.0 350 15.5 15.5 15.5 15.5 15.5 15.5 15.5 15.5 15.5 15.5 15.5 15.5 15.5 15.5 15.5 15.5 15.5 15.5 15.5 15.5 15.5 365 16.5 16.5 16.5 16.5 16.5 16.5 16.5 16.5 16.5 16.5 16.5 16.5 16.5 16.5 16.5 16.5 16.5 16.5 16.5 16.5 16.5 380 17.0 17.0 17.0 17.0 17.0 17.0 17.0 17.0 17.0 17.0 17.0 17.0 17.0 17.0 17.0 17.0 17.0 17.0 17.0 17.0 17.0 395 17.5 18.0 18.0 18.0 18.0 17.5 18.0 18.0 18.0 18.0 17.5 18.0 18.0 18.0 18.0 17.5 18.0 18.0 18.0 18.0 17.5 410 18.5 18.5 18.5 18.5 18.5 18.5 18.5 18.5 18.5 18.5 18.5 18.5 18.5 18.5 18.5 18.5 18.5 18.5 18.5 425 440 455 470 485
HM
A L
ayer
Th
ick
nes
s (m
m)
500

Laboratory Testing and Modeling for Structural Performance of Fully Permeable Pavements Final Report, November 2010
152
Table E.4: Preliminary Stress-to-Strength Ratio at Top of Subgrade, Los Angeles County (RHMA-O, no Subbase, E_GB= 60 MPa, Speed = 40 km/h)
Granular Base (GB) Layer Thickness (mm)
500 550 600 650 700 750 800 850 900 950 1000 1050 1100 1150 1200 1250 1300 1350 1400 1450 1500
200 Y Y Y G G G G G G G G G G G G G G G G G G 215 Y Y G G G G G G G G G G G G G G G G G G G 230 Y G G G G G G G G G G G G G G G G G G G G 245 G G G G G G G G G G G G G G G G G G G G G 260 G G G G G G G G G G G G G G G G G G G G G 275 G G G G G G G G G G G G G G G G G G G G G 290 G G G G G G G G G G G G G G G G G G G G G 305 G G G G G G G G G G G G G G G G G G G G G 320 G G G G G G G G G G G G G G G G G G G G G 335 G G G G G G G G G G G G G G G G G G G G G 350 G G G G G G G G G G G G G G G G G G G G G 365 G G G G G G G G G G G G G G G G G G G G G 380 G G G G G G G G G G G G G G G G G G G G G 395 G G G G G G G G G G G G G G G G G G G G G 410 G G G G G G G G G G G G G G G G G G G G G 425 G G G G G G G G G G G G G G G G G G G G G 440 G G G G G G G G G G G G G G G G G G G G G 455 G G G G G G G G G G G G G G G G G G G G G 470 G G G G G G G G G G G G G G G G G G G G G 485 G G G G G G G G G G G G G G G G G G G G G
HM
A L
ayer
Th
ick
nes
s (m
m)
500 G G G G G G G G G G G G G G G G G G G G G Note: G--Stress-to-Strength Ratio <0.3; Y--0.3=<Stress-to-Strength Ratio <=0.7; R--Stress-to-Strength Ratio >0.7

Laboratory Testing and Modeling for Structural Performance of Fully Permeable Pavements Final Report, November 2010
153
Table E.5: Preliminary TI for HMA-O Fatigue Damage=1, Sacramento County (RHMA-O, no Subbase, E_GB = 60 MPa, Speed = 7 km/h)
Granular Base (GB) Layer Thickness (mm)
500 550 600 650 700 750 800 850 900 950 1000 1050 1100 1150 1200 1250 1300 1350 1400 1450 1500
200 7.0 7.0 7.0 7.0 7.0 7.0 7.0 7.0 7.0 7.0 7.0 7.0 7.0 7.0 7.0 7.0 7.0 7.0 7.0 7.0 7.0 215 7.5 7.5 7.5 7.5 7.5 7.5 7.5 7.5 7.5 7.5 7.5 7.5 7.5 7.5 7.5 7.5 7.5 7.5 7.5 7.5 7.5 230 8.0 8.0 8.0 8.0 8.0 8.0 8.0 8.0 8.0 8.0 8.0 8.0 8.0 8.0 8.0 8.0 8.0 8.0 8.0 8.0 8.0 245 8.5 8.5 8.5 8.5 8.5 8.5 8.5 8.5 8.5 8.5 8.5 8.5 8.5 8.5 8.5 8.5 8.5 8.5 8.5 8.5 8.5 260 9.0 9.0 9.0 9.0 9.0 9.0 9.0 9.0 9.0 9.0 9.0 9.0 9.0 9.0 9.0 9.0 9.0 9.0 9.0 9.0 9.0 275 9.5 9.5 9.5 9.0 9.5 9.5 9.5 9.0 9.5 9.5 9.5 9.5 9.5 9.0 9.5 9.5 9.5 9.0 9.5 9.5 9.5 290 9.5 9.5 9.5 9.5 9.5 9.5 9.5 9.5 9.5 9.5 9.5 9.5 9.5 9.5 9.5 9.5 9.5 9.5 9.5 9.5 9.5 305 10.0 10.0 10.0 10.0 10.0 10.0 10.0 10.0 10.0 10.0 10.0 10.0 10.0 10.0 10.0 10.0 10.0 10.0 10.0 10.0 10.0 320 10.5 10.5 10.5 10.5 10.5 10.5 10.5 10.5 10.5 10.5 10.5 10.5 10.5 10.5 10.5 10.5 10.5 10.5 10.5 10.5 10.5 335 11.0 11.0 11.0 11.0 11.0 11.0 11.0 11.0 11.0 11.0 11.0 11.0 11.0 11.0 11.0 11.0 11.0 11.0 11.0 11.0 11.0 350 11.5 11.5 11.5 11.5 11.5 11.5 11.5 11.5 11.5 11.5 11.5 11.5 11.5 11.5 11.5 11.5 11.5 11.5 11.5 11.5 11.5 365 12.0 12.0 12.0 12.0 12.0 12.0 12.0 12.0 12.0 12.0 12.0 12.0 12.0 12.0 12.0 12.0 12.0 12.0 12.0 12.0 12.0 380 12.5 12.5 12.5 12.5 12.5 12.5 12.5 12.5 12.5 12.5 12.5 12.5 12.5 12.5 12.5 12.5 12.5 12.5 12.5 12.5 12.5 395 13.0 13.0 13.0 13.0 13.0 13.0 13.0 13.0 13.0 13.0 13.0 13.0 13.0 13.0 13.0 13.0 13.0 13.0 13.0 13.0 13.0 410 13.5 13.5 13.5 13.5 13.5 13.5 13.5 13.5 13.5 13.5 13.5 13.5 13.5 13.5 13.5 13.5 13.5 13.5 13.5 13.5 13.5 425 14.0 14.0 14.0 13.5 14.0 14.0 14.0 13.5 14.0 14.0 14.0 14.0 14.0 14.0 14.0 14.0 14.0 14.5 14.5 14.5 14.5 440 14.0 14.0 14.0 14.0 14.0 14.0 14.0 14.0 14.0 14.0 14.0 14.5 14.5 14.5 14.5 15.0 15.0 15.0 15.0 15.5 15.5 455 14.5 14.5 14.5 14.5 14.5 14.5 14.5 14.5 14.5 14.5 14.5 15.0 15.0 15.0 15.5 15.5 15.5 16.0 16.0 16.0 16.5 470 15.0 15.0 15.0 15.0 15.0 15.0 15.0 15.0 15.0 15.0 15.0 15.5 15.5 15.5 16.0 16.0 16.5 16.5 17.0 17.0 17.0 485 15.5 15.5 15.5 15.5 15.5 15.5 15.5 15.5 15.5 15.5 15.5 16.0 16.0 16.5 16.5 17.0 17.0 17.5 17.5 18.0 18.0
HM
A L
ayer
Th
ick
nes
s (m
m)
500 16.0 16.0 16.0 16.0 16.0 16.0 16.0 16.0 16.0 16.0 16.0 16.5 16.5 17.0 17.0 17.5 18.0 18.0 18.5 18.5

Laboratory Testing and Modeling for Structural Performance of Fully Permeable Pavements Final Report, November 2010
154
Table E.6: Preliminary Stress-to-Strength Ratio at Top of Subgrade for AC Structure, Sacramento County (RHMA-O, no Subbase, E_GB = 60 MPa, Speed = 7 km/h)
Granular Base (GB) Layer Thickness (mm)
500 550 600 650 700 750 800 850 900 950 1000 1050 1100 1150 1200 1250 1300 1350 1400 1450 1500
200 Y Y Y Y Y G G G G G G G G G G G G G G G G 215 Y Y Y Y G G G G G G G G G G G G G G G G G 230 Y Y Y Y G G G G G G G G G G G G G G G G G 245 Y Y Y G G G G G G G G G G G G G G G G G G 260 Y Y Y G G G G G G G G G G G G G G G G G G 275 Y Y G G G G G G G G G G G G G G G G G G G 290 Y G G G G G G G G G G G G G G G G G G G G 305 G G G G G G G G G G G G G G G G G G G G G 320 G G G G G G G G G G G G G G G G G G G G G 335 G G G G G G G G G G G G G G G G G G G G G 350 G G G G G G G G G G G G G G G G G G G G G 365 G G G G G G G G G G G G G G G G G G G G G 380 G G G G G G G G G G G G G G G G G G G G G 395 G G G G G G G G G G G G G G G G G G G G G 410 G G G G G G G G G G G G G G G G G G G G G 425 G G G G G G G G G G G G G G G G G G G G G 440 G G G G G G G G G G G G G G G G G G G G G 455 G G G G G G G G G G G G G G G G G G G G G 470 G G G G G G G G G G G G G G G G G G G G G 485 G G G G G G G G G G G G G G G G G G G G G
HM
A L
ayer
Th
ick
nes
s (m
m)
500 G G G G G G G G G G G G G G G G G G G G G Note: G--Stress-to-Strength Ratio <0.3; Y--0.3=<Stress-to-Strength Ratio <=0.7; R--Stress-to-Strength Ratio >0.7

Laboratory Testing and Modeling for Structural Performance of Fully Permeable Pavements Final Report, November 2010
155
Table E.7: Preliminary TI for HMA-O Fatigue Damage=1, Sacramento County (RHMA-O, no Subbase, E_GB = 60 MPa, Speed = 40 km/h)
Granular Base (GB) Layer Thickness (mm)
500 550 600 650 700 750 800 850 900 950 1000 1050 1100 1150 1200 1250 1300 1350 1400 1450 1500
200 8.0 8.0 8.0 8.0 8.0 8.0 8.0 8.0 8.0 8.0 8.0 8.0 8.0 8.0 8.0 8.0 8.0 8.0 8.0 8.0 8.0 215 8.5 8.5 8.5 8.5 8.5 8.5 8.5 8.5 8.5 8.5 8.5 8.5 8.5 8.5 8.5 8.5 8.5 8.5 8.5 8.5 8.5 230 9.0 9.0 9.0 9.0 9.0 9.0 9.0 9.0 9.0 9.0 9.0 9.0 9.0 9.0 9.0 9.0 9.0 9.0 9.0 9.0 9.0 245 10.0 10.0 10.0 10.0 10.0 10.0 10.0 10.0 10.0 10.0 10.0 10.0 9.5 9.5 9.5 9.5 9.5 9.5 9.5 9.5 9.5 260 10.5 10.5 10.5 10.5 10.5 10.5 10.5 10.5 10.5 10.5 10.5 10.5 10.5 10.0 10.0 10.0 10.0 10.0 10.0 10.0 10.0 275 11.0 11.0 11.0 11.0 11.0 11.0 11.0 11.0 11.0 11.0 11.0 11.0 11.0 11.0 10.5 10.5 10.5 10.5 10.5 10.5 10.5 290 11.5 11.5 11.5 11.5 11.5 11.5 11.5 11.5 11.5 11.5 11.5 11.5 11.5 11.5 11.0 11.0 11.0 11.0 11.0 11.0 10.5 305 12.0 12.0 12.0 12.0 12.0 12.0 12.0 12.0 12.0 12.0 12.0 12.0 12.0 12.0 12.0 11.5 11.5 11.5 11.5 11.5 11.0 320 12.5 12.5 12.5 12.5 12.5 12.5 12.5 12.5 12.5 12.5 12.5 12.5 12.5 12.5 12.5 12.0 12.0 12.0 12.0 12.0 12.0 335 13.0 13.0 13.0 13.0 13.0 13.0 13.0 13.0 13.0 13.0 13.0 13.0 13.0 13.0 13.0 12.5 12.5 12.5 12.5 12.5 12.5 350 13.5 13.5 13.5 13.5 13.5 13.5 13.5 13.5 13.5 13.5 13.5 13.5 13.5 13.5 13.5 13.5 13.0 13.0 13.0 13.0 13.0 365 14.0 14.0 14.0 14.0 14.0 14.0 14.0 14.0 14.0 14.0 14.0 14.0 14.0 14.0 14.0 14.0 13.5 13.5 13.5 13.5 13.5 380 14.5 14.5 14.5 14.5 14.5 14.5 14.5 14.5 14.5 14.5 14.5 14.5 14.5 14.5 14.5 14.5 14.5 14.5 14.0 14.0 14.0 395 15.0 15.0 15.0 15.0 15.0 15.0 15.0 15.0 15.0 15.0 15.0 15.0 15.0 15.0 15.0 15.0 15.0 15.0 15.0 15.0 15.0 410 15.5 15.5 15.5 15.5 15.5 15.5 15.5 15.5 15.5 15.5 15.5 15.5 15.5 15.5 15.5 15.5 15.5 15.5 15.5 15.5 15.5 425 16.0 16.0 16.0 16.0 16.0 16.0 16.0 16.0 16.0 16.0 16.0 16.0 16.0 16.0 16.5 16.5 16.5 16.5 16.5 16.5 17.0 440 16.5 16.5 16.5 16.5 16.5 16.5 16.5 16.5 16.5 16.5 16.5 16.5 17.0 17.0 17.0 17.0 17.5 17.5 17.5 17.5 18.0 455 17.0 17.0 17.0 17.0 17.0 17.0 17.0 17.0 17.0 17.0 17.0 17.5 17.5 17.5 18.0 18.0 18.0 18.5 18.5 18.5 470 18.0 18.0 18.0 18.0 18.0 18.0 18.0 18.0 18.0 18.0 18.0 18.0 18.0 18.5 18.5 485 18.5 18.5 18.5 18.5 18.5 18.5 18.5 18.5 18.5 18.5 18.5 18.5
HM
A L
ayer
Th
ick
nes
s (m
m)
500

Laboratory Testing and Modeling for Structural Performance of Fully Permeable Pavements Final Report, November 2010
156
Table E.8: Preliminary Stress-to-Strength Ratio at Top of Subgrade for AC Structure, Sacramento County (RHMA-O, no Subbase, E_GB = 60 MPa, Speed = 40 km/h)
Granular Base (GB) Layer Thickness (mm)
500 550 600 650 700 750 800 850 900 950 1000 1050 1100 1150 1200 1250 1300 1350 1400 1450 1500
200 Y Y Y Y G G G G G G G G G G G G G G G G G 215 Y Y Y G G G G G G G G G G G G G G G G G G 230 Y Y Y G G G G G G G G G G G G G G G G G G 245 Y Y G G G G G G G G G G G G G G G G G G G 260 Y G G G G G G G G G G G G G G G G G G G G 275 G G G G G G G G G G G G G G G G G G G G G 290 G G G G G G G G G G G G G G G G G G G G G 305 G G G G G G G G G G G G G G G G G G G G G 320 G G G G G G G G G G G G G G G G G G G G G 335 G G G G G G G G G G G G G G G G G G G G G 350 G G G G G G G G G G G G G G G G G G G G G 365 G G G G G G G G G G G G G G G G G G G G G 380 G G G G G G G G G G G G G G G G G G G G G 395 G G G G G G G G G G G G G G G G G G G G G 410 G G G G G G G G G G G G G G G G G G G G G 425 G G G G G G G G G G G G G G G G G G G G G 440 G G G G G G G G G G G G G G G G G G G G G 455 G G G G G G G G G G G G G G G G G G G G G 470 G G G G G G G G G G G G G G G G G G G G G 485 G G G G G G G G G G G G G G G G G G G G G
HM
A L
ayer
Th
ick
nes
s (m
m)
500 G G G G G G G G G G G G G G G G G G G G G Note: G--Stress-to-Strength Ratio <0.3; Y--0.3=<Stress-to-Strength Ratio <=0.7; R--Stress-to-Strength Ratio >0.7

Laboratory Testing and Modeling for Structural Performance of Fully Permeable Pavements Final Report, November 2010
157
Appendix F: Preliminary Structural Design Tables for RHMA-O Surfaces with Subbase
Table F.1: Preliminary TI for HMA-O Fatigue Damage=1, Los Angeles County (RHMA-O, with Subbase, E_GB= 60 MPa, Speed= 7 km/h)
Granular Base (GB) Layer Thickness (mm)
500 550 600 650 700 750 800 850 900 950 1000 1050 1100 1150 1200 1250 1300 1350 1400 1450 1500
200 8.0 8.0 8.0 8.0 8.0 8.0 8.0 8.0 8.0 8.0 8.0 8.0 8.0 8.0 8.0 8.0 8.0 8.0 8.0 8.0 8.0 215 9.0 9.0 9.0 9.0 9.0 9.0 9.0 9.0 9.0 9.0 9.0 9.0 9.0 9.0 9.0 9.0 9.0 9.0 9.0 9.0 9.0 230 9.5 9.5 9.5 9.5 9.5 9.5 9.5 9.5 9.5 9.5 9.5 9.5 9.5 9.5 9.5 9.5 9.5 9.5 9.5 9.5 9.5 245 10.5 10.5 10.5 10.5 10.5 10.5 10.5 10.5 10.5 10.5 10.5 10.5 10.5 10.5 10.5 10.5 10.5 10.5 10.5 10.5 10.5 260 11.0 11.0 11.0 11.0 11.0 11.0 11.0 11.0 11.0 11.0 11.0 11.0 11.0 11.0 11.0 11.0 11.0 11.0 11.0 11.0 11.0 275 12.0 12.0 12.0 11.5 12.0 12.0 12.0 11.5 12.0 12.0 12.0 12.0 12.0 11.5 12.0 12.0 12.0 11.5 12.0 12.0 12.0 290 12.5 12.5 12.5 12.5 12.5 12.5 12.5 12.5 12.5 12.5 12.5 12.5 12.5 12.5 12.5 12.5 12.5 12.5 12.5 12.5 12.5 305 13.5 13.0 13.0 13.0 13.0 13.0 13.0 13.0 13.0 13.0 13.0 13.0 13.0 13.0 13.0 13.0 13.0 13.0 13.0 13.0 13.0 320 14.0 14.0 14.0 14.0 14.0 14.0 14.0 14.0 14.0 14.0 14.0 14.0 14.0 14.0 14.0 14.0 14.0 14.0 14.0 14.0 14.0 335 15.0 14.5 14.5 14.5 14.5 14.5 14.5 14.5 14.5 14.5 14.5 14.5 14.5 14.5 14.5 14.5 14.5 14.5 14.5 14.5 14.5 350 15.5 15.5 15.5 15.5 15.5 15.5 15.0 15.0 15.0 15.0 15.0 15.0 15.0 15.0 15.0 15.0 15.0 15.0 15.0 15.0 15.0 365 16.5 16.0 16.0 16.0 16.0 16.0 16.0 16.0 15.5 15.5 15.5 15.5 15.5 15.5 15.5 15.5 15.5 15.5 15.5 15.5 15.5 380 17.0 17.0 17.0 17.0 16.5 16.5 16.5 16.5 16.5 16.5 16.0 16.0 16.0 16.0 16.0 16.0 16.0 16.0 16.0 16.0 16.0 395 17.5 17.5 17.5 17.5 17.5 17.5 17.0 17.0 17.0 17.0 17.0 17.0 17.0 17.0 17.0 17.0 17.0 17.0 17.0 17.0 17.0 410 18.5 18.5 18.5 18.0 18.0 18.0 18.0 18.0 17.5 17.5 17.5 17.5 17.5 17.5 17.5 17.5 17.5 17.5 17.5 17.5 17.5 425 18.5 18.5 18.5 18.5 18.5 18.5 18.5 18.5 18.5 18.5 18.5 18.5 18.5 18.5 18.5 440 455 470 485
HM
A L
ayer
Th
ick
nes
s (m
m)
500

Laboratory Testing and Modeling for Structural Performance of Fully Permeable Pavements Final Report, November 2010
158
Table E.2: Preliminary Stress-to-Strength Ratio at Top of Subgrade, Los Angeles County (RHMA-O, with Subbase, E_GB= 60 MPa, Speed = 7 km/h)
Granular Base (GB) Layer Thickness (mm)
500 550 600 650 700 750 800 850 900 950 1000 1050 1100 1150 1200 1250 1300 1350 1400 1450 1500
200 G G G G G G G G G G G G G G G G G G G G G 215 G G G G G G G G G G G G G G G G G G G G G 230 G G G G G G G G G G G G G G G G G G G G G 245 G G G G G G G G G G G G G G G G G G G G G 260 G G G G G G G G G G G G G G G G G G G G G 275 G G G G G G G G G G G G G G G G G G G G G 290 G G G G G G G G G G G G G G G G G G G G G 305 G G G G G G G G G G G G G G G G G G G G G 320 G G G G G G G G G G G G G G G G G G G G G 335 G G G G G G G G G G G G G G G G G G G G G 350 G G G G G G G G G G G G G G G G G G G G G 365 G G G G G G G G G G G G G G G G G G G G G 380 G G G G G G G G G G G G G G G G G G G G G 395 G G G G G G G G G G G G G G G G G G G G G 410 G G G G G G G G G G G G G G G G G G G G G 425 G G G G G G G G G G G G G G G G G G G G G 440 G G G G G G G G G G G G G G G G G G G G G 455 G G G G G G G G G G G G G G G G G G G G G 470 G G G G G G G G G G G G G G G G G G G G G 485 G G G G G G G G G G G G G G G G G G G G G
HM
A L
ayer
Th
ick
nes
s (m
m)
500 G G G G G G G G G G G G G G G G G G G G G Note: G--Stress-to-Strength Ratio <0.3; Y--0.3=<Stress-to-Strength Ratio <=0.7; R--Stress-to-Strength Ratio >0.7

Laboratory Testing and Modeling for Structural Performance of Fully Permeable Pavements Final Report, November 2010
159
Table F.3: Preliminary TI for HMA-O Fatigue Damage=1, Los Angeles County (RHMA-O, with Subbase, E_GB= 60 MPa, Speed = 40 km/h)
Granular Base (GB) Layer Thickness (mm)
500 550 600 650 700 750 800 850 900 950 1000 1050 1100 1150 1200 1250 1300 1350 1400 1450 1500
200 9.0 9.0 9.0 8.5 8.5 8.5 8.5 8.5 8.0 8.0 8.0 8.0 8.0 8.0 8.0 8.0 8.0 8.0 8.0 8.0 8.0 215 10.0 9.5 9.5 9.5 9.5 9.5 9.0 9.0 9.0 9.0 9.0 9.0 9.0 9.0 9.0 9.0 9.0 9.0 9.0 9.0 9.0 230 10.5 10.5 10.5 10.5 10.0 10.0 10.0 10.0 10.0 10.0 10.0 10.0 10.0 10.0 10.0 10.0 10.0 10.0 10.0 10.0 10.0 245 11.5 11.0 11.0 11.0 11.0 11.0 11.0 11.0 11.0 11.0 10.5 10.5 10.5 10.5 10.5 10.5 10.5 10.5 10.5 10.5 10.5 260 12.0 12.0 12.0 12.0 12.0 12.0 12.0 11.5 11.5 11.5 11.5 11.5 11.5 11.5 11.5 11.5 11.5 11.5 11.5 11.5 11.5 275 13.0 12.5 12.5 12.5 12.5 12.5 12.5 12.5 12.5 12.5 12.5 12.5 12.5 12.5 12.5 12.5 12.5 12.5 12.5 12.5 12.5 290 13.5 13.5 13.5 13.5 13.5 13.5 13.5 13.5 13.5 13.5 13.5 13.5 13.5 13.5 13.5 13.5 13.5 13.5 13.5 13.5 13.5 305 14.5 14.5 14.5 14.5 14.5 14.5 14.5 14.5 14.5 14.5 14.5 14.5 14.5 14.5 14.5 14.5 14.5 14.5 14.5 14.5 14.0 320 15.0 15.0 15.0 15.0 15.0 15.0 15.0 15.0 15.0 15.0 15.0 15.0 15.0 15.0 15.0 15.0 15.0 15.0 15.0 15.0 15.0 335 16.0 16.0 16.0 16.0 16.0 16.0 16.0 16.0 16.0 16.0 16.0 16.0 16.0 16.0 16.0 16.0 16.0 16.0 16.0 16.0 16.0 350 17.0 17.0 17.0 17.0 17.0 17.0 17.0 17.0 17.0 17.0 17.0 17.0 17.0 17.0 17.0 17.0 16.5 16.5 16.5 16.5 16.5 365 18.0 18.0 18.0 18.0 18.0 18.0 18.0 18.0 18.0 18.0 18.0 18.0 18.0 17.5 17.5 17.5 17.5 17.5 17.5 17.5 17.5 380 18.5 18.5 18.5 18.5 18.5 18.5 18.0 18.0 18.0 18.0 395 410 425 440 455 470 485
HM
A L
ayer
Th
ick
nes
s (m
m)
500
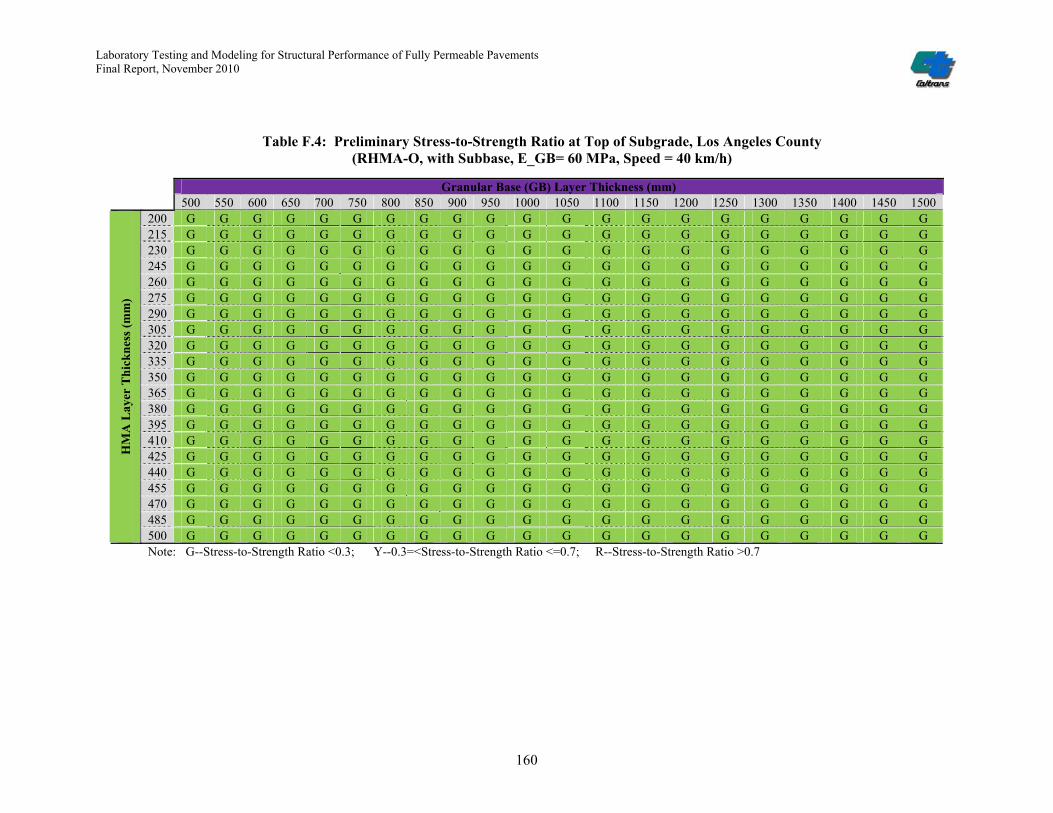
Laboratory Testing and Modeling for Structural Performance of Fully Permeable Pavements Final Report, November 2010
160
Table F.4: Preliminary Stress-to-Strength Ratio at Top of Subgrade, Los Angeles County (RHMA-O, with Subbase, E_GB= 60 MPa, Speed = 40 km/h)
Granular Base (GB) Layer Thickness (mm)
500 550 600 650 700 750 800 850 900 950 1000 1050 1100 1150 1200 1250 1300 1350 1400 1450 1500
200 G G G G G G G G G G G G G G G G G G G G G 215 G G G G G G G G G G G G G G G G G G G G G 230 G G G G G G G G G G G G G G G G G G G G G 245 G G G G G G G G G G G G G G G G G G G G G 260 G G G G G G G G G G G G G G G G G G G G G 275 G G G G G G G G G G G G G G G G G G G G G 290 G G G G G G G G G G G G G G G G G G G G G 305 G G G G G G G G G G G G G G G G G G G G G 320 G G G G G G G G G G G G G G G G G G G G G 335 G G G G G G G G G G G G G G G G G G G G G 350 G G G G G G G G G G G G G G G G G G G G G 365 G G G G G G G G G G G G G G G G G G G G G 380 G G G G G G G G G G G G G G G G G G G G G 395 G G G G G G G G G G G G G G G G G G G G G 410 G G G G G G G G G G G G G G G G G G G G G 425 G G G G G G G G G G G G G G G G G G G G G 440 G G G G G G G G G G G G G G G G G G G G G 455 G G G G G G G G G G G G G G G G G G G G G 470 G G G G G G G G G G G G G G G G G G G G G 485 G G G G G G G G G G G G G G G G G G G G G
HM
A L
ayer
Th
ick
nes
s (m
m)
500 G G G G G G G G G G G G G G G G G G G G G Note: G--Stress-to-Strength Ratio <0.3; Y--0.3=<Stress-to-Strength Ratio <=0.7; R--Stress-to-Strength Ratio >0.7

Laboratory Testing and Modeling for Structural Performance of Fully Permeable Pavements Final Report, November 2010
161
Table F.5: Preliminary TI for HMA-O Fatigue Damage=1, Sacramento County (RHMA-O, with Subbase, E_GB = 60 MPa, Speed = 7 km/h)
Granular Base (GB) Layer Thickness (mm)
500 550 600 650 700 750 800 850 900 950 1000 1050 1100 1150 1200 1250 1300 1350 1400 1450 1500
200 7.0 7.0 7.0 6.5 6.5 6.5 6.5 6.5 6.0 6.0 6.0 6.0 6.0 6.0 6.0 6.0 6.0 6.0 6.0 6.0 6.0 215 7.5 7.0 7.0 7.0 7.0 7.0 7.0 6.5 6.5 6.5 6.5 6.5 6.5 6.5 6.5 6.5 6.5 6.5 6.5 6.5 6.5 230 7.5 7.5 7.5 7.5 7.5 7.0 7.0 7.0 7.0 7.0 7.0 7.0 7.0 7.0 7.0 7.0 7.0 7.0 7.0 7.0 7.0 245 8.0 8.0 8.0 7.5 7.5 7.5 7.5 7.5 7.5 7.5 7.5 7.5 7.5 7.5 7.5 7.5 7.5 7.5 7.5 7.5 7.5 260 8.0 8.0 8.0 8.0 8.0 8.0 8.0 8.0 8.0 8.0 8.0 8.0 8.0 8.0 8.0 8.0 8.0 8.0 8.0 8.0 8.0 275 8.5 8.5 8.5 8.5 8.5 8.5 8.5 8.5 8.5 8.5 8.5 8.5 8.5 8.5 8.5 8.5 8.5 8.5 8.5 8.5 8.5 290 9.0 9.0 9.0 9.0 9.0 9.0 8.5 8.5 8.5 8.5 8.5 8.5 8.5 8.5 8.5 8.5 8.5 8.5 8.5 8.5 8.5 305 9.0 9.0 9.0 9.0 9.0 9.0 9.0 9.0 9.0 9.0 9.0 9.0 9.0 9.0 9.0 9.0 9.0 9.0 9.0 9.0 9.0 320 9.5 9.5 9.5 9.5 9.5 9.5 9.5 9.5 9.5 9.5 9.5 9.5 9.5 9.5 9.5 9.5 9.5 9.5 9.5 9.5 9.5 335 10.0 10.0 10.0 10.0 10.0 10.0 10.0 10.0 10.0 10.0 10.0 10.0 10.0 10.0 10.0 10.0 10.0 10.0 10.0 10.0 10.0 350 10.5 10.5 10.5 10.5 10.5 10.5 10.5 10.5 10.5 10.5 10.5 10.5 10.5 10.5 10.5 10.5 10.5 10.5 10.5 10.5 10.5 365 11.0 11.0 11.0 11.0 11.0 11.0 11.0 11.0 11.0 11.0 11.0 11.0 11.0 11.0 11.0 11.0 11.0 11.0 11.0 11.0 11.0 380 11.5 11.5 11.5 11.5 11.5 11.5 11.5 11.5 11.5 11.5 11.5 11.5 11.5 11.5 11.5 11.5 11.5 11.5 11.5 11.5 11.5 395 12.0 12.0 12.0 12.0 12.0 12.0 12.0 12.0 12.0 12.0 12.0 12.0 12.0 12.0 12.0 12.0 12.0 12.0 12.0 12.0 12.0 410 12.5 12.5 12.5 12.5 12.5 12.5 12.5 12.5 12.5 12.5 12.5 12.5 12.5 12.5 12.5 12.5 12.5 12.5 12.5 12.5 12.5 425 13.0 13.0 13.0 13.0 13.0 13.0 13.0 13.0 13.0 13.0 13.0 13.0 13.0 13.0 13.0 13.0 13.0 13.5 13.5 13.5 13.5 440 13.5 13.5 13.5 13.5 13.5 13.5 13.5 13.5 13.5 13.0 13.0 13.5 13.5 13.5 13.5 14.0 14.0 14.0 14.0 14.5 14.5 455 14.0 14.0 14.0 14.0 14.0 14.0 14.0 14.0 14.0 13.5 13.5 14.0 14.0 14.0 14.5 14.5 14.5 15.0 15.0 15.0 15.5 470 15.0 14.5 14.5 14.5 14.5 14.5 14.5 14.5 14.0 14.0 14.0 14.5 14.5 14.5 15.0 15.0 15.5 15.5 16.0 16.0 16.0 485 15.5 15.5 15.0 15.0 15.0 15.0 15.0 15.0 14.5 14.5 14.5 15.0 15.0 15.5 15.5 16.0 16.0 16.5 16.5 17.0 17.0
HM
A L
ayer
Th
ick
nes
s (m
m)
500 16.0 16.0 16.0 15.5 15.5 15.5 15.5 15.5 15.0 15.0 15.0 15.5 15.5 16.0 16.0 16.5 17.0 17.0 17.5 17.5 18.0

Laboratory Testing and Modeling for Structural Performance of Fully Permeable Pavements Final Report, November 2010
162
Table F.6: Preliminary Stress-to-Strength Ratio at Top of Subgrade, Sacramento County (RHMA-O, with Subbase, E_GB = 60 MPa, Speed = 7 km/h)
Granular Base (GB) Layer Thickness (mm)
500 550 600 650 700 750 800 850 900 950 1000 1050 1100 1150 1200 1250 1300 1350 1400 1450 1500
200 G G G G G G G G G G G G G G G G G G G G G 215 G G G G G G G G G G G G G G G G G G G G G 230 G G G G G G G G G G G G G G G G G G G G G 245 G G G G G G G G G G G G G G G G G G G G G 260 G G G G G G G G G G G G G G G G G G G G G 275 G G G G G G G G G G G G G G G G G G G G G 290 G G G G G G G G G G G G G G G G G G G G G 305 G G G G G G G G G G G G G G G G G G G G G 320 G G G G G G G G G G G G G G G G G G G G G 335 G G G G G G G G G G G G G G G G G G G G G 350 G G G G G G G G G G G G G G G G G G G G G 365 G G G G G G G G G G G G G G G G G G G G G 380 G G G G G G G G G G G G G G G G G G G G G 395 G G G G G G G G G G G G G G G G G G G G G 410 G G G G G G G G G G G G G G G G G G G G G 425 G G G G G G G G G G G G G G G G G G G G G 440 G G G G G G G G G G G G G G G G G G G G G 455 G G G G G G G G G G G G G G G G G G G G G 470 G G G G G G G G G G G G G G G G G G G G G 485 G G G G G G G G G G G G G G G G G G G G G
HM
A L
ayer
Th
ick
nes
s (m
m)
500 G G G G G G G G G G G G G G G G G G G G G Note: G--Stress-to-Strength Ratio <0.3; Y--0.3=<Stress-to-Strength Ratio <=0.7; R--Stress-to-Strength Ratio >0.7
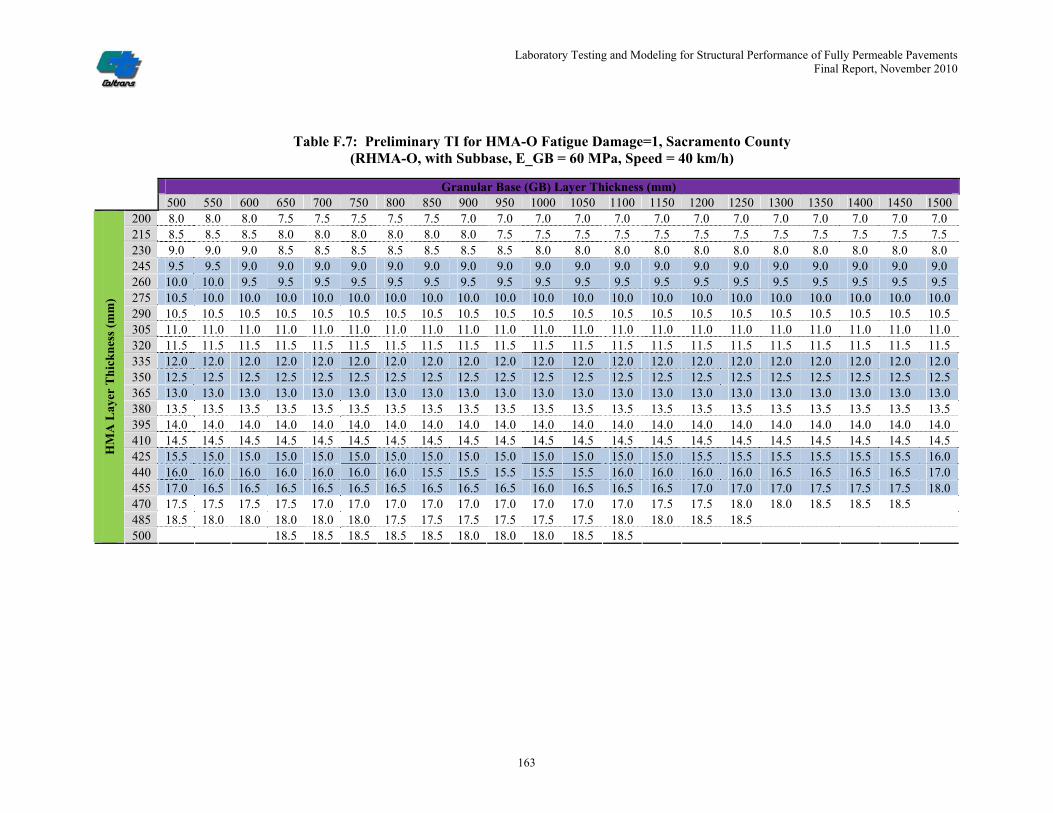
Laboratory Testing and Modeling for Structural Performance of Fully Permeable Pavements Final Report, November 2010
163
Table F.7: Preliminary TI for HMA-O Fatigue Damage=1, Sacramento County (RHMA-O, with Subbase, E_GB = 60 MPa, Speed = 40 km/h)
Granular Base (GB) Layer Thickness (mm)
500 550 600 650 700 750 800 850 900 950 1000 1050 1100 1150 1200 1250 1300 1350 1400 1450 1500
200 8.0 8.0 8.0 7.5 7.5 7.5 7.5 7.5 7.0 7.0 7.0 7.0 7.0 7.0 7.0 7.0 7.0 7.0 7.0 7.0 7.0 215 8.5 8.5 8.5 8.0 8.0 8.0 8.0 8.0 8.0 7.5 7.5 7.5 7.5 7.5 7.5 7.5 7.5 7.5 7.5 7.5 7.5 230 9.0 9.0 9.0 8.5 8.5 8.5 8.5 8.5 8.5 8.5 8.0 8.0 8.0 8.0 8.0 8.0 8.0 8.0 8.0 8.0 8.0 245 9.5 9.5 9.0 9.0 9.0 9.0 9.0 9.0 9.0 9.0 9.0 9.0 9.0 9.0 9.0 9.0 9.0 9.0 9.0 9.0 9.0 260 10.0 10.0 9.5 9.5 9.5 9.5 9.5 9.5 9.5 9.5 9.5 9.5 9.5 9.5 9.5 9.5 9.5 9.5 9.5 9.5 9.5 275 10.5 10.0 10.0 10.0 10.0 10.0 10.0 10.0 10.0 10.0 10.0 10.0 10.0 10.0 10.0 10.0 10.0 10.0 10.0 10.0 10.0 290 10.5 10.5 10.5 10.5 10.5 10.5 10.5 10.5 10.5 10.5 10.5 10.5 10.5 10.5 10.5 10.5 10.5 10.5 10.5 10.5 10.5 305 11.0 11.0 11.0 11.0 11.0 11.0 11.0 11.0 11.0 11.0 11.0 11.0 11.0 11.0 11.0 11.0 11.0 11.0 11.0 11.0 11.0 320 11.5 11.5 11.5 11.5 11.5 11.5 11.5 11.5 11.5 11.5 11.5 11.5 11.5 11.5 11.5 11.5 11.5 11.5 11.5 11.5 11.5 335 12.0 12.0 12.0 12.0 12.0 12.0 12.0 12.0 12.0 12.0 12.0 12.0 12.0 12.0 12.0 12.0 12.0 12.0 12.0 12.0 12.0 350 12.5 12.5 12.5 12.5 12.5 12.5 12.5 12.5 12.5 12.5 12.5 12.5 12.5 12.5 12.5 12.5 12.5 12.5 12.5 12.5 12.5 365 13.0 13.0 13.0 13.0 13.0 13.0 13.0 13.0 13.0 13.0 13.0 13.0 13.0 13.0 13.0 13.0 13.0 13.0 13.0 13.0 13.0 380 13.5 13.5 13.5 13.5 13.5 13.5 13.5 13.5 13.5 13.5 13.5 13.5 13.5 13.5 13.5 13.5 13.5 13.5 13.5 13.5 13.5 395 14.0 14.0 14.0 14.0 14.0 14.0 14.0 14.0 14.0 14.0 14.0 14.0 14.0 14.0 14.0 14.0 14.0 14.0 14.0 14.0 14.0 410 14.5 14.5 14.5 14.5 14.5 14.5 14.5 14.5 14.5 14.5 14.5 14.5 14.5 14.5 14.5 14.5 14.5 14.5 14.5 14.5 14.5 425 15.5 15.0 15.0 15.0 15.0 15.0 15.0 15.0 15.0 15.0 15.0 15.0 15.0 15.0 15.5 15.5 15.5 15.5 15.5 15.5 16.0 440 16.0 16.0 16.0 16.0 16.0 16.0 16.0 15.5 15.5 15.5 15.5 15.5 16.0 16.0 16.0 16.0 16.5 16.5 16.5 16.5 17.0 455 17.0 16.5 16.5 16.5 16.5 16.5 16.5 16.5 16.5 16.5 16.0 16.5 16.5 16.5 17.0 17.0 17.0 17.5 17.5 17.5 18.0 470 17.5 17.5 17.5 17.5 17.0 17.0 17.0 17.0 17.0 17.0 17.0 17.0 17.0 17.5 17.5 18.0 18.0 18.5 18.5 18.5 485 18.5 18.0 18.0 18.0 18.0 18.0 17.5 17.5 17.5 17.5 17.5 17.5 18.0 18.0 18.5 18.5
HM
A L
ayer
Th
ick
nes
s (m
m)
500 18.5 18.5 18.5 18.5 18.5 18.0 18.0 18.0 18.5 18.5

Laboratory Testing and Modeling for Structural Performance of Fully Permeable Pavements Final Report, November 2010
164
Table F.8: Preliminary Stress-to-Strength Ratio at Top of Subgrade, Sacramento County (RHMA-O, with Subbase, E_GB = 60 MPa, Speed = 40 km/h)
Granular Base (GB) Layer Thickness (mm)
500 550 600 650 700 750 800 850 900 950 1000 1050 1100 1150 1200 1250 1300 1350 1400 1450 1500
200 G G G G G G G G G G G G G G G G G G G G G 215 G G G G G G G G G G G G G G G G G G G G G 230 G G G G G G G G G G G G G G G G G G G G G 245 G G G G G G G G G G G G G G G G G G G G G 260 G G G G G G G G G G G G G G G G G G G G G 275 G G G G G G G G G G G G G G G G G G G G G 290 G G G G G G G G G G G G G G G G G G G G G 305 G G G G G G G G G G G G G G G G G G G G G 320 G G G G G G G G G G G G G G G G G G G G G 335 G G G G G G G G G G G G G G G G G G G G G 350 G G G G G G G G G G G G G G G G G G G G G 365 G G G G G G G G G G G G G G G G G G G G G 380 G G G G G G G G G G G G G G G G G G G G G 395 G G G G G G G G G G G G G G G G G G G G G 410 G G G G G G G G G G G G G G G G G G G G G 425 G G G G G G G G G G G G G G G G G G G G G 440 G G G G G G G G G G G G G G G G G G G G G 455 G G G G G G G G G G G G G G G G G G G G G 470 G G G G G G G G G G G G G G G G G G G G G 485 G G G G G G G G G G G G G G G G G G G G G
HM
A L
ayer
Th
ick
nes
s (m
m)
500 G G G G G G G G G G G G G G G G G G G G G Note: G--Stress-to-Strength Ratio <0.3; Y--0.3=<Stress-to-Strength Ratio <=0.7; R--Stress-to-Strength Ratio >0.7

Laboratory Testing and Modeling for Structural Performance of Fully Permeable Pavements Final Report, November 2010
165
Appendix G: Preliminary Structural Design Tables for G125 HMA-O Surfaces, no Subbase
Table G.1: Preliminary TI for HMA-O Fatigue Damage=1, Los Angeles County (G125 HMA-O, no Subbase, E_GB= 60 MPa, Speed = 7 km/h)
Granular Base (GB) Layer Thickness (mm)
500 550 600 650 700 750 800 850 900 950 1000 1050 1100 1150 1200 1250 1300 1350 1400 1450 1500
200 9.5 9.5 9.5 9.5 9.5 9.5 9.5 9.5 9.5 9.5 9.5 9.5 9.5 9.5 9.5 9.5 9.5 9.5 9.5 9.5 9.5 215 10.5 10.5 10.5 10.5 10.5 10.5 10.5 10.5 10.5 10.5 10.5 10.5 10.5 10.5 10.5 10.5 10.5 10.5 10.5 10.5 10.5 230 11.5 11.5 11.5 11.5 11.5 11.5 11.5 11.5 11.5 11.5 11.5 11.5 11.5 11.5 11.5 11.5 11.5 11.5 11.5 11.5 11.5 245 12.0 12.0 12.0 12.0 12.0 12.0 12.0 12.0 12.0 12.0 12.0 12.0 12.0 12.0 12.0 12.0 12.0 12.0 12.0 12.0 12.0 260 13.0 13.0 13.0 13.0 13.0 13.0 13.0 13.0 13.0 13.0 13.0 13.0 13.0 13.0 13.0 13.0 13.0 13.0 13.0 13.0 13.0 275 14.0 14.0 14.0 14.0 14.0 14.0 14.0 14.0 14.0 14.0 14.0 14.0 14.0 14.0 14.0 14.0 14.0 14.0 14.0 14.0 14.0 290 15.0 15.0 15.0 15.0 15.0 15.0 15.0 15.0 15.0 15.0 15.0 15.0 15.0 15.0 15.0 15.0 15.0 15.0 15.0 15.0 15.0 305 16.0 16.0 16.0 16.0 16.0 16.0 16.0 16.0 16.0 16.0 16.0 16.0 16.0 16.0 16.0 16.0 16.0 16.0 16.0 16.0 16.0 320 17.5 17.5 17.5 17.0 17.0 17.0 17.0 17.0 17.0 17.0 17.0 17.0 17.0 17.0 17.0 17.0 17.0 17.0 17.0 17.0 17.0 335 18.5 18.5 18.5 18.5 18.5 18.5 18.5 18.5 18.5 18.5 18.5 18.5 18.5 18.5 18.5 18.5 18.5 18.5 18.5 18.5 18.5 350 365 380 395 410 425 440 455 470 485
HM
A L
ayer
Th
ick
nes
s (m
m)
500

Laboratory Testing and Modeling for Structural Performance of Fully Permeable Pavements Final Report, November 2010
166
Table G.2: Preliminary Stress-to-Strength Ratio at Top of Subgrade, Los Angeles County (G125 HMA-O, no Subbase, E_GB= 60 MPa, Speed = 7 km/h)
Granular Base (GB) Layer Thickness (mm)
500 550 600 650 700 750 800 850 900 950 1000 1050 1100 1150 1200 1250 1300 1350 1400 1450 1500
200 Y Y G G G G G G G G G G G G G G G G G G G 215 Y G G G G G G G G G G G G G G G G G G G G 230 G G G G G G G G G G G G G G G G G G G G G 245 G G G G G G G G G G G G G G G G G G G G G 260 G G G G G G G G G G G G G G G G G G G G G 275 G G G G G G G G G G G G G G G G G G G G G 290 G G G G G G G G G G G G G G G G G G G G G 305 G G G G G G G G G G G G G G G G G G G G G 320 G G G G G G G G G G G G G G G G G G G G G 335 G G G G G G G G G G G G G G G G G G G G G 350 G G G G G G G G G G G G G G G G G G G G G 365 G G G G G G G G G G G G G G G G G G G G G 380 G G G G G G G G G G G G G G G G G G G G G 395 G G G G G G G G G G G G G G G G G G G G G 410 G G G G G G G G G G G G G G G G G G G G G 425 G G G G G G G G G G G G G G G G G G G G G 440 G G G G G G G G G G G G G G G G G G G G G 455 G G G G G G G G G G G G G G G G G G G G G 470 G G G G G G G G G G G G G G G G G G G G G 485 G G G G G G G G G G G G G G G G G G G G G
HM
A L
ayer
Th
ick
nes
s (m
m)
500 G G G G G G G G G G G G G G G G G G G G G Note: G--Stress-to-Strength Ratio <0.3; Y--0.3=<Stress-to-Strength Ratio <=0.7; R--Stress-to-Strength Ratio >0.7

Laboratory Testing and Modeling for Structural Performance of Fully Permeable Pavements Final Report, November 2010
167
Table G.3: Preliminary TI for HMA-O Fatigue Damage=1, Los Angeles County (G125 HMA-O, no Subbase, E_GB= 60 MPa, Speed = 40 km/h)
Granular Base (GB) Layer Thickness (mm)
500 550 600 650 700 750 800 850 900 950 1000 1050 1100 1150 1200 1250 1300 1350 1400 1450 1500
200 12.5 12.5 12.5 12.5 12.5 12.5 12.5 12.5 12.5 12.5 12.5 12.5 12.5 12.5 12.5 12.5 12.5 12.5 12.5 12.5 12.5 215 14.0 14.0 14.0 14.0 14.0 14.0 14.0 14.0 14.0 14.0 14.0 14.0 14.0 14.0 14.0 14.0 14.0 14.0 14.0 14.0 14.0 230 15.0 15.0 15.0 15.0 15.0 15.0 15.0 15.0 15.0 15.0 15.0 15.0 15.0 15.0 15.0 15.0 15.0 15.0 15.0 15.0 15.0 245 16.5 16.5 16.5 16.5 16.5 16.5 16.5 16.5 16.5 16.5 16.5 16.5 16.5 16.5 16.5 16.5 16.5 16.5 16.5 16.5 16.5 260 18.0 18.0 18.0 18.0 18.0 18.0 18.0 18.0 18.0 18.0 18.0 18.0 18.0 18.0 18.0 18.0 18.0 18.0 18.0 18.0 18.0 275 290 305 320 335 350 365 380 395 410 425 440 455 470 485
HM
A L
ayer
Th
ick
nes
s (m
m)
500

Laboratory Testing and Modeling for Structural Performance of Fully Permeable Pavements Final Report, November 2010
168
Table G.4: Preliminary Stress-to-Strength Ratio at Top of Subgrade, Los Angeles County (G125 HMA-O, no Subbase, E_GB = 60 MPa, Speed = 40 km/h)
Granular Base (GB) Layer Thickness (mm)
500 550 600 650 700 750 800 850 900 950 1000 1050 1100 1150 1200 1250 1300 1350 1400 1450 1500
200 G G G G G G G G G G G G G G G G G G G G G 215 G G G G G G G G G G G G G G G G G G G G G 230 G G G G G G G G G G G G G G G G G G G G G 245 G G G G G G G G G G G G G G G G G G G G G 260 G G G G G G G G G G G G G G G G G G G G G 275 G G G G G G G G G G G G G G G G G G G G G 290 G G G G G G G G G G G G G G G G G G G G G 305 G G G G G G G G G G G G G G G G G G G G G 320 G G G G G G G G G G G G G G G G G G G G G 335 G G G G G G G G G G G G G G G G G G G G G 350 G G G G G G G G G G G G G G G G G G G G G 365 G G G G G G G G G G G G G G G G G G G G G 380 G G G G G G G G G G G G G G G G G G G G G 395 G G G G G G G G G G G G G G G G G G G G G 410 G G G G G G G G G G G G G G G G G G G G G 425 G G G G G G G G G G G G G G G G G G G G G 440 G G G G G G G G G G G G G G G G G G G G G 455 G G G G G G G G G G G G G G G G G G G G G 470 G G G G G G G G G G G G G G G G G G G G G 485 G G G G G G G G G G G G G G G G G G G G G
HM
A L
ayer
Th
ick
nes
s (m
m)
500 G G G G G G G G G G G G G G G G G G G G G Note: G--Stress-to-Strength Ratio <0.3; Y--0.3=<Stress-to-Strength Ratio <=0.7; R--Stress-to-Strength Ratio >0.7

Laboratory Testing and Modeling for Structural Performance of Fully Permeable Pavements Final Report, November 2010
169
Table G.5: Preliminary TI for HMA-O Fatigue Damage=1, Sacramento County (G125 HMA-O, no Subbase, E_GB = 60 MPa, Speed = 7 km/h)
Granular Base (GB) Layer Thickness (mm)
500 550 600 650 700 750 800 850 900 950 1000 1050 1100 1150 1200 1250 1300 1350 1400 1450 1500
200 6.0 6.0 6.0 6.0 6.0 6.0 6.0 6.0 6.0 6.0 6.0 6.0 6.0 6.0 6.0 6.0 6.0 6.0 6.0 6.0 6.0 215 6.5 6.5 6.5 6.5 6.5 6.5 6.5 6.5 6.5 6.5 6.5 6.5 6.5 6.5 6.5 6.5 6.5 6.5 6.5 6.5 6.5 230 7.0 7.0 7.0 7.0 7.0 7.0 7.0 7.0 7.0 7.0 7.0 7.0 7.0 7.0 7.0 7.0 7.0 7.0 7.0 7.0 7.0 245 8.0 8.0 7.5 7.5 7.5 7.5 7.5 7.5 7.5 7.5 7.5 7.5 7.5 7.5 7.5 7.5 7.5 7.5 7.5 7.5 7.5 260 8.5 8.5 8.5 8.0 8.0 8.0 8.0 8.0 8.0 8.0 8.0 8.0 8.0 8.0 8.0 8.0 8.0 8.0 8.0 8.0 8.0 275 9.0 9.0 9.0 9.0 8.5 8.5 8.5 8.5 8.5 8.5 8.5 8.5 8.5 8.5 8.5 8.5 8.5 8.5 8.5 8.5 8.5 290 9.5 9.5 9.5 9.5 9.0 9.0 9.0 9.0 9.0 9.0 8.5 8.5 8.5 8.5 8.5 8.5 8.5 8.5 8.5 8.5 8.5 305 10.0 10.0 10.0 10.0 10.0 9.5 9.5 9.5 9.5 9.5 9.0 9.5 9.5 9.5 9.5 9.0 9.5 9.5 9.5 9.5 9.0 320 11.0 10.5 10.5 10.5 10.5 10.5 10.5 10.0 10.0 10.0 10.0 10.0 10.0 10.0 10.0 10.0 10.0 10.0 10.0 10.0 10.0 335 11.5 11.5 11.5 11.0 11.0 11.0 11.0 11.0 11.0 11.0 11.0 11.0 10.5 11.0 11.0 11.0 11.0 11.0 10.5 11.0 11.0 350 12.0 12.0 12.0 12.0 12.0 12.0 11.5 11.5 11.5 11.5 11.5 11.5 11.5 11.5 11.5 11.5 11.5 11.5 11.5 11.5 11.5 365 12.5 12.5 12.5 12.5 12.5 12.5 12.5 12.5 12.5 12.5 12.5 12.5 12.5 12.0 12.5 12.5 12.5 12.0 12.5 12.5 12.5 380 13.0 13.0 13.0 13.0 13.0 13.0 13.0 13.0 13.0 13.0 13.0 13.0 13.0 13.0 13.0 13.0 13.0 13.0 13.0 13.0 13.0 395 14.0 14.0 14.0 14.0 14.0 14.0 14.0 14.0 14.0 14.0 13.5 13.5 14.0 13.5 14.0 13.5 14.0 13.5 14.0 13.5 13.5 410 14.5 14.5 14.5 14.5 14.5 14.5 14.5 14.5 14.5 14.5 14.5 14.5 14.5 14.5 14.5 14.5 14.5 14.5 14.5 14.5 14.5 425 15.5 15.5 15.5 15.0 15.5 15.5 15.5 15.0 15.5 15.5 15.5 15.5 15.5 15.5 15.5 15.5 15.5 15.5 15.5 15.5 16.0 440 16.0 16.0 16.0 16.0 16.0 16.0 16.0 16.0 16.0 16.0 16.0 16.0 16.0 16.0 16.5 16.5 16.5 16.5 16.5 16.5 17.0 455 17.0 17.0 17.0 17.0 17.0 17.0 17.0 17.0 17.0 17.0 17.0 17.0 17.0 17.0 17.0 17.5 17.5 17.5 17.5 17.5 18.0 470 17.5 17.5 17.5 17.5 17.5 17.5 17.5 17.5 17.5 17.5 17.5 17.5 18.0 18.0 18.0 18.0 18.5 18.5 18.5 485 18.5 18.5 18.5 18.5 18.5 18.5 18.5 18.5 18.5 18.5 18.5 18.5 18.5
HM
A L
ayer
Th
ick
nes
s (m
m)
500

Laboratory Testing and Modeling for Structural Performance of Fully Permeable Pavements Final Report, November 2010
170
Table G.6: Preliminary Stress-to-Strength Ratio at Top of Subgrade, Sacramento County (G125 HMA-O, no Subbase, E_GB = 60 MPa, Speed = 7 km/h)
Granular Base (GB) Layer Thickness (mm)
500 550 600 650 700 750 800 850 900 950 1000 1050 1100 1150 1200 1250 1300 1350 1400 1450 1500
200 Y Y Y Y Y G G G G G G G G G G G G G G G G 215 Y Y Y Y G G G G G G G G G G G G G G G G G 230 Y Y Y Y G G G G G G G G G G G G G G G G G 245 Y Y Y G G G G G G G G G G G G G G G G G G 260 Y Y Y G G G G G G G G G G G G G G G G G G 275 Y Y G G G G G G G G G G G G G G G G G G G 290 Y G G G G G G G G G G G G G G G G G G G G 305 G G G G G G G G G G G G G G G G G G G G G 320 G G G G G G G G G G G G G G G G G G G G G 335 G G G G G G G G G G G G G G G G G G G G G 350 G G G G G G G G G G G G G G G G G G G G G 365 G G G G G G G G G G G G G G G G G G G G G 380 G G G G G G G G G G G G G G G G G G G G G 395 G G G G G G G G G G G G G G G G G G G G G 410 G G G G G G G G G G G G G G G G G G G G G 425 G G G G G G G G G G G G G G G G G G G G G 440 G G G G G G G G G G G G G G G G G G G G G 455 G G G G G G G G G G G G G G G G G G G G G 470 G G G G G G G G G G G G G G G G G G G G G 485 G G G G G G G G G G G G G G G G G G G G G
HM
A L
ayer
Th
ick
nes
s (m
m)
500 G G G G G G G G G G G G G G G G G G G G G Note: G--Stress-to-Strength Ratio <0.3; Y--0.3=<Stress-to-Strength Ratio <=0.7; R--Stress-to-Strength Ratio >0.7

Laboratory Testing and Modeling for Structural Performance of Fully Permeable Pavements Final Report, November 2010
171
Table G.7: Preliminary TI for HMA-O Fatigue Damage=1, Sacramento County (G125 HMA-O, no Subbase, E_GB = 60 MPa, Speed = 40 km/h)
Granular Base (GB) Layer Thickness (mm)
500 550 600 650 700 750 800 850 900 950 1000 1050 1100 1150 1200 1250 1300 1350 1400 1450 1500
200 7.0 7.0 7.0 7.0 7.0 7.0 7.0 7.0 7.0 7.0 7.0 7.0 7.0 7.0 7.0 7.0 7.0 7.0 7.0 7.0 7.0 215 7.5 7.5 7.5 7.5 7.5 7.5 7.5 7.5 7.5 7.5 7.5 7.5 7.5 7.5 7.5 7.5 7.5 7.5 7.5 7.5 7.5 230 8.0 8.0 8.0 8.0 8.0 8.0 8.0 8.0 8.0 8.0 8.0 8.0 8.0 8.0 8.0 8.0 8.0 8.0 8.0 8.0 8.0 245 9.0 9.0 9.0 9.0 9.0 9.0 9.0 9.0 9.0 9.0 9.0 9.0 9.0 9.0 9.0 9.0 9.0 9.0 9.0 9.0 9.0 260 9.5 9.5 9.5 9.5 9.5 9.5 9.5 9.5 9.5 9.5 9.5 9.5 9.5 9.5 9.5 9.5 9.5 9.5 9.5 9.5 9.5 275 10.0 10.0 10.0 10.0 10.0 10.0 10.0 10.0 10.0 10.0 10.0 10.0 10.0 10.0 10.0 10.0 10.0 10.0 10.0 10.0 10.0 290 10.5 10.5 10.5 10.5 10.5 10.5 10.5 10.5 10.5 10.5 10.5 10.5 10.5 10.5 10.5 10.5 10.5 10.5 10.5 10.5 10.5 305 11.5 11.0 11.5 11.0 11.5 11.5 11.5 11.0 11.5 11.0 11.5 11.0 11.5 11.0 11.5 11.5 11.5 11.0 11.5 11.0 11.5 320 12.0 12.0 12.0 12.0 12.0 12.0 12.0 12.0 12.0 12.0 12.0 12.0 12.0 12.0 12.0 12.0 12.0 12.0 12.0 12.0 12.0 335 13.0 13.0 13.0 13.0 13.0 13.0 13.0 13.0 13.0 13.0 13.0 13.0 13.0 13.0 13.0 13.0 13.0 13.0 13.0 13.0 13.0 350 13.5 13.5 13.5 13.5 13.5 13.5 13.5 13.5 13.5 13.5 13.5 13.5 13.5 13.5 13.5 13.5 13.5 13.5 13.5 13.5 13.5 365 14.5 14.5 14.5 14.5 14.5 14.5 14.5 14.5 14.5 14.5 14.5 14.5 14.5 14.5 14.5 14.5 14.5 14.5 14.5 14.5 14.5 380 15.0 15.0 15.0 15.0 15.0 15.0 15.0 15.0 15.0 15.0 15.0 15.0 15.0 15.0 15.0 15.0 15.0 15.0 15.0 15.0 15.0 395 16.0 16.0 16.0 15.5 16.0 16.0 16.0 15.5 16.0 16.0 16.0 16.0 16.0 15.5 16.0 16.0 16.0 15.5 16.0 16.0 16.0 410 16.5 16.5 16.5 16.5 16.5 16.5 16.5 16.5 16.5 16.5 16.5 16.5 17.0 17.0 17.0 17.0 17.0 17.0 17.0 17.0 17.0 425 18.0 18.0 18.0 17.5 18.0 18.0 18.0 17.5 18.0 18.0 18.0 18.0 18.0 18.0 18.0 18.0 18.0 18.5 18.5 18.5 18.5 440 455 470 485
HM
A L
ayer
Th
ick
nes
s (m
m)
500

Laboratory Testing and Modeling for Structural Performance of Fully Permeable Pavements Final Report, November 2010
172
Table G.8: Preliminary Stress-to-Strength Ratio at Top of Subgrade, Sacramento County (G125 HMA-O, no Subbase, E_GB = 60 MPa, Speed = 40 km/h)
Granular Base (GB) Layer Thickness (mm)
500 550 600 650 700 750 800 850 900 950 1000 1050 1100 1150 1200 1250 1300 1350 1400 1450 1500
200 Y Y Y Y G G G G G G G G G G G G G G G G G 215 Y Y Y Y G G G G G G G G G G G G G G G G G 230 Y Y Y G G G G G G G G G G G G G G G G G G 245 Y Y G G G G G G G G G G G G G G G G G G G 260 Y Y G G G G G G G G G G G G G G G G G G G 275 Y G G G G G G G G G G G G G G G G G G G G 290 G G G G G G G G G G G G G G G G G G G G G 305 G G G G G G G G G G G G G G G G G G G G G 320 G G G G G G G G G G G G G G G G G G G G G 335 G G G G G G G G G G G G G G G G G G G G G 350 G G G G G G G G G G G G G G G G G G G G G 365 G G G G G G G G G G G G G G G G G G G G G 380 G G G G G G G G G G G G G G G G G G G G G 395 G G G G G G G G G G G G G G G G G G G G G 410 G G G G G G G G G G G G G G G G G G G G G 425 G G G G G G G G G G G G G G G G G G G G G 440 G G G G G G G G G G G G G G G G G G G G G 455 G G G G G G G G G G G G G G G G G G G G G 470 G G G G G G G G G G G G G G G G G G G G G 485 G G G G G G G G G G G G G G G G G G G G G
HM
A L
ayer
Th
ick
nes
s (m
m)
500 G G G G G G G G G G G G G G G G G G G G G Note: G--Stress-to-Strength Ratio <0.3; Y--0.3=<Stress-to-Strength Ratio <=0.7; R--Stress-to-Strength Ratio >0.7

Laboratory Testing and Modeling for Structural Performance of Fully Permeable Pavements Final Report, November 2010
173
Appendix H: Preliminary Structural Design Tables for G125 HMA-O Surfaces, with Subbase
Table H.1: Preliminary TI for HMA-O Fatigue Damage=1, Los Angeles County (G125 HMA-O, with Subbase, E_GB= 60 MPa, Speed 7 km/h)
Granular Base (GB) Layer Thickness (mm)
500 550 600 650 700 750 800 850 900 950 1000 1050 1100 1150 1200 1250 1300 1350 1400 1450 1500
200 10.0 10.0 10.0 10.0 10.0 10.0 10.0 10.0 10.0 10.0 10.0 10.0 10.0 10.0 10.0 10.0 10.0 10.0 10.0 10.0 10.0 215 11.0 11.0 11.0 11.0 11.0 11.0 11.0 11.0 11.0 11.0 11.0 11.0 11.0 11.0 11.0 11.0 11.0 11.0 11.0 11.0 11.0 230 12.0 12.0 12.0 12.0 12.0 12.0 12.0 12.0 12.0 12.0 12.0 12.0 12.0 12.0 12.0 12.0 12.0 12.0 12.0 12.0 12.0 245 13.0 13.0 13.0 13.0 13.0 13.0 13.0 13.0 13.0 12.5 12.5 12.5 12.5 12.5 12.5 12.5 12.5 12.5 12.5 12.5 12.5 260 14.0 14.0 14.0 14.0 14.0 14.0 14.0 14.0 13.5 13.5 13.5 13.5 13.5 13.5 13.5 13.5 13.5 13.5 13.5 13.5 13.5 275 15.5 15.0 15.0 15.0 15.0 15.0 15.0 14.5 14.5 14.5 14.5 14.5 14.5 14.5 14.5 14.5 14.5 14.5 14.5 14.5 14.5 290 16.5 16.0 16.0 16.0 16.0 16.0 16.0 15.5 15.5 15.5 15.5 15.5 15.5 15.5 15.5 15.5 15.5 15.5 15.5 15.5 15.5 305 17.5 17.5 17.0 17.0 17.0 17.0 17.0 16.5 16.5 16.5 16.5 16.5 16.5 16.5 16.5 16.5 16.5 16.5 16.5 16.5 16.5 320 18.5 18.5 18.5 18.5 18.5 18.0 18.0 18.0 18.0 18.0 18.0 18.0 18.0 17.5 17.5 17.5 17.5 17.5 17.5 17.5 17.5 335 350 365 380 395 410 425 440 455 470 485
HM
A L
ayer
Th
ick
nes
s (m
m)
500

Laboratory Testing and Modeling for Structural Performance of Fully Permeable Pavements Final Report, November 2010
174
Table H.2: Preliminary Stress-to-Strength Ratio at Top of Subgrade, Los Angeles County (G125 HMA-O, with Subbase, E_GB= 60 MPa, Speed = 7 km/h)
Granular Base (GB) Layer Thickness (mm)
500 550 600 650 700 750 800 850 900 950 1000 1050 1100 1150 1200 1250 1300 1350 1400 1450 1500
200 G G G G G G G G G G G G G G G G G G G G G 215 G G G G G G G G G G G G G G G G G G G G G 230 G G G G G G G G G G G G G G G G G G G G G 245 G G G G G G G G G G G G G G G G G G G G G 260 G G G G G G G G G G G G G G G G G G G G G 275 G G G G G G G G G G G G G G G G G G G G G 290 G G G G G G G G G G G G G G G G G G G G G 305 G G G G G G G G G G G G G G G G G G G G G 320 G G G G G G G G G G G G G G G G G G G G G 335 G G G G G G G G G G G G G G G G G G G G G 350 G G G G G G G G G G G G G G G G G G G G G 365 G G G G G G G G G G G G G G G G G G G G G 380 G G G G G G G G G G G G G G G G G G G G G 395 G G G G G G G G G G G G G G G G G G G G G 410 G G G G G G G G G G G G G G G G G G G G G 425 G G G G G G G G G G G G G G G G G G G G G 440 G G G G G G G G G G G G G G G G G G G G G 455 G G G G G G G G G G G G G G G G G G G G G 470 G G G G G G G G G G G G G G G G G G G G G 485 G G G G G G G G G G G G G G G G G G G G G
HM
A L
ayer
Th
ick
nes
s (m
m)
500 G G G G G G G G G G G G G G G G G G G G G Note: G--Stress-to-Strength Ratio <0.3; Y--0.3=<Stress-to-Strength Ratio <=0.7; R--Stress-to-Strength Ratio >0.7

Laboratory Testing and Modeling for Structural Performance of Fully Permeable Pavements Final Report, November 2010
175
Table H.3: Preliminary TI for HMA-O Fatigue Damage=1, Los Angeles County (G125 HMA-O, with Subbase, E_GB= 60 MPa, Speed = 40 km/h)
Granular Base (GB) Layer Thickness (mm)
500 550 600 650 700 750 800 850 900 950 1000 1050 1100 1150 1200 1250 1300 1350 1400 1450 1500
200 13.0 13.0 13.0 12.5 12.5 12.5 12.5 12.5 12.0 12.0 12.0 12.0 12.0 12.0 12.0 12.0 12.0 12.0 12.0 12.0 12.0 215 14.5 14.5 14.0 14.0 14.0 14.0 14.0 13.5 13.5 13.5 13.5 13.5 13.5 13.5 13.5 13.5 13.5 13.5 13.5 13.5 13.5 230 15.5 15.5 15.5 15.5 15.5 15.0 15.0 15.0 15.0 15.0 14.5 14.5 14.5 14.5 14.5 14.5 14.5 14.5 14.5 14.5 14.5 245 17.0 17.0 17.0 17.0 16.5 16.5 16.5 16.5 16.5 16.0 16.0 16.0 16.0 16.0 16.0 16.0 16.0 16.0 16.0 16.0 16.0 260 18.5 18.5 18.0 18.0 18.0 18.0 18.0 17.5 17.5 17.5 17.5 17.5 17.5 17.5 17.5 17.5 17.5 17.5 17.5 17.5 17.5 275 290 305 320 335 350 365 380 395 410 425 440 455 470 485
HM
A L
ayer
Th
ick
nes
s (m
m)
500

Laboratory Testing and Modeling for Structural Performance of Fully Permeable Pavements Final Report, November 2010
176
Table H.4: Preliminary Stress-to-Strength Ratio at Top of Subgrade, Los Angeles County (G125 HMA-O, with Subbase, E_GB = 60 MPa, Speed = 40 km/h)
Granular Base (GB) Layer Thickness (mm)
500 550 600 650 700 750 800 850 900 950 1000 1050 1100 1150 1200 1250 1300 1350 1400 1450 1500
200 G G G G G G G G G G G G G G G G G G G G G 215 G G G G G G G G G G G G G G G G G G G G G 230 G G G G G G G G G G G G G G G G G G G G G 245 G G G G G G G G G G G G G G G G G G G G G 260 G G G G G G G G G G G G G G G G G G G G G 275 G G G G G G G G G G G G G G G G G G G G G 290 G G G G G G G G G G G G G G G G G G G G G 305 G G G G G G G G G G G G G G G G G G G G G 320 G G G G G G G G G G G G G G G G G G G G G 335 G G G G G G G G G G G G G G G G G G G G G 350 G G G G G G G G G G G G G G G G G G G G G 365 G G G G G G G G G G G G G G G G G G G G G 380 G G G G G G G G G G G G G G G G G G G G G 395 G G G G G G G G G G G G G G G G G G G G G 410 G G G G G G G G G G G G G G G G G G G G G 425 G G G G G G G G G G G G G G G G G G G G G 440 G G G G G G G G G G G G G G G G G G G G G 455 G G G G G G G G G G G G G G G G G G G G G 470 G G G G G G G G G G G G G G G G G G G G G 485 G G G G G G G G G G G G G G G G G G G G G
HM
A L
ayer
Th
ick
nes
s (m
m)
500 G G G G G G G G G G G G G G G G G G G G G Note: G--Stress-to-Strength Ratio <0.3; Y--0.3=<Stress-to-Strength Ratio <=0.7; R--Stress-to-Strength Ratio >0.7

Laboratory Testing and Modeling for Structural Performance of Fully Permeable Pavements Final Report, November 2010
177
Table H.5: Preliminary TI for HMA-O Fatigue Damage=1, Sacramento County (G125 HMA-O, with Subbase, E_GB = 60 MPa, Speed = 7 km/h)
Granular Base (GB) Layer Thickness (mm)
500 550 600 650 700 750 800 850 900 950 1000 1050 1100 1150 1200 1250 1300 1350 1400 1450 1500
200 6.0 6.0 6.0 6.0 6.0 6.0 6.0 6.0 6.0 6.0 6.0 6.0 6.0 6.0 6.0 6.0 6.0 6.0 6.0 6.0 6.0 215 6.5 6.5 6.5 6.5 6.5 6.5 6.5 6.5 6.5 6.5 6.5 6.5 6.5 6.5 6.5 6.5 6.5 6.5 6.5 6.5 6.5 230 7.0 7.0 7.0 7.0 7.0 7.0 7.0 7.0 7.0 7.0 7.0 7.0 7.0 7.0 7.0 7.0 7.0 7.0 7.0 7.0 7.0 245 8.0 8.0 8.0 8.0 8.0 8.0 8.0 8.0 8.0 8.0 8.0 8.0 7.5 7.5 7.5 7.5 7.5 7.5 7.5 7.5 7.5 260 8.5 8.5 8.5 8.5 8.5 8.5 8.5 8.5 8.5 8.5 8.5 8.5 8.5 8.0 8.0 8.0 8.0 8.0 8.0 8.0 8.0 275 9.0 9.0 9.0 9.0 9.0 9.0 9.0 9.0 9.0 9.0 9.0 9.0 9.0 9.0 8.5 8.5 8.5 8.5 8.5 8.5 8.5 290 9.5 9.5 9.5 9.5 9.5 9.5 9.5 9.5 9.5 9.5 9.5 9.5 9.5 9.5 9.0 9.0 9.0 9.0 9.0 9.0 8.5 305 10.0 10.0 10.0 10.0 10.0 10.0 10.0 10.0 10.0 10.0 10.0 10.0 10.0 10.0 10.0 9.5 9.5 9.5 9.5 9.5 9.0 320 11.0 11.0 11.0 11.0 11.0 11.0 11.0 11.0 11.0 11.0 11.0 10.5 10.5 10.5 10.5 10.5 10.5 10.0 10.0 10.0 10.0 335 11.5 11.5 11.5 11.5 11.5 11.5 11.5 11.5 11.5 11.5 11.5 11.5 11.5 11.0 11.0 11.0 11.0 11.0 11.0 11.0 11.0 350 12.0 12.0 12.0 12.0 12.0 12.0 12.0 12.0 12.0 12.0 12.0 12.0 12.0 12.0 12.0 12.0 11.5 11.5 11.5 11.5 11.5 365 12.5 12.5 12.5 12.5 12.5 12.5 12.5 12.5 12.5 12.5 12.5 12.5 12.5 12.5 12.5 12.5 12.5 12.5 12.5 12.5 12.5 380 13.0 13.0 13.0 13.0 13.0 13.0 13.0 13.0 13.0 13.0 13.0 13.0 13.0 13.0 13.0 13.0 13.0 13.0 13.0 13.0 13.0 395 14.0 14.0 14.0 14.0 14.0 14.0 14.0 14.0 14.0 14.0 14.0 14.0 14.0 14.0 14.0 14.0 14.0 14.0 14.0 14.0 13.5 410 14.5 14.5 14.5 14.5 14.5 14.5 14.5 14.5 14.5 14.5 14.5 14.5 14.5 14.5 14.5 14.5 14.5 14.5 14.5 14.5 14.5 425 15.5 15.5 15.5 15.0 15.5 15.5 15.5 15.0 15.5 15.5 15.5 15.5 15.5 15.5 15.5 15.5 15.5 15.5 15.5 15.5 16.0 440 16.0 16.0 16.0 16.0 16.0 16.0 16.0 16.0 16.0 16.0 16.0 16.0 16.0 16.0 16.5 16.5 16.5 16.5 16.5 16.5 17.0 455 17.0 17.0 17.0 17.0 17.0 17.0 17.0 17.0 17.0 17.0 17.0 17.0 17.0 17.0 17.0 17.5 17.5 17.5 17.5 17.5 18.0 470 17.5 17.5 17.5 17.5 17.5 17.5 17.5 17.5 17.5 17.5 17.5 17.5 18.0 18.0 18.0 18.0 18.5 18.5 18.5 485 18.5 18.5 18.5 18.5 18.5 18.5 18.5 18.5 18.5 18.5 18.5 18.5 18.5
HM
A L
ayer
Th
ick
nes
s (m
m)
500

Laboratory Testing and Modeling for Structural Performance of Fully Permeable Pavements Final Report, November 2010
178
Table H.6: Preliminary Stress-to-Strength Ratio at Top of Subgrade, Sacramento County (G125 HMA-O, with Subbase, E_GB = 60 MPa, Speed = 7 km/h)
Granular Base (GB) Layer Thickness (mm)
500 550 600 650 700 750 800 850 900 950 1000 1050 1100 1150 1200 1250 1300 1350 1400 1450 1500
200 G G G G G G G G G G G G G G G G G G G G G 215 G G G G G G G G G G G G G G G G G G G G G 230 G G G G G G G G G G G G G G G G G G G G G 245 G G G G G G G G G G G G G G G G G G G G G 260 G G G G G G G G G G G G G G G G G G G G G 275 G G G G G G G G G G G G G G G G G G G G G 290 G G G G G G G G G G G G G G G G G G G G G 305 G G G G G G G G G G G G G G G G G G G G G 320 G G G G G G G G G G G G G G G G G G G G G 335 G G G G G G G G G G G G G G G G G G G G G 350 G G G G G G G G G G G G G G G G G G G G G 365 G G G G G G G G G G G G G G G G G G G G G 380 G G G G G G G G G G G G G G G G G G G G G 395 G G G G G G G G G G G G G G G G G G G G G 410 G G G G G G G G G G G G G G G G G G G G G 425 G G G G G G G G G G G G G G G G G G G G G 440 G G G G G G G G G G G G G G G G G G G G G 455 G G G G G G G G G G G G G G G G G G G G G 470 G G G G G G G G G G G G G G G G G G G G G 485 G G G G G G G G G G G G G G G G G G G G G
HM
A L
ayer
Th
ick
nes
s (m
m)
500 G G G G G G G G G G G G G G G G G G G G G Note: G--Stress-to-Strength Ratio <0.3; Y--0.3=<Stress-to-Strength Ratio <=0.7; R--Stress-to-Strength Ratio >0.7

Laboratory Testing and Modeling for Structural Performance of Fully Permeable Pavements Final Report, November 2010
179
Table H.7: Preliminary TI for HMA-O Fatigue Damage=1, Sacramento County (G125 HMA-O, with Subbase, E_GB = 60 MPa, Speed = 40 km/h)
Granular Base (GB) Layer Thickness (mm)
500 550 600 650 700 750 800 850 900 950 1000 1050 1100 1150 1200 1250 1300 1350 1400 1450 1500
200 7.0 7.0 7.0 7.0 7.0 7.0 7.0 7.0 7.0 7.0 7.0 7.0 7.0 7.0 7.0 7.0 7.0 7.0 7.0 7.0 7.0 215 7.5 7.5 7.5 7.5 7.5 7.5 7.5 7.5 7.5 7.5 7.5 7.5 7.5 7.5 7.5 7.5 7.5 7.5 7.5 7.5 7.5 230 8.0 8.0 8.0 8.0 8.0 8.0 8.0 8.0 8.0 8.0 8.0 8.0 8.0 8.0 8.0 8.0 8.0 8.0 8.0 8.0 8.0 245 9.0 9.0 9.0 9.0 9.0 9.0 9.0 9.0 9.0 9.0 9.0 9.0 9.0 9.0 9.0 9.0 9.0 9.0 9.0 9.0 9.0 260 9.5 9.5 9.5 9.5 9.5 9.5 9.5 9.5 9.5 9.5 9.5 9.5 9.5 9.5 9.5 9.5 9.5 9.5 9.5 9.5 9.5 275 10.0 10.0 10.0 10.0 10.0 10.0 10.0 10.0 10.0 10.0 10.0 10.0 10.0 10.0 10.0 10.0 10.0 10.0 10.0 10.0 10.0 290 10.5 10.5 10.5 10.5 10.5 10.5 10.5 10.5 10.5 10.5 10.5 10.5 10.5 10.5 10.5 10.5 10.5 10.5 10.5 10.5 10.5 305 11.5 11.5 11.5 11.5 11.5 11.5 11.5 11.5 11.5 11.5 11.5 11.0 11.5 11.0 11.5 11.5 11.5 11.0 11.5 11.0 11.5 320 12.0 12.0 12.0 12.0 12.0 12.0 12.0 12.0 12.0 12.0 12.0 12.0 12.0 12.0 12.0 12.0 12.0 12.0 12.0 12.0 12.0 335 13.0 13.0 13.0 13.0 13.0 13.0 13.0 13.0 13.0 13.0 13.0 13.0 13.0 13.0 13.0 13.0 13.0 13.0 13.0 13.0 13.0 350 14.0 14.0 14.0 14.0 14.0 14.0 13.5 13.5 13.5 13.5 13.5 13.5 13.5 13.5 13.5 13.5 13.5 13.5 13.5 13.5 13.5 365 15.0 15.0 15.0 14.5 14.5 14.5 14.5 14.5 14.5 14.5 14.5 14.5 14.5 14.5 14.5 14.5 14.5 14.5 14.5 14.5 14.5 380 16.0 15.5 15.5 15.5 15.5 15.5 15.5 15.0 15.0 15.0 15.0 15.0 15.0 15.0 15.0 15.0 15.0 15.0 15.0 15.0 15.0 395 16.5 16.5 16.5 16.5 16.5 16.0 16.0 16.0 16.0 16.0 16.0 16.0 16.0 15.5 16.0 16.0 16.0 15.5 16.0 16.0 16.0 410 17.5 17.5 17.5 17.5 17.0 17.0 17.0 17.0 17.0 17.0 16.5 16.5 17.0 17.0 17.0 17.0 17.0 17.0 17.0 17.0 17.0 425 18.5 18.5 18.5 18.5 18.0 18.0 18.0 18.0 18.0 18.0 18.0 18.0 18.0 18.0 18.0 18.0 18.0 18.5 18.5 18.5 18.5 440 455 470 485
HM
A L
ayer
Th
ick
nes
s (m
m)
500

Laboratory Testing and Modeling for Structural Performance of Fully Permeable Pavements Final Report, November 2010
180
Table H.8: Preliminary Stress-to-Strength Ratio at Top of Subgrade, Sacramento County (G125 HMA-O, with Subbase, E_GB = 60 MPa, Speed = 40 km/h)
Granular Base (GB) Layer Thickness (mm)
500 550 600 650 700 750 800 850 900 950 1000 1050 1100 1150 1200 1250 1300 1350 1400 1450 1500
200 G G G G G G G G G G G G G G G G G G G G G 215 G G G G G G G G G G G G G G G G G G G G G 230 G G G G G G G G G G G G G G G G G G G G G 245 G G G G G G G G G G G G G G G G G G G G G 260 G G G G G G G G G G G G G G G G G G G G G 275 G G G G G G G G G G G G G G G G G G G G G 290 G G G G G G G G G G G G G G G G G G G G G 305 G G G G G G G G G G G G G G G G G G G G G 320 G G G G G G G G G G G G G G G G G G G G G 335 G G G G G G G G G G G G G G G G G G G G G 350 G G G G G G G G G G G G G G G G G G G G G 365 G G G G G G G G G G G G G G G G G G G G G 380 G G G G G G G G G G G G G G G G G G G G G 395 G G G G G G G G G G G G G G G G G G G G G 410 G G G G G G G G G G G G G G G G G G G G G 425 G G G G G G G G G G G G G G G G G G G G G 440 G G G G G G G G G G G G G G G G G G G G G 455 G G G G G G G G G G G G G G G G G G G G G 470 G G G G G G G G G G G G G G G G G G G G G 485 G G G G G G G G G G G G G G G G G G G G G
HM
A L
ayer
Th
ick
nes
s (m
m)
500 G G G G G G G G G G G G G G G G G G G G G Note: G--Stress-to-Strength Ratio <0.3; Y--0.3=<Stress-to-Strength Ratio <=0.7; R--Stress-to-Strength Ratio >0.7

Laboratory Testing and Modeling for Structural Performance of Fully Permeable Pavements Final Report, November 2010
181
Appendix I: Preliminary Structural Design Tables for HMA-O Surfaces, no Subbase
Table I.1: Preliminary TI for HMA-O Fatigue Damage=1, Los Angeles County (HMA-O, no Subbase, E_GB = 60 MPa, Speed = 7 km/h)
Granular Base (GB) Layer Thickness (mm)
500 550 600 650 700 750 800 850 900 950 1000 1050 1100 1150 1200 1250 1300 1350 1400 1450 1500
200 5.5 5.5 5.5 5.5 5.5 5.5 5.5 5.5 5.5 5.5 5.5 5.5 5.5 5.5 5.5 5.5 5.5 5.5 5.5 5.5 5.5 215 5.5 5.5 5.5 5.5 5.5 5.5 5.5 5.5 5.5 5.5 5.5 5.5 5.5 5.5 5.5 5.5 5.5 5.5 5.5 5.5 5.5 230 6.0 6.0 6.0 6.0 6.0 6.0 6.0 6.0 6.0 6.0 6.0 6.0 6.0 6.0 6.0 6.0 6.0 6.0 6.0 6.0 6.0 245 6.0 6.0 6.0 6.0 6.0 6.0 6.0 6.0 6.0 6.0 6.0 6.0 6.0 6.0 6.0 6.0 6.0 6.0 6.0 6.0 6.0 260 6.0 6.0 6.0 6.0 6.0 6.0 6.0 6.0 6.0 6.0 6.0 6.0 6.0 6.0 6.0 6.0 6.0 6.0 6.0 6.0 6.0 275 6.5 6.5 6.5 6.0 6.5 6.5 6.5 6.0 6.5 6.5 6.5 6.5 6.5 6.0 6.5 6.5 6.5 6.0 6.5 6.5 6.5 290 6.5 6.5 6.5 6.5 6.5 6.5 6.5 6.5 6.5 6.5 6.5 6.5 6.5 6.5 6.5 6.5 6.5 6.5 6.5 6.5 6.5 305 6.5 6.5 6.5 6.5 6.5 6.5 6.5 6.5 6.5 6.5 6.5 6.5 6.5 6.5 6.5 6.5 6.5 6.5 6.5 6.5 6.5 320 6.5 6.5 6.5 6.5 6.5 6.5 6.5 6.5 6.5 6.5 6.5 6.5 6.5 6.5 6.5 6.5 6.5 6.5 6.5 6.5 6.5 335 7.0 7.0 7.0 7.0 7.0 7.0 7.0 7.0 7.0 7.0 7.0 7.0 7.0 7.0 7.0 7.0 7.0 7.0 7.0 7.0 7.0 350 7.0 7.0 7.0 7.0 7.0 7.0 7.0 7.0 7.0 7.0 7.0 7.0 7.0 7.0 7.0 7.0 7.0 7.0 7.0 7.0 7.0 365 7.0 7.0 7.0 7.0 7.0 7.0 7.0 7.0 7.0 7.0 7.0 7.0 7.0 7.0 7.0 7.0 7.0 7.0 7.0 7.0 7.0 380 7.5 7.5 7.5 7.5 7.5 7.5 7.5 7.5 7.5 7.5 7.5 7.5 7.5 7.5 7.5 7.5 7.5 7.5 7.5 7.5 7.5 395 7.5 7.5 7.5 7.5 7.5 7.5 7.5 7.5 7.5 7.5 7.5 7.5 7.5 7.5 7.5 7.5 7.5 7.5 7.5 7.5 7.5 410 7.5 7.5 7.5 7.5 7.5 7.5 7.5 7.5 7.5 7.5 7.5 7.5 7.5 7.5 7.5 8.0 8.0 8.0 8.0 8.0 8.0 425 8.0 8.0 8.0 8.0 8.0 8.0 8.0 8.0 8.0 8.0 8.0 8.0 8.0 8.0 8.0 8.0 8.0 8.0 8.0 8.0 8.5 440 8.5 8.5 8.5 8.5 8.5 8.5 8.5 8.5 8.5 8.5 8.5 8.5 8.5 8.5 8.5 8.5 8.5 8.5 8.5 8.5 8.5 455 8.5 8.5 8.5 8.5 8.5 8.5 8.5 8.5 8.5 8.5 8.5 8.5 8.5 9.0 9.0 9.0 9.0 9.0 9.0 9.0 9.0 470 9.0 9.0 9.0 9.0 9.0 9.0 9.0 9.0 9.0 9.0 9.0 9.0 9.0 9.0 9.0 9.5 9.5 9.5 9.5 9.5 9.5 485 9.0 9.0 9.0 9.0 9.0 9.0 9.0 9.0 9.0 9.0 9.0 9.5 9.5 9.5 9.5 9.5 9.5 10.0 10.0 10.0 10.0
HM
A L
ayer
Th
ick
nes
s (m
m)
500 9.5 9.5 9.5 9.5 9.5 9.5 9.5 9.5 9.5 9.5 9.5 9.5 9.5 10.0 10.0 10.0 10.0 10.0 10.5 10.5 10.5

Laboratory Testing and Modeling for Structural Performance of Fully Permeable Pavements Final Report, November 2010
182
Table I.2: Preliminary Stress-to-Strength Ratio at Top of Subgrade, Los Angeles County (HMA-O, no Subbase, E_GB = 60 MPa, Speed = 7 km/h)
Granular Base (GB) Layer Thickness (mm)
500 550 600 650 700 750 800 850 900 950 1000 1050 1100 1150 1200 1250 1300 1350 1400 1450 1500
200 Y Y Y Y Y G G G G G G G G G G G G G G G G 215 Y Y Y Y G G G G G G G G G G G G G G G G G 230 Y Y Y Y G G G G G G G G G G G G G G G G G 245 Y Y Y G G G G G G G G G G G G G G G G G G 260 Y Y G G G G G G G G G G G G G G G G G G G 275 Y Y G G G G G G G G G G G G G G G G G G G 290 Y G G G G G G G G G G G G G G G G G G G G 305 G G G G G G G G G G G G G G G G G G G G G 320 G G G G G G G G G G G G G G G G G G G G G 335 G G G G G G G G G G G G G G G G G G G G G 350 G G G G G G G G G G G G G G G G G G G G G 365 G G G G G G G G G G G G G G G G G G G G G 380 G G G G G G G G G G G G G G G G G G G G G 395 G G G G G G G G G G G G G G G G G G G G G 410 G G G G G G G G G G G G G G G G G G G G G 425 G G G G G G G G G G G G G G G G G G G G G 440 G G G G G G G G G G G G G G G G G G G G G 455 G G G G G G G G G G G G G G G G G G G G G 470 G G G G G G G G G G G G G G G G G G G G G 485 G G G G G G G G G G G G G G G G G G G G G
HM
A L
ayer
Th
ick
nes
s (m
m)
500 G G G G G G G G G G G G G G G G G G G G G Note: G--Stress-to-Strength Ratio <0.3; Y--0.3=<Stress-to-Strength Ratio <=0.7; R--Stress-to-Strength Ratio >0.7

Laboratory Testing and Modeling for Structural Performance of Fully Permeable Pavements Final Report, November 2010
183
Table I.3: Preliminary TI for HMA-O Fatigue Damage=1, Los Angeles County (HMA-O, no Subbase, E_GB = 60 MPa, Speed = 40 km/h)
Granular Base (GB) Layer Thickness (mm)
500 550 600 650 700 750 800 850 900 950 1000 1050 1100 1150 1200 1250 1300 1350 1400 1450 1500
200 6.5 6.5 6.5 6.5 6.5 6.5 6.5 6.5 6.5 6.5 6.5 6.5 6.5 6.5 6.5 6.5 6.5 6.5 6.5 6.5 6.5 215 7.0 7.0 7.0 7.0 7.0 7.0 7.0 7.0 7.0 7.0 7.0 7.0 7.0 7.0 7.0 7.0 7.0 7.0 7.0 7.0 7.0 230 7.0 7.0 7.0 7.0 7.0 7.0 7.0 7.0 7.0 7.0 7.0 7.0 7.0 7.0 7.0 7.0 7.0 7.0 7.0 7.0 7.0 245 7.5 7.5 7.5 7.5 7.5 7.5 7.5 7.5 7.5 7.5 7.5 7.5 7.5 7.5 7.5 7.5 7.5 7.5 7.5 7.5 7.5 260 7.5 7.5 7.5 7.5 7.5 7.5 7.5 7.5 7.5 7.5 7.5 7.5 7.5 7.5 7.5 7.5 7.5 7.5 7.5 7.5 7.5 275 8.0 8.0 8.0 8.0 8.0 8.0 8.0 8.0 8.0 8.0 8.0 8.0 8.0 8.0 8.0 8.0 8.0 8.0 8.0 8.0 8.0 290 8.5 8.5 8.5 8.5 8.5 8.5 8.5 8.5 8.5 8.5 8.5 8.5 8.5 8.5 8.5 8.5 8.5 8.5 8.5 8.5 8.5 305 8.5 8.5 8.5 8.5 8.5 8.5 8.5 8.5 8.5 8.5 8.5 8.5 8.5 8.5 8.5 8.5 8.5 8.5 8.5 8.5 8.5 320 8.5 8.5 8.5 8.5 8.5 8.5 8.5 8.5 8.5 8.5 8.5 8.5 8.5 8.5 8.5 8.5 8.5 8.5 8.5 8.5 8.5 335 9.0 9.0 9.0 9.0 9.0 9.0 9.0 9.0 9.0 9.0 9.0 9.0 9.0 9.0 9.0 9.0 9.0 9.0 9.0 9.0 9.0 350 9.0 9.0 9.0 9.0 9.0 9.0 9.0 9.0 9.0 9.0 9.0 9.0 9.0 9.0 9.0 9.0 9.0 9.0 9.0 9.0 9.0 365 9.0 9.0 9.0 9.0 9.0 9.0 9.0 9.0 9.0 9.0 9.0 9.0 9.0 9.0 9.0 9.0 9.0 9.0 9.0 9.0 9.0 380 9.5 9.5 9.5 9.5 9.5 9.5 9.5 9.5 9.5 9.5 9.5 9.5 9.5 9.5 9.5 9.5 9.5 9.5 9.5 9.5 9.5 395 9.5 9.5 9.5 9.5 9.5 9.5 9.5 9.5 9.5 9.5 9.5 9.5 9.5 9.5 9.5 9.5 9.5 9.5 9.5 9.5 9.5 410 9.5 9.5 9.5 9.5 9.5 9.5 9.5 9.5 9.5 9.5 9.5 9.5 9.5 9.5 9.5 10.0 10.0 10.0 10.0 10.0 10.0 425 10.0 10.0 10.0 10.0 10.0 10.0 10.0 10.0 10.0 10.0 10.0 10.0 10.0 10.0 10.0 10.0 10.0 10.0 10.0 10.0 10.5 440 10.5 10.5 10.5 10.5 10.5 10.5 10.5 10.5 10.5 10.5 10.5 10.5 10.5 10.5 10.5 10.5 10.5 10.5 10.5 10.5 10.5 455 10.5 10.5 10.5 10.5 10.5 10.5 10.5 10.5 10.5 10.5 10.5 10.5 10.5 11.0 11.0 11.0 11.0 11.0 11.0 11.0 11.0 470 11.0 11.0 11.0 11.0 11.0 11.0 11.0 11.0 11.0 11.0 11.0 11.0 11.0 11.0 11.0 11.5 11.5 11.5 11.5 11.5 11.5 485 11.0 11.0 11.0 11.0 11.0 11.0 11.0 11.0 11.0 11.0 11.0 11.5 11.5 11.5 11.5 11.5 11.5 12.0 12.0 12.0 12.0
HM
A L
ayer
Th
ick
nes
s (m
m)
500 11.5 11.5 11.5 11.5 11.5 11.5 11.5 11.5 11.5 11.5 11.5 11.5 11.5 12.0 12.0 12.0 12.0 12.0 12.5 12.5 12.5

Laboratory Testing and Modeling for Structural Performance of Fully Permeable Pavements Final Report, November 2010
184
Table I.4: Preliminary Stress-to-Strength Ratio at Top of Subgrade, Los Angeles County (HMA-O, no Subbase, E_GB = 60 MPa, Speed = 40 km/h)
Granular Base (GB) Layer Thickness (mm)
500 550 600 650 700 750 800 850 900 950 1000 1050 1100 1150 1200 1250 1300 1350 1400 1450 1500
200 Y G G G G G G G G G G G G G G G G G G G G 215 Y G G G G G G G G G G G G G G G G G G G G 230 G G G G G G G G G G G G G G G G G G G G G 245 G G G G G G G G G G G G G G G G G G G G G 260 G G G G G G G G G G G G G G G G G G G G G 275 G G G G G G G G G G G G G G G G G G G G G 290 G G G G G G G G G G G G G G G G G G G G G 305 G G G G G G G G G G G G G G G G G G G G G 320 G G G G G G G G G G G G G G G G G G G G G 335 G G G G G G G G G G G G G G G G G G G G G 350 G G G G G G G G G G G G G G G G G G G G G 365 G G G G G G G G G G G G G G G G G G G G G 380 G G G G G G G G G G G G G G G G G G G G G 395 G G G G G G G G G G G G G G G G G G G G G 410 G G G G G G G G G G G G G G G G G G G G G 425 G G G G G G G G G G G G G G G G G G G G G 440 G G G G G G G G G G G G G G G G G G G G G 455 G G G G G G G G G G G G G G G G G G G G G 470 G G G G G G G G G G G G G G G G G G G G G 485 G G G G G G G G G G G G G G G G G G G G G
HM
A L
ayer
Th
ick
nes
s (m
m)
500 G G G G G G G G G G G G G G G G G G G G G Note: G--Stress-to-Strength Ratio <0.3; Y--0.3=<Stress-to-Strength Ratio <=0.7; R--Stress-to-Strength Ratio >0.7
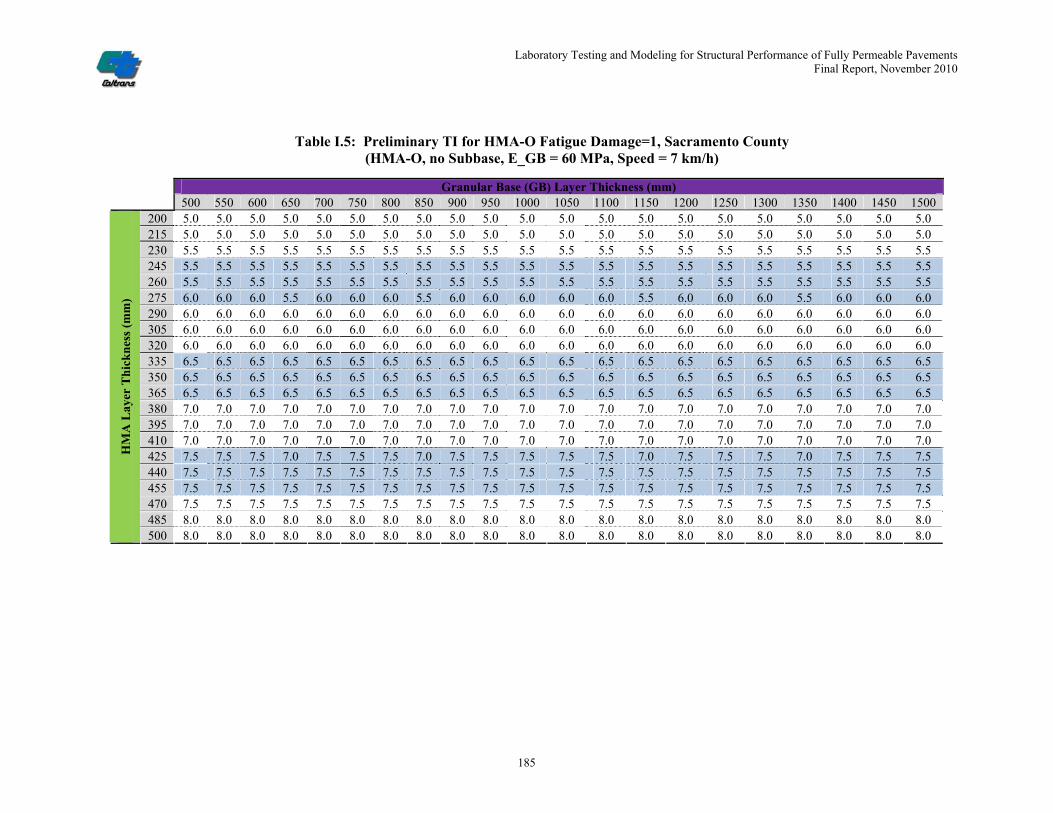
Laboratory Testing and Modeling for Structural Performance of Fully Permeable Pavements Final Report, November 2010
185
Table I.5: Preliminary TI for HMA-O Fatigue Damage=1, Sacramento County (HMA-O, no Subbase, E_GB = 60 MPa, Speed = 7 km/h)
Granular Base (GB) Layer Thickness (mm)
500 550 600 650 700 750 800 850 900 950 1000 1050 1100 1150 1200 1250 1300 1350 1400 1450 1500
200 5.0 5.0 5.0 5.0 5.0 5.0 5.0 5.0 5.0 5.0 5.0 5.0 5.0 5.0 5.0 5.0 5.0 5.0 5.0 5.0 5.0 215 5.0 5.0 5.0 5.0 5.0 5.0 5.0 5.0 5.0 5.0 5.0 5.0 5.0 5.0 5.0 5.0 5.0 5.0 5.0 5.0 5.0 230 5.5 5.5 5.5 5.5 5.5 5.5 5.5 5.5 5.5 5.5 5.5 5.5 5.5 5.5 5.5 5.5 5.5 5.5 5.5 5.5 5.5 245 5.5 5.5 5.5 5.5 5.5 5.5 5.5 5.5 5.5 5.5 5.5 5.5 5.5 5.5 5.5 5.5 5.5 5.5 5.5 5.5 5.5 260 5.5 5.5 5.5 5.5 5.5 5.5 5.5 5.5 5.5 5.5 5.5 5.5 5.5 5.5 5.5 5.5 5.5 5.5 5.5 5.5 5.5 275 6.0 6.0 6.0 5.5 6.0 6.0 6.0 5.5 6.0 6.0 6.0 6.0 6.0 5.5 6.0 6.0 6.0 5.5 6.0 6.0 6.0 290 6.0 6.0 6.0 6.0 6.0 6.0 6.0 6.0 6.0 6.0 6.0 6.0 6.0 6.0 6.0 6.0 6.0 6.0 6.0 6.0 6.0 305 6.0 6.0 6.0 6.0 6.0 6.0 6.0 6.0 6.0 6.0 6.0 6.0 6.0 6.0 6.0 6.0 6.0 6.0 6.0 6.0 6.0 320 6.0 6.0 6.0 6.0 6.0 6.0 6.0 6.0 6.0 6.0 6.0 6.0 6.0 6.0 6.0 6.0 6.0 6.0 6.0 6.0 6.0 335 6.5 6.5 6.5 6.5 6.5 6.5 6.5 6.5 6.5 6.5 6.5 6.5 6.5 6.5 6.5 6.5 6.5 6.5 6.5 6.5 6.5 350 6.5 6.5 6.5 6.5 6.5 6.5 6.5 6.5 6.5 6.5 6.5 6.5 6.5 6.5 6.5 6.5 6.5 6.5 6.5 6.5 6.5 365 6.5 6.5 6.5 6.5 6.5 6.5 6.5 6.5 6.5 6.5 6.5 6.5 6.5 6.5 6.5 6.5 6.5 6.5 6.5 6.5 6.5 380 7.0 7.0 7.0 7.0 7.0 7.0 7.0 7.0 7.0 7.0 7.0 7.0 7.0 7.0 7.0 7.0 7.0 7.0 7.0 7.0 7.0 395 7.0 7.0 7.0 7.0 7.0 7.0 7.0 7.0 7.0 7.0 7.0 7.0 7.0 7.0 7.0 7.0 7.0 7.0 7.0 7.0 7.0 410 7.0 7.0 7.0 7.0 7.0 7.0 7.0 7.0 7.0 7.0 7.0 7.0 7.0 7.0 7.0 7.0 7.0 7.0 7.0 7.0 7.0 425 7.5 7.5 7.5 7.0 7.5 7.5 7.5 7.0 7.5 7.5 7.5 7.5 7.5 7.0 7.5 7.5 7.5 7.0 7.5 7.5 7.5 440 7.5 7.5 7.5 7.5 7.5 7.5 7.5 7.5 7.5 7.5 7.5 7.5 7.5 7.5 7.5 7.5 7.5 7.5 7.5 7.5 7.5 455 7.5 7.5 7.5 7.5 7.5 7.5 7.5 7.5 7.5 7.5 7.5 7.5 7.5 7.5 7.5 7.5 7.5 7.5 7.5 7.5 7.5 470 7.5 7.5 7.5 7.5 7.5 7.5 7.5 7.5 7.5 7.5 7.5 7.5 7.5 7.5 7.5 7.5 7.5 7.5 7.5 7.5 7.5 485 8.0 8.0 8.0 8.0 8.0 8.0 8.0 8.0 8.0 8.0 8.0 8.0 8.0 8.0 8.0 8.0 8.0 8.0 8.0 8.0 8.0
HM
A L
ayer
Th
ick
nes
s (m
m)
500 8.0 8.0 8.0 8.0 8.0 8.0 8.0 8.0 8.0 8.0 8.0 8.0 8.0 8.0 8.0 8.0 8.0 8.0 8.0 8.0 8.0

Laboratory Testing and Modeling for Structural Performance of Fully Permeable Pavements Final Report, November 2010
186
Table I.6: Preliminary Stress-to-Strength Ratio at Top of Subgrade, Sacramento County (HMA-O, no Subbase, E_GB = 60 MPa, Speed = 7 km/h)
Granular Base (GB) Layer Thickness (mm)
500 550 600 650 700 750 800 850 900 950 1000 1050 1100 1150 1200 1250 1300 1350 1400 1450 1500
200 Y Y Y Y Y G G G G G G G G G G G G G G G G 215 Y Y Y Y Y G G G G G G G G G G G G G G G G 230 Y Y Y Y G G G G G G G G G G G G G G G G G 245 Y Y Y Y G G G G G G G G G G G G G G G G G 260 Y Y Y G G G G G G G G G G G G G G G G G G 275 Y Y G G G G G G G G G G G G G G G G G G G 290 Y Y G G G G G G G G G G G G G G G G G G G 305 Y G G G G G G G G G G G G G G G G G G G G 320 G G G G G G G G G G G G G G G G G G G G G 335 G G G G G G G G G G G G G G G G G G G G G 350 G G G G G G G G G G G G G G G G G G G G G 365 G G G G G G G G G G G G G G G G G G G G G 380 G G G G G G G G G G G G G G G G G G G G G 395 G G G G G G G G G G G G G G G G G G G G G 410 G G G G G G G G G G G G G G G G G G G G G 425 G G G G G G G G G G G G G G G G G G G G G 440 G G G G G G G G G G G G G G G G G G G G G 455 G G G G G G G G G G G G G G G G G G G G G 470 G G G G G G G G G G G G G G G G G G G G G 485 G G G G G G G G G G G G G G G G G G G G G
HM
A L
ayer
Th
ick
nes
s (m
m)
500 G G G G G G G G G G G G G G G G G G G G G Note: G--Stress-to-Strength Ratio <0.3; Y--0.3=<Stress-to-Strength Ratio <=0.7; R--Stress-to-Strength Ratio >0.7

Laboratory Testing and Modeling for Structural Performance of Fully Permeable Pavements Final Report, November 2010
187
Table I.7: Preliminary TI for HMA-O Fatigue Damage=1, Sacramento County (HMA-O, no Subbase, E_GB = 60 MPa, Speed = 40 km/h)
Granular Base (GB) Layer Thickness (mm)
500 550 600 650 700 750 800 850 900 950 1000 1050 1100 1150 1200 1250 1300 1350 1400 1450 1500
200 4.0 4.0 4.0 4.0 4.0 4.0 4.0 4.0 4.0 4.0 4.0 4.0 4.0 4.0 4.0 4.0 4.0 4.0 4.0 4.0 4.0 215 4.0 4.0 4.0 4.0 4.0 4.0 4.0 4.0 4.0 4.0 4.0 4.0 4.0 4.0 4.0 4.0 4.0 4.0 4.0 4.0 4.0 230 3.5 3.5 3.5 3.5 3.5 3.5 3.5 3.5 3.5 3.5 3.5 3.5 3.5 3.5 3.5 3.5 3.5 3.5 3.5 3.5 3.5 245 3.5 3.5 3.5 3.5 3.5 3.5 3.5 3.5 3.5 3.5 3.5 3.5 3.5 3.5 3.5 3.5 3.5 3.5 3.5 3.5 3.5 260 3.5 3.5 3.5 3.5 3.5 3.5 3.5 3.5 3.5 3.5 3.5 3.5 3.5 3.5 3.5 3.5 3.5 3.5 3.5 3.5 3.5 275 3.5 3.5 3.5 3.0 3.5 3.5 3.5 3.0 3.5 3.5 3.5 3.5 3.5 3.0 3.5 3.5 3.5 3.0 3.5 3.5 3.5 290 3.0 3.0 3.0 3.0 3.0 3.0 3.0 3.0 3.0 3.0 3.0 3.0 3.0 3.0 3.0 3.0 3.0 3.0 3.0 3.0 3.0 305 3.0 3.0 3.0 3.0 3.0 3.0 3.0 3.0 3.0 3.0 3.0 3.0 3.0 3.0 3.0 3.0 3.0 3.0 3.0 3.0 3.0 320 3.0 3.0 3.0 3.0 3.0 3.0 3.0 3.0 3.0 3.0 3.0 3.0 3.0 3.0 3.0 3.0 3.0 3.0 3.0 3.0 3.0 335 3.0 3.0 3.0 3.0 3.0 3.0 3.0 3.0 3.0 3.0 3.0 3.0 3.0 3.0 3.0 3.0 3.0 3.0 3.0 3.0 3.0 350 3.0 3.0 3.0 3.0 3.0 3.0 3.0 3.0 3.0 3.0 3.0 3.0 3.0 3.0 3.0 3.0 3.0 3.0 3.0 3.0 3.0 365 3.0 3.0 3.0 3.0 3.0 3.0 3.0 3.0 3.0 3.0 3.0 3.0 3.0 3.0 3.0 3.0 3.0 3.0 3.0 3.0 3.0 380 3.0 3.0 3.0 3.0 3.0 3.0 3.0 3.0 3.0 3.0 3.0 3.0 3.0 3.0 3.0 3.0 3.0 3.0 3.0 3.0 3.0 395 3.0 3.0 3.0 3.0 3.0 3.0 3.0 3.0 3.0 3.0 3.0 3.0 3.0 3.0 3.0 3.0 3.0 3.0 3.0 3.0 3.0 410 3.0 3.0 3.0 3.0 3.0 3.0 3.0 3.0 3.0 3.0 3.0 3.0 3.0 3.0 3.0 3.0 3.0 3.0 3.0 3.0 3.0 425 3.0 3.0 3.0 3.0 3.0 3.0 3.0 3.0 3.0 3.0 3.0 3.0 3.0 3.0 3.0 3.0 3.0 3.0 3.0 3.0 3.0 440 3.0 3.0 3.0 3.0 3.0 3.0 3.0 3.0 3.0 3.0 3.0 3.0 3.0 3.0 3.0 3.0 3.0 3.0 3.0 3.0 3.0 455 3.0 3.0 3.0 3.0 3.0 3.0 3.0 3.0 3.0 3.0 3.0 3.0 3.0 3.0 3.0 3.0 3.0 3.0 3.0 3.0 3.0 470 3.0 3.0 3.0 3.0 3.0 3.0 3.0 3.0 3.0 3.0 3.0 3.0 3.0 3.0 3.0 3.0 3.0 3.0 3.0 3.0 3.0 485 3.0 3.0 3.0 3.0 3.0 3.0 3.0 3.0 3.0 3.0 3.0 3.0 3.0 3.0 3.0 3.0 3.0 3.0 3.0 3.0 3.0
HM
A L
ayer
Th
ick
nes
s (m
m)
500 3.0 3.0 3.0 3.0 3.0 3.0 3.0 3.0 3.0 3.0 3.0 3.0 3.0 3.0 3.0 3.0 3.0 3.0 3.0 3.0 3.0

Laboratory Testing and Modeling for Structural Performance of Fully Permeable Pavements Final Report, November 2010
188
Table I.8: Preliminary Stress-to-Strength Ratio at Top of Subgrade, Sacramento County (HMA-O, no Subbase, E_GB = 60 MPa, Speed = 40 km/h)
Granular Base (GB) Layer Thickness (mm)
500 550 600 650 700 750 800 850 900 950 1000 1050 1100 1150 1200 1250 1300 1350 1400 1450 1500
200 Y Y Y Y Y G G G G G G G G G G G G G G G G 215 Y Y Y Y Y G G G G G G G G G G G G G G G G 230 Y Y Y Y Y G G G G G G G G G G G G G G G G 245 Y Y Y Y G G G G G G G G G G G G G G G G G 260 Y Y Y Y G G G G G G G G G G G G G G G G G 275 Y Y Y G G G G G G G G G G G G G G G G G G 290 Y Y Y G G G G G G G G G G G G G G G G G G 305 Y Y Y G G G G G G G G G G G G G G G G G G 320 Y Y G G G G G G G G G G G G G G G G G G G 335 Y Y G G G G G G G G G G G G G G G G G G G 350 Y G G G G G G G G G G G G G G G G G G G G 365 Y G G G G G G G G G G G G G G G G G G G G 380 G G G G G G G G G G G G G G G G G G G G G 395 G G G G G G G G G G G G G G G G G G G G G 410 G G G G G G G G G G G G G G G G G G G G G 425 G G G G G G G G G G G G G G G G G G G G G 440 G G G G G G G G G G G G G G G G G G G G G 455 G G G G G G G G G G G G G G G G G G G G G 470 G G G G G G G G G G G G G G G G G G G G G 485 G G G G G G G G G G G G G G G G G G G G G
HM
A L
ayer
Th
ick
nes
s (m
m)
500 G G G G G G G G G G G G G G G G G G G G G Note: G--Stress-to-Strength Ratio <0.3; Y--0.3=<Stress-to-Strength Ratio <=0.7; R--Stress-to-Strength Ratio >0.7

Laboratory Testing and Modeling for Structural Performance of Fully Permeable Pavements Final Report, November 2010
189
Appendix J: Preliminary Structural Design Tables for HMA-O Surfaces, with Subbase
Table J.1: Preliminary TI for HMA-O Fatigue Damage=1, Los Angeles County (HMA-O, with Subbase, E_GB = 60 MPa, Speed = 7 km/h)
Granular Base (GB) Layer Thickness (mm)
500 550 600 650 700 750 800 850 900 950 1000 1050 1100 1150 1200 1250 1300 1350 1400 1450 1500
200 5.5 5.5 5.5 5.5 5.5 5.5 5.5 5.5 5.5 5.5 5.5 5.5 5.5 5.5 5.5 5.5 5.5 5.5 5.5 5.5 5.5 215 5.5 5.5 5.5 5.5 5.5 5.5 5.5 5.5 5.5 5.5 5.5 5.5 5.5 5.5 5.5 5.5 5.5 5.5 5.5 5.5 5.5 230 6.0 6.0 6.0 6.0 6.0 6.0 6.0 6.0 6.0 6.0 6.0 6.0 6.0 6.0 6.0 6.0 6.0 6.0 6.0 6.0 6.0 245 6.0 6.0 6.0 6.0 6.0 6.0 6.0 6.0 6.0 6.0 6.0 6.0 6.0 6.0 6.0 6.0 6.0 6.0 6.0 6.0 6.0 260 6.0 6.0 6.0 6.0 6.0 6.0 6.0 6.0 6.0 6.0 6.0 6.0 6.0 6.0 6.0 6.0 6.0 6.0 6.0 6.0 6.0 275 6.5 6.5 6.5 6.0 6.5 6.5 6.5 6.0 6.5 6.5 6.5 6.5 6.5 6.0 6.5 6.5 6.5 6.0 6.5 6.5 6.5 290 6.5 6.5 6.5 6.5 6.5 6.5 6.5 6.5 6.5 6.5 6.5 6.5 6.5 6.5 6.5 6.5 6.5 6.5 6.5 6.5 6.5 305 6.5 6.5 6.5 6.5 6.5 6.5 6.5 6.5 6.5 6.5 6.5 6.5 6.5 6.5 6.5 6.5 6.5 6.5 6.5 6.5 6.5 320 6.5 6.5 6.5 6.5 6.5 6.5 6.5 6.5 6.5 6.5 6.5 6.5 6.5 6.5 6.5 6.5 6.5 6.5 6.5 6.5 6.5 335 7.0 7.0 7.0 7.0 7.0 7.0 7.0 7.0 7.0 7.0 7.0 7.0 7.0 7.0 7.0 7.0 7.0 7.0 7.0 7.0 7.0 350 7.0 7.0 7.0 7.0 7.0 7.0 7.0 7.0 7.0 7.0 7.0 7.0 7.0 7.0 7.0 7.0 7.0 7.0 7.0 7.0 7.0 365 7.0 7.0 7.0 7.0 7.0 7.0 7.0 7.0 7.0 7.0 7.0 7.0 7.0 7.0 7.0 7.0 7.0 7.0 7.0 7.0 7.0 380 7.5 7.5 7.5 7.5 7.5 7.5 7.5 7.5 7.5 7.5 7.5 7.5 7.5 7.5 7.5 7.5 7.5 7.5 7.5 7.5 7.5 395 7.5 7.5 7.5 7.5 7.5 7.5 7.5 7.5 7.5 7.5 7.5 7.5 7.5 7.5 7.5 7.5 7.5 7.5 7.5 7.5 7.5 410 7.5 7.5 7.5 7.5 7.5 7.5 7.5 7.5 7.5 7.5 7.5 7.5 7.5 7.5 7.5 8.0 8.0 8.0 8.0 8.0 8.0 425 8.0 8.0 8.0 8.0 8.0 8.0 8.0 8.0 8.0 8.0 8.0 8.0 8.0 8.0 8.0 8.0 8.0 8.0 8.0 8.0 8.5 440 8.5 8.5 8.5 8.5 8.5 8.5 8.5 8.5 8.5 8.5 8.5 8.5 8.5 8.5 8.5 8.5 8.5 8.5 8.5 8.5 8.5 455 8.5 8.5 8.5 8.5 8.5 8.5 8.5 8.5 8.5 8.5 8.5 8.5 8.5 9.0 9.0 9.0 9.0 9.0 9.0 9.0 9.0 470 9.0 9.0 9.0 9.0 9.0 9.0 9.0 9.0 9.0 9.0 9.0 9.0 9.0 9.0 9.0 9.5 9.5 9.5 9.5 9.5 9.5 485 9.0 9.0 9.0 9.0 9.0 9.0 9.0 9.0 9.0 9.0 9.0 9.5 9.5 9.5 9.5 9.5 9.5 10.0 10.0 10.0 10.0
HM
A L
ayer
Th
ick
nes
s (m
m)
500 9.5 9.5 9.5 9.5 9.5 9.5 9.5 9.5 9.5 9.5 9.5 9.5 9.5 10.0 10.0 10.0 10.0 10.0 10.5 10.5 10.5

Laboratory Testing and Modeling for Structural Performance of Fully Permeable Pavements Final Report, November 2010
190
Table J.2: Preliminary Stress-to-Strength Ratio at Top of Subgrade, Los Angeles County (HMA-O, with Subbase, E_GB = 60 MPa, Speed = 7 km/h)
Granular Base (GB) Layer Thickness (mm)
500 550 600 650 700 750 800 850 900 950 1000 1050 1100 1150 1200 1250 1300 1350 1400 1450 1500
200 G G G G G G G G G G G G G G G G G G G G G 215 G G G G G G G G G G G G G G G G G G G G G 230 G G G G G G G G G G G G G G G G G G G G G 245 G G G G G G G G G G G G G G G G G G G G G 260 G G G G G G G G G G G G G G G G G G G G G 275 G G G G G G G G G G G G G G G G G G G G G 290 G G G G G G G G G G G G G G G G G G G G G 305 G G G G G G G G G G G G G G G G G G G G G 320 G G G G G G G G G G G G G G G G G G G G G 335 G G G G G G G G G G G G G G G G G G G G G 350 G G G G G G G G G G G G G G G G G G G G G 365 G G G G G G G G G G G G G G G G G G G G G 380 G G G G G G G G G G G G G G G G G G G G G 395 G G G G G G G G G G G G G G G G G G G G G 410 G G G G G G G G G G G G G G G G G G G G G 425 G G G G G G G G G G G G G G G G G G G G G 440 G G G G G G G G G G G G G G G G G G G G G 455 G G G G G G G G G G G G G G G G G G G G G 470 G G G G G G G G G G G G G G G G G G G G G 485 G G G G G G G G G G G G G G G G G G G G G
HM
A L
ayer
Th
ick
nes
s (m
m)
500 G G G G G G G G G G G G G G G G G G G G G Note: G--Stress-to-Strength Ratio <0.3; Y--0.3=<Stress-to-Strength Ratio <=0.7; R--Stress-to-Strength Ratio >0.7

Laboratory Testing and Modeling for Structural Performance of Fully Permeable Pavements Final Report, November 2010
191
Table J.3: Preliminary TI for HMA-O Fatigue Damage=1, Los Angeles County (HMA-O, with Subbase, E_GB = 60 MPa, Speed = 40 km/h)
Granular Base (GB) Layer Thickness (mm)
500 550 600 650 700 750 800 850 900 950 1000 1050 1100 1150 1200 1250 1300 1350 1400 1450 1500
200 6.5 6.5 6.5 6.5 6.5 6.5 6.5 6.5 6.5 6.5 6.5 6.5 6.5 6.5 6.5 6.5 6.5 6.5 6.5 6.5 6.5 215 7.0 7.0 7.0 7.0 7.0 7.0 7.0 7.0 7.0 7.0 7.0 7.0 7.0 7.0 7.0 7.0 7.0 7.0 7.0 7.0 7.0 230 7.0 7.0 7.0 7.0 7.0 7.0 7.0 7.0 7.0 7.0 7.0 7.0 7.0 7.0 7.0 7.0 7.0 7.0 7.0 7.0 7.0 245 7.5 7.5 7.5 7.5 7.5 7.5 7.5 7.5 7.5 7.5 7.5 7.5 7.5 7.5 7.5 7.5 7.5 7.5 7.5 7.5 7.5 260 7.5 7.5 7.5 7.5 7.5 7.5 7.5 7.5 7.5 7.5 7.5 7.5 7.5 7.5 7.5 7.5 7.5 7.5 7.5 7.5 7.5 275 8.0 8.0 8.0 8.0 8.0 8.0 8.0 8.0 8.0 8.0 8.0 8.0 8.0 8.0 8.0 8.0 8.0 8.0 8.0 8.0 8.0 290 8.5 8.5 8.5 8.5 8.5 8.5 8.5 8.5 8.5 8.5 8.5 8.5 8.5 8.5 8.5 8.5 8.5 8.5 8.5 8.5 8.5 305 8.5 8.5 8.5 8.5 8.5 8.5 8.5 8.5 8.5 8.5 8.5 8.5 8.5 8.5 8.5 8.5 8.5 8.5 8.5 8.5 8.5 320 8.5 8.5 8.5 8.5 8.5 8.5 8.5 8.5 8.5 8.5 8.5 8.5 8.5 8.5 8.5 8.5 8.5 8.5 8.5 8.5 8.5 335 9.0 9.0 9.0 9.0 9.0 9.0 9.0 9.0 9.0 9.0 9.0 9.0 9.0 9.0 9.0 9.0 9.0 9.0 9.0 9.0 9.0 350 9.0 9.0 9.0 9.0 9.0 9.0 9.0 9.0 9.0 9.0 9.0 9.0 9.0 9.0 9.0 9.0 9.0 9.0 9.0 9.0 9.0 365 9.0 9.0 9.0 9.0 9.0 9.0 9.0 9.0 9.0 9.0 9.0 9.0 9.0 9.0 9.0 9.0 9.0 9.0 9.0 9.0 9.0 380 9.5 9.5 9.5 9.5 9.5 9.5 9.5 9.5 9.5 9.5 9.5 9.5 9.5 9.5 9.5 9.5 9.5 9.5 9.5 9.5 9.5 395 9.5 9.5 9.5 9.5 9.5 9.5 9.5 9.5 9.5 9.5 9.5 9.5 9.5 9.5 9.5 9.5 9.5 9.5 9.5 9.5 9.5 410 9.5 9.5 9.5 9.5 9.5 9.5 9.5 9.5 9.5 9.5 9.5 9.5 9.5 10.0 10.0 10.0 10.0 10.0 10.0 10.0 10.0 425 10.0 10.0 10.0 10.0 10.0 10.0 10.0 10.0 10.0 10.0 10.0 10.0 10.0 10.0 10.0 10.5 10.5 10.5 10.5 10.5 10.5 440 10.5 10.5 10.5 10.5 10.5 10.5 10.5 10.5 10.5 10.5 10.5 10.5 10.5 10.5 10.5 10.5 11.0 11.0 11.0 11.0 11.0 455 10.5 10.5 10.5 10.5 10.5 10.5 10.5 10.5 10.5 10.5 10.5 10.5 11.0 11.0 11.0 11.0 11.5 11.5 11.5 11.5 11.5 470 11.0 11.0 11.0 11.0 11.0 11.0 11.0 11.0 11.0 11.0 11.0 11.0 11.0 11.5 11.5 11.5 11.5 12.0 12.0 12.0 12.5 485 11.0 11.0 11.0 11.0 11.0 11.0 11.0 11.0 11.0 11.0 11.0 11.5 11.5 11.5 12.0 12.0 12.0 12.5 12.5 12.5 13.0
HM
A L
ayer
Th
ick
nes
s (m
m)
500 11.5 11.5 11.5 11.5 11.5 11.5 11.5 11.5 11.5 11.5 11.5 11.5 12.0 12.0 12.5 12.5 12.5 13.0 13.0 13.5 13.5

Laboratory Testing and Modeling for Structural Performance of Fully Permeable Pavements Final Report, November 2010
192
Table J.4: Preliminary Stress-to-Strength Ratio at Top of Subgrade, Los Angeles County (HMA-O, with Subbase, E_GB = 60 MPa, Speed = 40 km/h)
Granular Base (GB) Layer Thickness (mm)
500 550 600 650 700 750 800 850 900 950 1000 1050 1100 1150 1200 1250 1300 1350 1400 1450 1500
200 G G G G G G G G G G G G G G G G G G G G G 215 G G G G G G G G G G G G G G G G G G G G G 230 G G G G G G G G G G G G G G G G G G G G G 245 G G G G G G G G G G G G G G G G G G G G G 260 G G G G G G G G G G G G G G G G G G G G G 275 G G G G G G G G G G G G G G G G G G G G G 290 G G G G G G G G G G G G G G G G G G G G G 305 G G G G G G G G G G G G G G G G G G G G G 320 G G G G G G G G G G G G G G G G G G G G G 335 G G G G G G G G G G G G G G G G G G G G G 350 G G G G G G G G G G G G G G G G G G G G G 365 G G G G G G G G G G G G G G G G G G G G G 380 G G G G G G G G G G G G G G G G G G G G G 395 G G G G G G G G G G G G G G G G G G G G G 410 G G G G G G G G G G G G G G G G G G G G G 425 G G G G G G G G G G G G G G G G G G G G G 440 G G G G G G G G G G G G G G G G G G G G G 455 G G G G G G G G G G G G G G G G G G G G G 470 G G G G G G G G G G G G G G G G G G G G G 485 G G G G G G G G G G G G G G G G G G G G G
HM
A L
ayer
Th
ick
nes
s (m
m)
500 G G G G G G G G G G G G G G G G G G G G G Note: G--Stress-to-Strength Ratio <0.3; Y--0.3=<Stress-to-Strength Ratio <=0.7; R--Stress-to-Strength Ratio >0.7

Laboratory Testing and Modeling for Structural Performance of Fully Permeable Pavements Final Report, November 2010
193
Table J.5: Preliminary TI for HMA-O Fatigue Damage=1, Sacramento County (HMA-O, with Subbase, E_GB = 60 MPa, Speed = 7 km/h)
Granular Base (GB) Layer Thickness (mm)
500 550 600 650 700 750 800 850 900 950 1000 1050 1100 1150 1200 1250 1300 1350 1400 1450 1500
200 5.0 5.0 5.0 5.0 5.0 5.0 5.0 5.0 5.0 5.0 5.0 5.0 5.0 5.0 5.0 5.0 5.0 5.0 5.0 5.0 5.0 215 5.0 5.0 5.0 5.0 5.0 5.0 5.0 5.0 5.0 5.0 5.0 5.0 5.0 5.0 5.0 5.0 5.0 5.0 5.0 5.0 5.0 230 5.5 5.5 5.5 5.5 5.5 5.5 5.5 5.5 5.5 5.5 5.5 5.5 5.5 5.5 5.5 5.5 5.5 5.5 5.5 5.5 5.5 245 5.5 5.5 5.5 5.5 5.5 5.5 5.5 5.5 5.5 5.5 5.5 5.5 5.5 5.5 5.5 5.5 5.5 5.5 5.5 5.5 5.5 260 5.5 5.5 5.5 5.5 5.5 5.5 5.5 5.5 5.5 5.5 5.5 5.5 5.5 5.5 5.5 5.5 5.5 5.5 5.5 5.5 5.5 275 6.0 6.0 6.0 5.5 6.0 6.0 6.0 5.5 6.0 6.0 6.0 6.0 6.0 5.5 6.0 6.0 6.0 5.5 6.0 6.0 6.0 290 6.0 6.0 6.0 6.0 6.0 6.0 6.0 6.0 6.0 6.0 6.0 6.0 6.0 6.0 6.0 6.0 6.0 6.0 6.0 6.0 6.0 305 6.0 6.0 6.0 6.0 6.0 6.0 6.0 6.0 6.0 6.0 6.0 6.0 6.0 6.0 6.0 6.0 6.0 6.0 6.0 6.0 6.0 320 6.0 6.0 6.0 6.0 6.0 6.0 6.0 6.0 6.0 6.0 6.0 6.0 6.0 6.0 6.0 6.0 6.0 6.0 6.0 6.0 6.0 335 6.5 6.5 6.5 6.5 6.5 6.5 6.5 6.5 6.5 6.5 6.5 6.5 6.5 6.5 6.5 6.5 6.5 6.5 6.5 6.5 6.5 350 6.5 6.5 6.5 6.5 6.5 6.5 6.5 6.5 6.5 6.5 6.5 6.5 6.5 6.5 6.5 6.5 6.5 6.5 6.5 6.5 6.5 365 6.5 6.5 6.5 6.5 6.5 6.5 6.5 6.5 6.5 6.5 6.5 6.5 6.5 6.5 6.5 6.5 6.5 6.5 6.5 6.5 6.5 380 7.0 7.0 7.0 7.0 7.0 7.0 7.0 7.0 7.0 7.0 7.0 7.0 7.0 7.0 7.0 7.0 7.0 7.0 7.0 7.0 7.0 395 7.0 7.0 7.0 7.0 7.0 7.0 7.0 7.0 7.0 7.0 7.0 7.0 7.0 7.0 7.0 7.0 7.0 7.0 7.0 7.0 7.0 410 7.0 7.0 7.0 7.0 7.0 7.0 7.0 7.0 7.0 7.0 7.0 7.0 7.0 7.0 7.0 7.0 7.0 7.0 7.0 7.0 7.0 425 7.5 7.5 7.5 7.0 7.5 7.5 7.5 7.0 7.5 7.5 7.5 7.5 7.5 7.0 7.5 7.5 7.5 7.0 7.5 7.5 7.5 440 7.5 7.5 7.5 7.5 7.5 7.5 7.5 7.5 7.5 7.5 7.5 7.5 7.5 7.5 7.5 7.5 7.5 7.5 7.5 7.5 7.5 455 7.5 7.5 7.5 7.5 7.5 7.5 7.5 7.5 7.5 7.5 7.5 7.5 7.5 7.5 7.5 7.5 7.5 7.5 7.5 7.5 7.5 470 7.5 7.5 7.5 7.5 7.5 7.5 7.5 7.5 7.5 7.5 7.5 7.5 7.5 7.5 7.5 7.5 7.5 7.5 7.5 7.5 7.5 485 8.0 8.0 8.0 8.0 8.0 8.0 8.0 8.0 8.0 8.0 8.0 8.0 8.0 8.0 8.0 8.0 8.0 8.0 8.0 8.0 8.0
HM
A L
ayer
Th
ick
nes
s (m
m)
500 8.0 8.0 8.0 8.0 8.0 8.0 8.0 8.0 8.0 8.0 8.0 8.0 8.0 8.0 8.0 8.0 8.0 8.0 8.0 8.0 8.0

Laboratory Testing and Modeling for Structural Performance of Fully Permeable Pavements Final Report, November 2010
194
Table J.6: Preliminary Stress-to-Strength Ratio at Top of Subgrade, Sacramento County (HMA-O, with Subbase, E_GB = 60 MPa, Speed = 7 km/h)
Granular Base (GB) Layer Thickness (mm)
500 550 600 650 700 750 800 850 900 950 1000 1050 1100 1150 1200 1250 1300 1350 1400 1450 1500
200 G G G G G G G G G G G G G G G G G G G G G 215 G G G G G G G G G G G G G G G G G G G G G 230 G G G G G G G G G G G G G G G G G G G G G 245 G G G G G G G G G G G G G G G G G G G G G 260 G G G G G G G G G G G G G G G G G G G G G 275 G G G G G G G G G G G G G G G G G G G G G 290 G G G G G G G G G G G G G G G G G G G G G 305 G G G G G G G G G G G G G G G G G G G G G 320 G G G G G G G G G G G G G G G G G G G G G 335 G G G G G G G G G G G G G G G G G G G G G 350 G G G G G G G G G G G G G G G G G G G G G 365 G G G G G G G G G G G G G G G G G G G G G 380 G G G G G G G G G G G G G G G G G G G G G 395 G G G G G G G G G G G G G G G G G G G G G 410 G G G G G G G G G G G G G G G G G G G G G 425 G G G G G G G G G G G G G G G G G G G G G 440 G G G G G G G G G G G G G G G G G G G G G 455 G G G G G G G G G G G G G G G G G G G G G 470 G G G G G G G G G G G G G G G G G G G G G 485 G G G G G G G G G G G G G G G G G G G G G
HM
A L
ayer
Th
ick
nes
s (m
m)
500 G G G G G G G G G G G G G G G G G G G G G Note: G--Stress-to-Strength Ratio <0.3; Y--0.3=<Stress-to-Strength Ratio <=0.7; R--Stress-to-Strength Ratio >0.7

Laboratory Testing and Modeling for Structural Performance of Fully Permeable Pavements Final Report, November 2010
195
Table J.7: Preliminary TI for HMA-O Fatigue Damage=1, Sacramento County (HMA-O, with Subbase, E_GB = 60 MPa, Speed = 40 km/h)
Granular Base (GB) Layer Thickness (mm)
500 550 600 650 700 750 800 850 900 950 1000 1050 1100 1150 1200 1250 1300 1350 1400 1450 1500
200 5.0 5.0 5.0 5.0 5.0 5.0 5.0 5.0 5.0 5.0 5.0 5.0 5.0 5.0 5.0 5.0 5.0 5.0 5.0 5.0 5.0 215 5.0 5.0 5.0 5.0 5.0 5.0 5.0 5.0 5.0 5.0 5.0 5.0 5.0 5.0 5.0 5.0 5.0 5.0 5.0 5.0 5.0 230 5.5 5.5 5.5 5.5 5.5 5.5 5.5 5.5 5.5 5.5 5.5 5.5 5.5 5.5 5.5 5.5 5.5 5.5 5.5 5.5 5.5 245 5.5 5.5 5.5 5.5 5.5 5.5 5.5 5.5 5.5 5.5 5.5 5.5 5.5 5.5 5.5 5.5 5.5 5.5 5.5 5.5 5.5 260 5.5 5.5 5.5 5.5 5.5 5.5 5.5 5.5 5.5 5.5 5.5 5.5 5.5 5.5 5.5 5.5 5.5 5.5 5.5 5.5 5.5 275 6.0 6.0 6.0 5.5 6.0 6.0 6.0 5.5 6.0 6.0 6.0 6.0 6.0 5.5 6.0 6.0 6.0 5.5 6.0 6.0 6.0 290 6.0 6.0 6.0 6.0 6.0 6.0 6.0 6.0 6.0 6.0 6.0 6.0 6.0 6.0 6.0 6.0 6.0 6.0 6.0 6.0 6.0 305 6.0 6.0 6.0 6.0 6.0 6.0 6.0 6.0 6.0 6.0 6.0 6.0 6.0 6.0 6.0 6.0 6.0 6.0 6.0 6.0 6.0 320 6.0 6.0 6.0 6.0 6.0 6.0 6.0 6.0 6.0 6.0 6.0 6.0 6.0 6.0 6.0 6.0 6.0 6.0 6.0 6.0 6.0 335 6.5 6.5 6.5 6.5 6.5 6.5 6.5 6.5 6.5 6.5 6.5 6.5 6.5 6.5 6.5 6.5 6.5 6.5 6.5 6.5 6.5 350 6.5 6.5 6.5 6.5 6.5 6.5 6.5 6.5 6.5 6.5 6.5 6.5 6.5 6.5 6.5 6.5 6.5 6.5 6.5 6.5 6.5 365 6.5 6.5 6.5 6.5 6.5 6.5 6.5 6.5 6.5 6.5 6.5 6.5 6.5 6.5 6.5 6.5 6.5 6.5 6.5 6.5 6.5 380 7.0 7.0 7.0 7.0 7.0 7.0 7.0 7.0 7.0 7.0 7.0 7.0 7.0 7.0 7.0 7.0 7.0 7.0 7.0 7.0 7.0 395 7.0 7.0 7.0 7.0 7.0 7.0 7.0 7.0 7.0 7.0 7.0 7.0 7.0 7.0 7.0 7.0 7.0 7.0 7.0 7.0 7.0 410 7.0 7.0 7.0 7.0 7.0 7.0 7.0 7.0 7.0 7.0 7.0 7.0 7.0 7.0 7.0 7.0 7.0 7.0 7.0 7.0 7.0 425 7.5 7.5 7.5 7.0 7.5 7.5 7.5 7.0 7.5 7.5 7.5 7.5 7.5 7.0 7.5 7.5 7.5 7.0 7.5 7.5 7.5 440 7.5 7.5 7.5 7.5 7.5 7.5 7.5 7.5 7.5 7.5 7.5 7.5 7.5 7.5 7.5 7.5 7.5 7.5 7.5 7.5 7.5 455 7.5 7.5 7.5 7.5 7.5 7.5 7.5 7.5 7.5 7.5 7.5 7.5 7.5 7.5 7.5 7.5 7.5 7.5 7.5 7.5 7.5 470 7.5 7.5 7.5 7.5 7.5 7.5 7.5 7.5 7.5 7.5 7.5 7.5 7.5 7.5 7.5 7.5 7.5 7.5 7.5 7.5 7.5 485 8.0 8.0 8.0 8.0 8.0 8.0 8.0 8.0 8.0 8.0 8.0 8.0 8.0 8.0 8.0 8.0 8.0 8.0 8.0 8.0 8.0
HM
A L
ayer
Th
ick
nes
s (m
m)
500 8.0 8.0 8.0 8.0 8.0 8.0 8.0 8.0 8.0 8.0 8.0 8.0 8.0 8.0 8.0 8.0 8.0 8.0 8.0 8.0 8.0

Laboratory Testing and Modeling for Structural Performance of Fully Permeable Pavements Final Report, November 2010
196
Table J.8: Preliminary Stress-to-Strength Ratio at Top of Subgrade, Sacramento County (HMA-O, with Subbase, E_GB = 60 MPa, Speed = 40 km/h)
Granular Base (GB) Layer Thickness (mm)
500 550 600 650 700 750 800 850 900 950 1000 1050 1100 1150 1200 1250 1300 1350 1400 1450 1500
200 G G G G G G G G G G G G G G G G G G G G G 215 G G G G G G G G G G G G G G G G G G G G G 230 G G G G G G G G G G G G G G G G G G G G G 245 G G G G G G G G G G G G G G G G G G G G G 260 G G G G G G G G G G G G G G G G G G G G G 275 G G G G G G G G G G G G G G G G G G G G G 290 G G G G G G G G G G G G G G G G G G G G G 305 G G G G G G G G G G G G G G G G G G G G G 320 G G G G G G G G G G G G G G G G G G G G G 335 G G G G G G G G G G G G G G G G G G G G G 350 G G G G G G G G G G G G G G G G G G G G G 365 G G G G G G G G G G G G G G G G G G G G G 380 G G G G G G G G G G G G G G G G G G G G G 395 G G G G G G G G G G G G G G G G G G G G G 410 G G G G G G G G G G G G G G G G G G G G G 425 G G G G G G G G G G G G G G G G G G G G G 440 G G G G G G G G G G G G G G G G G G G G G 455 G G G G G G G G G G G G G G G G G G G G G 470 G G G G G G G G G G G G G G G G G G G G G 485 G G G G G G G G G G G G G G G G G G G G G
HM
A L
ayer
Th
ick
nes
s (m
m)
500 G G G G G G G G G G G G G G G G G G G G G Note: G--Stress-to-Strength Ratio <0.3; Y--0.3=<Stress-to-Strength Ratio <=0.7; R--Stress-to-Strength Ratio >0.7

Laboratory Testing and Modeling for Structural Performance of Fully Permeable Pavements Final Report, November 2010
197


