
Project funded by the European Union’s Horizon 2020 Research and Innovation Programme (2014 – 2020)
OpenBudgets.eu: Fighting Corruption with Fiscal Transparency
Deliverable 2.3
Requirements for Statistical Analytics and
Data Mining
Dissemination Level Public
Due Date of Deliverable Month 12, 30.04.2016
Actual Submission Date 01.06.2016
Work Package WP 2, Data Collection and Mining
Task T 2.3
Type Report
Approval Status Final
Version 1.0
Number of Pages 32
Filename D2.3 - Requirements for Statistical Analytics and Data Mining.docx
Abstract: In this deliverable we present requirements for statistical analytics and data mining in the OpenBudgets.eu (OBEU) platform. Based on user needs assessed and reported in previous OBEU deliverables we formulate data mining and analytics tasks, discuss related tools and algorithms, and finally define corresponding requirements.
The information in this document reflects only the author’s views and the European Community is not liable for any use that may be made of the information contained therein. The information in this document is provided “as is” without guarantee or warranty of any kind, express or implied, including but not limited to the fitness of the information for a
particular purpose. The user thereof uses the information at his/ her sole risk and liability.
Project Number: 645833 Start Date of Project: 01.05.2015 Duration: 30 months

D2.3 – v.1.0
Page 2
History
Version Date Reason Revised by
0.1 11.05.2016 Version for internal review Kleanthis Koupidis
1.0 31.05.2016 Final version for submission Christiane Engels
Author List
Organisation Name Contact Information
Fraunhofer Christiane Engels [email protected]
OKFGR Charalampos Bratsas [email protected]
OKFGR Kleanthis Koupidis [email protected]
UBONN Fathoni Musyaffa [email protected]
UBONN Fabrizio Orlandi [email protected]
UEP David Chudán [email protected]
UEP Jaroslav Kuchař [email protected]
UEP Jindřich Mynarz [email protected]
UEP Václav Zeman [email protected]
D2.3 – v.1.0
Page 3
Executive Summary
In this deliverable we present the requirements for statistical analytics and data mining in the OpenBudgets.eu (OBEU) project. We start by elaborating the methodology used to collect the data mining and statistical analytics requirements. After identifying sources of collected data mining and analytics needs in previous OBEU deliverables, these needs are summarized. We continue with mapping those needs onto corresponding data mining and analytics tasks. A discussion regarding appropriate algorithms for the identified tasks follows. Based on the collected tasks, we describe related tools. Finally, we formulate the list of requirements for data mining and statistical analytics along with a priority for each requirement.

D2.3 – v.1.0
Page 4
Abbreviations and Acronyms CSV Comma-Separated Values
DCV Data Cube Vocabulary
RDF Resource Description Framework
OBEU OpenBudgets.eu

D2.3 – v.1.0
Page 5
Table of Contents
1 INTRODUCTION ....................................................................................................... 8
2 PRELIMINARIES ...................................................................................................... 8
2.1 SEMANTIC MODEL ........................................................................................... 8
2.2 METHODOLOGY ............................................................................................... 9
3 DATA MINING AND ANALYTICS NEEDS AND TASKS .......................................... 9
3.1 SOURCES OF COLLECTED DATA MINING AND ANALYTICS NEEDS ........... 9
3.2 COLLECTED DATA MINING AND ANALYTICS NEEDS ..................................10
3.2.1 Analysis of the required functionality of OpenBudgets.eu (D4.2) .......... 10
3.2.2 User Requirements Reports – First Cycle (D5.1) .................................. 11
3.2.3 Needs Analysis Report (D6.2) .............................................................. 12
3.2.4 Assessment Report (D7.1) ................................................................... 12
3.2.5 Stakeholder identification and outreach plan (D8.3) .............................. 12
3.2.6 Additional Needs .................................................................................. 14
3.3 DATA MINING AND ANALYTICS TASKS .........................................................14
3.4 SUMMARY OF DATA MINING AND ANALYTICS TASKS ................................21
3.5 DISCUSSION OF IDENTIFIED DATA MINING AND ANALYTICS TASKS ........21
3.5.1 Similarity Learning ................................................................................ 21
3.5.2 Rule/Pattern Mining .............................................................................. 22
3.5.3 Outlier/Anomaly Detection .................................................................... 22
3.5.4 Clustering ............................................................................................. 23
3.5.5 Graph/Network Analysis ....................................................................... 23
3.5.6 Pattern Matching .................................................................................. 24
3.5.7 Descriptive Statistics ............................................................................ 24
3.5.8 Comparative Analysis ........................................................................... 25
3.5.9 Time Series Analysis ............................................................................ 25
4 TOOLS .....................................................................................................................26
4.1 RAPIDMINER ....................................................................................................26
4.2 WEKA ...............................................................................................................26
4.3 R .......................................................................................................................26
4.4 PYTHON ...........................................................................................................27
4.5 SPARQL ...........................................................................................................27
4.6 OPENSPENDING .............................................................................................27
4.7 EASYMINER .....................................................................................................28
5 REQUIREMENTS FOR STATISTICAL ANALYTICS AND DATA MINING ..............29
5.1 GENERAL FUNCTIONAL REQUIREMENTS ....................................................29

D2.3 – v.1.0
Page 6
5.2 FUNCTIONAL REQUIREMENTS FROM DATA MINING AND ANALYTICS TASKS ..............................................................................................................29
5.3 PRE-PROCESSING REQUIREMENTS ............................................................30
5.4 NON-FUNCTIONAL REQUIREMENTS .............................................................31
6 CONCLUSION .........................................................................................................31
7 REFERENCES .........................................................................................................31

D2.3 – v.1.0
Page 7
List of Figures
Figure 1: Diagram of the Chosen Methodology...................................................................... 9
List of Tables
Table 1: Data Mining and Analytics Needs Collected in D4.2 ...............................................11
Table 2: Data Mining and Analytics Needs Collected in D5.1 ...............................................11
Table 3: Data Mining and Analytics Needs Collected in D6.2 ...............................................12
Table 4: Data Mining and Analytics Needs Collected in D7.1 ...............................................12
Table 5: Data Mining and Analytics Needs Collected in D8.3 ...............................................13
Table 6: Additional Data Mining and Analytics Needs ...........................................................14
Table 7: Transformation of Data Mining and Analytics Needs into Corresponding Tasks .....20
Table 8: Summary of Collected Data Mining and Analytics Tasks ........................................21
Table 9: General Requirements for Data Mining and Statistical Analytics .............................29
Table 10: Functional Requirements for Data Mining and Statistical Analytics .......................30
Table 11: Pre-Processing Requirements for Data Mining and Statistical Analytics ...............30
Table 12: Non-Functional Requirements for Data Mining and Statistical Analytics ...............31
D2.3 – v.1.0
Page 8
1 Introduction Apart from integrating budget and spending data on European, national, regional and local level into one single platform and a uniform data model, the possibility to analyze and visualize this data is a key component of OBEU.
There are many open data platforms collecting budget and spending data on various regions and level like OpenCoesione1 in Italy or OffenerHaushalt2 in Germany. Some of them also provide nice visualizations (e.g. OpenCoesione and WhereDoesMyMoneyGo3 in UK) but often lack of analytics and more advanced visualizations to make the contained data better understandable and digestible.
In the OBEU project we are going to address the needs of our stakeholders and enhance our open data platform with comparative analysis and data mining functionalities.
This deliverable is the first of the corresponding work package task T2.3 in the project. It summarizes the needs analysis of our use case partners related to data mining and analytics, specifies according tasks, discusses related tools and algorithms, and finally formulates requirements.
The analytics on the OBEU platform will be twofold: there will be advanced analytics tools for experts as well as an easy-to-use graphical user interface to reduce the barrier for non-experts to engage in budget and spending data. To this end, we will do both integrate and adapt existing tools as well as develop new tools in line with the users’ needs.
The remainder of the deliverable is structured as follows: After a preliminary section in Section 2, we first summarize the data mining and analytics needs collected in cooperation with our use case partners, transform them into corresponding tasks, and discuss appropriate algorithms in Section 3. Suitable tools for these tasks are discussed in Sections 4 in order to finally define the requirements for statistical analytics and data mining in Section 5. We close with a conclusion in Section 6.
2 Preliminaries In this preliminary section, we briefly explain the OBEU data model in Section 2.1 which serves as input format for the data mining and analytics tasks. In Section 2.2, we introduce the methodology used in this deliverable for obtaining and formulating the requirements.
2.1 Semantic Model On the OBEU platform, the data sets will be kept in the RDF data model defined in WP1. This data model for public budget and spending data is documented in deliverable D1.4 (Dudáš et al. [2015]). It is based on the Data Cube Vocabulary4 and provides several predefined dimensions for modeling budget and spending data.
Since the majority of data mining algorithms and statistic tools works on tabular-structured data, the RDF data sets cannot directly serve as input. A pre-processing step is necessary to transform or propositionalize the data into an appropriate tabular format like CSV (cf. requirement (R18)). This transformation is in most cases realizable with SPARQL SELECT-queries. Further details can be found in the corresponding OBEU deliverable D2.2 (Klímek et al. [2016]) on data optimisation, enrichment, and preparation for analysis.
1 http://www.opencoesione.gov.it/ 2 http://offenerhaushalt.de/ 3 http://wheredoesmymoneygo.org/ 4 http://www.w3.org/TR/vocab-data-cube/

D2.3 – v.1.0
Page 9
2.2 Methodology For obtaining and formulating requirements for data mining and statistical analytics in this deliverable, we follow the methodology depicted in Figure 1.
Figure 1: Diagram of the Chosen Methodology
After the sources of collected data mining and analytics needs have been identified in Section 3.1, those needs related to data mining and analytics are summarized in Section 3.2. Then the needs are transformed into corresponding data mining and analytics tasks in Section 3.3, which are grouped together and classified in Section 3.4. In Section 3.5, a discussion of the identified tasks and appropriate tools and algorithms follows. A deeper look into software environments for data mining and analytics is given in Section 4. Finally, the requirements for data mining and statistical analytics are formulated in Section 5 based on the previous discussions.
Each requirement is assigned a priority indicating the importance for the project. The priorities are based on the number of related needs (cf. Section 3.2) and feedback received from project partners while discussing the identified data mining and analytics tasks (cf. Sections 3.3 - 3.4). We chose three possible priorities: high, medium and low.
3 Data Mining and Analytics Needs and Tasks
For formulating data mining and analytics needs and tasks in this section, we follow the methodology introduced in Section 2.2. We use the following naming convention throughout this deliverable: data mining needs are numbered as (Nxx), data mining tasks as (Txx), and requirements as (Rxx).
3.1 Sources of Collected Data Mining and Analytics Needs Data Mining needs have been collected in various steps during the project.
A first definition of the OBEU functionality including data mining and analytics tasks was specified in the required functionality analysis report (D4.2, Gökgöz et al. [2015]) at the very beginning of the project.
In the meantime, our three pilot partners collected requirements for the whole OBEU platform along with their stakeholders. We examined their findings documented in deliverables D5.1 (Kayser-Bril et al. [2015]), D6.2 (Aiossa et al., [2016]), and D7.1 (Cabo Calderón et al. [2016]) for data mining needs and summarized them in Sections 3.2.2 to 3.2.4.
Identify sources of data mining and analytics needs
Summarize collected needs
Transform needs into appropriate
tasks
Group and classify identified tasks
Discuss related tools and
algorithms
Formulate requirements and assign prioriteis
D2.3 – v.1.0
Page 10
Another input for this deliverable is the outcome of the stakeholder workshop that was held at our plenary in November/December 2015. Deliverable D8.3 (Alberts et al. [2016]) provides an exhaustive summary of other open data platforms and projects that have been presented by the participants, and the outcome of a gap analysis and user stories sessions.
Sources of Data Mining Needs (Summary):
Deliverable 4.2 - Analysis of the required functionality of OpenBudgets.eu
Requirements analysis of the pilot partners (WP5-WP7)
o Deliverable D5.1 - User Requirement Reports - First Cycle
o Deliverable D6.2 - Needs Analysis Report
o Deliverable D7.1 - Assessment Report
Deliverable D8.3 - Stakeholder identification and outreach plan
3.2 Collected Data Mining and Analytics Needs In this section, we itemize all needs related to data mining and analytics collected in the sources identified above. Each of the following sections copes with one source identified in the previous section.
3.2.1 Analysis of the required functionality of OpenBudgets.eu (D4.2)
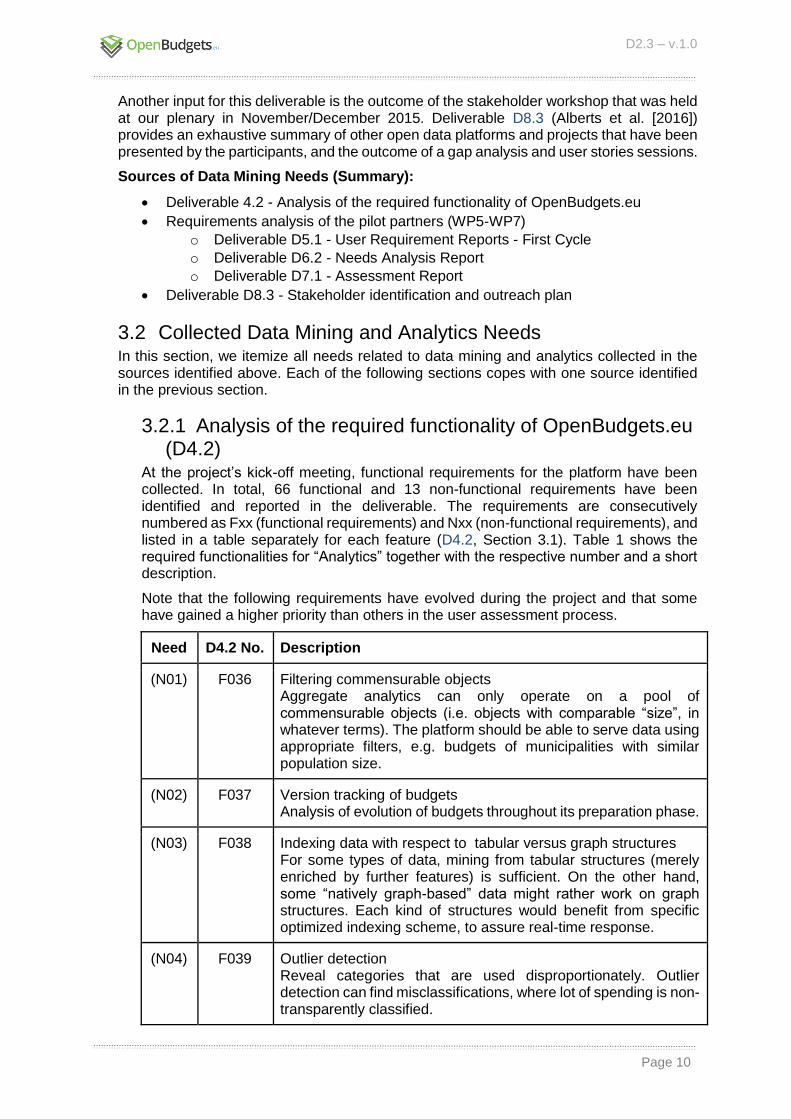
At the project’s kick-off meeting, functional requirements for the platform have been collected. In total, 66 functional and 13 non-functional requirements have been identified and reported in the deliverable. The requirements are consecutively numbered as Fxx (functional requirements) and Nxx (non-functional requirements), and listed in a table separately for each feature (D4.2, Section 3.1). Table 1 shows the required functionalities for “Analytics” together with the respective number and a short description.
Note that the following requirements have evolved during the project and that some have gained a higher priority than others in the user assessment process.
Need D4.2 No. Description
(N01) F036 Filtering commensurable objects Aggregate analytics can only operate on a pool of commensurable objects (i.e. objects with comparable “size”, in whatever terms). The platform should be able to serve data using appropriate filters, e.g. budgets of municipalities with similar population size.
(N02) F037 Version tracking of budgets Analysis of evolution of budgets throughout its preparation phase.
(N03) F038 Indexing data with respect to tabular versus graph structures For some types of data, mining from tabular structures (merely enriched by further features) is sufficient. On the other hand, some “natively graph-based” data might rather work on graph structures. Each kind of structures would benefit from specific optimized indexing scheme, to assure real-time response.
(N04) F039 Outlier detection Reveal categories that are used disproportionately. Outlier detection can find misclassifications, where lot of spending is non-transparently classified.

D2.3 – v.1.0
Page 11
(N05) F040 Extrapolations on data Ability to outline trends for future budget allocations.
(N06) F041 Aggregation by time interval Ability to aggregate (e.g. sum, average) amounts over a user-defined period of time (e.g. quarter).
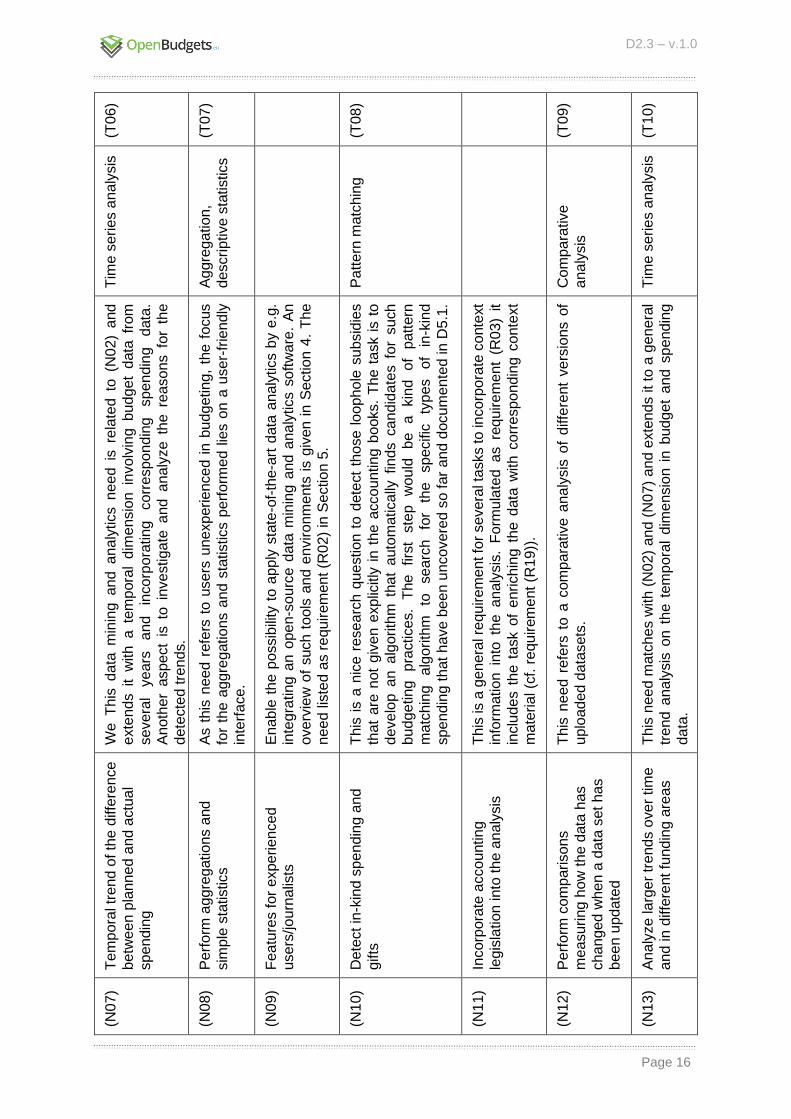
(N07) F042 Temporal trend of the difference between planned and actual spending How does the difference between planned and actual expenditure differ over time? If it gets smaller, does it imply that the public body improved its estimates?
Table 1: Data Mining and Analytics Needs Collected in D4.2
3.2.2 User Requirements Reports – First Cycle (D5.1) The first user requirements report in the field of journalism indicates that journalists in general prefer raw data to preprocessed data and that publicly available open data is not exclusive enough to lead to a good story which is – even in data journalism – a central point. Nevertheless, budget data represents a slightly different case. Budget and spending data is rather complex, hard to understand and digest. So data mining tools on the OBEU platform might assist non-technical journalists to perform their analytics. For a better acceptance among journalists, these analytics performed on the data have to be transparent, i.e. the methods, algorithms and all parameters have to be easily available on request which results in the first requirement:
Requirement (R01): Algorithms have to be explained on the platform, all parameters have to be transparent if asked.
Table 2 summarizes the data mining and analytics needs collected in D5.1. (N10) and (N11) address gaps G5.11 and G5.13 identified in the gap analysis5 which could possibly be helped by data mining and machine learning.
Need Description
(N08) Perform aggregations and simple statistics for a better understanding of the data and to support journalist unexperienced in budgeting to find the demanded values.
(N09) Add features for experienced users, as data journalists usually have a high understanding of technical and mathematical issues.
(N10) Detect in-kind spending and gifts which are not explicitly present in the data.
(N11) Incorporate accounting legislation into the analysis.
(N12) Perform comparisons measuring how the data has changed when a data set has been updated.
Table 2: Data Mining and Analytics Needs Collected in D5.1
5 D5.1, Section 2. GX.XX refers to the gap number provided in the deliverable.

D2.3 – v.1.0
Page 12
3.2.3 Needs Analysis Report (D6.2) The needs analysis report in WP6 is based on a Members of the European Parliament survey evaluation and identifies a clear need to process and analyze raw data in the OBEU platform. In particular it raises the following needs:
Need Description
(N13) Analyze larger trends over time and in different funding areas.
(N14) Identify both good and bad examples of financial management.
(N15) Pay special focus on analyzing the spending and management of EU budget funds.
(N16) Identify systematic problems of project implementation in different funds and programmes, rather than in-depth engagement with individual projects.
(N17) Consider fiscal indicators like error, performance and absorption rates.
(N18) Perform comparative analysis of certain budget and expenditure areas through the use of timelines; geographically; and by sector.
(N19) Complement the raw budget data with other sources such as annual audit or activity reports.
Table 3: Data Mining and Analytics Needs Collected in D6.2
3.2.4 Assessment Report (D7.1) The assessment report for the participatory budget tool on the OBEU project reveals only a limited need for statistical analytics and data mining going beyond visualizations. Most user needs collected so far are related to information requests, e.g. a search engine and filtering tools. However, the following two needs fit the scope of this deliverable:
Need Description
(N20) Comparisons of previous years’ budgets with the current one.
(N21) Provide context information, e.g. information about authorities, departments and areas involved in proposals.
Table 4: Data Mining and Analytics Needs Collected in D7.1
3.2.5 Stakeholder identification and outreach plan (D8.3) At the first stakeholder workshop that was held at the plenary on 30.11. – 1.12.2015 several participants from the fields of journalism, civil society and (budget) transparency gave presentations of their work. The functionality of these open budget and spending data portals and anti-corruption campaigns inspired us to target the integration of similar tools into the OBEU platform (cf. (N22) - (N29)).
In addition, the gap analysis and the user stories session revealed requirements including those for analytics to overcome the identified gaps and to address the needs of the different user groups (cf. (N30) - (N35)). Again, a clear need for good analytics has been emphasized.

D2.3 – v.1.0
Page 13
Table 5 summarizes the needs reported in D8.3.
Need Description
(N22) Comparative analysis performed by Openspending.nl6 The Openspending.nl project provides a way to compare budget and spending data from different Dutch local (e.g. districtual/municipal/provincial) administrations. The project’s main features are comparing the budgets of two local administrations, decomposing the budget into several functional classifications and creating visualizations.
(N23) Aggregations performed by The Price of the State7 The Price of the State project provides information on how much the Slovak public sector spends and collects money in various years. The platform provides comparisons between budgets, aggregations, visualizations, statistics, and a simulation interface where users can create their own national budget.
(N24) Identifying fishy relations and red flags using network analysis presented by Adriana Homolova and Belia Heilbron
(N25) Red Flags8 for tenders and contracts indicating corruption, mistakes, etc.
(N26) Detection of politicians involved in receiving subsidies performed by Open Data Albania9
(N27) Incorporating information of the budget process, information on politicians, public procurement, and private companies receiving money from the state
(N28) Detection of corruption as a general goal
(N29) Follow the state’s money flows all the way down to transaction data and then questioning who was receiving the money and if this happened in a proper manner.
(N30) Include actual statistics
(N31) Provide context to budget and spending data
(N32) Compare the same budget line across countries and cities
(N33) Detect council members tied to companies winning tenders
(N34) Implement notifications on specific changes in certain data sets, monitoring
(N35) Address questions like “How is the money really used?” and “How do I profit from my salary taxes?”
Table 5: Data Mining and Analytics Needs Collected in D8.3
6 http://openspending.nl/ 7 http://www.priceofthestate.org/ 8 http://www.redflags.eu/?lang=en 9 http://open.data.al/en
D2.3 – v.1.0
Page 14
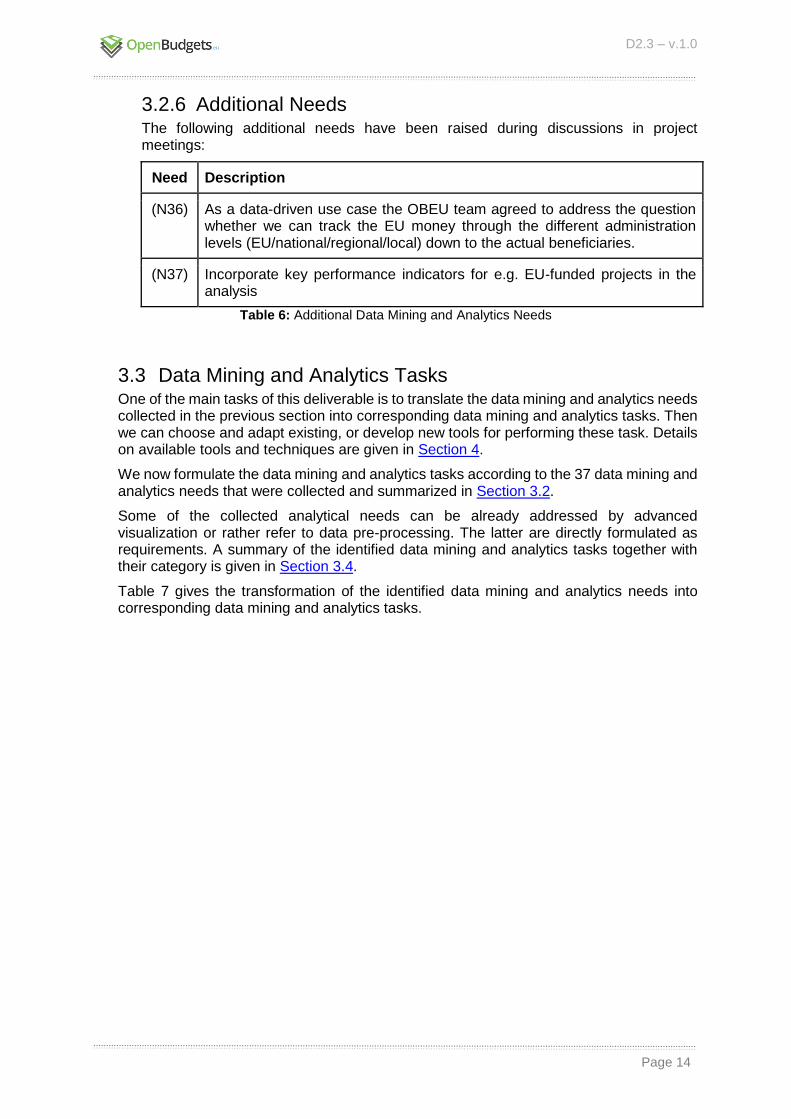
3.2.6 Additional Needs The following additional needs have been raised during discussions in project meetings:
Need Description
(N36) As a data-driven use case the OBEU team agreed to address the question whether we can track the EU money through the different administration levels (EU/national/regional/local) down to the actual beneficiaries.
(N37) Incorporate key performance indicators for e.g. EU-funded projects in the analysis
Table 6: Additional Data Mining and Analytics Needs
3.3 Data Mining and Analytics Tasks One of the main tasks of this deliverable is to translate the data mining and analytics needs collected in the previous section into corresponding data mining and analytics tasks. Then we can choose and adapt existing, or develop new tools for performing these task. Details on available tools and techniques are given in Section 4.
We now formulate the data mining and analytics tasks according to the 37 data mining and analytics needs that were collected and summarized in Section 3.2.
Some of the collected analytical needs can be already addressed by advanced visualization or rather refer to data pre-processing. The latter are directly formulated as requirements. A summary of the identified data mining and analytics tasks together with their category is given in Section 3.4.
Table 7 gives the transformation of the identified data mining and analytics needs into corresponding data mining and analytics tasks.

D2.3 – v.1.0
Page 15
Task
No
.
(T01
)
(T02
)
(T03
)
(T04
)
(T05
)
Tas
k D
esc
rip
tio
n
Clu
ste
rin
g,
sim
ilarity
le
arn
ing
Co
mp
ara
tive
ana
lysis
,
tim
e s
eries a
na
lysis
Ou
tlie
r D
ete
ctio
n
Tim
e s
erie
s
ana
lysis
, p
red
ictio
ns
Ag
gre
ga
tion
Dis
cu
ss
ion
We
will
im
ple
me
nt th
is a
s a
pre
-pro
cessin
g s
tep fo
r th
e o
ther
data
min
ing
and
ana
lytics t
asks,
e.g
. p
att
ern
min
ing a
nd o
utlie
r d
ete
ctio
n.
To m
ake
this
a
n in
tere
sting
d
ata
m
inin
g ta
sk a
s w
ell,
w
e w
ill n
ot
limit to
e.g
.
mu
nic
ipalit
ies o
f sim
ilar
pop
ula
tion
siz
e b
ut
als
o i
ncorp
ora
te a
dd
itio
na
l
featu
res lik
e g
eo
spa
tial cla
ssific
ation
s,
so
cia
l a
nd
econ
om
ic in
form
atio
n,
and
co
nsid
er
mu
ltip
le d
ime
nsio
ns a
t o
nce.
The
refo
re
the
co
rre
spon
din
g
task
involv
es
intr
odu
cin
g
a
sim
ilarity
me
asu
re
on
diffe
rent
entitie
s
like
lo
catio
ns
and
o
rga
niz
ation
s
(i.e
.
sim
ilarity
le
arn
ing)
and
a c
luste
rin
g g
roup
ing c
om
para
ble
ite
ms to
ge
ther.
The
co
rre
sp
on
din
g
dem
and
to
e
nrich
th
e
data
w
ith
th
ose
a
dd
itio
na
l
featu
res lis
ted a
bo
ve is fo
rmu
late
d a
s r
equ
irem
ent (R
19).
This
data
min
ing a
nd a
na
lytics n
ee
d r
efe
rs t
o a
co
mp
ara
tive
ana
lysis
of
bud
ge
t lin
es a
long
th
e d
iffe
rent
bud
ge
t p
ha
ses a
nd c
an b
e e
xte
nd
ed t
o
fin
d a
nd
me
asure
tre
nd
s in
do
ing s
o.
This
is a
pre
-pro
cessin
g r
equ
ire
me
nt
refe
rrin
g t
o t
he d
ata
pre
para
tio
n f
or
ana
lysis
. It is f
orm
ula
ted a
s r
equ
irem
ent (R
20).
Ou
tlie
r d
ete
ctio
n w
ill b
e p
erf
orm
ed o
n t
he b
ud
get
and
sp
en
din
g d
ata
to
fin
d u
nu
sua
l va
lues o
r p
att
ern
s th
at
may in
dic
ate
e
rrors
in
th
e d
ata
,
irre
gu
lar
beh
avio
r lik
e c
orr
uptio
n o
r fr
aud
, o
r p
oin
t to
re
gio
ns/s
ecto
rs o
f
sp
ecia
l in
tere
st.
This
data
min
ing a
nd
analy
tics n
ee
d e
xte
nd
s (
N0
2)
in tw
o a
spe
cts
: firs
t to
perf
orm
pre
dic
tio
ns f
or
futu
re b
ud
gets
and
se
cond
to
in
corp
ora
te b
ud
get
data
fro
m d
iffe
ren
t fisca
l p
erio
ds in
th
e a
na
lysis
.
Ag
gre
ga
tion
will
be p
erf
orm
ed n
ot
only
but
especia
lly b
y t
ime i
nte
rva
ls.
Po
ssib
le o
the
r d
ime
nsio
ns for
aggre
ga
tion
are
e.g
. b
y s
ecto
r o
r b
y r
egio
n.
De
sc
rip
tio
n
Filt
ering
co
mm
ensura
ble
obje
cts
Ve
rsio
n tra
ckin
g o
f
bud
ge
ts
Inde
xin
g d
ata
with r
espect
to ta
bu
lar
vers
us g
rap
h
str
uctu
res
Ou
tlie
r d
ete
ctio
n
Extr
apo
lation
s o
n d
ata
Ag
gre
ga
tion
by t
ime
inte
rva
l
Ne
ed
(N0
1)
(N0
2)
(N0
3)
(N0
4)
(N0
5)
(N0
6)
D2.3 – v.1.0
Page 16
(T06
)
(T07
)
(T08
)
(T09
)
(T10
)
Tim
e s
erie
s a
na
lysis
Ag
gre
ga
tion
,
descrip
tive s
tatistics
Pa
tte
rn m
atc
hin
g
Co
mp
ara
tive
ana
lysis
Tim
e s
erie
s a
na
lysis
We
T
his
d
ata
m
inin
g an
d a
na
lytics n
ee
d is
re
late
d to
(N
02)
and
exte
nd
s it w
ith
a te
mp
ora
l d
ime
nsio
n in
volv
ing b
ud
ge
t d
ata
fr
om
se
vera
l ye
ars
a
nd
inco
rpo
ratin
g
co
rre
spo
nd
ing
sp
en
din
g
data
.
An
oth
er
asp
ect
is t
o in
ve
stiga
te a
nd
a
na
lyze th
e re
aso
ns fo
r th
e
dete
cte
d tre
nd
s.
As t
his
nee
d r
efe
rs t
o u
se
rs u
ne
xperie
nce
d i
n b
udg
etin
g,
the
fo
cus
for
the a
gg
reg
atio
ns a
nd s
tatistics p
erf
orm
ed l
ies o
n a
user-
frie
nd
ly
inte
rfa
ce.
En
ab
le t
he p
ossib
ility
to a
pp
ly s
tate
-of-
the-a
rt d
ata
ana
lytics b
y e
.g.
inte
gra
tin
g a
n o
pe
n-s
ourc
e d
ata
min
ing a
nd
ana
lytics s
oftw
are
. A
n
overv
iew
of
such
to
ols
an
d e
nviro
nm
ents
is g
iven
in
Se
ction
4.
The
nee
d lis
ted a
s r
equ
irem
en
t (R
02)
in S
ection
5.
This
is a
nic
e r
esea
rch q
ue
stion
to
dete
ct
those l
oop
ho
le s
ubsid
ies
that
are
not
giv
en
explic
itly
in
th
e a
cco
un
ting
books.
The
ta
sk i
s t
o
deve
lop a
n a
lgorith
m t
ha
t a
uto
matica
lly f
inds c
and
idate
s f
or
su
ch
bud
ge
ting
p
ractice
s.
The
firs
t ste
p
wo
uld
b
e
a
kin
d
of
patt
ern
ma
tch
ing
alg
orith
m
to
se
arc
h
for
the
sp
ecific
ty
pes
of
in-k
ind
sp
en
din
g t
hat
have b
ee
n u
nco
vere
d s
o f
ar
and d
ocu
me
nte
d in
D5.1
.
This
is a
gen
era
l re
qu
irem
ent fo
r se
vera
l ta
sks to
incorp
ora
te c
onte
xt
info
rmatio
n in
to th
e a
naly
sis
. F
orm
ula
ted a
s re
quire
me
nt
(R0
3)
it
inclu
de
s t
he t
ask o
f e
nrich
ing t
he d
ata
with
co
rre
spo
nd
ing c
onte
xt
ma
teria
l (c
f. r
equ
irem
ent (R
19))
.
This
nee
d r
efe
rs t
o a
com
para
tive
ana
lysis
of
diffe
rent
ve
rsio
ns o
f
uplo
ad
ed
da
tasets
.
This
nee
d m
atc
hes w
ith (
N0
2)
and (
N0
7)
and e
xte
nds it to
a g
en
era
l
tre
nd a
na
lysis
on t
he t
em
pora
l d
ime
nsio
n i
n b
ud
ge
t a
nd s
pend
ing
da
ta.
Tem
pora
l tr
end o
f th
e d
iffe
ren
ce
betw
een
pla
nn
ed
an
d a
ctu
al
sp
en
din
g
Pe
rfo
rm a
gg
reg
atio
ns a
nd
sim
ple
sta
tistics
Fea
ture
s f
or
expe
rien
ced
users
/jo
urn
alis
ts
De
tect in
-kin
d s
pen
din
g a
nd
gifts
Incorp
ora
te a
ccou
ntin
g
legis
lation
into
th
e a
na
lysis
Pe
rfo
rm c
om
pariso
ns
me
asu
ring h
ow
th
e d
ata
has
ch
an
ge
d w
hen
a d
ata
set
has
bee
n u
pd
ate
d
An
aly
ze
larg
er
tre
nd
s o
ve
r tim
e
and
in d
iffe
rent fu
nd
ing a
reas
(N0
7)
(N0
8)
(N0
9)
(N1
0)
(N1
1)
(N1
2)
(N1
3)

D2.3 – v.1.0
Page 17
(T11
)
(T12
)
(T13
)
(T14
)
(T15
)
(T16
)
(T17
)
Ru
le/p
att
ern
min
ing
Outlie
r d
ete
ctio
n
Ru
le/p
att
ern
min
ing
on a
gg
reg
ate
d d
ata
Ou
tlie
r d
ete
ctio
n o
n
agg
reg
ate
d d
ata
Re
trie
val/ca
lcu
lation
of fisca
l in
dic
ato
rs
De
scriptive
sta
tistics,
tim
e s
eries a
na
lysis
Ou
tlie
r d
ete
ctio
n
This
nee
d c
an b
e a
dd
ress b
y le
arn
ing p
atte
rns o
f su
ch g
ood a
nd b
ad
exam
ple
s a
nd
app
lyin
g a
cla
ssifie
r o
n t
he l
earn
ed p
att
ern
s/r
ule
s t
o
the r
em
ain
ing d
ata
.
An
oth
er p
ossib
le w
ay to a
dd
ress th
is n
ee
d is
to a
pp
ly o
utlie
r d
ete
ctio
n
me
tho
ds
to
iden
tify
u
ne
xpe
cte
d
beh
avio
r w
hic
h
ma
y
indic
ate
a
mis
sp
en
din
g o
f m
oney (
pu
rpo
se
ly o
r n
ot, c
f. (
T03
)) o
r o
n t
he o
ther
sid
e a
n a
bo
ve-a
vera
ge f
inan
cia
l m
ana
ge
me
nt.
For
the a
na
lysis
of E
U b
ud
ge
t fu
nd
s w
e w
ill u
se s
eve
ral o
f th
e a
lre
ady
me
ntio
ne
d
me
tho
ds:
Tim
e
se
ries
ana
lysis
(T
02
),
co
mp
ara
tive
ana
lysis
(T
09
), r
ule
/patt
ern
min
ing (
T1
1),
and
outlie
r d
ete
ctio
n (
T12).
The
fo
cus
on
ana
lyzin
g
EU
b
ud
ge
t fu
nd
s
is
form
ula
ted
as
requ
ire
me
nt (R
04).
This
nee
d c
om
bin
es (
N14
) w
ith p
erf
orm
ing a
gg
reg
atio
ns o
n th
e d
ata
to
ach
ieve
a
gen
era
l,
syste
ma
tic
overv
iew
o
n
the
fund
s’
and
pro
gra
mm
es’s
pen
din
g
da
ta,
and
incorp
ora
tin
g
the
tem
pora
l
dim
ensio
n.
The
first ta
sk to a
ddre
ss th
is n
ee
d is to r
etr
ieve o
r ca
lcu
late
th
e fis
ca
l
indic
ato
rs to
be c
onsid
ere
d.
Aft
er
ca
lcu
lating
th
ese
fis
ca
l in
dic
ato
r w
e w
ill a
pp
ly s
tatistics w
ith
a
focus o
n tre
nd
s.
On
to
p o
f th
at
a s
epara
te o
utlie
r ste
p m
ight
revea
l d
ee
pe
r in
sig
hts
into
th
e in
dic
ato
rs.
Iden
tify
both
go
od a
nd
ba
d
exam
ple
s o
f fin
an
cia
l
ma
na
ge
me
nt
Pa
y s
pe
cia
l fo
cus o
n a
naly
zin
g
the s
pen
din
g a
nd
ma
na
ge
me
nt
of
EU
bud
get fu
nd
s
Iden
tify
syste
ma
tic p
rob
lem
s o
f
pro
ject
imple
me
nta
tion
in
diffe
rent fu
nd
s a
nd
pro
gra
mm
es, ra
ther
than in
-
dep
th e
ng
ag
em
ent w
ith
indiv
idua
l p
roje
cts
Co
nsid
er
fisca
l in
dic
ato
rs lik
e
err
or,
perf
orm
ance
an
d
abso
rptio
n r
ate
s
(N1
4)
(N1
5)
(N1
6)
(N1
7)

D2.3 – v.1.0
Page 18
(T18
)
(T19
)
(T20
)
(T21
)
(T22
)
(T23
)
(T24
)
Co
mp
ara
tive
ana
lysis
Co
mp
ara
tive
ana
lysis
Co
mp
ara
tive
ana
lysis
Ag
gre
ga
tion
Ne
twork
ana
lysis
Tag
gin
g o
f re
d fla
gs
Pa
tte
rn m
inin
g
This
n
ee
d r
efe
rs to
a bro
ad
a
na
lysis
o
f b
ud
get
data
w
ith sp
ecia
l
inte
rest to
th
e te
mp
ora
l, g
eo
gra
ph
ica
l a
nd
th
em
atic d
ime
nsio
n.
The
nee
d
to
enrich
the
d
ata
w
ith
su
ch
report
s
is
inclu
de
d
in
requ
ire
me
nt
(R1
9).
As t
he
se r
epo
rts a
re u
nfo
rtu
na
tely
only
pro
vid
ed
in
larg
e
PD
F
data
d
ocu
me
nts
. It
is
uncle
ar
how
th
ey
ca
n
be
incorp
ora
ted in
an
y o
f th
e d
ata
min
ing o
r a
na
lytics t
asks.
This
nee
d refe
rs to a
co
mp
ara
tive a
na
lysis
of d
iffe
rent ye
ars
’ bud
ge
ts.
Sim
ilar
to (N
11)
and (N
19)
this
n
ee
d re
fers
to
p
rovid
ing co
nte
xt
info
rmatio
n to
th
e b
ud
get d
ata
(cf. r
equ
irem
ent (R
19))
.
This
nee
d i
s e
xte
nd
ing (
N0
2),
(N
12),
(N
18)
and (
N2
0)
to p
erf
orm
co
mp
ara
tive a
na
lysis
of b
ud
ge
t a
nd s
pen
din
g d
ata
in g
en
era
l.
This
n
ee
d
exte
nd
s
(N0
6)
to
perf
orm
a
ggre
ga
tion
in
g
en
era
l.
Ag
gre
ga
tion
will
be im
ple
me
nte
d in
su
ch a
wa
y t
hat
it is p
ossib
le t
o
perf
orm
agg
reg
atio
ns a
lon
g m
ultip
le d
imen
sio
ns a
t th
e s
am
e t
ime.
This
nee
d r
equ
ire
s t
he inte
gra
tio
n o
f seve
ral h
ete
roge
ne
ou
s d
ata
on
entitie
s in
volv
ed in
allo
ca
tin
g a
nd
re
ceiv
ing s
ubsid
ies, te
nd
er
win
ne
rs
and
so
on t
o b
uild
a n
etw
ork
th
at
ca
n t
hen
be a
na
lyze
d in
a s
econ
d
ste
p
usin
g
netw
ork
an
aly
sis
te
chn
ique
s.
Th
e
co
rre
spo
nd
ing
enrich
me
nt
and in
terlin
kin
g t
ask is lis
ted a
s r
equ
ire
me
nt (R
21).
Be
yon
d t
he t
agg
ing o
f re
d f
lags,
we
aim
at
perf
orm
ing a
n a
na
lysis
ste
p o
n t
hose
, e
.g.
lookin
g f
or
tre
nd
s a
nd
patte
rns.
Pe
rfo
rm c
om
para
tive a
na
lysis
of
ce
rta
in b
ud
get a
nd
exp
en
ditu
re
are
as th
rou
gh t
he u
se o
f
tim
elin
es;
geo
gra
ph
ica
lly;
and
by s
ecto
r
Co
mp
lem
en
t th
e r
aw
bud
ge
t
data
with o
ther
so
urc
es s
uch a
s
ann
ua
l a
ud
it o
r a
ctivity r
ep
ort
s
Co
mp
arison
s o
f p
revio
us y
ears
’
bud
ge
ts w
ith t
he c
urr
ent
one.
Pro
vid
e c
onte
xt in
form
atio
n
Co
mp
ara
tive a
na
lysis
Ag
gre
ga
tion
s
Iden
tify
ing f
ish
y r
ela
tion
s a
nd
red fla
gs u
sin
g n
etw
ork
an
aly
sis
Re
d F
lags f
or
tend
ers
and
co
ntr
acts
in
dic
ating
co
rrup
tion
,
mis
takes, ...
(N1
8)
(N1
9)
(N2
0)
(N2
1)
(N2
2)
(N2
3)
(N2
4)
(N2
5)
D2.3 – v.1.0
Page 19
(T25
)
(T26
)
(T27
)
(T28
)
Gra
ph a
na
lytics
Co
mp
ara
tive
ana
lysis
Gra
ph a
na
lysis
Ru
le/p
att
ern
min
ing,
outlie
r d
ete
ctio
n
This
nee
d T
his
nee
d is r
ela
ted
to (
N2
4).
It
involv
es t
he in
teg
ratio
n o
f
data
on
p
olit
icia
ns a
nd th
eir re
lation
s in
to th
e in
form
atio
n of
the
mo
ne
y
flo
w.
The
task
here
is
to
se
arc
h
for
cycle
s
in
a
gra
ph
co
nsis
tin
g o
f e
dg
es la
be
led "is_funded_by”
and "is _related_to
”.
The
co
rre
sp
on
din
g e
nrich
me
nt
and in
terlin
kin
g t
ask is lis
ted a
s p
art
of re
qu
ire
me
nt (R
21).
Sim
ilar
to (
N1
1)
this
is a
gen
era
l re
qu
irem
ent
for
the o
ther
ana
lysis
tasks a
nd
fo
rmu
late
d a
s r
equ
ire
me
nt
(R0
3).
For
the c
olle
ction
and
inte
gra
tion
of th
e d
ata
is lis
ted a
s p
art
of re
qu
ire
me
nt (R
19).
The
dete
ction
of
co
rru
ptio
n i
n g
en
era
l is
out
of
sco
pe
of
the O
BE
U
pro
ject
as
it
ca
nn
ot
be
so
lve
d
satisfa
cto
rily
d
urin
g
the
pro
ject.
Ho
we
ver,
th
e d
ete
ction
of sp
ecia
l ty
pes o
f co
rru
ptio
n is a
dd
resse
d in
se
vera
l n
ee
ds,
e.g
. (N
04
), (
N1
0),
(N
14),
(N
16),
(N
24),
(N
25)
and
(N2
6).
To a
dd
ress th
is n
eed
, m
uch eff
ort
is
re
qu
ire
d o
n in
terlin
kin
g th
e
bud
ge
ts
of
the
diffe
ren
t g
overn
men
t le
vels
a
nd
th
e
eng
ag
ed
min
istr
ies
and
co
uncils
(c
f.
requ
ire
me
nt
(R2
2))
. A
fte
rward
s
the
resultin
g n
etw
ork
will
be a
na
lyze
d u
sin
g c
om
para
tive
sta
tistics, gra
ph
ana
lysis
te
ch
niq
ue
s, b
ut a
lso
ru
le/p
atte
rn m
inin
g a
nd o
utlie
r d
ete
ctio
n
techn
ique
s (
cf. (
N1
4)
and
(N
16))
.
This
n
ee
d
exte
nd
s
the
a
lre
ad
y
form
ula
ted
requ
ire
me
nt
(R0
3)
extr
acte
d
from
n
ee
ds
(N1
9)
and
(N2
7)
to
als
o
inclu
de
a
ctu
al
sta
tistics. T
he
se s
tatistics c
an b
e in
corp
ora
ted in
OB
EU
in
tw
o w
ays:
First
pro
vid
ing t
he s
tatistics a
s a
dd
itio
na
l in
form
atio
n t
o th
e d
ata
and
se
con
d d
ire
ctly in
th
e a
na
lysis
to
en
hance
th
e r
esu
lts.
This
nee
d g
en
era
lize
s (
N1
9),
(N
21)
and (
N2
7)
to c
om
ple
me
ntin
g th
e
data
w
ith g
en
era
l co
nte
xt
and is
th
ere
fore
a
lrea
dy a
dd
resse
d in
requ
ire
me
nt (R
19).
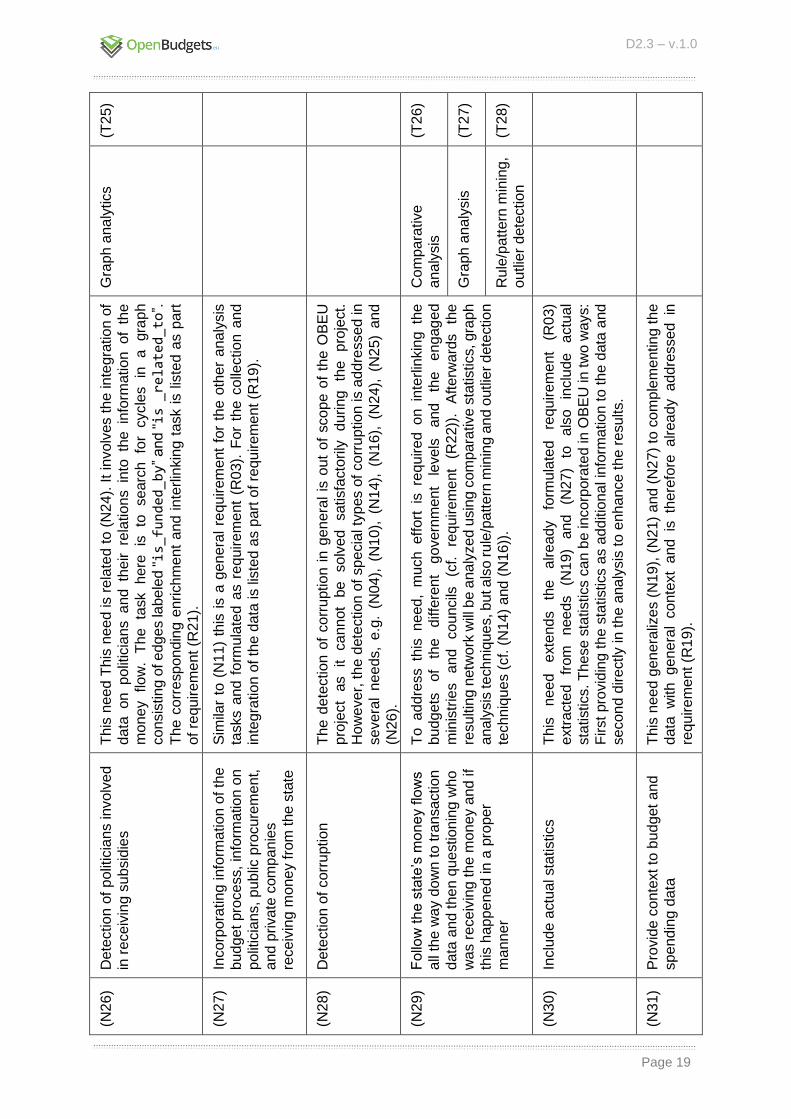
De
tectio
n o
f p
olit
icia
ns invo
lve
d
in r
eceiv
ing s
ubsid
ies
Incorp
ora
ting
info
rma
tion o
f th
e
bud
ge
t pro
cess,
info
rma
tio
n o
n
polit
icia
ns,
pub
lic p
rocure
me
nt,
and
priva
te c
om
pan
ies
receiv
ing m
one
y fro
m the
sta
te
De
tectio
n o
f corr
uptio
n
Follo
w t
he s
tate
’s m
one
y f
low
s
all
the w
ay d
ow
n t
o tra
nsa
ction
data
an
d t
hen q
ue
stio
nin
g w
ho
wa
s r
eceiv
ing th
e m
one
y a
nd
if
this
hap
pe
ne
d in
a p
roper
ma
nn
er
Inclu
de
actu
al sta
tistics
Pro
vid
e c
onte
xt to
bud
get
and
sp
en
din
g d
ata
(N2
6)
(N2
7)
(N2
8)
(N2
9)
(N3
0)
(N3
1)

D2.3 – v.1.0
Page 20
(T29
)
(T30
)
Tab
le 7
: T
ransfo
rmatio
n o
f D
ata
Min
ing a
nd A
na
lytics N
eeds into
Corr
espo
nd
ing
Tasks
Co
mp
ara
tive
ana
lysis
Ag
gre
ga
tion
Co
mp
ara
tive a
na
lysis
a
long
th
e g
eo
spatia
l d
ime
nsio
n is
a
sp
ecia
l ca
se o
f (T
18
).
This
nee
d is r
ela
ted
to
(N
24),
(N
25)
and
(N
26).
It
diffe
rs in
a
wa
y th
at
the
ta
sk h
ere
is
to
fin
d th
e re
latio
nsh
ip b
etw
een
co
un
cil
me
mb
ers
and
the
te
nd
er
win
nin
g c
om
pan
ies w
hic
h is
bring
s th
e d
ata
inte
gra
tio
n r
ath
er
than th
e a
na
lysis
in
to fo
cus.
This
in
teg
ratio
n ta
sk is
fo
rmu
late
d a
s p
art
of
requ
ire
me
nt
(R2
1).
The
fu
nctio
na
lity o
f h
avin
g a
mo
nitorin
g s
yste
m is
a fu
nctio
na
l
requ
ire
me
nt
of
the O
BE
U p
latf
orm
in
gen
era
l. I
t w
ill b
e lis
ted
as r
equ
irem
ent (R
05).
This
nee
d c
an b
e a
dd
resse
d w
ith a
dva
nce
d v
isu
aliz
ation
s li
ke
those
Wh
ere
Do
esM
yM
on
eyG
o p
rovid
e10.
So
we
re
fer
to t
he
vis
ualiz
ation
work
packag
e (
WP
3)
to r
ealiz
e t
he ta
sk.
This
nee
d is
sim
ilar
to (
N2
9)
and
in th
e s
am
e m
ann
er
requ
ire
s
the i
nte
rlin
kin
g o
f b
ud
gets
on s
evera
l g
overn
me
nt
levels
(cf.
requ
ire
me
nt (R
22))
. T
he
ana
lysis
of th
e in
terlin
ked
bud
ge
ts is
there
fore
alre
ad
y a
ddre
sse
d b
y (
T2
6),
(T
27
) a
nd (
T28
).
Be
yon
d t
he c
alc
ula
tion
of
the k
ey p
erf
orm
ance
ind
ica
tors
we
targ
et a
sta
tistic a
nd
com
para
tive a
na
lysis
of th
ose
(cf. (
N1
7))
and
aim
to in
corp
ora
te t
hose
in
th
e o
ther
ana
lytics t
asks (
cf.
requ
ire
me
nt (R
03))
.
Co
mp
are
th
e s
am
e b
ud
ge
t lin
e
acro
ss c
oun
trie
s a
nd c
itie
s
De
tect co
un
cil
mem
bers
tie
d t
o
co
mp
an
ies w
innin
g t
ende
rs
Imp
lem
ent n
otificatio
ns o
n
sp
ecific
ch
an
ge
s in
cert
ain
da
ta
se
ts, m
onito
ring
Ad
dre
ss q
ue
stio
ns lik
e “
Ho
w is
the m
one
y r
eally
used
?”
and
“Ho
w d
o I p
rofit fr
om
my s
ala
ry
taxes?
”
Tra
ckin
g th
e E
U m
one
y th
rou
gh
the d
iffe
rent
levels
dow
n to
th
e
actu
al b
en
eficia
ries
Incorp
ora
te k
ey p
erf
orm
ance
indic
ato
rs in
th
e a
na
lysis
(N3
2)
(N3
3)
(N3
4)
(N3
5)
(N3
6)
(N3
7)
10 E.g. http://wheredoesmymoneygo.org/dailybread.html

D2.3 – v.1.0
Page 21
3.4 Summary of Data Mining and Analytics Tasks In this section we summarize the identified analytics and data mining and analytics tasks of Section 3.3. Many needs and tasks collected from different sources overlap. Table 8 groups common tasks together and classifies them, whether they are data mining tasks or tasks that can be addressed by statistics and visualizations.
Data Mining and Analytics Task
Category Corresponding Tasks
Source (Deliverable)
Clustering, similarity learning Data Mining (T01) D4.2
Rule/pattern mining Data Mining (T11), (T13), (T24), (T28)
D6.2, D8.3
Outlier/anomaly detection Data Mining (T03), (T12), (T14), (T17), (T28)
D4.2, D6.2, D8.3
Pattern matching Data Mining (T08) D5.1
Graph/network analysis Data Mining (T22), (T25), (T27) D8.3
Descriptive statistics Statistics (T07), (T16), (T30) D5.1, D6.2
Comparative analysis Statistics, Visualization
(T02), (T09), (T18), (T19), (T20), (T26), (T29), (T30)
D4.2, D5.1, D6.2, D7.1, D8.3
Time series analysis, predictions
Data Mining, Visualization, Statistics
(T02), (T04), (T06), (T10), (T16)
D4.2, D6.2
Aggregation Statistics, Visualization
(T05), (T07), (T21) D4.2, D5.1, D8.3
Calculation of fiscal indicators, tagging of red flags
Algorithmics (T15), (T23) D6.2, D8.3
Table 8: Summary of Collected Data Mining and Analytics Tasks
3.5 Discussion of Identified Data Mining and Analytics Tasks In this section we provide an overview of the data mining and analytics tasks that will be performed on the OBEU platform according to the identified tasks in Section 3.4. As we focus in this deliverable and the corresponding task T2.3 in the OBEU project on data mining and statistical analytics, we take a deeper look on the tasks identified as such.
Each of the following subsections deals with one task. After a definition, relevant algorithms are discussed and finally requirements are formulated.
Aggregation is to be included as feature in the other tasks and as part of the visualization tools. Therefore we will not have a separate section on aggregation. Similar, the calculation of red flags and fiscal indicators will be handled using an appropriate algorithms and is not discussed separately.
A summary of the requirements is finally given in Section 5.
3.5.1 Similarity Learning Similarity learning will be used in OBEU to find comparable items. It serves as a pre-processing step for the other data mining and analytics tasks based on comparisons. Therefore it is assigned a high priority in Section 5.
The goal of similarity learning is to introduce or learn a similarity function on a set of item that measures how similar two items are. Metric learning is a closely related field, where the similarity or distance function has to be a metric.
D2.3 – v.1.0
Page 22
In OBEU, similarity learning will be applied to find comparable items among e.g. geospatial objects or persons/organizations (cf. (T01)). A critical issue in similarity learning is the number of dimensions. Learning a metric for each dimension separately and combining the resulting functions, or projecting the data into lower dimensional spaces is only suitable in some cases. A recent approach for learning such high-dimensional metrics is COMET (Atzmon et al. [2015]).
Most similarity learning approaches use a regularizer to limit the model complexity and thus smooth the learned function and avoid overfitting.
3.5.2 Rule/Pattern Mining This task refers to finding statistically relevant patterns in the data, in other words data that appear in a dataset frequently. It compromises tasks like association rule mining, frequent/infrequent itemset mining and rule-based classifications. The key term in these methods is frequent itemset. An itemset (a set of items) is frequent if the relative support of the specific itemset satisfies the corresponding minimal support count threshold specified by the user. The support count is the number of transactions that contains the particular itemset.
Frequent pattern mining is generally considered to be a very difficult problem, but now there are many algorithms solving this high complexity by a smart pruning of a state space. Among the best known algorithms may be mentioned variations of:
● Apriori (breadth-first search, out-of-memory problem, Agrawal et al. [1996])
● FP-Growth (usually faster than Apriori but with more complex data structures,
Zaki et al. [1997])
● Eclat (it uses a vertical data storage that does not consume so much memory
such as Apriori or FP-Growth, Han et al. [2000])
● LCM (designed for closed itemset mining and it is considered one of the fastest
algorithm for this purpose, Uno et al. [2003])
These methods have been implemented in lots of well-known mining tools like RapidMiner, Weka and EasyMiner. Besides, there are many existing libraries for frequent pattern mining in various environments like R, Apache Spark, Apache Mahout, Python and other. There are also several parallel solutions for the mentioned algorithms to process big data sets.
3.5.3 Outlier/Anomaly Detection Anomaly detection refers to the problem of finding patterns in data that do not conform to the expected normal behavior (Chandola et al. [2009]).
Outlier detection and pattern mining are two sides of the same coin in the sense that outliers can be viewed as infrequent patterns or as data that does not fit into the extracted patterns.
There are different approaches basically all following the same idea to define some kind of model (e.g. a statistical distribution or a clustering) representing normal behavior and declare any observation in the data that does not fit the model as an anomaly or outlier.
The following list presents a subset of relevant approaches and algorithms for the outlier and anomaly detection that can be used in OBEU. They differ in the requirements on input data including labelled instances for supervised learning, data types for statistical approaches or number of attributes in univariate or multivariate approaches. Several implementations are available for R, Python and RapidMiner.

D2.3 – v.1.0
Page 23
● Statistical tests:
Basic statistical tests for testing hypothesis and distributions can be used to
identify outliers. The required inputs are mostly numeric values. Implementations
for univariate and multivariate outliers are available for R.
● Classification based approaches:
These are supervised techniques that require labelled instances for training
classifiers. An example implementation in Python is based on one-class support
vector machines. R provides random forest outlier detection and a rule-based
approach in this category.
● Nearest neighbor based approaches:
These techniques are mostly unsupervised without any requirements on labelled
data. The main representative is Local Outlier Factor (LOF) which uses the
concept of a local density and measures a local deviation of a point in contrast to
its nearest neighbors.
● Clustering based approaches:
Algorithms in this category are K-Means with simultaneous outlier detection and
the calculation of isolation forests, an unsupervised technique that computes a
score for each instance reflecting how easily it can be isolated from others.
● Association rules and frequent itemsets:
As mentioned before, anomaly can be considered as instances not matching any
pattern learned as normal or regular behavior. These approaches can be either
supervised or unsupervised techniques.
The above mentioned techniques can be combined to get better results.
3.5.4 Clustering Clustering is the task of dividing a given data sample into groups of similar items, the so called clusters. Typically, clustering methods are iterative processes of defining clusters and assigning the item to these clusters. Also the clustering itself is manifold. The clusters can be hard or soft, disjoint or overlapping, include or exclude possible outliers. Popular algorithms among more than 100 published clustering algorithms are:
● k-means (a partitioning approach assigning each item to the nearest of k means,
MacQueen [1967])
● Hierarchical clustering (based on Johnson [1967])
● DBSCAN (a density-based approach assigning high density regions of arbitrary
shape to the same cluster, Ester et al. [1996])
There is no objectively best clustering algorithm. When dealing with a particular problem, the most appropriate clustering algorithm needs to be chosen experimentally, unless there is a mathematical reason to prefer one cluster model over another. There are algorithms that provide a proper criteria for determining the number of clusters (among all combinations of numbers of clusters) for a selected clustering method in order to use the best clustering scheme.
3.5.5 Graph/Network Analysis Graph and network analysis refers to the task of examining the structure of graphs in general and networks in specific. Extensive research has been conducted in the past on network analysis and several industry applications have been developed in various domains, e.g. social networks, logistical networks, the World Wide Web, biological networks, etc.

D2.3 – v.1.0
Page 24
Common procedures and algorithms for network analysis involve (Barabási [2016]), e.g.:
● Manipulation of directed or undirected graphs
● Statistical measurements: degree/property histogram, combined degree/property
histogram, vertex-vertex correlations, assortativity, average shortest path, etc.
● Graph-theoretical algorithms: such as graph isomorphism, minimum spanning
tree, connected components, dominator tree, maximum flow, etc.
● Centrality measures
● Clustering coefficients, network motif statistics and community structure detection
● Modelling of random graphs, with arbitrary degree distribution and correlations
Popular tools for network analysis include for instance the GUI-based Gephi11, Pajek12, NodeXL13 and UCINet14, or the developers-oriented NetworkX15, Graph-tool16 and igraph17 libraries. For example, tools such as the open source Java-based Gephi Platform, are suitable for both exploring small to medium size graphs, and exporting good quality images. While these tools do provide an implementation of algorithms for graph metrics and clustering, these steps are normally batch processed using libraries such as NetworkX (Python-based) or the igraph library (supporting R, Python and C/C++).
A recent paper by Lee et al. [2016] highlights also the importance of the RDF query language SPARQL for holistic in-situ graph analysis.
3.5.6 Pattern Matching Pattern matching is the task of finding a given pattern in the data. The pattern can be of various formats and is either already part of the input or learned in a separate task.
There are several algorithms for string and graph pattern matching (e.g. the Boyer-Moore string search algorithm, Boyer, Moore [1977]). For structured RDF data, SPARQL queries are most appropriate to find predefined patterns in the data as SPARQL is based on graph pattern matching (cf. Section 4.5).
3.5.7 Descriptive Statistics Descriptive statistics are used to describe the basic features of a dataset. They simplify large amounts of data through simple summaries of the available data. These summaries form the basis of every quantitative analysis. When analyzing one variable there are three main characteristics that we usually look at: a.) the distribution, b.) the central tendency and c.) the dispersion.
a.) The distribution: The distribution is a summary of the frequency (counts of occurrences) of individual values or ranges of values for a selected variable. The distribution can be represented as a table, as a histogram or as a bar chart depending on the nature of the studied variable.
b.) The central tendency:
11 https://gephi.org/ 12 http://mrvar.fdv.uni-lj.si/pajek/ 13 http://nodexl.codeplex.com/ 14 https://sites.google.com/site/ucinetsoftware/home 15 https://networkx.github.io/ 16 http://graph-tool.skewed.de/ 17 http://igraph.sourceforge.net/

D2.3 – v.1.0
Page 25
The central tendency is a central value for a distribution of values. The arithmetic mean, median and mode are the most common measures of central tendency.
c.) The dispersion: Dispersion measures the spread of the values around the central tendency value. The most common measures of statistical dispersion are the variance, standard deviation, the range and the interquartile range.
Other important descriptors of data are skewness and kurtosis that are measures of the shape of the distribution.
3.5.8 Comparative Analysis Comparative analysis is common technique in statistics. It refers to the task of quantitatively and qualitatively comparing two or more objects with each other. These objects can be for example the unemployment rates for two countries or the budgets of two municipalities. Descriptive statistics and visualizations are the basis for comparative analysis. Possible axis for comparative analysis are e.g. temporal, geographical, and by sector. Therefore comparative analysis is related but not limited to time series analysis. Regression and correlation matrices are terms in comparative analysis.
3.5.9 Time Series Analysis Time series analysis includes methods for analyzing time series data in order to extract meaningful statistics and other characteristics of the input data. The main assumption in analyzing time series is that the successive values of a variable represent consecutive measurements of equally spaced time intervals. There are two main goals in time series analysis: a.) identify an internal structure that we have to consider, such as autocorrelation, trend and seasonal variation and b.) forecast future values of the desired variable/measure based on previously observed values. Regression analysis is often employed in such a way as to test theories that the current values of one or more independent time series affect the current value of another time series. An observed time series can be decomposed into three components: the trend (long term direction), the seasonal (systematic movements) and the irregular (short term fluctuations). There are various methods in order to deal with these three components that affect the behavior of the data and make predictions a critical issue.
A popular method for forecasting the behavior of a time series is the ARIMA (autoregressive integrated moving average) model. It has three parameters p, d and q indicating the order of the autoregressive model, the degree of differencing, and the order of the moving-average model. Before fitting an ARIMA model, the time series have to be stationary. This can be checked through autocorrelation and partial autocorrelation function plots and with multiple tests (e.g. the Ljung-Box test, the Augmented Dickey-Fuller (ADF) t-statistic test, and the Kwiatkowski-Phillips-Schmidt-Shin (KPSS) test).
Other approaches for predictions are regression analysis methods, regression trees, regression neural networks and support vector machines.
Some algorithms have assumptions on the input data (e.g. normality of the data) which have to be taken into account in order to get valid predictions. If the data does not satisfy the assumptions, transformation techniques have to be applied or a different algorithms has to be used.

D2.3 – v.1.0
Page 26
4 Tools In this section, we take a closer look at already existing tools and software environments that can be adapted and integrated into the OBEU platform to perform the data mining and analytics tasks identified and specified in Section 3.
There exist many tools providing implementations of the most popular algorithms performing e.g. clustering, regression, rule mining and outlier detection.
RapidMiner and WEKA are open-source examples of general data mining software environments which could be integrated with all their functionality into the OBEU platform for data mining tasks, as well as R for statistical analytics.
Each of the following subsections addresses one tool or programming language and discusses included features and algorithms.
4.1 RapidMiner RapidMiner18 is a software platform supporting all steps of the data mining process including data loading, transforming, pre-processing, predictive analytics, statistical modeling, visualization, evaluation and validation. It is written in Java and was first released in 2006 (under the former name YALE). A free basic version is available under the Affero General Public Licence19.
RapidMiner accepts various input formats, including CSV, XML and XLS, and also allows for a direct import from a SPARQL endpoint. It is integrated with WEKA and R, easily extendable and already provides many extensions.
Algorithms included (selection): Naïve Bayes, Trees, Rule Induction, Subgroup Discovery, Neuronal Nets, Regression, Support Vector Machines, Clustering, Association Rules, Outlier Detection, Correlation Matrix, Mutual Information Matrix, k-NN, k-means, Gaussians, Weightings, Feature Generation, Feature Selection.
4.2 WEKA WEKA20 (Waikato Environment for Knowledge Analysis) is an open source machine learning software which has been developed since 1993. It is written in Java and available under the GNU General Public License21. WEKA supports various steps of the data mining process like preprocessing, feature selection, analysis and visualization.
Algorithms included (selection): Clustering, Classification, Regression, Association Rules.
4.3 R R22 is a programming language and software environment for statistical analytics and data mining. It has been developed since 1993 and is available under the GNU General Public License21. Several formats for data import are supported, e.g. tabular formats like CSV, and also Turtle and JSON-LD for RDF data. R is highly extensible and already provides many packages.
Features included (selection): Statistics, Linear and Nonlinear Modeling, Classification, Clustering, Regression, Time-series Analysis.
18 https://rapidminer.com/ 19 http://www.gnu.org/licenses/agpl-3.0.en.html 20 http://www.cs.waikato.ac.nz/ml/weka/ 21 http://www.gnu.org/licenses/gpl-3.0.en.html 22 https://www.r-project.org/

D2.3 – v.1.0
Page 27
4.4 Python Python23 is a programming language and environment that is widely accepted by the community as a tool for performing data science and data mining tasks. The language itself is developed under an open-source licence. There are several existing modules and libraries to perform such tasks, namely: numpy24 as a fundamental package for scientific computing, scipy25 as an ecosystem, matplotlib26 as a plotting library, pandas27 for data structures and data analysis tools and scikit-learn28 as tools for data mining and data analysis. They all are available under an open source licence. There are also other existing libraries and modules that can be imported and extend the core functionality.
Python can generally accept any format of input data including tabular formats (e.g. CSV) or even import from SPARQL endpoint.
Algorithms included (selection): Classification, Regression, Clustering, Dimensionality reduction, Model selection, Preprocessing.
4.5 SPARQL SPARQL29 is the W3C recommended query language for RDF data. It was first released in 2008, the latest version is SPARQL 1.1 which was released in 2013.
SPARQL is based on graph pattern matching and can therefore be used for performing pattern matching. SPARQL 1.1 provides aggregate functions like SUM and AVG similar to
SQL which enables the utilization of SPARQL for descriptive statistics and aggregation. In addition, a recent paper by Techentin et al. [2014] demonstrates how to implement iterative algorithms in SPARQL.
An appropriate tool for executing SPARQL queries is the ETL framework LinkedPipes ETL30 which is already used in the OBEU project for data transformation and therefore described in deliverable D2.1 (Engels et al. [2016]). LinkedPipes ETL allows for creating and sharing pipelines performing the specified tasks using SPARQL components. A new feature described in D2.2 enables to also dynamically generate SPARQL queries based on the data flowing through the pipeline.
Features included (selection): Pattern Matching, Descriptive Statistics, Aggregation, Iterative Algorithms.
4.6 OpenSpending OpenSpending31 is an open platform for public financial information, including budget and spending data developed by the Open Knowledge Foundation, one of our project partners. The aim is to “map the money worldwide”. OBEU will be build on top of the OpenSpending system.
The OpenSpending platform offers an analytical HTTP API which is called Babbage API32. This tool provides an interface that allows us to query against OpenSpending datasets.
23 https://www.python.org 24 http://www.numpy.org/ 25 http://www.scipy.org/ 26 http://matplotlib.org/ 27 http://pandas.pydata.org/ 28 http://scikit-learn.org/stable/ 29 https://www.w3.org/TR/rdf-sparql-query/ 30 http://etl.linkedpipes.com 31 https://openspending.org/ 32 https://github.com/openspending/babbage

D2.3 – v.1.0
Page 28
Here is a list of available operations for this API:
Getting a list of datasets.
Getting a list of all fields for some particular dataset which are represented by
OLAP cubes with dimensions, hierarchical information, aggregations, measures
as financial attributes, data types, etc.
Getting a list of entries which can be filtered by an attribute name and value. This
operation also supports paging and ordering.
Display a histogram of some attribute.
Calculation of the number of distinct values for some attribute.
Getting aggregate statistics for a numeric attribute (now only the sum method is
available).
The API can be used for filtering entries by an exact value of some attribute or by a set of attribute combinations with various values. There is no method for an advanced filtering like greater than, less than, negation. It is possible to dump all entries and filter it explicitly. For each nominal attribute the API is able to show a histogram and the number of unique values. For a numeric/monetary attribute there is only one aggregation method available now - the summation method. If the API shows a histogram for a nominal attribute there is also information about sum of all numeric attributes aggregated for each distinct value. The OpenSpending community plans to add additional aggregate functions such as min, max, avg, stdev, etc.
Within usage of the Babbage API there may occur a problem with inconsistencies of attributes between two datasets. Each dataset may have different attribute names so it can be hard to compare two entries from various datasets or to join records together. Every field has a specific type like string, integer, date etc. Financial attributes are individually separated; therefore it is easy to identify sums of money and their currency across all fields, but within one dataset there may be multiple monetary fields. For practical usage (such as visualization or aggregation) we should eliminate these ambiguities among all attributes and datasets.
Babbage API does not contain any “machine learning” functions, e.g. for clustering, outlier detection or pattern mining. There is no similarities functions or any methods for an object comparison. This API could be used for these lightweight tasks in the OpenBudgets project:
Filtering
Listing of distinct values
Summation of financial attributes across user-defined filters (aggregation)
Histograms
Summaries
4.7 EasyMiner EasyMiner33 is an open source web-based visual interface and REST API for association rule mining. The system also offers classification based on associations (CBA) which enables rule based classification. EasyMiner has been developed at University of Economics, Prague since 2013. It offers an attractive graphical interactive interface which allows users to easily define a pattern for rules that they are looking for in a dataset.
The application provides the complete data mining workflow for association rule mining starting from dataset uploading over preprocessing and performing the association rules mining to a final interpretation of the results. It has two basic versions “limited” and “unlimited”. The “limited” part works with small and medium-size datasets (up to hundreds
33 http://www.easyminer.eu/

D2.3 – v.1.0
Page 29
of megabytes) using the R environment with an apriori in-memory solution and a typical SQL relational database. This approach is usually very fast. The second “unlimited” part uses the hadoop environment for all core operations, Apache Hive34 for warehousing and Apache Spark35 for association rules mining.
5 Requirements for Statistical Analytics and Data Mining
In this section we summarize the requirements for statistical analytics and data mining for the OBEU platform. The requirements are split into general requirements that arose in Section 3.3, functional requirements derived from the discussion on the data mining and analytics tasks in Section 3.5, pre-processing requirements, and an additional non-functional requirement that occurred during the examination of the datasets to be analyzed.
5.1 General Functional Requirements This is a summary of the general functional requirements related to data mining and analytics identified in Section 3.3:
Requirement Description Priority
(R01) Algorithms have to be explained on the platform, all parameters have to be transparent on request.
medium
(R02) Integrate an open-source data mining and analytics software into the platform in order to apply state-of-the-art data analysis for expert users.
medium
(R03) Incorporate additional context into the analysis. (This could be accounting legislation; information of the budget process; information on politicians, public procurement, and private companies receiving money from the state; actual statistics; …, cf. (R19), (R21) and (R22).)
medium
(R04) Have a special focus on EU funds in the analytics. high
(R05) Implement notifications on specific changes in certain data sets, monitoring.
low
Table 9: General Requirements for Data Mining and Statistical Analytics
5.2 Functional Requirements from Data Mining and Analytics Tasks
These are the functional requirements for the OBEU platform arising from the identified data mining and analytics tasks in Section 3.5:
Requirement Description Priority
(R06) Incorporate a similarity measure in algorithms based on comparisons.
high
34 http://scikit-learn.org/stable/ 35 http://spark.apache.org/

D2.3 – v.1.0
Page 30
(R07) Perform rule/pattern mining. high
(R08) Perform outlier/anomaly detection. high
(R09) Perform clustering. low
(R10) Perform pattern matching. low
(R11) Perform graph/network analysis. low
(R12) Perform descriptive statistics. high
(R13) Perform comparative analysis. high
(R14) Perform time series analysis. high
(R15) Perform aggregation. high
(R16) Calculate fiscal indicators. medium
(R17) Tag red flags. low
Table 10: Functional Requirements for Data Mining and Statistical Analytics
5.3 Pre-Processing Requirements In this section we summarize those requirements related to data pre-processing (cf. Section 3.3):
Requirement Description Priority
(R18) Transform the data sets into an appropriate format (like CSV) for the data mining and statistical analytics tools.
high
(R19) Enrich the data sets with information on ● Demographics
● Geospatial classifications
● Social and economic indicators
● Accounting legislation
● Annual audit and activity reports
● Budget processes
● Public procurement
● Private companies receiving money from the state
high
(R20) Index data with respect to tabular and graph structures. low
(R21) Enrich and interlink the data sets with information on entities involved in allocating and receiving subsidies, tender winners, politicians, and the relation between those.
low
(R22) Interlink budget and spending data of different government levels and the engaged ministries and councils.
high
Table 11: Pre-Processing Requirements for Data Mining and Statistical Analytics

D2.3 – v.1.0
Page 31
5.4 Non-Functional Requirements In this section we add a non-functional requirement that arose during the examination of the data sets that will be analysed. As there are large data sets containing more than 10 M triples, the data mining and analytics tools in OBEU have to be able to handle those.
Requirement Description Priority
(R23) Ability to handle large data sets (≥ 10 M triples). high
Table 12: Non-Functional Requirements for Data Mining and Statistical Analytics
6 Conclusion In this deliverable, we examined the so far collected user requirements of the OBEU platform for those that are related to data mining and analytics. We extracted data mining and analytics needs and transformed them into corresponding tasks. We provided an overview on appropriate existing tools and software environments, and discussed each identified tasks individually. Finally, we formulated 23 resulting requirements and assigned priorities.
In the coming months we will address these requirements and develop suitable tools for the OBEU platform.
Note that these requirements might be updated according to the upcoming deliverables of our use case partners, e.g. Deliverable D5.3 - User Requirement Reports - Final Cycle, which is due M20.
7 References OBEU deliverables:
● Dudáš, Marek; Horáková, Linda; Klímek, Jakub; Kučera, Jan; Mynarz, Jindřich;
Sedmihradská, Lucie; Zbranek, Jaroslav; Dong, Tiansi (2015). Deliverable D1.4: User
Documentation. http://openbudgets.eu/assets/deliverables/D1.4.pdf
● Engels, Christiane; Musyaffa, Fathoni; Dong, Tiansi; Klímek, Jakub; Mynarz, Jindřich;
Orlandi, Fabrizio; Auer, Sören (2016). Deliverable 2.1: Tools for semantic lifting of
multiformat budgetary data. http://openbudgets.eu/assets/deliverables/D2.1.pdf
● Klímek, Jakub; Mynarz, Jindřich; Škoda, Petr; Zbranek, Jaroslav; Zeman, Václav
(2016). Deliverable D2.2: Data optimisation, enrichment, and preparation for analysis.
http://openbudgets.eu/assets/deliverables/D2.2.pdf
● Gökgöz, Fahrettin; Auer, Sören; Takis, Jaana (2015). Deliverable D4.2: Analysis of the
required functionality of OpenBudgets.eu.
http://openbudgets.eu/assets/deliverables/D4.2.pdf
● Alberts, Anna; Wurnig, Dominik; Kayser-Bril, Nicolas; Bouyer, Anne-Lise (2015).
Deliverable D5.1: User Requirement Reports - First Cycle.
http://openbudgets.eu/assets/deliverables/D5.1.pdf
● Aiossa, Nicholas; Alberts, Anna (2016). Deliverable D6.2: Needs Analysis Report.
http://openbudgets.eu/assets/deliverables/D6.2.pdf
● Cabo Calderón, David; Belmonte Belda, Eva; Díaz Poblete, Raúl; Campos Reviriego,
Daniel Amir; de Vega de la Sierra, Javier (2016). Deliverable D7.1: Assessment Report.
http://openbudgets.eu/assets/deliverables/D7.1.pdf

D2.3 – v.1.0
Page 32
● Alberts, Anna; Wagner, Eileen; Le Guen, Cecile; Kayser-Bril, Nicolas; Del Campos,
Amir; Lämmerhirt, Danny; Gray, Jonathan; Sedmihradská, Lucie (2016). Deliverable
8.3: Stakeholder identification and outreach plan.
http://openbudgets.eu/assets/deliverables/D8.3.pdf
Papers on tools/algorithms:
Similarity learning:
o Atzmon, Yuval; Uri Shalit; Gal Chechik (2015). Learning Sparse Metrics, One
Feature at a Time. In Journal of Machine Learning Research 1.
Rule/pattern mining:
o Agrawal, Rakesh; Mannila, Heikki; Srikant, Ramakrishnan; Toivonen, Hannu;
Verkamo, A. Inkeri (1996). Fast Discovery of Association Rules. In Advances in
knowledge discovery and data mining, 12(1).
o Zaki, Mohammed J.; Parthasarathy, Srinivasan; Ogihara, Mitsunori; Li, Wei
(1997). New Algorithms for Fast Discovery of Association Rules. In KDD (Vol.
97).
o Han, Jiawei; Jian Pei; Yiwen Yin (2000). Mining frequent patterns without
candidate generation. In ACM Sigmod Record (Vol. 29).
o Uno, Takeaki; Asai, Tatsuya; Uchida, Yuzo; Arimura, Hiroki (2003). LCM: An
Efficient Algorithm for Enumerating Frequent Closed Item Sets. In FIMI (Vol.
90).
Outlier/anomaly detection:
o Chandola, Varun; Banerjee, Arindam; Kumar, Vipin (2009). Anomaly detection:
A survey. In ACM computing surveys (CSUR).
Clustering:
o MacQueen, James (1967). Some methods for classification and analysis of
multivariate observations. In Proceedings of the fifth Berkeley symposium on
mathematical statistics and probability (Vol. 1).
o Johnson, Stephen (1967). Hierarchical clustering schemes. In Psychometrika.
o Ester, Martin; Kriegel, Hans-Peter; Sander, Jörg; Xu, Xiaowei (1996). A density-
based algorithm for discovering clusters in large spatial databases with noise.
In KDD (Vol. 96).
Graph/network Analysis:
o Barabási, Albert-László (2016). Network Science. In Cambridge University
Press.
o Lee, Sangkeun; Sukumar, Sreenivas; Hong, Seokyong; Lim, Seung-Hwan
(2016). Enabling graph mining in RDF triplestores using SPARQL for holistic in-
situ graph analysis. In Expert Systems with Applications (Vol. 48).
Pattern matching:
o Boyer, Robert S.; Moore, J. Strother (1977). A fast string searching algorithm.
In Communications of the ACM (Vol. 20).
SPARQL:
o Techentin, Robert; Gilbert, Barry; Lugowski, Adam; Deweese, Kevin; Gilbert,
John; Dull, Eric;Hinchey, Mike; Reinhardt, Steven (2014). Implementing
Iterative Algorithms with SPARQL. In Edbt/icdt workshops.


