REPUBLIC OF SEYCHELLES
Ministry of Education
DEPARTMENT OF TERTIARY EDUCATION, POLICY PLANNING AND ADMINISTRATION
Policy Planning and Research Division (PPRD)
EDUCATION STATISTICS 2015
Education Management Information System (EMIS) Section
June 2016
I
FOREWORD
This publication contains accurate and up-to-date information on
national, public and private schooling from early childhood to
secondary. Statistical information is a vital resource for shaping the
planning of educational policy. This resource is used to present an
up-to-date picture of the nation's education landscape, to enable
assessment of the performance of the various sectoral components
against set targets, and facilitates the formulation of informed
policies to make accurate projections on key aspects of our education
system, including resource mobilization.
As we strive to achieve the targets set in the Ministry's Medium-Term Strategy 2013-2017 and beyond, it
is essential that we are guided in our planning by the most up-to-date and accurate statistical information
on all aspects of our education and training system.
The Ministry's Education Management Information System (EMIS) is the mechanism by which the
Ministry collects, processes and enhances data collection, and ensures the dissemination of key
information in a timely manner.
Building on the extended range of information provided in the 2014 Education Statistics, this publication
presents a more comprehensive range of statistical information based on the data gathered from the
Annual School Census 2015 exercise for the Early Childhood (Crèche), Primary, Secondary Schools, as
well as the Tertiary University and non-University education sectors. Statistical information on private
education institutions is also included in this publication.
I wish to thank all stakeholders for their co-operation in making such a valuable and crucial contribution
to the preparation of this key Ministry of Education resource document. Your much appreciated
collaboration will help to ensure that the education community, stakeholders, and the citizens of
Seychelles will have a greater understanding and appreciation of the education system that we all seek to
enhance.
A special thanks to our EMIS officers, our Head teachers and office managers who co-ordinated the
submission of data in an effective and efficient manner.
We look forward to your continued co-operation in this highly important work, in our commitment to
provide accurate statistical information, so necessary for the future planning of educational policies that
will help to raise the standard and quality of our education and training system in the years ahead.
In this collective endeavour, we welcome your observations and comments on the Ministry's 2015
Statistics Booklet.
I am very pleased to launch this excellent publication, a truly collaborative production on the part of all
involved.
II
TABLE OF CONTENTS Page
FOREWORD ...................................................................................................................................................................... i
LIST OF TABLES ............................................................................................................................................................... v
LIST OF FIGURES ............................................................................................................................................................ vi
LIST OF ACRONYMS ...................................................................................................................................................... vii
LIST OF EDUCATIONAL INSTITUTIONS ........................................................................................................................ viii
GEOGRAPHICAL LOCATION OF EDUCATIONAL INSTITUTIONS ON MAHE ................................................................... ix
GEOGRAPHICAL LOCATION OF EDUCATIONAL INSTITUTIONS ON INNER ISLANDS ..................................................... x
INTRODUCTION ............................................................................................................................................................. xi
The Ministry’s Education Management Information System (EMIS): ....................................................................... xi
1. THE MINISTRY OF EDUCATION ............................................................................................................................... 1
1.1 Vision, Mission and Mandate of the Ministry of Education ........................................................................... 1
1.1.1 Vision ....................................................................................................................................................... 1
1.1.2 Mission .................................................................................................................................................... 1
1.1.3 Mandate .................................................................................................................................................. 1
1.2 Structure of the Seychelles Education System ................................................................................................ 2
1.3 Methodology ................................................................................................................................................... 3
1.4 The Main Education Indicators ....................................................................................................................... 4
1.4.1 Definitions of Key Education Indicators .................................................................................................. 4
1.4.1.1 Gross Enrolment Rate (GER) ................................................................................................................. 4
1.4.1.2 Net Enrolment Rate (NER) ...................................................................................................................... 4
1.4.1.3 Gross Intake Rate (GIR) or Gross Admission Rate (GAR) ........................................................................ 4
1.4.1.4 Net Intake Rate (NIR) or Net Admission Rate (NAR) .............................................................................. 5
1.4.1.5 Completion Rate (CR) ............................................................................................................................. 5
1.4.1.6 Transition Rate (TR) ................................................................................................................................ 5
1.4.1.7 Pupil-Teacher Ratio (PTR) ....................................................................................................................... 5
1.4.1.8 Gender Parity Index (GPI) ....................................................................................................................... 5
1.4.1.9 Attrition rate of teachers ....................................................................................................................... 5
2. NON-FORMAL EARLY CHILDHOOD (DAY CARE PROVISION) ................................................................................. 6
3. EARLY CHILDHOOD EDUCATION (CRECHE) - ISCED LEVEL 0 .................................................................................. 7
4. PRIMARY EDUCATION - ISCED LEVEL 1 ................................................................................................................ 10
4.1 ATTRITION OF PRIMARY TEACHERS .............................................................................................................. 14
5. SPECIAL NEEDS EDUCATION ................................................................................................................................. 15
6. SECONDARY EDUCATION - ISCED LEVEL 2 & ISCED LEVEL 3 ................................................................................ 16
III
6.1 ISCED LEVEL 2 LOWER SECONDARY EDUCATION .......................................................................................... 16
6.2 ISCED LEVEL 3 UPPER SECONDARY EDUCATION ........................................................................................... 16
6.2.1 TECHNICAL VOCATIONAL EDUCATIONAL AND TRAINING (TVET) ............................................................. 20
6.2.2 UPPER SECONDARY EDUCATION (ADVANCED LEVEL STUDIES) ................................................................ 22
6.2.3 ATTRITION OF TEACHERS IN SECONDARY SCHOOLS (S1 – S5) .................................................................. 23
7. TERTIARY NON-UNIVERSITY EDUCATION AND TRAINING - ISCED LEVEL 4 ........................................................ 24
7.1 ENROLMENT IN 2015 .................................................................................................................................... 25
7.2 GRADUATES AND DROPOUTS IN 2015 .......................................................................................................... 26
7.3 ATTRITION OF LEARNERS IN 2015 ................................................................................................................. 30
7.4 ATTRITION OF TEACHING STAFF, 2015 ......................................................................................................... 32
8. TERTIARY UNIVERSITY EDUCATION (ISCED LEVEL 5 - ISCED LEVEL 8) ................................................................. 33
9. NATIONAL AND INTERNATIONAL EXAMINATION RESULTS ................................................................................ 39
9.1.1 The P6 (Key Stage 3) National Examination Results by Subject and by Grade in State Schools, 2015 ..... 39
9.1.2 The P6 (Key Stage 3) National Examination Results by Subject and by Grade in State Schools, 2014 ..... 40
9.2.1 The S3 Coordinated (Key Stage 4) National Examination Results by Subject and by Grade in State
Schools, 2015 ............................................................................................................................................................ 41
9.2.2 The S3 Coordinated (Key Stage 4) National Examination Results by Subject and by Grade in State
Schools, 2014 ............................................................................................................................................................ 42
9.3.1 The S5/S4 DELF Scolaire in State Schools, 2015 ........................................................................................ 43
9.3.2 The S5/S4 DELF Scolaire in State Schools, 2014 ........................................................................................ 44
9.4.1 The IGCSE Examination Results of S5 Candidates by Subject and by Grade in State Schools, 2015 ....... 45
9.4.2 The IGCSE Examination Results of S5 Candidates by Subject and by Grade in State Schools, 2014 ....... 46
9.5.1 The GCE (A-Level) Examination Results by Subject and by Grade – School of Advanced Level
Studies, 2015 ........................................................................................................................................................... 47
9.5.2 The GCE (A-Level) Examination Results by Subject and by Grade – School of Advanced Level
Studies, 2014 ........................................................................................................................................................... 48
ANNEXES ....................................................................................................................................................................... 49
Annex 1: Enrolment by Level in State and Private Institutions 2011 - 2015 ............................................................ 49
Annex 2: Student Teacher Ratio in State Schools 2010 - 2015 ................................................................................. 50
Annex 3: Number of students and classes in State and Private Primary Schools, 2015 ........................................... 51
Annex 4: Number of students and classrooms in State and Private Secondary Schools, 2015 ................................ 52
Annex 5: Total Number of Full-Time Students Enrolled in Tertiary Non-University Institutions by Gender and Year,
2015 .......................................................................................................................................................................... 53
Annex 6: Total Number of Distance Students Enrolled in State Tertiary Non-University Institutions by Gender and
Year, 2015 ................................................................................................................................................................. 53
IV
Annex 7: Total Number of Part-Time Students Enrolled in State Tertiary Non-University Institutions by Gender
and Year, 2015 .......................................................................................................................................................... 53
Annex 8: Total Number of Apprenticeship Students Enrolled in State Tertiary Non-University Institutions by
Gender and Year, 2015 ............................................................................................................................................. 53
Annex 9: Total Number of Students (Full-Time, Part-time, Apprenticeship & Distance) Enrolled in NIHSS by
Programmes, Gender and Year, 2015 ....................................................................................................................... 54
Annex 10: Total Number of Full-Time Students Enrolled in SBSA by Programmes, Gender and Year, 2015 ........... 54
Annex 11: Total Number of Full-Time Students Enrolled in SIAD by Programmes, Gender and Year, 2015 ........... 54
Annex 12: Total Number of Full-Time and Apprenticeship Students Enrolled in SIT by Programmes, Gender and
Year, 2015 ................................................................................................................................................................. 55
Annex 13: Total Number of Full-Time and Apprenticeship Students Enrolled in SIAH by Programmes, Gender and
Year, 2015 ................................................................................................................................................................. 55
Annex 14: Total Number of Full-Time and Apprenticeship Students Enrolled in SMA by Programmes, Gender and
Year, 2015 ................................................................................................................................................................. 55
Annex 15: Total Number of Full-Time and Part-Time Students Enrolled in SITE by Programmes, Gender and Year,
2015 .......................................................................................................................................................................... 56
Annex 16: Total Number of Full-Time and Apprenticeship Students Enrolled in STA by Programmes, Gender and
Year, 2015 ................................................................................................................................................................. 56
Annex 17: Total Number of Distance/online Students Enrolled in SIDOL by Programmes, Gender and Year, 2015
................................................................................................................................................................................... 57
Annex 18: Programmes on Offer in Tertiary Non-University Education and Training Institutions, 2015 ................ 57
Annex 19: Programmes on Offer in University of Seychelles (UniSey), 2015 ........................................................... 60
Annex 20: Total Number of Students Enrolled in UniSey by Age, Year and Gender, 2015 ...................................... 61
Annex 21: Total Number of Students Enrolled in UniSey by Programmes, Gender and Year, 2015 ........................ 62
Annex 22: Crèche, Primary and Secondary Enrolment by Class, Age and Gender in Private Schools, 2015 ............ 64
Annex 23: Crèche, Primary and Secondary Enrolment by Class, Age and Gender in State Schools, 2015 ............... 65
Annex 24: Crèche, Primary and Secondary Enrolment by Class, Age and Gender in State and Private Schools, 2015
................................................................................................................................................................................... 66
Annex 25: Tertiary Non-University Enrolment by Year, Age and Gender in State Institutions, 2015 ...................... 67
Annex 26: Projected Mid 2015 Population by Age Group and by Sex ...................................................................... 68
Annex 27: Broad Groups and Fields of Education ..................................................................................................... 69
V
LIST OF TABLES
Table 1: National Education Programmes According to ISCED 2011................................................................................................ 2
Table 2: Number of Children and Staff in Registered Day Care Centres, by Gender, 2015 .............................................................. 6
Table 3: Total Number of Pupils Enrolled by Gender and Number of Classrooms in State and Private Crèches, 2015 ................... 8
Table 4: Number of Full-Time Teaching Staff by Gender and Nationality in State and Private Crèches, 2015 ................................ 9
Table 5: Total Number of Pupils Enrolled by Gender and Number of Classrooms in State and Private Primary Schools, 2015 .... 10
Table 6: Total Number of Full-Time Teaching Staff by Gender and Nationality in State and Private Primary Schools, 2015 ........ 12
Table 7: Total Number of Students Enrolled by Gender in Special Schools, 2014 ......................................................................... 15
Table 8: Total Number of Students Enrolled by Gender and Number of Classrooms in State and Private Secondary Schools, 2015
........................................................................................................................................................................................................ 17
Table 9: Total Number of Full-Time Teaching Staff by Gender and Nationality in State and Private Secondary Schools, 2015 .... 18
Table 10: Number of Students Enrolled in TVET Phase One Programme at S4 and S5 Levels, by School and Gender, 2015 ........ 20
Table 11: Status of TVET cohort, 2013 - 2014 ................................................................................................................................ 20
Table 12: Number of Students and classrooms by Year and by gender in State and Private upper Secondary Institutions, 2015 22
Table 13: Total Number of Full-Time Teaching Staff by Gender and Nationality in State and Private Upper Secondary Schools,
2015 ................................................................................................................................................................................................ 22
Table 14: Total Number of Students (Full-Time, Part-time, Apprenticeship & Distance) Enrolled in Tertiary Non-University
Institutions by Gender and Year, 2015 ........................................................................................................................................... 25
Table 15: Total Number of Full-Time Students Enrolled in State Tertiary Non-University Institutions by Gender and Year, 2015 25
Table 16: Total Number of Part-Time Students Enrolled in State Tertiary Non-University Institutions by Gender and Year, 2015
........................................................................................................................................................................................................ 25
Table 17: Total Number of Apprenticeship Students Enrolled in State Tertiary Non-University Institutions by Gender and Year,
2015 ................................................................................................................................................................................................ 26
Table 18: Total Number of Distance and Open Learning Students Enrolled in State Tertiary Non-University Institutions by
Gender and Year, 2015 ................................................................................................................................................................... 26
Table 19: Seychelles Maritime Academy (SMA) ............................................................................................................................. 26
Table 20: National Institute of Health and Social Studies (NIHSS) ................................................................................................. 27
Table 21: Seychelles Business Studies Academy (SBSA) ................................................................................................................. 27
Table 22: Seychelles Institute of Art and Design (SIAD) ................................................................................................................. 27
Table 23: Seychelles Institute of Agriculture & Horticulture (SIAH) ............................................................................................... 28
Table 24: Seychelles Institute of Distance and Open Learning (SIDOL) .......................................................................................... 28
Table 25: Seychelles Institute of Technology (SIT) ......................................................................................................................... 28
Table 26: Seychelles Institute of Teacher Education (S.I.T.E) ......................................................................................................... 29
Table 27: Seychelles Tourism Academy (STA) ................................................................................................................................ 29
Table 28: Learners attrition in Tertiary Non-University Institutions by Reasons and Gender, 2015.............................................. 30
Table 29: Number of Learners Graduated and Dropouts by Programme and by Gender in UniSey, 2015 .................................... 36
Table 30: P6 National Examination Results by Subject and by Grade in State Schools, 2015 ........................................................ 39
Table 31: P6 National Examination Results by Subject and by Grade in State Schools, 2014 ........................................................ 40
Table 32: S3 Coordinated National Examination Results by Subject and by Grade in State Schools, 2015 ................................... 41
Table 33: S3 Coordinated National Examination Results by Subject and by Grade in State Schools, 2014 ................................... 42
Table 34: S5 & S4 DELF Scolaire by Level and by Gender in State Schools, 2015 ........................................................................... 43
Table 35: S5 & S4 DELF Scolaire by Level and by Gender in State Schools, 2014 ........................................................................... 44
Table 36: IGCSE Examination Results of S5 Candidates by Subject and by Grade in State Schools, 2015 ..................................... 45
Table 37: IGCSE Examination Results of S5 Candidates by Subject and by Grade in State Schools, 2014 ..................................... 46
Table 38: GCE (A-Level) Examination Results by Subject and by Grade, 2015 ............................................................................... 47
Table 39: GCE (A-Level) Examination Results by Subject and by Grade, 2014 ............................................................................... 48
VI
LIST OF FIGURES
Figure 1: Highest Qualification of Full-Time Teaching Staff in State Crèches, 2015 ......................................................................... 9
Figure 2: Attrition of learners in state Primary schools by gender, 2015 ....................................................................................... 12
Figure 3: Highest Qualification of Full-Time Teaching Staff in State Primary Schools, 2015 .......................................................... 13
Figure 4: Percentage of Members of School Management by Gender and by Responsibility in State Primary Schools, 2015 ..... 13
Figure 5: Total Number of Primary Teaching Staff Exiting MoE by Month and by Gender, 2014 .................................................. 14
Figure 6: Total Number of Primary Teaching Staff Exiting MoE by Month and by Gender, 2015 .................................................. 14
Figure 7: Number of Staff in SEC by Responsibility and Gender, 2015 ........................................................................................... 15
Figure 8: Qualification of Full-Time Teaching Staff in State Secondary Schools, 2015 ................................................................... 18
Figure 9: Percentage of Teaching Staff in State Secondary Schools by Subject and by Gender, 2015 ........................................... 19
Figure 10: Number of Teaching Staff by Gender and by Schools in State Secondary Schools, 2015 ............................................. 19
Figure 11: Attrition of learners in state secondary schools (S1- S5), by gender, 2015 ................................................................... 21
Figure 12: Highest Qualification of Full-Time Teaching Staff in SALS by Gender, 2015 ................................................................. 22
Figure 13: Total Number of Secondary Teaching Staff Exiting MoE by Month and by Gender, 2014 ............................................ 23
Figure 14: Total Number of Secondary Teaching Staff Exiting MoE by Month and by Gender, 2015 ............................................ 23
Figure 15: Learners attrition in Tertiary Non- University Institutions by Reasons and Gender, 2015 ........................................... 30
Figure 16: Total Number of Full-Time Teaching Staff in Tertiary Non-University Institutions by Qualification and Gender, 2015 31
Figure 17: Total Number of Full-Time Teaching Staff in Tertiary Non-University Institutions by Nationality and Gender, 2015 .. 31
Figure 18: Age Distribution of Full-Time Teaching Staff in Tertiary Non-University Institutions by Gender, 2015 ........................ 32
Figure 19: Attrition of Full-Time Teaching Staff in Tertiary Non-University Institutions by Gender, 2015 .................................... 32
Figure 20: Age Distribution of Total Number of Learners Enrolled in UniSey by Gender, 2015 .................................................... 34
Figure 21: Learner Attrition in UniSey by Reason and by Gender, 2015 ........................................................................................ 35
Figure 22: Highest Qualification of Full-Time Academic Staff at UniSey by Gender, 2015 ............................................................ 37
Figure 23: Highest Qualification of Full-Time Academic Staff by Nationality and by Gender, 2015 .............................................. 37
Figure 24: Attrition of Teaching Staff at UniSey by Gender, 2015.................................................................................................. 38
Figure 25: P6 National Examination Results by Subject and by Grade in State Schools, 2015....................................................... 39
Figure 26: P6 National Examination Results by Subject and by Grade in State Schools, 2014....................................................... 40
Figure 27: Number of Grades obtained in S3 Coordinated National Examinations by subject in State Schools, 2015.................. 41
Figure 28: Number of Grades obtained in S3 Coordinated National Examinations by subject in State Schools, 2014.................. 42
Figure 29: DELF results of S5 Candidates by level and gender in State Schools, 2015 .................................................................. 43
Figure 30: DELF results of S5 Candidates by level and gender in State Schools, 2014 ................................................................... 44
Figure 31: IGCSE Examination Results of S5 Candidates by Subject and by Grade in State Schools, 2015 .................................... 45
Figure 32: IGCSE Examination Results of S5 Candidates by Subject and by Grade in State Schools, 2014 .................................... 46
VII
LIST OF ACRONYMS
"A" Level Advanced Level
"AS" Level Advanced Subsidiary Level
ACCA Advanced Diploma in Accounting and Business
AIDS Acquired Immune Deficiency Syndrome
ASC Annual School Census
BSC Bachelor of Science
CCATS Centre for Curriculum, Assessment and Teacher Support
CR Completion Rate
DELF Diplôme D’études en Langue Française
DR Drop-out Rate
EMIS Education Management Information System
GAR Admission Rate
GER Gross Enrolment Rate
GIR Gross Intake Rate
GPI Gender Parity Index
ICT Information and Communication Technology
IGCSE Cambridge International General Certificate of Secondary Education
ISCED International Standard Classification of Education
IT Information Technology
MoE Ministry of Education
NBS National Bureau of Statistics
NAR Net Admission Rate
NER Net Enrolment Rate
NIR Net Intake Rate
PCs Professional Centres
PPRD Policy Planning and Research Division
PSE Personal and Social Education
PTR Pupil-Teacher Ratio
SEC School for the Exceptional Child
TR Transition Rate
TVET Technical Vocational Educational and Training
UNESCO United Nations Educational, Scientific and Cultural Organization
VIII
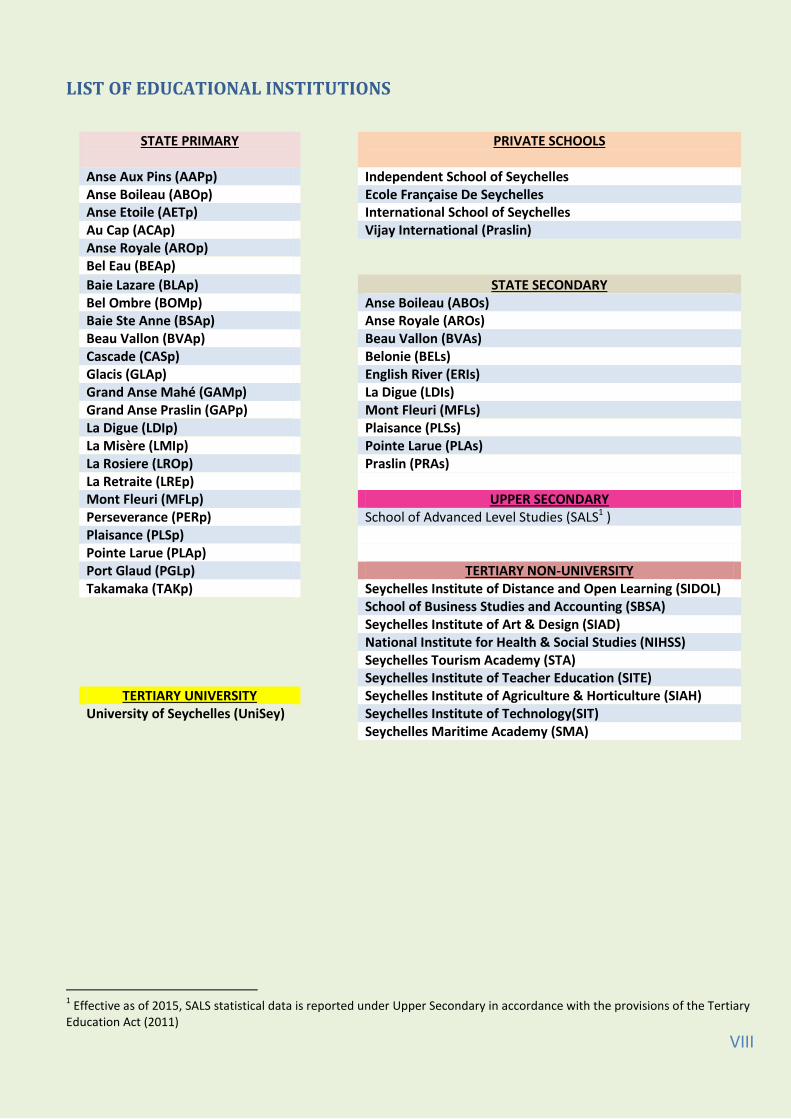
LIST OF EDUCATIONAL INSTITUTIONS
STATE PRIMARY
PRIVATE SCHOOLS
Anse Aux Pins (AAPp) Independent School of Seychelles Anse Boileau (ABOp) Ecole Française De Seychelles Anse Etoile (AETp) International School of Seychelles Au Cap (ACAp) Vijay International (Praslin) Anse Royale (AROp) Bel Eau (BEAp)
Baie Lazare (BLAp) STATE SECONDARY Bel Ombre (BOMp) Anse Boileau (ABOs) Baie Ste Anne (BSAp) Anse Royale (AROs) Beau Vallon (BVAp) Beau Vallon (BVAs) Cascade (CASp) Belonie (BELs) Glacis (GLAp) English River (ERIs) Grand Anse Mahé (GAMp) La Digue (LDIs) Grand Anse Praslin (GAPp) Mont Fleuri (MFLs) La Digue (LDIp) Plaisance (PLSs) La Misère (LMIp) Pointe Larue (PLAs) La Rosiere (LROp) Praslin (PRAs) La Retraite (LREp) Mont Fleuri (MFLp) UPPER SECONDARY Perseverance (PERp) School of Advanced Level Studies (SALS1 ) Plaisance (PLSp)
Pointe Larue (PLAp) Port Glaud (PGLp) TERTIARY NON-UNIVERSITY Takamaka (TAKp) Seychelles Institute of Distance and Open Learning (SIDOL)
School of Business Studies and Accounting (SBSA) Seychelles Institute of Art & Design (SIAD) National Institute for Health & Social Studies (NIHSS) Seychelles Tourism Academy (STA) Seychelles Institute of Teacher Education (SITE)
TERTIARY UNIVERSITY Seychelles Institute of Agriculture & Horticulture (SIAH) University of Seychelles (UniSey) Seychelles Institute of Technology(SIT) Seychelles Maritime Academy (SMA)
1 Effective as of 2015, SALS statistical data is reported under Upper Secondary in accordance with the provisions of the Tertiary
Education Act (2011)
IX
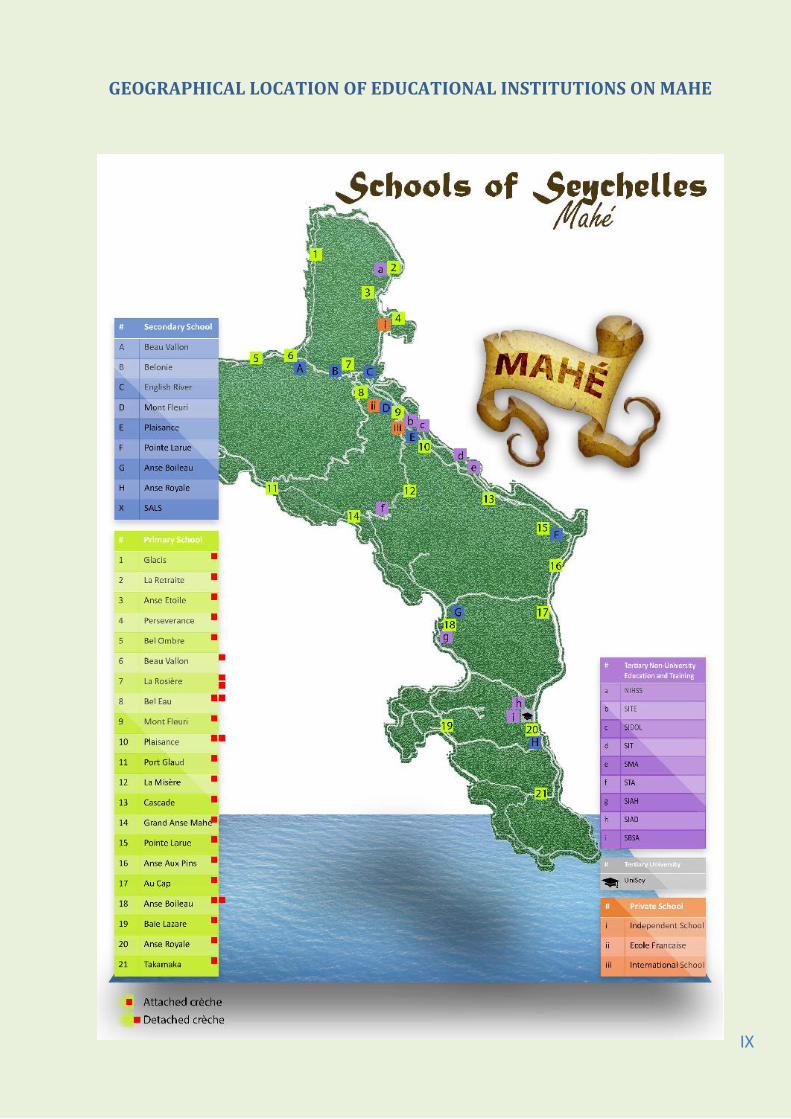
GEOGRAPHICAL LOCATION OF EDUCATIONAL INSTITUTIONS ON MAHE
X
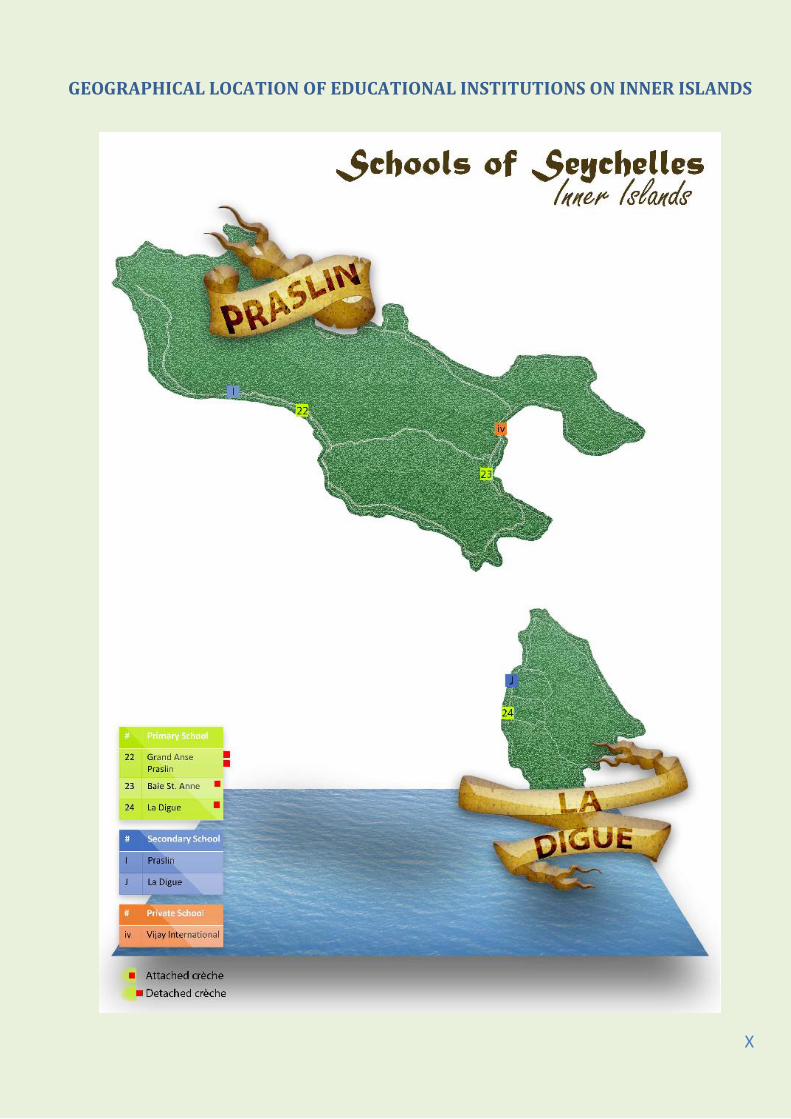
GEOGRAPHICAL LOCATION OF EDUCATIONAL INSTITUTIONS ON INNER ISLANDS
XI
INTRODUCTION
The Ministry’s Education Management Information System (EMIS):
The Ministry of Education’s Education Management Information System (EMIS) Section operates
under the Policy Planning and Research Division. It facilitates decision-making and the
formulation of policies by providing reliable data on the current education system. It also assists
in the implementation, evaluation and monitoring processes within the ministry. The Annual
Education Statistic Booklet prepared by EMIS is a vital source of essential statistical information
about education and training in Seychelles, which enables the Ministry of Education to meet the
information needs of all stakeholders, both nationally and internationally.
.
Introducing the International Standard Classification of Education (ISCED) Education systems throughout the world differ from another in terms of structure and curricular
content. Consequently, it can be difficult to benchmark performance across multiple countries or
monitor progress towards national and international goals. In order to understand and properly
interpret inputs, processes and outcomes of education systems from a global perspective, it is
vital to ensure that data are comparable.
To achieve this objective, the EMIS is introducing the International Standard Classification of
Education (ISCED), the standard framework used to categorise and report cross-nationally
comparable education statistics in this publication.
ISCED classifies education programmes by their content using two main cross-classification
variables: levels of education (see Table 1) and fields of education (see Annex 27).
Initially developed by UNESCO in the 1970s, and first revised in 1997, the ISCED classification
serves as an instrument to compile and present education statistics both nationally and
internationally. At its 36th session in November 2011, the General Conference adopted the
ISCED 2011 Classification.
Seychelles is a Member State of UNE SCO, and provides educational statistics annually. The
publication of the Education Statistics Booklet 2015 contains vital statistics on the Seychelles
education system for the past school year (2015). The list of indicators in this publication,
classified under the themes of access, quality, internal efficiency, outcome and equity, includes
XII
data from all state and private educational institutions in the country. Data is organised into five
subsectors:
- Early Childhood,
- Primary,
- Secondary,
- Tertiary Non-University, and
- Tertiary University.
The main purpose of the Education Statistics Booklet 2015 is to provide relevant, reliable and
updated data for purposes of planning and research, as well as the formulation of education
policies and plans at both national and international levels.
P a g e | 1
1. THE MINISTRY OF EDUCATION
1.1 Vision, Mission and Mandate of the Ministry of Education
1.1.1 Vision
The vision of the Ministry of Education is to empower future citizens to contribute positively to the
process of building a sustainable, peaceful and harmonious Seychelles society whilst safeguarding
and promoting our unique traditions and cultural values.
1.1.2 Mission
The mission of the Ministry of Education is to build a coherent and comprehensive system of quality
education and training reflecting universal and national values, which will promote the integrated
development of the person and empower him/her to participate fully in social and economic
development.
1.1.3 Mandate
The Ministry of Education’s primary mandate concerning education is derived from Article 33 of the
Constitution (1993) on the Right to Education:
“The State recognizes the right of every citizen to education and with a view to ensuring the
effective realization of this right undertakes -
(a) to provide compulsory education, which shall be free in State Schools, for such
minimum period, which shall not be less than ten years2, as may be prescribed by
law;
(b) to ensure that educational programmes in all schools are aimed at the complete
development of the person;
(c) to afford, on the basis of intellectual ability, every citizen equal access to
educational opportunities and facilities beyond the period of compulsory
education.
(d) to allow, subject to such reasonable restriction, supervision and conditions as are
necessary in a democratic society, any person, organization or institution to
establish and maintain a private school.
(e) to respect the right of parents to choose whether to send their children to a State
or private school.”
2 Effective as of January 2016, compulsory education is of 11 years’ duration, from age 6 to 16 years, which is free.
P a g e | 2
1.2 Structure of the Seychelles Education System
While the Seychelles education system has undergone five major reforms during the past 40 years, the
philosophy and principles on which the education system is based on has not changed. It encompasses both
formal and non-formal educational frameworks.
The formal education framework consists of the following main levels: pre-primary (crèche), primary,
secondary (to Cambridge A-Level), tertiary non-university education and training (professional centres), and
tertiary university education and training.
The informal educational framework includes non-formal early childhood, adult education and social and
youth activities. Up to December 2015 in Seychelles, compulsory education was of 10 years’ duration, from
ages 6 to 15; it covered six years in primary and four years in secondary education, all of which is free. From
January 2016, this has been augmented to 11 years, with an additional year in secondary.
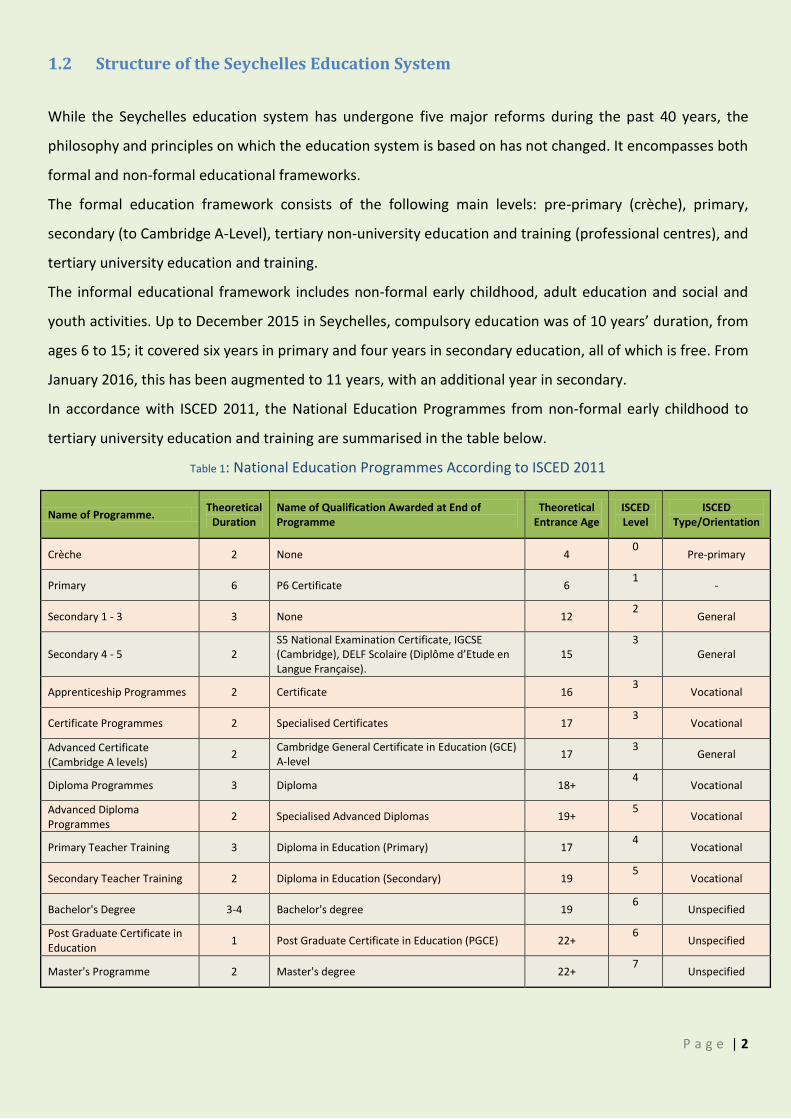
In accordance with ISCED 2011, the National Education Programmes from non-formal early childhood to
tertiary university education and training are summarised in the table below.
Table 1: National Education Programmes According to ISCED 2011
Name of Programme. Theoretical
Duration Name of Qualification Awarded at End of Programme
Theoretical Entrance Age
ISCED Level
ISCED Type/Orientation
Crèche 2 None 4 0
Pre-primary
Primary 6 P6 Certificate 6 1
-
Secondary 1 - 3 3 None 12 2
General
Secondary 4 - 5 2 S5 National Examination Certificate, IGCSE (Cambridge), DELF Scolaire (Diplôme d’Etude en Langue Française).
15 3
General
Apprenticeship Programmes 2 Certificate 16 3
Vocational
Certificate Programmes 2 Specialised Certificates 17 3
Vocational
Advanced Certificate (Cambridge A levels)
2 Cambridge General Certificate in Education (GCE) A-level
17 3
General
Diploma Programmes 3 Diploma 18+ 4
Vocational
Advanced Diploma Programmes
2 Specialised Advanced Diplomas 19+ 5
Vocational
Primary Teacher Training 3 Diploma in Education (Primary) 17 4
Vocational
Secondary Teacher Training 2 Diploma in Education (Secondary) 19 5
Vocational
Bachelor's Degree 3-4 Bachelor's degree 19 6
Unspecified
Post Graduate Certificate in Education
1 Post Graduate Certificate in Education (PGCE) 22+ 6
Unspecified
Master's Programme 2 Master's degree 22+ 7
Unspecified
P a g e | 3
1.3 Methodology
In its effort to improve on the timeliness, accuracy, reliability and availability of information to various
users, EMIS created standardised educational database templates in 2015, which included fields for data
input on all staff and students in all state and private primary, secondary and Tertiary Non-University
Education and Training. To increase the scope of data collection in schools, an Annual School Census was
piloted for the first time, in 2015, in all State and Private primary, secondary and Tertiary Non-University
Education and Training educational institutions. This exercise aimed at collecting qualitative information
about the status of the institutions to substantiate the nature of data already collected, together with
additional information on resources, infrastructure, students’ behaviour and indicators on HIV/AIDS.
To ensure that all institutions understand the indicators and procedures to complete the database
templates and the Annual School Census, sensitisation sessions were conducted with the heads of all
institutions. Follow-up training sessions were then organised for the persons who would be responsible to
collect and compile the data within each institution. During these sessions and onsite support visits by EMIS
personnel in schools, they clarified queries and accuracy of data verified through a collaborative approach.
To calculate the 2015 educational indicators, the EMIS section used official population figures (updated as
of 2015) from the National Bureau of Statistics (NBS) together with finalised educational data from the staff
and students that were finalised by December 2015.
P a g e | 4
1.4 The Main Education Indicators
Education indicators are quantitative measures designed to indicate the nature, direction and extent of
change. They play an important role in the review of the education system as they describe key features of
an education system, establish a platform the Ministry to work with, and illustrate a comprehensive picture
of what has already been achieved, allowing for a better understanding of how the system works.
Education indicators may be either single statistics (e.g. number of qualified female teachers, number of
teachers with university degree, etc.) or composite statistics (gross enrolment ratio, pupil-teacher ratio,
etc.). To describe the performance of an education system, various indicators can be used together. Some
key indicators used in this Report, which are important in showing how the system is performing, are
presented below.
1.4.1 Definitions of Key Education Indicators
In calculating the key educational indicators, the following formulas have been sourced from
UNESCO’s Education Indicators Technical Guidelines (2009).
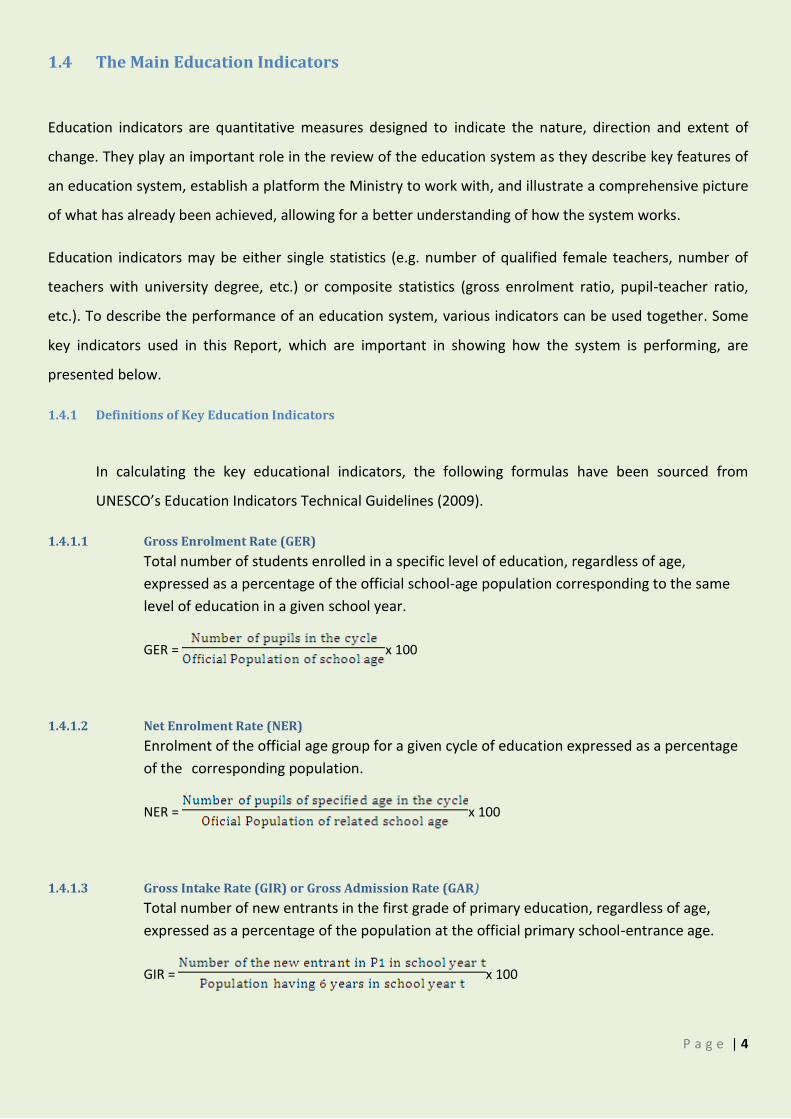
1.4.1.1 Gross Enrolment Rate (GER)
Total number of students enrolled in a specific level of education, regardless of age,
expressed as a percentage of the official school-age population corresponding to the same
level of education in a given school year.
GER = x 100
1.4.1.2 Net Enrolment Rate (NER)
Enrolment of the official age group for a given cycle of education expressed as a percentage
of the corresponding population.
NER = x 100
1.4.1.3 Gross Intake Rate (GIR) or Gross Admission Rate (GAR)
Total number of new entrants in the first grade of primary education, regardless of age,
expressed as a percentage of the population at the official primary school-entrance age.
GIR = x 100
P a g e | 5
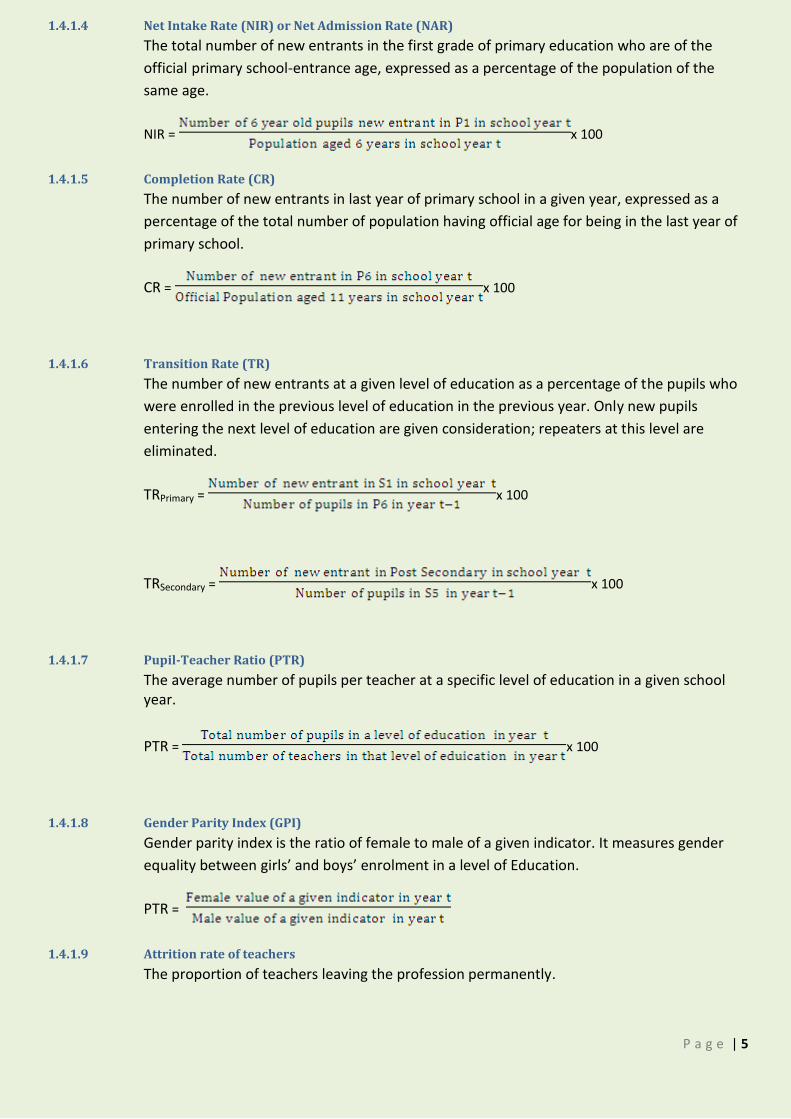
1.4.1.4 Net Intake Rate (NIR) or Net Admission Rate (NAR)
The total number of new entrants in the first grade of primary education who are of the
official primary school-entrance age, expressed as a percentage of the population of the
same age.
NIR = x 100
1.4.1.5 Completion Rate (CR)
The number of new entrants in last year of primary school in a given year, expressed as a
percentage of the total number of population having official age for being in the last year of
primary school.
CR = x 100
1.4.1.6 Transition Rate (TR)
The number of new entrants at a given level of education as a percentage of the pupils who
were enrolled in the previous level of education in the previous year. Only new pupils
entering the next level of education are given consideration; repeaters at this level are
eliminated.
TRPrimary = x 100
TRSecondary = x 100
1.4.1.7 Pupil-Teacher Ratio (PTR)
The average number of pupils per teacher at a specific level of education in a given school year.
PTR = x 100
1.4.1.8 Gender Parity Index (GPI)
Gender parity index is the ratio of female to male of a given indicator. It measures gender
equality between girls’ and boys’ enrolment in a level of Education.
PTR =
1.4.1.9 Attrition rate of teachers
The proportion of teachers leaving the profession permanently.
P a g e | 6
2. NON-FORMAL EARLY CHILDHOOD (DAY CARE PROVISION)
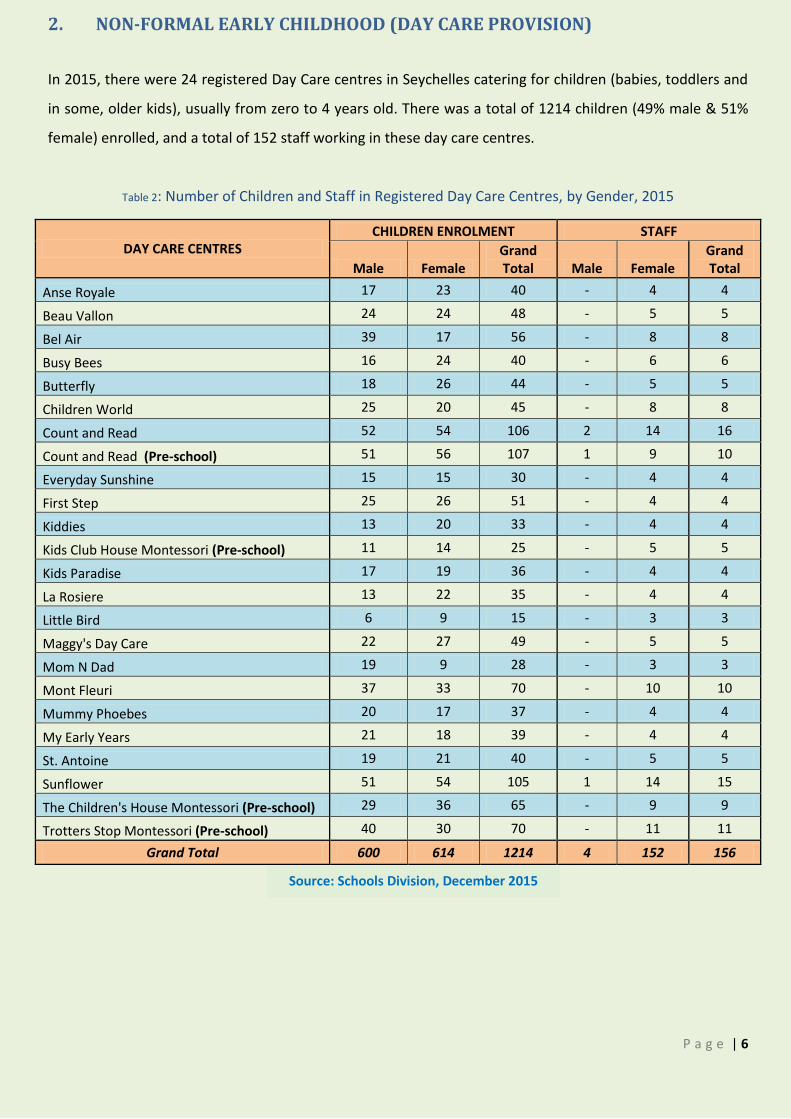
In 2015, there were 24 registered Day Care centres in Seychelles catering for children (babies, toddlers and
in some, older kids), usually from zero to 4 years old. There was a total of 1214 children (49% male & 51%
female) enrolled, and a total of 152 staff working in these day care centres.
Table 2: Number of Children and Staff in Registered Day Care Centres, by Gender, 2015
DAY CARE CENTRES CHILDREN ENROLMENT STAFF
Male Female Grand Total Male Female
Grand Total
Anse Royale 17 23 40 - 4 4
Beau Vallon 24 24 48 - 5 5
Bel Air 39 17 56 - 8 8
Busy Bees 16 24 40 - 6 6
Butterfly 18 26 44 - 5 5
Children World 25 20 45 - 8 8
Count and Read 52 54 106 2 14 16
Count and Read (Pre-school) 51 56 107 1 9 10
Everyday Sunshine 15 15 30 - 4 4
First Step 25 26 51 - 4 4
Kiddies 13 20 33 - 4 4
Kids Club House Montessori (Pre-school) 11 14 25 - 5 5
Kids Paradise 17 19 36 - 4 4
La Rosiere 13 22 35 - 4 4
Little Bird 6 9 15 - 3 3
Maggy's Day Care 22 27 49 - 5 5
Mom N Dad 19 9 28 - 3 3
Mont Fleuri 37 33 70 - 10 10
Mummy Phoebes 20 17 37 - 4 4
My Early Years 21 18 39 - 4 4
St. Antoine 19 21 40 - 5 5
Sunflower 51 54 105 1 14 15
The Children's House Montessori (Pre-school) 29 36 65 - 9 9
Trotters Stop Montessori (Pre-school) 40 30 70 - 11 11
Grand Total 600 614 1214 4 152 156
Source: Schools Division, December 2015
P a g e | 7
3. EARLY CHILDHOOD EDUCATION (CRECHE) - ISCED LEVEL 0
Programmes at ISCED level 0, or early childhood education, are typically designed with a holistic approach
to support children’s early cognitive, physical, social and emotional development and introduce young
children to organized instruction outside of the family context. ISCED level 0 refers to early childhood
programmes that have an intentional education component. These programmes aim to develop socio-
emotional skills necessary for participation in school and society. They also develop some of the skills
needed for academic readiness and prepare children for entry into primary education.
In Seychelles, the Ministry of Education provides educational services for children in the first two years of
early childhood education (ranging in age from 3 years and 3 months to 6 years) which are not compulsory,
hence not subjected to zoning. All the 24 districts have one or two (satellite) state crèches and are
administered by district primary schools. The five schools with satellite crèches are Bel Eau (La
Bourdonnais), Grand Anse Praslin (Anse Kerlan), Anse Boileau (Anse Louis), La Rosiere (English River) and
Plaisance (Les Mamelles) resulting with a total of 29 state crèches. In private, there are 4 crèches, in some
cases referred to as reception years.
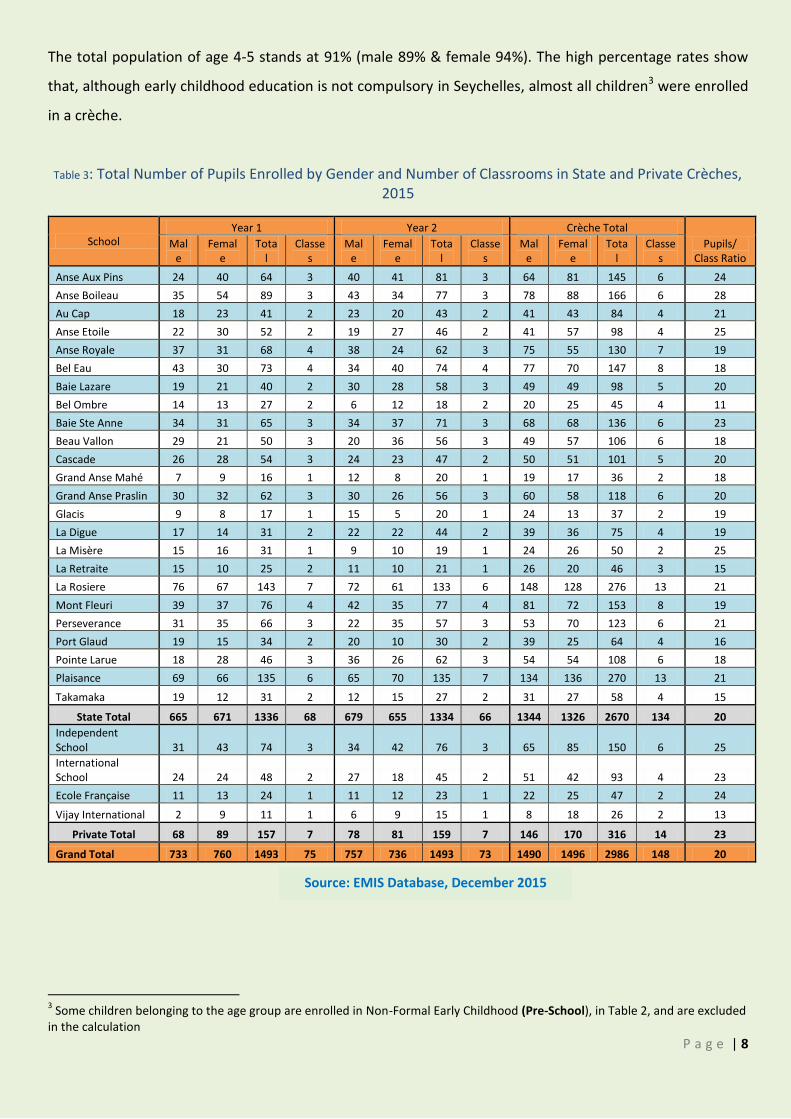
In 2015, there were 2986 children (50% male & 50% female) enrolled at ISCED Level 0 compared to 3030
pupils in 2014 (44 children less). State enrolment represents 89% with private enrolment accounting for the
remaining 11%. In state schools’ category, La Rosiere remains the crèche with the highest enrolment figure
(276 children) and Grand Anse Mahé with the lowest enrolment figure (36 children). In private,
Independent School has the highest enrolment figure (150 children) and Vijay International has the lowest
enrolment figure (26 children). Table 3 on page 8 shows enrolment figures by gender, number of classes
and pupil-class ratio per school in state and private crèches. On average, there are 21 pupils per class at
crèche level.
Gross Enrolment ratio (GER) in early childhood education, which is defined as the proportion of the total
number of children in early childhood, irrespective of age, to the total population of age 4-5, stands at
105% (male 104% & female 107%). Net Enrolment ratio (NER) in early childhood education is defined as the
proportion of the total number of children in early childhood, with the official age group.
P a g e | 8
The total population of age 4-5 stands at 91% (male 89% & female 94%). The high percentage rates show
that, although early childhood education is not compulsory in Seychelles, almost all children3 were enrolled
in a crèche.
Table 3: Total Number of Pupils Enrolled by Gender and Number of Classrooms in State and Private Crèches, 2015
School Year 1 Year 2 Crèche Total
Pupils/ Class Ratio
Male
Female
Total
Classes
Male
Female
Total
Classes
Male
Female
Total
Classes
Anse Aux Pins 24 40 64 3 40 41 81 3 64 81 145 6 24
Anse Boileau 35 54 89 3 43 34 77 3 78 88 166 6 28
Au Cap 18 23 41 2 23 20 43 2 41 43 84 4 21
Anse Etoile 22 30 52 2 19 27 46 2 41 57 98 4 25
Anse Royale 37 31 68 4 38 24 62 3 75 55 130 7 19
Bel Eau 43 30 73 4 34 40 74 4 77 70 147 8 18
Baie Lazare 19 21 40 2 30 28 58 3 49 49 98 5 20
Bel Ombre 14 13 27 2 6 12 18 2 20 25 45 4 11
Baie Ste Anne 34 31 65 3 34 37 71 3 68 68 136 6 23
Beau Vallon 29 21 50 3 20 36 56 3 49 57 106 6 18
Cascade 26 28 54 3 24 23 47 2 50 51 101 5 20
Grand Anse Mahé 7 9 16 1 12 8 20 1 19 17 36 2 18
Grand Anse Praslin 30 32 62 3 30 26 56 3 60 58 118 6 20
Glacis 9 8 17 1 15 5 20 1 24 13 37 2 19
La Digue 17 14 31 2 22 22 44 2 39 36 75 4 19
La Misère 15 16 31 1 9 10 19 1 24 26 50 2 25
La Retraite 15 10 25 2 11 10 21 1 26 20 46 3 15
La Rosiere 76 67 143 7 72 61 133 6 148 128 276 13 21
Mont Fleuri 39 37 76 4 42 35 77 4 81 72 153 8 19
Perseverance 31 35 66 3 22 35 57 3 53 70 123 6 21
Port Glaud 19 15 34 2 20 10 30 2 39 25 64 4 16
Pointe Larue 18 28 46 3 36 26 62 3 54 54 108 6 18
Plaisance 69 66 135 6 65 70 135 7 134 136 270 13 21
Takamaka 19 12 31 2 12 15 27 2 31 27 58 4 15
State Total 665 671 1336 68 679 655 1334 66 1344 1326 2670 134 20
Independent School 31 43 74 3 34 42 76 3 65 85 150 6 25
International School 24 24 48 2 27 18 45 2 51 42 93 4 23
Ecole Française 11 13 24 1 11 12 23 1 22 25 47 2 24
Vijay International 2 9 11 1 6 9 15 1 8 18 26 2 13
Private Total 68 89 157 7 78 81 159 7 146 170 316 14 23
Grand Total 733 760 1493 75 757 736 1493 73 1490 1496 2986 148 20
3 Some children belonging to the age group are enrolled in Non-Formal Early Childhood (Pre-School), in Table 2, and are excluded
in the calculation
Source: EMIS Database, December 2015
P a g e | 9
Table 4 below shows that in 2015, only female staff were teaching in both the state and private crèches in
Seychelles. All the teaching staff (100%) in the state crèches are Seychellois compared to 78% of the
teachers in private crèches.
Table 4: Number of Full-Time Teaching Staff by Gender and Nationality in State and Private Crèches, 2015
Local Expatriate Total Both Sexes
Male Female Total Male Female Total Male Female
State Total 0 143 143 0 0 0 0 143 143
Private Total 0 21 21 0 6 6 0 27 27
Grand Total 0 164 164 0 6 6 0 170 170
Source: EMIS Database, December 2015
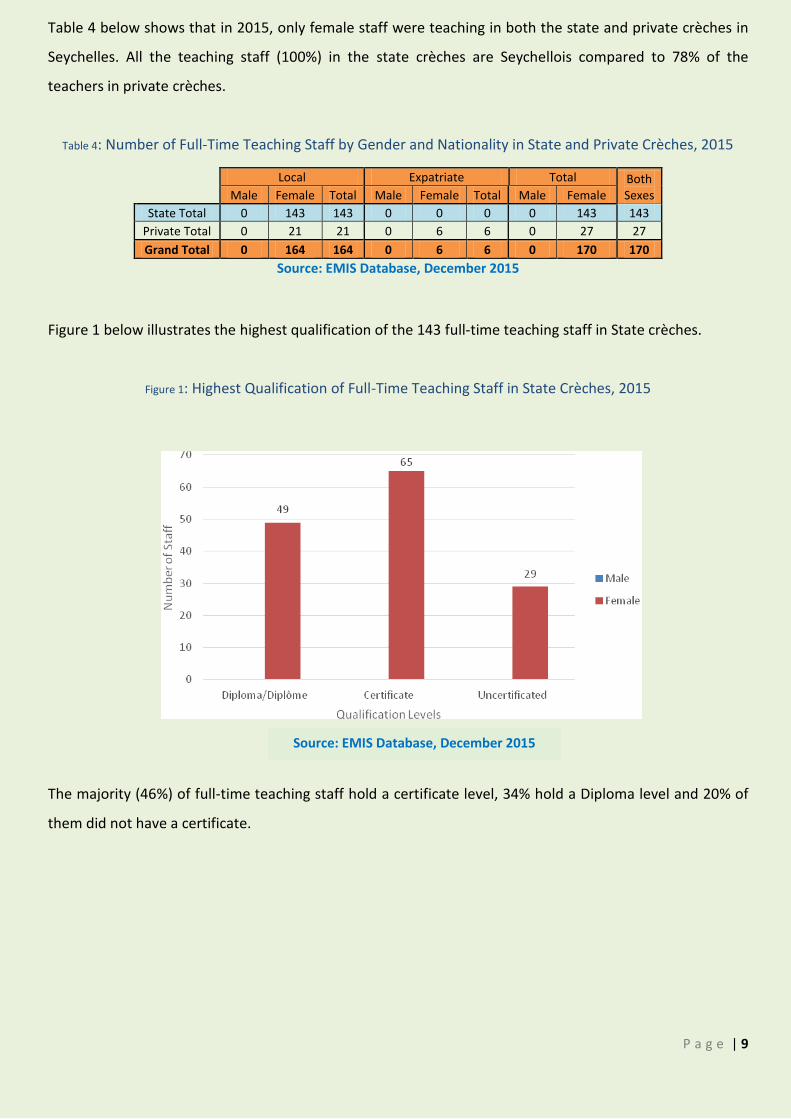
Figure 1 below illustrates the highest qualification of the 143 full-time teaching staff in State crèches.
Figure 1: Highest Qualification of Full-Time Teaching Staff in State Crèches, 2015
The majority (46%) of full-time teaching staff hold a certificate level, 34% hold a Diploma level and 20% of
them did not have a certificate.
Source: EMIS Database, December 2015
P a g e | 10
4. PRIMARY EDUCATION - ISCED LEVEL 1
Programmes at ISCED level 1, or primary education, are typically designed to provide students with
fundamental skills in reading, writing and mathematics (i.e. literacy and numeracy). Furthermore, it seeks to
establish a solid foundation for learning as well as understanding core areas of knowledge, personal and
social development, in preparation for lower secondary education. It focuses on learning at a basic level of
low complexity with limited, if any, specialisation involved. In Seychelles, up to December 2015, the
constitution makes provision for free compulsory education from the age of six (primary one) to fifteen
years (secondary four) and this is stipulated in the Education Act 2004.
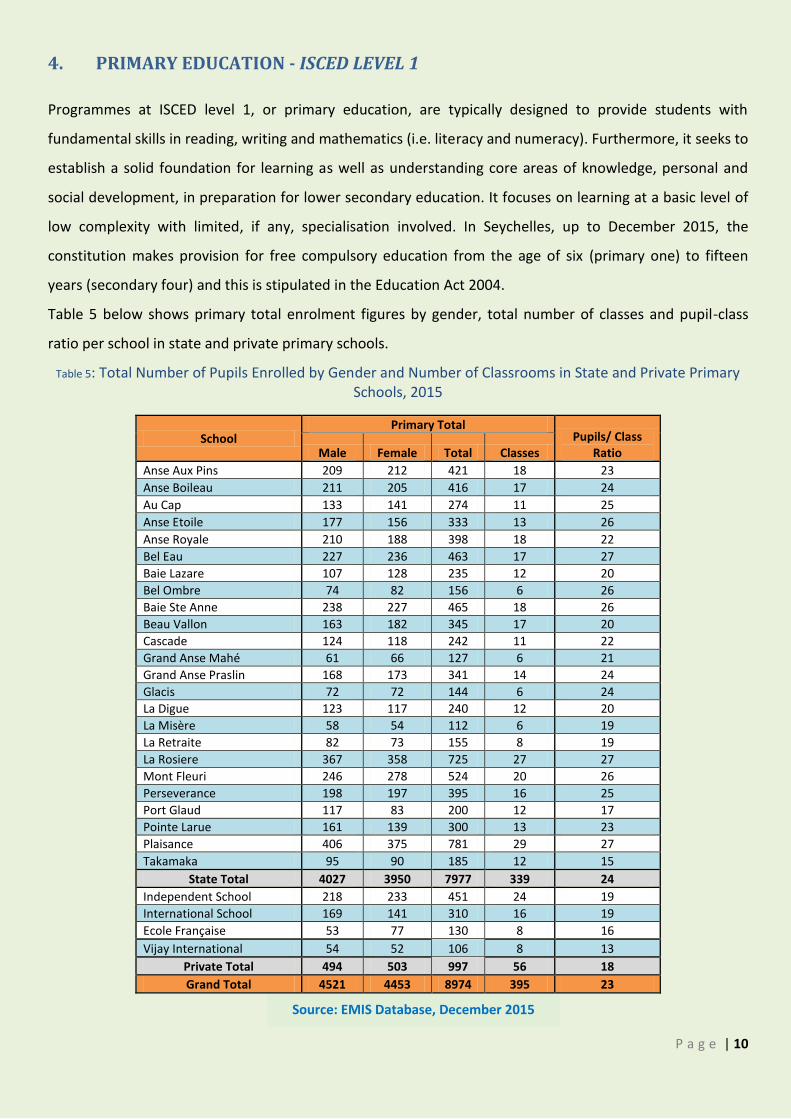
Table 5 below shows primary total enrolment figures by gender, total number of classes and pupil-class
ratio per school in state and private primary schools.
Table 5: Total Number of Pupils Enrolled by Gender and Number of Classrooms in State and Private Primary Schools, 2015
School Primary Total
Pupils/ Class Ratio Male Female Total Classes
Anse Aux Pins 209 212 421 18 23
Anse Boileau 211 205 416 17 24
Au Cap 133 141 274 11 25
Anse Etoile 177 156 333 13 26
Anse Royale 210 188 398 18 22
Bel Eau 227 236 463 17 27
Baie Lazare 107 128 235 12 20
Bel Ombre 74 82 156 6 26
Baie Ste Anne 238 227 465 18 26
Beau Vallon 163 182 345 17 20
Cascade 124 118 242 11 22
Grand Anse Mahé 61 66 127 6 21
Grand Anse Praslin 168 173 341 14 24
Glacis 72 72 144 6 24
La Digue 123 117 240 12 20
La Misère 58 54 112 6 19
La Retraite 82 73 155 8 19
La Rosiere 367 358 725 27 27
Mont Fleuri 246 278 524 20 26
Perseverance 198 197 395 16 25
Port Glaud 117 83 200 12 17
Pointe Larue 161 139 300 13 23
Plaisance 406 375 781 29 27
Takamaka 95 90 185 12 15
State Total 4027 3950 7977 339 24
Independent School 218 233 451 24 19
International School 169 141 310 16 19
Ecole Française 53 77 130 8 16
Vijay International 54 52 106 8 13
Private Total 494 503 997 56 18
Grand Total 4521 4453 8974 395 23
Source: EMIS Database, December 2015
P a g e | 11
In 2015, there were 28 primary schools (24 state and 4 private), with a total enrolment of 8, 974 pupils
(50% male and 50% female). Public enrolment represents 89% and private enrolment accounts for 11%. In
state enrolment, La Rosiere primary school has the highest enrolment figure (725 children) and La Misère
has the lowest enrolment figure (112 children). In private enrolment, Independent School has the highest
enrolment figure (451 children) and Vijay International has the lowest enrolment figure (106 children). On
average, the pupil/class ratio in state primary schools was 24 and 18 pupils per class in private schools.
Gross Intake Ratio (GIR) in primary: This is an indicator of access to primary education and indicates the
capacity of the education system to provide access to grade 1 (Primary 1) for the official primary school-
entrance age, which is 6 years in Seychelles. It is defined as the total number of new entrants in the first
grade of primary education, regardless of age, expressed as a percentage of the population at the official
primary school-entrance age.
In 2015, GIR for both sexes stood at 113% (male 113% &female 112%), illustrating some new entrants in the
first grade were more than 6 years old because of the cut-off age for crèche registration (3 years 9 months).
This means that some of the same age children born in the same year are registered in the following year,
subsequently the pattern continues across the primary and secondary cycles. On the other hand, Net Intake
Rate (NIR) which precisely looks at new entrants in the first grade who are exactly 6 years old. This indicator
is 83% for both sexes (male 85% &female 80%), indicating that some new entrants were excluded from the
calculation because they turned 6 years old in crèche (See Annex 22 - 24).
Gross Enrolment Ratio in primary: This is a crude measure of coverage of the education system in primary.
It is defined as the proportion of total enrolment in primary, irrespective of age, to the corresponding
school age population (6 - 11 years old) for primary. The value can exceed 100% due to the presence of
over aged students, which indicates the proportion of the children who are in schools in relation to those
outside the school system. For both sexes, it stood at 110% (male 110% & female 109%).
Net Enrolment Ratio in primary: This is another indicator of coverage of the primary school system. The net
enrolment ratio measures the extent to which school age children have access to schooling. It takes into
account those children in the age range of 6 - 11 and compares those students to the total population of
ages 6 - 11, which is a more refined indicator of coverage. This was 100% for both sexes in 2015, showing
that all school age children were enrolled in school.
P a g e | 12
Gender Disparity Index (GPI) in Primary: In a situation of perfect equality between boys and girls, the value
of GPI is 1 and in total inequality, maximum gender disparity the value is 0. In practice, the value of GPI falls
between 0 and 1. At primary, GPI indicates parity between females and males (0.99).
Completion Ratio: Pupils completing primary six is 107% for both sexes denoting a high degree of
completion of primary education.
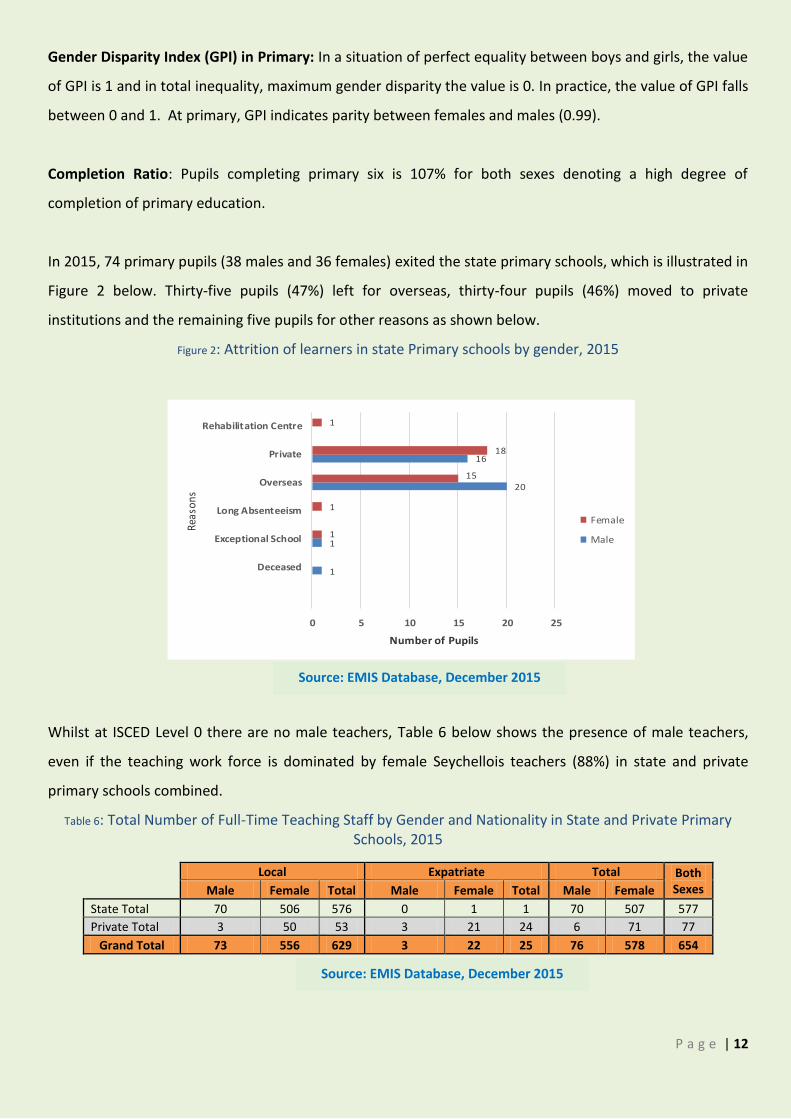
In 2015, 74 primary pupils (38 males and 36 females) exited the state primary schools, which is illustrated in
Figure 2 below. Thirty-five pupils (47%) left for overseas, thirty-four pupils (46%) moved to private
institutions and the remaining five pupils for other reasons as shown below.
Figure 2: Attrition of learners in state Primary schools by gender, 2015
1
1
20
16
1
1
15
18
1
0 5 10 15 20 25
Deceased
Exceptional School
Long Absenteeism
Overseas
Private
Rehabilitation Centre
Number of Pupils
Reas
ons
Female
Male
Whilst at ISCED Level 0 there are no male teachers, Table 6 below shows the presence of male teachers,
even if the teaching work force is dominated by female Seychellois teachers (88%) in state and private
primary schools combined.
Table 6: Total Number of Full-Time Teaching Staff by Gender and Nationality in State and Private Primary Schools, 2015
Local Expatriate Total Both Sexes
Male Female Total Male Female Total Male Female
State Total 70 506 576 0 1 1 70 507 577
Private Total 3 50 53 3 21 24 6 71 77
Grand Total 73 556 629 3 22 25 76 578 654
Source: EMIS Database, December 2015
Source: EMIS Database, December 2015
P a g e | 13
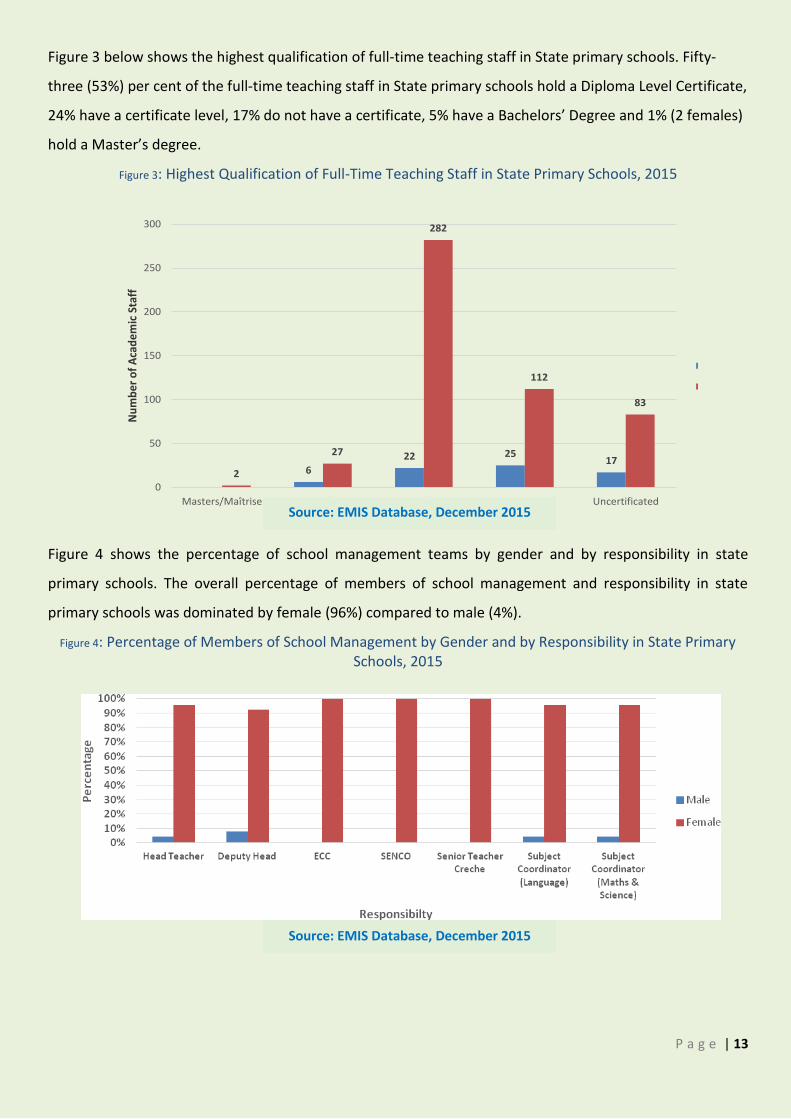
Figure 3 below shows the highest qualification of full-time teaching staff in State primary schools. Fifty-
three (53%) per cent of the full-time teaching staff in State primary schools hold a Diploma Level Certificate,
24% have a certificate level, 17% do not have a certificate, 5% have a Bachelors’ Degree and 1% (2 females)
hold a Master’s degree.
Figure 3: Highest Qualification of Full-Time Teaching Staff in State Primary Schools, 2015
6
22 2517
2
27
282
112
83
0
50
100
150
200
250
300
Masters/Maîtrise Bachelors/Licence Diploma/Diplôme Certificate Uncertificated
Nu
mb
er o
f A
cad
emic
Sta
ff
Qualification Levels
Male
Female
Figure 4 shows the percentage of school management teams by gender and by responsibility in state
primary schools. The overall percentage of members of school management and responsibility in state
primary schools was dominated by female (96%) compared to male (4%).
Figure 4: Percentage of Members of School Management by Gender and by Responsibility in State Primary Schools, 2015
Source: EMIS Database, December 2015
Source: EMIS Database, December 2015
P a g e | 14
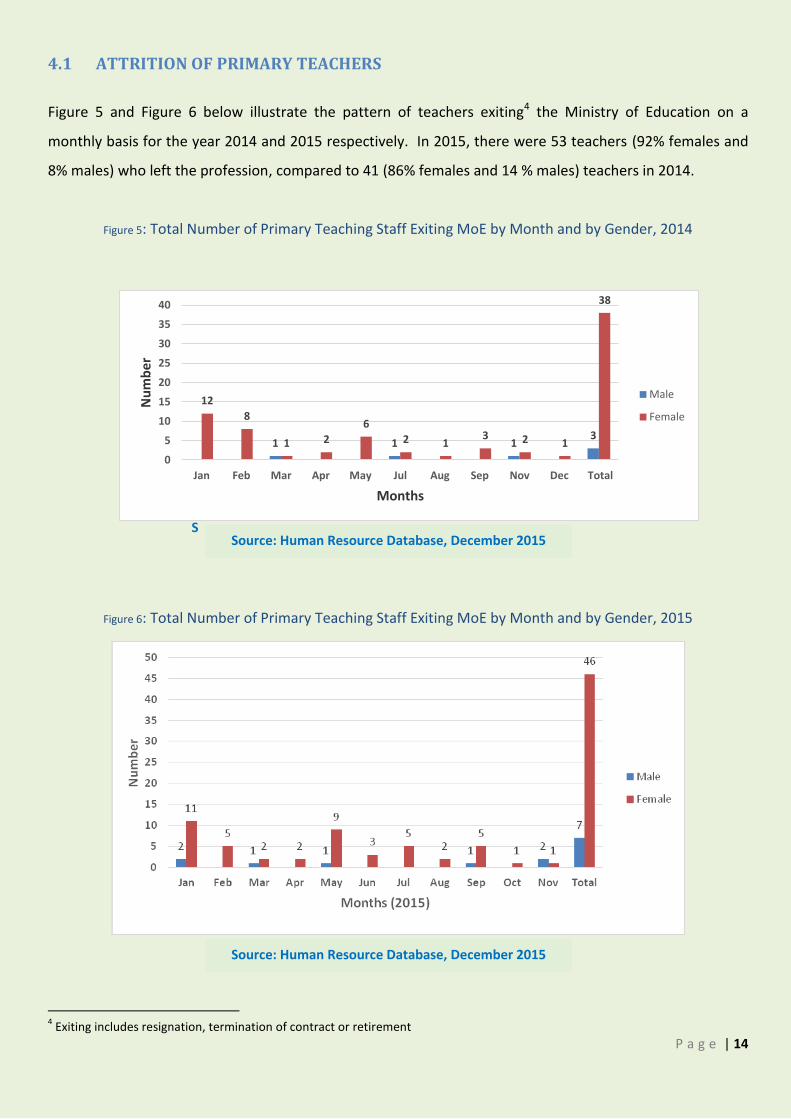
4.1 ATTRITION OF PRIMARY TEACHERS
Figure 5 and Figure 6 below illustrate the pattern of teachers exiting4 the Ministry of Education on a
monthly basis for the year 2014 and 2015 respectively. In 2015, there were 53 teachers (92% females and
8% males) who left the profession, compared to 41 (86% females and 14 % males) teachers in 2014.
Figure 5: Total Number of Primary Teaching Staff Exiting MoE by Month and by Gender, 2014
S
Figure 6: Total Number of Primary Teaching Staff Exiting MoE by Month and by Gender, 2015
4 Exiting includes resignation, termination of contract or retirement
1 1 13
12
8
1 2
6
2 13 2 1
38
0
5
10
15
20
25
30
35
40
Jan Feb Mar Apr May Jul Aug Sep Nov Dec Total
Nu
mb
er
Months
Male
Female
Source: Human Resource Database, December 2015
Source: Human Resource Database, December 2015
P a g e | 15
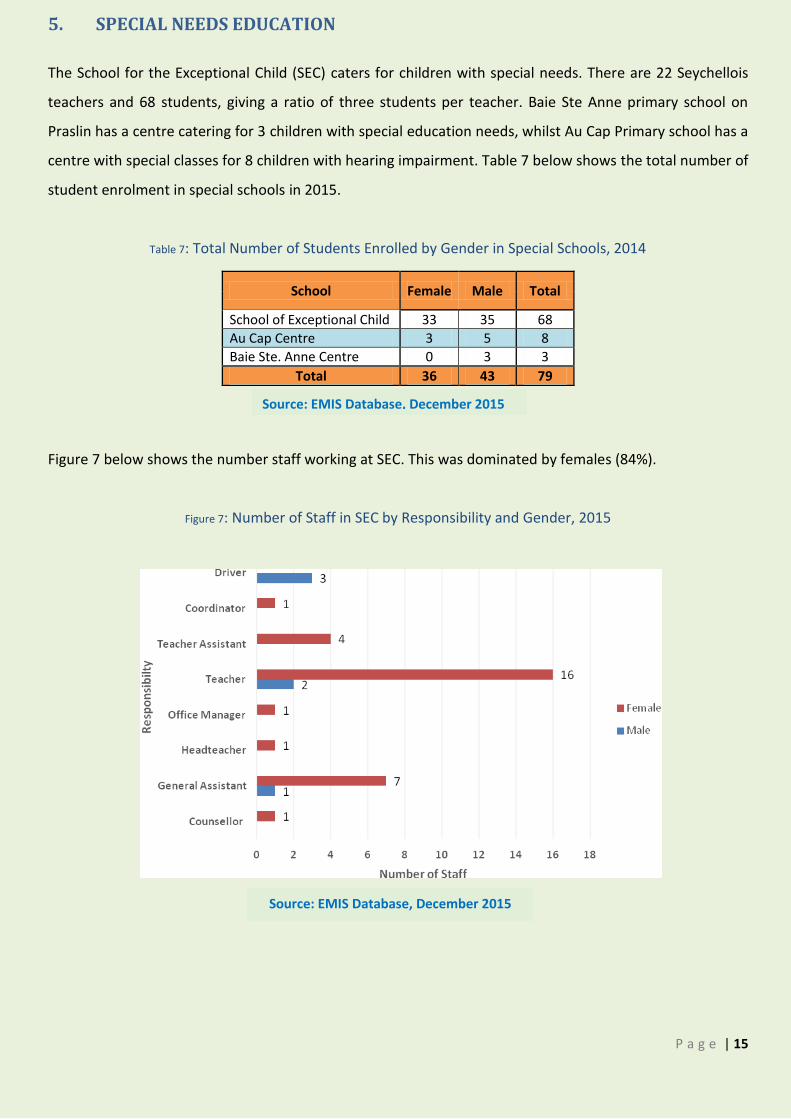
5. SPECIAL NEEDS EDUCATION
The School for the Exceptional Child (SEC) caters for children with special needs. There are 22 Seychellois
teachers and 68 students, giving a ratio of three students per teacher. Baie Ste Anne primary school on
Praslin has a centre catering for 3 children with special education needs, whilst Au Cap Primary school has a
centre with special classes for 8 children with hearing impairment. Table 7 below shows the total number of
student enrolment in special schools in 2015.
Table 7: Total Number of Students Enrolled by Gender in Special Schools, 2014
School Female Male Total
School of Exceptional Child 33 35 68
Au Cap Centre 3 5 8
Baie Ste. Anne Centre 0 3 3
Total 36 43 79
Figure 7 below shows the number staff working at SEC. This was dominated by females (84%).
Figure 7: Number of Staff in SEC by Responsibility and Gender, 2015
Source: EMIS Database, December 2015
Source: EMIS Database, December 2015
P a g e | 16
6. SECONDARY EDUCATION - ISCED LEVEL 2 & ISCED LEVEL 3
6.1 ISCED LEVEL 2 LOWER SECONDARY EDUCATION
Programmes at ISCED level 2, or lower secondary education, are typically designed to build on the learning
outcomes from ISCED level 1. The aim is to lay the foundation for lifelong learning and human development
upon which education systems may then expand further educational opportunities. Programmes at this
level are usually organized around a more subject-oriented curriculum, introducing theoretical concepts
across a broad range of subjects. Teachers typically have pedagogical training in specific subjects and, more
often, than at ISCED level 1, a class of students may have several teachers with specialised knowledge of
the subjects they teach. Also note that in Seychelles, when referring to lower secondary education, it
includes secondary one to secondary three (S1 – S3).
6.2 ISCED LEVEL 3 UPPER SECONDARY EDUCATION
Programmes at ISCED level 3, or upper secondary education, are typically designed to complete secondary
education in preparation for tertiary education and/or provide skills relevant to employment. Programmes
at this level offer student more varied, specialised and in-depth instruction than programmes at ISCED level
2. They are more differentiated, with an increased range of options and streams available. Teachers are
often highly qualified in the subjects or fields of specialisation they teach, particularly in the higher grades.
In Seychelles context, this level includes secondary four and secondary five (S4 and S5) and Advanced Level
Studies (A Level). Up to December 2015, S4 was compulsory while S5 and A Level were not compulsory.
In all state secondary schools (S1 - S5 levels), access to education is free. There are 14 secondary schools
(10 state and 4 private), with an enrolment of 6,952 pupils (50% male and 50% female) in 2015. Of the total
secondary student enrolment, state enrolment represented 90% while the private enrolment represented
10%. Table 8 on page 17 shows secondary total (S1 to S5) enrolment figures by gender, total number of
classes and pupil-class ratio per school in state and private secondary schools.
P a g e | 17
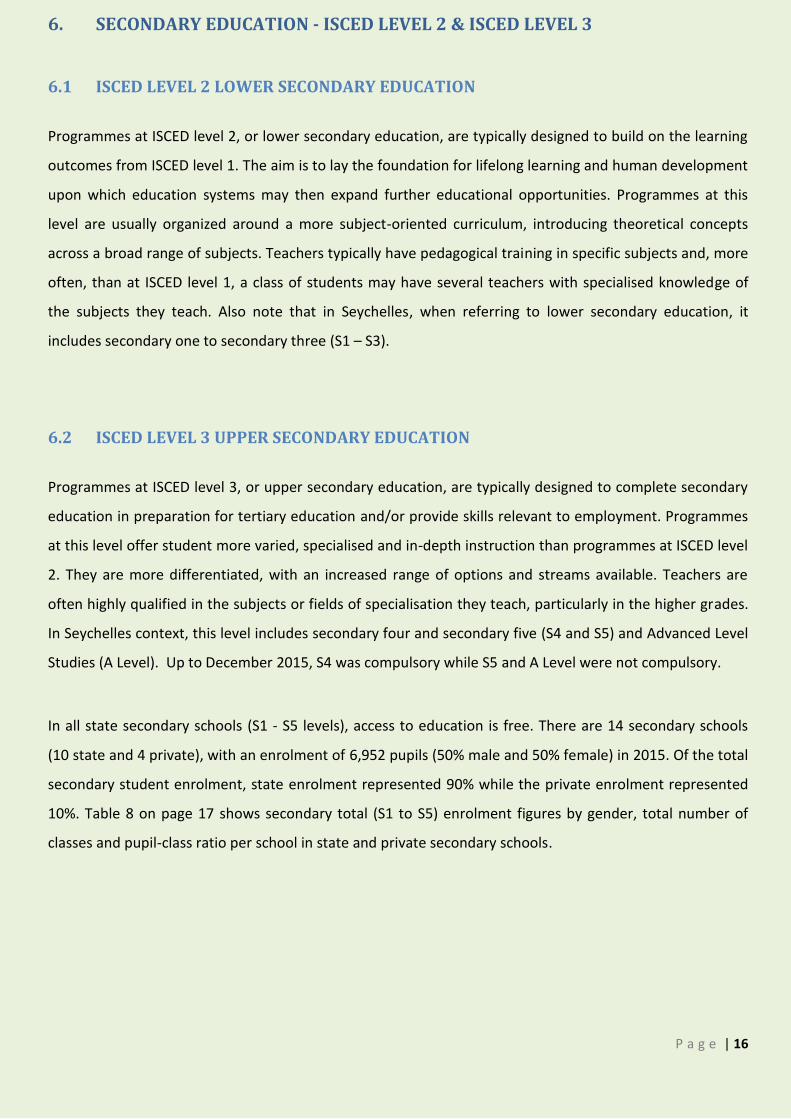
Table 8: Total Number of Students Enrolled by Gender and Number of Classrooms in State and Private Secondary Schools, 2015
School Secondary Totals Students/
Class Ratio Male Female Total Classes
Anse Boileau 349 329 678 25 27
Anse Royale 461 441 902 35 26
Belonie 322 322 644 25 26
Beau Vallon 277 300 577 25 23
English River 375 362 737 27 27
La Digue 97 105 202 11 18
Mont Fleuri 320 306 626 24 26
Pointe Larue 361 328 689 27 26
Plaisance 359 329 688 25 28
Praslin 259 267 526 21 25
State Total 3180 3089 6269 245 26
Independent School 151 195 346 14 25
International School 97 127 224 10 22
Ecole Française 20 37 57 5 11
Vijay International 30 26 56 5 11
Private Total 298 385 683 34 20
Grand Total 3478 3474 6952 279 25
Source: EMIS Database, December 2015
On average, there were 25 students per class in secondary school. In state schools, Anse Royale Secondary
has the largest enrolment figure (902 students) with an average of 27 students per class whereas in the
private schools, Independent School has the largest enrolment figure (346 students) with an average of 25
students per class.
Transition Rate which is defined as the number of pupils enrolled in primary six (P6) in 2014 admitted to
the first grade of secondary (S1) in 2015, stands at 101% for both sexes (male -101 % and female - 101%).
The high transition rate indicates a high level of access from primary level to secondary level.
GER for both sexes at Secondary Level (S1 - S5) is 104% (male 103% & female 105%) and NER is 99% for
both sexes (male 98% & female 100%) indicating a high level of participation in the secondary. GPI is 1.02,
which is slightly in favour of girls.
P a g e | 18
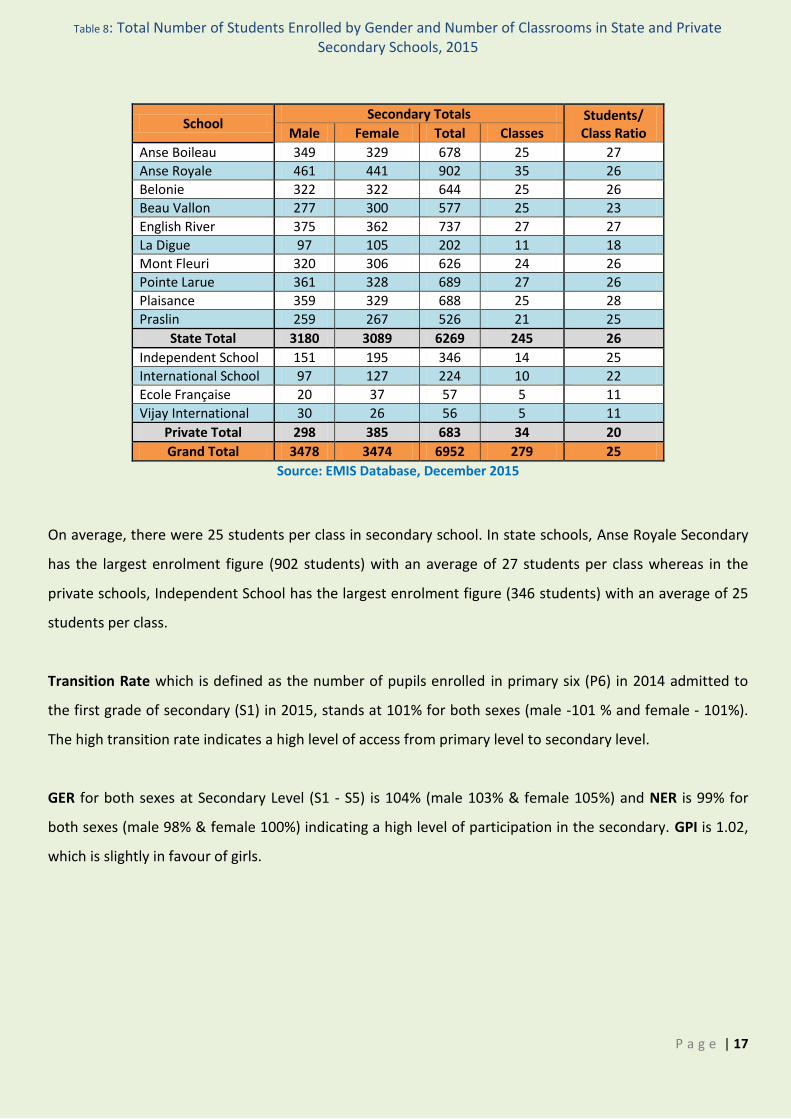
Table 9 illustrates the workforce of full-time teaching staff in state and private secondary schools, which is
Seychellois dominated. In state schools, more than three quarters (77%) of the teaching staff is Seychellois
compared to 60% Seychellois in private schools. When combined together, this averages to 75%.
Table 9: Total Number of Full-Time Teaching Staff by Gender and Nationality in State and Private Secondary Schools, 2015
Local Expatriate Total Both Sexes Male Female Total Male Female Total Male Female
State Total 128 232 360 63 69 132 191 301 492
Private Total 17 20 37 15 16 31 32 36 68
Grand Total 145 252 397 78 85 163 223 337 560
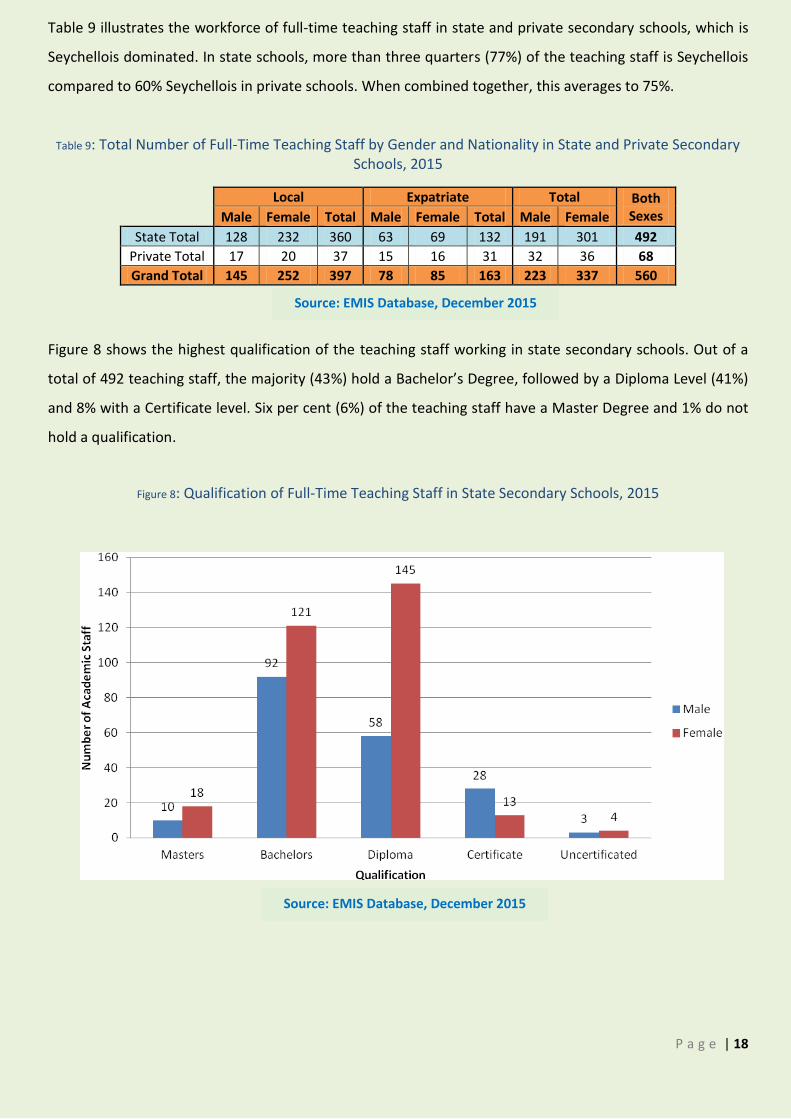
Figure 8 shows the highest qualification of the teaching staff working in state secondary schools. Out of a
total of 492 teaching staff, the majority (43%) hold a Bachelor’s Degree, followed by a Diploma Level (41%)
and 8% with a Certificate level. Six per cent (6%) of the teaching staff have a Master Degree and 1% do not
hold a qualification.
Figure 8: Qualification of Full-Time Teaching Staff in State Secondary Schools, 2015
Source: EMIS Database, December 2015
Source: EMIS Database, December 2015
P a g e | 19
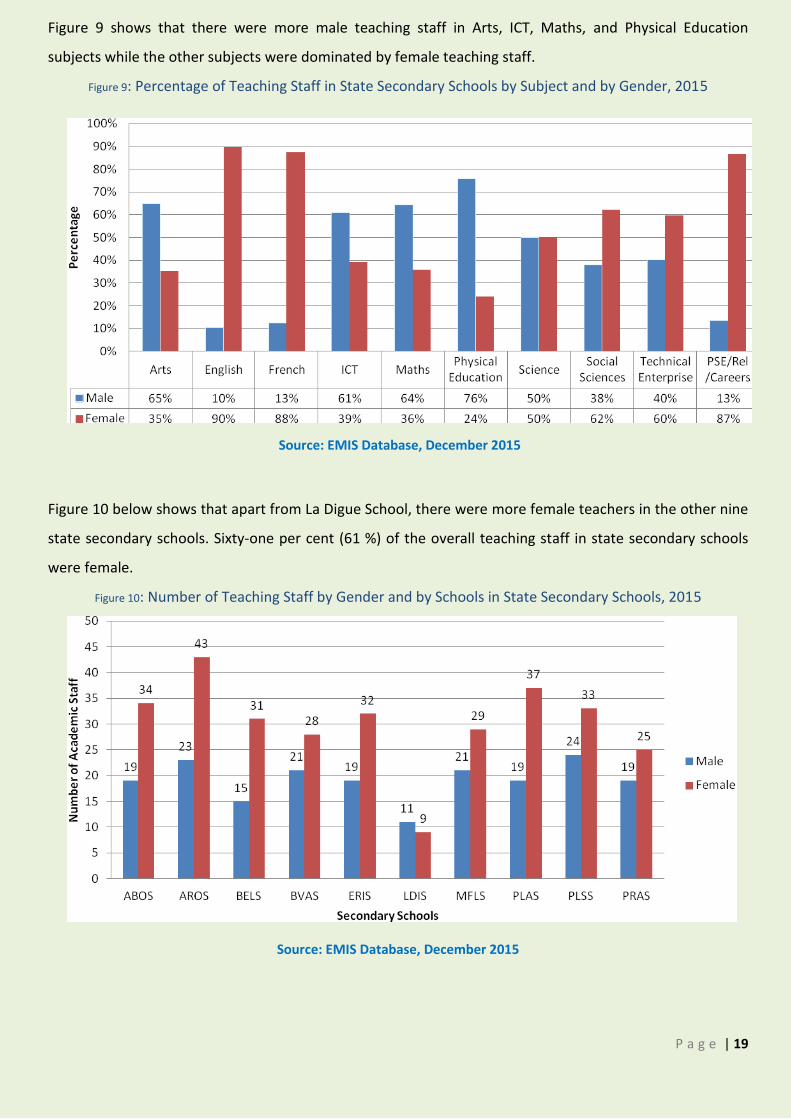
Figure 9 shows that there were more male teaching staff in Arts, ICT, Maths, and Physical Education
subjects while the other subjects were dominated by female teaching staff.
Figure 9: Percentage of Teaching Staff in State Secondary Schools by Subject and by Gender, 2015
Source: EMIS Database, December 2015
Figure 10 below shows that apart from La Digue School, there were more female teachers in the other nine
state secondary schools. Sixty-one per cent (61 %) of the overall teaching staff in state secondary schools
were female.
Figure 10: Number of Teaching Staff by Gender and by Schools in State Secondary Schools, 2015
Source: EMIS Database, December 2015
P a g e | 20
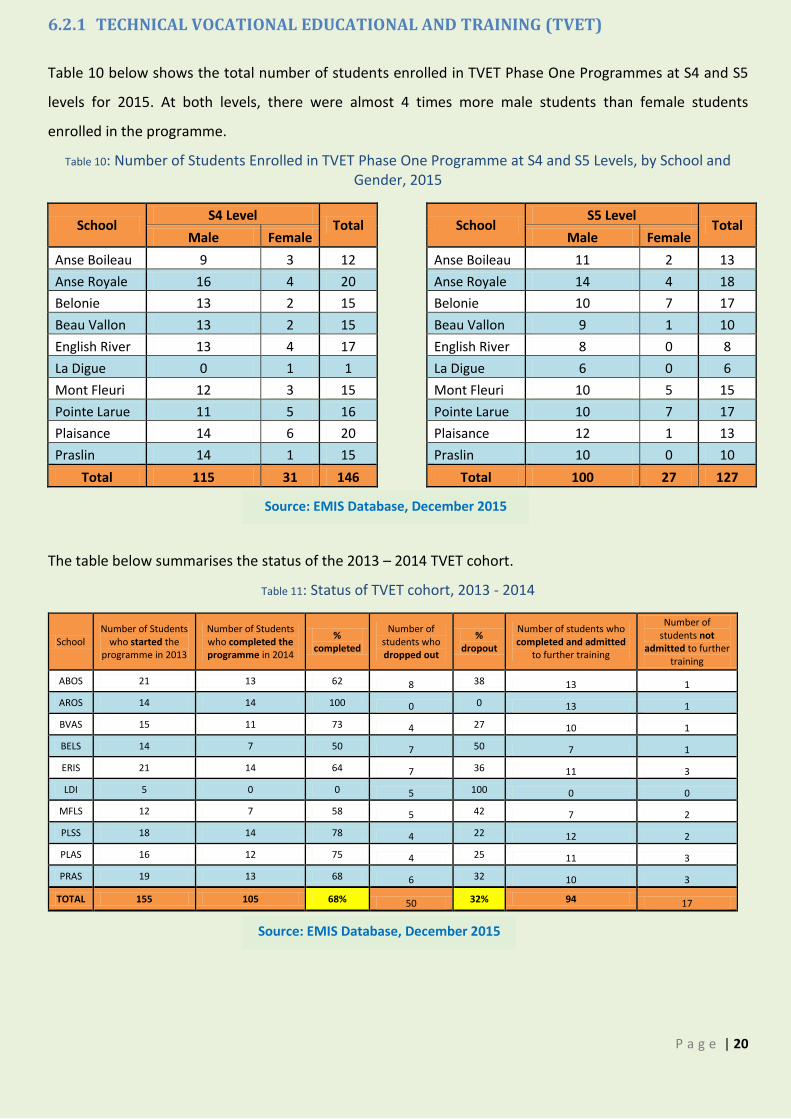
6.2.1 TECHNICAL VOCATIONAL EDUCATIONAL AND TRAINING (TVET)
Table 10 below shows the total number of students enrolled in TVET Phase One Programmes at S4 and S5
levels for 2015. At both levels, there were almost 4 times more male students than female students
enrolled in the programme.
Table 10: Number of Students Enrolled in TVET Phase One Programme at S4 and S5 Levels, by School and Gender, 2015
School S4 Level
Total
School S5 Level
Total Male Female
Male Female
Anse Boileau 9 3 12
Anse Boileau 11 2 13
Anse Royale 16 4 20
Anse Royale 14 4 18
Belonie 13 2 15
Belonie 10 7 17
Beau Vallon 13 2 15
Beau Vallon 9 1 10
English River 13 4 17
English River 8 0 8
La Digue 0 1 1
La Digue 6 0 6
Mont Fleuri 12 3 15
Mont Fleuri 10 5 15
Pointe Larue 11 5 16
Pointe Larue 10 7 17
Plaisance 14 6 20
Plaisance 12 1 13
Praslin 14 1 15
Praslin 10 0 10
Total 115 31 146
Total 100 27 127
The table below summarises the status of the 2013 – 2014 TVET cohort.
Table 11: Status of TVET cohort, 2013 - 2014
School Number of Students
who started the programme in 2013
Number of Students who completed the programme in 2014
% completed
Number of students who dropped out
% dropout
Number of students who completed and admitted
to further training
Number of students not
admitted to further training
ABOS 21 13 62 8 38 13 1
AROS 14 14 100 0 0 13 1
BVAS 15 11 73 4 27 10 1
BELS 14 7 50 7 50 7 1
ERIS 21 14 64 7 36 11 3
LDI 5 0 0 5 100 0 0
MFLS 12 7 58 5 42 7 2
PLSS 18 14 78 4 22 12 2
PLAS 16 12 75 4 25 11 3
PRAS 19 13 68 6 32 10 3
TOTAL 155 105 68% 50 32% 94 17
Source: EMIS Database, December 2015
Source: EMIS Database, December 2015
P a g e | 21
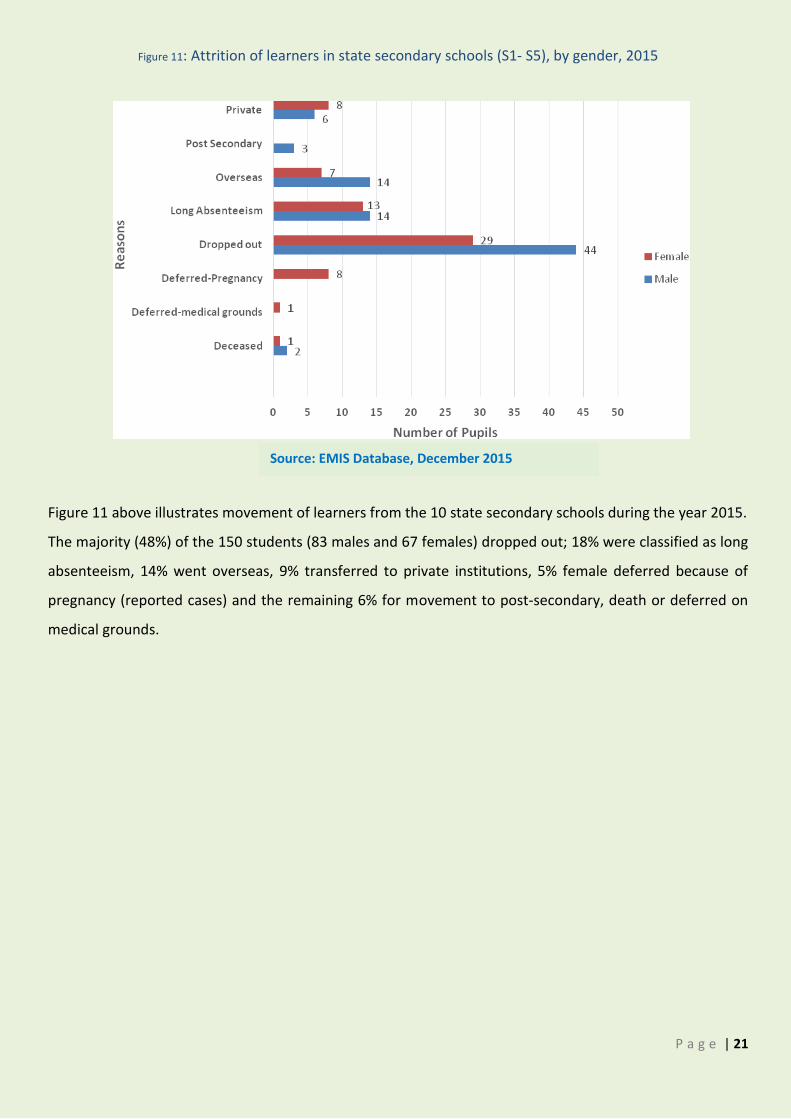
Figure 11: Attrition of learners in state secondary schools (S1- S5), by gender, 2015
Figure 11 above illustrates movement of learners from the 10 state secondary schools during the year 2015.
The majority (48%) of the 150 students (83 males and 67 females) dropped out; 18% were classified as long
absenteeism, 14% went overseas, 9% transferred to private institutions, 5% female deferred because of
pregnancy (reported cases) and the remaining 6% for movement to post-secondary, death or deferred on
medical grounds.
Source: EMIS Database, December 2015
P a g e | 22
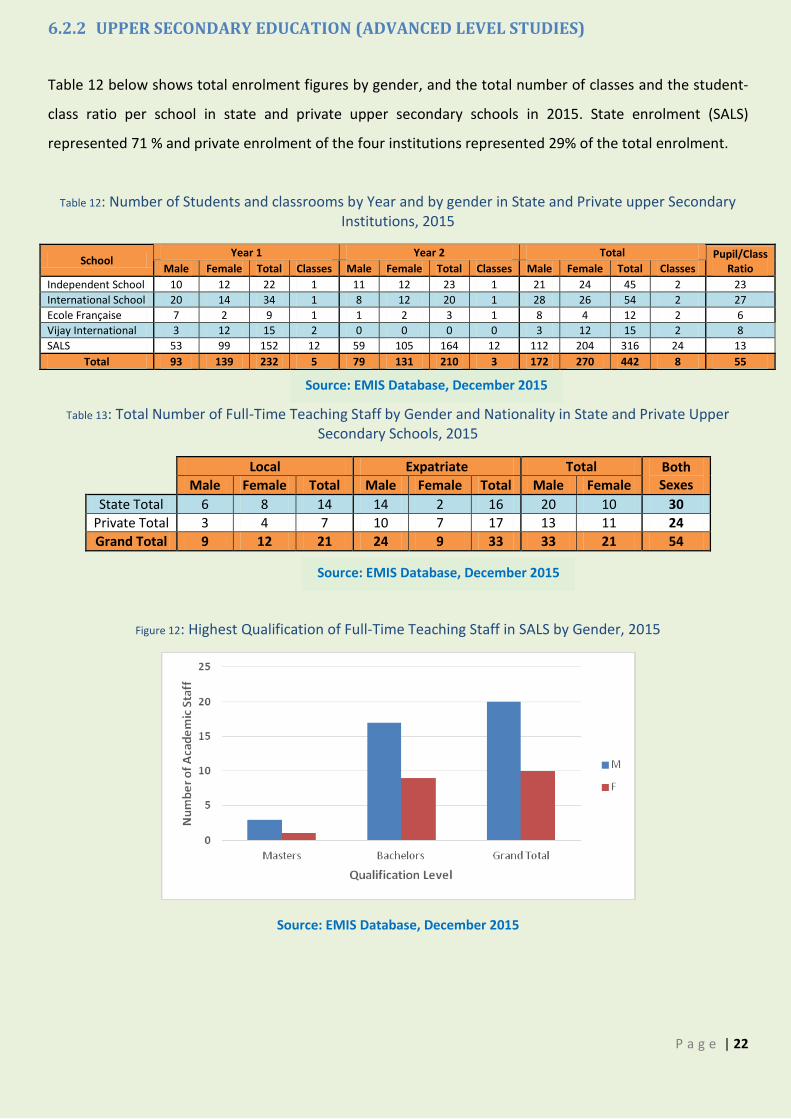
6.2.2 UPPER SECONDARY EDUCATION (ADVANCED LEVEL STUDIES)
Table 12 below shows total enrolment figures by gender, and the total number of classes and the student-
class ratio per school in state and private upper secondary schools in 2015. State enrolment (SALS)
represented 71 % and private enrolment of the four institutions represented 29% of the total enrolment.
Table 12: Number of Students and classrooms by Year and by gender in State and Private upper Secondary Institutions, 2015
School Year 1 Year 2 Total Pupil/Class
Ratio Male Female Total Classes Male Female Total Classes Male Female Total Classes
Independent School 10 12 22 1 11 12 23 1 21 24 45 2 23
International School 20 14 34 1 8 12 20 1 28 26 54 2 27
Ecole Française 7 2 9 1 1 2 3 1 8 4 12 2 6
Vijay International 3 12 15 2 0 0 0 0 3 12 15 2 8
SALS 53 99 152 12 59 105 164 12 112 204 316 24 13
Total 93 139 232 5 79 131 210 3 172 270 442 8 55
Table 13: Total Number of Full-Time Teaching Staff by Gender and Nationality in State and Private Upper Secondary Schools, 2015
Local Expatriate Total Both Sexes Male Female Total Male Female Total Male Female
State Total 6 8 14 14 2 16 20 10 30
Private Total 3 4 7 10 7 17 13 11 24
Grand Total 9 12 21 24 9 33 33 21 54
Figure 12: Highest Qualification of Full-Time Teaching Staff in SALS by Gender, 2015
Source: EMIS Database, December 2015
Source: EMIS Database, December 2015
Source: EMIS Database, December 2015
P a g e | 23
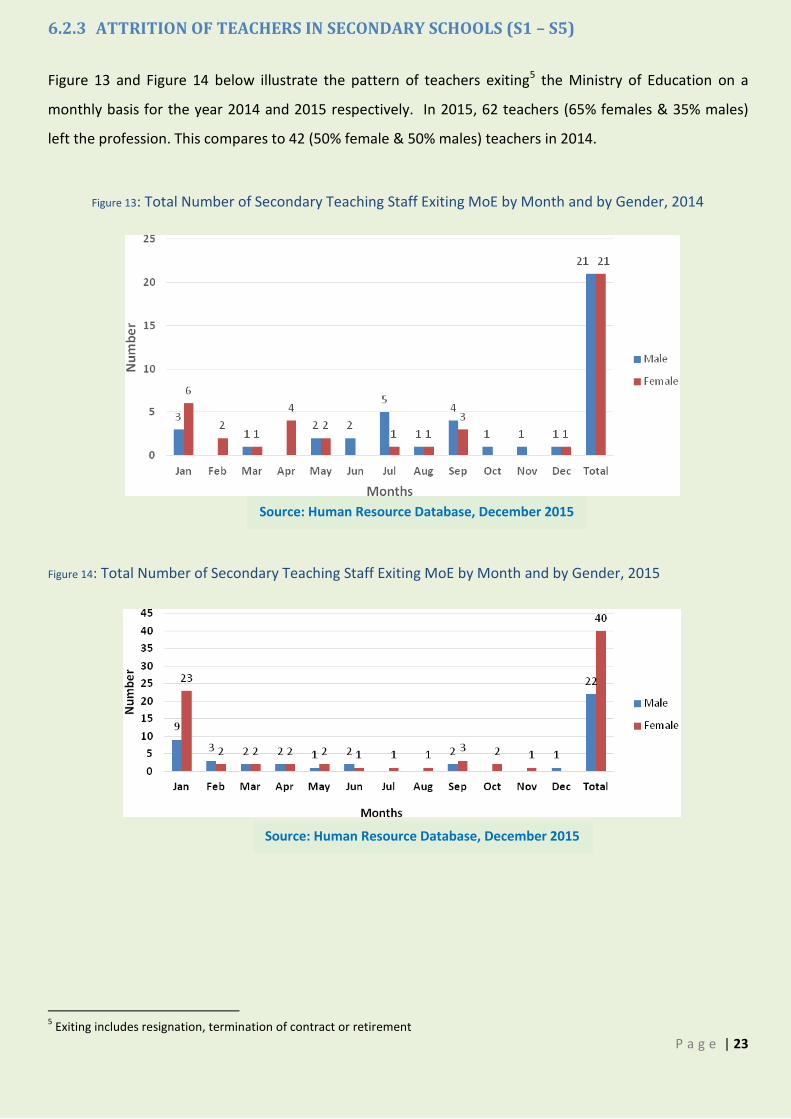
6.2.3 ATTRITION OF TEACHERS IN SECONDARY SCHOOLS (S1 – S5)
Figure 13 and Figure 14 below illustrate the pattern of teachers exiting5 the Ministry of Education on a
monthly basis for the year 2014 and 2015 respectively. In 2015, 62 teachers (65% females & 35% males)
left the profession. This compares to 42 (50% female & 50% males) teachers in 2014.
Figure 13: Total Number of Secondary Teaching Staff Exiting MoE by Month and by Gender, 2014
Figure 14: Total Number of Secondary Teaching Staff Exiting MoE by Month and by Gender, 2015
5 Exiting includes resignation, termination of contract or retirement
Source: Human Resource Database, December 2015
Source: Human Resource Database, December 2015
P a g e | 24
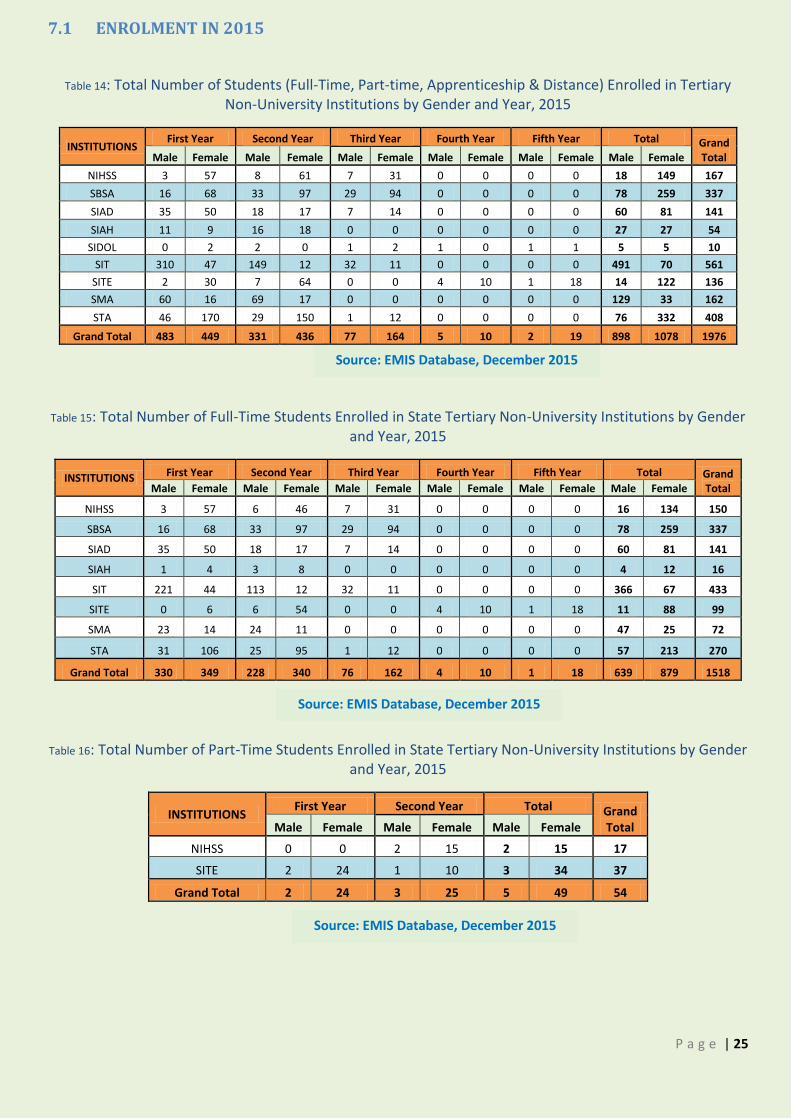
7. TERTIARY NON-UNIVERSITY EDUCATION AND TRAINING - ISCED LEVEL 4
Tertiary non-university education and training education provides learning experiences building on
secondary education, preparing for labour market entry as well as tertiary university education. This level
aims at the individual acquisition of knowledge, skills and competencies lower than the level of complexity
characteristic of tertiary university education. Programmes at ISCED Level 4, or post-secondary non-
university education and training, are typically designed to provide individuals who have completed ISCED
Level 3 without qualifications required for progression to tertiary university education or for employment.
For example, graduates from general ISCED Level 3 programmes may choose to complete a tertiary non-
university vocational qualification; or graduates from vocational ISCED Level 3 programmes may choose to
increase their level of qualifications or specialise further. The content of ISCED Level 4 programmes is not
sufficiently complex to be regarded as tertiary university education, although it is clearly post-secondary.
Currently, there are nine state institutions offering tertiary non-university education and training (referred
as Professional Centres (PCs)). The PCs are the Seychelles Institute of Distance and Open Learning (SIDOL),
School of Business Studies and Accounting (SBSA), Seychelles Institute of Art & Design (SIAD), National
Institute for Health & Social Studies (NIHSS), Seychelles Tourism Academy (STA), Seychelles Institute of
Teacher Education (SITE), Seychelles Institute of Agriculture & Horticulture (SIAH), Seychelles Institute of
Technology (SIT) and Seychelles Maritime Academy (SMA). Amongst the tertiary non-university Institutions
in 2015, SIT had the largest enrolment figure, followed by STA and SBSA. Tables 14 to 18 show the total
number of all students enrolled by mode, year level and gender in tertiary non-university Institutions. SIT
and SMA are the only two state tertiary non-university institutions where there were more male students
enrolled as compared to female students. Overall, in 2015, there were 1,078 female students (55%)
enrolled in tertiary non-university institutions.
P a g e | 25
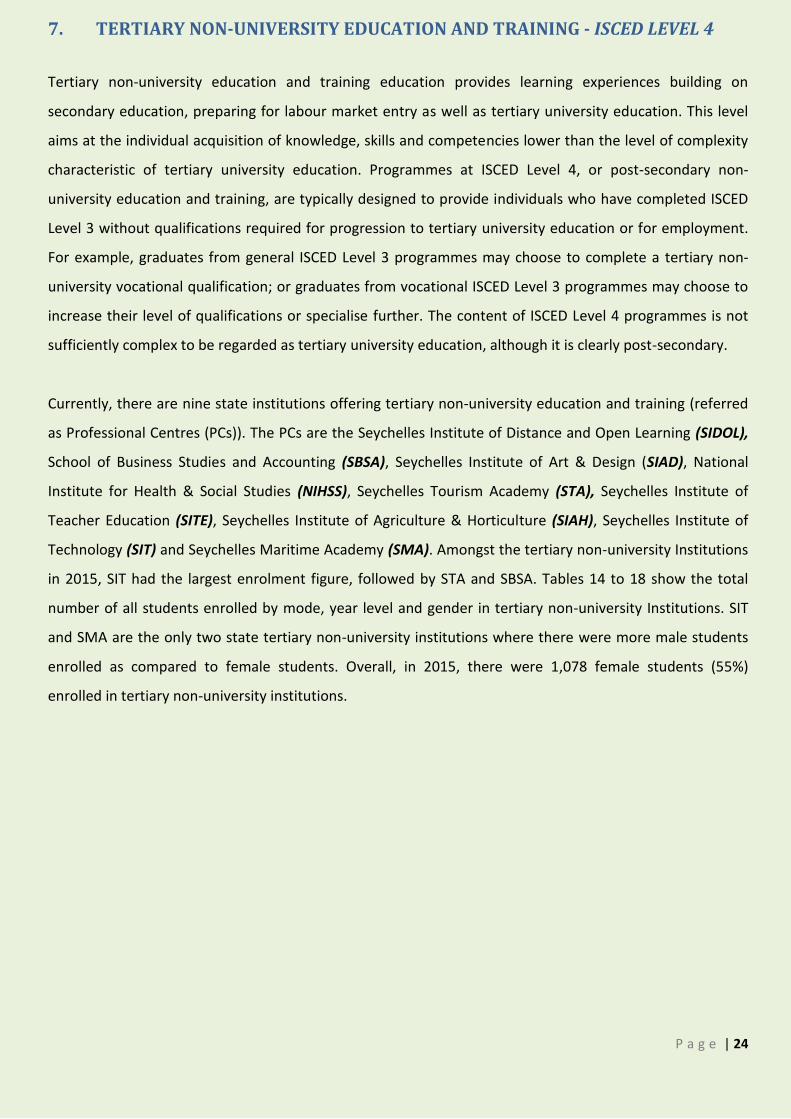
7.1 ENROLMENT IN 2015
Table 14: Total Number of Students (Full-Time, Part-time, Apprenticeship & Distance) Enrolled in Tertiary Non-University Institutions by Gender and Year, 2015
INSTITUTIONS First Year Second Year Third Year Fourth Year Fifth Year Total Grand
Total Male Female Male Female Male Female Male Female Male Female Male Female
NIHSS 3 57 8 61 7 31 0 0 0 0 18 149 167
SBSA 16 68 33 97 29 94 0 0 0 0 78 259 337
SIAD 35 50 18 17 7 14 0 0 0 0 60 81 141
SIAH 11 9 16 18 0 0 0 0 0 0 27 27 54
SIDOL 0 2 2 0 1 2 1 0 1 1 5 5 10
SIT 310 47 149 12 32 11 0 0 0 0 491 70 561
SITE 2 30 7 64 0 0 4 10 1 18 14 122 136
SMA 60 16 69 17 0 0 0 0 0 0 129 33 162
STA 46 170 29 150 1 12 0 0 0 0 76 332 408
Grand Total 483 449 331 436 77 164 5 10 2 19 898 1078 1976
Table 15: Total Number of Full-Time Students Enrolled in State Tertiary Non-University Institutions by Gender and Year, 2015
INSTITUTIONS First Year Second Year Third Year Fourth Year Fifth Year Total Grand Total Male Female Male Female Male Female Male Female Male Female Male Female
NIHSS 3 57 6 46 7 31 0 0 0 0 16 134 150
SBSA 16 68 33 97 29 94 0 0 0 0 78 259 337
SIAD 35 50 18 17 7 14 0 0 0 0 60 81 141
SIAH 1 4 3 8 0 0 0 0 0 0 4 12 16
SIT 221 44 113 12 32 11 0 0 0 0 366 67 433
SITE 0 6 6 54 0 0 4 10 1 18 11 88 99
SMA 23 14 24 11 0 0 0 0 0 0 47 25 72
STA 31 106 25 95 1 12 0 0 0 0 57 213 270
Grand Total 330 349 228 340 76 162 4 10 1 18 639 879 1518
Table 16: Total Number of Part-Time Students Enrolled in State Tertiary Non-University Institutions by Gender and Year, 2015
INSTITUTIONS First Year Second Year Total Grand
Total Male Female Male Female Male Female
NIHSS 0 0 2 15 2 15 17
SITE 2 24 1 10 3 34 37
Grand Total 2 24 3 25 5 49 54
Source: EMIS Database, December 2015
Source: EMIS Database, December 2015
Source: EMIS Database, December 2015
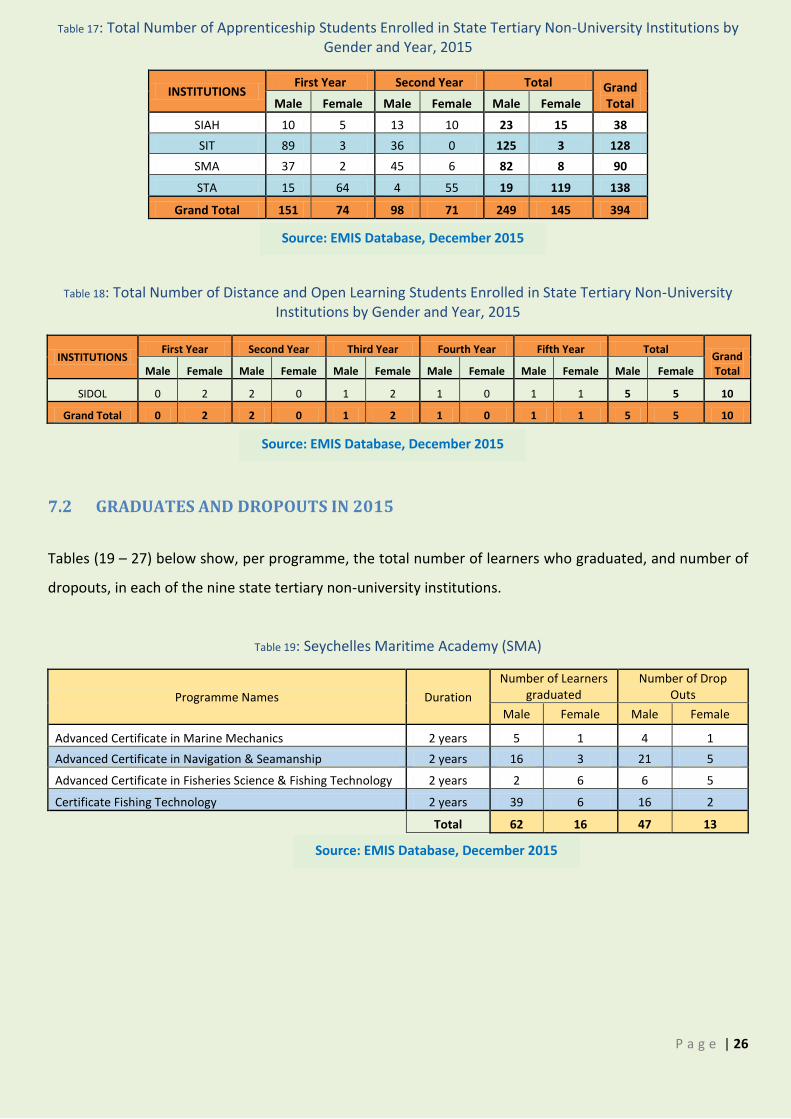
P a g e | 26
Table 17: Total Number of Apprenticeship Students Enrolled in State Tertiary Non-University Institutions by Gender and Year, 2015
INSTITUTIONS First Year Second Year Total Grand
Total Male Female Male Female Male Female
SIAH 10 5 13 10 23 15 38
SIT 89 3 36 0 125 3 128
SMA 37 2 45 6 82 8 90
STA 15 64 4 55 19 119 138
Grand Total 151 74 98 71 249 145 394
Table 18: Total Number of Distance and Open Learning Students Enrolled in State Tertiary Non-University Institutions by Gender and Year, 2015
INSTITUTIONS First Year Second Year Third Year Fourth Year Fifth Year Total
Grand Total Male Female Male Female Male Female Male Female Male Female Male Female
SIDOL 0 2 2 0 1 2 1 0 1 1 5 5 10
Grand Total 0 2 2 0 1 2 1 0 1 1 5 5 10
7.2 GRADUATES AND DROPOUTS IN 2015
Tables (19 – 27) below show, per programme, the total number of learners who graduated, and number of
dropouts, in each of the nine state tertiary non-university institutions.
Table 19: Seychelles Maritime Academy (SMA)
Programme Names Duration
Number of Learners graduated
Number of Drop Outs
Male Female Male Female
Advanced Certificate in Marine Mechanics 2 years 5 1 4 1
Advanced Certificate in Navigation & Seamanship 2 years 16 3 21 5
Advanced Certificate in Fisheries Science & Fishing Technology 2 years 2 6 6 5
Certificate Fishing Technology 2 years 39 6 16 2
Total 62 16 47 13
Source: EMIS Database, December 2015
Source: EMIS Database, December 2015
Source: EMIS Database, December 2015
P a g e | 27
Table 20: National Institute of Health and Social Studies (NIHSS)
Programme Names Duration
Number of Learners graduated
Number of Drop Outs
Male Female Male Female
Diploma in Nursing 3 years 1 20 0 24
Diploma in Emergency Medical Care 3 years 6 4 0 9
Diploma in Biomedical Laboratory Science 3 years 0 8 3 15
Advanced Certificate in Oral Health Care 2 years 2 17 1 14
9 49 4 62
Table 21: Seychelles Business Studies Academy (SBSA)
Programme Names Duration
Number of Learners graduated
Number of Drop Outs
Male Female Male Female
Diploma in Business Studies & Accounting 3 years 20 47 0 1
Diploma in Office Management & Administration 3 years 6 42 0 1
26 89 0 2
Table 22: Seychelles Institute of Art and Design (SIAD)
Programme Names Duration
Number of Learners graduated
Number of Drop Outs
Male Female Male Female
Certificate in Drawing and Painting 1 year 6 5 2 1
Certificate in Sewing and Textile 1 year 0 7 2 6
Advanced Certificate in Fashion 1 year 0 0 0 2
Advanced Certificate in Textile 1 year 0 0 0 2
Advanced Certificate in Graphics Design 1 year 0 0 0 1
Advanced Certificate in Fashion 2 years 1 4 0 1
Advanced Certificate in Fine Art 2 years 5 4 1 0
Advanced Certificate in Graphics Design 2 years 7 5 1 0
Diploma in Art and Design 3 years 7 14 0 0
26 39 6 13
Source: EMIS Database, December 2015
Source: EMIS Database, December 2015
Source: EMIS Database, December 2015
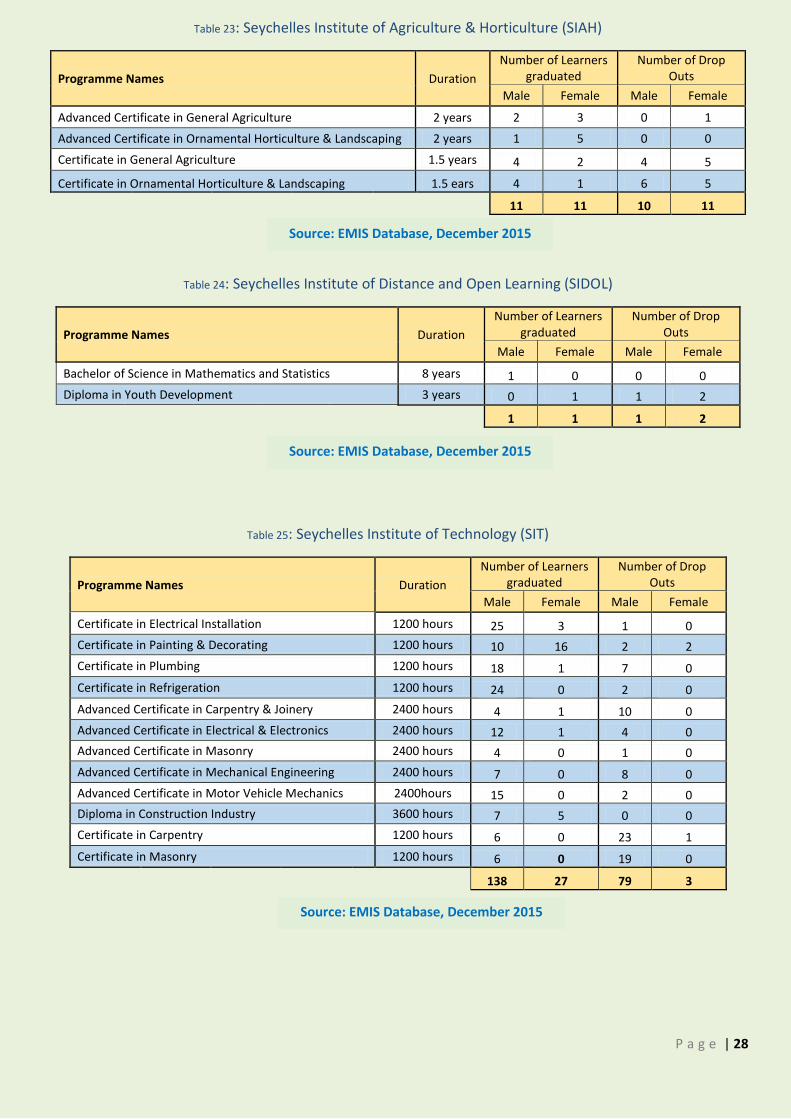
P a g e | 28
Table 23: Seychelles Institute of Agriculture & Horticulture (SIAH)
Programme Names Duration
Number of Learners graduated
Number of Drop Outs
Male Female Male Female
Advanced Certificate in General Agriculture 2 years 2 3 0 1
Advanced Certificate in Ornamental Horticulture & Landscaping 2 years 1 5 0 0
Certificate in General Agriculture 1.5 years 4 2 4 5
Certificate in Ornamental Horticulture & Landscaping 1.5 ears 4 1 6 5
11 11 10 11
Table 24: Seychelles Institute of Distance and Open Learning (SIDOL)
Programme Names Duration
Number of Learners graduated
Number of Drop Outs
Male Female Male Female
Bachelor of Science in Mathematics and Statistics 8 years 1 0 0 0
Diploma in Youth Development 3 years 0 1 1 2
1 1 1 2
Table 25: Seychelles Institute of Technology (SIT)
Programme Names Duration
Number of Learners graduated
Number of Drop Outs
Male Female Male Female
Certificate in Electrical Installation 1200 hours 25 3 1 0
Certificate in Painting & Decorating 1200 hours 10 16 2 2
Certificate in Plumbing 1200 hours 18 1 7 0
Certificate in Refrigeration 1200 hours 24 0 2 0
Advanced Certificate in Carpentry & Joinery 2400 hours 4 1 10 0
Advanced Certificate in Electrical & Electronics 2400 hours 12 1 4 0
Advanced Certificate in Masonry 2400 hours 4 0 1 0
Advanced Certificate in Mechanical Engineering 2400 hours 7 0 8 0
Advanced Certificate in Motor Vehicle Mechanics 2400hours 15 0 2 0
Diploma in Construction Industry 3600 hours 7 5 0 0
Certificate in Carpentry 1200 hours 6 0 23 1
Certificate in Masonry 1200 hours 6 0 19 0
138 27 79 3
Source: EMIS Database, December 2015
Source: EMIS Database, December 2015
Source: EMIS Database, December 2015
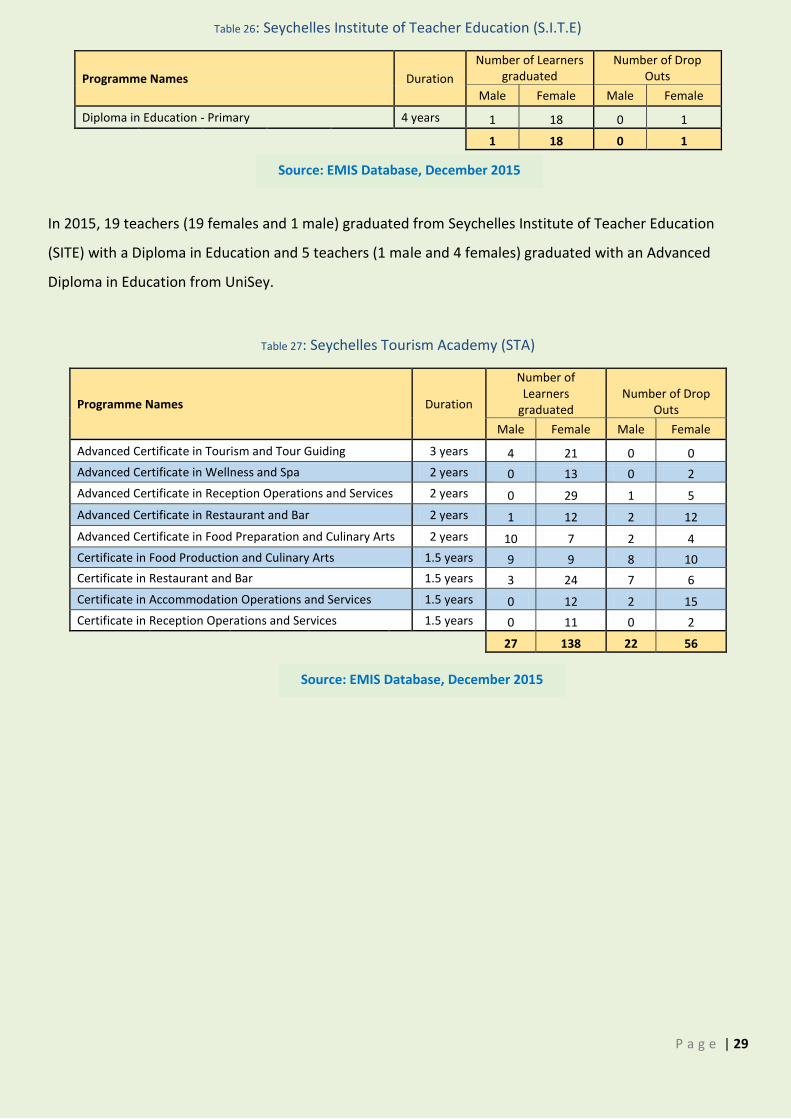
P a g e | 29
Table 26: Seychelles Institute of Teacher Education (S.I.T.E)
Programme Names Duration
Number of Learners graduated
Number of Drop Outs
Male Female Male Female
Diploma in Education - Primary 4 years 1 18 0 1
1 18 0 1
In 2015, 19 teachers (19 females and 1 male) graduated from Seychelles Institute of Teacher Education
(SITE) with a Diploma in Education and 5 teachers (1 male and 4 females) graduated with an Advanced
Diploma in Education from UniSey.
Table 27: Seychelles Tourism Academy (STA)
Programme Names Duration
Number of Learners
graduated Number of Drop
Outs
Male Female Male Female
Advanced Certificate in Tourism and Tour Guiding 3 years 4 21 0 0
Advanced Certificate in Wellness and Spa 2 years 0 13 0 2
Advanced Certificate in Reception Operations and Services 2 years 0 29 1 5
Advanced Certificate in Restaurant and Bar 2 years 1 12 2 12
Advanced Certificate in Food Preparation and Culinary Arts 2 years 10 7 2 4
Certificate in Food Production and Culinary Arts 1.5 years 9 9 8 10
Certificate in Restaurant and Bar 1.5 years 3 24 7 6
Certificate in Accommodation Operations and Services 1.5 years 0 12 2 15
Certificate in Reception Operations and Services 1.5 years 0 11 0 2
27 138 22 56
Source: EMIS Database, December 2015
Source: EMIS Database, December 2015
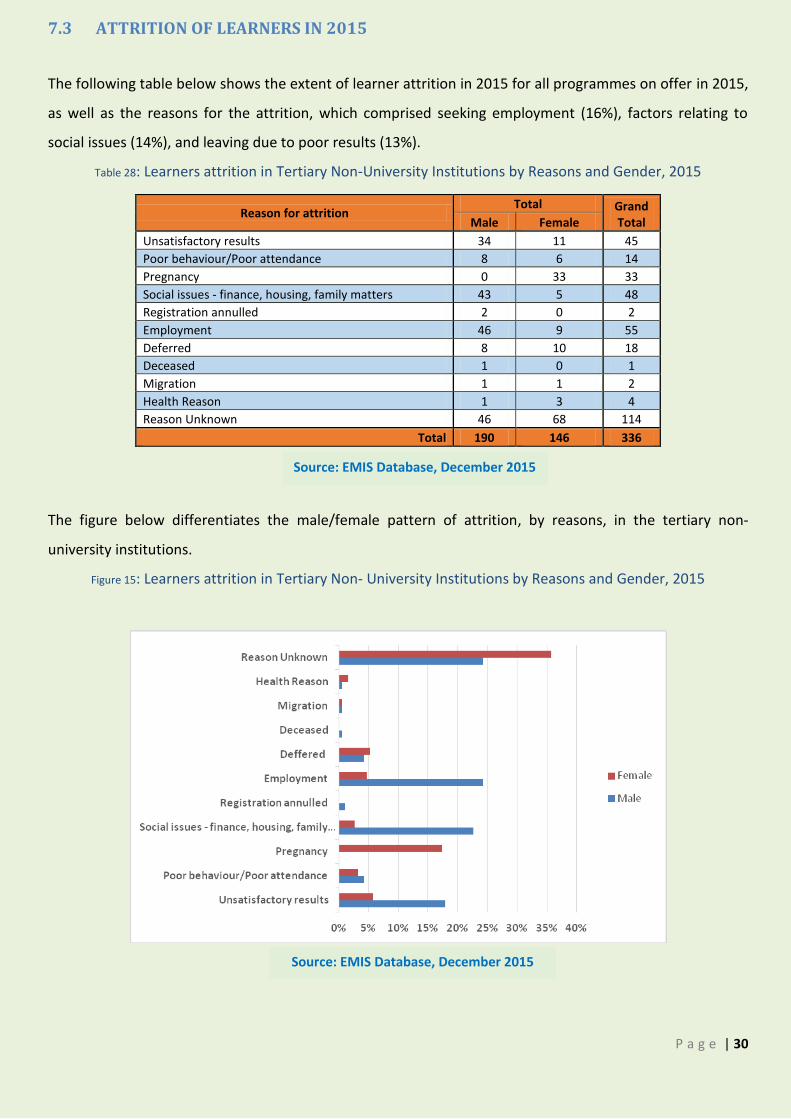
P a g e | 30
7.3 ATTRITION OF LEARNERS IN 2015
The following table below shows the extent of learner attrition in 2015 for all programmes on offer in 2015,
as well as the reasons for the attrition, which comprised seeking employment (16%), factors relating to
social issues (14%), and leaving due to poor results (13%).
Table 28: Learners attrition in Tertiary Non-University Institutions by Reasons and Gender, 2015
Reason for attrition Total Grand
Total Male Female
Unsatisfactory results 34 11 45
Poor behaviour/Poor attendance 8 6 14
Pregnancy 0 33 33
Social issues - finance, housing, family matters 43 5 48
Registration annulled 2 0 2
Employment 46 9 55
Deferred 8 10 18
Deceased 1 0 1
Migration 1 1 2
Health Reason 1 3 4
Reason Unknown 46 68 114
Total 190 146 336
The figure below differentiates the male/female pattern of attrition, by reasons, in the tertiary non-
university institutions.
Figure 15: Learners attrition in Tertiary Non- University Institutions by Reasons and Gender, 2015
Source: EMIS Database, December 2015
Source: EMIS Database, December 2015
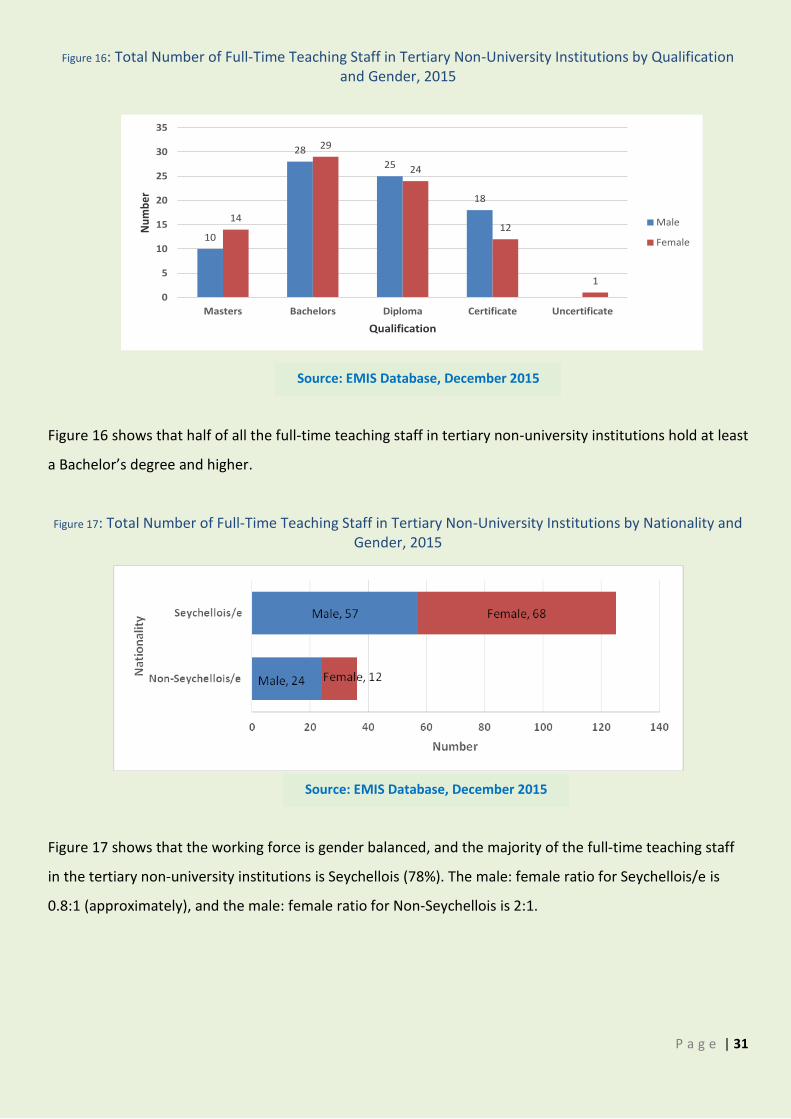
P a g e | 31
Figure 16: Total Number of Full-Time Teaching Staff in Tertiary Non-University Institutions by Qualification and Gender, 2015
Figure 16 shows that half of all the full-time teaching staff in tertiary non-university institutions hold at least
a Bachelor’s degree and higher.
Figure 17: Total Number of Full-Time Teaching Staff in Tertiary Non-University Institutions by Nationality and Gender, 2015
Figure 17 shows that the working force is gender balanced, and the majority of the full-time teaching staff
in the tertiary non-university institutions is Seychellois (78%). The male: female ratio for Seychellois/e is
0.8:1 (approximately), and the male: female ratio for Non-Seychellois is 2:1.
10
28
25
18
14
29
24
12
1
0
5
10
15
20
25
30
35
Masters Bachelors Diploma Certificate Uncertificate
Nu
mb
er
Qualification
Male
Female
Source: EMIS Database, December 2015
Source: EMIS Database, December 2015
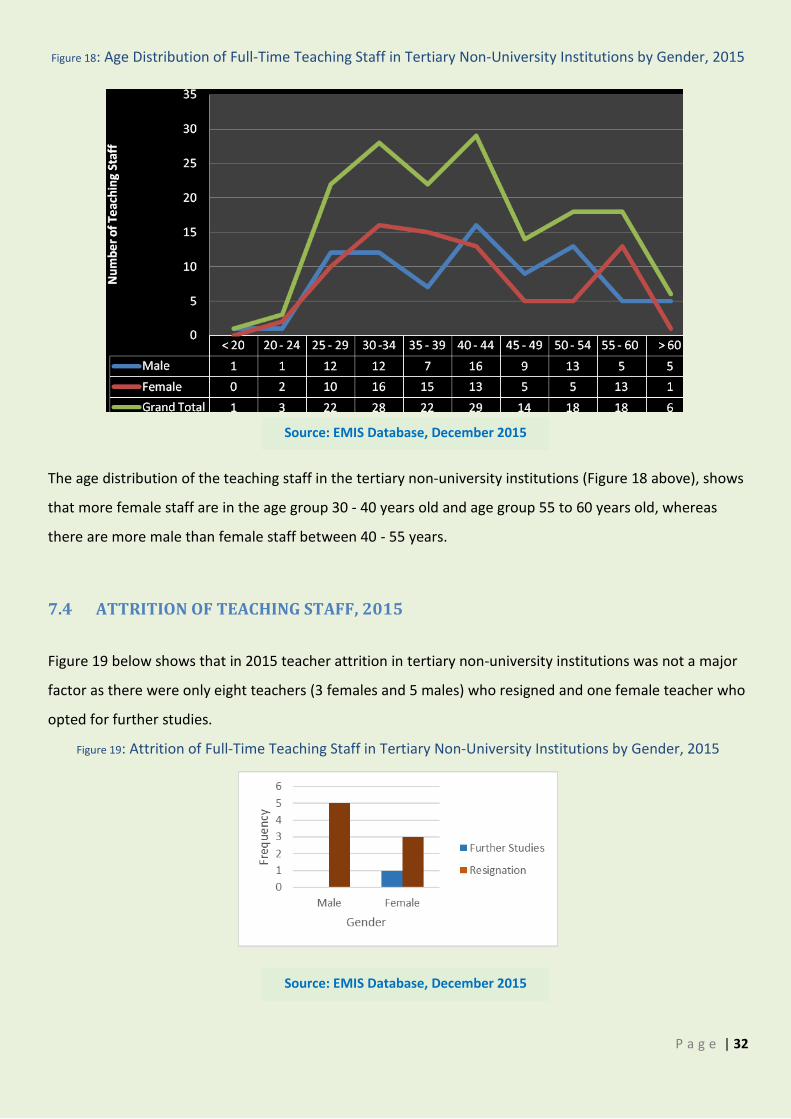
P a g e | 32
Figure 18: Age Distribution of Full-Time Teaching Staff in Tertiary Non-University Institutions by Gender, 2015
The age distribution of the teaching staff in the tertiary non-university institutions (Figure 18 above), shows
that more female staff are in the age group 30 - 40 years old and age group 55 to 60 years old, whereas
there are more male than female staff between 40 - 55 years.
7.4 ATTRITION OF TEACHING STAFF, 2015
Figure 19 below shows that in 2015 teacher attrition in tertiary non-university institutions was not a major
factor as there were only eight teachers (3 females and 5 males) who resigned and one female teacher who
opted for further studies.
Figure 19: Attrition of Full-Time Teaching Staff in Tertiary Non-University Institutions by Gender, 2015
Source: EMIS Database, December 2015
Source: EMIS Database, December 2015
P a g e | 33
8. TERTIARY UNIVERSITY EDUCATION (ISCED LEVEL 5 - ISCED LEVEL 8)
Tertiary university education builds on secondary education and tertiary non-university education and
training, providing learning activities in specialised fields of education. It aims at learning at a high level of
complexity and specialisation. Tertiary university education includes academic education but also includes
advanced vocational or professional education. It comprises ISCED Levels 5, 6, 7 and 8, which are labelled as
short-cycle tertiary education, Bachelor’s or equivalent level, Master’s or equivalent level, and doctoral or
equivalent level, respectively. The content of programmes at the tertiary university level is more complex
and advanced than in lower ISCED levels.
ISCED LEVEL 5 - SHORT-CYCLE TERTIARY EDUCATION
Programmes at ISCED level 5, or short-cycle tertiary education, are often designed to provide participants
with professional knowledge, skills and competencies. Typically, they are practically based, occupationally
specific and prepare students to enter the labour market. However, these programmes may also provide a
pathway to other tertiary education programmes. Academic tertiary education programmes below the level
of a Bachelor’s programme or equivalent are also classified as ISCED level 5.
ISCED LEVEL 6 BACHELOR’S OR EQUIVALENT LEVEL
Programmes at ISCED level 6, or Bachelor’s or equivalent level, are often designed to provide participants
with intermediate academic and/or professional knowledge, skills and competencies, leading to a first
degree or equivalent qualification. Programmes at this level are typically theoretically based but may
include practical components and are informed by state of the art research and/or best professional
practice. They are traditionally offered by universities and equivalent tertiary educational institutions.
ISCED LEVEL 7 MASTER’S OR EQUIVALENT LEVEL
Programmes at ISCED level 7, or Master’s or equivalent level, are often designed to provide participants
with advanced academic and/or professional knowledge, skills and competencies, leading to a second
degree or equivalent qualification. Programmes at this level may have a substantial research component
but do not yet lead to the award of a doctoral qualification. Typically, programmes at this level are theory-
based but may include practical components and are informed by state of the art research and/or best
professional practice. They are traditionally offered by universities and other tertiary educational
institutions.
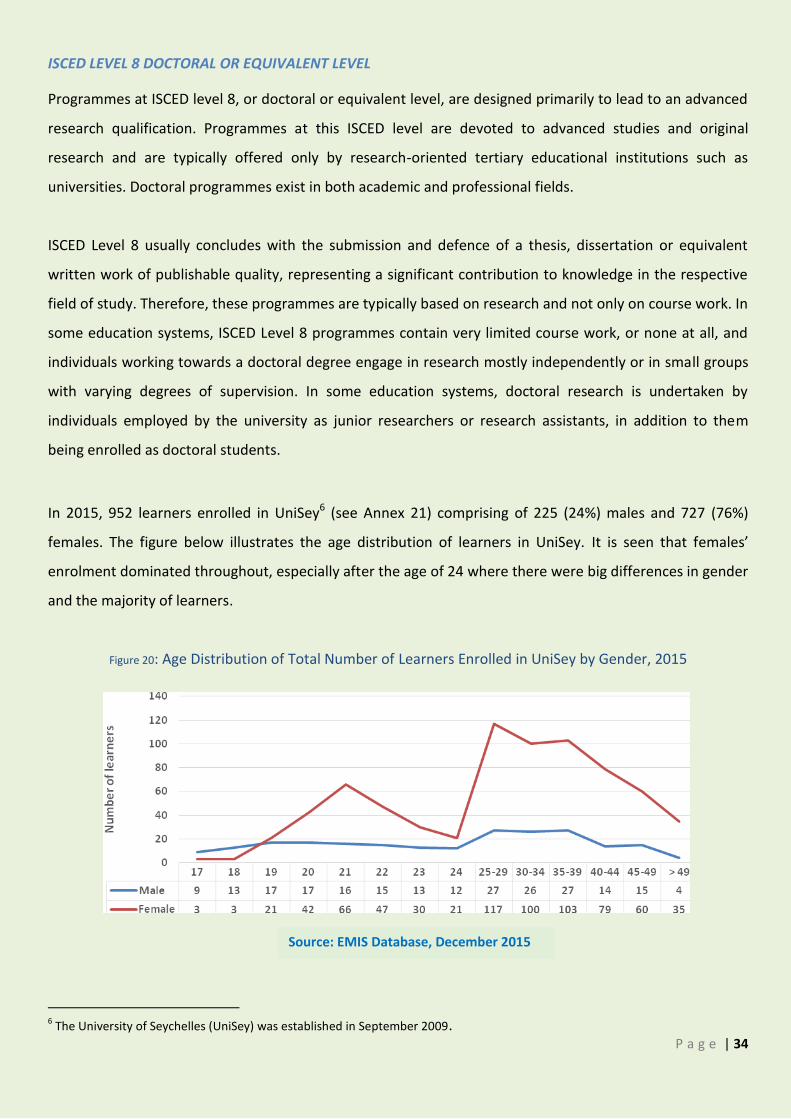
P a g e | 34
ISCED LEVEL 8 DOCTORAL OR EQUIVALENT LEVEL
Programmes at ISCED level 8, or doctoral or equivalent level, are designed primarily to lead to an advanced
research qualification. Programmes at this ISCED level are devoted to advanced studies and original
research and are typically offered only by research-oriented tertiary educational institutions such as
universities. Doctoral programmes exist in both academic and professional fields.
ISCED Level 8 usually concludes with the submission and defence of a thesis, dissertation or equivalent
written work of publishable quality, representing a significant contribution to knowledge in the respective
field of study. Therefore, these programmes are typically based on research and not only on course work. In
some education systems, ISCED Level 8 programmes contain very limited course work, or none at all, and
individuals working towards a doctoral degree engage in research mostly independently or in small groups
with varying degrees of supervision. In some education systems, doctoral research is undertaken by
individuals employed by the university as junior researchers or research assistants, in addition to them
being enrolled as doctoral students.
In 2015, 952 learners enrolled in UniSey6 (see Annex 21) comprising of 225 (24%) males and 727 (76%)
females. The figure below illustrates the age distribution of learners in UniSey. It is seen that females’
enrolment dominated throughout, especially after the age of 24 where there were big differences in gender
and the majority of learners.
Figure 20: Age Distribution of Total Number of Learners Enrolled in UniSey by Gender, 2015
6 The University of Seychelles (UniSey) was established in September 2009.
Source: EMIS Database, December 2015
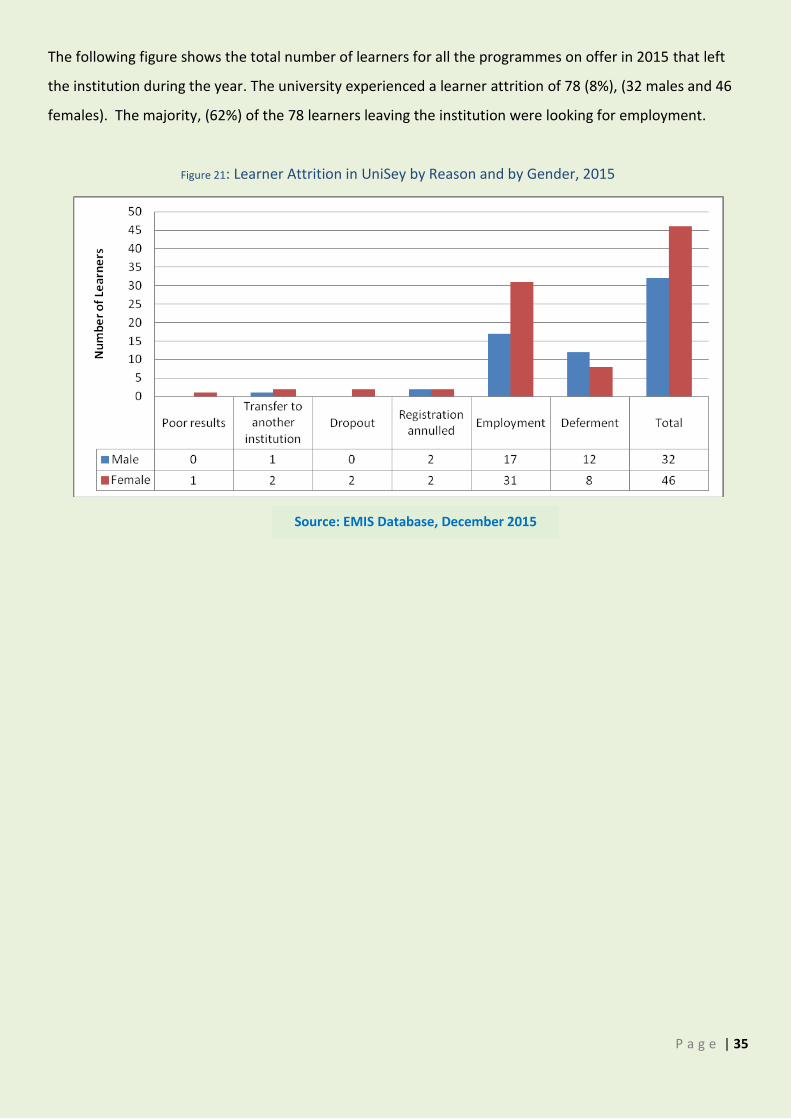
P a g e | 35
The following figure shows the total number of learners for all the programmes on offer in 2015 that left
the institution during the year. The university experienced a learner attrition of 78 (8%), (32 males and 46
females). The majority, (62%) of the 78 learners leaving the institution were looking for employment.
Figure 21: Learner Attrition in UniSey by Reason and by Gender, 2015
Source: EMIS Database, December 2015
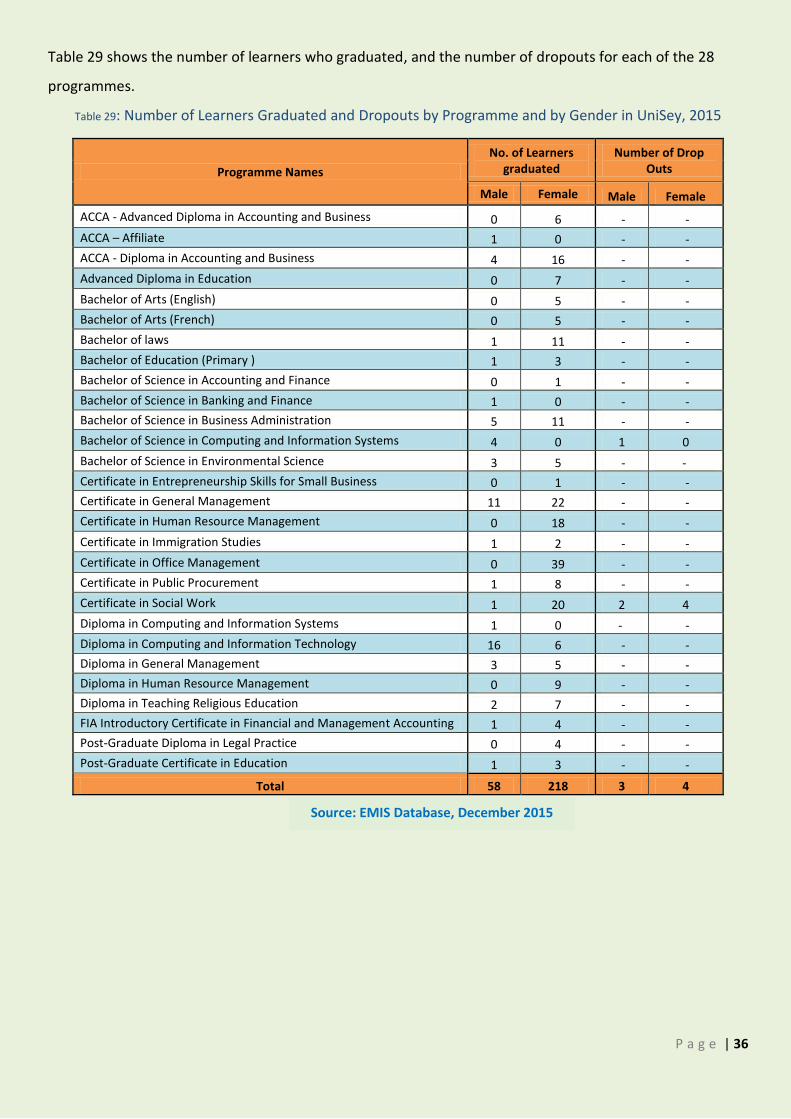
P a g e | 36
Table 29 shows the number of learners who graduated, and the number of dropouts for each of the 28
programmes.
Table 29: Number of Learners Graduated and Dropouts by Programme and by Gender in UniSey, 2015
Programme Names
No. of Learners graduated
Number of Drop Outs
Male Female Male Female
ACCA - Advanced Diploma in Accounting and Business 0 6 - -
ACCA – Affiliate 1 0 - -
ACCA - Diploma in Accounting and Business 4 16 - -
Advanced Diploma in Education 0 7 - -
Bachelor of Arts (English) 0 5 - -
Bachelor of Arts (French) 0 5 - -
Bachelor of laws 1 11 - -
Bachelor of Education (Primary ) 1 3 - -
Bachelor of Science in Accounting and Finance 0 1 - -
Bachelor of Science in Banking and Finance 1 0 - -
Bachelor of Science in Business Administration 5 11 - -
Bachelor of Science in Computing and Information Systems 4 0 1 0
Bachelor of Science in Environmental Science 3 5 - -
Certificate in Entrepreneurship Skills for Small Business 0 1 - -
Certificate in General Management 11 22 - -
Certificate in Human Resource Management 0 18 - -
Certificate in Immigration Studies 1 2 - -
Certificate in Office Management 0 39 - -
Certificate in Public Procurement 1 8 - -
Certificate in Social Work 1 20 2 4
Diploma in Computing and Information Systems 1 0 - -
Diploma in Computing and Information Technology 16 6 - -
Diploma in General Management 3 5 - -
Diploma in Human Resource Management 0 9 - -
Diploma in Teaching Religious Education 2 7 - -
FIA Introductory Certificate in Financial and Management Accounting 1 4 - -
Post-Graduate Diploma in Legal Practice 0 4 - -
Post-Graduate Certificate in Education 1 3 - -
Total 58 218 3 4
Source: EMIS Database, December 2015
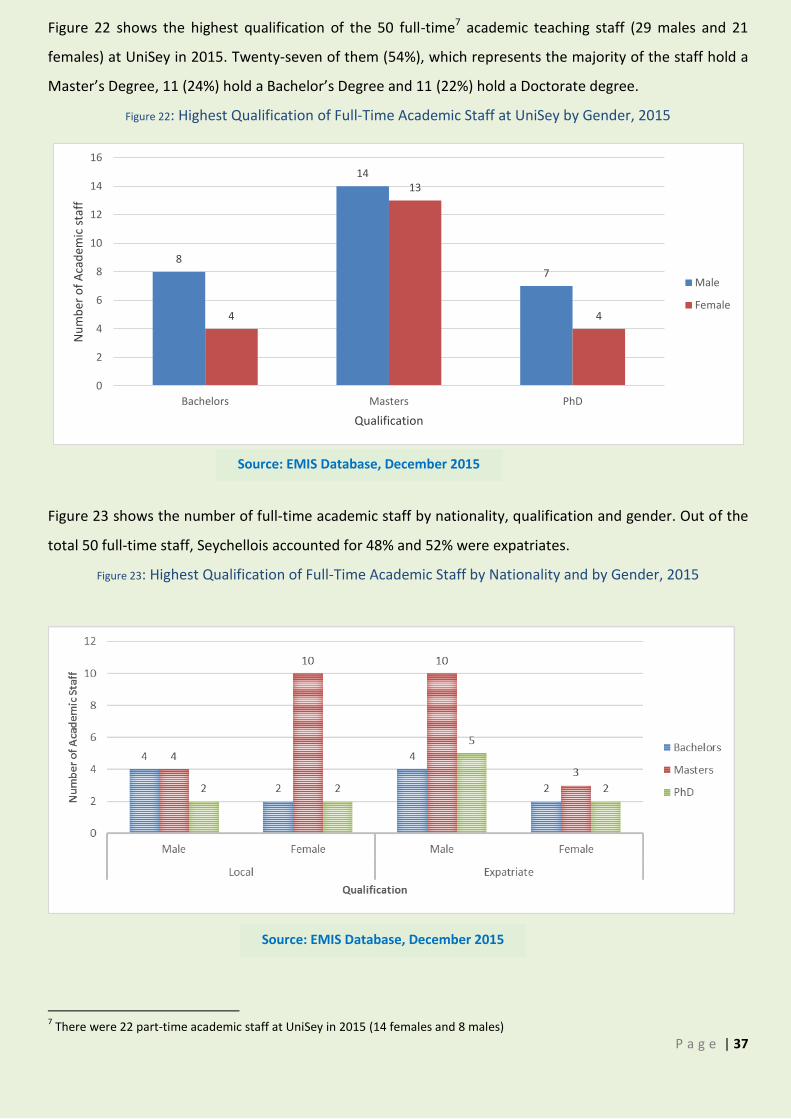
P a g e | 37
Figure 22 shows the highest qualification of the 50 full-time7 academic teaching staff (29 males and 21
females) at UniSey in 2015. Twenty-seven of them (54%), which represents the majority of the staff hold a
Master’s Degree, 11 (24%) hold a Bachelor’s Degree and 11 (22%) hold a Doctorate degree.
Figure 22: Highest Qualification of Full-Time Academic Staff at UniSey by Gender, 2015
8
14
7
4
13
4
0
2
4
6
8
10
12
14
16
Bachelors Masters PhD
Nu
mb
er o
f A
cad
emic
sta
ff
Qualification
Male
Female
Figure 23 shows the number of full-time academic staff by nationality, qualification and gender. Out of the
total 50 full-time staff, Seychellois accounted for 48% and 52% were expatriates.
Figure 23: Highest Qualification of Full-Time Academic Staff by Nationality and by Gender, 2015
7 There were 22 part-time academic staff at UniSey in 2015 (14 females and 8 males)
Source: EMIS Database, December 2015
Source: EMIS Database, December 2015
Source: EMIS Database, December 2015
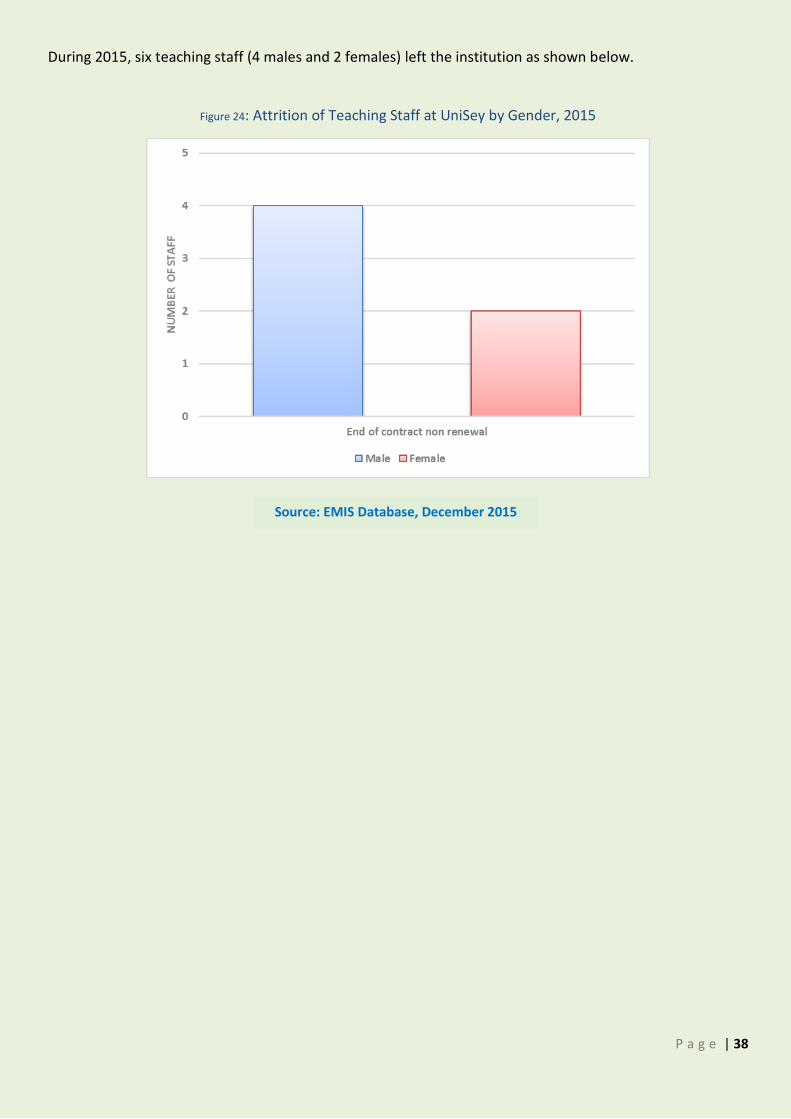
P a g e | 38
During 2015, six teaching staff (4 males and 2 females) left the institution as shown below.
Figure 24: Attrition of Teaching Staff at UniSey by Gender, 2015
Source: EMIS Database, December 2015
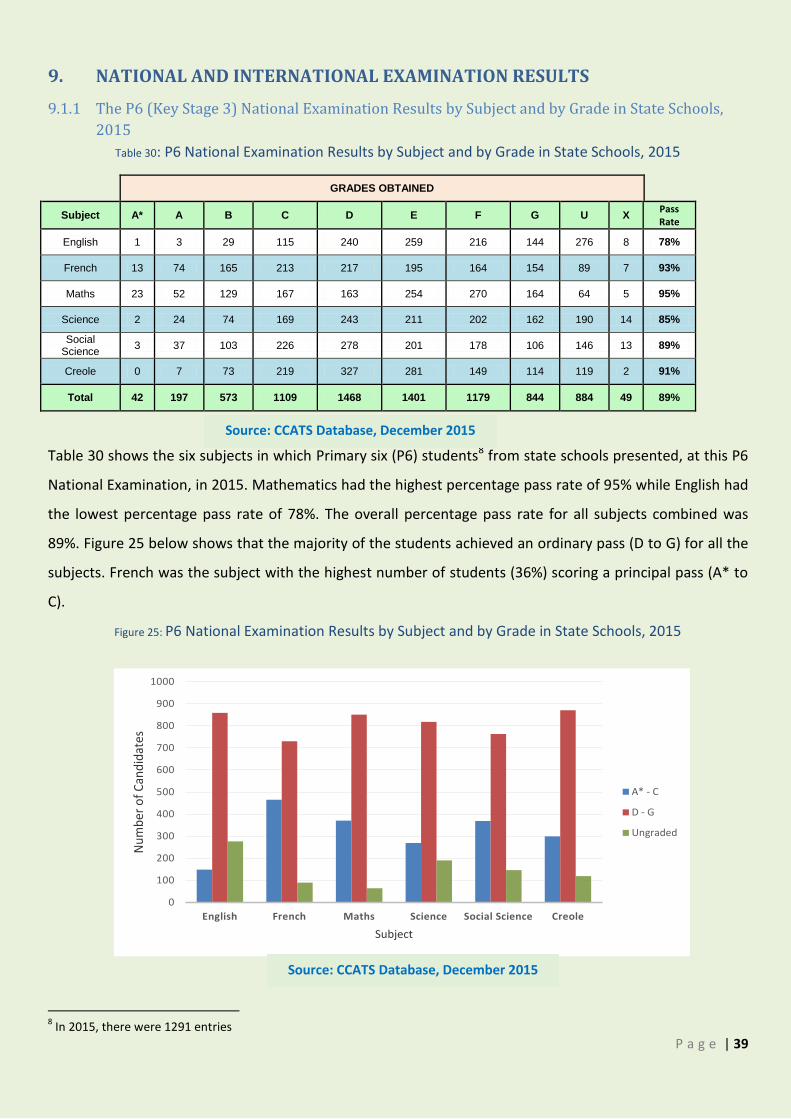
P a g e | 39
9. NATIONAL AND INTERNATIONAL EXAMINATION RESULTS
9.1.1 The P6 (Key Stage 3) National Examination Results by Subject and by Grade in State Schools,
2015
Table 30: P6 National Examination Results by Subject and by Grade in State Schools, 2015
GRADES OBTAINED
Subject A* A B C D E F G U X
Pass Rate
English 1 3 29 115 240 259 216 144 276 8 78%
French 13 74 165 213 217 195 164 154 89 7 93%
Maths 23 52 129 167 163 254 270 164 64 5 95%
Science 2 24 74 169 243 211 202 162 190 14 85%
Social Science
3 37 103 226 278 201 178 106 146 13 89%
Creole 0 7 73 219 327 281 149 114 119 2 91%
Total 42 197 573 1109 1468 1401 1179 844 884 49 89%
Table 30 shows the six subjects in which Primary six (P6) students8 from state schools presented, at this P6
National Examination, in 2015. Mathematics had the highest percentage pass rate of 95% while English had
the lowest percentage pass rate of 78%. The overall percentage pass rate for all subjects combined was
89%. Figure 25 below shows that the majority of the students achieved an ordinary pass (D to G) for all the
subjects. French was the subject with the highest number of students (36%) scoring a principal pass (A* to
C).
Figure 25: P6 National Examination Results by Subject and by Grade in State Schools, 2015
0
100
200
300
400
500
600
700
800
900
1000
English French Maths Science Social Science Creole
Nu
mb
er o
f C
and
idat
es
Subject
A* - C
D - G
Ungraded
8 In 2015, there were 1291 entries
Source: CCATS Database, December 2015
Source: CCATS Database, December 2015
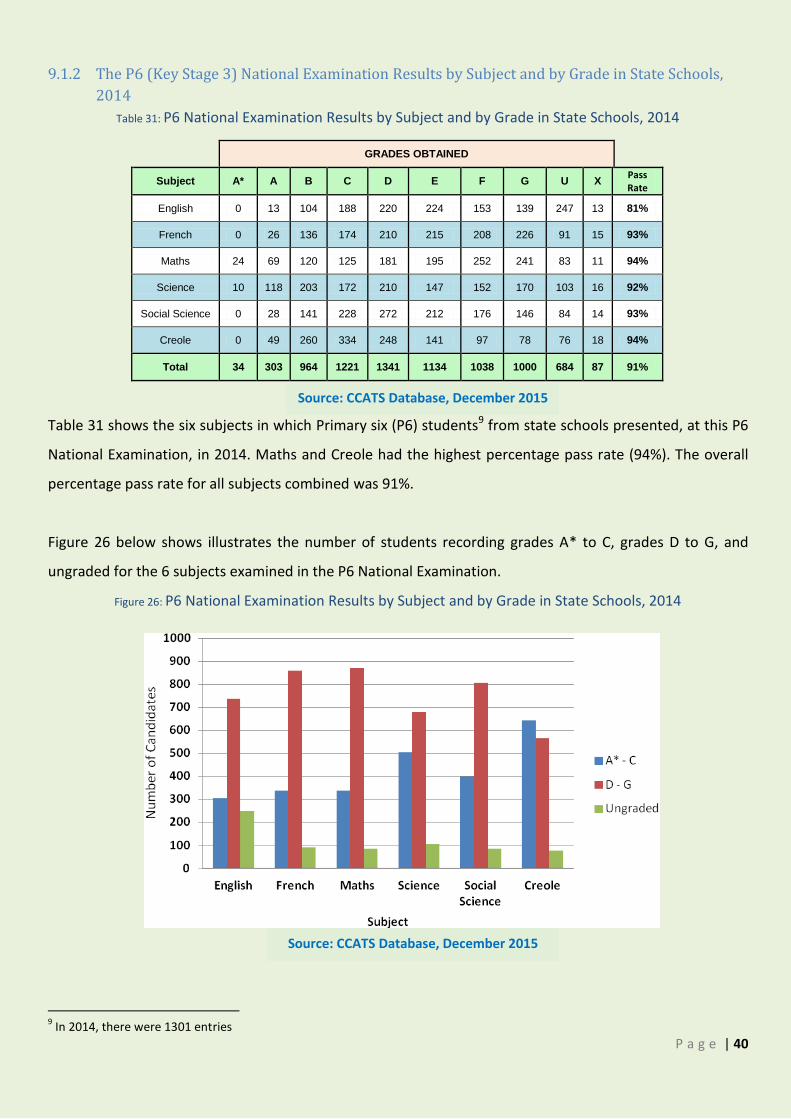
P a g e | 40
9.1.2 The P6 (Key Stage 3) National Examination Results by Subject and by Grade in State Schools,
2014
Table 31: P6 National Examination Results by Subject and by Grade in State Schools, 2014
GRADES OBTAINED
Subject A* A B C D E F G U X
Pass Rate
English 0 13 104 188 220 224 153 139 247 13 81%
French 0 26 136 174 210 215 208 226 91 15 93%
Maths 24 69 120 125 181 195 252 241 83 11 94%
Science 10 118 203 172 210 147 152 170 103 16 92%
Social Science 0 28 141 228 272 212 176 146 84 14 93%
Creole 0 49 260 334 248 141 97 78 76 18 94%
Total 34 303 964 1221 1341 1134 1038 1000 684 87 91%
Table 31 shows the six subjects in which Primary six (P6) students9 from state schools presented, at this P6
National Examination, in 2014. Maths and Creole had the highest percentage pass rate (94%). The overall
percentage pass rate for all subjects combined was 91%.
Figure 26 below shows illustrates the number of students recording grades A* to C, grades D to G, and
ungraded for the 6 subjects examined in the P6 National Examination.
Figure 26: P6 National Examination Results by Subject and by Grade in State Schools, 2014
9 In 2014, there were 1301 entries
Source: CCATS Database, December 2015
Source: CCATS Database, December 2015
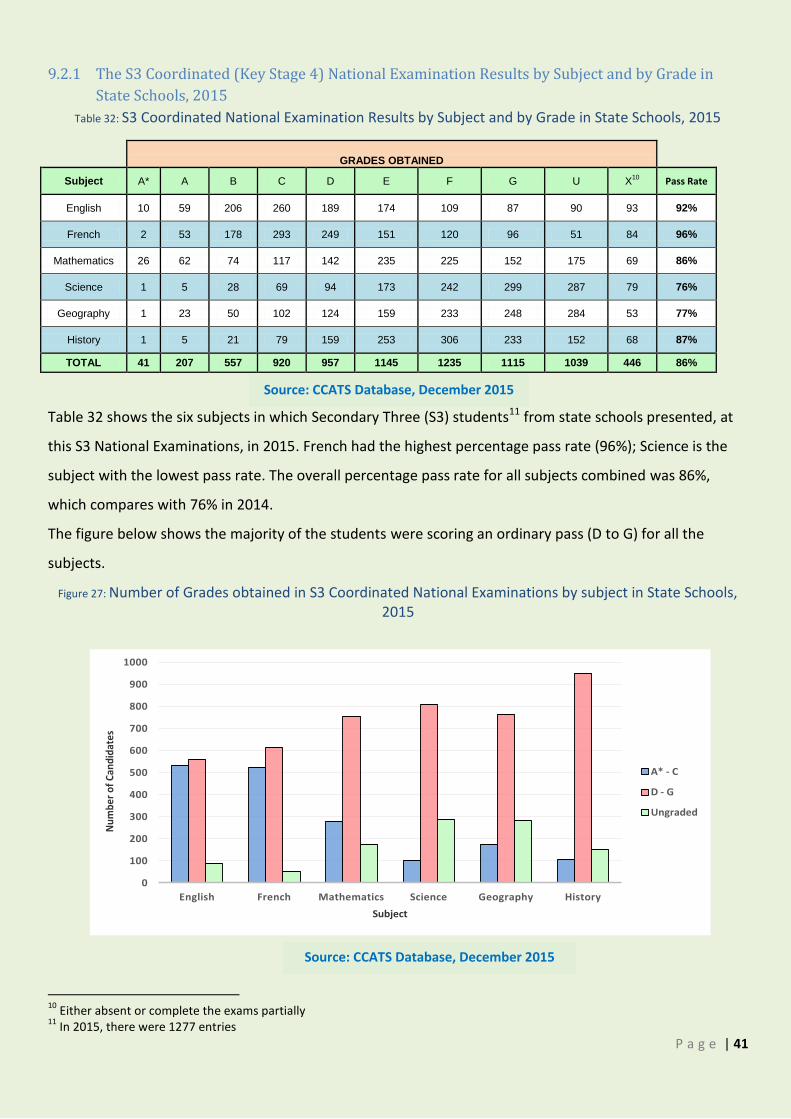
P a g e | 41
9.2.1 The S3 Coordinated (Key Stage 4) National Examination Results by Subject and by Grade in
State Schools, 2015
Table 32: S3 Coordinated National Examination Results by Subject and by Grade in State Schools, 2015
GRADES OBTAINED
Subject A* A B C D E F G U X10
Pass Rate
English 10 59 206 260 189 174 109 87 90 93 92%
French 2 53 178 293 249 151 120 96 51 84 96%
Mathematics 26 62 74 117 142 235 225 152 175 69 86%
Science 1 5 28 69 94 173 242 299 287 79 76%
Geography 1 23 50 102 124 159 233 248 284 53 77%
History 1 5 21 79 159 253 306 233 152 68 87%
TOTAL 41 207 557 920 957 1145 1235 1115 1039 446 86%
Table 32 shows the six subjects in which Secondary Three (S3) students11 from state schools presented, at
this S3 National Examinations, in 2015. French had the highest percentage pass rate (96%); Science is the
subject with the lowest pass rate. The overall percentage pass rate for all subjects combined was 86%,
which compares with 76% in 2014.
The figure below shows the majority of the students were scoring an ordinary pass (D to G) for all the
subjects. Figure 27: Number of Grades obtained in S3 Coordinated National Examinations by subject in State Schools,
2015
0
100
200
300
400
500
600
700
800
900
1000
English French Mathematics Science Geography History
Nu
mb
er o
f C
and
idat
es
Subject
A* - C
D - G
Ungraded
10
Either absent or complete the exams partially 11
In 2015, there were 1277 entries
Source: CCATS Database, December 2015
Source: CCATS Database, December 2015
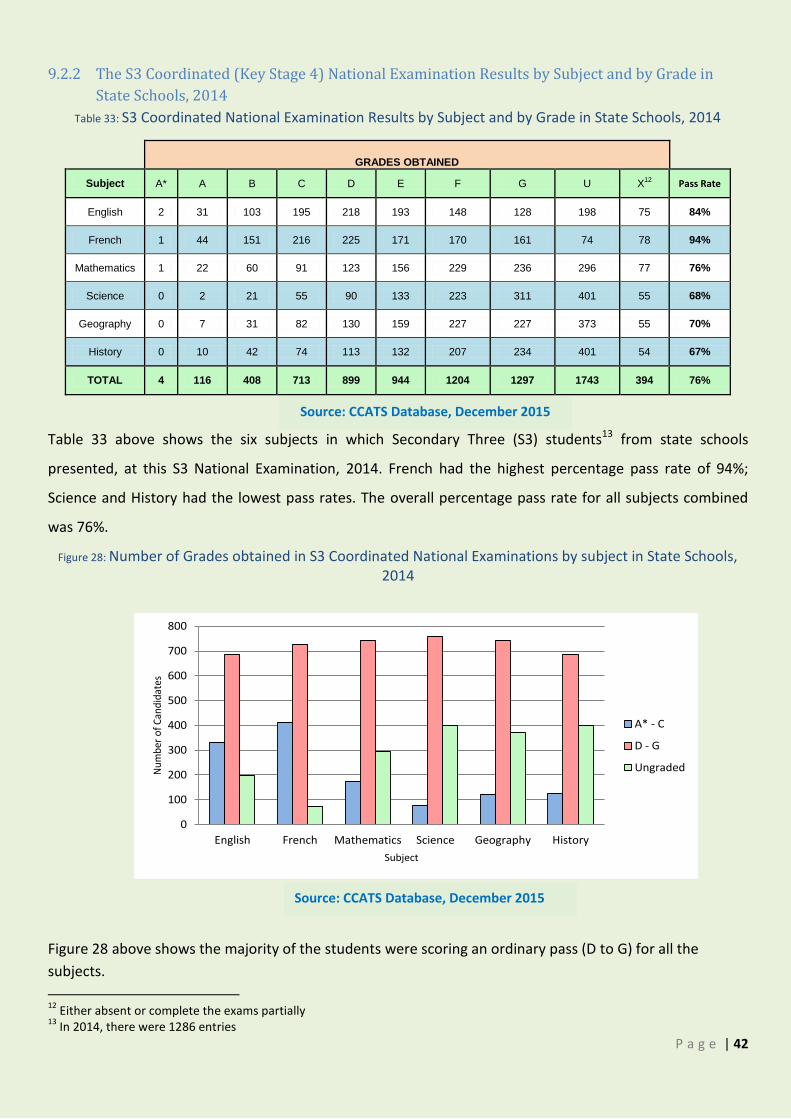
P a g e | 42
9.2.2 The S3 Coordinated (Key Stage 4) National Examination Results by Subject and by Grade in
State Schools, 2014
Table 33: S3 Coordinated National Examination Results by Subject and by Grade in State Schools, 2014
GRADES OBTAINED
Subject A* A B C D E F G U X12
Pass Rate
English 2 31 103 195 218 193 148 128 198 75 84%
French 1 44 151 216 225 171 170 161 74 78 94%
Mathematics 1 22 60 91 123 156 229 236 296 77 76%
Science 0 2 21 55 90 133 223 311 401 55 68%
Geography 0 7 31 82 130 159 227 227 373 55 70%
History 0 10 42 74 113 132 207 234 401 54 67%
TOTAL 4 116 408 713 899 944 1204 1297 1743 394 76%
Table 33 above shows the six subjects in which Secondary Three (S3) students13 from state schools
presented, at this S3 National Examination, 2014. French had the highest percentage pass rate of 94%;
Science and History had the lowest pass rates. The overall percentage pass rate for all subjects combined
was 76%.
Figure 28: Number of Grades obtained in S3 Coordinated National Examinations by subject in State Schools, 2014
Figure 28 above shows the majority of the students were scoring an ordinary pass (D to G) for all the
subjects.
12
Either absent or complete the exams partially 13
In 2014, there were 1286 entries
0
100
200
300
400
500
600
700
800
English French Mathematics Science Geography History
Num
ber
of C
andi
date
s
Subject
A* - C
D - G
Ungraded
Source: CCATS Database, December 2015
Source: CCATS Database, December 2015
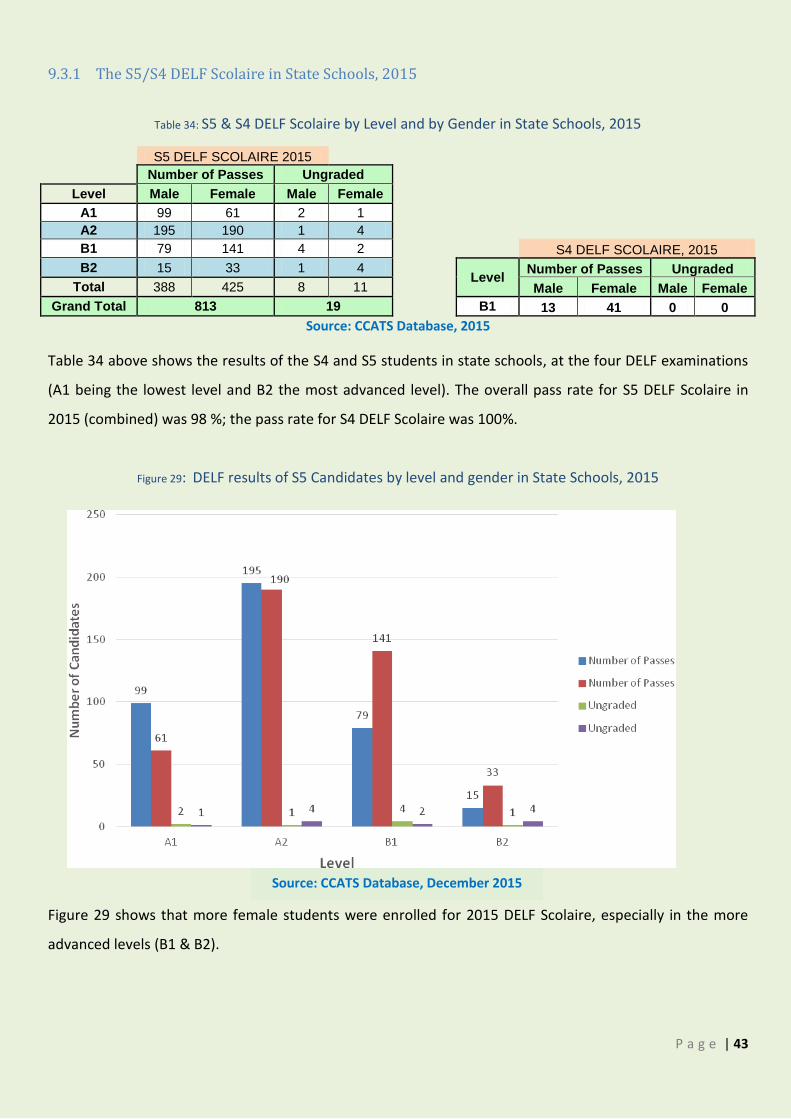
P a g e | 43
9.3.1 The S5/S4 DELF Scolaire in State Schools, 2015
Table 34: S5 & S4 DELF Scolaire by Level and by Gender in State Schools, 2015
S5 DELF SCOLAIRE 2015
Number of Passes Ungraded
Level Male Female Male Female
A1 99 61 2 1
A2 195 190 1 4
B1 79 141 4 2
S4 DELF SCOLAIRE, 2015
B2 15 33 1 4
Level
Number of Passes Ungraded
Total 388 425 8 11
Male Female Male Female
Grand Total 813 19
B1 13 41 0 0
Source: CCATS Database, 2015
Table 34 above shows the results of the S4 and S5 students in state schools, at the four DELF examinations
(A1 being the lowest level and B2 the most advanced level). The overall pass rate for S5 DELF Scolaire in
2015 (combined) was 98 %; the pass rate for S4 DELF Scolaire was 100%.
Figure 29: DELF results of S5 Candidates by level and gender in State Schools, 2015
Figure 29 shows that more female students were enrolled for 2015 DELF Scolaire, especially in the more
advanced levels (B1 & B2).
Source: CCATS Database, December 2015
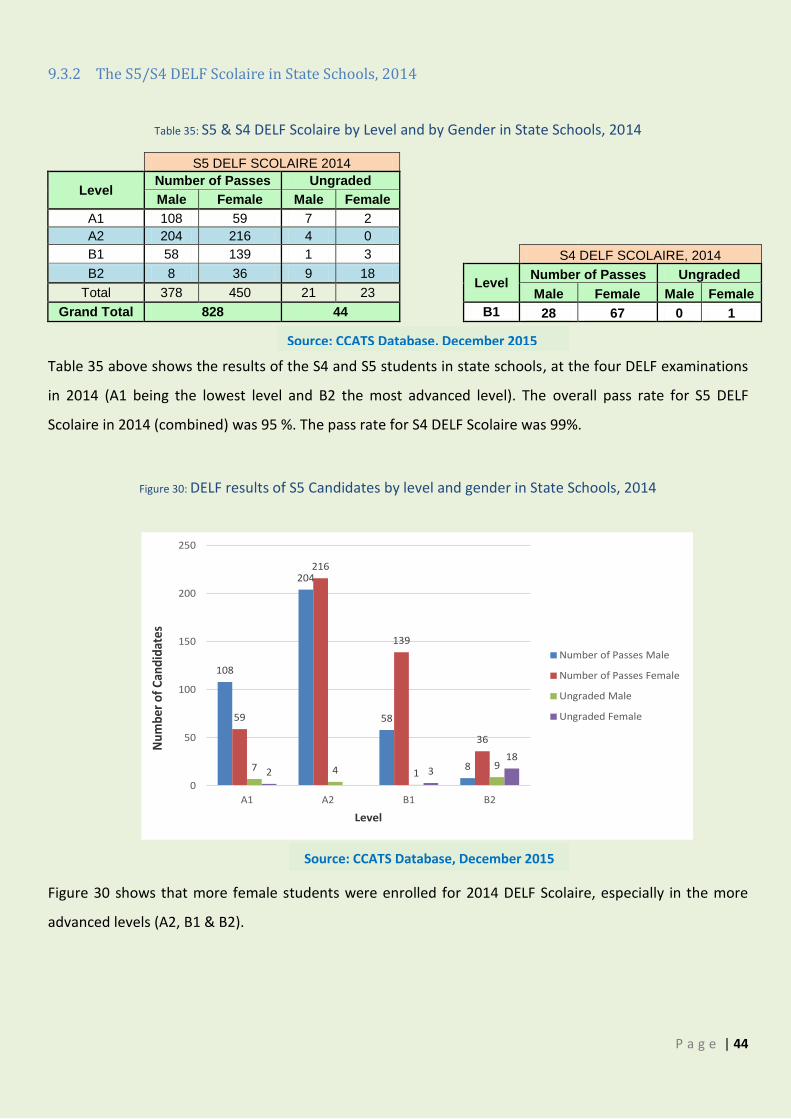
P a g e | 44
9.3.2 The S5/S4 DELF Scolaire in State Schools, 2014
Table 35: S5 & S4 DELF Scolaire by Level and by Gender in State Schools, 2014
S5 DELF SCOLAIRE 2014
Level
Number of Passes Ungraded
Male Female Male Female
A1 108 59 7 2
A2 204 216 4 0
B1 58 139 1 3
S4 DELF SCOLAIRE, 2014
B2 8 36 9 18
Level
Number of Passes Ungraded
Total 378 450 21 23
Male Female Male Female
Grand Total 828 44
B1 28 67 0 1
Table 35 above shows the results of the S4 and S5 students in state schools, at the four DELF examinations
in 2014 (A1 being the lowest level and B2 the most advanced level). The overall pass rate for S5 DELF
Scolaire in 2014 (combined) was 95 %. The pass rate for S4 DELF Scolaire was 99%.
Figure 30: DELF results of S5 Candidates by level and gender in State Schools, 2014
Figure 30 shows that more female students were enrolled for 2014 DELF Scolaire, especially in the more
advanced levels (A2, B1 & B2).
108
204
58
8
59
216
139
36
7 4 19
2 3
18
0
50
100
150
200
250
A1 A2 B1 B2
Nu
mb
er o
f C
and
idat
es
Level
Number of Passes Male
Number of Passes Female
Ungraded Male
Ungraded Female
Source: CCATS Database, December 2015
Source: CCATS Database, December 2015
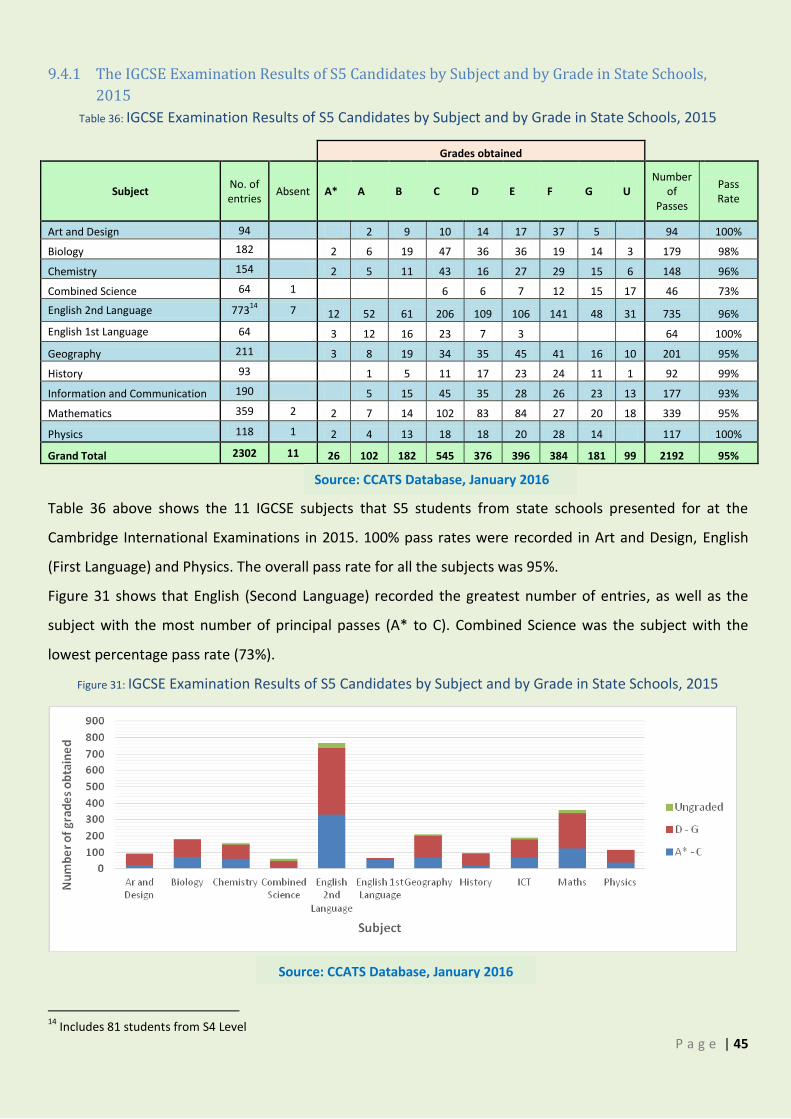
P a g e | 45
9.4.1 The IGCSE Examination Results of S5 Candidates by Subject and by Grade in State Schools,
2015
Table 36: IGCSE Examination Results of S5 Candidates by Subject and by Grade in State Schools, 2015
Grades obtained
Subject No. of entries
Absent A* A B C D E F G U Number
of Passes
Pass Rate
Art and Design 94 2 9 10 14 17 37 5 94 100%
Biology 182 2 6 19 47 36 36 19 14 3 179 98%
Chemistry 154 2 5 11 43 16 27 29 15 6 148 96%
Combined Science 64 1 6 6 7 12 15 17 46 73%
English 2nd Language 77314
7 12 52 61 206 109 106 141 48 31 735 96%
English 1st Language 64 3 12 16 23 7 3 64 100%
Geography 211 3 8 19 34 35 45 41 16 10 201 95%
History 93 1 5 11 17 23 24 11 1 92 99%
Information and Communication 190 5 15 45 35 28 26 23 13 177 93%
Mathematics 359 2 2 7 14 102 83 84 27 20 18 339 95%
Physics 118 1 2 4 13 18 18 20 28 14 117 100%
Grand Total 2302 11 26 102 182 545 376 396 384 181 99 2192 95%
Table 36 above shows the 11 IGCSE subjects that S5 students from state schools presented for at the
Cambridge International Examinations in 2015. 100% pass rates were recorded in Art and Design, English
(First Language) and Physics. The overall pass rate for all the subjects was 95%.
Figure 31 shows that English (Second Language) recorded the greatest number of entries, as well as the
subject with the most number of principal passes (A* to C). Combined Science was the subject with the
lowest percentage pass rate (73%). Figure 31: IGCSE Examination Results of S5 Candidates by Subject and by Grade in State Schools, 2015
14
Includes 81 students from S4 Level
Source: CCATS Database, January 2016
Source: CCATS Database, January 2016
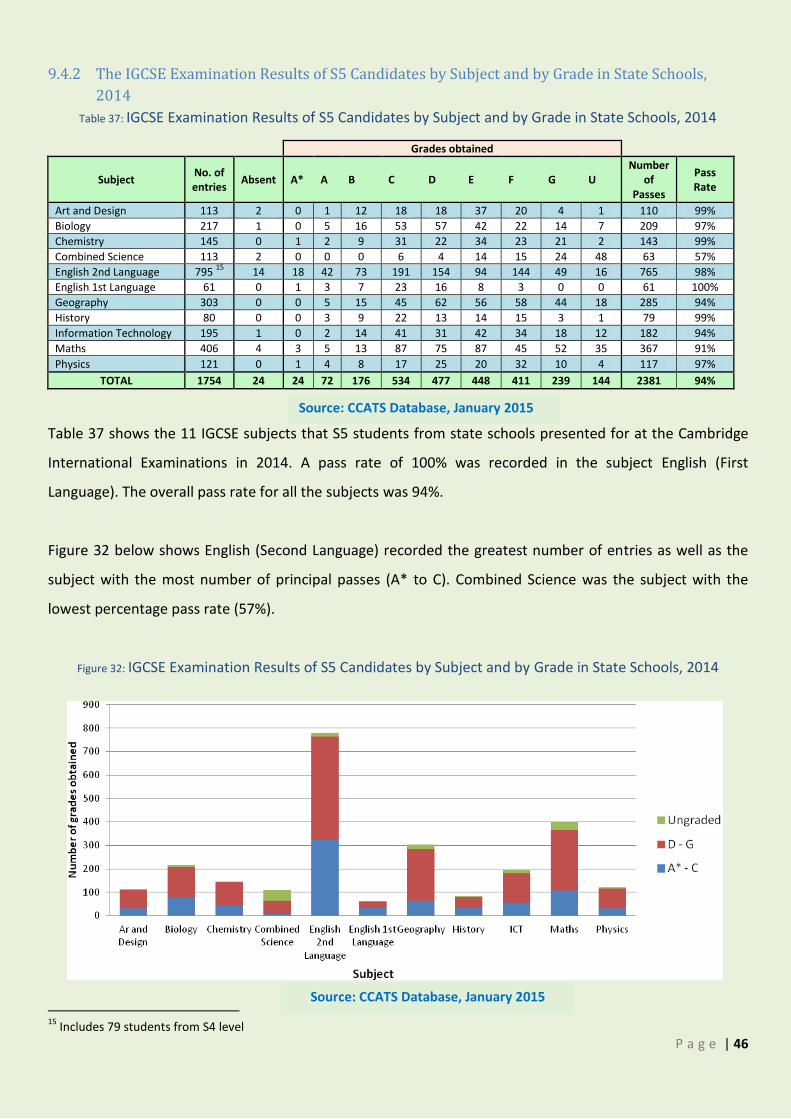
P a g e | 46
9.4.2 The IGCSE Examination Results of S5 Candidates by Subject and by Grade in State Schools,
2014
Table 37: IGCSE Examination Results of S5 Candidates by Subject and by Grade in State Schools, 2014
Grades obtained
Subject No. of entries
Absent A* A B C D E F G U Number
of Passes
Pass Rate
Art and Design 113 2 0 1 12 18 18 37 20 4 1 110 99%
Biology 217 1 0 5 16 53 57 42 22 14 7 209 97%
Chemistry 145 0 1 2 9 31 22 34 23 21 2 143 99%
Combined Science 113 2 0 0 0 6 4 14 15 24 48 63 57%
English 2nd Language 795 15
14 18 42 73 191 154 94 144 49 16 765 98%
English 1st Language 61 0 1 3 7 23 16 8 3 0 0 61 100%
Geography 303 0 0 5 15 45 62 56 58 44 18 285 94%
History 80 0 0 3 9 22 13 14 15 3 1 79 99%
Information Technology 195 1 0 2 14 41 31 42 34 18 12 182 94%
Maths 406 4 3 5 13 87 75 87 45 52 35 367 91%
Physics 121 0 1 4 8 17 25 20 32 10 4 117 97%
TOTAL 1754 24 24 72 176 534 477 448 411 239 144 2381 94%
Table 37 shows the 11 IGCSE subjects that S5 students from state schools presented for at the Cambridge
International Examinations in 2014. A pass rate of 100% was recorded in the subject English (First
Language). The overall pass rate for all the subjects was 94%.
Figure 32 below shows English (Second Language) recorded the greatest number of entries as well as the
subject with the most number of principal passes (A* to C). Combined Science was the subject with the
lowest percentage pass rate (57%).
Figure 32: IGCSE Examination Results of S5 Candidates by Subject and by Grade in State Schools, 2014
15
Includes 79 students from S4 level
Source: CCATS Database, January 2015
Source: CCATS Database, January 2015
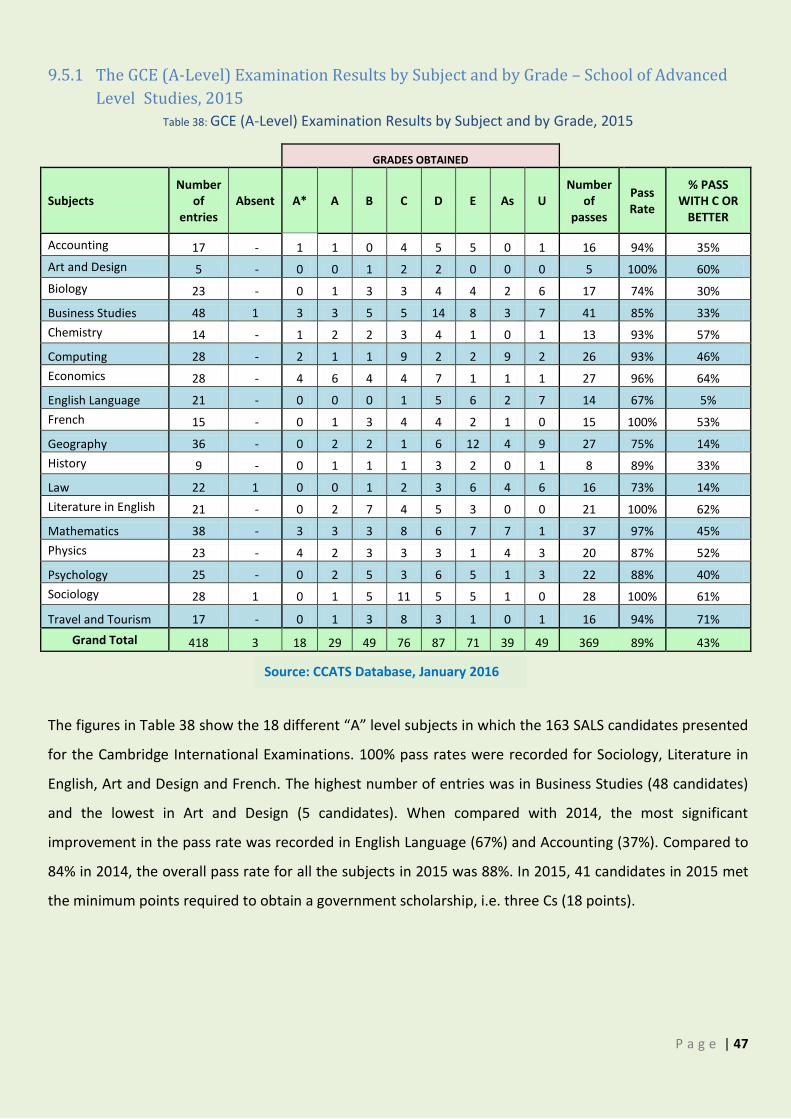
P a g e | 47
9.5.1 The GCE (A-Level) Examination Results by Subject and by Grade – School of Advanced
Level Studies, 2015
Table 38: GCE (A-Level) Examination Results by Subject and by Grade, 2015
GRADES OBTAINED
Subjects Number
of entries
Absent A* A B C D E As U Number
of passes
Pass Rate
% PASS WITH C OR
BETTER
Accounting 17 - 1 1 0 4 5 5 0 1 16 94% 35%
Art and Design 5 - 0 0 1 2 2 0 0 0 5 100% 60%
Biology 23 - 0 1 3 3 4 4 2 6 17 74% 30%
Business Studies 48 1 3 3 5 5 14 8 3 7 41 85% 33%
Chemistry 14 - 1 2 2 3 4 1 0 1 13 93% 57%
Computing 28 - 2 1 1 9 2 2 9 2 26 93% 46%
Economics 28 - 4 6 4 4 7 1 1 1 27 96% 64%
English Language 21 - 0 0 0 1 5 6 2 7 14 67% 5%
French 15 - 0 1 3 4 4 2 1 0 15 100% 53%
Geography 36 - 0 2 2 1 6 12 4 9 27 75% 14%
History 9 - 0 1 1 1 3 2 0 1 8 89% 33%
Law 22 1 0 0 1 2 3 6 4 6 16 73% 14%
Literature in English 21 - 0 2 7 4 5 3 0 0 21 100% 62%
Mathematics 38 - 3 3 3 8 6 7 7 1 37 97% 45%
Physics 23 - 4 2 3 3 3 1 4 3 20 87% 52%
Psychology 25 - 0 2 5 3 6 5 1 3 22 88% 40%
Sociology 28 1 0 1 5 11 5 5 1 0 28 100% 61%
Travel and Tourism 17 - 0 1 3 8 3 1 0 1 16 94% 71%
Grand Total 418 3 18 29 49 76 87 71 39 49 369 89% 43%
The figures in Table 38 show the 18 different “A” level subjects in which the 163 SALS candidates presented
for the Cambridge International Examinations. 100% pass rates were recorded for Sociology, Literature in
English, Art and Design and French. The highest number of entries was in Business Studies (48 candidates)
and the lowest in Art and Design (5 candidates). When compared with 2014, the most significant
improvement in the pass rate was recorded in English Language (67%) and Accounting (37%). Compared to
84% in 2014, the overall pass rate for all the subjects in 2015 was 88%. In 2015, 41 candidates in 2015 met
the minimum points required to obtain a government scholarship, i.e. three Cs (18 points).
Source: CCATS Database, January 2016
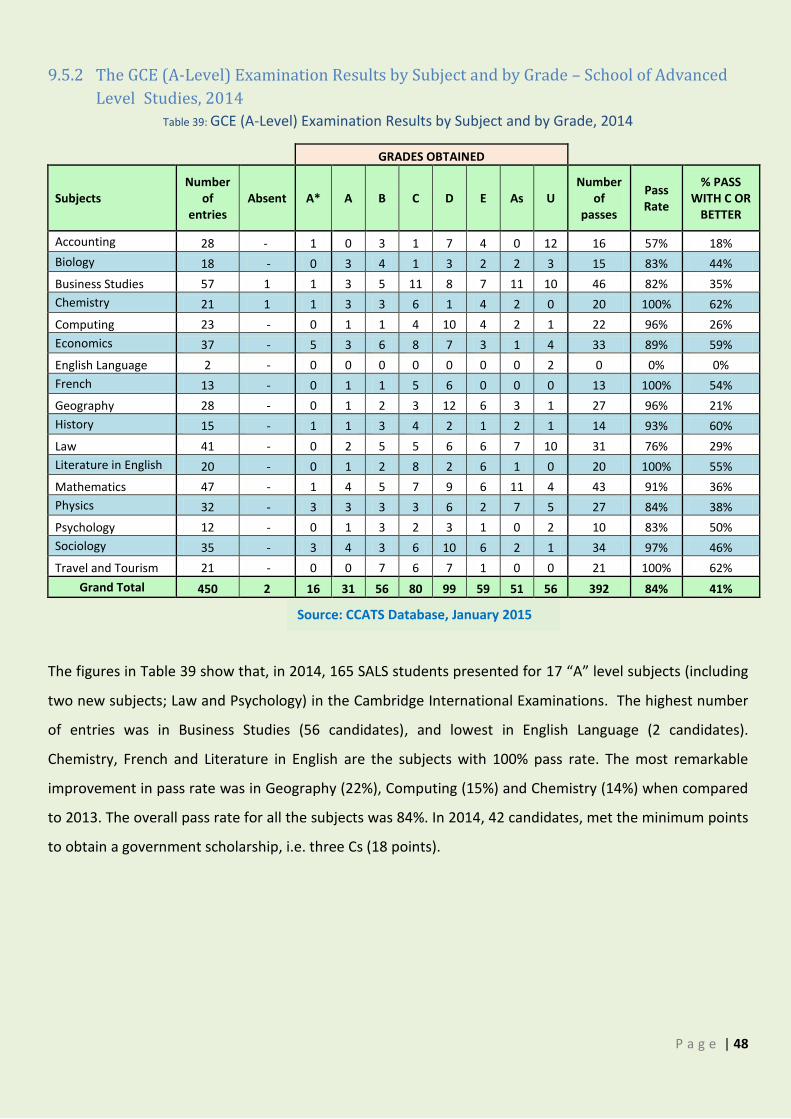
P a g e | 48
9.5.2 The GCE (A-Level) Examination Results by Subject and by Grade – School of Advanced
Level Studies, 2014
Table 39: GCE (A-Level) Examination Results by Subject and by Grade, 2014
GRADES OBTAINED
Subjects Number
of entries
Absent A* A B C D E As U Number
of passes
Pass Rate
% PASS WITH C OR
BETTER
Accounting 28 - 1 0 3 1 7 4 0 12 16 57% 18%
Biology 18 - 0 3 4 1 3 2 2 3 15 83% 44%
Business Studies 57 1 1 3 5 11 8 7 11 10 46 82% 35%
Chemistry 21 1 1 3 3 6 1 4 2 0 20 100% 62%
Computing 23 - 0 1 1 4 10 4 2 1 22 96% 26%
Economics 37 - 5 3 6 8 7 3 1 4 33 89% 59%
English Language 2 - 0 0 0 0 0 0 0 2 0 0% 0%
French 13 - 0 1 1 5 6 0 0 0 13 100% 54%
Geography 28 - 0 1 2 3 12 6 3 1 27 96% 21%
History 15 - 1 1 3 4 2 1 2 1 14 93% 60%
Law 41 - 0 2 5 5 6 6 7 10 31 76% 29%
Literature in English 20 - 0 1 2 8 2 6 1 0 20 100% 55%
Mathematics 47 - 1 4 5 7 9 6 11 4 43 91% 36%
Physics 32 - 3 3 3 3 6 2 7 5 27 84% 38%
Psychology 12 - 0 1 3 2 3 1 0 2 10 83% 50%
Sociology 35 - 3 4 3 6 10 6 2 1 34 97% 46%
Travel and Tourism 21 - 0 0 7 6 7 1 0 0 21 100% 62%
Grand Total 450 2 16 31 56 80 99 59 51 56 392 84% 41%
The figures in Table 39 show that, in 2014, 165 SALS students presented for 17 “A” level subjects (including
two new subjects; Law and Psychology) in the Cambridge International Examinations. The highest number
of entries was in Business Studies (56 candidates), and lowest in English Language (2 candidates).
Chemistry, French and Literature in English are the subjects with 100% pass rate. The most remarkable
improvement in pass rate was in Geography (22%), Computing (15%) and Chemistry (14%) when compared
to 2013. The overall pass rate for all the subjects was 84%. In 2014, 42 candidates, met the minimum points
to obtain a government scholarship, i.e. three Cs (18 points).
Source: CCATS Database, January 2015
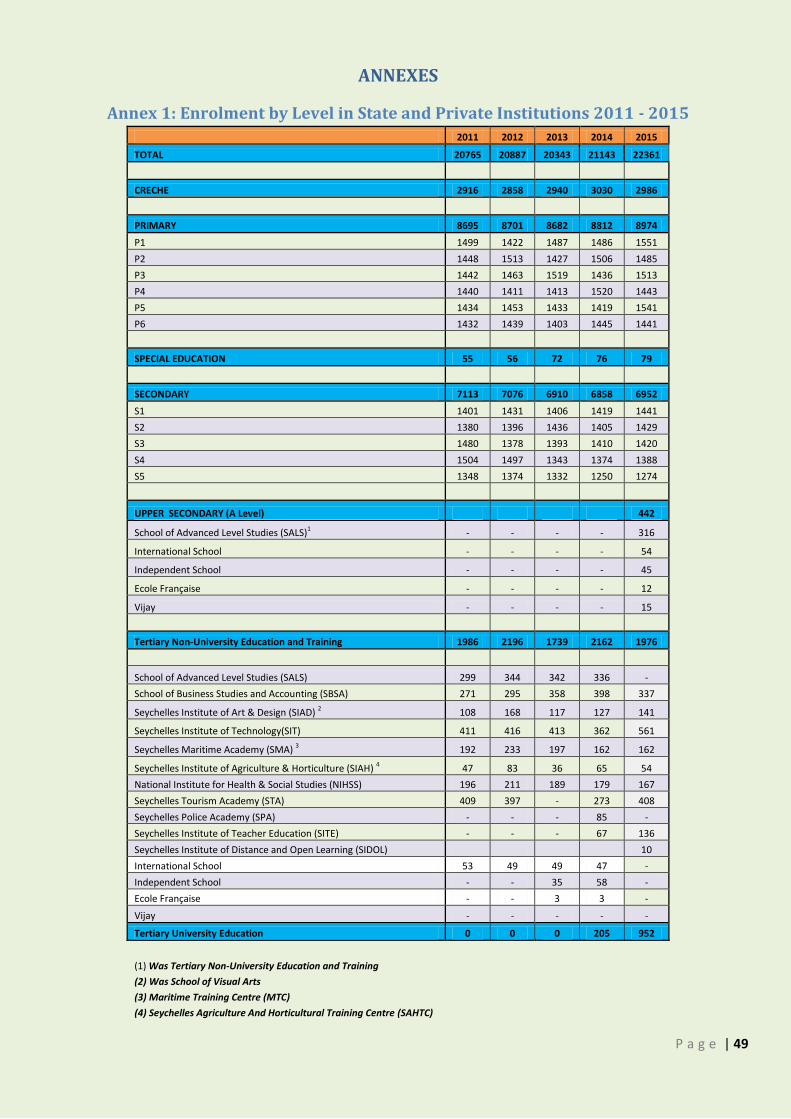
P a g e | 49
ANNEXES
Annex 1: Enrolment by Level in State and Private Institutions 2011 - 2015
2011 2012 2013 2014 2015
TOTAL 20765 20887 20343 21143 22361
CRECHE 2916 2858 2940 3030 2986
PRIMARY 8695 8701 8682 8812 8974
P1 1499 1422 1487 1486 1551
P2 1448 1513 1427 1506 1485
P3 1442 1463 1519 1436 1513
P4 1440 1411 1413 1520 1443
P5 1434 1453 1433 1419 1541
P6 1432 1439 1403 1445 1441
SPECIAL EDUCATION 55 56 72 76 79
SECONDARY 7113 7076 6910 6858 6952
S1 1401 1431 1406 1419 1441
S2 1380 1396 1436 1405 1429
S3 1480 1378 1393 1410 1420
S4 1504 1497 1343 1374 1388
S5 1348 1374 1332 1250 1274
UPPER SECONDARY (A Level) 442
School of Advanced Level Studies (SALS)1 - - - - 316
International School - - - - 54
Independent School - - - - 45
Ecole Française - - - - 12
Vijay - - - - 15
Tertiary Non-University Education and Training 1986 2196 1739 2162 1976
School of Advanced Level Studies (SALS) 299 344 342 336 -
School of Business Studies and Accounting (SBSA) 271 295 358 398 337
Seychelles Institute of Art & Design (SIAD) 2 108 168 117 127 141
Seychelles Institute of Technology(SIT) 411 416 413 362 561
Seychelles Maritime Academy (SMA) 3 192 233 197 162 162
Seychelles Institute of Agriculture & Horticulture (SIAH) 4 47 83 36 65 54
National Institute for Health & Social Studies (NIHSS) 196 211 189 179 167
Seychelles Tourism Academy (STA) 409 397 - 273 408
Seychelles Police Academy (SPA) - - - 85 -
Seychelles Institute of Teacher Education (SITE) - - - 67 136
Seychelles Institute of Distance and Open Learning (SIDOL) 10
International School 53 49 49 47 -
Independent School - - 35 58 -
Ecole Française - - 3 3 -
Vijay - - - - -
Tertiary University Education 0 0 0 205 952
(1) Was Tertiary Non-University Education and Training (2) Was School of Visual Arts (3) Maritime Training Centre (MTC) (4) Seychelles Agriculture And Horticultural Training Centre (SAHTC)
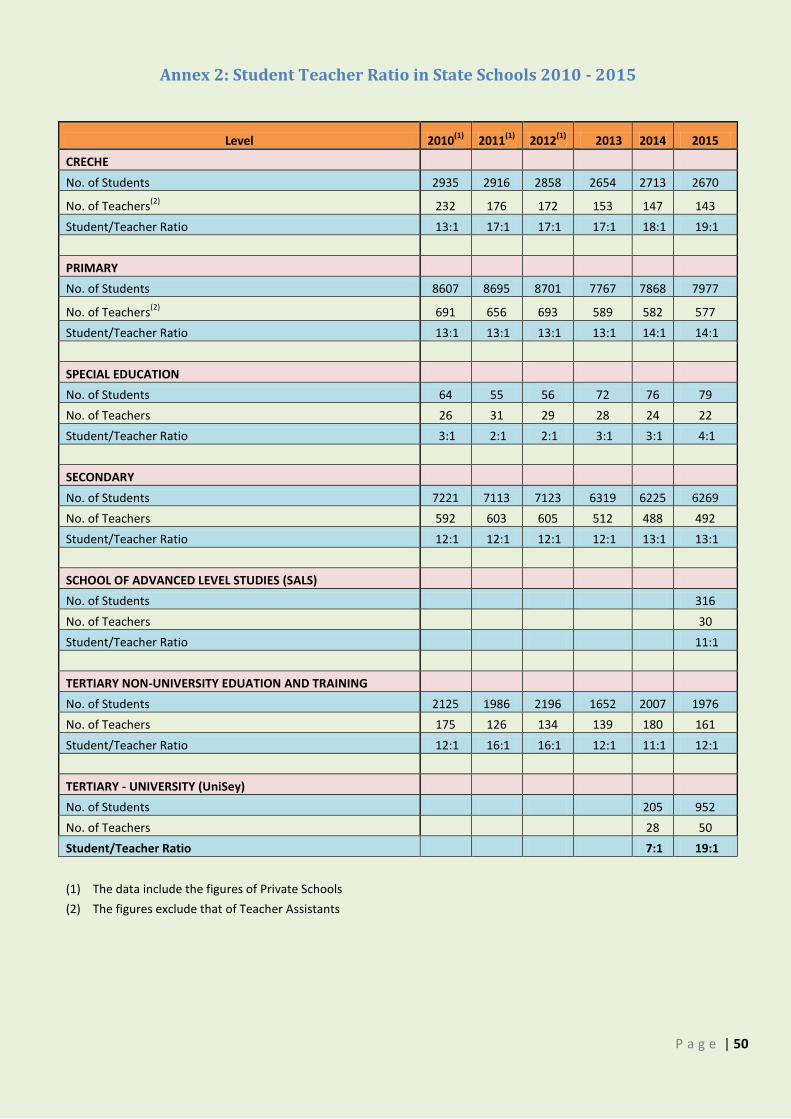
P a g e | 50
Annex 2: Student Teacher Ratio in State Schools 2010 - 2015
Level 2010(1)
2011(1)
2012(1)
2013 2014 2015
CRECHE
No. of Students 2935 2916 2858 2654 2713 2670
No. of Teachers(2)
232 176 172 153 147 143
Student/Teacher Ratio 13:1 17:1 17:1 17:1 18:1 19:1
PRIMARY
No. of Students 8607 8695 8701 7767 7868 7977
No. of Teachers(2)
691 656 693 589 582 577
Student/Teacher Ratio 13:1 13:1 13:1 13:1 14:1 14:1
SPECIAL EDUCATION
No. of Students 64 55 56 72 76 79
No. of Teachers 26 31 29 28 24 22
Student/Teacher Ratio 3:1 2:1 2:1 3:1 3:1 4:1
SECONDARY
No. of Students 7221 7113 7123 6319 6225 6269
No. of Teachers 592 603 605 512 488 492
Student/Teacher Ratio 12:1 12:1 12:1 12:1 13:1 13:1
SCHOOL OF ADVANCED LEVEL STUDIES (SALS)
No. of Students 316
No. of Teachers 30
Student/Teacher Ratio 11:1
TERTIARY NON-UNIVERSITY EDUATION AND TRAINING
No. of Students 2125 1986 2196 1652 2007 1976
No. of Teachers 175 126 134 139 180 161
Student/Teacher Ratio 12:1 16:1 16:1 12:1 11:1 12:1
TERTIARY - UNIVERSITY (UniSey)
No. of Students 205 952
No. of Teachers 28 50
Student/Teacher Ratio 7:1 19:1
(1) The data include the figures of Private Schools (2) The figures exclude that of Teacher Assistants
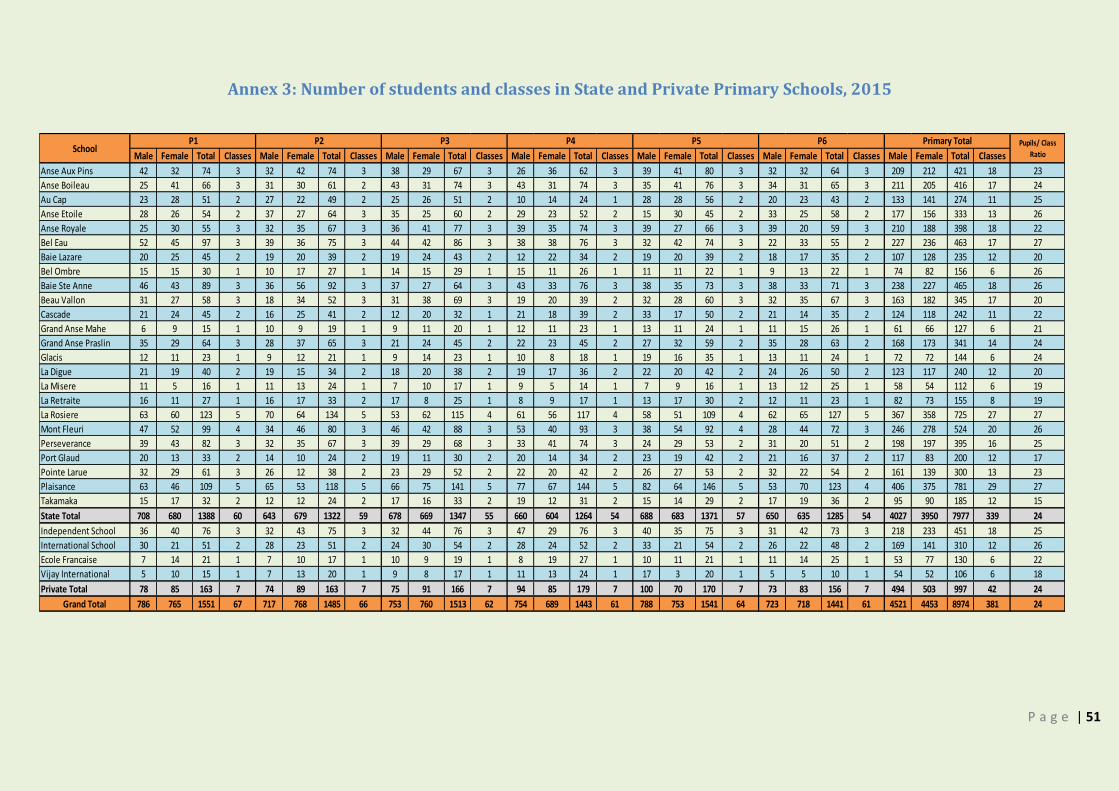
P a g e | 51
Annex 3: Number of students and classes in State and Private Primary Schools, 2015
Male Female Total Classes Male Female Total Classes Male Female Total Classes Male Female Total Classes Male Female Total Classes Male Female Total Classes Male Female Total Classes
Anse Aux Pins 42 32 74 3 32 42 74 3 38 29 67 3 26 36 62 3 39 41 80 3 32 32 64 3 209 212 421 18 23
Anse Boileau 25 41 66 3 31 30 61 2 43 31 74 3 43 31 74 3 35 41 76 3 34 31 65 3 211 205 416 17 24
Au Cap 23 28 51 2 27 22 49 2 25 26 51 2 10 14 24 1 28 28 56 2 20 23 43 2 133 141 274 11 25
Anse Etoile 28 26 54 2 37 27 64 3 35 25 60 2 29 23 52 2 15 30 45 2 33 25 58 2 177 156 333 13 26
Anse Royale 25 30 55 3 32 35 67 3 36 41 77 3 39 35 74 3 39 27 66 3 39 20 59 3 210 188 398 18 22
Bel Eau 52 45 97 3 39 36 75 3 44 42 86 3 38 38 76 3 32 42 74 3 22 33 55 2 227 236 463 17 27
Baie Lazare 20 25 45 2 19 20 39 2 19 24 43 2 12 22 34 2 19 20 39 2 18 17 35 2 107 128 235 12 20
Bel Ombre 15 15 30 1 10 17 27 1 14 15 29 1 15 11 26 1 11 11 22 1 9 13 22 1 74 82 156 6 26
Baie Ste Anne 46 43 89 3 36 56 92 3 37 27 64 3 43 33 76 3 38 35 73 3 38 33 71 3 238 227 465 18 26
Beau Vallon 31 27 58 3 18 34 52 3 31 38 69 3 19 20 39 2 32 28 60 3 32 35 67 3 163 182 345 17 20
Cascade 21 24 45 2 16 25 41 2 12 20 32 1 21 18 39 2 33 17 50 2 21 14 35 2 124 118 242 11 22
Grand Anse Mahe 6 9 15 1 10 9 19 1 9 11 20 1 12 11 23 1 13 11 24 1 11 15 26 1 61 66 127 6 21
Grand Anse Praslin 35 29 64 3 28 37 65 3 21 24 45 2 22 23 45 2 27 32 59 2 35 28 63 2 168 173 341 14 24
Glacis 12 11 23 1 9 12 21 1 9 14 23 1 10 8 18 1 19 16 35 1 13 11 24 1 72 72 144 6 24
La Digue 21 19 40 2 19 15 34 2 18 20 38 2 19 17 36 2 22 20 42 2 24 26 50 2 123 117 240 12 20
La Misere 11 5 16 1 11 13 24 1 7 10 17 1 9 5 14 1 7 9 16 1 13 12 25 1 58 54 112 6 19
La Retraite 16 11 27 1 16 17 33 2 17 8 25 1 8 9 17 1 13 17 30 2 12 11 23 1 82 73 155 8 19
La Rosiere 63 60 123 5 70 64 134 5 53 62 115 4 61 56 117 4 58 51 109 4 62 65 127 5 367 358 725 27 27
Mont Fleuri 47 52 99 4 34 46 80 3 46 42 88 3 53 40 93 3 38 54 92 4 28 44 72 3 246 278 524 20 26
Perseverance 39 43 82 3 32 35 67 3 39 29 68 3 33 41 74 3 24 29 53 2 31 20 51 2 198 197 395 16 25
Port Glaud 20 13 33 2 14 10 24 2 19 11 30 2 20 14 34 2 23 19 42 2 21 16 37 2 117 83 200 12 17
Pointe Larue 32 29 61 3 26 12 38 2 23 29 52 2 22 20 42 2 26 27 53 2 32 22 54 2 161 139 300 13 23
Plaisance 63 46 109 5 65 53 118 5 66 75 141 5 77 67 144 5 82 64 146 5 53 70 123 4 406 375 781 29 27
Takamaka 15 17 32 2 12 12 24 2 17 16 33 2 19 12 31 2 15 14 29 2 17 19 36 2 95 90 185 12 15
State Total 708 680 1388 60 643 679 1322 59 678 669 1347 55 660 604 1264 54 688 683 1371 57 650 635 1285 54 4027 3950 7977 339 24
Independent School 36 40 76 3 32 43 75 3 32 44 76 3 47 29 76 3 40 35 75 3 31 42 73 3 218 233 451 18 25
International School 30 21 51 2 28 23 51 2 24 30 54 2 28 24 52 2 33 21 54 2 26 22 48 2 169 141 310 12 26
Ecole Francaise 7 14 21 1 7 10 17 1 10 9 19 1 8 19 27 1 10 11 21 1 11 14 25 1 53 77 130 6 22
Vijay International 5 10 15 1 7 13 20 1 9 8 17 1 11 13 24 1 17 3 20 1 5 5 10 1 54 52 106 6 18
Private Total 78 85 163 7 74 89 163 7 75 91 166 7 94 85 179 7 100 70 170 7 73 83 156 7 494 503 997 42 24
Grand Total 786 765 1551 67 717 768 1485 66 753 760 1513 62 754 689 1443 61 788 753 1541 64 723 718 1441 61 4521 4453 8974 381 24
Pupils/ Class
RatioSchool
P1 P2 Primary TotalP3 P4 P5 P6
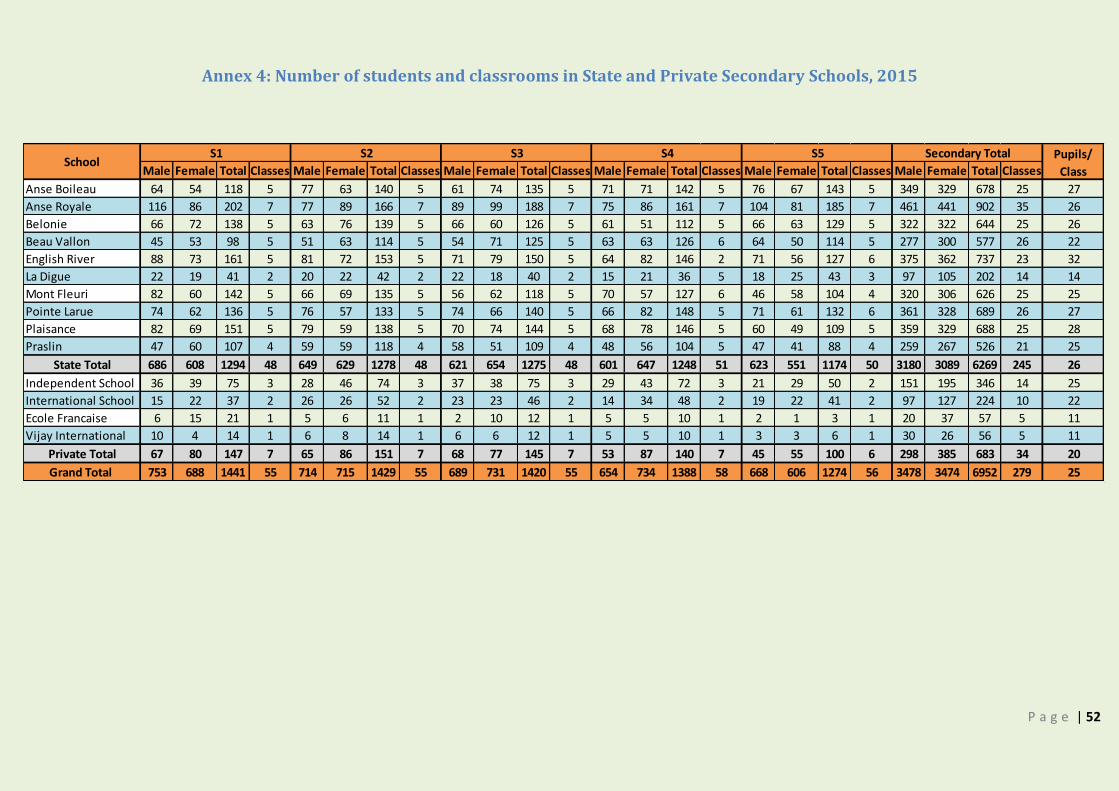
P a g e | 52
Annex 4: Number of students and classrooms in State and Private Secondary Schools, 2015
Male Female Total Classes Male Female Total Classes Male Female Total Classes Male Female Total Classes Male Female Total Classes Male Female Total Classes
Anse Boileau 64 54 118 5 77 63 140 5 61 74 135 5 71 71 142 5 76 67 143 5 349 329 678 25 27
Anse Royale 116 86 202 7 77 89 166 7 89 99 188 7 75 86 161 7 104 81 185 7 461 441 902 35 26
Belonie 66 72 138 5 63 76 139 5 66 60 126 5 61 51 112 5 66 63 129 5 322 322 644 25 26
Beau Vallon 45 53 98 5 51 63 114 5 54 71 125 5 63 63 126 6 64 50 114 5 277 300 577 26 22
English River 88 73 161 5 81 72 153 5 71 79 150 5 64 82 146 2 71 56 127 6 375 362 737 23 32
La Digue 22 19 41 2 20 22 42 2 22 18 40 2 15 21 36 5 18 25 43 3 97 105 202 14 14
Mont Fleuri 82 60 142 5 66 69 135 5 56 62 118 5 70 57 127 6 46 58 104 4 320 306 626 25 25
Pointe Larue 74 62 136 5 76 57 133 5 74 66 140 5 66 82 148 5 71 61 132 6 361 328 689 26 27
Plaisance 82 69 151 5 79 59 138 5 70 74 144 5 68 78 146 5 60 49 109 5 359 329 688 25 28
Praslin 47 60 107 4 59 59 118 4 58 51 109 4 48 56 104 5 47 41 88 4 259 267 526 21 25
State Total 686 608 1294 48 649 629 1278 48 621 654 1275 48 601 647 1248 51 623 551 1174 50 3180 3089 6269 245 26
Independent School 36 39 75 3 28 46 74 3 37 38 75 3 29 43 72 3 21 29 50 2 151 195 346 14 25
International School 15 22 37 2 26 26 52 2 23 23 46 2 14 34 48 2 19 22 41 2 97 127 224 10 22
Ecole Francaise 6 15 21 1 5 6 11 1 2 10 12 1 5 5 10 1 2 1 3 1 20 37 57 5 11
Vijay International 10 4 14 1 6 8 14 1 6 6 12 1 5 5 10 1 3 3 6 1 30 26 56 5 11
Private Total 67 80 147 7 65 86 151 7 68 77 145 7 53 87 140 7 45 55 100 6 298 385 683 34 20
Grand Total 753 688 1441 55 714 715 1429 55 689 731 1420 55 654 734 1388 58 668 606 1274 56 3478 3474 6952 279 25
Secondary Total Pupils/
Class School
S1 S2 S3 S4 S5
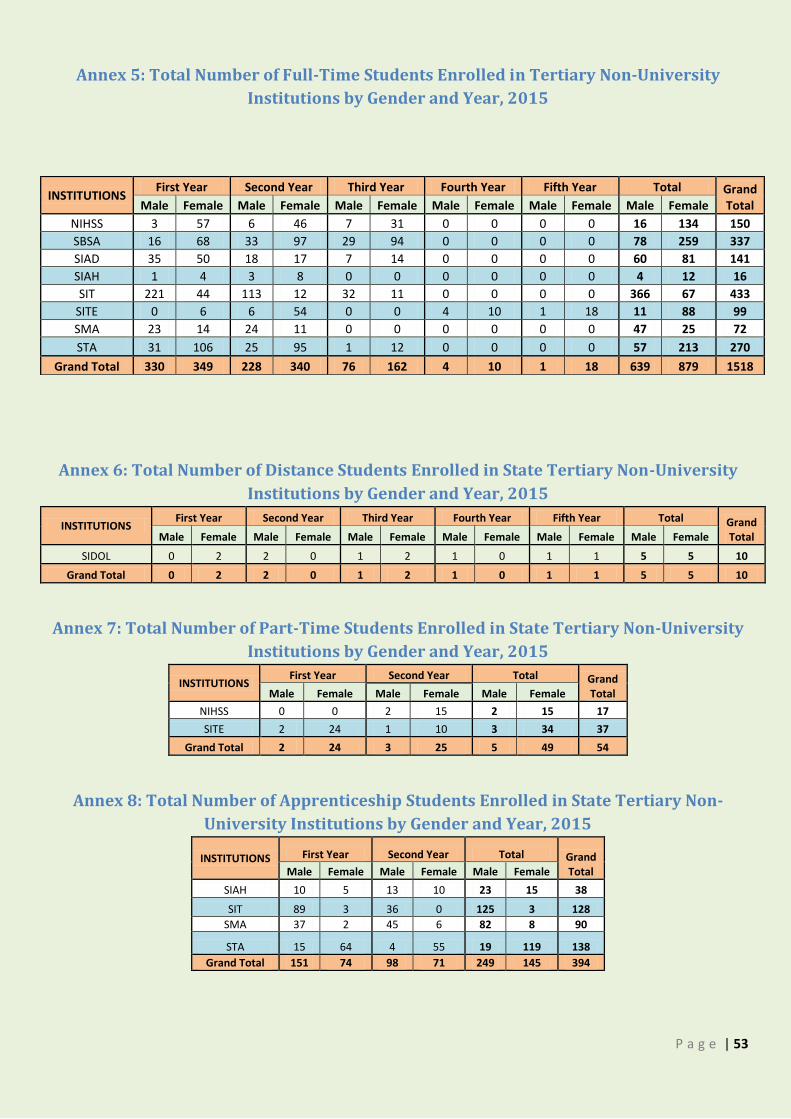
P a g e | 53
Annex 5: Total Number of Full-Time Students Enrolled in Tertiary Non-University
Institutions by Gender and Year, 2015
Annex 6: Total Number of Distance Students Enrolled in State Tertiary Non-University
Institutions by Gender and Year, 2015
INSTITUTIONS First Year Second Year Third Year Fourth Year Fifth Year Total Grand
Total Male Female Male Female Male Female Male Female Male Female Male Female
SIDOL 0 2 2 0 1 2 1 0 1 1 5 5 10
Grand Total 0 2 2 0 1 2 1 0 1 1 5 5 10
Annex 7: Total Number of Part-Time Students Enrolled in State Tertiary Non-University
Institutions by Gender and Year, 2015
INSTITUTIONS First Year Second Year Total Grand
Total Male Female Male Female Male Female
NIHSS 0 0 2 15 2 15 17
SITE 2 24 1 10 3 34 37
Grand Total 2 24 3 25 5 49 54
Annex 8: Total Number of Apprenticeship Students Enrolled in State Tertiary Non-
University Institutions by Gender and Year, 2015
INSTITUTIONS First Year Second Year Total Grand Total Male Female Male Female Male Female
SIAH 10 5 13 10 23 15 38
SIT 89 3 36 0 125 3 128
SMA 37 2 45 6 82 8 90
STA 15 64 4 55 19 119 138
Grand Total 151 74 98 71 249 145 394
INSTITUTIONS First Year Second Year Third Year Fourth Year Fifth Year Total Grand
Total Male Female Male Female Male Female Male Female Male Female Male Female
NIHSS 3 57 6 46 7 31 0 0 0 0 16 134 150
SBSA 16 68 33 97 29 94 0 0 0 0 78 259 337
SIAD 35 50 18 17 7 14 0 0 0 0 60 81 141
SIAH 1 4 3 8 0 0 0 0 0 0 4 12 16
SIT 221 44 113 12 32 11 0 0 0 0 366 67 433
SITE 0 6 6 54 0 0 4 10 1 18 11 88 99
SMA 23 14 24 11 0 0 0 0 0 0 47 25 72
STA 31 106 25 95 1 12 0 0 0 0 57 213 270
Grand Total 330 349 228 340 76 162 4 10 1 18 639 879 1518
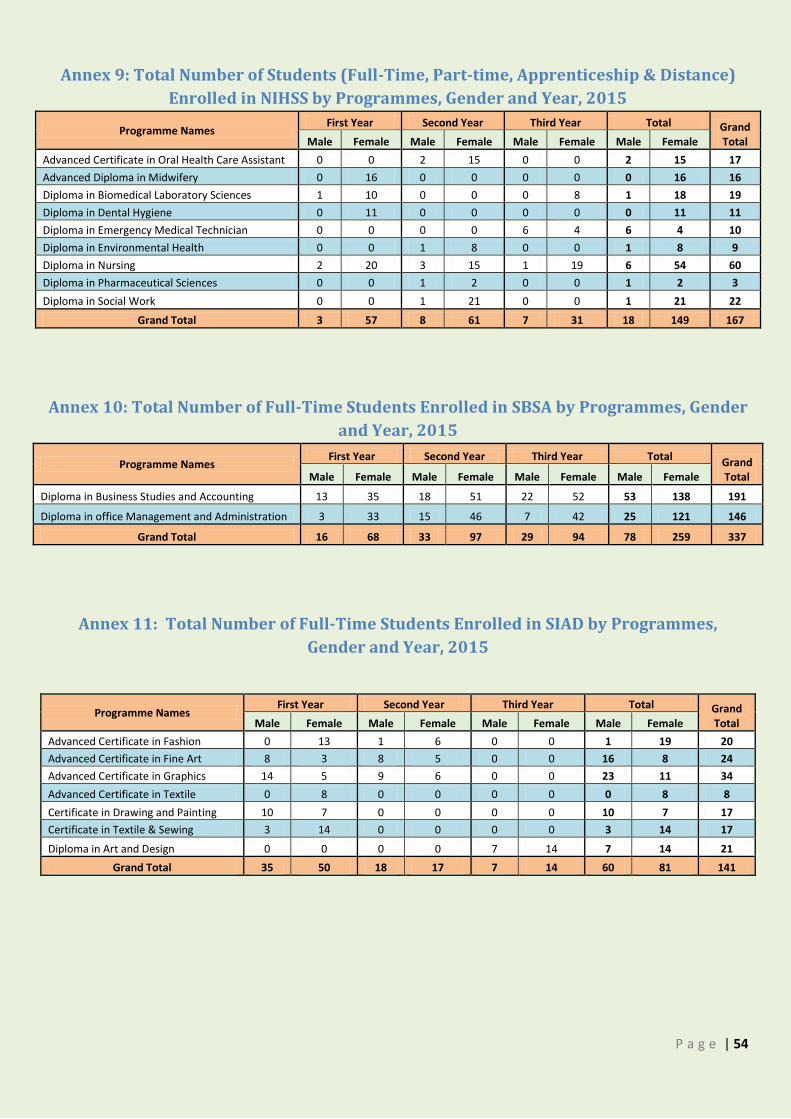
P a g e | 54
Annex 9: Total Number of Students (Full-Time, Part-time, Apprenticeship & Distance)
Enrolled in NIHSS by Programmes, Gender and Year, 2015
Programme Names First Year Second Year Third Year Total Grand
Total Male Female Male Female Male Female Male Female
Advanced Certificate in Oral Health Care Assistant 0 0 2 15 0 0 2 15 17
Advanced Diploma in Midwifery 0 16 0 0 0 0 0 16 16
Diploma in Biomedical Laboratory Sciences 1 10 0 0 0 8 1 18 19
Diploma in Dental Hygiene 0 11 0 0 0 0 0 11 11
Diploma in Emergency Medical Technician 0 0 0 0 6 4 6 4 10
Diploma in Environmental Health 0 0 1 8 0 0 1 8 9
Diploma in Nursing 2 20 3 15 1 19 6 54 60
Diploma in Pharmaceutical Sciences 0 0 1 2 0 0 1 2 3
Diploma in Social Work 0 0 1 21 0 0 1 21 22
Grand Total 3 57 8 61 7 31 18 149 167
Annex 10: Total Number of Full-Time Students Enrolled in SBSA by Programmes, Gender
and Year, 2015
Programme Names First Year Second Year Third Year Total
Grand Total Male Female Male Female Male Female Male Female
Diploma in Business Studies and Accounting 13 35 18 51 22 52 53 138 191
Diploma in office Management and Administration 3 33 15 46 7 42 25 121 146
Grand Total 16 68 33 97 29 94 78 259 337
Annex 11: Total Number of Full-Time Students Enrolled in SIAD by Programmes,
Gender and Year, 2015
Programme Names First Year Second Year Third Year Total Grand
Total Male Female Male Female Male Female Male Female
Advanced Certificate in Fashion 0 13 1 6 0 0 1 19 20
Advanced Certificate in Fine Art 8 3 8 5 0 0 16 8 24
Advanced Certificate in Graphics 14 5 9 6 0 0 23 11 34
Advanced Certificate in Textile 0 8 0 0 0 0 0 8 8
Certificate in Drawing and Painting 10 7 0 0 0 0 10 7 17
Certificate in Textile & Sewing 3 14 0 0 0 0 3 14 17
Diploma in Art and Design 0 0 0 0 7 14 7 14 21
Grand Total 35 50 18 17 7 14 60 81 141

P a g e | 55
Annex 12: Total Number of Full-Time and Apprenticeship Students Enrolled in SIT by
Programmes, Gender and Year, 2015
Annex 13: Total Number of Full-Time and Apprenticeship Students Enrolled in SIAH by
Programmes, Gender and Year, 2015
Programme Names First Year Second Year Total Grand
Total Male Female Male Female Male Female
Advanced Certificate in General Agriculture 0 2 2 3 2 5 7
Advanced Certificate in Ornamental Horticulture & Landscaping 1 2 1 5 2 7 9
Certificate in General Agriculture 7 1 5 5 12 6 18
Certificate in Ornamental Horticulture & Landscaping 3 4 8 5 11 9 20
Grand Total 11 9 16 18 27 27 54
Annex 14: Total Number of Full-Time and Apprenticeship Students Enrolled in SMA by
Programmes, Gender and Year, 2015
Programme Names First Year Second Year Total Grand
Total Male Female Male Female Male Female
Advanced Certificate Fisheries Science & Fishing Technology 7 13 2 7 9 20 29
Advanced Certificate Marine Mechanics 3 0 6 1 9 1 10
Advanced Certificate Navigation & Seamanship 13 1 15 3 28 4 32
Certificate Fishing Technology 37 2 46 6 83 8 91
Grand Total 60 16 69 17 129 33 162
Programme Names First Year Second Year Third Year Total Grand
Total Male Female Male Female Male Female Male Female
Advanced Certificate in Carpentry 25 1 19 1 0 0 44 2 46
Advanced Certificate in Electrical and Electronics 15 3 18 1 0 0 33 4 37
Advanced Certificate in Masonry 14 0 7 0 0 0 21 0 21
Advanced Certificate in Mechanical Engineering 16 4 14 0 0 0 30 4 34
Advanced Certificate in Motor Vehicle Mechanics 24 0 16 0 0 0 40 0 40
Apprenticeship in Carpentry 60 3 18 0 0 0 78 3 81
Apprenticeship in Masonry 28 0 18 0 0 0 46 0 46
Certificate in Electrical Installation 31 5 0 0 0 0 31 5 36
Certificate in Painting 15 22 0 0 0 0 15 22 37
Certificate in Plumbing 24 1 1 0 0 0 25 1 26
Certificate in Refrigeration & Air Conditioning 26 0 0 0 0 0 26 0 26
Diploma in Construction 10 3 9 6 10 6 29 15 44
Diploma in Mechanical & Electrical Engineering 7 1 13 0 7 0 27 1 28
Diploma in Motor Vehicle Engineering 7 1 7 0 10 0 24 1 25
Diploma in Telecommunication Systems 8 3 9 4 5 5 22 12 34
Grand Total 310 47 149 12 32 11 491 70 561
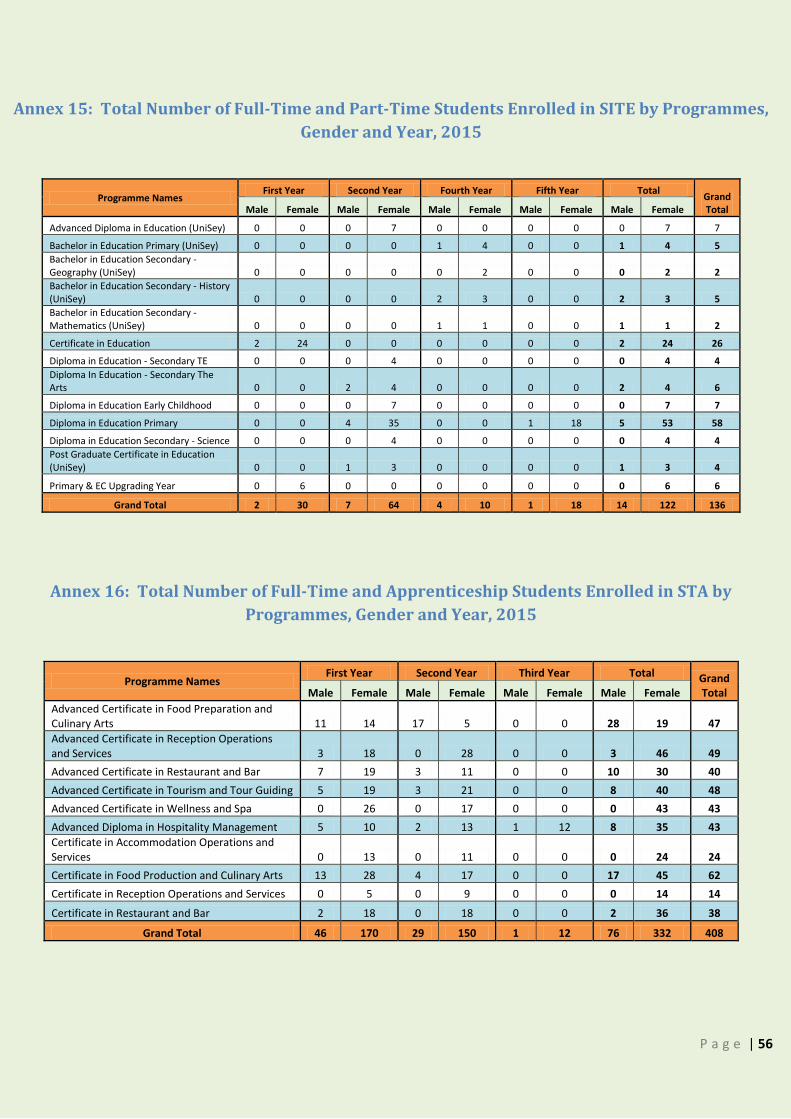
P a g e | 56
Annex 15: Total Number of Full-Time and Part-Time Students Enrolled in SITE by Programmes,
Gender and Year, 2015
Programme Names First Year Second Year Fourth Year Fifth Year Total
Grand Total Male Female Male Female Male Female Male Female Male Female
Advanced Diploma in Education (UniSey) 0 0 0 7 0 0 0 0 0 7 7
Bachelor in Education Primary (UniSey) 0 0 0 0 1 4 0 0 1 4 5
Bachelor in Education Secondary - Geography (UniSey) 0 0 0 0 0 2 0 0 0 2 2
Bachelor in Education Secondary - History (UniSey) 0 0 0 0 2 3 0 0 2 3 5
Bachelor in Education Secondary - Mathematics (UniSey) 0 0 0 0 1 1 0 0 1 1 2
Certificate in Education 2 24 0 0 0 0 0 0 2 24 26
Diploma in Education - Secondary TE 0 0 0 4 0 0 0 0 0 4 4
Diploma In Education - Secondary The Arts 0 0 2 4 0 0 0 0 2 4 6
Diploma in Education Early Childhood 0 0 0 7 0 0 0 0 0 7 7
Diploma in Education Primary 0 0 4 35 0 0 1 18 5 53 58
Diploma in Education Secondary - Science 0 0 0 4 0 0 0 0 0 4 4
Post Graduate Certificate in Education (UniSey) 0 0 1 3 0 0 0 0 1 3 4
Primary & EC Upgrading Year 0 6 0 0 0 0 0 0 0 6 6
Grand Total 2 30 7 64 4 10 1 18 14 122 136
Annex 16: Total Number of Full-Time and Apprenticeship Students Enrolled in STA by
Programmes, Gender and Year, 2015
Programme Names First Year Second Year Third Year Total Grand
Total Male Female Male Female Male Female Male Female
Advanced Certificate in Food Preparation and Culinary Arts 11 14 17 5 0 0 28 19 47
Advanced Certificate in Reception Operations and Services 3 18 0 28 0 0 3 46 49
Advanced Certificate in Restaurant and Bar 7 19 3 11 0 0 10 30 40
Advanced Certificate in Tourism and Tour Guiding 5 19 3 21 0 0 8 40 48
Advanced Certificate in Wellness and Spa 0 26 0 17 0 0 0 43 43
Advanced Diploma in Hospitality Management 5 10 2 13 1 12 8 35 43
Certificate in Accommodation Operations and Services 0 13 0 11 0 0 0 24 24
Certificate in Food Production and Culinary Arts 13 28 4 17 0 0 17 45 62
Certificate in Reception Operations and Services 0 5 0 9 0 0 0 14 14
Certificate in Restaurant and Bar 2 18 0 18 0 0 2 36 38
Grand Total 46 170 29 150 1 12 76 332 408
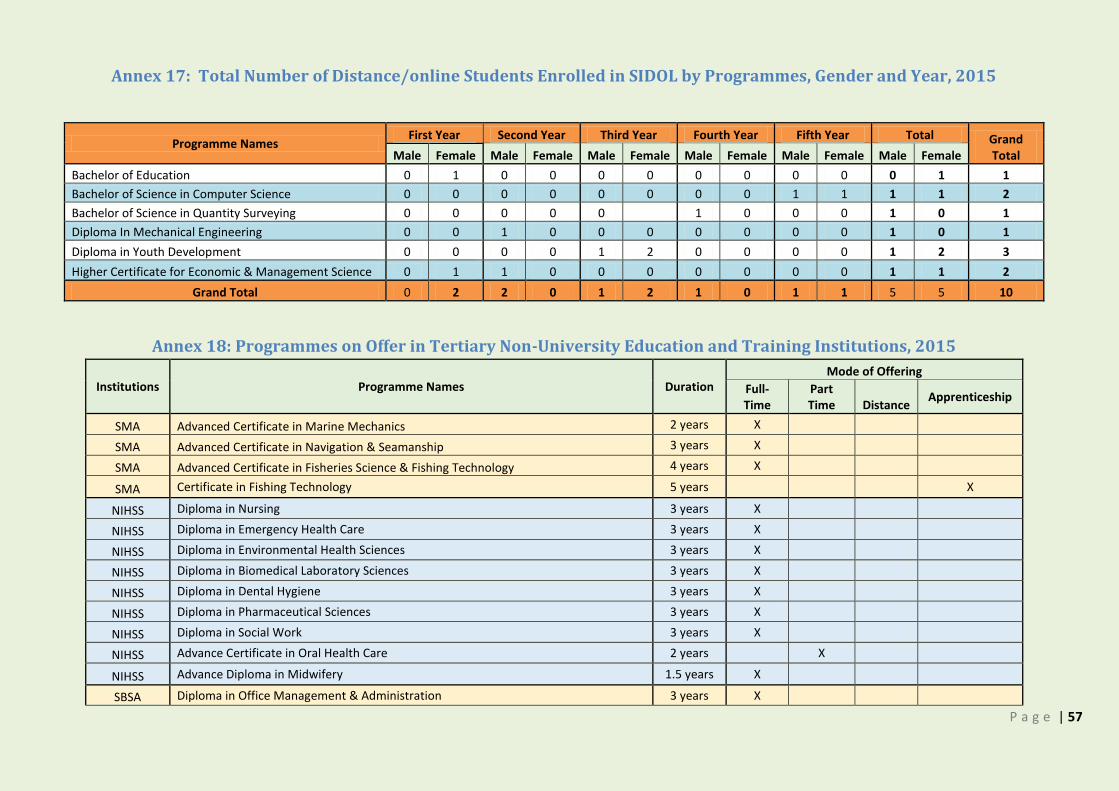
P a g e | 57
Annex 17: Total Number of Distance/online Students Enrolled in SIDOL by Programmes, Gender and Year, 2015
Programme Names First Year Second Year Third Year Fourth Year Fifth Year Total Grand
Total Male Female Male Female Male Female Male Female Male Female Male Female
Bachelor of Education 0 1 0 0 0 0 0 0 0 0 0 1 1
Bachelor of Science in Computer Science 0 0 0 0 0 0 0 0 1 1 1 1 2
Bachelor of Science in Quantity Surveying 0 0 0 0 0 1 0 0 0 1 0 1
Diploma In Mechanical Engineering 0 0 1 0 0 0 0 0 0 0 1 0 1
Diploma in Youth Development 0 0 0 0 1 2 0 0 0 0 1 2 3
Higher Certificate for Economic & Management Science 0 1 1 0 0 0 0 0 0 0 1 1 2
Grand Total 0 2 2 0 1 2 1 0 1 1 5 5 10
Annex 18: Programmes on Offer in Tertiary Non-University Education and Training Institutions, 2015
Institutions Programme Names Duration Mode of Offering
Full-Time
Part Time
Distance
Apprenticeship
SMA Advanced Certificate in Marine Mechanics 2 years X
SMA Advanced Certificate in Navigation & Seamanship 3 years X
SMA Advanced Certificate in Fisheries Science & Fishing Technology 4 years X
SMA Certificate in Fishing Technology 5 years X
NIHSS Diploma in Nursing 3 years X
NIHSS Diploma in Emergency Health Care 3 years X
NIHSS Diploma in Environmental Health Sciences 3 years X
NIHSS Diploma in Biomedical Laboratory Sciences 3 years X
NIHSS Diploma in Dental Hygiene 3 years X
NIHSS Diploma in Pharmaceutical Sciences 3 years X
NIHSS Diploma in Social Work 3 years X
NIHSS Advance Certificate in Oral Health Care 2 years X
NIHSS Advance Diploma in Midwifery 1.5 years X
SBSA Diploma in Office Management & Administration 3 years X
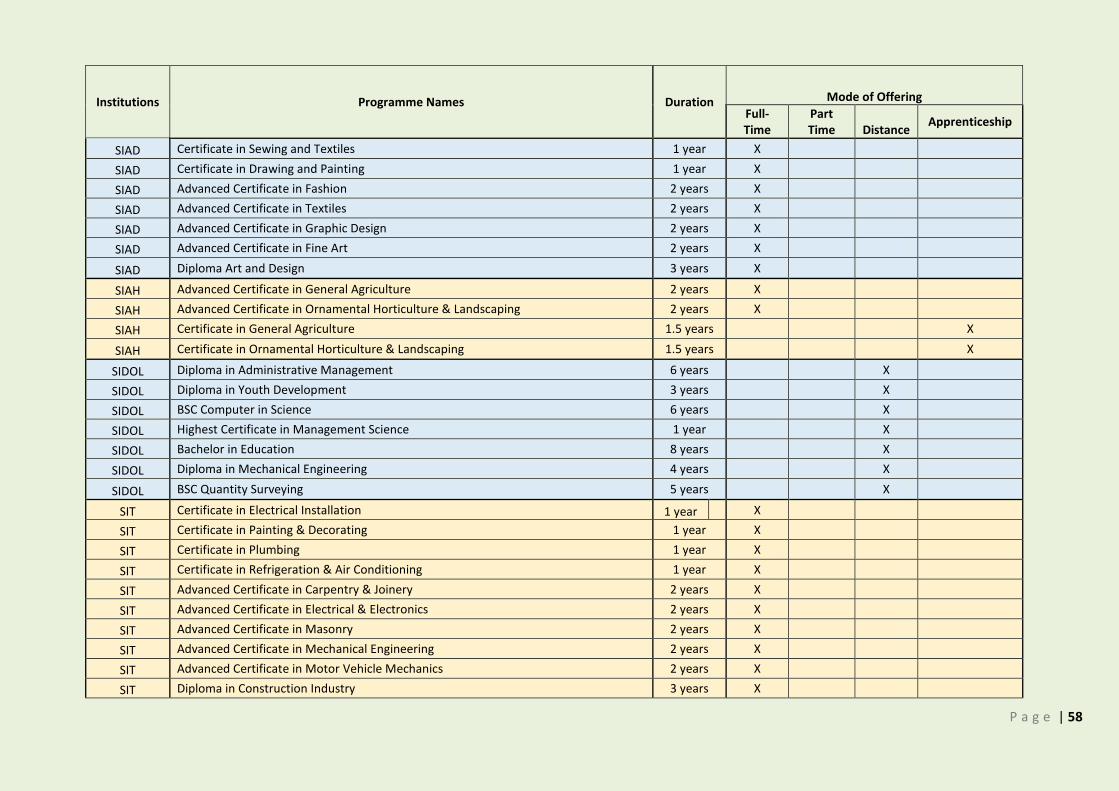
P a g e | 58
Institutions Programme Names Duration Mode of Offering
Full-Time
Part Time
Distance
Apprenticeship
SIAD Certificate in Sewing and Textiles 1 year X
SIAD Certificate in Drawing and Painting 1 year X
SIAD Advanced Certificate in Fashion 2 years X
SIAD Advanced Certificate in Textiles 2 years X
SIAD Advanced Certificate in Graphic Design 2 years X
SIAD Advanced Certificate in Fine Art 2 years X
SIAD Diploma Art and Design 3 years X
SIAH Advanced Certificate in General Agriculture 2 years X
SIAH Advanced Certificate in Ornamental Horticulture & Landscaping 2 years X
SIAH Certificate in General Agriculture 1.5 years X
SIAH Certificate in Ornamental Horticulture & Landscaping 1.5 years X
SIDOL Diploma in Administrative Management 6 years X
SIDOL Diploma in Youth Development 3 years X
SIDOL BSC Computer in Science 6 years X
SIDOL Highest Certificate in Management Science 1 year X
SIDOL Bachelor in Education 8 years X
SIDOL Diploma in Mechanical Engineering 4 years X
SIDOL BSC Quantity Surveying 5 years X
SIT Certificate in Electrical Installation 1 year X
SIT Certificate in Painting & Decorating 1 year X
SIT Certificate in Plumbing 1 year X
SIT Certificate in Refrigeration & Air Conditioning 1 year X
SIT Advanced Certificate in Carpentry & Joinery 2 years X
SIT Advanced Certificate in Electrical & Electronics 2 years X
SIT Advanced Certificate in Masonry 2 years X
SIT Advanced Certificate in Mechanical Engineering 2 years X
SIT Advanced Certificate in Motor Vehicle Mechanics 2 years X
SIT Diploma in Construction Industry 3 years X
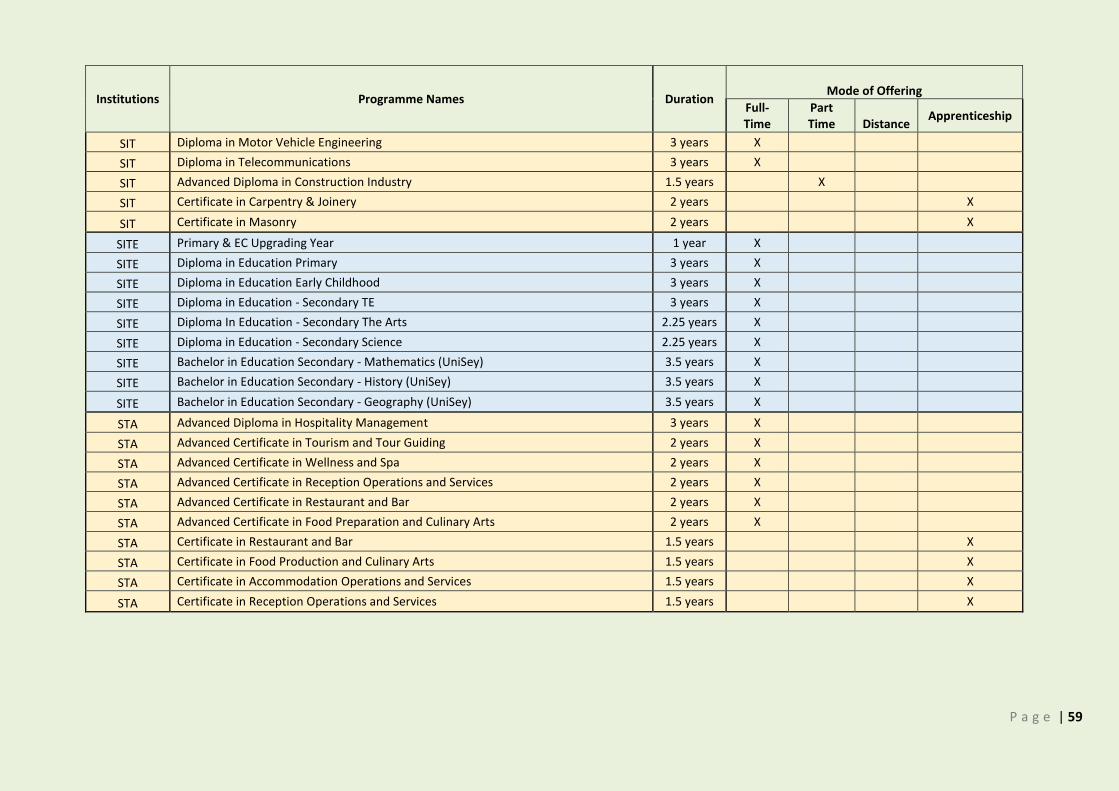
P a g e | 59
Institutions Programme Names Duration Mode of Offering
Full-Time
Part Time
Distance
Apprenticeship
SIT Diploma in Motor Vehicle Engineering 3 years X
SIT Diploma in Telecommunications 3 years X
SIT Advanced Diploma in Construction Industry 1.5 years X
SIT Certificate in Carpentry & Joinery 2 years X
SIT Certificate in Masonry 2 years X
SITE Primary & EC Upgrading Year 1 year X
SITE Diploma in Education Primary 3 years X
SITE Diploma in Education Early Childhood 3 years X
SITE Diploma in Education - Secondary TE 3 years X
SITE Diploma In Education - Secondary The Arts 2.25 years X
SITE Diploma in Education - Secondary Science 2.25 years X
SITE Bachelor in Education Secondary - Mathematics (UniSey) 3.5 years X
SITE Bachelor in Education Secondary - History (UniSey) 3.5 years X
SITE Bachelor in Education Secondary - Geography (UniSey) 3.5 years X
STA Advanced Diploma in Hospitality Management 3 years X
STA Advanced Certificate in Tourism and Tour Guiding 2 years X
STA Advanced Certificate in Wellness and Spa 2 years X
STA Advanced Certificate in Reception Operations and Services 2 years X
STA Advanced Certificate in Restaurant and Bar 2 years X
STA Advanced Certificate in Food Preparation and Culinary Arts 2 years X
STA Certificate in Restaurant and Bar 1.5 years X
STA Certificate in Food Production and Culinary Arts 1.5 years X
STA Certificate in Accommodation Operations and Services 1.5 years X
STA Certificate in Reception Operations and Services 1.5 years X
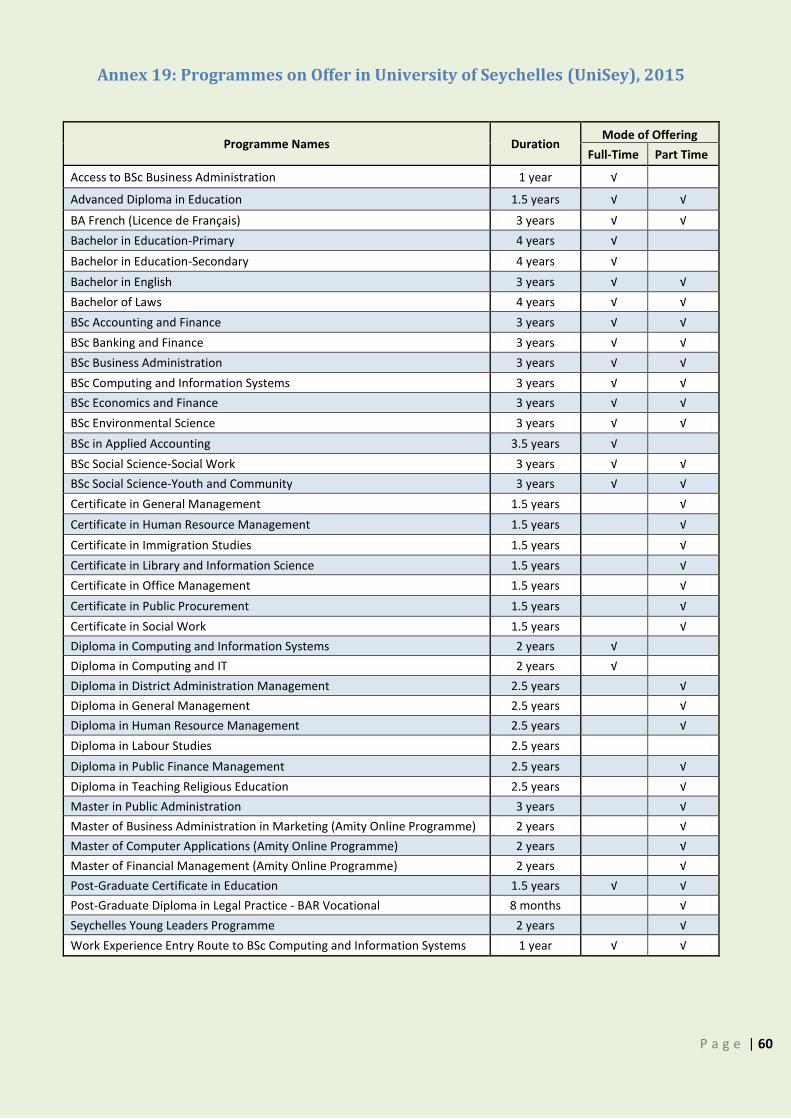
P a g e | 60
Annex 19: Programmes on Offer in University of Seychelles (UniSey), 2015
Programme Names Duration Mode of Offering
Full-Time Part Time
Access to BSc Business Administration 1 year √
Advanced Diploma in Education 1.5 years √ √
BA French (Licence de Français) 3 years √ √
Bachelor in Education-Primary 4 years √
Bachelor in Education-Secondary 4 years √
Bachelor in English 3 years √ √
Bachelor of Laws 4 years √ √
BSc Accounting and Finance 3 years √ √
BSc Banking and Finance 3 years √ √
BSc Business Administration 3 years √ √
BSc Computing and Information Systems 3 years √ √
BSc Economics and Finance 3 years √ √
BSc Environmental Science 3 years √ √
BSc in Applied Accounting 3.5 years √
BSc Social Science-Social Work 3 years √ √
BSc Social Science-Youth and Community 3 years √ √
Certificate in General Management 1.5 years √
Certificate in Human Resource Management 1.5 years √
Certificate in Immigration Studies 1.5 years √
Certificate in Library and Information Science 1.5 years √
Certificate in Office Management 1.5 years √
Certificate in Public Procurement 1.5 years √
Certificate in Social Work 1.5 years √
Diploma in Computing and Information Systems 2 years √
Diploma in Computing and IT 2 years √
Diploma in District Administration Management 2.5 years √
Diploma in General Management 2.5 years √
Diploma in Human Resource Management 2.5 years √
Diploma in Labour Studies 2.5 years
Diploma in Public Finance Management 2.5 years √
Diploma in Teaching Religious Education 2.5 years √
Master in Public Administration 3 years √
Master of Business Administration in Marketing (Amity Online Programme) 2 years √
Master of Computer Applications (Amity Online Programme) 2 years √
Master of Financial Management (Amity Online Programme) 2 years √
Post-Graduate Certificate in Education 1.5 years √ √
Post-Graduate Diploma in Legal Practice - BAR Vocational 8 months √
Seychelles Young Leaders Programme 2 years √
Work Experience Entry Route to BSc Computing and Information Systems 1 year √ √
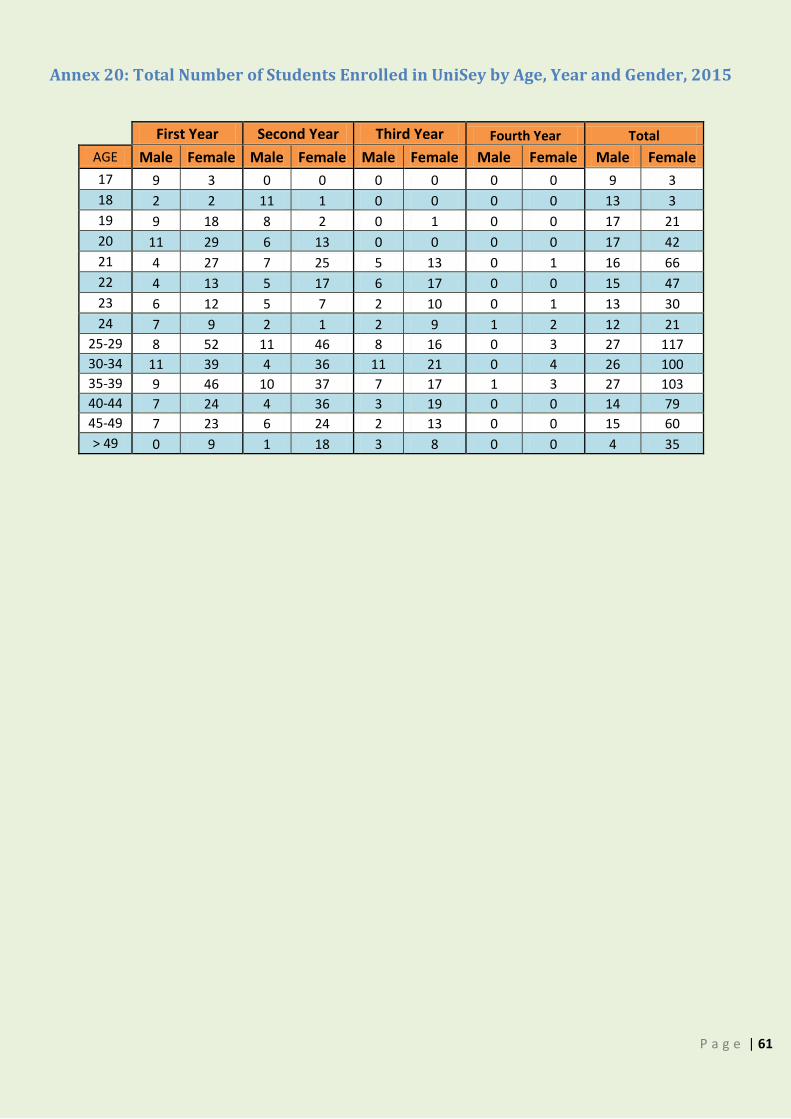
P a g e | 61
Annex 20: Total Number of Students Enrolled in UniSey by Age, Year and Gender, 2015
First Year Second Year Third Year Fourth Year Total
AGE Male Female Male Female Male Female Male Female Male Female
17 9 3 0 0 0 0 0 0 9 3
18 2 2 11 1 0 0 0 0 13 3
19 9 18 8 2 0 1 0 0 17 21
20 11 29 6 13 0 0 0 0 17 42
21 4 27 7 25 5 13 0 1 16 66
22 4 13 5 17 6 17 0 0 15 47
23 6 12 5 7 2 10 0 1 13 30
24 7 9 2 1 2 9 1 2 12 21
25-29 8 52 11 46 8 16 0 3 27 117
30-34 11 39 4 36 11 21 0 4 26 100
35-39 9 46 10 37 7 17 1 3 27 103
40-44 7 24 4 36 3 19 0 0 14 79
45-49 7 23 6 24 2 13 0 0 15 60
> 49 0 9 1 18 3 8 0 0 4 35
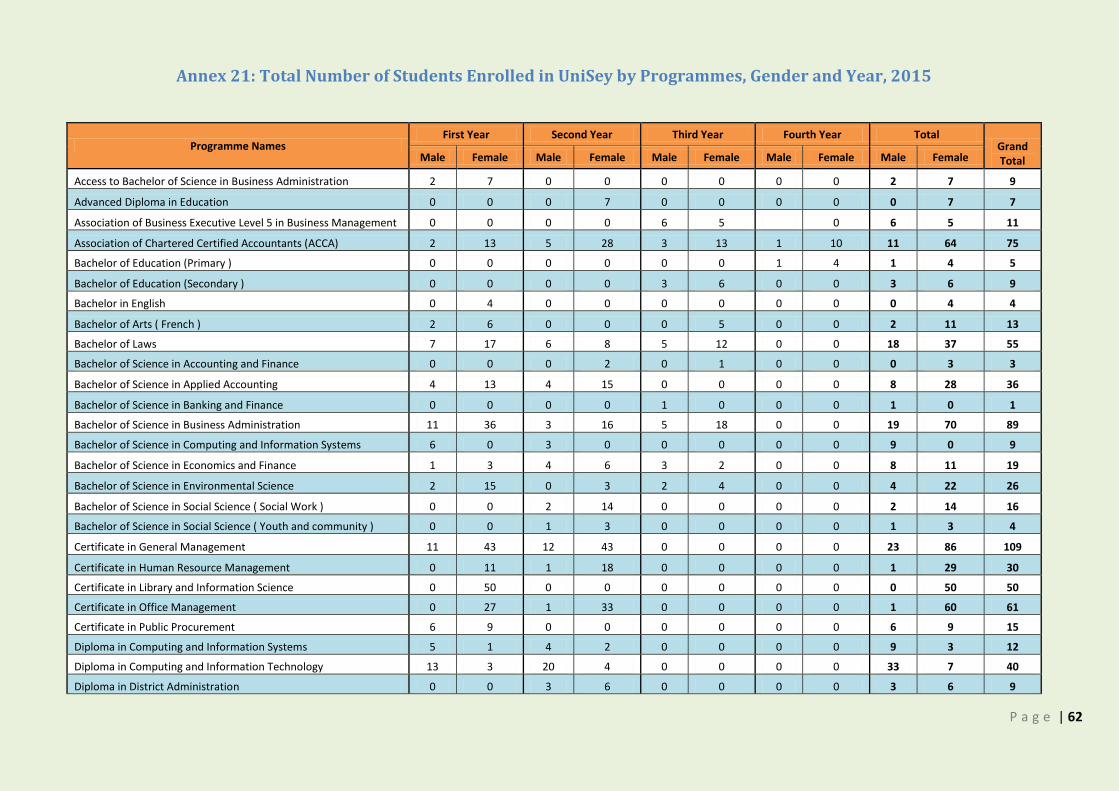
P a g e | 62
Annex 21: Total Number of Students Enrolled in UniSey by Programmes, Gender and Year, 2015
Programme Names First Year Second Year Third Year Fourth Year Total
Grand Total Male Female Male Female Male Female Male Female Male Female
Access to Bachelor of Science in Business Administration 2 7 0 0 0 0 0 0 2 7 9
Advanced Diploma in Education 0 0 0 7 0 0 0 0 0 7 7
Association of Business Executive Level 5 in Business Management 0 0 0 0 6 5 0 6 5 11
Association of Chartered Certified Accountants (ACCA) 2 13 5 28 3 13 1 10 11 64 75
Bachelor of Education (Primary ) 0 0 0 0 0 0 1 4 1 4 5
Bachelor of Education (Secondary ) 0 0 0 0 3 6 0 0 3 6 9
Bachelor in English 0 4 0 0 0 0 0 0 0 4 4
Bachelor of Arts ( French ) 2 6 0 0 0 5 0 0 2 11 13
Bachelor of Laws 7 17 6 8 5 12 0 0 18 37 55
Bachelor of Science in Accounting and Finance 0 0 0 2 0 1 0 0 0 3 3
Bachelor of Science in Applied Accounting 4 13 4 15 0 0 0 0 8 28 36
Bachelor of Science in Banking and Finance 0 0 0 0 1 0 0 0 1 0 1
Bachelor of Science in Business Administration 11 36 3 16 5 18 0 0 19 70 89
Bachelor of Science in Computing and Information Systems 6 0 3 0 0 0 0 0 9 0 9
Bachelor of Science in Economics and Finance 1 3 4 6 3 2 0 0 8 11 19
Bachelor of Science in Environmental Science 2 15 0 3 2 4 0 0 4 22 26
Bachelor of Science in Social Science ( Social Work ) 0 0 2 14 0 0 0 0 2 14 16
Bachelor of Science in Social Science ( Youth and community ) 0 0 1 3 0 0 0 0 1 3 4
Certificate in General Management 11 43 12 43 0 0 0 0 23 86 109
Certificate in Human Resource Management 0 11 1 18 0 0 0 0 1 29 30
Certificate in Library and Information Science 0 50 0 0 0 0 0 0 0 50 50
Certificate in Office Management 0 27 1 33 0 0 0 0 1 60 61
Certificate in Public Procurement 6 9 0 0 0 0 0 0 6 9 15
Diploma in Computing and Information Systems 5 1 4 2 0 0 0 0 9 3 12
Diploma in Computing and Information Technology 13 3 20 4 0 0 0 0 33 7 40
Diploma in District Administration 0 0 3 6 0 0 0 0 3 6 9
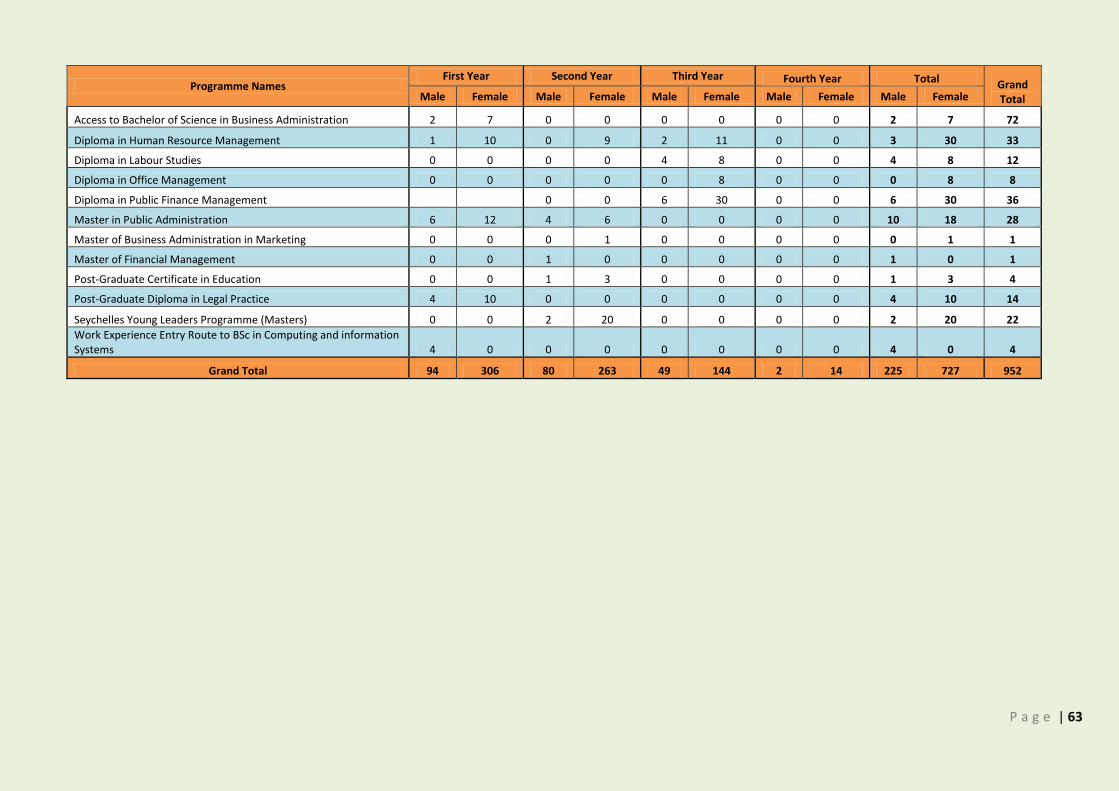
P a g e | 63
Programme Names First Year Second Year Third Year Fourth Year Total Grand
Total Male Female Male Female Male Female Male Female Male Female
Access to Bachelor of Science in Business Administration 2 7 0 0 0 0 0 0 2 7 72
Diploma in Human Resource Management 1 10 0 9 2 11 0 0 3 30 33
Diploma in Labour Studies 0 0 0 0 4 8 0 0 4 8 12
Diploma in Office Management 0 0 0 0 0 8 0 0 0 8 8
Diploma in Public Finance Management 0 0 6 30 0 0 6 30 36
Master in Public Administration 6 12 4 6 0 0 0 0 10 18 28
Master of Business Administration in Marketing 0 0 0 1 0 0 0 0 0 1 1
Master of Financial Management 0 0 1 0 0 0 0 0 1 0 1
Post-Graduate Certificate in Education 0 0 1 3 0 0 0 0 1 3 4
Post-Graduate Diploma in Legal Practice 4 10 0 0 0 0 0 0 4 10 14
Seychelles Young Leaders Programme (Masters) 0 0 2 20 0 0 0 0 2 20 22
Work Experience Entry Route to BSc in Computing and information Systems 4 0 0 0 0 0 0 0 4 0 4
Grand Total 94 306 80 263 49 144 2 14 225 727 952
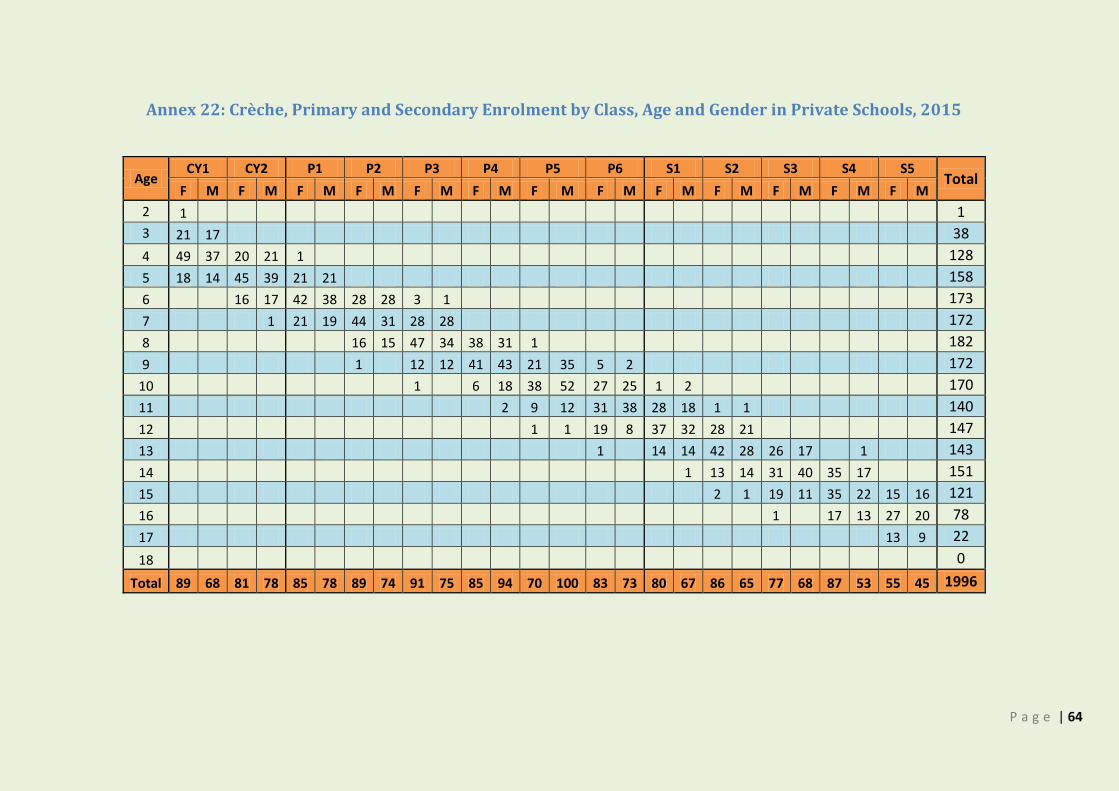
P a g e | 64
Annex 22: Crèche, Primary and Secondary Enrolment by Class, Age and Gender in Private Schools, 2015
Age CY1 CY2 P1 P2 P3 P4 P5 P6 S1 S2 S3 S4 S5
Total F M F M F M F M F M F M F M F M F M F M F M F M F M
2 1 1
3 21 17 38
4 49 37 20 21 1 128
5 18 14 45 39 21 21 158
6 16 17 42 38 28 28 3 1 173
7 1 21 19 44 31 28 28 172
8 16 15 47 34 38 31 1 182
9 1 12 12 41 43 21 35 5 2 172
10 1 6 18 38 52 27 25 1 2 170
11 2 9 12 31 38 28 18 1 1 140
12 1 1 19 8 37 32 28 21 147
13 1 14 14 42 28 26 17 1 143
14 1 13 14 31 40 35 17 151
15 2 1 19 11 35 22 15 16 121
16 1 17 13 27 20 78
17 13 9 22
18 0
Total 89 68 81 78 85 78 89 74 91 75 85 94 70 100 83 73 80 67 86 65 77 68 87 53 55 45 1996
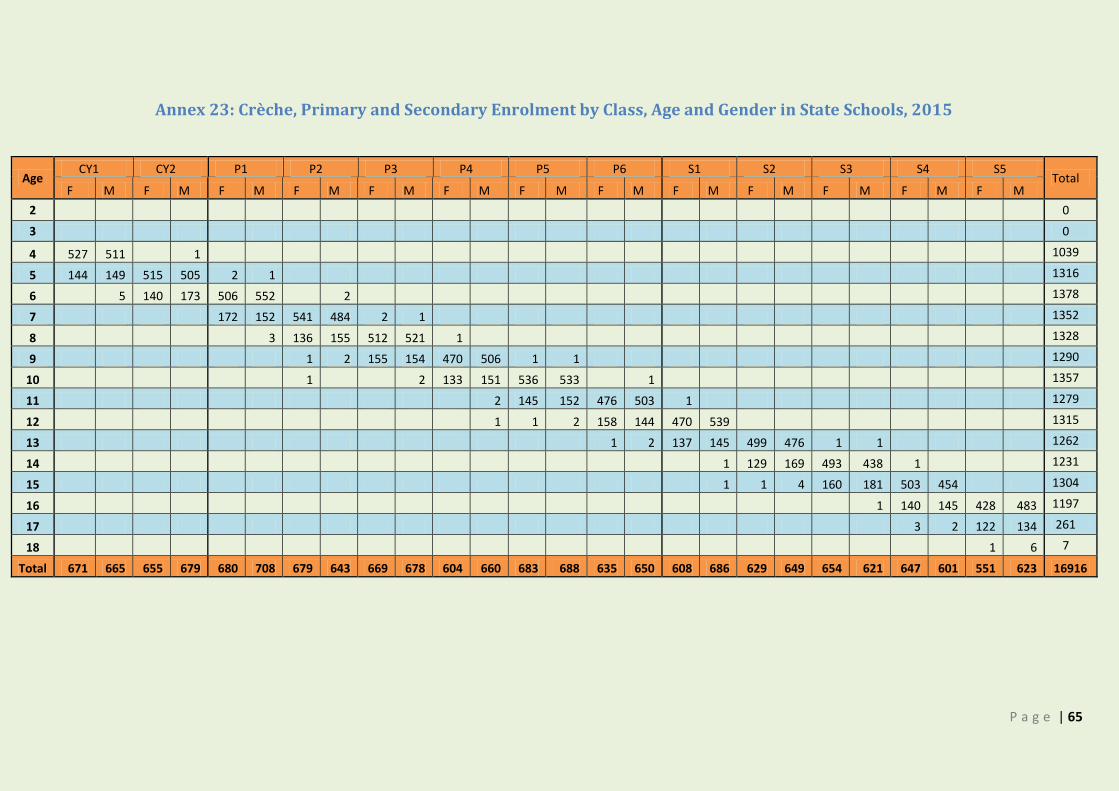
P a g e | 65
Annex 23: Crèche, Primary and Secondary Enrolment by Class, Age and Gender in State Schools, 2015
Age CY1 CY2 P1 P2 P3 P4 P5 P6 S1 S2 S3 S4 S5
Total F M F M F M F M F M F M F M F M F M F M F M F M F M
2 0
3 0
4 527 511 1 1039
5 144 149 515 505 2 1 1316
6 5 140 173 506 552 2 1378
7 172 152 541 484 2 1 1352
8 3 136 155 512 521 1 1328
9 1 2 155 154 470 506 1 1 1290
10 1 2 133 151 536 533 1 1357
11 2 145 152 476 503 1 1279
12 1 1 2 158 144 470 539 1315
13 1 2 137 145 499 476 1 1 1262
14 1 129 169 493 438 1 1231
15 1 1 4 160 181 503 454 1304
16 1 140 145 428 483 1197
17 3 2 122 134 261
18 1 6 7
Total 671 665 655 679 680 708 679 643 669 678 604 660 683 688 635 650 608 686 629 649 654 621 647 601 551 623 16916
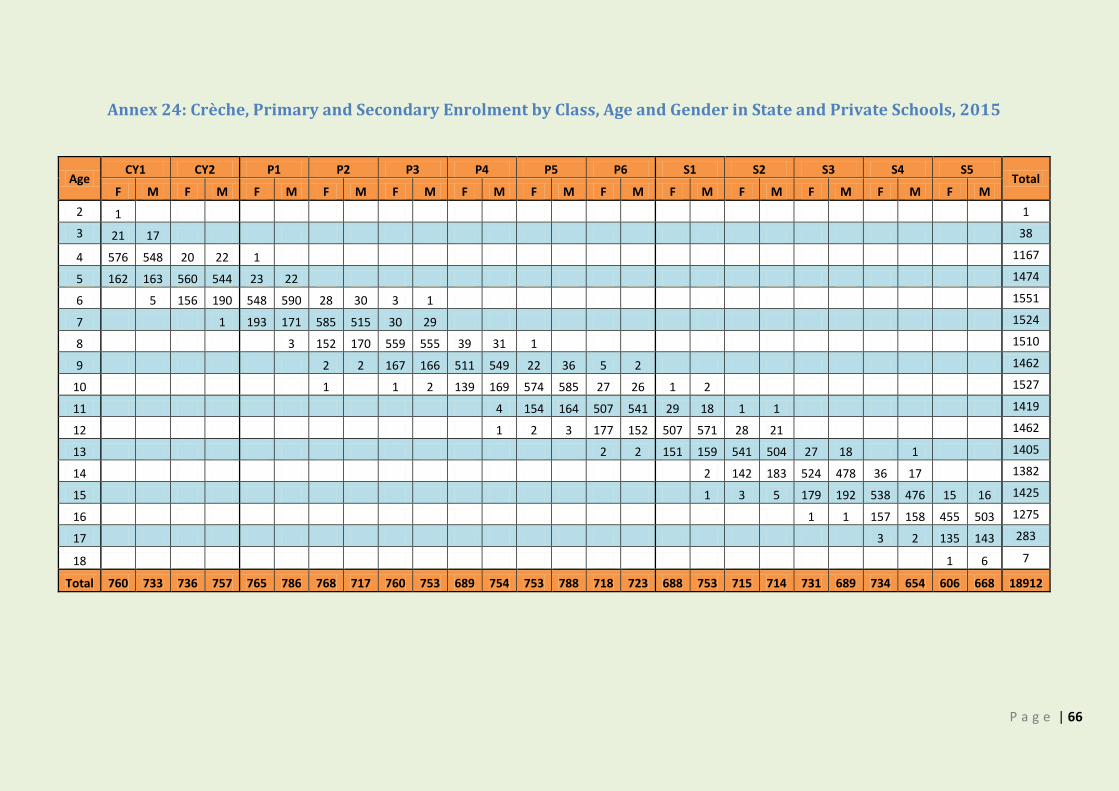
P a g e | 66
Annex 24: Crèche, Primary and Secondary Enrolment by Class, Age and Gender in State and Private Schools, 2015
Age CY1 CY2 P1 P2 P3 P4 P5 P6 S1 S2 S3 S4 S5
Total F M F M F M F M F M F M F M F M F M F M F M F M F M
2 1 1
3 21 17 38
4 576 548 20 22 1 1167
5 162 163 560 544 23 22 1474
6 5 156 190 548 590 28 30 3 1 1551
7 1 193 171 585 515 30 29 1524
8 3 152 170 559 555 39 31 1 1510
9 2 2 167 166 511 549 22 36 5 2 1462
10 1 1 2 139 169 574 585 27 26 1 2 1527
11 4 154 164 507 541 29 18 1 1 1419
12 1 2 3 177 152 507 571 28 21 1462
13 2 2 151 159 541 504 27 18 1 1405
14 2 142 183 524 478 36 17 1382
15 1 3 5 179 192 538 476 15 16 1425
16 1 1 157 158 455 503 1275
17 3 2 135 143 283
18 1 6 7
Total 760 733 736 757 765 786 768 717 760 753 689 754 753 788 718 723 688 753 715 714 731 689 734 654 606 668 18912
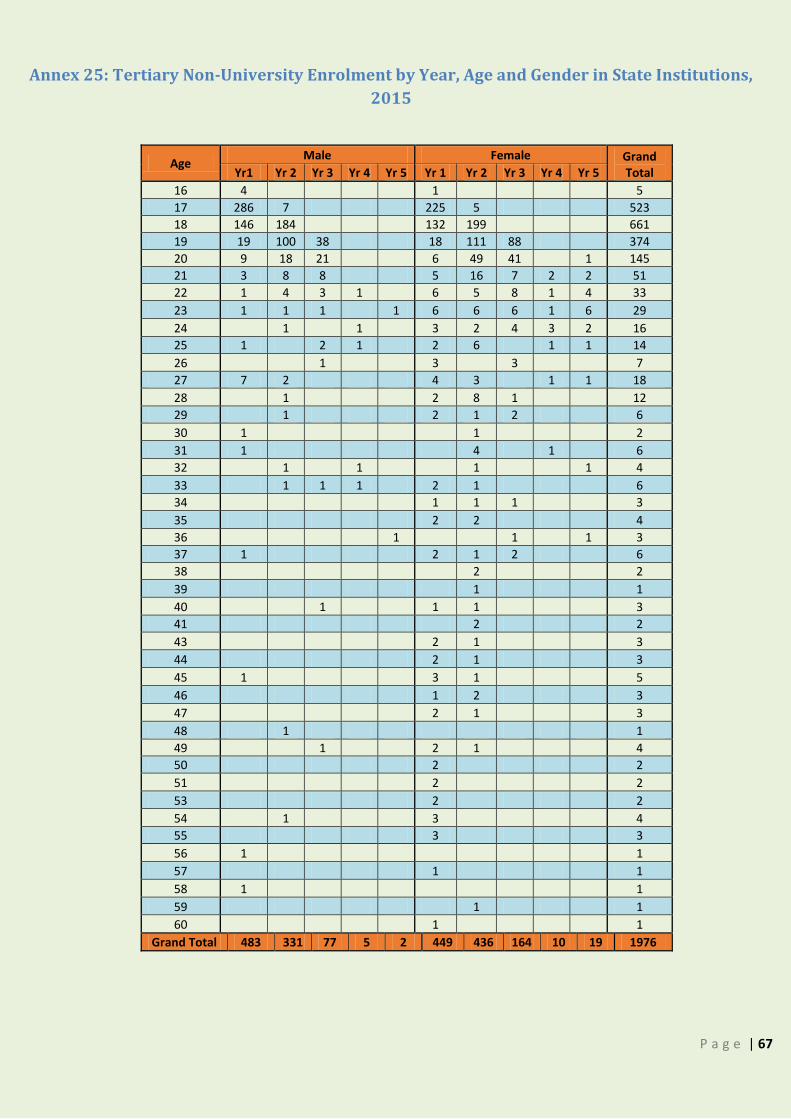
P a g e | 67
Annex 25: Tertiary Non-University Enrolment by Year, Age and Gender in State Institutions,
2015
Age Male Female Grand
Total Yr1 Yr 2 Yr 3 Yr 4 Yr 5 Yr 1 Yr 2 Yr 3 Yr 4 Yr 5
16 4 1 5
17 286 7 225 5 523
18 146 184 132 199 661
19 19 100 38 18 111 88 374
20 9 18 21 6 49 41 1 145
21 3 8 8 5 16 7 2 2 51
22 1 4 3 1 6 5 8 1 4 33
23 1 1 1 1 6 6 6 1 6 29
24 1 1 3 2 4 3 2 16
25 1 2 1 2 6 1 1 14
26 1 3 3 7
27 7 2 4 3 1 1 18
28 1 2 8 1 12
29 1 2 1 2 6
30 1 1 2
31 1 4 1 6
32 1 1 1 1 4
33 1 1 1 2 1 6
34 1 1 1 3
35 2 2 4
36 1 1 1 3
37 1 2 1 2 6
38 2 2
39 1 1
40 1 1 1 3
41 2 2
43 2 1 3
44 2 1 3
45 1 3 1 5
46 1 2 3
47 2 1 3
48 1 1
49 1 2 1 4
50 2 2
51 2 2
53 2 2
54 1 3 4
55 3 3
56 1 1
57 1 1
58 1 1
59 1 1
60 1 1
Grand Total 483 331 77 5 2 449 436 164 10 19 1976
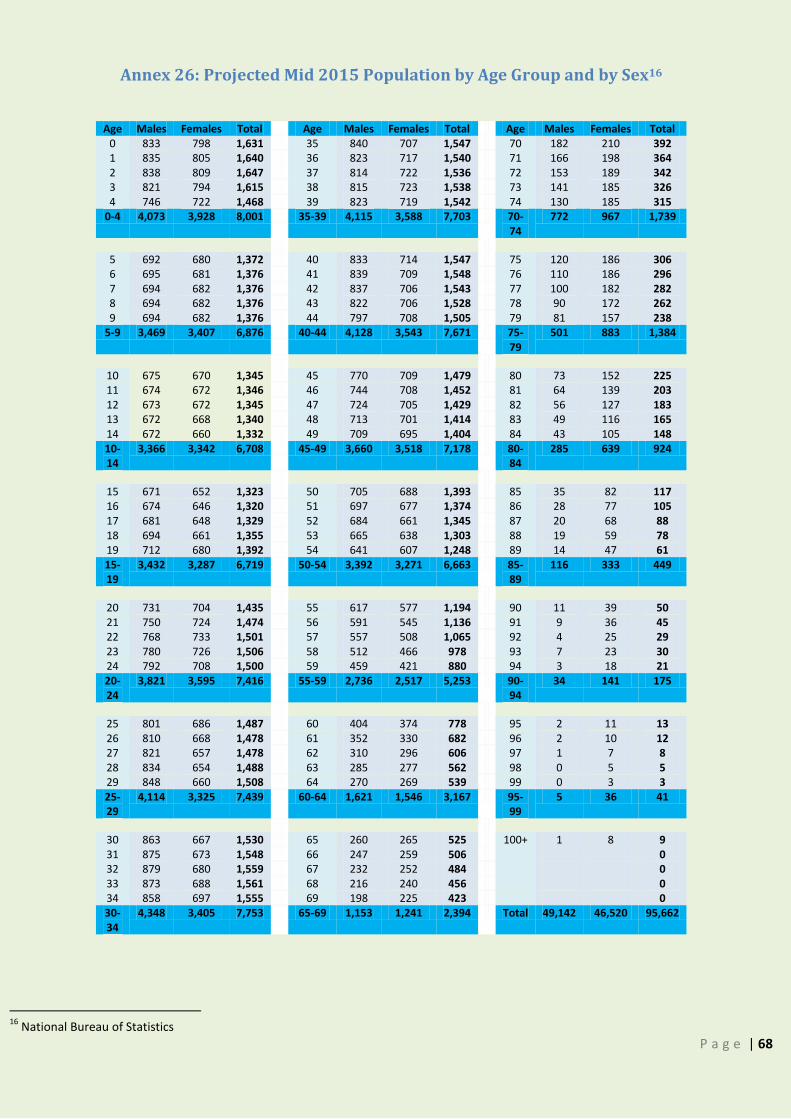
P a g e | 68
Annex 26: Projected Mid 2015 Population by Age Group and by Sex16
Age Males Females Total Age Males Females Total Age Males Females Total 0 833 798 1,631 35 840 707 1,547 70 182 210 392 1 835 805 1,640 36 823 717 1,540 71 166 198 364 2 838 809 1,647 37 814 722 1,536 72 153 189 342 3 821 794 1,615 38 815 723 1,538 73 141 185 326 4 746 722 1,468 39 823 719 1,542 74 130 185 315
0-4 4,073 3,928 8,001 35-39 4,115 3,588 7,703 70-74
772 967 1,739
5 692 680 1,372 40 833 714 1,547 75 120 186 306 6 695 681 1,376 41 839 709 1,548 76 110 186 296 7 694 682 1,376 42 837 706 1,543 77 100 182 282 8 694 682 1,376 43 822 706 1,528 78 90 172 262 9 694 682 1,376 44 797 708 1,505 79 81 157 238
5-9 3,469 3,407 6,876 40-44 4,128 3,543 7,671 75-79
501 883 1,384
10 675 670 1,345 45 770 709 1,479 80 73 152 225 11 674 672 1,346 46 744 708 1,452 81 64 139 203 12 673 672 1,345 47 724 705 1,429 82 56 127 183 13 672 668 1,340 48 713 701 1,414 83 49 116 165 14 672 660 1,332 49 709 695 1,404 84 43 105 148 10-14
3,366 3,342 6,708 45-49 3,660 3,518 7,178 80-84
285 639 924
15 671 652 1,323 50 705 688 1,393 85 35 82 117 16 674 646 1,320 51 697 677 1,374 86 28 77 105 17 681 648 1,329 52 684 661 1,345 87 20 68 88 18 694 661 1,355 53 665 638 1,303 88 19 59 78 19 712 680 1,392 54 641 607 1,248 89 14 47 61 15-19
3,432 3,287 6,719 50-54 3,392 3,271 6,663 85-89
116 333 449
20 731 704 1,435 55 617 577 1,194 90 11 39 50 21 750 724 1,474 56 591 545 1,136 91 9 36 45 22 768 733 1,501 57 557 508 1,065 92 4 25 29 23 780 726 1,506 58 512 466 978 93 7 23 30 24 792 708 1,500 59 459 421 880 94 3 18 21 20-24
3,821 3,595 7,416 55-59 2,736 2,517 5,253 90-94
34 141 175
25 801 686 1,487 60 404 374 778 95 2 11 13 26 810 668 1,478 61 352 330 682 96 2 10 12 27 821 657 1,478 62 310 296 606 97 1 7 8 28 834 654 1,488 63 285 277 562 98 0 5 5 29 848 660 1,508 64 270 269 539 99 0 3 3 25-29
4,114 3,325 7,439 60-64 1,621 1,546 3,167 95-99
5 36 41
30 863 667 1,530 65 260 265 525 100+ 1 8 9 31 875 673 1,548 66 247 259 506 0 32 879 680 1,559 67 232 252 484 0 33 873 688 1,561 68 216 240 456 0 34 858 697 1,555 69 198 225 423 0 30-34
4,348 3,405 7,753 65-69 1,153 1,241 2,394 Total 49,142 46,520 95,662
16
National Bureau of Statistics
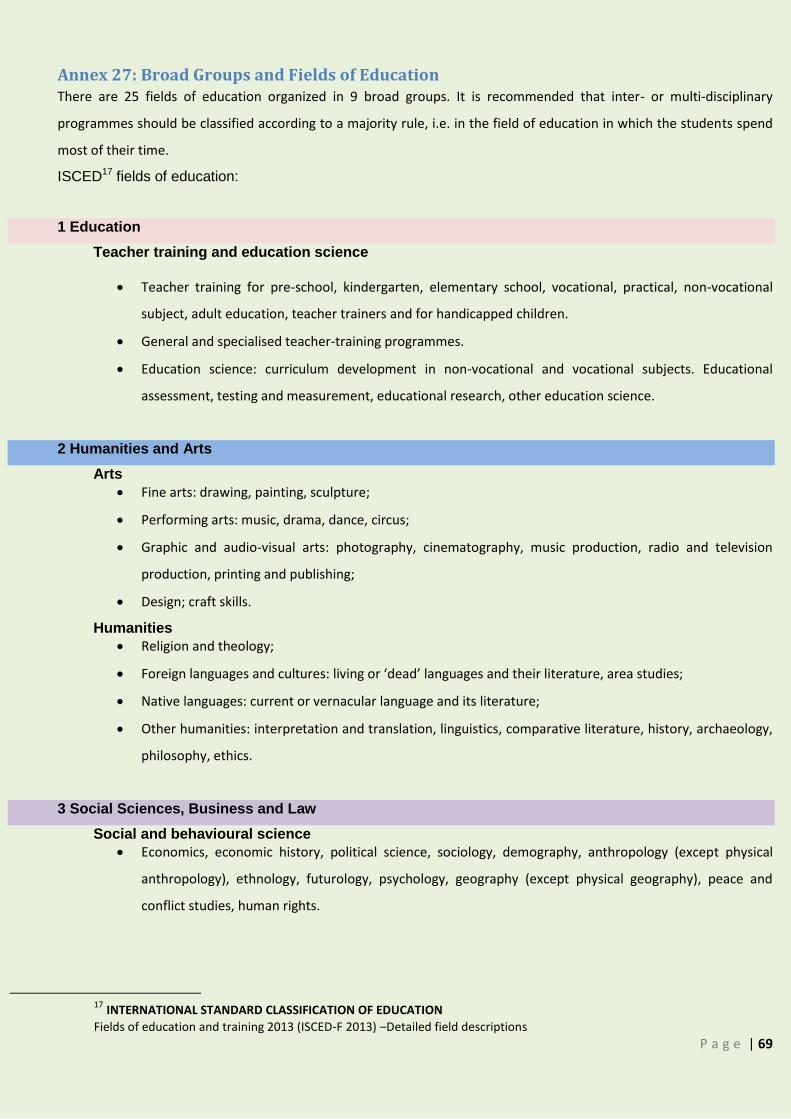
P a g e | 69
Annex 27: Broad Groups and Fields of Education There are 25 fields of education organized in 9 broad groups. It is recommended that inter- or multi-disciplinary
programmes should be classified according to a majority rule, i.e. in the field of education in which the students spend
most of their time.
ISCED17 fields of education:
1 Education
Teacher training and education science
Teacher training for pre-school, kindergarten, elementary school, vocational, practical, non-vocational
subject, adult education, teacher trainers and for handicapped children.
General and specialised teacher-training programmes.
Education science: curriculum development in non-vocational and vocational subjects. Educational
assessment, testing and measurement, educational research, other education science.
2 Humanities and Arts
Arts
Fine arts: drawing, painting, sculpture;
Performing arts: music, drama, dance, circus;
Graphic and audio-visual arts: photography, cinematography, music production, radio and television
production, printing and publishing;
Design; craft skills.
Humanities
Religion and theology;
Foreign languages and cultures: living or ‘dead’ languages and their literature, area studies;
Native languages: current or vernacular language and its literature;
Other humanities: interpretation and translation, linguistics, comparative literature, history, archaeology,
philosophy, ethics.
3 Social Sciences, Business and Law
Social and behavioural science
Economics, economic history, political science, sociology, demography, anthropology (except physical
anthropology), ethnology, futurology, psychology, geography (except physical geography), peace and
conflict studies, human rights.
17 INTERNATIONAL STANDARD CLASSIFICATION OF EDUCATION Fields of education and training 2013 (ISCED-F 2013) –Detailed field descriptions
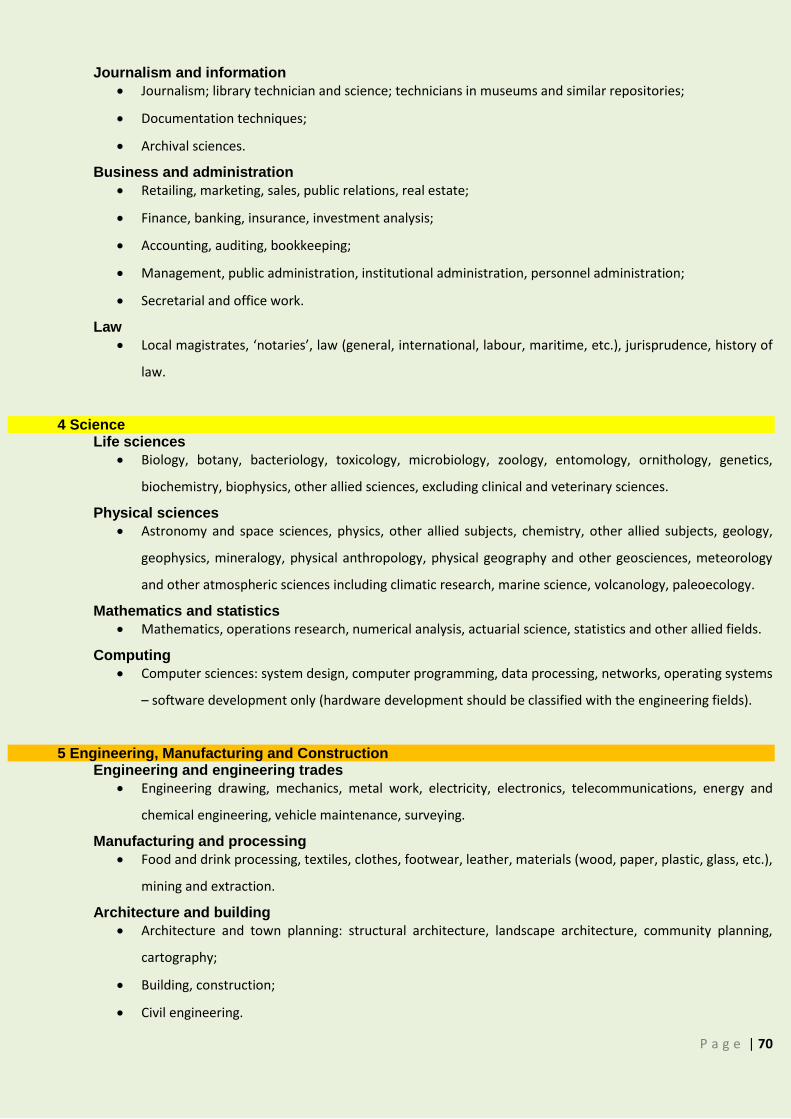
P a g e | 70
Journalism and information
Journalism; library technician and science; technicians in museums and similar repositories;
Documentation techniques;
Archival sciences.
Business and administration
Retailing, marketing, sales, public relations, real estate;
Finance, banking, insurance, investment analysis;
Accounting, auditing, bookkeeping;
Management, public administration, institutional administration, personnel administration;
Secretarial and office work.
Law
Local magistrates, ‘notaries’, law (general, international, labour, maritime, etc.), jurisprudence, history of
law.
4 Science Life sciences
Biology, botany, bacteriology, toxicology, microbiology, zoology, entomology, ornithology, genetics,
biochemistry, biophysics, other allied sciences, excluding clinical and veterinary sciences.
Physical sciences
Astronomy and space sciences, physics, other allied subjects, chemistry, other allied subjects, geology,
geophysics, mineralogy, physical anthropology, physical geography and other geosciences, meteorology
and other atmospheric sciences including climatic research, marine science, volcanology, paleoecology.
Mathematics and statistics
Mathematics, operations research, numerical analysis, actuarial science, statistics and other allied fields.
Computing
Computer sciences: system design, computer programming, data processing, networks, operating systems
– software development only (hardware development should be classified with the engineering fields).
5 Engineering, Manufacturing and Construction Engineering and engineering trades
Engineering drawing, mechanics, metal work, electricity, electronics, telecommunications, energy and
chemical engineering, vehicle maintenance, surveying.
Manufacturing and processing Food and drink processing, textiles, clothes, footwear, leather, materials (wood, paper, plastic, glass, etc.),
mining and extraction.
Architecture and building
Architecture and town planning: structural architecture, landscape architecture, community planning,
cartography;
Building, construction;
Civil engineering.
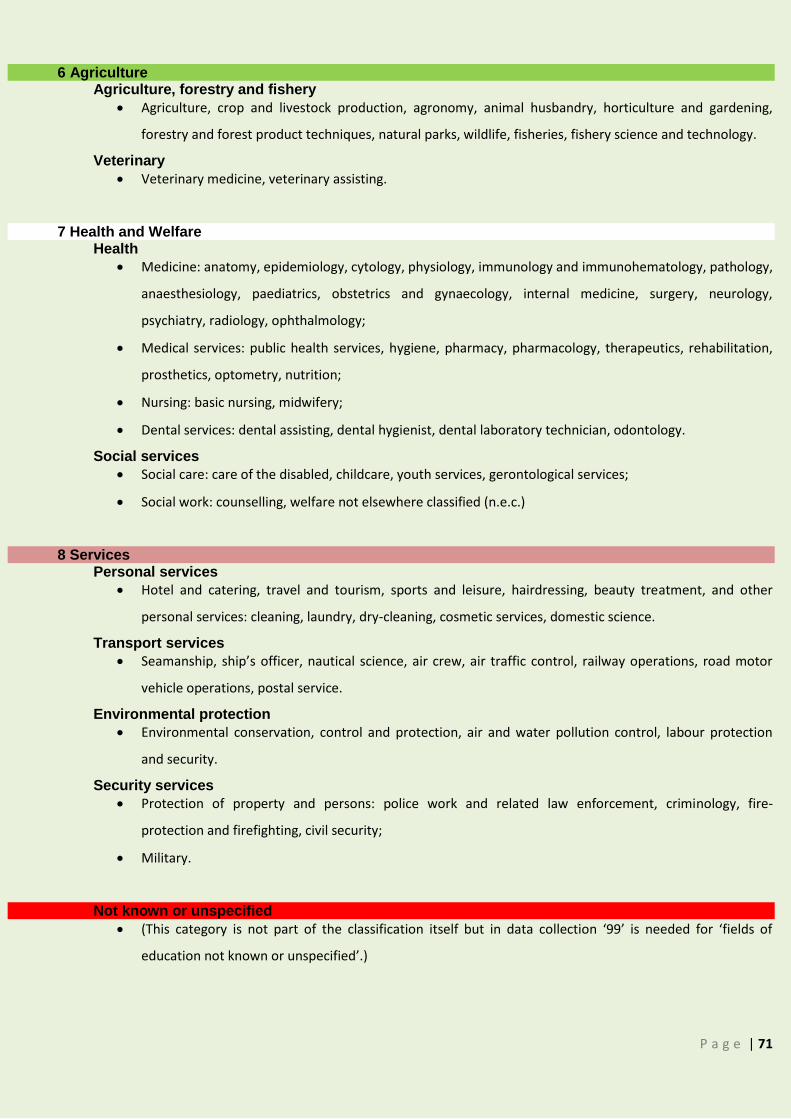
P a g e | 71
6 Agriculture Agriculture, forestry and fishery
Agriculture, crop and livestock production, agronomy, animal husbandry, horticulture and gardening,
forestry and forest product techniques, natural parks, wildlife, fisheries, fishery science and technology.
Veterinary
Veterinary medicine, veterinary assisting.
7 Health and Welfare Health
Medicine: anatomy, epidemiology, cytology, physiology, immunology and immunohematology, pathology,
anaesthesiology, paediatrics, obstetrics and gynaecology, internal medicine, surgery, neurology,
psychiatry, radiology, ophthalmology;
Medical services: public health services, hygiene, pharmacy, pharmacology, therapeutics, rehabilitation,
prosthetics, optometry, nutrition;
Nursing: basic nursing, midwifery;
Dental services: dental assisting, dental hygienist, dental laboratory technician, odontology.
Social services
Social care: care of the disabled, childcare, youth services, gerontological services;
Social work: counselling, welfare not elsewhere classified (n.e.c.)
8 Services Personal services
Hotel and catering, travel and tourism, sports and leisure, hairdressing, beauty treatment, and other
personal services: cleaning, laundry, dry-cleaning, cosmetic services, domestic science.
Transport services
Seamanship, ship’s officer, nautical science, air crew, air traffic control, railway operations, road motor
vehicle operations, postal service.
Environmental protection
Environmental conservation, control and protection, air and water pollution control, labour protection
and security.
Security services Protection of property and persons: police work and related law enforcement, criminology, fire-
protection and firefighting, civil security;
Military.
Not known or unspecified
(This category is not part of the classification itself but in data collection ‘99’ is needed for ‘fields of
education not known or unspecified’.)


