
T.C. Hender, M.F. Johnson, C. Bachmann, N. Eidietis, S.Gerasimov,G. Sannazzaro, R. Paccagnella, G. Pautasso, R. Prakash, V. Riccardo,
M. Sugihara, H. Strauss and L. Zakharov
EFDA–JET–R(11)01
Report of the ITPA MHD WorkingGroup 6 on Non-Axisymmetric
Currents During VDEs
“© – COPYRIGHT ECSC/EEC/EURATOM, LUXEMBOURG – 2011”
“Enquiries about Copyright and reproduction should be addressed to thePublications Officer, EFDA, Culham Science Centre, Abingdon, Oxon, OX14 3DB, UK.”
Report of the ITPA MHD WorkingGroup 6 on Non-Axisymmetric
Currents During VDEs
T.C. Hender1, M.F. Johnson1, C. Bachmann2, N. Eidietis3, S.Gerasimov1,G. Sannazzaro2, R. Paccagnella4, G. Pautasso5, R. Prakash6, V. Riccardo1,
M. Sugihara2, H. Strauss7 and L. Zakharov8
1EURATOM/CCFE Fusion Association, Culham Science Centre, Abingdon, OX14 3DB, UK2ITER Organization CS90 046, 13067 St. Paul lez Durance, Cedex, France
3General Atomics, PO Box 85608, San Diego, CA 92186, USA4Associazione EURATOM-ENEA sulla Fusione, Consorzio RFX Padova, Italy
5Max-Planck-Intitut fuer Plasmaphysik, EURATOM Association, D-85748, Garching, Germany6ITER-India, Institute for Plasma Research, A-29 GIDC Electronic Estate,
Sector-25 Gandhinagar – 382 025, Gujarat, India.7HRS Fusion, West Orange NJ, USA 07052
8Princeton Plasma Physics Laboratory, Princeton, NJ 08570, USA

.
Report of the ITPA MHD Working Group 6 on
Non-Axisymmetric currents during VDEs
T.C.Hender1, M.F.Johnson1, C Bachmann2, N Eidietis3, S.Gerasimov1, G Sannazzaro2, R Paccagnella4, G
Pautasso5, R Prakash6, V.Riccardo1, M Sugihara2, H Strauss7and L Zakharov8
JET EFDA, Culham Science Centre, Abingdon, OX14 3DB, UK.
1EURATOM/CCFE Fusion Association, Culham Science Centre, Abingdon, OX14 3DB, UK
2ITER Organization CS90 046, 13067 St. Paul lez Durance, Cedex, France
3General Atomics, PO Box 85608, San Diego, CA 92186, USA
4Associazione EURATOM-ENEA sulla Fusione, Consorzio RFX Padova, Italy
5Max-Planck-Intitut fuer Plasmaphysik, EURATOM Association, D-85748, Garching, Germany
6ITER-India, Institute for Plasma Research, A-29 GIDC Electronic Estate, Sector-25 Gandhinagar – 382
025, Gujarat, India. 7HRS Fusion, West Orange NJ, USA 07052
8Princeton Plasma Physics Laboratory, Princeton, NJ 08570, USA
1. Introduction
During VDEs toroidally asymmetric vessel currents can flow and these are related to toroidal variations in
the measured toroidal plasma current [1]. These asymmetries in the currents during VDEs can lead to
substantial sideways forces of over 4MN in JET [1,2], and are expected to be an order of magnitude larger
in ITER [3]. There is thus an urgent need to develop and record understanding of plasma current
asymmetries during VDEs; to facilitate this process a Working Group (WG 6) on sideways forces on the
vacuum vessel and magnets was established under the auspices of the ITPA MHD Topical Group.
This report discusses the asymmetries of plasma and vessel currents measured in JET and as such is an
update of previous reports [4,5]. It also discusses related measurements of halo current asymmetries in
ASDEX Upgrade (AUG) and DIII-D.
For ITER the asymmetric forces are being modelled using the source and sink model described in Ref [1].
The plasma current asymmetries are assumed to have an n=1 toroidal variation and so the input needed is
the amplitude of the plasma current asymmetry, its duration and its rotational frequency (if any). More
specifically information is needed on the amplitude/duration of asymmetry for the worst 6% of asymmetric
VDEs (termed Cat III/IV) and for the least bad 94% (termed Cat II). The asymmetry rotation is also an
issue; in ITER the main vessel resonant frequencies are in the range 3-8Hz [6] and so if the current
asymmetries were to rotate in this range of frequency there will be an enhancement of the vessel distortions.
Also smaller in-vessel components have higher resonant frequencies of up to ~100Hz.
A previous assessment by the ITER of JET data [5] concluded that the Cat III/IV plasma current
asymmetries can be covered by an envelope of 10% of the pre-disruptive Ip lasting for 37.5ms (in JET).
This assessment was based however on just 7 pulses with incomplete data on the toroidal variation – hence
the importance of revisiting this issue with a larger and more complete dataset.
2. JET asymmetry amplitude
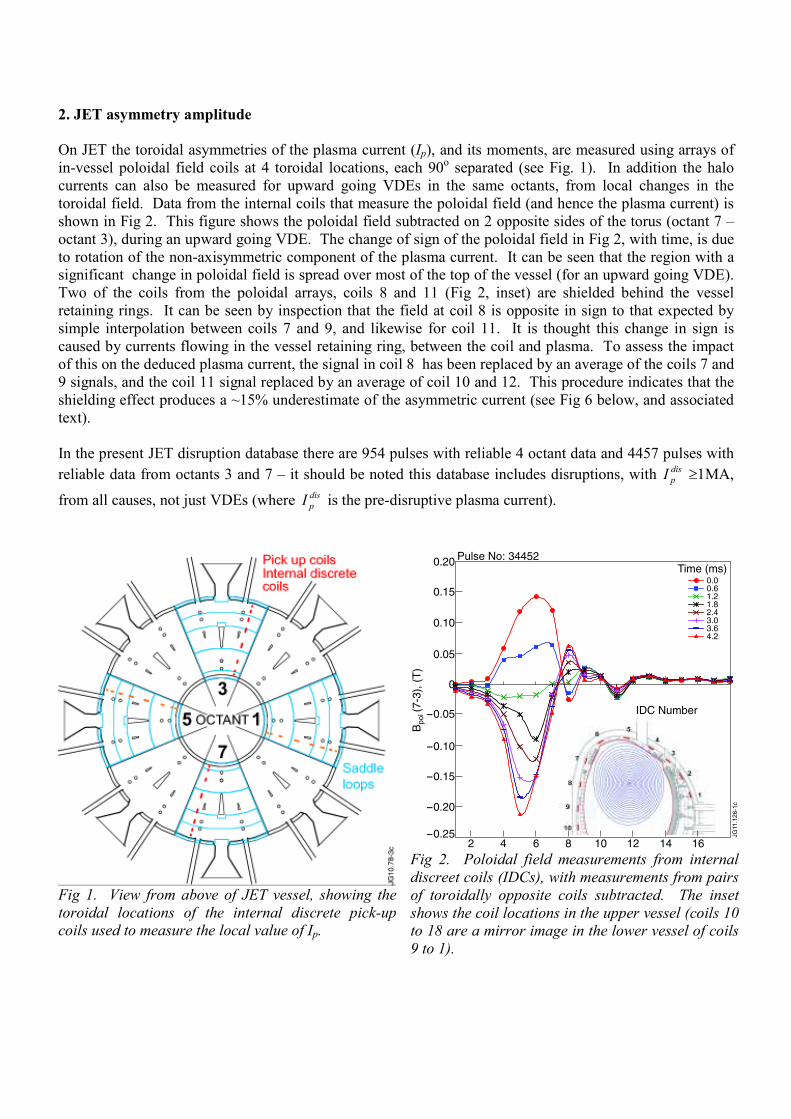
On JET the toroidal asymmetries of the plasma current (Ip), and its moments, are measured using arrays of
in-vessel poloidal field coils at 4 toroidal locations, each 90o separated (see Fig. 1). In addition the halo
currents can also be measured for upward going VDEs in the same octants, from local changes in the
toroidal field. Data from the internal coils that measure the poloidal field (and hence the plasma current) is
shown in Fig 2. This figure shows the poloidal field subtracted on 2 opposite sides of the torus (octant 7 –
octant 3), during an upward going VDE. The change of sign of the poloidal field in Fig 2, with time, is due
to rotation of the non-axisymmetric component of the plasma current. It can be seen that the region with a
significant change in poloidal field is spread over most of the top of the vessel (for an upward going VDE).
Two of the coils from the poloidal arrays, coils 8 and 11 (Fig 2, inset) are shielded behind the vessel
retaining rings. It can be seen by inspection that the field at coil 8 is opposite in sign to that expected by
simple interpolation between coils 7 and 9, and likewise for coil 11. It is thought this change in sign is
caused by currents flowing in the vessel retaining ring, between the coil and plasma. To assess the impact
of this on the deduced plasma current, the signal in coil 8 has been replaced by an average of the coils 7 and
9 signals, and the coil 11 signal replaced by an average of coil 10 and 12. This procedure indicates that the
shielding effect produces a ~15% underestimate of the asymmetric current (see Fig 6 below, and associated
text).
In the present JET disruption database there are 954 pulses with reliable 4 octant data and 4457 pulses with
reliable data from octants 3 and 7 – it should be noted this database includes disruptions, with dis
pI ≥1MA,
from all causes, not just VDEs (where dis
pI is the pre-disruptive plasma current).
Fig 1. View from above of JET vessel, showing the
toroidal locations of the internal discrete pick-up
coils used to measure the local value of Ip.
-0.20
-0.15
-0.10
-0.05
0.05
0.10
0.15
0
-0.25
0.20
2 4 6 8 10 12 14
0.00.61.21.82.43.03.64.2
16
Bpol (7
-3),
(T
)
IDC Number
Time (ms)Pulse No: 34452
JG
11
.12
6-1
c
Fig 2. Poloidal field measurements from internal
discreet coils (IDCs), with measurements from pairs
of toroidally opposite coils subtracted. The inset
shows the coil locations in the upper vessel (coils 10
to 18 are a mirror image in the lower vessel of coils
9 to 1).

Figure 3 shows the asymmetric halo and plasma currents for a pulse (74449) with a significant asymmetry.
1.00
-1.0
1.0
1.5
0.5
200100
0.50
-0.5-1.0
1.0
0.6
0.2
200
0
0
0
25.00 25.01 25.02 25.03
∆Ihalo
∆Ip
Halo
Amplitude
∆Ip Amplitude
Halo
Phase
∆Ip Phase
(10
5 A
)(1
05 A
)(D
eg)
(Deg)
Time (s)
JG
11
.12
6-2
c
Both the halo current and plasma current asymmetries rotate and may be linked [7], though the exact
physics underlying this relationship is not yet clear.
To systematically quantify the plasma current asymmetries the following quantity is used:-
dtII
A asym
pdis
p
oct ∫=1
4
where dis
pI =pre-disruptive plasma current and 2
51
2
37 )()( IIIII asymp −+−= with I1= octant 1 plasma
current etc. To avoid noise contributing to the results, the A4oct integral is only evaluated for times when
| asym
pI |>10kA and | asym
pI |>0.5% | dis
pI | and |Ip|>10% |dis
pI |. In the results presented the time of disruption is
defined as the point when |dIp/dt|>25MA/s for at least 2ms for VDEs, or the peak of the negative loop
voltage spike for disruptions that occur before vertical instability onset. dis
pI is then defined as the average
Ip over 20-50ms before the disruption time.
It is important to note that A4oct is a measure of the peak-to-peak variation, and not the amplitude of plasma
current asymmetry. tp
asym
octBaI
dtFA
∫~4 where Fasym is the asymmetric force and a the minor radius. So A4 oct is
related to the magnitude of the asymmetric impulse force.
In cases where just octant 3 and 7 data are available then a two octant asymmetry A2 oct can be defined. If
the asymmetric currents (I7-I3 and I5-I1) are assumed as a pure sine wave in time then
A4 oct = π/2 A2 oct
Fig 3 (a) Halo current
asymmetry defined as difference
of local signal and the toroidal
average [red=octant 1,
blue=octant 3, purple=octant 5,
green=octant 7]; (b) amplitude of
the halo asymmetry; (c) phase of
halo asymmetry; (d) to (f) as (a)
to (c) but for plasma current.

Figure 4 shows the variation of A4 oct for the whole 954 shot four octant database and the variation of A2 oct
for the whole two octant database. Also shown is the π/2 A2 oct together with A4 oct for shots where four octant data are available – it can be seen on average that π/2 A2 oct gives a good description of the four octant data.
0
0.5
1.5
2.0
1.0
2.5
10018016014012011
A4
oct (m
s)
Shot
JG
10
.17
-1c
01001 2001 3001
2 octant dataA4oct (or A2) = Ip dt/Ip2 octant data*(π/2)4 octant data
40011
A4o
ct, A
2oct (
ms)
Shot
JG10
.78-
14c
disasym!
1
2
3
4
Fig 4 Left-hand plot shows A4oct for the whole 4 octant database. The right-hand plot shows the entire 2
octant database (red), data for 4 octant shots (dark blue) where it exists, and π/2 A2 oct (green). In the right-hand plot the data are sorted by descending size of A2 oct
The extrapolated 2 octant data (π/2 A2 oct) has a maximum value (3.68ms) just below the ITER envelope value of 3.75ms (10% of Ip for 37.5ms) assumed in Ref [5].
There is also a significant difference in the asymmetry between upward and downward going VDEs in JET.
Figure 5 shows the integral asymmetry, with upward and downward going VDEs discriminated. The
upward going VDEs have a peak π/2 A2 oct= 3.68ms whereas the downward going VDEs have a peak of 1.34ms; the reason for this difference is not clear but presumably depends on the machine magnetic and
physical geometry. It should also be noted that some of poloidal field pick-up coils (used to deduce Ip) are
shielded by the divertor structure and this may impact the accuracy for downward goings VDEs.
0
1
3
2
4
10018016014012011
π/ 2
A2
oct (m
s)
Shot
JG
10
.17
-4c
Fig 5 π/2 A2 oct with upward going disruptions in blue and downward going in red – showing the first
2000 shots from the two octant database.
As noted in the introductory paragraph to this section, the vessel retaining rings that shield 2 of the internal
sensor coils used to evaluate Ip, are likely introducing a systematic error. To quantify this effect the signals

of the shielded coils (8 and 11) have been replaced by averages of their neighbours – the resulting values of
π/2 A2 oct are shown in Fig 6. It can be seen that the shielded coils introduce a systematic underestimate of π/2 A2 oct by 15%. For the remainder of this report values of Ip using the raw coil 8 and 11 data will be used – this must be regarded as a systematic error on the results presented.
4.00
3.50
3.00
2.50
2.00
1.50
1.00
0.50
0
4.50
501 10011
π/2 A
2 o
ct
Shot
JG11
.126-3
c
Fig 6 π/2 A2 oct with Ip evaluated with (red) and without (blue) sensor coils 8 and 11 replaced by
averages of their neighbours. In both cases the
data are sorted into descending order.
Figure 7 shows the cumulative percentage of pulses with an asymmetry up to a given value for the 2 octant
database.
0
20
60
80
40
100
43210
Cu
mu
lative
%
π/2 A2oct (ms)
JG
10
.17
-3c
0
20
60
80
40
100
1.00.80.60.40.20π/2 A2oct (ms)
Cu
mu
lative
(%
)
JG
10
.17
-2c
Fig 7 Cumulative % of shots with π/2 A2 oct less than a given value. The right figure is a zoom of the left figure for the range π/2A2oct= 0 to 1ms.
The behaviour at low asymmetry (seen in Fig 7, right) is caused by the criteria (discussed above) used to
determine the times over which the asymmetry integral is evaluated.
The traces of asym
pI / dis
pI for the cases with largest values of A4 oct and A2 oct are shown in Figs 8 and 9,
respectively. In these plots t=0 is defined such that dtIdtIt
asym
p
t
asym
p ∫∫><
=00
. Under the previously developed
ITER specification [5] a +/-2ms rectangular smoothing of the JET data was applied, on the basis that such
short timescale behaviour (when extrapolated to ITER) will have no mechanical effects. Given the ~3 to
8Hz ITER vessel frequency the choice of +/-2ms smoothing time (though somewhat arbitrary) is
conservative (how to extrapolate timescales to ITER is discussed below). It can be seen from Fig 8 (right)
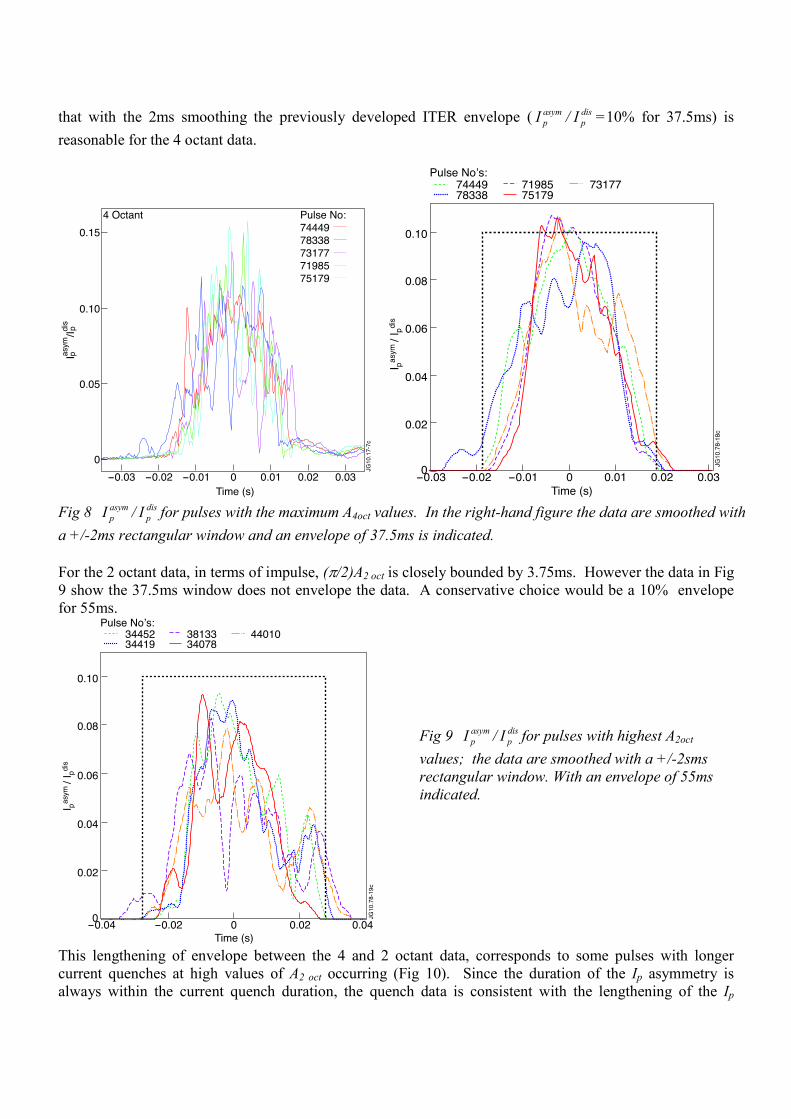
that with the 2ms smoothing the previously developed ITER envelope ( asym
pI / dis
pI =10% for 37.5ms) is
reasonable for the 4 octant data.
0.15
4 Octant Pulse No:
74449
78338
73177
71985
75179
0.10
0.05
0
-0.03 -0.02 -0.01 0 0.01 0.02 0.03
Time (s)
JG
10
.17
-7c
Iasym
/Id
isp
p
0
0.02
0.04
0.06
0.08
0.10
-0.02 -0.01 0 0.01 0.02 0.03-0.03
I pa
sym
/ I p
dis
Time (s)
Pulse No’s:7444978338
7198575179
73177
JG
10
.78
-18
c
Fig 8 asym
pI / dis
pI for pulses with the maximum A4oct values. In the right-hand figure the data are smoothed with
a +/-2ms rectangular window and an envelope of 37.5ms is indicated.
For the 2 octant data, in terms of impulse, (π/2)A2 oct is closely bounded by 3.75ms. However the data in Fig 9 show the 37.5ms window does not envelope the data. A conservative choice would be a 10% envelope
for 55ms.
0
0.02
0.04
0.06
0.08
0.10
-0.02 0 0.02 0.04-0.04
I pa
sym
/ I p
dis
Time (s)
Pulse No’s:3445234419
3813334078
44010
JG
10
.78
-19
c
Fig 9 asym
pI / dis
pI for pulses with highest A2oct
values; the data are smoothed with a +/-2sms
rectangular window. With an envelope of 55ms
indicated.
This lengthening of envelope between the 4 and 2 octant data, corresponds to some pulses with longer
current quenches at high values of A2 oct occurring (Fig 10). Since the duration of the Ip asymmetry is
always within the current quench duration, the quench data is consistent with the lengthening of the Ip

asymmetry between the 4 and 2 octant data. The line in Fig 10 corresponds to asym
pI / dis
pI =10% for the whole
current quench duration - this line provides a good bound on the data. Also since the Ip quench duration is
known to scale linearly with plasma area [8], this possibly justifies scaling the asymmetry duration with
plasma area – implying the asymmetries will persist a factor of ~5 times longer in ITER than JET. Though
it should be noted that the reason the peak asymmetry occurs at τ80-20=50-60ms is not clear, and so it is not certain this time will scale as the plasma area.
2 Octant data4 Octant data
0
3.0
2.0
1.0
4.0
150 200100500
τ80-20 (ms)
A (
ms)
JG
10
.17
-5c
Fig 10 A4oct (red) and π/2 A2oct (blue) vs the current quench time extrapolated from time to
quench from 80 to 20% of dis
pI (ie. the time from
80 to 20% multiplied by 5/3). The green line is
the integral asymmetry if the Ip asymmetry is
10% for the whole τ80-20 time.
The maximum magnitude of the asymmetry asym
pI / dis
pI from just the 2 octant (3 and 7) data is shown in Fig
11. It can be seen that at the highest asymmetries (determined by A2 oct) that the 10% maximum is a good
envelope (when the +/-2ms smoothing is applied).
20
25Unsmoothed
+/- 2ms smoothing
15
Ma
x (
Iasym
/Id
is)
%
10
5
0210 43
π/2 A2oct
JG
10
.17
-14
c
pp
Fig 11 Maximum value of asym
pI / dis
pI versus π/2A 2 oct.
Results are shown with and without a +/-2ms
rectangular smoothing window.
For the 4 octant data using A4 oct as the asymmetry measure to define the CAT III to CAT II boundary, this
occurs at 1.19ms; giving a ratio of the peak CAT III/IV to CAT II Ip asymmetries of 2.15/1.18=1.82. The
equivalent ratio for the 2 octant dataset is rather bigger at 3.68/1.45=2.55. A simple envelope description of
the peak CAT II pulses is not so easy; it can be inferred from Fig 10 that there will be some pulses where a
10% envelope for the duration of the Ip quench gives a good description of the data, but others where the

asymmetry is less than 10%, but for longer durations in slower current quenches. However it can also be
seen from Fig 11 that there are a few CAT II pulses where an envelope of asym
pI / dis
pI >10% is needed (even
for the smoothed data). The 2 octant CAT II data might thus be described by a asym
pI / dis
pI envelope of 10%
for 15ms. However to account for the reduced amplitude but longer pulses in CAT II it might be prudent to
also examine the forces arising from an envelope asym
pI / dis
pI =5% for 30ms and asym
pI / dis
pI =15% for 10ms.
3 JET asymmetry rotation
In the majority of pulses the halo and Ip asymmetry rotates counter to Ip, at ~100Hz, though there is
significant scatter and a few pulses even rotate in the Ip-direction [9,10]. For the ITER vessel the most
problematic rotation frequency is ~3-8Hz, the fundamental mechanical vessel frequencies for VDE loading
conditions [6]. Rotating modes resonating with the vessel frequency will lead to dynamic amplification of
the structural forces. Figure 12 shows the number of revolutions calculated for four different time windows
specified by the condition asym
pI / )( asym
p
dis
p AI ≡ >0.5%, 1%, 2% and 5% for first and last window time points
(subject to the additional criteria on noise level that| asym
pI |>10kA and | asym
pI |>0.5% | dis
pI | and |Ip|>10% |dis
pI |
and also | asym
pI |>10kA for the first and last 1ms window to ignore the shortlived spikes). The degree of
rotation is in the range from -2 turns to +8 turns for the entire 4 octant database, where a positive number of
turns corresponds to rotation counter to Ip. The physical processes leading to these rotation variations are
not presently understood, however at the ITER vessel frequency (up to ~8Hz) around 2 turns maximum will
occur through the duration of the peak CAT III/IV events (where the duration is extrapolated from JET on
the plasma area weighting basis), limiting dynamic amplification.
8
6
4
2
0
-221
Apasym > 0.5%
Apasym > 1%
Apasym > 2%
Apasym > 5%
41 611
Nu
mb
er
of tu
rns
Shot
Mode rotation for A4oct > 1.0ms
JG
10
.78
-8c
Fig.12. The number of turns calculated for the four
octant databases. Only pulses with a measurable
rotation of >0.5turns are included.
The cumulative probability of reaching a given number of turns is shown in Fig 13, for various amplitudes
of the plasma current asymmetry.

0.1
0.2
0.3
0
0.4
1 2 3 4
Ap > 0.5%
50 6
Fra
ction o
f puls
es
Number of turns
Pulse fraction which exceed specified number of turns
JG
11
.12
6-4
c
asym
Ap > 1.0%asym
Ap > 2.0%asym
Ap > 5.0%asym
Fig 13 Fraction of shots (from 954 shot 4 octant
database) that exceed a specified number of turns, with
the different curves showing the fraction for different
asymmetry amplitudes.
5. ASDEX Upgrade and DIII-D results
Unfortunately no data is available from tokamaks other than JET on the toroidal variation of the plasma
current during disruptions events. However many tokamaks have halo current data. Empirically in JET
there is a clear relationship of the toroidal current asymmetry and the measured poloidal halo current, as
shown in Fig 14.
Fig 14 The poloidal halo current and the plasma current measured in four octants are in the top two boxes.
The plasma current flows clockwise in JET, hence the negative sign. Negative halo current in the top of the
vessel means current entering outboard and exiting inboard. The bottom four boxes have the asymmetric
component of the poloidal halo current and the asymmetric component of the toroidal plasma current in
each octant, with the comparison octant shifted toroidally by π/2 between the halo and plasma current data. From [9].

It can be seen that the plasma current and halo current asymmetries are 90o out of phase and of
approximately equal magnitude (as also reported in [7]). While this is not fully understood there are related
results from the M3D code that confirm the phase relationship, but for the case studied show the fluctuating
halo currents are ~2 times the toroidal current variation [11].
Although the relationship of the toroidal variation of the halo current and that of toroidal plasma current is
not fully quantitatively understood, results are presented from AUG and DIII-D on the halo current
variations since they are clearly related to the plasma current variation, and may be of future relevance.
From the definition of the toroidal peaking factor as
)(
(max)
averageI
ITPF
halo
halo=
it can be seen that the amplitude of the halo current asymmetry normalised to the pre-disruptive plasma
current is
dis
P
halo
I
tITPFtA
)()1()( −= (1)
and that ∫A(t)dt is related to A4,oct (though it should be noted that the peak-to-peak variation of the toroidal plasma current is used in the A4,oct definition). The data for A(t) in AUG are published in Ref [12]. Figure
15 shows the ∫A(t)dt over the corresponding AUG shot database and also the equivalent results from DIII-D.
1.0
0.8
0.6
0.4
0.2
0
1.2
200 400 6000
∫Adt
(ms)
Pulse
JG11
.126
-5c
Fig 15 ∫A(t)dt values arranged in monotonically decreasing order for AUG (solid line) and DIII-D (‘*’ symbols); the AUG data are from Ref [12].
It can be seen that AUG and DIII-D have similar peak levels of asymmetry (∫A(t)dt) but that higher halo current asymmetry is more common in AUG over the considered databases (i.e. the fall-off of ∫A(t)dt with shot number is much more rapid in DIII-D). Taking account of the fact that the peak-to-peak (and not
amplitude) is used to define A4,oct and assuming an area weighted scaling then one would expect from the
JET Ip asymmetry results a peak value of ∫A(t)dt ~ 0.5ms in AUG or DIII-D (not the observed 1ms).

However as noted one should be very cautious in directly comparing the halo and toroidal current
asymmetry amplitudes.
There is limited data on rotation of the halo current in AUG and DIII-D. It should be noted that current
quench rates are faster in AUG and DIII-D than in JET (since they scale as plasma area), and so rotations of
less than O(100)Hz are more difficult to observe in the smaller tokamaks due to very few periods of rotation
occurring. In AUG the rotation is most commonly in the counter-Ip direction but sometimes occurs in the
co-Ip direction. Generally there is very limited rotation, but this has not yet been systematically quantified.
In DIII-D a database of 315 pulses has been analysed (Fig 16) and in general shows very little rotation.
180
160
140
120
100
80
60
40
20
0
200
-1.5 -1.0 -0.5 0 0.5 1.0 1.5 2.0 2.5 More
Fre
quency o
f occure
nce
Number of revolutions
JG
11.1
26-6
c
Fig 16 Data from DIII-D on the number of revolutions of the halo current asymmetry, from right to left the
histogram bins for the data are - 3.0≥data >2.5, 2.5≥data >2.0, etc to -1.5≥data >-2.0. A negative number of revolutions indicates rotation counter to Ip.
6. Comparison of JET halo and Ip asymmetry results
Although halo and Ip asymmetries are clearly linked an approach to evaluating disruption loads is to treat
them separately as cumulative loads. An issue then is whether you can simultaneously get a maximum of
the halo and Ip asymmetries. Figure 17 shows the temporal maximum of the Ip asymmetry (normalised by
pre-disruption Ip) versus the normalised halo current asymmetry (see Eq(1) in section 5).

0.20
0.15
0.10
0.05
0
0.25
Ma
x (
Ipasym
m /I
p)
f* (TPF-1)
JG
11
.12
6-7
c
0.05 0.10 0.15 0.200 0.25
Fig 17 Maximum Ip asymmetry versus the
maximum halo current asymmetry. The blue
diamonds are 2 octant data with Ip asymmetry
derived from the difference between octants 1 and
5. The red triangles are 4 octant data with Ip
asymmetry defined as the maximum of the
difference between octants 1 and 5 Ip, and octants
3 and 8 Ip.
From Fig 17 it can be seen that there is a correlation between the Ip asymmetry and halo asymmetry, though
with a large spread. It thus might be conjectured that the largest sideways force and halo current can occur
simultaneously. However, it has to be remembered that the Ip asymmetry maximum can be very transient
(this is indicated by Fig 11, where the averaging substantially reduces the maximum). Using instead the
time integrated measure of the Ip asymmetry (A4oct), shows the maximum sideways impulse force is not
coincident with either maximum spatially averaged halo fraction (f) or with the maximum local halo fraction
(f*TPF) – this is shown in Fig 18.
2.0
1.5
1.0
0.5
0
2.5
A4
,oct
f* TPF or f
JG11
.126-8
c
0.1 0.2 0.3 0.4 0.50 0.6
Fig 18 A4oct versus halo fraction (f, blue diamonds)
and maximum local halo fraction (f*TPF, purple
squares)
7. Summary and future work
The JET data show toroidal asymmetries in Ip, that can translate into substantial sideways forces on the
vacuum vessel [1]. For fairly recent shots Ip data are available in 4 toroidally opposite octants, allowing
phase and amplitude to be deduced. Previously only 2 toroidally opposite octants of data were recorded.

A measure of the Ip-asymmetry has been defined as dtII
A asym
pdis
p
octor ∫=1
42 . It is found on average that
A4oct=π/2 A2oct, as would be expected for a rotating n=1 structure.
The data are sorted into 2 categories: CAT III/IV which are largest 6% of pulses, and CAT II which are the
remaining 94%. The peak values of A2oct or A4oct for these categories are :-
Category A4oct π/2A2oct A4oct(up) π/2A2oct(up) III/IV 2.15ms 3.67ms 2.15ms 3.67ms
II 1.18ms 1.44ms 1.47ms
(514 pulses)
1.21ms
(2333 pulses)
Table 1 Peak values of A2oct or A4oct for the indicated categories. Also the statistics for upward going VDEs
alone are discriminated. An upward VDE is defined as ∆Z>0.2m when pI /dis
pI =0.5
Since it is observed that the peak asym
pI / dis
pI ~10% (when smoothed by +/-2ms, see Fig 11), the values in
Table 1 can be used to provide waveforms for the peak CAT III/IV and CAT II events, i.e asym
pI / dis
pI =10%
for 37ms (for CAT III/IV events). For CAT II events there is a wider spread of amplitudes and it is
recommended that windows with asym
pI / dis
pI =5, 10 and 15% are also considered. The likely systematic
underestimate of the Ip asymmetry (see Fig 6) should be noted and it is strongly recommended that a
substantial margin is allowed in applying these results to ITER vacuum vessel loading calculations. The
large, and as yet unexplained, difference in asymmetry (A4oct) between upward and downward going VDEs
in JET also reinforces the need for allowing a large margin.
The observation that the asymmetry is within the Ip quench phase duration and the known scaling of this
with plasma area [8], suggest that the durations of CAT III/IV and CAT II waveforms be scaled as plasma
area (NB. SITER/SJET~4.7). This issue should be revisited when halo data from other machines can be
incorporated to give a size scaling.
Rotation of the asymmetry is important since it can lead to dynamic amplification of the applied force if
resonance with the vessel or an in-vessel component occurs. The main vessel frequency is up to ~8Hz and
so the upper bound of the JET CATIII/IV envelope which is 258ms in duration when extrapolated to ITER,
allows up to just over 2 periods of rotation – thus limiting the scope for dynamic amplification. However it
should be noted that smaller amplitude asymmetries asym
pI / dis
pI can last longer and also in-vessel
components have higher resonant frequencies allowing greater dynamic amplification.
A key weakness is that the data on Ip asymmetries is solely from JET. Data on halo current asymmetries is
however available on other tokamaks including AUG and DIII-D, and some is presented here. There are
empirical observations on JET on the link between the poloidal halo current asymmetry and the plasma
current asymmetry. Also M3D calculations are starting to shed light on this link. Thus if a physics
understanding can be developed this would be very valuable in providing experimental confirmation of the
size scaling of the Ip (or poloidal halo current) asymmetry duration; this is the key near-term development to
be pursued.
Acknowledgements
This work was carried out within the framework of the European Fusion Development Agreement and was
partly funded by the RCUK Energy Programme under grant EP/I501045 and the European Communities

under the contract of Association between EURATOM and CCFE. The views and opinions expressed
herein do not necessarily reflect those of the European Commission.
References
[1] V. Riccardo, P. Noll and S.P. Walker, ‘Forces between plasma, vessel and TF coils during AVDEs at
JET’, Nucl. Fusion 40 (2000) 1805
[2] P Noll et al, ‘The present understanding of electromagnetic behaviour during disruptions in JET’, 19th
Symposium of Fus Tech 1 (1996) 751
[3] C Bachmann et al, ‘Specification of asymmetric VDE loads of the ITER tokamak’, accepted Fus Eng and
Design (2011)
[4] V. Riccardo, JET report at http://users.jet.efda.org/repository/pinboard/EFDA-
JET/report/13668_avde_v06.pdf (2007)
[5] C Bachmann, ITER report ITER_D_2DJ5AA v 2.7 (2009)
[6] T Schioler et al, ‘Dynamic Response of ITER during asymmetric VDEs’, accepted Fus Eng and Design
(2011)
[7] V. Riccardo , G. Arnoux , P. Beaumont et al and JET EFDA Contributors, ‘Progress in understanding
halo current at JET’, Nucl. Fusion 49 (2009) 055012
[8] Chapter 3 ITER Physics Basis, Nucl. Fusion 39 (1999) 2137
[9] V Riccardo et al, ‘JET disruption studies in support of ITER’, Plasma Phys. Control. Fusion 52 (2010)
124018
[10] S Gerasimov et al, ‘Scaling JET disruption sideways forces to ITER’, 37th EPS Conference on Plasma
Physics, Dublin, Ireland, 21-25 June, 2010, P4.121(European Physical Society, 2010) Conference
Proceedings
[11] H R Strauss, R Paccagnella et al, ‘Wall forces and plasma currents produced by disruptions’, submitted
to Phys of Plasma (2011)
[12] G Pautasso et al, ‘The halo current in ASDEX Upgrade’, Nucl Fus 51 (2011) 043010


