
Aviation moves.
report2015
Energy efficiency and climate protection

German aviation is reducing its specific energy consumption from year to year. In 2014, the airlines achieved an all-time record by reducing fuel consumption to an average of 3.64 litres of kerosene per 100 passenger-kilometres.
In this Aviation Energy Efficiency and Climate Protection Report 2015 the German Aviation Association (BDL) presents the key indicators as well as the strategies and measures that lead to improved energy efficiency and climate protection.
www.bdl.aero
Contents
Key indicators 2015
Aviation energy efficiency and climate protection report in key indicators 2
Objectives and strategy
Industry targets and four-pillar strategy 9
Measures
Technical innovations 11
Energy-optimised operation 13
Efficient infrastructure 15
Alternative propulsion systems and aviation fuels 17
Emissions trading 19
Research on climate impact 20
Conversion factors 21
Publication details 22
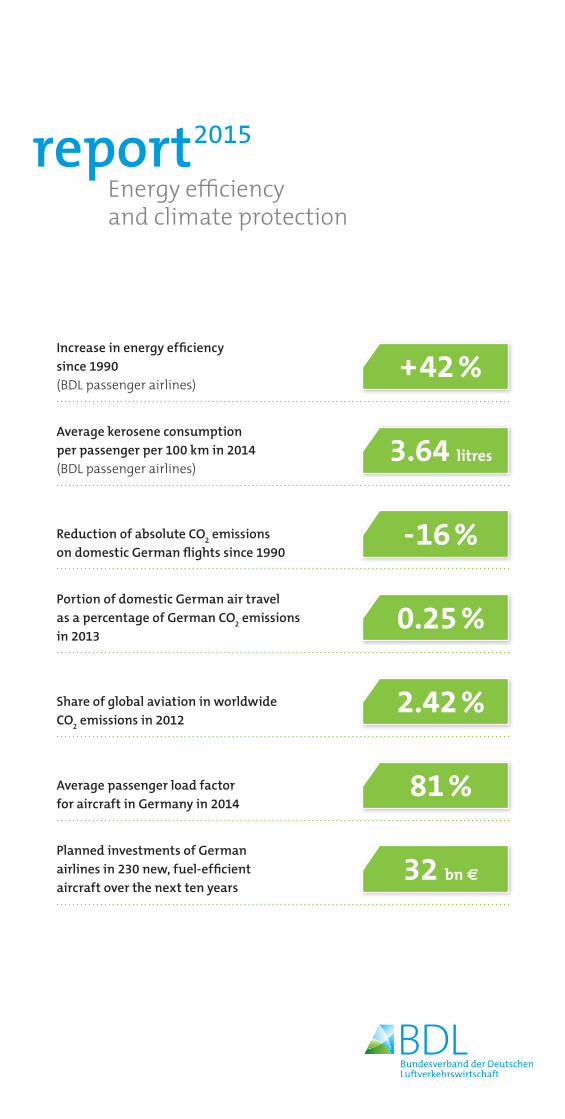
Average kerosene consumption per passenger per 100 km in 2014 (BDL passenger airlines)
Portion of domestic German air travel as a percentage of German CO
2 emissions
in 2013
Reduction of absolute CO2 emissions
on domestic German flights since 1990
Increase in energy efficiency since 1990 (BDL passenger airlines)
+42 %
3.64 litres
-16 %
0.25 %
Share of global aviation in worldwide CO
2 emissions in 2012
Average passenger load factor for aircraft in Germany in 2014
Planned investments of German airlines in 230 new, fuel-efficient aircraft over the next ten years
2.42 %
81 %
32 bn €
report2015
Energy efficiency and climate protection
3
Energy efficiency and climate protection in key indicators
Today, rising German air traffic volumes no longer mean a parallel increase in kerosene consumption. Year-on-year the average consumption of the German air fleet per passenger per 100 km has fallen by one per cent and currently stands at 3.64 litres. In other words, air transport is becoming more and more efficient.
More traffic, less kerosene
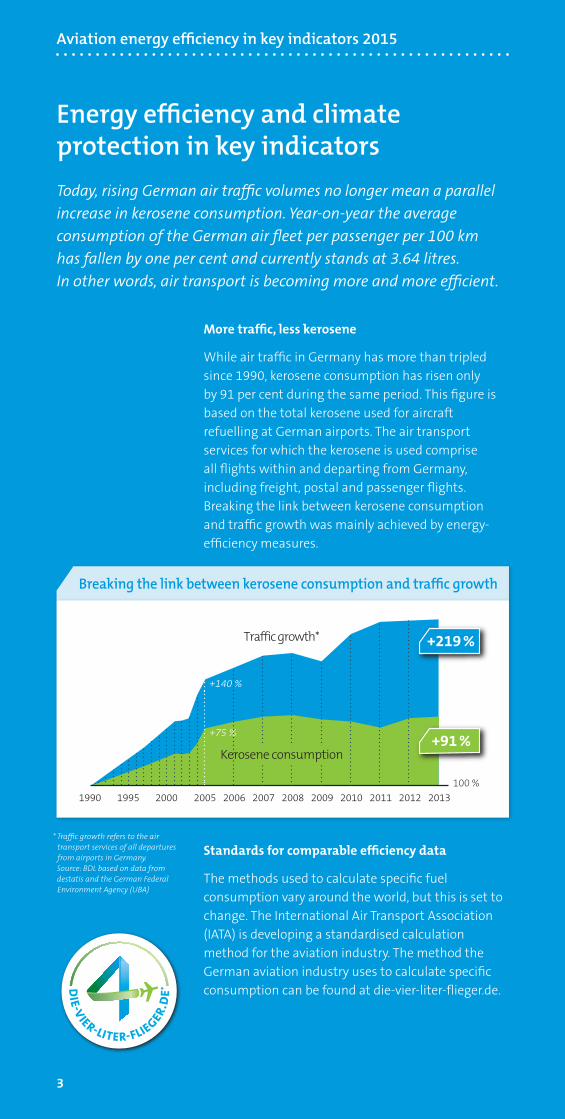
While air traffic in Germany has more than tripled since 1990, kerosene consumption has risen only by 91 per cent during the same period. This figure is based on the total kerosene used for aircraft refuelling at German airports. The air transport services for which the kerosene is used comprise all flights within and departing from Germany, including freight, postal and passenger flights. Breaking the link between kerosene consumption and traffic growth was mainly achieved by energy-efficiency measures.
Standards for comparable efficiency data
The methods used to calculate specific fuel consumption vary around the world, but this is set to change. The International Air Transport Association (IATA) is developing a standardised calculation method for the aviation industry. The method the German aviation industry uses to calculate specific consumption can be found at die-vier-liter-flieger.de.
* Traffic growth refers to the air transport services of all departures from airports in Germany. Source: BDL based on data from destatis and the German Federal Environment Agency (UBA)
Breaking the link between kerosene consumption and traffic growth
1990 2012201120102009200820072006200520001995 2013
+219 %
+91 %
100 %
+140 %
+75 %
Kerosene consumption
Traffic growth*
Aviation energy efficiency in key indicators 2015
4
A new efficiency record in passenger transport
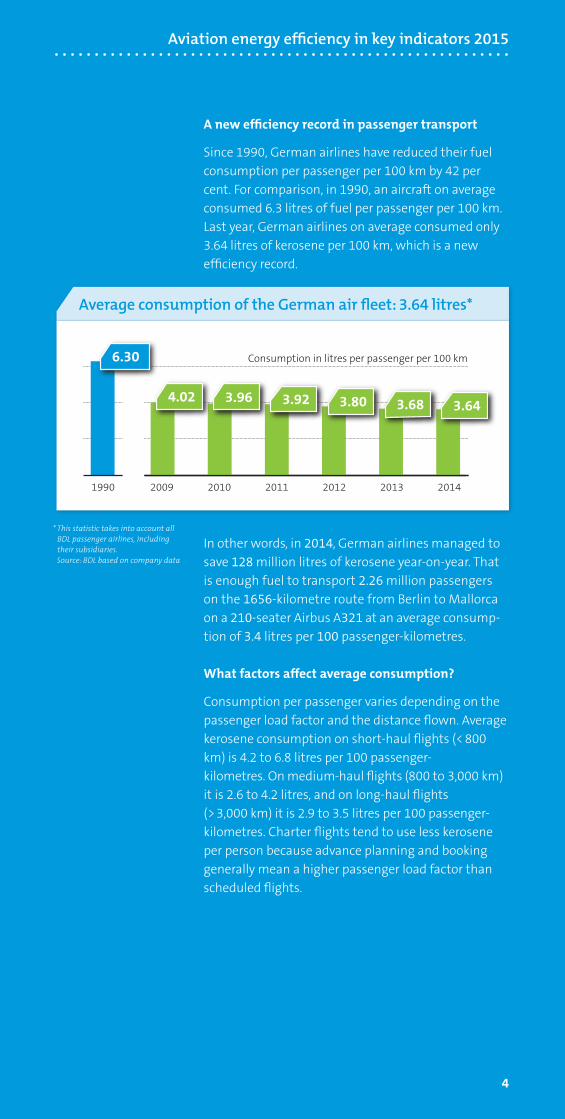
Since 1990, German airlines have reduced their fuel consumption per passenger per 100 km by 42 per cent. For comparison, in 1990, an aircraft on average consumed 6.3 litres of fuel per passenger per 100 km. Last year, German airlines on average consumed only 3.64 litres of kerosene per 100 km, which is a new efficiency record.
In other words, in 2014, German airlines managed to save 128 million litres of kerosene year-on-year. That is enough fuel to transport 2.26 million passengers on the 1656-kilometre route from Berlin to Mallorca on a 210-seater Airbus A321 at an average consump- tion of 3.4 litres per 100 passenger-kilometres.
What factors affect average consumption?
Consumption per passenger varies depending on the passenger load factor and the distance flown. Average kerosene consumption on short-haul flights (< 800 km) is 4.2 to 6.8 litres per 100 passenger- kilometres. On medium-haul flights (800 to 3,000 km) it is 2.6 to 4.2 litres, and on long-haul flights (> 3,000 km) it is 2.9 to 3.5 litres per 100 passenger-kilometres. Charter flights tend to use less kerosene per person because advance planning and booking generally mean a higher passenger load factor than scheduled flights.
* This statistic takes into account all BDL passenger airlines, including their subsidiaries. Source: BDL based on company data
Average consumption of the German air fleet: 3.64 litres*
1990 20102009 2011 2012 2013 2014
Consumption in litres per passenger per 100 km
3.68 3.64
6.30
3.964.02 3.92 3.80
Aviation energy efficiency in key indicators 2015

5
More freight at lower consumption rates
German cargo aircraft are also more efficient than ever: expressed in terms of passengers, Lufthansa Cargo’s freighter fleet only uses 1.83 litres per 100 kilometers. This figure is based on the assumption that a passenger including luggage weighs 100 kg on average. A freighter uses less fuel per 100 kilo-metres than a passenger aircraft because the space available can be utilised more efficiently. Since 2005, the freighter fleet has reduced its specific energy consumption by 16 per cent; a trend that the Boeing 777F cargo aircraft continues because it is 17 per cent more efficient.
Energy efficiency in aviation is self-driven by the industry
It costs more than 100,000 euros to refuel an Airbus A380. Kerosene accounts for around one third of an airline’s operating costs. This explains why the aviation industry achieves fuel reductions without government-imposed targets or other regulatory measures.
Source: International Air Transport Association (IATA)
Airline operating costs
Fuel costIncl. wages/salaries, taxes, maintenance, charges
1/32/3
* 100 kg = 1 passenger incl. luggage Source: Lufthansa Cargo
Aviation energy efficiency in key indicators 2015
Average consumption of the freighter fleet: 1.83 litres
2014201320122011201020092008200720062005
100
200
300
400
500
1.0
2.0
3.0
462549
1.832.18
CO2 g /tkm
l Kerosene/100 kg* and 100 km

6
Falling: CO2 emissions on domestic German routes
In 2013, air travel within Germany accounted for 0.25 per cent of total CO
2 emissions in Germany.
This represents an 16 per cent reduction to 2.1 million tonnes of CO
2 from the 1990 level, even
though air traffic within Germany grew by 57 per cent in the same period.
Flight routes within Germany are important to business travellers
A representative survey by the ifo Institute found that flight routes within Germany are very important to 40 per cent of companies in Germany. The average distance flown by passengers in Germany in 2014 was 435 kilometres. This is roughly the equivalent of flying from Hamburg to Nuremberg. While the round trip takes two hours and twenty minutes by plane, it would take nine hours by train. Of course,
one must also factor in the time it takes to travel to and from the airport, plus check-in times, but still it is possible to complete the business trip in one day without over-time or overnight stay if one travels by plane. The very fact that there is demand among companies for flights within Germany even though they generally cost more than train travel testifies to their importance for this customer group.
CO2 emissions and traffic growth between 1990 and 2013
CO2 emissions Passenger-kilometres
Domestic German flights
-16 % +57 %
Source: BDL based on data on air transport services from destatis and CO
2 emissions data from the
German Federal Environment Agency (UBA)
Journey time
Nuremberg
Hamburg
Round trip*
* Travel/flight time only
2015 key indicators for CO2 emissions from air traffic

7
Global air traffic is down as a percentage of global CO
2 emissions
On the global scale, the aviation industry has also increased its energy efficiency, preventing the emission of more than five billion tonnes of carbon dioxide since 1990, which is roughly equivalent of the annual CO
2 emissions in the USA. Not only that,
but despite the on-going substantial growth in air travel, the share of global CO
2 emissions caused by
aviation has been falling for years. In 2012 the figure was 2.42 per cent. For comparison, it was 2.81 per cent in 2000.
The reason is that absolute CO2 emissions from air
transport are growing at a lower rate than emissions from other sectors, one factor being increasingly efficient flights. For example, CO
2 emissions from
electricity and heat generation rose by 62 per cent between 2000 and 2012. Air travel emissions increased by only 15 per cent in the same period.
* Measured against CO2 emissions
from burning fossil fuels Source: International Energy Agency (IEA) 2014
Source: International Energy Agency (IEA) 2014, data for 2012
2015 key indicators for CO2 emissions from air traffic
CO2 emissions from burning fossil fuels
2.42 % Aviation
16.93% Road
2.40% Shipping0.89% Other TransportIndustrie
Residential
Other Sectors
Electricity/heat
23%
9%20%
6%
42 %
Trend in global CO2 emissions*
2000 2012
10,000
20,000
30,000 Electricity/heat■
Residential■
Industry■
Other sectors ■
Aviation■
Transport■
Million tonnes of CO2
2.42%2.81%

8
Carbon footprint at German airports
The German Airports Association (ADV) together with airports developed a climate protection strategy. CO
2 emissions from airport operation are assessed for
15 airports on a regular basis. Measurements take into account the heating of the building, ground handling operations as well as aircraft emissions on take-off, landing and when on the ground. The CO
2
measurements for German airports are divided into three categories (called scopes) in line with the Greenhouse Gas Protocol.
Between 2010 and 2013, the airports managed to reduce their specific CO
2 emissions for Scopes 1 and
2 by more than twelve per cent, to 2.72 kg of CO2 per
transport unit. This is primarily due to measures falling under Scope 1, including the optimisation of ground operations and the use of innovative tech-nologies to run buildings and installations, such as modern heating controls and the use of alternative vehicle propulsion systems.
* 1 TU = 1 transport unit = 1 passenger incl. luggage or 100 kg cargo; values refer to Scopes 1 and 2 Source: German Airport Association (ADV)
Source: Munich Airport
Specific CO2 emissions from German airports
1.0
2.0
3.0
2010 2013
3.112.72
kg CO2/TU*
–12.54%
Airport carbon footprint
Scope 1 Direct emissions from energy production and transport
13%
4%
83%
Scope 3 Indirect emissions as a consequence of the airport’s activities
Scope 2 Indirect emissions from purchased energy
BHKW
2015 key indicators for CO2 emissions from air traffic

9
Objectives and strategy
Sector targets and four-pillar strategy
Airlines, aircraft manufacturers and airports worldwide agreed on specific climate protection targets as early as 2009: up to 2020, to increase fuel efficiency by approximately 1.5 per cent per year; from 2020 onwards, to achieve carbon-neutral growth; by 2050, to reduce aviation’s net CO
2 emissions by 50 per cent compared to
2005 levels.
The four-pillar strategy as a road map
The aviation sector’s global climate protection measures are based upon a four-pillar strategy agreed by the international aviation sector in 2007.
■■ Firstly, aircraft and engine manufacturers, in particular, are driving forward technical innovations in aircraft and energy design. In addition, the use of sustainable alternative fuels is being increased.
■■ Secondly, airlines, air traffic control and airports are increasing the efficiency of their operations
– ranging from flight planning, flight procedures and efficient ground operations through to energy supply.
■■ Thirdly, governments are being called upon to ensure an efficient and sustainable infrastructure, both on the ground and in the air. This includes extending airports in line with demand as well as establishing an efficient single European airspace
– the Single European Sky.
■■ Fourthly, market-based measures can facilitate carbon-neutral growth. These measures must be applied to the aviation sector on a global scale to avoid distorting competition. They also must allow an easy implementation. Carbon-neutral growth within European aviation has already been achieved with the advent of EU emissions trading in 2012.
10
Objectives and strategy
Diverse measures to achieve reduction targets
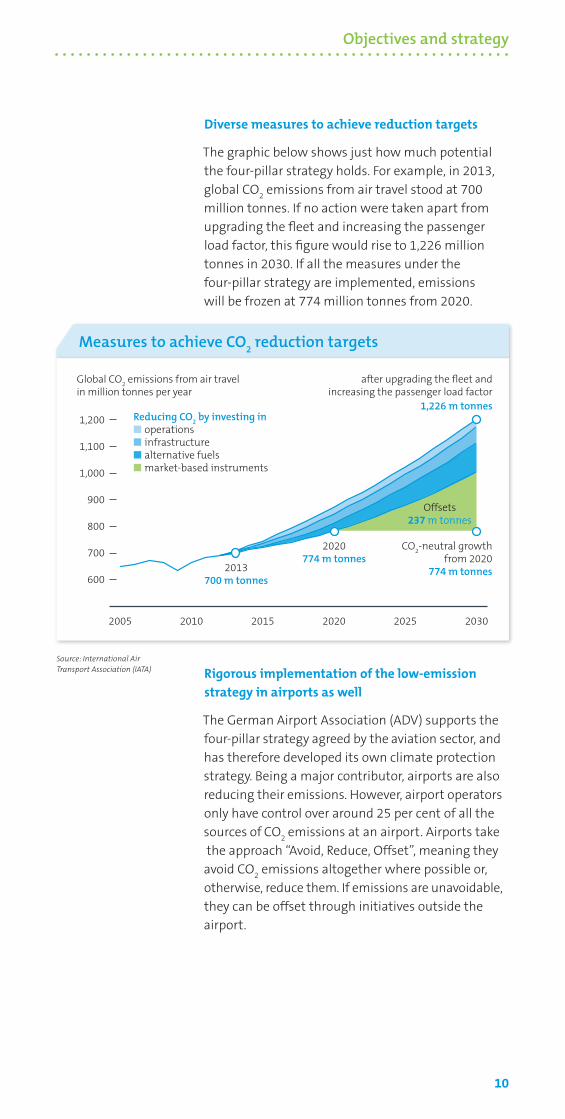
The graphic below shows just how much potential the four-pillar strategy holds. For example, in 2013, global CO
2 emissions from air travel stood at 700
million tonnes. If no action were taken apart from upgrading the fleet and increasing the passenger load factor, this figure would rise to 1,226 million tonnes in 2030. If all the measures under the four-pillar strategy are implemented, emissions will be frozen at 774 million tonnes from 2020.
Rigorous implementation of the low-emission strategy in airports as well
The German Airport Association (ADV) supports the four-pillar strategy agreed by the aviation sector, and has therefore developed its own climate protection strategy. Being a major contributor, airports are also reducing their emissions. However, airport operators only have control over around 25 per cent of all the sources of CO
2 emissions at an airport. Airports take
the approach “Avoid, Reduce, Offset”, meaning they avoid CO
2 emissions altogether where possible or,
otherwise, reduce them. If emissions are unavoidable, they can be offset through initiatives outside the airport.
Source: International Air Transport Association (IATA)
Measures to achieve CO2 reduction targets
1,200
1,100
1,000
900
800
700
600
Global CO2 emissions from air travel
in million tonnes per year
Offsets237 m tonnes
after upgrading the fleet and increasing the passenger load factor
2005 2010 2015 2020 2025 2030
Reducing CO2 by investing in
■ operations■ infrastructure■ alternative fuels■ market-based instruments
2013700 m tonnes
2020774 m tonnes
CO2-neutral growth
from 2020774 m tonnes
1,226 m tonnes
11
Measure: technical innovations
32-billion-euro investment in energy efficiency
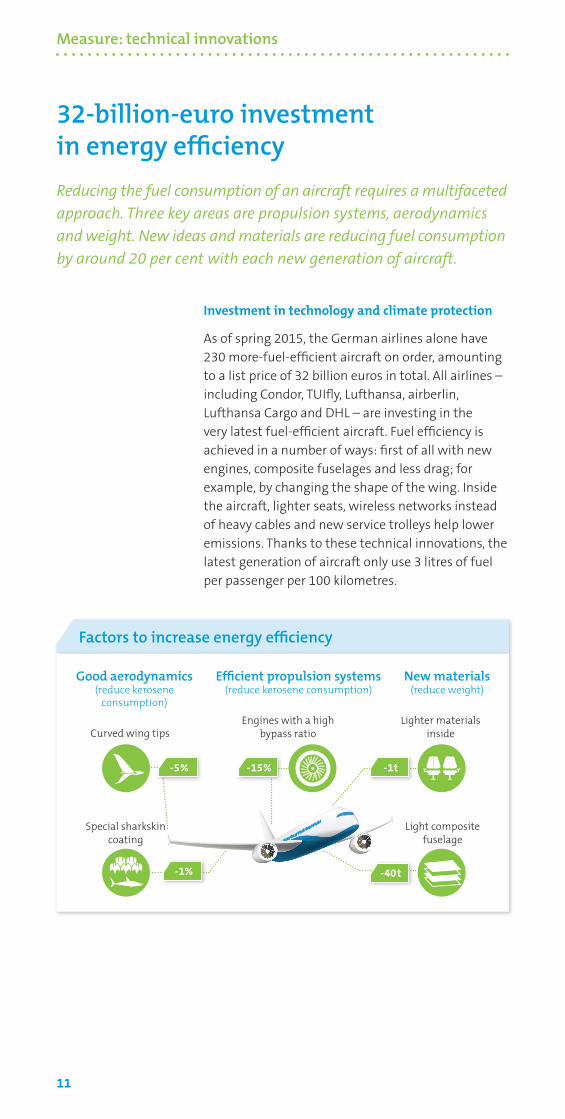
Reducing the fuel consumption of an aircraft requires a multifaceted approach. Three key areas are propulsion systems, aerodynamics and weight. New ideas and materials are reducing fuel consumption by around 20 per cent with each new generation of aircraft.
Investment in technology and climate protection
As of spring 2015, the German airlines alone have 230 more-fuel-efficient aircraft on order, amounting to a list price of 32 billion euros in total. All airlines – including Condor, TUIfly, Lufthansa, airberlin, Lufthansa Cargo and DHL – are investing in the very latest fuel-efficient aircraft. Fuel efficiency is achieved in a number of ways: first of all with new engines, composite fuselages and less drag; for example, by changing the shape of the wing. Inside the aircraft, lighter seats, wireless networks instead of heavy cables and new service trolleys help lower emissions. Thanks to these technical innovations, the latest generation of aircraft only use 3 litres of fuel per passenger per 100 kilometres.
Factors to increase energy efficiency
Efficient propulsion systems(reduce kerosene consumption)
Good aerodynamics(reduce kerosene
consumption)
New materials(reduce weight)
Curved wing tipsLighter materials
inside
Light composite fuselage
Engines with a high bypass ratio
Special sharkskin coating
-5% -1t
-40t
-15%
-1%

12
Measure: technical innovations
Split Scimitar Winglets
Drag can be reduced not only in the design of new aircraft, but also in existing fleet aircraft. This improves aerodynamics. The very latest Split Scimitar Winglets can reduce fuel consumption per aircraft by up to two per cent compared to previous winglets. The curved wing tips are modelled on the shape of the condor’s wing.
Carbon engine components
Carbon fibre is many times more resistant than titanium and only half the weight of steel. For this reason, Rolls-Royce is using this material to develop its latest generation of engines, with the result that each engine will weigh around 700 kilos less. In fact, today carbon is used for many components in the very latest generation of aircraft.
Imitating the shark
One reason why sharks can swim so fast is that the grooved texture of their skin prevents water turbulence and the resulting drag. Lufthansa, Airbus and the Fraunhofer Institute for Manufacturing Technology and Advanced Materials are currently studying the fluid dynamics of sharkskin mockups on aircraft. Their goal for the future is to come up with an automated process of applying an artificial sharkskin to the surfaces of an aircraft in order to reduce energy consumption by one per cent.
Lower weight equals greater climate protection
In a project entitled the “Clear-out”, every single MD-11F freighter in the Lufthansa Cargo fleet was stripped of unnecessary extra weight. Now each plane weighs around 35 kilos less at take-off. In the Clear-out, objects that did not have to be on board were removed and old equipment was replaced by lighter units. In total, this measure reduced CO
2 by
around 250 tonnes at Lufthansa.
13
Measure: energy-optimised operation
Higher passenger load factor, optimised flights
Energy efficiency can also be increased on the operations side. For example, airlines are trying to increase the passenger load factor and improve route management in conjunction with air traffic control.
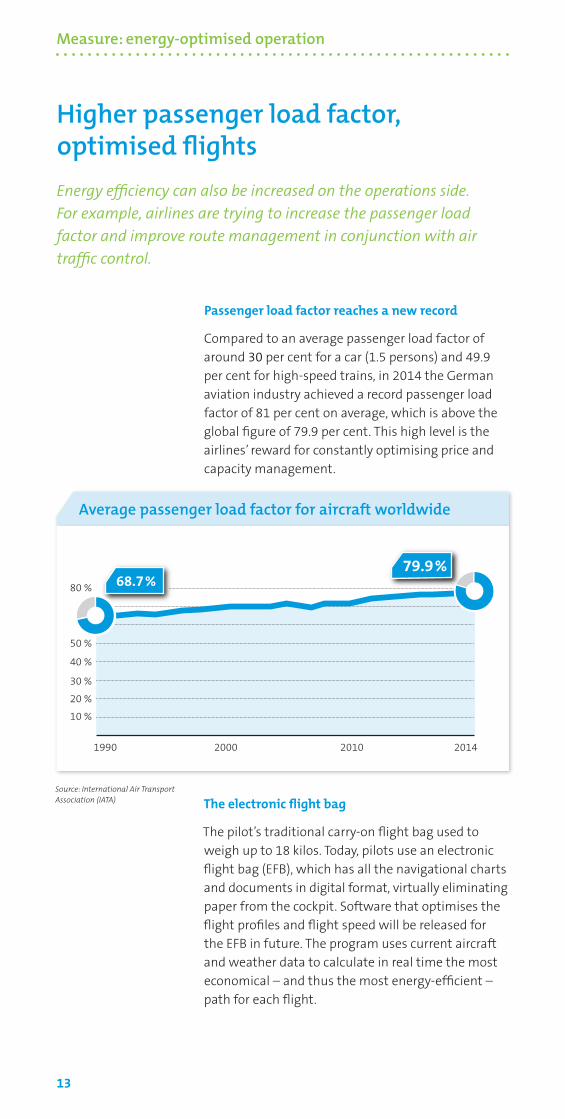
Passenger load factor reaches a new record
Compared to an average passenger load factor of around 30 per cent for a car (1.5 persons) and 49.9 per cent for high-speed trains, in 2014 the German aviation industry achieved a record passenger load factor of 81 per cent on average, which is above the global figure of 79.9 per cent. This high level is the airlines’ reward for constantly optimising price and capacity management.
The electronic flight bag
The pilot’s traditional carry-on flight bag used to weigh up to 18 kilos. Today, pilots use an electronic flight bag (EFB), which has all the navigational charts and documents in digital format, virtually eliminating paper from the cockpit. Software that optimises the flight profiles and flight speed will be released for the EFB in future. The program uses current aircraft and weather data to calculate in real time the most economical – and thus the most energy-efficient – path for each flight.
Source: International Air Transport Association (IATA)
Average passenger load factor for aircraft worldwide
1990 2000 2010 2014
10 %
20 %
30 %
40 %
50 %
80 % 68.7%79.9%
14
Measure: energy-optimised operation
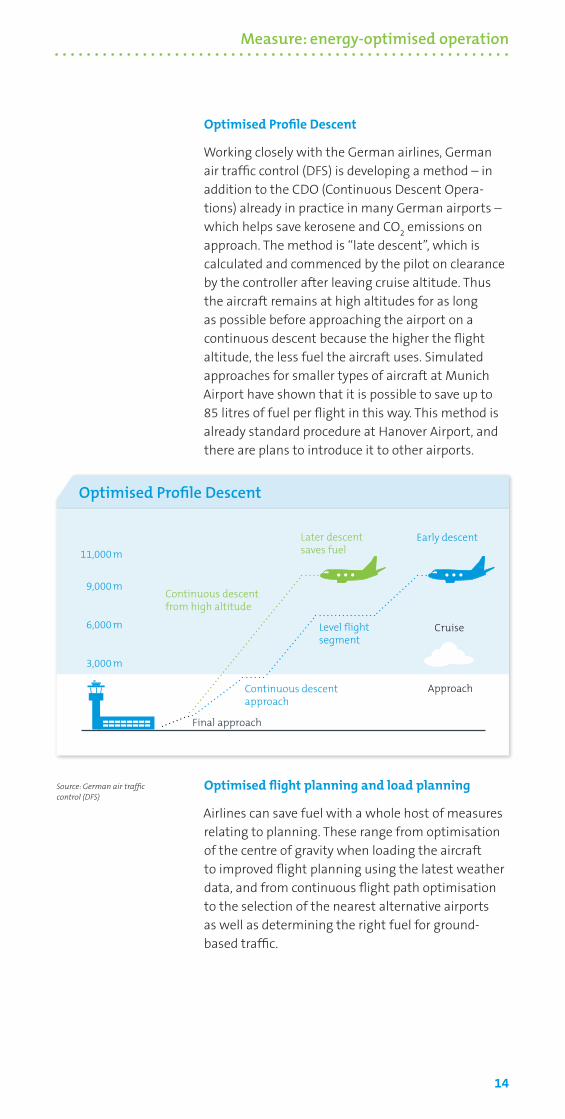
Optimised Profile Descent
Working closely with the German airlines, German air traffic control (DFS) is developing a method – in addition to the CDO (Continuous Descent Opera-tions) already in practice in many German airports – which helps save kerosene and CO
2 emissions on
approach. The method is “late descent”, which is calculated and commenced by the pilot on clearance by the controller after leaving cruise altitude. Thus the aircraft remains at high altitudes for as long as possible before approaching the airport on a continuous descent because the higher the flight altitude, the less fuel the aircraft uses. Simulated approaches for smaller types of aircraft at Munich Airport have shown that it is possible to save up to 85 litres of fuel per flight in this way. This method is already standard procedure at Hanover Airport, and there are plans to introduce it to other airports.
Optimised flight planning and load planning
Airlines can save fuel with a whole host of measures relating to planning. These range from optimisation of the centre of gravity when loading the aircraft to improved flight planning using the latest weather data, and from continuous flight path optimisation to the selection of the nearest alternative airports as well as determining the right fuel for ground-based traffic.
Source: German air traffic control (DFS)
Optimised Profile Descent
11,000 m
9,000 m
6,000 m
3,000 m
Approach
CruiseLevel flight segment
Continuous descent approach
Final approach
Continuous descent from high altitude
Later descent saves fuel
Early descent

15
Measure: efficient infrastructure
Many measures, one goal
In an effort to reduce CO2 emissions, many measures are being
developed, trialled and implemented. These range from the small details – for example, how the aircraft gets to the runway – to the bigger picture, like the entire European airspace.
TaxiBot replaces engine for taxiing
TaxiBot was tested in 2013 for the first time at Frankfurt Airport. It is a tug that tows the aircraft from the gate to the runway and is steered by the pilot. The engines remain off for the journey. A Boeing 737 towed four kilometres will save 250 litres of kerosene. If TaxiBot passes all the other tests, this technology could be applied to many other types of aircraft in future.
“APU Sheriff” increases efficiency
For a number of years now, Auxiliary Power Units (APUs) may no longer be used for power supply at Hamburg Airport once the aircraft is in position. Instead, the planes are supplied with energy and pre-conditioned air (PCA) from Ground Power Units. To check that all aircraft comply with this noise- and fuel-reducing measure, the position of “APU Sheriff” was created. Switching off an APU saves 100 litres of kerosene per hour.
Source: Lufthansa Technik, Ricardo
TaxiBot is steered by the pilot
1 | Nose gear moves forward
2 | Clamps extend
3 | Nose gear is encircled
4 | Clamps retract
16
Measure: efficient infrastructure
“Green Satellite” reduces CO2 emissions
Munich Airport, together with Lufthansa, is building a new terminal, designed as a “Green Satellite”. The CO
2 emissions from this building will be 40 per
cent lower than the two existing terminals. Important elements of the concept include the use of modern air-conditioning, energy-efficient lighting and insulating interior components. It is planned to provide PCA technology at the aircraft parking positions beside the terminal.
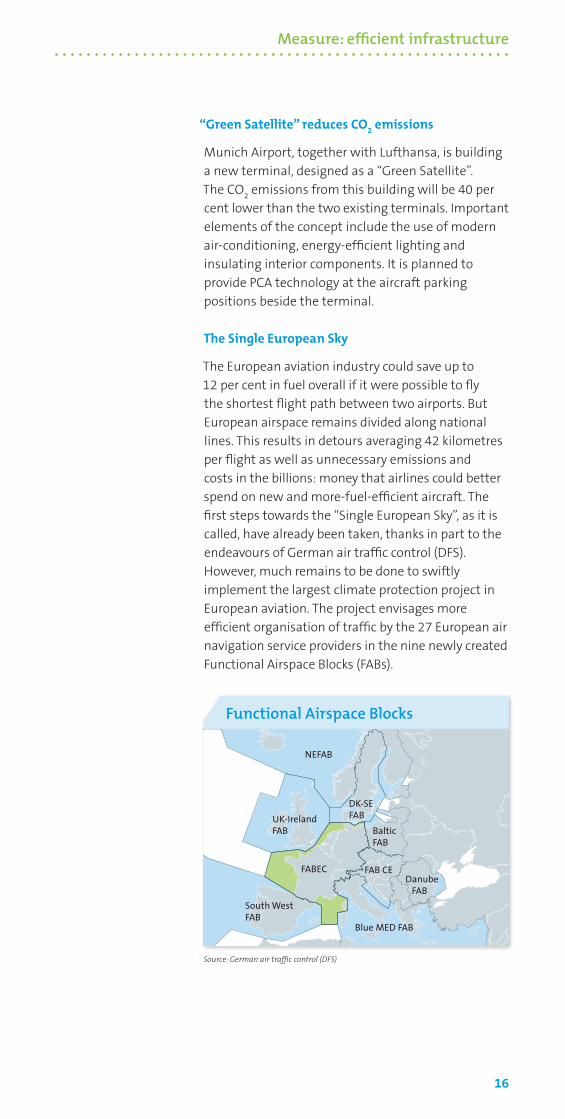
The Single European Sky
The European aviation industry could save up to 12 per cent in fuel overall if it were possible to fly the shortest flight path between two airports. But European airspace remains divided along national lines. This results in detours averaging 42 kilometres per flight as well as unnecessary emissions and costs in the billions: money that airlines could better spend on new and more-fuel-efficient aircraft. The first steps towards the “Single European Sky”, as it is called, have already been taken, thanks in part to the endeavours of German air traffic control (DFS). However, much remains to be done to swiftly implement the largest climate protection project in European aviation. The project envisages more efficient organisation of traffic by the 27 European air navigation service providers in the nine newly created Functional Airspace Blocks (FABs).
Functional Airspace Blocks
NEFAB
UK-IrelandFAB
FABEC
South West FAB
Blue MED FAB
Danube FAB
DK-SEFAB
BalticFAB
FAB CE
Source: German air traffic control (DFS)

17
Measure: alternative propulsion systems and aviation fuels
Innovative concepts for sustainable aviation
Alternative fuels and electrical energy are playing an ever-increasing role in air transport. While alternative fuels like biokerosene are already being used in conventional engines, electric motors require completely new aircraft concepts.
Electric motors facilitate new aircraft concepts
The first prototypes like the DLR Antares and the e-Genius from the University of Stuttgart show that it is possible to fly using electrical propulsion alone. The great advantage of the electric motor is that, unlike conventional engines, energy can be generated at one single point in the body of the aircraft and supplied from there to multiple propellers. For example, the electricity required could be produced by a turbine, a fuel cell or a battery. The greater the power-to-weight ratio of the electricity generator, the more successful these technologies will be in aviation. Experts from Airbus aim to develop a prototype of a hybrid regional aircraft with up to 90 seats by 2030.
Simplified illustration of overall weight and overall efficiency Source: Association of German Engineers (VDI)
Efficiency (η) and weight of propulsion systems
Fuel
E-motor Electricity
E-motor
Piston engine
Hydrogen ElectricityFuel cell
▲
▲ ▲ ▲
▲
η = 35%
η = 50%
η = 90%
H2
65 kg
185 kg
590 kg

18
Measure: alternative propulsion systems and aviation fuels
Kerosene from the sun, wind, hydrogen, CO
2 and algae
Researchers have for the first time succeeded in producing aviation fuel from solar energy, water vapour and carbon dioxide. Alternatively, other renewables can be used; for example, wind power in conjunction with electrolysis to generate hydrogen. The “Aufwind” project, in which Airbus is involved, takes a different approach. It uses algae as the raw material to produce biofuel. But researchers are really just starting to develop commercially viable processes.
Market entry has begun
While the examples show that there are more options in the long-term, alternative fuels are already entering the market: the Dutch airline KLM operates weekly flights to the Caribbean that use some alter-native fuels. In Germany, too, science and industry are working under the umbrella of the Aviation Initiative for Renewable Energy in Germany (aireg) to introduce sustainably produced fuels in the near future. Of all the alternative fuels, vegetable oils have the best chance of making any inroads into the market and ushering in a new era in transport. The target is ten per cent from 2025.
Kerosene from the sun, wind, hydrogen, CO2 and algae
KeroseneWind power Electrolysis Fischer-Tropsch process
Solar energy Solar reactor Fischer-Tropsch process Kerosene
KeroseneBioenergy (algae) Bioreactor HEFA refinery
▲ ▲ ▲
▲ ▲ ▲
▲ ▲ ▲
CO2
CO2
CO

19
Measure: emissions trading
Emissions trading facilitates carbon-neutral growth in air transport
The aviation industry in the European Union joined the emissions trading system in 2012. Under this system, the CO
2 emissions from
air transport in Europe are capped at 2005 levels. If air traffic increases, additional certificates must be purchased to cover the CO
2 emissions arising from growth.
The European aviation industry joined emissions trading in 2012. A certificate must be held for every tonne of CO
2 an aircraft emits. An airline with very
energy-efficient aircraft has to buy fewer emissions certificates than an airline with aircraft that emit relatively more CO
2. The airlines buy the emissions
certificates through traders, for example, from large utilities who have saved CO
2. Since the total number
of certificates is capped, so are overall CO2 emissions,
too. Thus growth in air transport in Europe is already carbon-neutral.
However, an insular emissions trading system limited to Europe is a heavier burden on European companies than their counterparts outside Europe. Only an international form of emissions trading in aviation does not distort competition. For this reason, the International Civil Aviation Organization (ICAO) is currently developing a global market-based system. A final decision is expected in 2016. This system is set to be in use from 2020.
Carbon-neutral growth thanks to emissions trading
2005 2010 2015 2020
Carbon credits to be purchased by airlines
Capping of CO2 emissions
in European aviation
Assigned carbon credits
Assumption: 3 per cent annual growth in European air transport
20
Measure: research on climate impact
Commercial aircraft used for research on climate impact
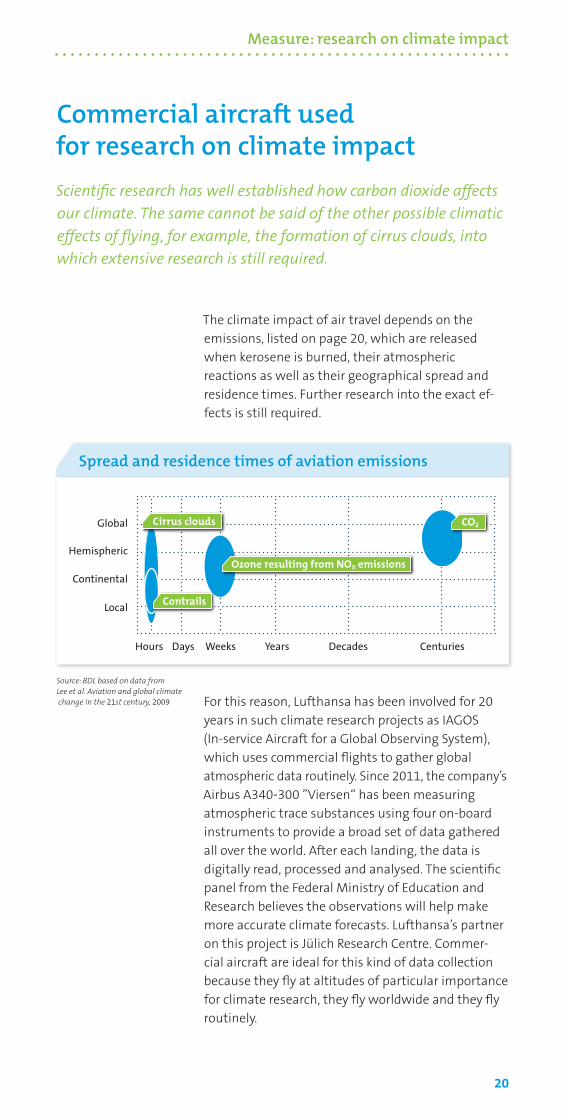
Scientific research has well established how carbon dioxide affects our climate. The same cannot be said of the other possible climatic effects of flying, for example, the formation of cirrus clouds, into which extensive research is still required.
The climate impact of air travel depends on the emissions, listed on page 20, which are released when kerosene is burned, their atmospheric reactions as well as their geographical spread and residence times. Further research into the exact ef-fects is still required.
For this reason, Lufthansa has been involved for 20 years in such climate research projects as IAGOS (In-service Aircraft for a Global Observing System), which uses commercial flights to gather global atmospheric data routinely. Since 2011, the company’s Airbus A340-300 ”Viersen“ has been measuring atmospheric trace substances using four on-board instruments to provide a broad set of data gathered all over the world. After each landing, the data is digitally read, processed and analysed. The scientific panel from the Federal Ministry of Education and Research believes the observations will help make more accurate climate forecasts. Lufthansa’s partner on this project is Jülich Research Centre. Commer-cial aircraft are ideal for this kind of data collection because they fly at altitudes of particular importance for climate research, they fly worldwide and they fly routinely.
Spread and residence times of aviation emissions
Local
Hours Days Weeks Years Decades Centuries
Continental
Hemispheric
Global CO2
Ozone resulting from NOX emissions
Cirrus clouds
Contrails
Source: BDL based on data from Lee et al. Aviation and global climate change in the 21st century, 2009
21
Conversion factors
Emissions
1 kg kerosene emits 3.15 kg CO2
4 litres per passenger per 100 km is equivalent to approx. 100 grams of CO
2 per passenger per kilometre
0.2 litres per tonne per 100 km is equivalent to approx. 500 grams of CO
2 per tkm
Energy density
1 kg kerosene = 42.8 MJ (megajoules) 1 MJ = 0.023 kg kerosene
1 l kerosene = 34.24 MJ 1 MJ = 0.029 l kerosene
Mass density
1 l kerosene = 0.8 kg kerosene 1 kg kerosene = 1.25 l kerosene
Volume
1 l = 0.264 US gal lqd (US gallon) 1 US gal lqd = 3.785 l
1 l = 0.00629 bl (barrel) 1 bl = 159 l
Freight and passengers
1 passenger incl. luggage is equivalent to 100 kg = 1 TU (transport unit)
1 tonne of cargo is equivalent to ten passengers incl. luggage = 10 TU (transport unit)
Entfernung
1 m = 3.28 ft (feet) 1 ft = 0.3048 m
1 km = 0.62 mi (mile) 1 mi = 1.61 km
1 km = 0.54 NM (nautical mile) 1 NM = 1.852 km 1 NM = 1 sm (sea mile)
Speed
100 km/h = 54 kn (knots) 1 kn = 1 NM/h = 1.852 km/h
Sonstige
Megajoule: 1 MJ = 1,000,000 J = 106 J Petajoule: 1 PJ = 1,000,000,000,000,000 J = 1015 J
Source: BDL based on data from the German Federal Environment Agency (UBA)
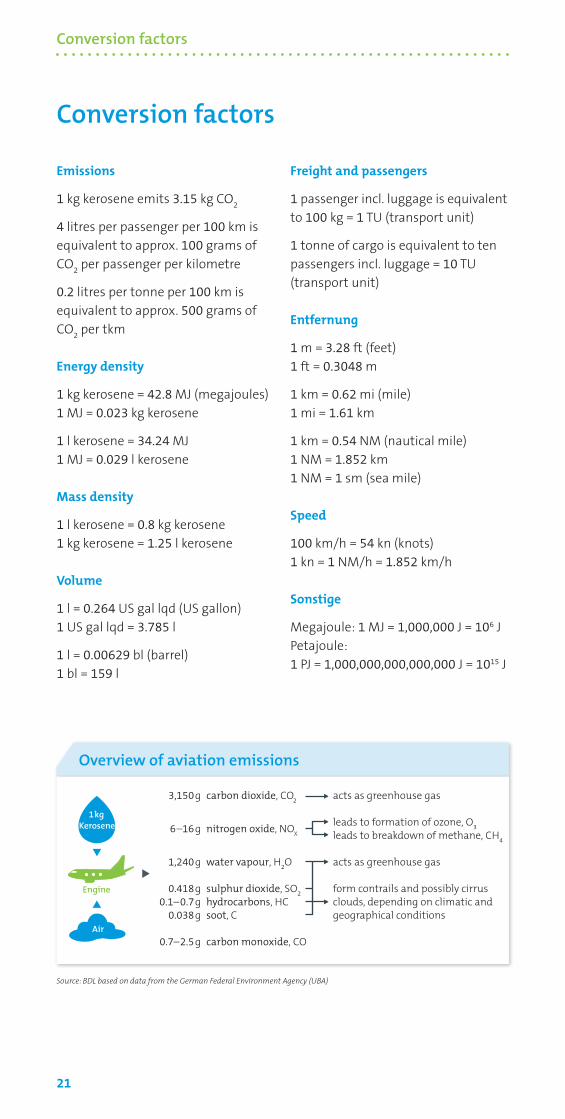
Overview of aviation emissions
3,150 g carbon dioxide, CO2
6–16 g nitrogen oxide, NOX
1,240 g water vapour, H2O
0.418 g sulphur dioxide, SO2
0.1–0.7 g hydrocarbons, HC 0.038 g soot, C
0.7–2.5 g carbon monoxide, CO
acts as greenhouse gas
leads to formation of ozone, O3
leads to breakdown of methane, CH4
acts as greenhouse gas
form contrails and possibly cirrus clouds, depending on climatic and geographical conditions
Air
Engine
▲
▲
▲
1kgKerosene
Conversion factors

Publication details
Published by
BDL – Bundesverband der
Deutschen Luftverkehrswirtschaft e. V.
Haus der Luftfahrt
Friedrichstraße 79
10117 Berlin, Germany
Telephone: +49 (0)30 520077-0
www.bdl.aero
V. i. S. d. P. (Responsible for the content as defined by German Press Law)
Matthias von Randow
Managing Director
Editorial board
Uta Maria Pfeiffer
Head of Sustainability
Date of publication
September 2015
Production and design
GDE | Kommunikation gestalten
www.gde.de
© BDL 2015

Contact
Uta Maria Pfeiffer Head of Sustainability
+49 (0)30 520077-140 [email protected]
Carola Scheffler Press Officer
+49 (0)30 520077-116 [email protected]


