Remote Sensing and Statistical
Analysis of Fracture Populations
Around Lake Thingvallavatn, SW Iceland
Johan Oxenstierna
This study aims at a description and statistical analysis of tectonic and
magmatic fractures in the Western Volcanic Zone (WVZ) on Iceland. Two
fracture populations are studied with respect to their distance to the Hengill
volcano: The southern area is between 0-10 kilometers from the volcano and
the northern area is between 16-25 kilometers from the volcano. The
description and analysis of fractures is carried out separately for the two
areas as well as for the two areas together to test different mapping
procedures, statistical methods and the influence of the volcano on the
properties of the fractures.
There are various reasons for considering this an important study: Firstly, this
is not an extensively researched field and there are many unanswered
methodological questions on how to map and describe the fractures. In this
study, problems such as how maps are stitched and georeferenced, how
fractures are divided into segments and mapped in respect to topography, are
discussed. The potential errors caused by these methodological problems are
concluded to be large enough to significantly affect statistical tests analyzing
fracture populations.
In the analysis part, the properties of the fracture populations are studied
using Kolmogorov Smirnov and χ2 goodness-of-fit tests, scatter-plots, simple
count and ratios among other methods. It was found that the fracture
populations follow distributions that are not easily defined, but that they are
of the same and quantifiable type. With more data their common distribution
could therefore be modeled, and the factor by which the Hengill volcano
affects the strike of fractures per distance unit from the volcano could be
calculated. It was also found that magmatic fractures are formed in a similar,
but not necessarily the same stress-field as tectonic fractures. Therefore
change in magma pressure might change the local stress regime around
magmatic fractures, affecting their strike.
Uppsala universitet, Institutionen för geovetenskaper
Kandidatexamen i Geovetenskap, 180 hp
Självständigt arbete i geovetenskap, 15 hp
Tryckt hos Institutionen för geovetenskaper
Geotryckeriet, Uppsala universitet, Uppsala, 2012.
Självständigt arbete Nr 37
Remote Sensing and Statistical
Analysis of Fracture Populations
Around Lake Thingvallavatn,
SW Iceland
Johan Oxenstierna

Självständigt arbete Nr 37
Remote Sensing and Statistical
Analysis of Fracture Populations
Around Lake Thingvallavatn,
SW Iceland
Johan Oxenstierna


1
Contents Abstract ...................................................................................................................................... 2
Introduction ................................................................................................................................ 3
2. Geological Setting .................................................................................................................. 4
2.1 Iceland .............................................................................................................................. 4
2.2 The Western Volcanic Zone ............................................................................................. 6
2.3 The Thingvallavatn Area .................................................................................................. 6
3. Methods ................................................................................................................................ 11
3.1 Mapping .......................................................................................................................... 12
3.2 Statistical analysis ........................................................................................................... 14
4. Results .................................................................................................................................. 18
4.1 Mapping .......................................................................................................................... 18
4.2 Statistical analysis ........................................................................................................... 19
Frequency and age ............................................................................................................ 19
Frequency of strike ........................................................................................................... 20
Frequency of lengths ......................................................................................................... 25
Length and strike ............................................................................................................... 25
Average deviation of strike from the mean strike and distance to the volcano ................ 26
Length and elevation ......................................................................................................... 27
Elevation of fractures and the distance to the volcano...................................................... 29
Spacing of tectonic fractures and the distance to the volcano .......................................... 30
5. Discussion ............................................................................................................................ 33
5.1 Mapping .......................................................................................................................... 33
5.2 Statistical analysis ........................................................................................................... 34
6. Conclusions .......................................................................................................................... 39
7. References ............................................................................................................................ 40
8. Appendix .............................................................................................................................. 42
Appendix 1: ....................................................................................................................... 42
Appendix 2: ....................................................................................................................... 42

2
Abstract
This study aims at a description and statistical analysis of tectonic and
magmatic fractures in the Western Volcanic Zone (WVZ) on Iceland. Two
fracture populations are studied with respect to their distance to the Hengill
volcano: The southern area is between 0-10 kilometers from the volcano and
the northern area is between 16-25 kilometers from the volcano. The
description and analysis of fractures is carried out separately for the two
areas as well as for the two areas together to test different mapping
procedures, statistical methods and the influence of the volcano on the
properties of the fractures.
There are various reasons for considering this an important study: Firstly,
this is not an extensively researched field and there are many unanswered
methodological questions on how to map and describe the fractures. In this
study, problems such as how maps are stitched and georeferenced, how
fractures are divided into segments and mapped in respect to topography,
are discussed. The potential errors caused by these methodological problems
are concluded to be large enough to significantly affect statistical tests
analyzing fracture populations.
In the analysis part, the properties of the fracture populations are studied
using Kolmogorov Smirnov and χ2 goodness-of-fit tests, scatter-plots,
simple count and ratios among other methods. It was found that the fracture
populations follow distributions that are not easily defined, but that they are
of the same and quantifiable type. With more data their common
distribution could therefore be modeled, and the factor by which the Hengill
volcano affects the strike of fractures per distance unit from the volcano
could be calculated. It was also found that magmatic fractures are formed in
a similar, but not necessarily the same stress-field as tectonic fractures.
Therefore change in magma pressure might change the local stress regime
around magmatic fractures, affecting their strike.

3
Introduction
This study aims at a description and statistical analysis of tectonic and magmatic fractures in
the Western Volcanic Zone (WVZ) on Iceland. There are various reasons for considering this
an important study: Firstly there is the methodological problem of (1) how to map and
describe the fractures and (2) how to analyze them. Furthermore, there is the geological side
with the question of why the fractures are distributed in the way they are. This question can
only be satisfactorily discussed after the methodological issues have been taken into account.
The aim here is thus to test various physical variables of the fractures against each other to get
a better understanding of how they form and develop in rifting zones.
The study area is located around 20 kilometers east of Reykjavik (Iceland) and it is
subdivided into two parts, one located to the SW of Lake Thingvallavatn (southern area) and
one located to the NE of the lake (northern area). The southern area is dominated by the
Hengill volcano. The description and analysis of fractures was carried out separately for the
two areas as well as for the two areas together to test different mapping procedures, statistical
methods and the influence of the volcano on the properties of the fractures.
The study aims at answering the following questions:
1) Mapping: Which mapping methods are most effective when tracing fractures on aerial
photographs?
2) Statistical analysis: What are the statistical relationships between the following variables:
frequency and age, frequency and strike, frequency and length, length and strike, average
deviation of strike and distance to the central volcano, length and elevation, elevation and
the distance to the central volcano, distance between fractures and distance to the volcano
of:
-tectonic and magmatic fractures mapped in the southern study area?
-tectonic and magmatic fractures mapped in the northern study area?
-tectonic fractures mapped in the southern and the northern study areas?
Which statistical methods are most suitable to establish the nature of these relationships
and why? What can be inferred from the relationships?

4
2. Geological Setting
2.1 Iceland
Iceland is located on a large submarine platform in the north Atlantic. It has an area of
103,100 km² and reaches a maximum altitude of around 2110 meters. It consists of oceanic
basaltic crust (Weisenberger, 2010).
Iceland has formed due to two main factors, the fact that it is located on top of the Iceland
mantle plume and a Mid Oceanic Ridge (MOR) at the same time. The Mid-Atlantic ridge
started to diverge about 56-53.5 million years ago (Weisenberger, 2010). It is believed that the
first lavas came up from the crust when the Iceland plume, which is slowly moving in a
northwestern direction, coincided with that of the position of the MOR (Saemundsson, 1992).
Over the last 500 years Iceland’s volcanic activity was responsible for around a third of the
total lava produced in the world (Feldmann, 2010). Significant eruptions occur every five to
ten years, today predominantly in the southern areas, at volcanoes such as the Eyjafjallajokull
and Katla, mount Hekla and Laki. The latter was the site of the second largest basaltic lava
eruption in history with its 1783 eruption, leading to the deaths of 20-25% of the Icelandic
population and destruction of crops over large areas in Europe (Foulger, 2005).
Most of the volcanism produces basaltic lava, but large central volcanoes such as Hekla
produce more silicic lava. Another typical feature on Iceland are the volcanic fissures, which
are “linear fracture[s] on the Earth's surface through which lavas, pyroclastics, and gas are
erupted and effused” (Allaby, 1999). These fissures often have the same orientation as the
tectonic fractures of the plate margin and many eruptions. Small fissures can cluster in fissure
swarms that are up to 100 kilometers long and 10 kilometers wide (Saemundsson, 1992).
There are many different variations of eruptive types and products that depend on parameters
such as whether the volcano is on land, subglacial or submarine. One major volcanic area, for
instance, is the Grimsvötn situated under the Vatnajökull glacier, where hyaloclastite, a glassy
and tuff-like breccia, forms due to the rapid cooling of the lava under ice and water. Since the
last three million years have been dominated by glaciations, many of the lavas on Iceland
were deposited subglacially. Today Iceland´s subglacial eruptions amount to a whole 83% of
the world’s total of such eruptions, and large hyaloclastite ridges have formed in the process
(Batsford, 2010).
Based on the age of rocks, Iceland can be divided into three stratigraphic zones (Figure 1).
The Tertiary zone (bright grey) consists of flood basalts up to 10 kilometers thick (Ward,
1971). The Plio-Pleistocene zone (darker grey) is younger than three million years and
consists of flood basalts and hyaloclastites. The Upper Pleistocene-Holocene (dark grey) is
called the Neovolcanic zone, which hosts most of the active volcanoes and where most of the
present day rifting is occurring. This area makes up about one third of Iceland’s area
(Feldmann, 2010).
The volcanism on Iceland is concentrated in the three volcanic zones, The Northern, Western
and Southern. These consist of 30 volcanic systems, of which 12 are mainly comprised of
5
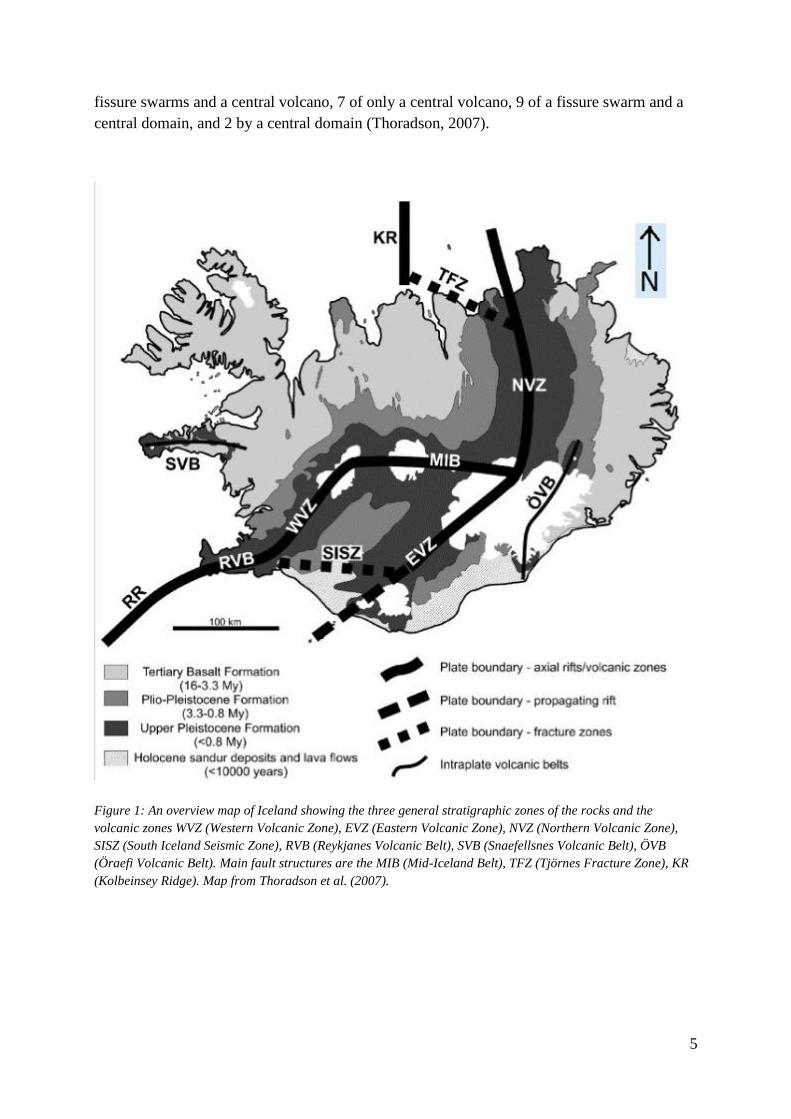
fissure swarms and a central volcano, 7 of only a central volcano, 9 of a fissure swarm and a
central domain, and 2 by a central domain (Thoradson, 2007).
Figure 1: An overview map of Iceland showing the three general stratigraphic zones of the rocks and the
volcanic zones WVZ (Western Volcanic Zone), EVZ (Eastern Volcanic Zone), NVZ (Northern Volcanic Zone),
SISZ (South Iceland Seismic Zone), RVB (Reykjanes Volcanic Belt), SVB (Snaefellsnes Volcanic Belt), ÖVB
(Öraefi Volcanic Belt). Main fault structures are the MIB (Mid-Iceland Belt), TFZ (Tjörnes Fracture Zone), KR
(Kolbeinsey Ridge). Map from Thoradson et al. (2007).

6
2.2 The Western Volcanic Zone
The Western Volcanic Zone (WVZ) is about 170 kilometers long and extends from the
western edge of the Reykjanes peninsula up to the glacier Langjökull (Figure 1). The WVZ
has provided Iceland with some of its largest crustal spreading in the last 6-7 million years,
today the spreading is dominated by the Eastern Volcanic Zone (EVZ) that started to develop
2-3 million years ago (Sigmundsson, 2006). The volcanic activity is focused in four areas: the
Hengill, Langjökull and Prestanjúkur and an area around Mount Kálfstindar. Most of the
eruptions occurred early in post-glacial times. Recent magma production has been low,
leading to a graben formation in the Lake Thingvellir area (Einarsson, 1991). It is believed
that the whole area of western Iceland is experiencing a steady decline in melting, especially
in late postglacial times. The area includes 44 observed locations where eruptions occurred
(Sinton, 2005).
The seismicity of the WVZ is high and predominantly restricted to depths of 1-7 kilometers,
with a high concentration at the Hengill triple junction (Clifton, 2001). There, the Reykjanes
Ridge splits into the WVZ and the South Iceland Seismic Zone (SISZ) (see Figure 1).
A common feature of the WVZ and the other volcanic zones of Iceland are the volcanic
fissures. In the WVZ they are usually found in swarms approximately five kilometers apart
with a general strike to the north-east. Most fissures are small usually less than a hundred
meters. The swarms consist of normal faults, extension fractures with no or little shear
displacement and hybrid fractures (shear and extension) (Saemundsson, 1992).
There are also a number of table mountains and hyaloclastite cones within the zone. These
have been created from isolated vents in sub-glacial eruptions. Lava shields of different
volumes have formed with large shields usually being basaltic in composition and small
shields usually picritic in composition. The last fissure eruption occurred in the thirteenth
century (Thoradson, 2007).
2.3 The Thingvallavatn Area
The studied area is about 1000 km2 large. The main features of the area are Lake
Thingvallavatn, Iceland´s second largest lake, the graben structures associated and the
volcano mountains to the north and south of the lake. The zone is about 80 km long and 10
km wide and is called the Hengill Volcanic system (Gudmundsson, 2000a)). The area is
considered to be active in terms of volcanism and today nearly half of the area is covered by
postglacial lava. The area has historically been the site of important studies on rifting and
several researchers, for instance Nielsen and Bernauer, applied Wegener´s continental drift
theory long before it was accepted by the majority of scientists (Saemundsson, 1992).
7
Lake Thingvallavatn lies in the middle of a N30-trending graben structure (Saemundsson,
1992). It is asymmetrical with the faults being more tightly spaced and with a larger throw on
the NW side than on the SE side, where the throw is spread out over a larger amount of
smaller faults (Saemundsson, 1992). The dip of the faults is mostly subvertical. The number
and size of faults in different areas depends on the age of the rock they are found in, with
more faults occurring in the older rocks (Saemundsson, 1992). The throw also depends on the
age of the host rock and in some places where the fault passes between different stratigraphic
units the throw suddenly becomes bigger in the older rock. Rifting rates in most cases vary
between 1-3 mm/year (Saemundsson, 1992) with much higher values during active rifting
periods. During the latest active period, in the year 1789, the Almannagjá fault alone rifted by
half a meter or more (Saemundsson, 1992).
In the Thingvallavatn area the Hengill and the Hrömmundartindur volcanoes are proposed as
the main volcanic systems with their respective fissure swarms (Saemundsson, 1992). There
are many different lava flows. Their relative age is usually established by the degree of
faulting or erosion. The oldest sequence in the area is from the Plio-Pleistocene at around 3.1
to 0.7 Myr and consists of basaltic flows and glacial deposits that are up to 400 meters thick
(Saemundsson, 1992). The rock sequence is shown in Figure 2 and the accompanying cross
section is shown in Figure 3. Superimposed on the Plio-Pleistocene sequence is a
discontinuity of around one million years below the next sequence of Upper Pleistocene rocks
(0.7 – 0.01 Myr). These are found northwest and south of Lake Thingvallavatn and consist
mostly of sub-glacial shield-volcano pillow lava and breccia, often covered by glacial
deposits. All of these surface deposits have been exposed to glacial erosion originating from
the Langjökull area in the north (Saemundsson, 1992). There are also end and lateral
moraines. The margins of Lake Thingvallavatn have also changed with time, for instance
during the melting stage in the last glaciation it formed an ice lake at the south margin of the
glacier with a much higher water-level than today and the former shore banks are still visible
on certain locations (Saemundsson, 1992).

8
Figure 2:Plio-pleistocene (3,1-0,01Myr) rock succession around lake Thingvallavatn (from Saemundsson,
1992).

9
Figure 3: Cross sections of the Thingvallavatn graben. The colors are the same as in Figure 2 and Figure 4.
(from Saemundsson, 1992).
The majority of rocks in the area are postglacial and belong to the largest lava flow that
originate from a fissure eruption around 9100 years ago (Saemundsson, 1992) and covers
more than 100 km2 at the northern shores of Lake Thingvallavatn (Eldborgir, see Figure 4). It

10
is evident at the famous Almannagjá fault, which has a maximum throw of 30 to 40 meters
and clearly displays separate layers of lava lobes (Saemundsson, 1992).
Other lava flows were erupted 7000 years ago on the east bank of Lake Thingvallavatn, 5800
years ago south of the bank of Lake Thingvallavatn and then 1880 years ago at a similar
location when a crater row just north of Nesjavellir erupted ( Figure 4). Ash layers are found
in soils from the different periods (Saemundsson, 1992).
Figure 4: The Pleistocene-Holocene geologic rocks around Lake Thingvallavatn (from Saemundsson, 1992).
11
3. Methods
The reason the parameters chosen in study question 2 in the introduction is hereby provided:
Frequency and the age of fractures: One can assume that there should be more fractures in an
older rock than in a young one because the older the rock, the more time it had to acquire
more fractures. This was also concluded in a similar study on northern Iceland (Hjartardóttir
et al., 2009). The assumption is in this study tested in the Thingvallavatn area.
Frequency and the strike of fractures: The aim here is to see whether the fractures are aligned
in any organized fashion that could be used for modeling or estimating the formation of yet to
be located fractures. Clifton et al. (2003), also seek a distribution pattern for frequency and
strike when studying fractures west of the study area. They state that the strike of fractures
exhibit a normal distribution. This claim is tested in the Thingvallavatn area. The type of
distribution is additionally analyzed using a Kolmogorov-Smirnov test to find the degree of
similarity between the strike distributions on both sides of Lake Thingvallavatn. The final aim
is to not just be able to say that the “volcano has a pronounced effect on the regional stress
field” without quantification as done in the Hjartdottir et al. study (2009), but to be able to say
that the “volcano affects the strike of fractures by a factor of x degrees per kilometer distance
from the volcano”.
A similar question can be posed concerning magmatic fractures: Does the strike of magmatic
fractures depend on the strike of tectonic fractures and if so by what degree? This is
interesting to find out whether the form of tectonic fractures is the only variable that governs
the way in which new magmatic fractures align themselves at the surface (for more on
statistical dependence see “correlation and causality”, appendix). This type of causality is
expected because magmatic fractures are supposedly formed in the same stress field as
tectonic fractures. There are, however, factors that could affect this stress field locally around
magmatic fractures, such as magma pressure. Statistics will show whether such factors can be
statistically neglected or if they have to be taken into account when studying the strike of
fractures.
Frequency of fracture length: The population distributions of the length of fractures is
studied.
Length of fractures and strike of fractures: It is assumed that the longer a fracture is the less
their strike deviates from their mean strike (Hjartdottir et al., 2009). This study tests whether
this can be confirmed on the Thingvallavatn area.
Average deviation of strike of fractures as a function of the distance to the volcano of
fractures: According to Hjartdottir et al. (2009), the presence of a volcano “has a pronounced
effect on the regional stress field around the plate boundary, as can be seen from the azimuth
of the volcanic fissures and tectonic fractures in the fissure swarms close to Askja” (Askja
being the volcano). Thereby the average deviation of strike should get larger closer to the
volcano. This argument is tested in the Hengill area.

12
Length and elevation of fractures: Hjartdottir et al. (2009), state that fractures “get fewer and
smaller with increasing elevation” (Hjartardóttir et al., 2009). The argument is tested in the
Thingvallavatn area.
Elevation and the distance to the central volcano of fractures: Here the spatial distribution of
fractures is analyzed in respect to their elevation. This is a topographical approach that will
answer whether the fractures are located at any specific elevation more than any other.
Spacing between fractures and distance to the volcano of fractures: In order to study the
shape of the graben the distances between fractures at certain distances from the volcano were
analyzed. According to Scholz and Contreras (1998) faults in a rifting area can be divided into
two classes, the boundary fault system (BFS), and the failed conjugate fault (FCF). If these
can be identified for a fracture set the degree of asymmetry can be estimated for the rifting
area.
3.1 Mapping
The fact that Iceland is covered by around 60% tundra makes remote sensing a good and
efficient method to study geological features at the land surface. For the southern part of the
study area 15 aerial photographs were used most of which were about seven kilometers
across. For the northern part 8 aerial photographs were used. The scale in all photographs is
between 1:25000 to 1:50000 except for the area around Thingvellir where the scale was
1:6000. The aerial photographs in the southern part were stitched together using Adobe
Photoshop that produced a mosaic image of the area with the cost of getting a slightly lower
resolution and a distorted projection. The photomosaic was thereafter transferred to ArcGIS
for analysis. In the northern part the photographs were directly imported into ArcGIS because
one aim of the study (study-question 1) was to compare different methods.
The photomosaic was georeferenced manually using the Universal Transverse Mercator WGS
1984 60o north system. In order to get the photomosaic referenced the ArcGIS
“georeferencing” tool and Google Earth were used. Clear distinguishable points were located
on the photos and assigned with coordinates using Google Earth. 25 georeference points were
used. Since the mosaic was slightly distorted by the stitching process, the georeferencing was
more difficult. There are different algorithms that can be used, 1st, 2
nd or 3
rd etc. polynomial
functions, depending on how many georeferencing points there are. The final average
coordinate error of the photomosaic is ±20 meters, which was considered satisfactory as that
was approximately the precision of Google Earth in the area (in border areas between two
satellite images). The fractures and fissures were drawn using ArcGIS polylines which consist
of three to ten points depending their lengths.
The next step was to map the fractures on the aerial photographs. Various other maps, such as
a geological map (Saemundsson, 1995) of the same area were additionally imported into
ArcGIS. Google Earth with its resolution and 3D function was additionally used for locating
hyaloclastite ridges. The images in Google Earth are however slightly different. They include

13
vegetation and therefore the contrast between fractures and the surrounding landscape was
usually not as good as in the aerial photographs. Also there were some areas that were
covered by clouds, for instance a cloud with 600 meters diameter which partly covered the
area to the north of Thingvellir (see Figure 5).
Figure 5: Perspective view of the southern study area shown in Google Earth. Notice the big cloud (about 600
meters diameter) and its shadow in the lower right corner just above the road.
Since the photomosaic had lost some resolution during the stitching, the aerial photographs
were sometimes studied individually to confirm certain features. Small features, such as
several volcanic fissures, were sometimes too small to be identified on the aerial photographs,
or to distinguish them from tectonic fractures. In those cases the geologic map (Saemundsson,
1995) was used as a reference.
In order to answer the question of a possible correlation between the number of fractures and
elevation a Digital Elevation Model (DEM) of the area was used. The resolution of this DEM,
with a cell size of 90x90 meters, was not optimal but since there were so many fracture
samples it could still be used in statistical analysis.
Similarly, lava flows were mapped on the aerial photographs according to the geological map
(Saemundsson 1995) so that a fracture quantity versus age correlation test could be carried
out. The fractures of each age section were selected on the big map using the ArcGIS tool
“clip”, and then their features were compared to other fracture populations on the map.

14
The fractures were categorized as follows:
Single tectonic fractures striking SW
Single tectonic fractures striking NE
Connected tectonic fractures striking SW
Connected tectonic fractures striking NE
Volcanic fissures
Hyaloclastite ridges
The fractures in the Thingvallavatn area can be described in many ways depending on what
resolution one observes them in. The Almagja-fault could for instance be described as a 7,7
kilometer fault. However, depending on the resolution of the maps, these 7,7 kilometers can
be divided into numerous parts. In this study the Almagja fault was separated into 21 different
segments. One could have increased the number of segments even further. Fractures separated
in a strike-slip fashion by less than approximately five meters were considered as one fracture
whereas a separation larger than that was considered as two fractures. As some maps had
lower resolutions this precision also had to be adjusted to the map in question.
Some differences in mapping between the northern and the southern area can possibly be
attributed to the geological differences between the two. The southern mapping area is
dominated by structures in close proximity to the volcano Hengill. The topography is varied
and there are significant artificial structures. This made it generally harder to spot fractures in
this area so that the geological map was used as a reference. The northern area is more even
topographically. There are less human imprints, and it is generally easier to find fractures
except for the northernmost parts of the area, which are also mountainous.
3.2 Statistical analysis
The statistical methods used to answer the study question are described in the following:
What are the statistical relationships between the following variables: Frequency of the age
of fractures, frequency of the strike of fractures, frequency and length, length and average
deviation of strike, length and elevation, elevation and the distance to the central volcano?
Frequency of age of fractures: The correlativity between these variables could only be tested
in the southern area because there are no significant age differences between the lava flows in
the northern area. In the southern area the lava flows divided into two age categories: Post-
Strangarháls and pre-Strangarháls. The age of the Strangarháls lava has not been established
yet but is probably around 7000-8000 years old and form a sharp border to younger lava flows
(Saemundsson, 1992). The amount of fractures per kilometers square in the post-Strangarháls
areas was counted and compared to the number of fractures in the pre-Strangarháls areas. To
evaluate if the number of fractures in a certain area depends on the age of the host rock a
dependency test is necessary. However this could not be done in this case because the χ2

15
independence test method requires two categorical variables to work. In this case there was
only one categorical variable, age in terms of “pre” or “post”. Additionally the amount of
fractures (27) in the “post” areas is too small to convert them into similar categorical classes
without breaking the conditions of the test. Therefore the result only constitutes a simple
count and ratio.
Frequency of strike of the fractures: To see whether the frequency of strike exhibits a normal
distribution two methods were used: Using a Quantile normality plot method and a
Kolmogorov-Smirnov method. The frequencies are plotted in cumulative histograms and
tested against assigned z-values from standard tables around the mean (z used here since the
control-group data follows a normal distribution under large n).
Quantile normality method:
Every , is assigned to a z-value and table critical values so that:
Equation 1: The range of the values in the quantile normality test.
Kolmogorov Smirnov method:
The Kolmogorov-Smirnov goodness-of-fit test is based on the empirical distribution where N
ordered data points, y1, y2 .... yn are defined by the following function:
Equation 2: The definition of the Kolmogorov-Smirnov empirical distribution.
n(i) represents the number of data point that are less than Yi. Yi increases by 1/N at each
following data point. The empirical distribution function Fn and the Kolmogorov-Smirnov
statistic Dn are given by:
Equation 3: The empirical distribution function and the Kolmogorov-Smirnov statistic.

16
Where sup is the supremum of the distribution variable x, which is the number that is greater
than or equal to Fn.
A Kolmogorov-Smirnov goodness of fit test was also used to test the similarity of the fracture
strike distributions on both sides of Lake Thingvallavatn. The two data samples were plotted
against one another in cumulative histograms and analyzed by the following principle:
Equation 4:The Kolmogorov-Smirnov statistic when applied to a goodness-of-fit test, and its critical value.
where F1 and F2 are the distribution functions of the respective populations and Kα is a table
critical values.
A χ2 independence test was used to test whether the strike of magmatic fractures depend on
the strike of tectonic fractures. First the strike data was categorized into 10o classes. One
condition for the test to work is that each class contains at least 5 values. Tthis could only be
obtained if the data was distributed by 10o classes because the number of magmatic fractures
only amounted to 38, with a large standard deviation in strike.
Hypotheses to be tested:
H0: The strike of volcanic fissures is independent of the strike of tectonic fractures.
H1: The strike of volcanic fissures is not independent of the strike of tectonic fractures.
Degrees of freedom: (r-1)(c-1)
Test function: Rules of rejection: H0 is rejected if
Frequency and length of fractures: To test the distribution of length of fractures around Lake
Thingvallavatn scatter-plots were used. The magmatic fractures were not tested for any
relationship including lengths since the range of lengths covered by them is too small to avoid
a high degree of error.
Length and strike of fractures: Analysis using scatter-plots.

17
Average deviation of strike and distance to the central volcano: Scatter-plots of the average
deviation of strike (residuals) against the distance were used and analyzed using a moving
average trend line.
Length and elevation: Scatter-plots were used. The study was only carried out for the southern
area more significant changes in topography occur there.
Elevation and the distance to the central volcano: Analysis using scatter plots.
Distance between fractures and distance to the volcano: The distances between fractures were
measured using transects at certain distances, 2500, 5000, 7500 meters for the southern area
and 20000, 22500, 25000 meters for the northern area, from the volcano. The distances were
then plotted in a scatter plot and analyzed. The location of the transects and mid-line of the
diagram were chosen where they seemed to best represent the graben.

18
4. Results
4.1 Mapping
In Figure 6 the map of both areas are displayed with the average spatial errors (average
deviation from correct GPS coordinate with Google Earth as reference) shown to the left of
each areas respective map.
Figure 6: Mosaics of the aerial photographs over the southern and northern study areas separated by Lake
Thingvallavatn in the middle. The southern area is built up of 15 aerial photographs that have been stitched
together. The northern area consists of 8 aerial photographs that have not been stitched together. The fractures
were mapped on the aerial photographs.

19
The average spatial error in the northern area is with 17.8 meters slightly lower than in the
southern area, with 23.5 meters. In total 647 tectonic fractures could be identified. The
outlines of the graben can be clearly seen. Furthermore, it can be observed that the Hengill
volcano possibly affects the strike of tectonic fractures close to it. They seem to spread out
from the volcano. In the northern area the strike seems to be more regular.
4.2 Statistical analysis
Frequency and age
Fractures in the southern study area mapped with the aerial photographs on a geologic map
(Figure 7). The number of fractures/km2 was counted within a confined area.
Figure 7: The mapped fractures plotted on a geological map over the southern area (Saemundsson, 1995). The
number of fractures/km2 was counted within a confined area (green box).

20
The total area inside the green confined area is about 110 km2, of which the pre-Strangarháls
area covers about 85 km2
and the post-Strangarháls area 25 km2. Out of the 221 tectonic
fractures 23 were found to be in the post-Strangarháls category, which is about 10%. This
amounts to 0.83 fractures/km2, while in the pre-Strangarháls area 2.33 fractures/km
2 occur.
There are almost three times more fractures/ km2
in the older rocks than in the younger.
Whether there is any statistic relationship between age and frequency for magmatic fractures
one would similarly study the fissures in the pre- and post- areas. However, since there were
only 38 fissures found the number was not considered sufficient for analysis.
Frequency of strike
Normality test
In Figure 8 the strike frequency distributions of tectonic fractures N and S of Lake
Thingvallavatn are displayed in the form of Rose diagrams and histograms.
Figure 8: The frequency distributions of strikes of the tectonic fractures in the northern area ( a) and c) to the
left) and the southern area ( b) and d) to the right).

21
The frequency distributions were tested for normality using a Normal Quantile Plot method
and a Kolmogorov-Smirnov method:
Ho: The strike of faults are not normally distributed around the mean.
H1: The strike of faults are normally distributed around the mean.
Southern area:
The calculated correlation coefficient between the fracture frequency and assigned z-values is
0.8852.
.
√
0.9768
Ho rejected if
Since Ho cannot be rejected; the strikes of the fractures are not distributed
normally around the mean. P-value = 0.37.
Northern area:
The correlation coefficient (in this case altered into ) between the fracture strike
frequency and assigned z-values was found to be 0.9368, which is slightly higher than the
0.8852 coefficient of the southern area. The distribution of the northern area is therefore
closer to normality than in the southern area.
.
√
0.9689

22
Ho rejected if
Since the Ho cannot be rejected: The strikes of the fractures are not
distributed normally around the mean. P value = 0.34. Hence any further statistical testing of
the frequency of strikes of fractures in the northern area that assume normality cannot be
used.
For the magmatic fractures in the southern area, the question of normality could not be
answered due to lack of data. The distribution of the 38 fissures, however, was concluded not
to be normal by looking at the frequency distribution, which is much more scattered than the
non-normal distributions of the tectonic fractures (Compare Figure 8c/d with Figure 9).
Figure 9: The frequency distribution of strikes of the magmatic fractures.
Distribution test
The frequency distributions of tectonic fracture strikes on both the N and S sides of Lake
Thingvallavatn were found to be close to normal. The next step was to test whether they
belong to the same distribution. For this purpose a two sided parameter-free Kolmogorov-
Smirnov distribution test was applied with the hypotheses:
H0: The strike of tectonic fractures in the northern and southern areas do not follow the same
frequency distribution.
H1: The strike of tectonic fractures in the northern and southern areas do follow the same
frequency distribution.
0
2
4
6
8
10
12
10 15 20 25 30 35 40 45 50 55 60 65 70 75 80 85 90 95
Fre
qu
en
cy
Strike[o]

23
Ho rejected if
Figure 10: The approximate normal cumulative frequency line-plot is represented by the thick black line. The
cumulative frequency plots of the strike of the southern fractures (N=274, thin solid line) and the northern
fractures (N=376, dashed line). The population distributions seem to be similar, with a mean around 60o and
with few fractures between 10 o and 40
o. The northern fractures show a better fit to a normal distribution, which
can be seen by the way that more of them are located closer to the middle of the plot.
, p value = 0,025.
Since the Ho is rejected: The strike of tectonic fractures in the northern and
southern areas do follow the same frequency distribution.

24
χ2 independence test
A χ2 independence test (one-sided) was applied to test whether the strike of magmatic
fractures depends on the strike of tectonic fractures with the hypotheses:
H0: The strike of magmatic fractures is independent of the strike of tectonic fractures.
H1: The strike of magmatic fractures depends on the strike of tectonic fractures.
Degrees of freedom: (r-1)(c-1) = 4
Reject H0 if:
Table 1: The χ2 contingency table where the strike of volcanic fissures is tested against the strike of tectonic
fractures. The expected numbers of tectonic and magmatic fractures (expected frqFRA and frq FISS ) are
calculated by using the contingency table (see methods). The observed and expected numbers of tectonic and
magmatic fractures (frqFRA(obs/exp and frqFISS(obs/exp) are displayed for each 10o class.
Since 6.311 < 9.488 H0 cannot be rejected. The strike of volcanic fissures is independent of
the strike of tectonic fractures. The p-value of 0,1771 is, however, indicating a strong trend
towards dependence. Since the strikes had to be narrowed down to five classes the whole test
is simplified and highly contentious (see discussion).
Strike classes(degrees) 40 50 60 70 80 Sum
frqFRA(0bs/exp) 13 34 70 99 42 258
frqFISS(0bs/exp) 1 4 16 8 6 34
Sum 13 38 86 107 48 292
Expected
frqFRA 11.4863 33.5753 75.9863 94.5411 42.411
frqFISS 1.5137 4.42466 10.0137 12.4589 5.58904
Test Sum
frqFRA 0.19948 0.00537 0.47161 0.2103 0.00398 0.89074
frqFISS 0.17433 0.04076 3.57868 1.59579 0.03022 5.41978
6.311

25
Frequency of lengths
The frequency distributions of the length of tectonic fractures in the respective areas can be
seen in Figure 11.
Figure 11: Histograms of the frequency distributions of the lengths of tectonic fractures in the respective study
areas.
The fracture size distribution is dominated by short length values, but the data is highly
scattered. In the northern area most of the fractures are between 100 and 200 meters long. In
the southern area fracture lengths are wider distributed. Most of the fractures are between 100
and 700 meters long. The data was not subjected to a distribution test because of these highly
variable features.
Length and strike
The scatter plots of the variables length and strike of tectonic fractures are displayed in Figure
12 for the two study areas.

26
Figure 12: Length against strike of fractures.
Short fractures have a higher variability in strike than longer fractures. The long fractures
south and north of Lake Thingvallavatn mainly strike between 050 o – 070
o.
Average deviation of strike from the mean strike and distance to the volcano
This analysis was carried out from the data of both study areas. The two variables are plotted
in Figure 13:
Figure 13: N= 649. Average deviation of strike of tectonic fractures from the mean strike and distance from the
Hengill volcano. The southern area is represented on the left side of the diagram and the northern area is on the
right side. The moving average (red line) is calculated over 32 values.
27
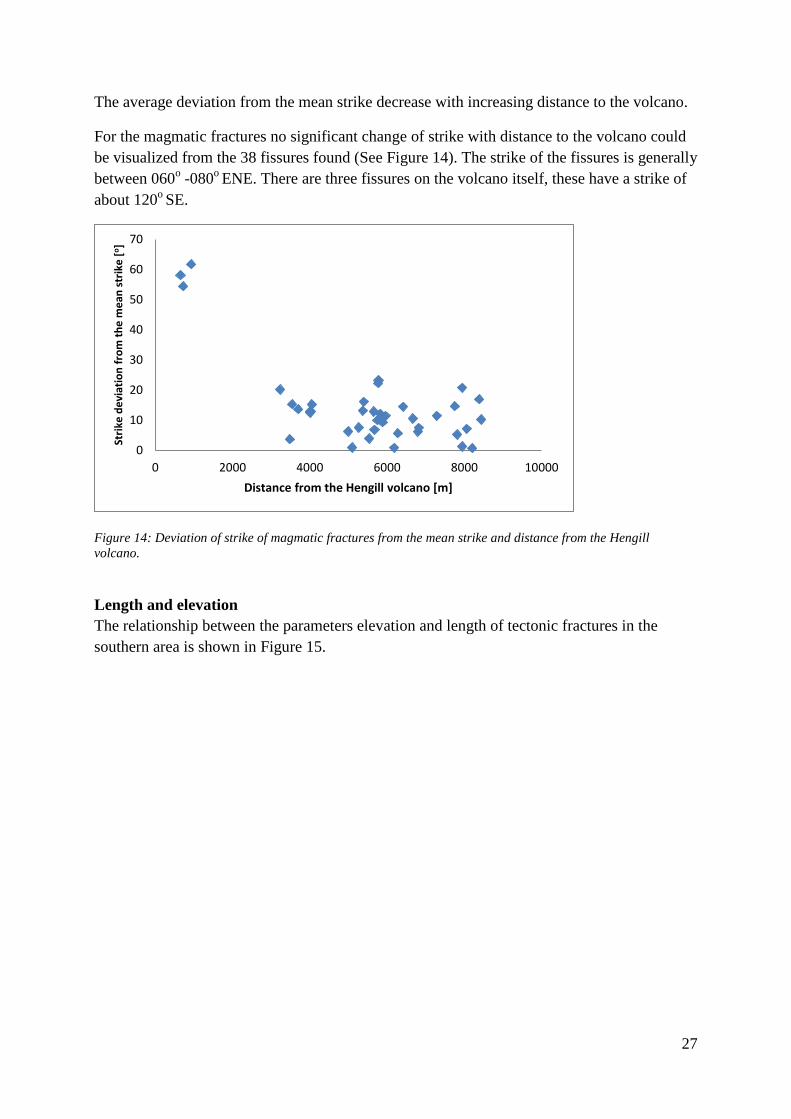
The average deviation from the mean strike decrease with increasing distance to the volcano.
For the magmatic fractures no significant change of strike with distance to the volcano could
be visualized from the 38 fissures found (See Figure 14). The strike of the fissures is generally
between 060o -080
o ENE. There are three fissures on the volcano itself, these have a strike of
about 120o SE.
Figure 14: Deviation of strike of magmatic fractures from the mean strike and distance from the Hengill
volcano.
Length and elevation
The relationship between the parameters elevation and length of tectonic fractures in the
southern area is shown in Figure 15.
0
10
20
30
40
50
60
70
0 2000 4000 6000 8000 10000
Stri
ke d
evi
atio
n f
rom
th
e m
ean
str
ike
[o]
Distance from the Hengill volcano [m]

28
Figure 15: Elevation against length of tectonic fractures in the S area. n=312. The mean elevation is 372
meters; the standard deviation is 145 meters.
Most of the fractures are located around the mean elevation of 372 meters. The number of
fractures decrease the further away they are from this mean elevation. The elevation of
fractures was further visualized in ArcScene (Figure 16):
0
100
200
300
400
500
600
700
800
900
0 1000 2000 3000 4000 5000 6000
Elevation[m]
Length [m]

29
Figure 16: Perspective view over the southern area generated in ArcScene using a DEM. Mount Hengill is in the
middle and Lake Thingvallavatn is at the top right corner. Fractures were mapped on top of the DEM.
The ArcScene map shows no hint of any significant correlation between elevation and length
or between elevation of fractures and distance to the volcano of fractures.
Elevation of fractures and the distance to the volcano
The relationship between the parameters elevation and the distance to the volcano is shown in
Figure 17:

30
Figure 17: Elevation of fractures (n=312) against the distance of fractures to the Hengill volcano.
The fractures close to the volcano tend to be located at a higher elevation. Since this increase
in elevation is singularly made up of mount Hengill the variability between fractures elevation
and their distance to the volcano decreases.
Spacing of tectonic fractures and the distance to the volcano
The selected distances from the volcano and their corresponding transects are shown in Figure
18.

31
Figure 18: The spacing of fractures. The yellow lines are the confines of the measurements, with the yellow line
in the middle marking the presumed mid-line of the graben. The black and white lines are the sections, along
which the spacing was measured. The bright spot to the SW of the lowermost transect is mount Hengill.
Distances of the transects to the Hengill volcano are for A: 2500 meters, B: 5000m, C: 7500m, D: 20000m, E:
22500m and F: 25000m.
The spacing of tectonic fractures on both sides of the graben and the distance to the volcano
were then plotted in a Figure 19.

32
Figure 19: Spacing of tectonic fractures against distance to the Hengill volcano.
In the southern area from 2500 to 7500 meters from the volcano the spacing of tectonic
fractures to the NW and the SE of the mid line of the graben center is approximately the same
with around 400 to 500 meters. The spacing of the fractures on the SE side of the mid line of
the graben center is slightly larger than the NW fractures in the southern part, and increases
further with increasing distance to the volcano.

33
5. Discussion
5.1 Mapping
Is it more effective to stitch the maps or to not stitch the maps? In this study the average
spatial error produced in the georeferencing procedure was slightly lower for the northern area
where the aerial photographs were not stitched. Moreover, the southern area lost some of its
resolution during the stitching process making it harder to identify and map fractures.
Furthermore, it is more distorted than the northern area image. It was also more difficult and
more time consuming to georeference the southern area. These shortcomings could however
depend on the type of stitching software. Drawbacks with not using stitching were mainly
noted to be uneven borders between the aerial photographs and that it can be cumbersome to
have to deal with dozens of different map-files rather than a single stitched map-file. This
could also be an advantage though as one has more control over the mapping-procedure and
that one can alter an individual map if it is found that this particular map is wrongly projected.
Once the maps have been stitched, however, no local changes can be made. In this study the
approach without stitching is concluded to be more effective.
Can Google Earth be used to successfully map fractures? The present version of Google
Earth provides material of lower quality than the used aerial photographs. In some areas
however, mostly close to settlements, the resolution can be of equally good quality as the
aerial photographs. It is possible to map fractures and to measure their lengths in Google
Earth using a simple drawing tool, but the data cannot be directly transferred to other
programs.
What is the margin of error when mapping fractures from aerial photographs? As evident
from Figure 11 there could be about 100 more tectonic fractures identified in the northern area
even though the northern area is significantly smaller than the southern area. This could to a
large extent depend on the facts that the fractures were much easier to recognize in the
northern area which has a flatter and more even topography and that the southern area had lost
some of its resolution in the stitching process. Additionally, the fractures could be drawn with
a higher precision and split up into more segments since it was easier to see where the
distance between two fracture segments exceeded five meters and hence constituted two
fractures. In the southern area, this was often not possible, and in many cases one had to rely
on the geological map to map the extent of a fracture since it was impossible to see such small
features on the aerial photographs.
There is not much cause to distrust Saemundssons (1995) geological map over the area, which
was produced using remote sensing combined with extensive field work, but it is still hard to
know whether the differences between the mapped properties of fractures in the northern and
southern areas are because of actual physical differences or because of methodological
differences. This is a crucial matter because if the methodological differences are not properly
understood and handled at the mapping stage the statistical tests which follow may very well
be rendered useless.

34
What are the methodological differences? The main problem is the already addressed effect of
topography, which should be studied in a separate investigation: “What effect does
topography have on the appearance of fractures in aerial photographs?” The maps in the
southern study area, compared to Saemundssons geological map (1995), show that the effect
is significant. No calculations were made but it is estimated that around 20% of fractures in
close proximity (~3km) of Mount Hengill displayed on Saemundssons geological map (1995),
could not be identified on the aerial photographs. In the non-mountainous areas, however,
only 5% of the fractures were missed. If this is the actual case, there is not a single statistical
test that could successfully be applied to model or estimate population distributions with the
given variables without adjustment. It would definitely be of interest in future research to
calculate the exact differences to find the margin of error of the mapping and expose the
fragility of the subject.
Another methodological issue is to determine where one fracture ends and another begins. In
this investigation the minimum distance of 5 meters between fracture segments was chosen to
distinguish segments, but this distance was not chosen because of any related research, where
no such number was found, but because it was considered appropriate. It seems very likely
though, again in reference to Saemundssons geological map (1995) that the choice of this
distance varies significantly between different studies. Saemundsson (1995) most likely used
a larger distance than 5 meters.
Comprehensive methodological studies with clear mapping criteria concerning mapping of
fractures are needed before one can satisfactorily carry out statistical tests based on mapping
data. Until then, the statistical results from this investigation, compared to statistical results
from other investigations, cannot be assumed to show the relationships between parameters of
physical properties of fractures without the significant impact of systematic and/or random
error due to the use of different methods.
5.2 Statistical analysis
Frequency and the age of fractures
The claim by Hjartdottir et al. (2009) that an older rock is usually more fractured can be
confirmed by this study´s data: Almost three times more fractures/km2 were observed in the
older rocks. However, it is difficult to draw any wide spanning conclusions from this result
since the measurement area and the age categories were chosen deliberately. It would be
desirable to see whether the number of fractures depends on the age of the host rock to see
whether age is the only governing parameter that controls the number of fractures, with other
variables, such as the mechanical properties of the rock or change of stress regimes being of

35
insignificant importance. Such an investigation requires more specific data but could be
carried out quite easily in ArcGIS together with a χ2 independence test.
Frequency and the strike of fractures
A disturbance in the strike of fractures could be observed close to the Hengill volcano,
especially in the part between the volcano and Lake Thingvallavatn (see Figure 6). The
statistical analysis also showed that there were some differences in the frequency distributions
between the “northern” and “southern” data sets, but however not to the degree of statistical
significance.
A study carried out west of the current study area (Reykjanes Peninsula) conducted statistical
tests on the frequency distributions of the strike of faults (Clifton and Schliese, 2003). They
concluded that “Fracture strikes exhibit a normal distribution with the great majority between
050o and 060
o” (See Figure 20). These distributions seem to look more organized compared
to the ones in this study, but one needs to pay attention to the fact that the distributions are not
using the highest amount of frequency classes and that a claim of normality needs to be
supplemented with a normality test, something not done in the article.
Figure 20: Normal or not normal? The frequency distributions of strike of fractures on the Reykjanes peninsula,
in Clifton et.al. 2003.

36
The strike of fractures in this study were not found to be normally distributed with a large
margin. This does not exclude the possibility of normality for a larger data set with more than
the 278-369 data points in this investigation.
The degree of similarity of the frequency distributions were tested with a Kolmogorov-
Smirnov test and they were passed as coming from the same distribution, confirming the
visual impression that the fractures on both sides of Lake Thingvallavatn are part of the same
graben and therefore share similar properties. More data would allow quantifying the degree
by which the volcano affects the strike of fractures as a function of distance from the volcano.
This would allow making reliable assumptions about the strike of newly forming fractures.
Regarding the question of whether the strike of magmatic fractures depends on the strike of
tectonic fractures, the statistical answer was no, which means that we cannot exclude the
possibility of other parameters having a significant impact on the strike of magmatic fractures.
The strike of tectonic fractures is quite probably the main parameter, but other variables such
as features of the host rock (e.g. brittleness), magma pressure, elevation or distance to the
central volcano (the deviation of strike from the mean of magmatic fractures was largest on
top of Mount Hengill), are also possible to significantly affect the strike. Therefore it can be
concluded that magmatic fractures in general do align themselves parallel to tectonic fractures
because they form in the same stress field, but that there are other factors as well that affect
the process.
The χ2 independence test of this question that was used to test dependence was flawed with
various problems and thus did not produce significant results. The Kolmogorov-Smirnov test
on the other hand proved itself more suitable in handling these types of statistical problems
although the tests were not used in the same way.
Frequency and the length of fractures
The length is expected to be highly affected by the methodological differences in the mapping
of both study areas. The lengths of tectonic fractures measured in the northern area is
significantly shorter than in the southern area (Figure 11). This could be at least partly
explained by a systematic error.
A geological explanation could be that the northern area consists mostly of the 9100 years old
Eldborgir lava that is different in respect to the mechanical properties of the southern area,
consisting mostly of hyaloclastites and a bigger variation of lava flows. Hyaloclastites are
comparatively soft with a low tensile strength and therefore a tectonic fracture can grow
“longer” in this material, whereas the Eldborgir lava flows are more stiff (Friese, 2008).
However, this would imply that the average deviation of strike of tectonic fractures should
also be greater in the Eldborgir area, but this could not be confirmed in this study.
The type of frequency distribution which the length of fractures might follow has been
discussed using various models (Exponential model: Bohnestiehl and Kleinrock, 1999, 2000;
Carbotte and Macdonald, 1994. Power-law model: Gudmundsson, 1987, 2000) but the

37
different findings may to a significant extent depend on local stress regimes or
methodological differences. In this study neither model could be supported since the number
of data points and the size of the study was not considered to be large enough to draw any
such conclusions.
Strike and length/distance to the volcano
In general it was found that the shorter the tectonic fracture, the larger the variability of the
strike of the fracture. In addition, the northern fractures which were measured to be shorter in
average deviated less from the average strike than the southern fractures. So even if the
Eldborgir lava is in fact more brittle and has led to longer fractures breaking up into more
segments, the strike does not deviate more from the average in the southern area ( Figure 13).
Elevation/length, elevation/distance to the volcano
There is no correlation between any of these variables which were plotted to give a 2D
representation of the fractures. The theory that there should be fewer fractures on top of the
volcano because of the distance to a magmatic dyke is greater (Hjartdottir et al., 2009), could
therefore not be supported.
Spacing of fractures and distance to the volcano
The spacing of fractures was found to be larger on the SE side of the graben (Figure 19).
Consequently the graben is asymmetrical.
The spacing of fractures was also measured to exhibit a larger change on the SE side of the
graben than the SW side (Figure 19). The reason for this type of this asymmetry is unclear,
but might be related to the fact that the area is located on the triple junction between the
WVZ, the SIVZ and the Reykjanes peninsula, so that conflicting stress regimes have affected
the distance between fractures. Bergerat et al., (1999), linked different types of normal and
strike-slip faults to different stress directions and reached the conclusion that as many as four
stress regimes are represented in the area, where some fractures are more affected by one and
other fractures are more affected by another stressfield. The two main stress regimes (Figure
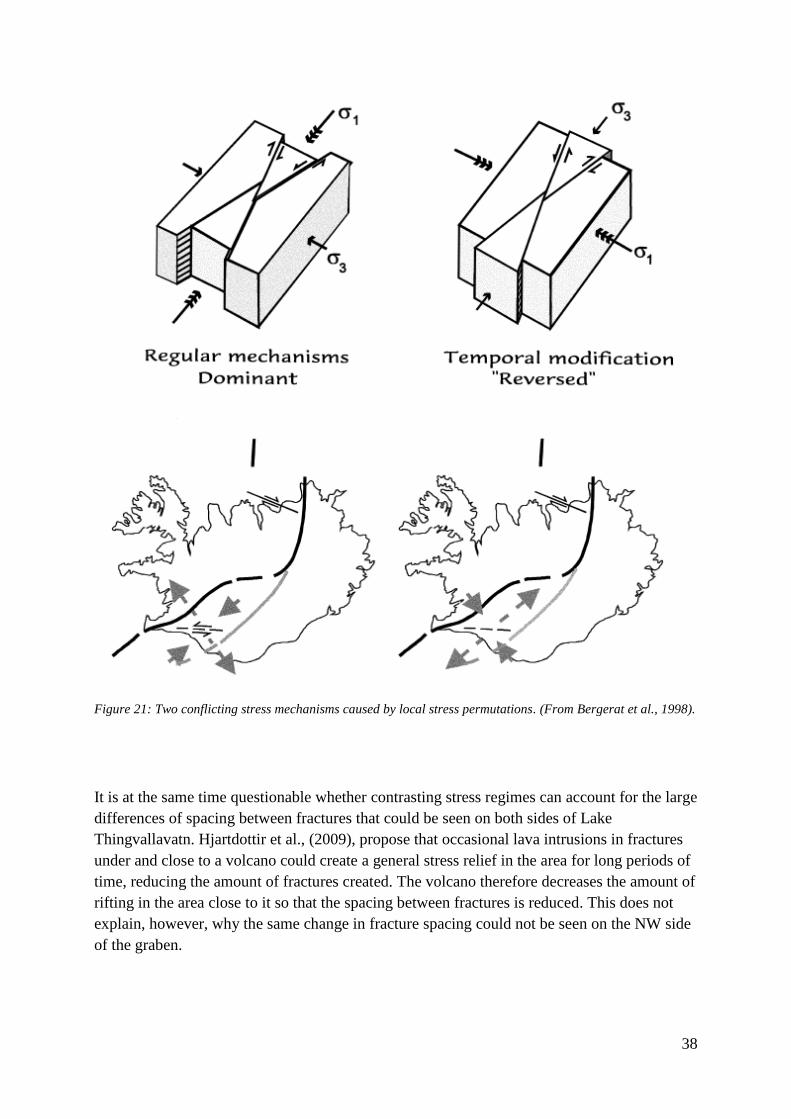
21) are extensions in NE-SW and NW-SE directions.
38
Figure 21: Two conflicting stress mechanisms caused by local stress permutations. (From Bergerat et al., 1998).
It is at the same time questionable whether contrasting stress regimes can account for the large
differences of spacing between fractures that could be seen on both sides of Lake
Thingvallavatn. Hjartdottir et al., (2009), propose that occasional lava intrusions in fractures
under and close to a volcano could create a general stress relief in the area for long periods of
time, reducing the amount of fractures created. The volcano therefore decreases the amount of
rifting in the area close to it so that the spacing between fractures is reduced. This does not
explain, however, why the same change in fracture spacing could not be seen on the NW side
of the graben.

39
6. Conclusions
The strike of fractures is more varied close to the volcano. The frequency distributions
of the strike of fractures were found not to be normal, but they were found to be of the
same and quantifiable type. With more data their common distribution could therefore
be modeled, and the factor by which the Hengill volcano affects the strike of fractures
per distance unit from the volcano could be calculated.
The strike of magmatic fractures was found to be similar to but not dependent on the
strike of tectonic fractures. Therefore change in magma pressure might change the local
stress regime around the fissure, affecting the strike.
Clear mapping criteria are needed in order to conduct remote sensing of fractures in a
systematic way. Otherwise there is a large risk of methodological differences between
studies. The mapping of fissures needs better methods in particular. In this study it was
difficult to locate magmatic fractures on the aerial photographs and the ones located
were too few to analyze in detail.
The study area should be as large as possible to provide a reliable amount of data for the
statistical analysis. It should also be compared to artificial models so that results can be
viewed in a broader perspective. If features are studied on a larger scale the limits of the
resolutions of the aerial photographs will also be a lesser problem.
The non-parametric Kolmogorov-Smirnov statistical test was found to be more suitable
than the categorical χ2 test in this type of study. In order to satisfy χ
2 test conditions
more data than available in this study is required.

40
7. References
Allaby, Ailsa: A Dictionary of Earth Sciences, online version, 1999,
http://www.encyclopedia.com/doc/1O13-fissurevolcano.html, 4/15/2012.
Bergerat, Franc; Gudmundsson, Agust; Angelier, Jacques: Seismotectonics of the central part
of the South Iceland Seismic Zone, Paris, 1998.
Bergerat, Franqoise; Jacques Angelier; Solkne Verrier: Tectonic stress regimes, rift extension
and transform motion: the South Iceland Seismic Zone, Paris, 1999.
Bull, Jonathan M; Minshull, Timothy A.; Mitchell, Neil C.; Dix, Justin K.; Hardardottir,
Jorunn: Magmatic and tectonic history of Iceland's western rift zone at Lake Thingvallavatn,
Geological Society of America, Bulletin, 2005.
Clifton, Amy E.; Roy W. Schlische: Fracture populations on the Reykjanes Peninsula,
Iceland: Comparison with experimental clay models of oblique rifting, Nordic Volcanological
Institute, Reykjavı´k, Iceland: Journal of geophysical research, vol. 108, 2003.
Clifton, Amy E. et al.: Surface e!ects of faulting and deformation resulting from magma
accumulation at the Hengill triple junction, SW Iceland, 1994-1998, Journal of Volcanology
and Geothermal Research, 115, 2001.
Einarsson, Páll: Earthquakes and present day tectonism in Iceland, Tectonophysics, 1991.
Einstein, H.H.; Baecher, G.B.: Probabilistic and Statistical Methods in Engineering Geology,
Rock Mechanics and Rock Engineering, 16, 39-72, 1983.
Feldmann, Michael, 2010: Geology of Iceland,
http://www.eldey.de/English/geology/geology.html, 6/02/2012.
Foulger, G. R.; Anderson, D. L.: A cool model for the Iceland hotspot. Journal of
Volcanology and Geothermal Research, 141, 2005.
Friese, Nadine: Brittle tectonics of the Thingvellir and Hengill volcanic systems, Southwest
Iceland: field studies and numerical modelling [sic.], Göttingen, 2008.
Grant, James V.; Kattenhorn, Simon A.: Evolution of vertical faults at an extensional plate
boundary, southwest Iceland, Journal of Structural Geology, 2004.
Gudmundsson, Agust; Brenner, Sonja: Loading of a seismic zone to failure deforms nearby
volcanoes: a new earthquake precursor, Terra Nova, vol 15, 2003.
Gudmundsson, Agust a): Dynamics of volcanic systems in Iceland: Example of Tectonism and
Volcanism at Juxtaposed Hot Spot and Mid-Ocean Ridge Systems, Earth Planet. 28:107–40,
2000.

41
Gudmundsson, Agust b): Fracture networks and fluid transport in active fault zones, Bergen,
2000.
Gudmundsson, Agust: Tectonics of the Thingvellir fissure swarm, SW
Iceland, Journal of Structural Geology 9, 61–69, 1987.
Hjartdóttir, Asta Rut; Einarsson, Páll; Sigurdsson, Haraldur: The fissure swarm of the Askja
volcanic system along the divergent plate boundary of N Iceland, Bull Volcanologist 71:961-
975, 2009.
Interactive statistical test: http://www.physics.csbsju.edu/stats/KS-test.n.plot_form.html,
4/27/2012.
QMI agency; Batsford, Susan, Understanding Eyjafjallajokull, 2010:
http://www.recorder.ca/2010/04/22/understanding-eyjafjallajokull-2, 4/15/2012,
http://iceland.vefur.is/iceland_nature/geology_of_iceland/index.htm, 4/15/2012.
Saemundsson, Kristján: Hengill geological map (bedrock) 1:50 000. Orkustofnun, Hitaveita
Reykjavikur, LandmMlingar, 1995.
Saemundsson, Kristján: Geology of the Thingvallavatn Area, Oikios Vol. 64, No.1/2, 1992.
Scholz, Christopher H.; Contreras, Juan C.: Mechanics of continental rift architecture,
Geology, 26;967, 1998.
Sigbjörnsson, R.; Ólafsson, S.: The South Iceland earthquakes in June 2000: strong-motion
effects and damage, Selfoss, 2003.
Sigmundsson, Hall (ed.) Iceland Geodynamics: Crustal deformation and divergent plate
tectonics, Springer and Praxis, 2006.
Sinton, John: Postglacial eruptive history of the Western Volcanic Zone, Iceland,
Geochemistry Geophysics Geosystems, VOL. 6, 2005.
Sturkell, Erik, et al.: Volcano geodesy and magma dynamics in Iceland, Journal of
volcanology and Geothermal research, 150, 14-34, 2006.
Thoradson, T.; Larsen, G.: Volcanism in Iceland in historical time: Volcano types,
eruption styles and eruptive history, Journal of Geodynamics 43, 118–152, 2007.
Ward, Peter L.: New interpretation of the Geology of Iceland, Geological Society of America
Bulletin, 1971.
Weisenberger, Tobias: Introduction to the geology of Iceland, http://www.tobias-
weisenberger.de/6Iceland.html, 4/27/2012.

42
8. Appendix
Appendix 1:
Correlation and causality (dependence): Dependency is a type of correlation where the
correlation is only and exclusively between two variables. So if one variable is passed as
being dependent on another, say “coffee tasting sweet” depends on “amount of sugar” that
means that “coffee tasting sweet” can only be correlated to one and only one other variable,
namely “amount of sugar”. But if the variable “coffee tasting sweet” is not found to be
dependent on “amount of sugar” that means that there can be a correlation between “coffee
tasting sweet” and “amount of sugar”, but there can also be a correlation between “coffee
tasting sweet” and some other variable, such as “amount of sugar free sweetener”.
Appendix 2:


