Reinforced Soil Projects:Bringing Research to Applications
S.R. Lo

Contents
• Introduction• Application of constrained dilatancy concept to
pullout resistance of strap reinforcement– SW and PR interchange (D+C)– M2 road project (D+C)
• Not so happy story• Tied back-to-back wall: Railway abutment (D+C)• Modular block wall: Barnes Point• Select fill of high fines content: Blue Mountain• RSW for mining project (D+C)• Reinforced embankment on very soft clay

Introduction
• Reinforced Soil = RS • = Mechanically Stabilised Soil (MSS)• = Reinforcement + soil • Reinforcement = Inclusions

Forms of RSS
• Fill structure: – dominantly sustained loading under normal conditions

Forms of RSS
• Cut slope: • Transient loading: pavement structure
Subgrade
Pavement structure

Forms of RSS
• Combined system-1:• Geosynthetic encased stone columns: The geosynthetic reinforced
the stones which in turn reinforced the surrounding soft soil.
unit cell
Embankment
geosynthetic encasementstones
weak deposits

Forms of RSS
• Combined system-2:• Bored pile wall with soil nails (or passive anchors)
soil nailspile wall

Stabilising Effects
• Provision of stabilising force(s) for O/A stability
?
?
?
Surcharge
stabilising force for potential slip surface

Stabilising Effects• Closely spaced reinforcement changing or controlling the strain
state, thus stress state, of soil in its vicinity. – Metallic reinforcement: near K0 condition.– Geosynthetic reinforcement: limit lateral strain and hence prevent
development of collapse mechanism. Soil around reinforcement likely to be at or near-failure state but RSS is safe.
Extensible inclusion
soil element
deformed element
Inextensibleinclusion
applied stress

Reinforced Soil Wall
• Wall configuration: Active / YieldingZone
Passive/Resistant Zone: soil holding reinforcement back
"Thin" Front panel:panels or continuous
reinforcement
General Fill
Reinfoced Zone / Block
(may have concentrate load or sloping fill)
Tc
Tmax
Select fill

Design Considerations
• Highly redundant system.• Design Vs collapse based on simplified mechanisms.• Internal stability: reinforcements of “adequate
strength” that “bind” the soil into an integral (coherent) mass.
• Overall stability as an integral gravity RW
Internal Stability
• Reinforcement tension not excessive: normally check Tmax and Tc. Well “codified” in most cases.
• Adequate interaction between reinforcement and soil: pullout resistance. Range of reinforcement + soil combinations presents opportunities.
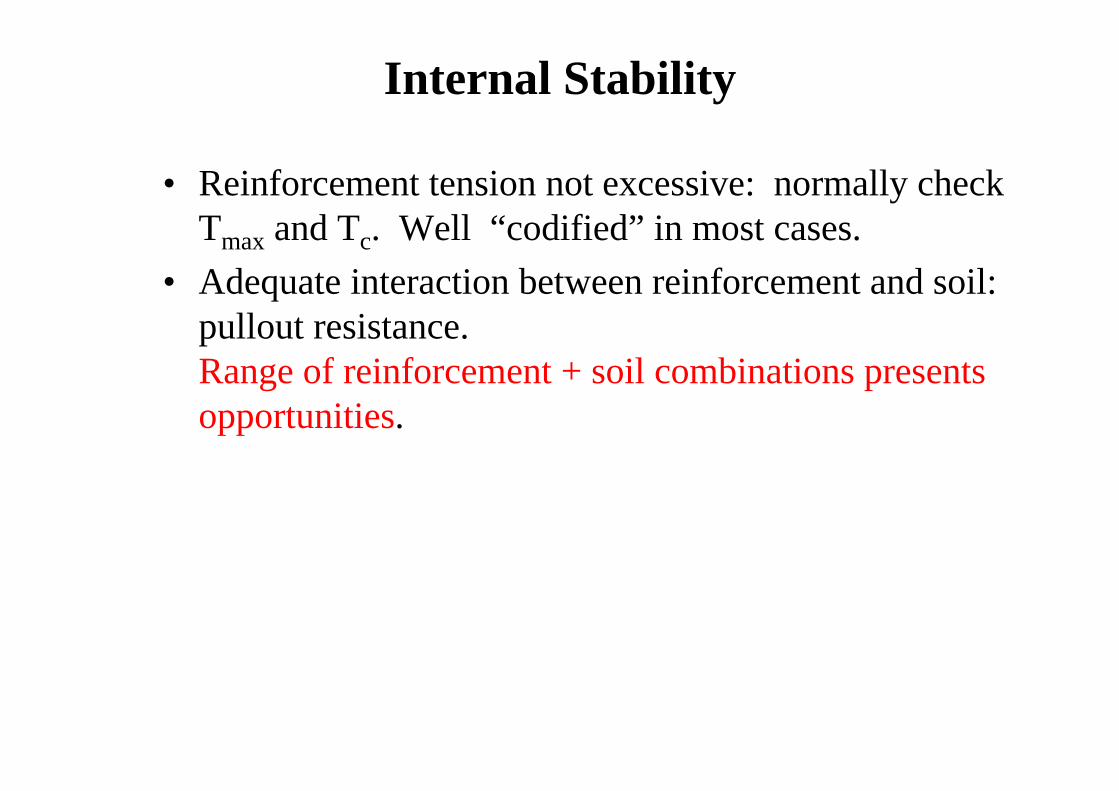
Overall Stability
• Check as equivalent gravity RW.• δ along virtual back depends on reinforcement stiffness
because it affects the “overall stiffness” of the reinforced zone.
active thrust
Step-back RSW
active thrusactive thrus
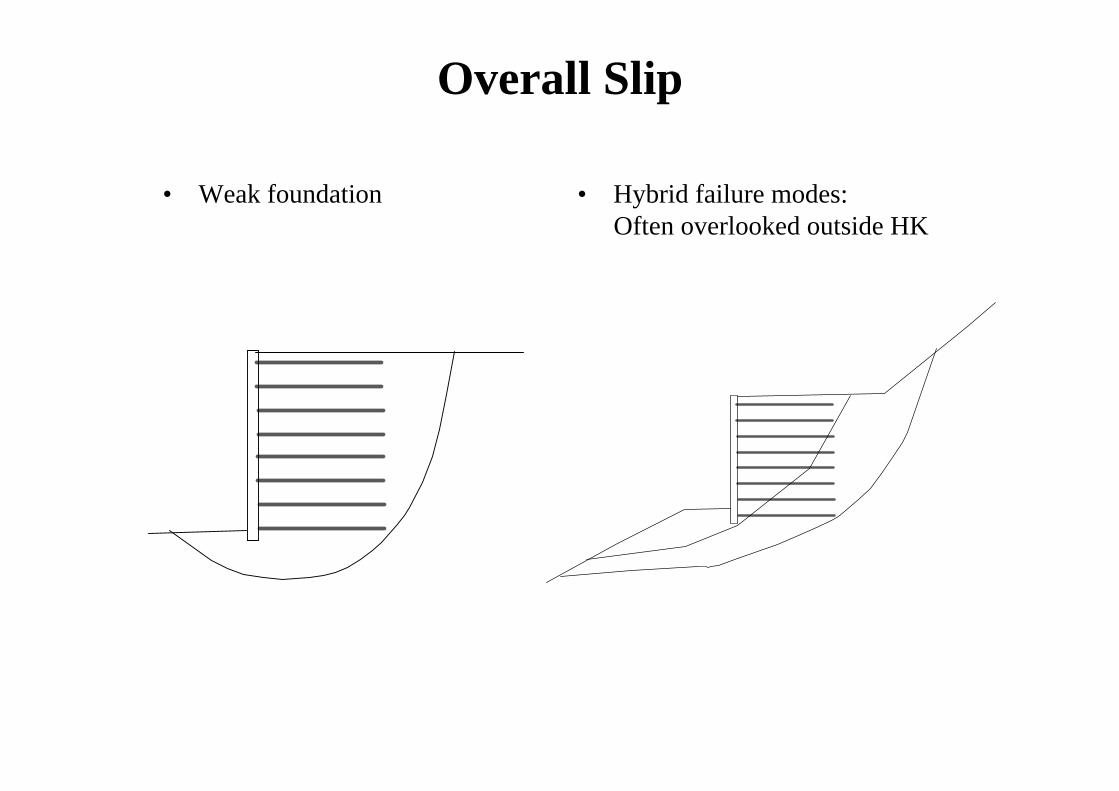
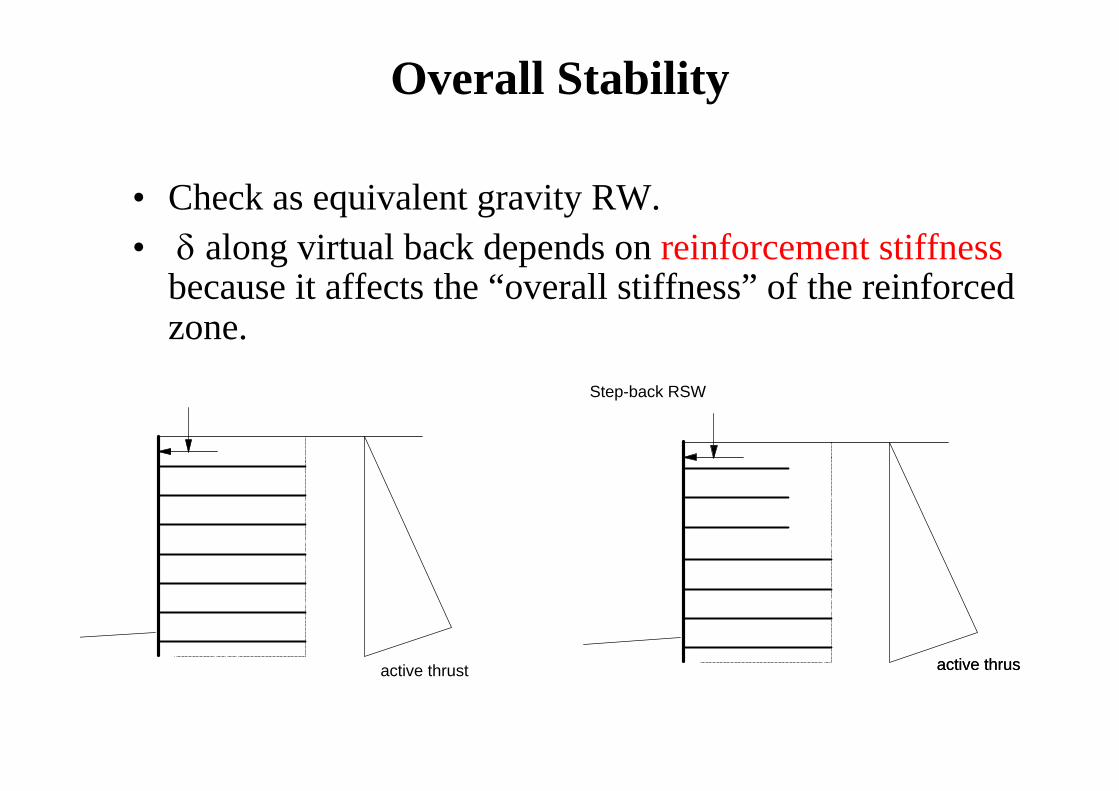
Overall Slip
• Weak foundation • Hybrid failure modes:Often overlooked outside HK

Movement
• Rule of thumb and precedence.• Finite element or FLAC analysis is very powerful and
useful but need great care …. • Particular issues for geosynthetic RSW.
– A proper and consistent FE or FLAC analysis will give you considerable movement for most cases, and this is REAL.
– We can usually rely on “smart” construction sequence to “built out” the movement. This means the reinforced zone has to be near-drained condition at end of construction. From a specification point of view, the select fill ……
• Also relate to construction sequence / details.

Model wall
• Paper as reinforcement

Steel straps

Ladder strap
• Ladder strap

Terramesh
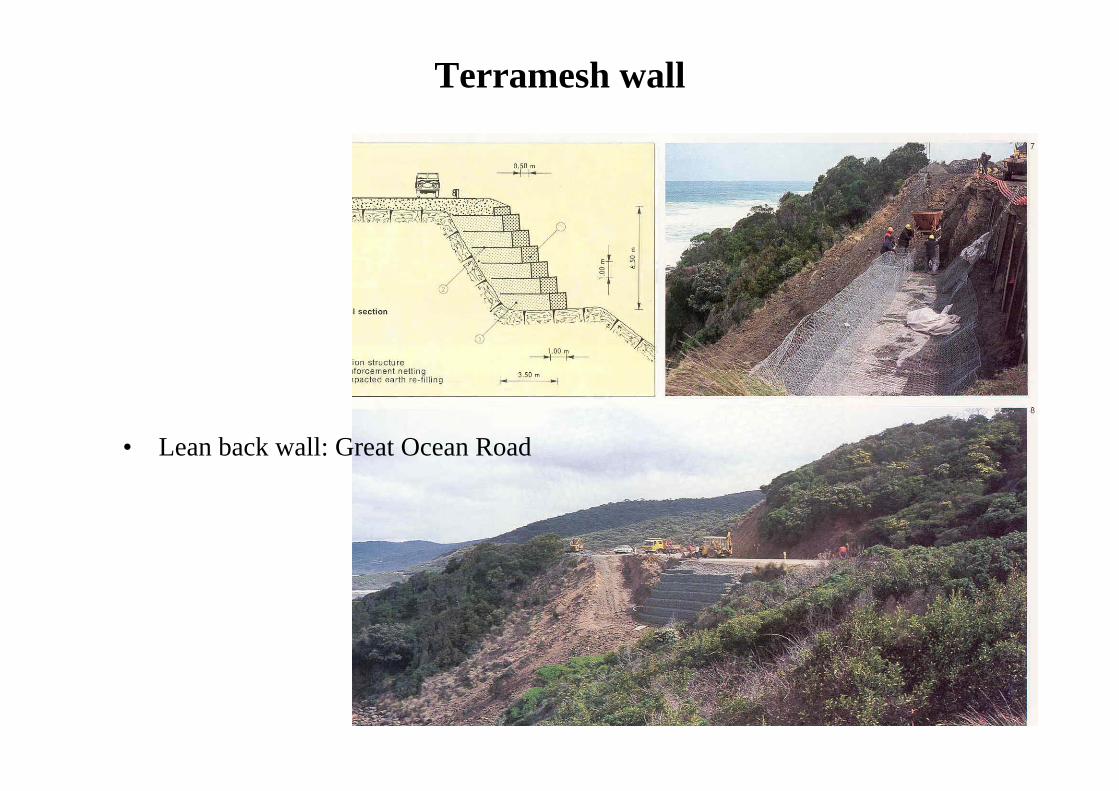
Terramesh wall
• Lean back wall: Great Ocean Road

Soil nails
• VW strain gauging

Polyester Strap
low density polyethelene(with carbon black)
polyester yarns
85 or 90 mm
4 to 6 mm
1.5 to 2 mm
Short term strength per strap: 20 to 100kN. Pullout design issue to be discussed later.
Textured surface

Geogrid
• Flexible: from small polyester straps
• Stiff: Drawn from HDPE

Design sections
• Tall wall
Abutment wall

Pullout resistance
• Pullout Check: Rp(i) is “adequately large relative to” Tmax(i).
• Rp(i) is a 2D design eqn.• f = “friction factor”
= “apparent friction coefficient”= μ* = tanδ*
• f = αF. Where α≤ 1 is a scaling factor to take into account progressive failure for extensible reinf.
• A few challenges (opportunities)presented by f or F.
Tmax
Maxi tension locus
Resisting zone
Tmax(i) To(i)
( ) [ ( ) ( ) ( )] ( ) [ ( ) ]( ) ( )p o p o pR i i A i i perimetef i f i r L iσ σ= =
Lp

Friction Factor for straps
• Ribbed steel strap, α = 1• For well graded granular
soils with < 15% fines : – How can we have f > tanφ?– Reduction of φ with
overburden stress cannot explain the very high f-value at shallow depth.
– How about other types of straps and select fill ?(Textured surface polyester straps)

Constrained Dilatancy
• 3D interaction
Soil elementin shear
reinforcementtension
Stress generated to constrain dilation
Reinforcingstrap
tendency to dilate being constrained
σ
o
Reinforcing strap
vertical stress distribution
σ y
Shear dilatancy
( ) tan
(1 ) tanyo
f o y
o
oF
σσ
τ σ σ δ
σ δ
σ
= +
⎡ ⎤= +⎣ ⎦=

Pullout Testing
• Pullout testing is NOT an element test.• It’s a model test that needs to be interpreted.• At Det “X”: we need a sleeve because ..…
applied test pressure
applied pull
SOIL Det 'X'
Pullout Testing
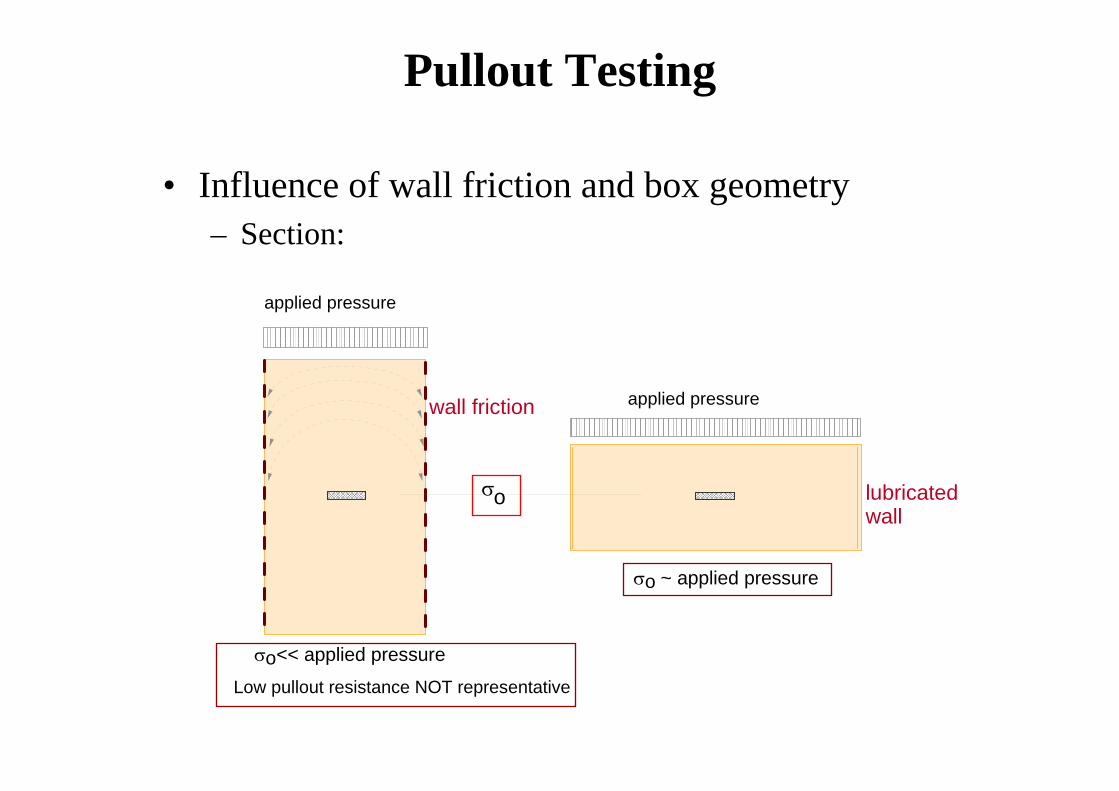
• Influence of wall friction and box geometry– Section:
σ << applied pressureo
σ ~ applied pressureo
σ o
wall friction
applied pressure
applied pressure
lubricatedwall
Low pullout resistance NOT representative

Pullout Testing Apparatus

Pullout box – pressure bag
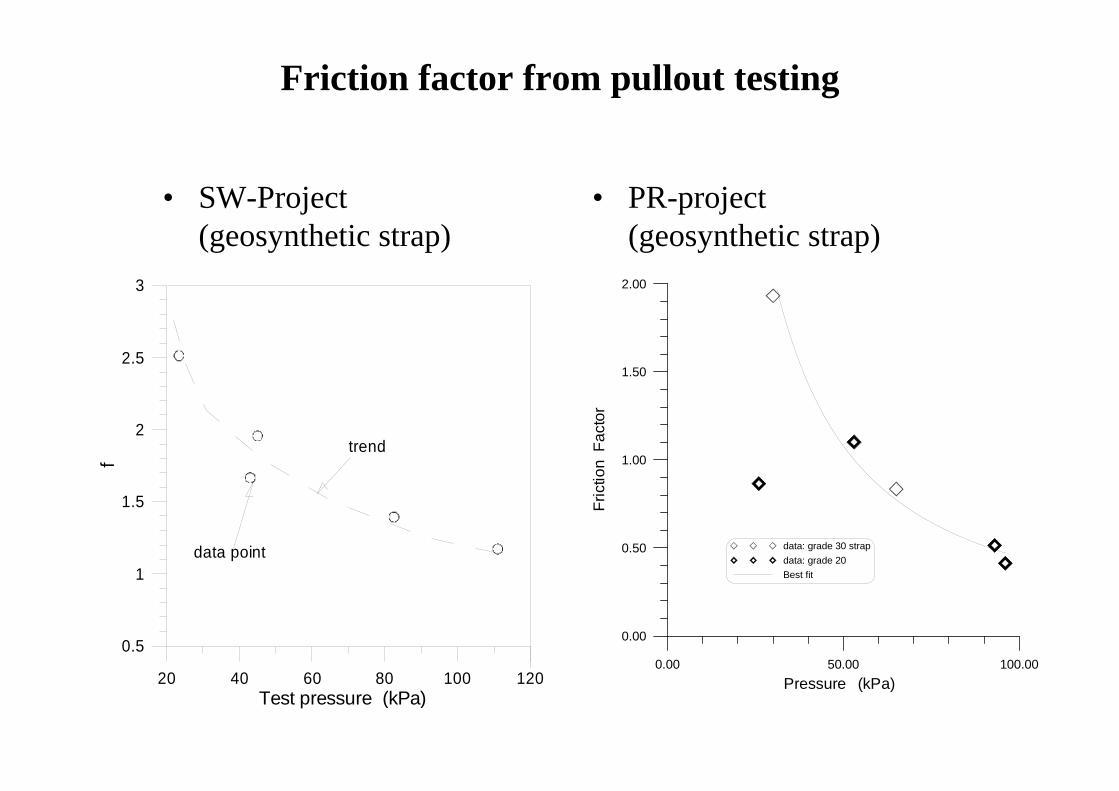
Friction factor from pullout testing
• SW-Project (geosynthetic strap)
• PR-project (geosynthetic strap)
20 40 60 80 100 120Test pressure (kPa)
0.5
1
1.5
2
2.5
3
f
trend
data point
0.00 50.00 100.00Pressure (kPa)
0.00
0.50
1.00
1.50
2.00
Fric
tion
Fac
tor
data: grade 30 strapdata: grade 20Best fit
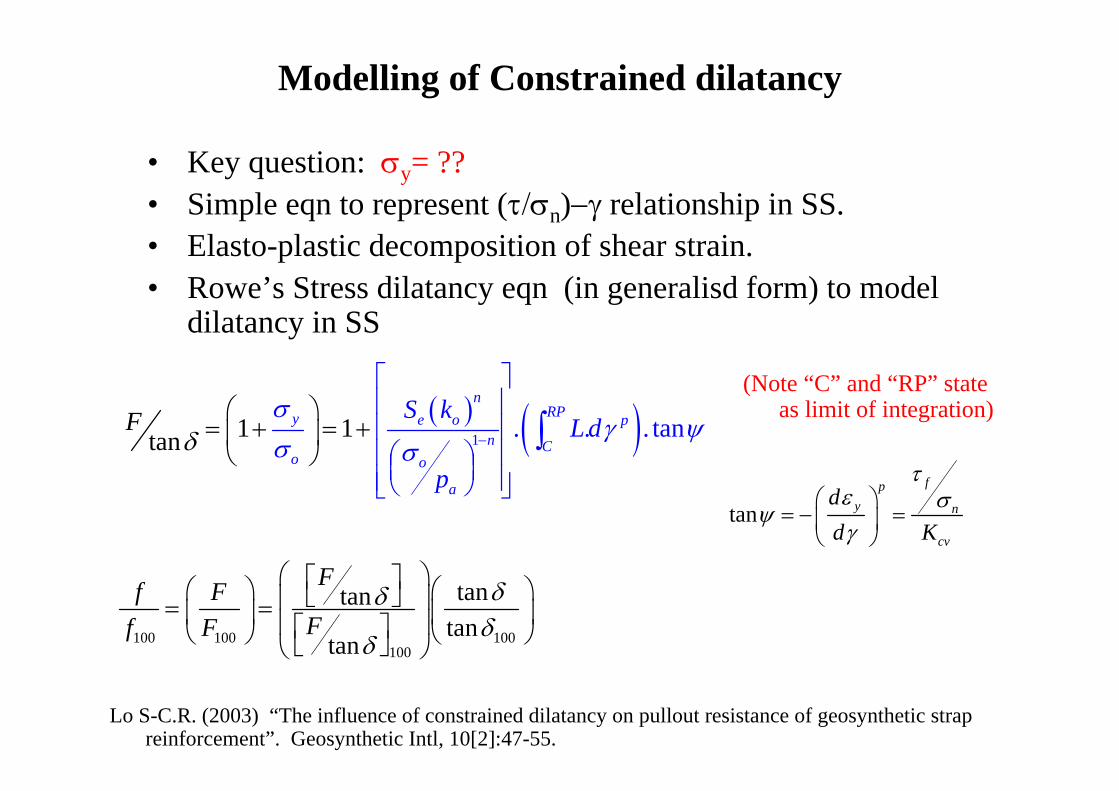
Modelling of Constrained dilatancy
• Key question: σy= ??• Simple eqn to represent (τ/σn)−γ relationship in SS.• Elasto-plastic decomposition of shear strain.• Rowe’s Stress dilatancy eqn (in generalisd form) to model
dilatancy in SS
( ) ( )1 . .1 1tan . tann
RPy e o pn C
o o
a
F S kL d
p
σγ ψδ σ σ −
⎡ ⎤⎢ ⎥⎢ ⎥⎢⎛ ⎞
⎛ ⎞= + = +⎜ ⎟
⎥⎜ ⎟⎢ ⎥⎠
⎝ ⎠⎝
⎣ ⎦
∫
100 100 100100
tantantan
tan
Ff FFf F
δδδ
δ
⎛ ⎞⎡ ⎤⎛ ⎞ ⎛ ⎞⎣ ⎦⎜ ⎟= =⎜ ⎟ ⎜ ⎟⎜ ⎟⎡ ⎤⎝ ⎠ ⎝ ⎠⎣ ⎦⎝ ⎠
tanfp
y n
cv
dd K
τε σψγ
⎛ ⎞= − =⎜ ⎟
⎝ ⎠
Lo S-C.R. (2003) “The influence of constrained dilatancy on pullout resistance of geosynthetic strap reinforcement”. Geosynthetic Intl, 10[2]:47-55.
(Note “C” and “RP” state as limit of integration)

M2 toll road project

M2 Abutment

M2 Construction
Modelling of Constrained dilatancy
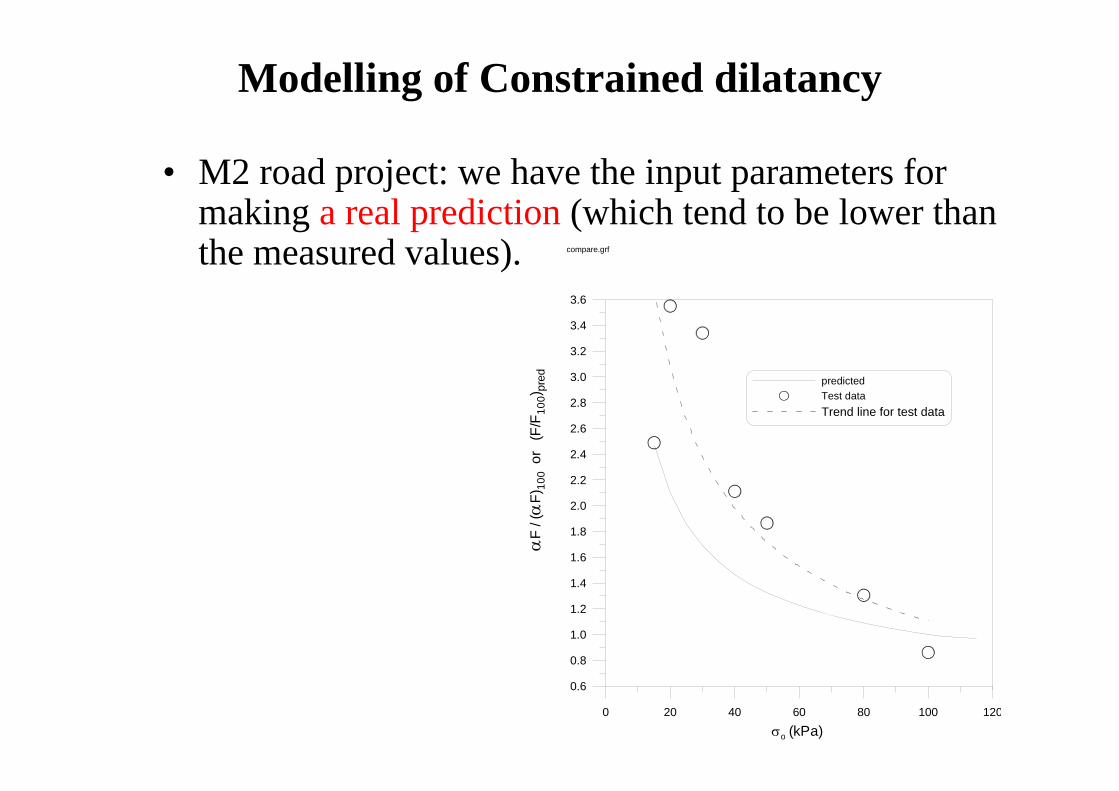
• M2 road project: we have the input parameters for making a real prediction (which tend to be lower than the measured values).
0 20 40 60 80 100 120
σo (kPa)
0.6
0.8
1.0
1.2
1.4
1.6
1.8
2.0
2.2
2.4
2.6
2.8
3.0
3.2
3.4
3.6
αF
/ (α
F)10
0 o
r (F
/F10
0)pr
ed predicted Test data Trend line for test data
compare.grf

Not so happy story
• Abutment wall• Severe reinforcement pullout issue.• Do not want to spoil your appetite

TBB wall
• Dutton Park rail abutment: somewhere between Brisbane and Gold Coast.
• Tied back-to-back subject to high partial UDL.
TBB wall
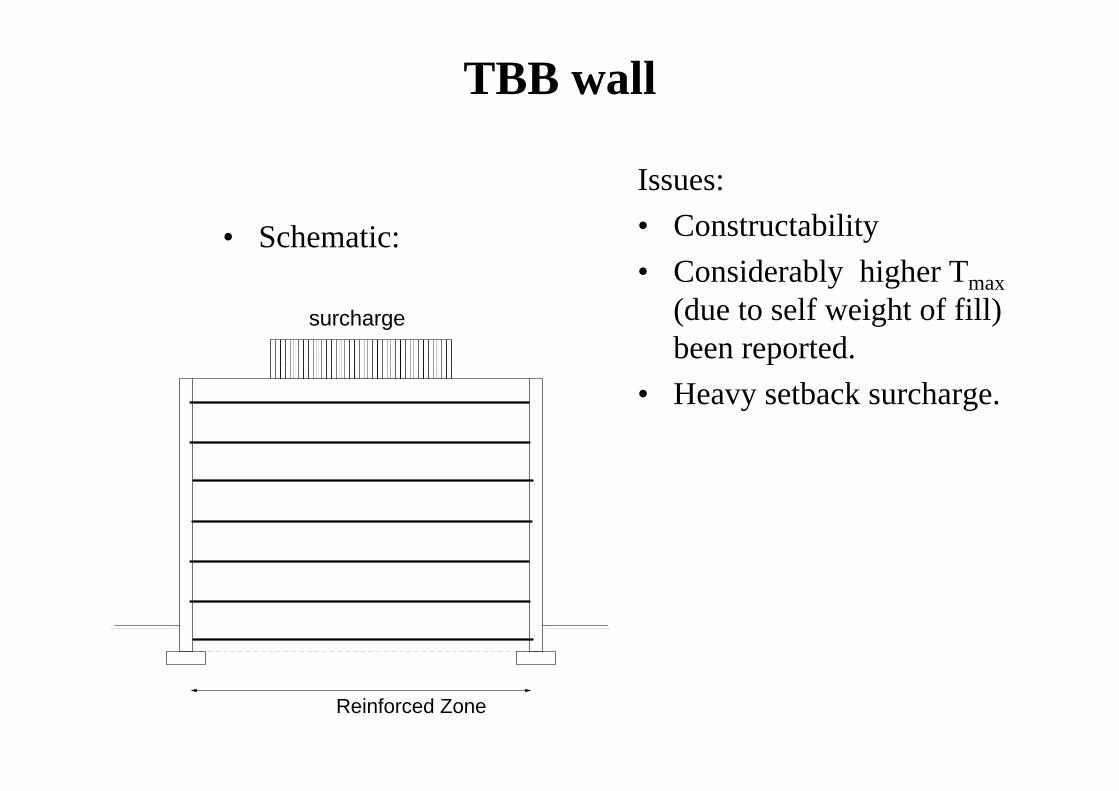
• Schematic:
Issues:• Constructability• Considerably higher Tmax
(due to self weight of fill) been reported.
• Heavy setback surcharge.
Reinforced Zone
surcharge
TBB wall
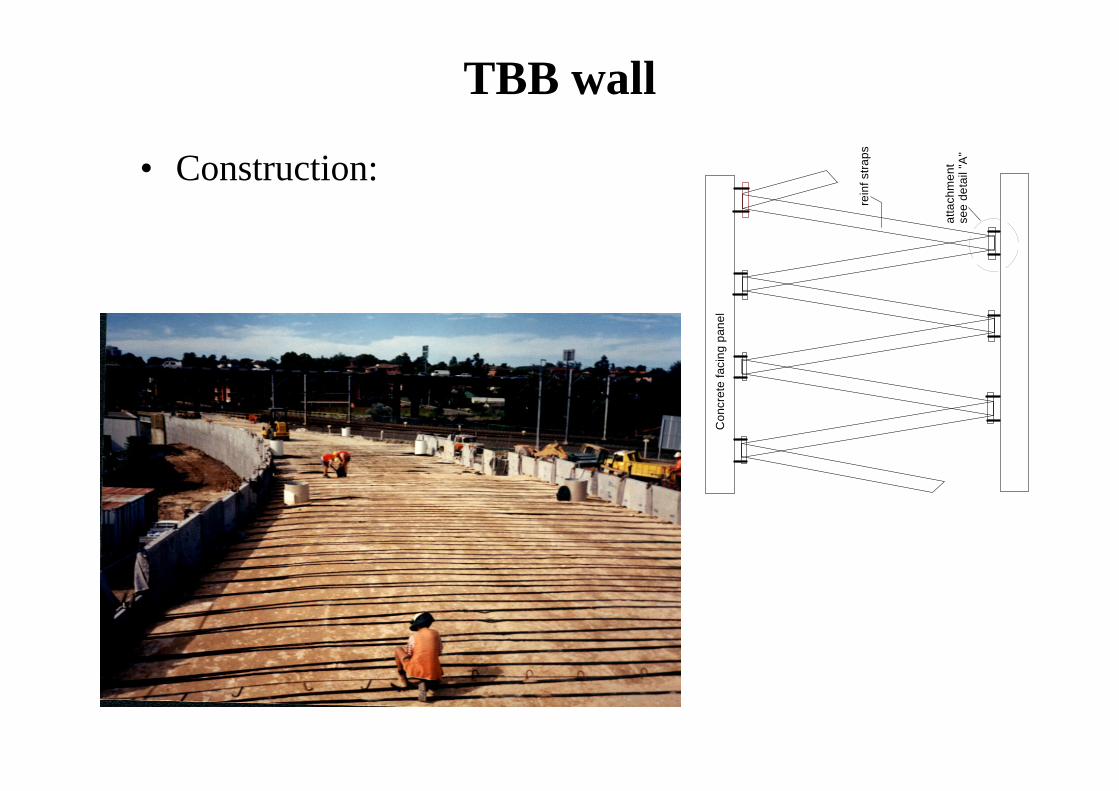
• Construction:
rein
f stra
ps
atta
chm
ent
see
deta
il "A
"
Con
cret
e fa
cing
pan
el

TBB wall: Issues
• Nonlinear FE analysis.• Results relevant to the design issues not sensitive
to assume soil models.• Conventional design eqns can be used for
calculating T due to self weight of fill and UDL.• Use FEA results to develop simplified method for
calculation ΔT due to setback surcharge.
Lo S.R., Li S-Q.Gopalan, M, and Gao Z. (1996) “Analysis and design of a geosynthetic tied back to back wall”. Geotechnical Engineering J., SE Asian Geot. Society, 27[1], 37-50.

Barnes Point Abutment
30 to 45 min drive from Gold Coast

Barnes Point Abutment
Reinforced
Zone
Blocks
Sill Beam
General Fill
Lo S.R. (2005) “A multi-tier mechanically stabilised soil wall – field performance and numerical modelling”. Chapter 30, Ground Improvements – Case Histories. Ed. Indraratna and Chu, Publisher Elsevier
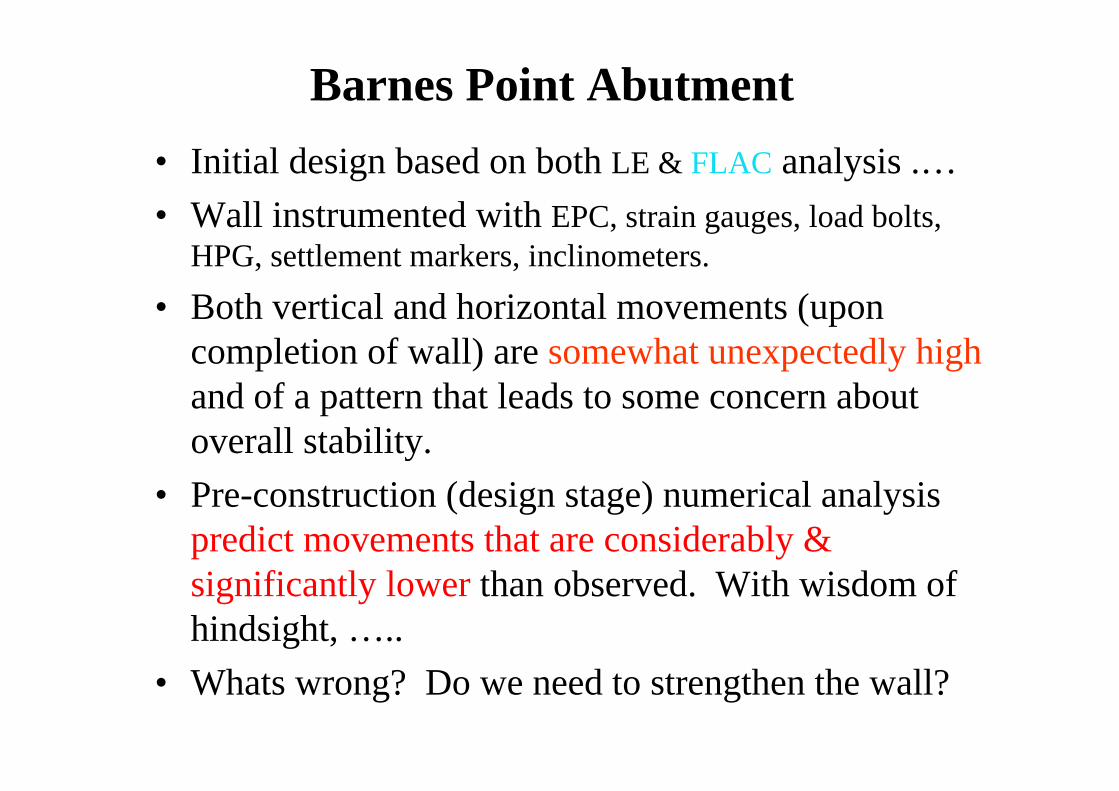
Barnes Point Abutment• Initial design based on both LE & FLAC analysis .…• Wall instrumented with EPC, strain gauges, load bolts,
HPG, settlement markers, inclinometers.
• Both vertical and horizontal movements (upon completion of wall) are somewhat unexpectedly highand of a pattern that leads to some concern about overall stability.
• Pre-construction (design stage) numerical analysis predict movements that are considerably & significantly lower than observed. With wisdom of hindsight, …..
• Whats wrong? Do we need to strengthen the wall?

Barnes Point Abutment
• Settlement at foundation level (note ~ 1000 day movement)

Barnes Point Abutment
• Wall settlement as measure by HPG• Lateral movement:
by inclinometer
0
5
10
15
20
25
Dep
th
(m)
0 50 100Horizontal displacement (mm)
natural ground level
Tier-3 level
75mm

Barnes Point Abutment
• Higher than expected movements at service state (working condition)– Can be accommodated by bridge articulation (MJ etc) – may or may not infer a safety (ULS) issue.
• Initial limit equilibrium analysis indicated adequate FOS, but ……
• Therefore, need to address the two separate limit states with the “same” calculation model (in our case the same numerical model).

Barnes Point Abutment
Challenges:• Not to predict the known movements at working
condition. Well, one can …• But to have a “single” analysis that can
– Give conservative prediction (hopefully not too conservative) relative to the known movements.
– continue to collapse (without the need of ad-hoc procedures to handle numerical ill-conditioning) so as to assess the safety margin of the wall.
• This means that our observations of higher than expected movements can be “fed” into the calculation of safety margin

Barnes Point Abutment • Strategy:
Estimate design parameters
Perform analysis to working condition
Computed movement ≥observed ?
Develop numerical model
Continue analysis to collapse
Adequate FOS ?OK
Refine model and/or parameters?
Additional investigation to refine parameters
Needs strengtheningY
N
N
Y
N
Y
Lo S.R. (2005) “A multi-tier mechanically stabilised soil wall – field performance and numerical modelling”. Chapter 30, Ground Improvements – Case Histories. Ed. Indraratna and Chu, Publisher Elsevier

Barnes Point Abutment
• Computed vertical settlement.
-2.000
-1.000
0.000
1.000
2.000
3.000
4.000
(*10^1)ndition with 20 kPa plus sill beam loading Contour interval = 20mm
Maximum settlement = 140 mm

Great Western Hwy: near Katoomba
• Use ribbed steel straps
Lo S.R., Yuen S.C.K., and Won G.W. (2004) “Pullout resistnce of ribbed steel strips in a crushed sandstone with high fines content”. Proc 9th ANZ conference in Geomechanics, Auckland, Vol 2, 682-688.

Issues
• All “near by” borrow areas gave select fill with high fines content. (Although very low clay content).
• Significant contractual implications if we need to hauled select fuil in (say from >100 km away).
• f = ? Should we jump into pullout box testing? • One need dilatant soil to get high f. • First study stress-dilatancy behaviour in Tx testing ….

Pullout resistance
• Pullout testing:
20 40 60 80 100 120Test pressure (kPa)
0.5
1
1.5
2
2.5
3
f
trend
data point
0 0.5 1 1.5 2
D= 1 - dεvol/dε1
1
2
3
4
5
6
R =
σ' 1
/σ' 3
• Stress-dilatancy plot:very dilatant behaviour
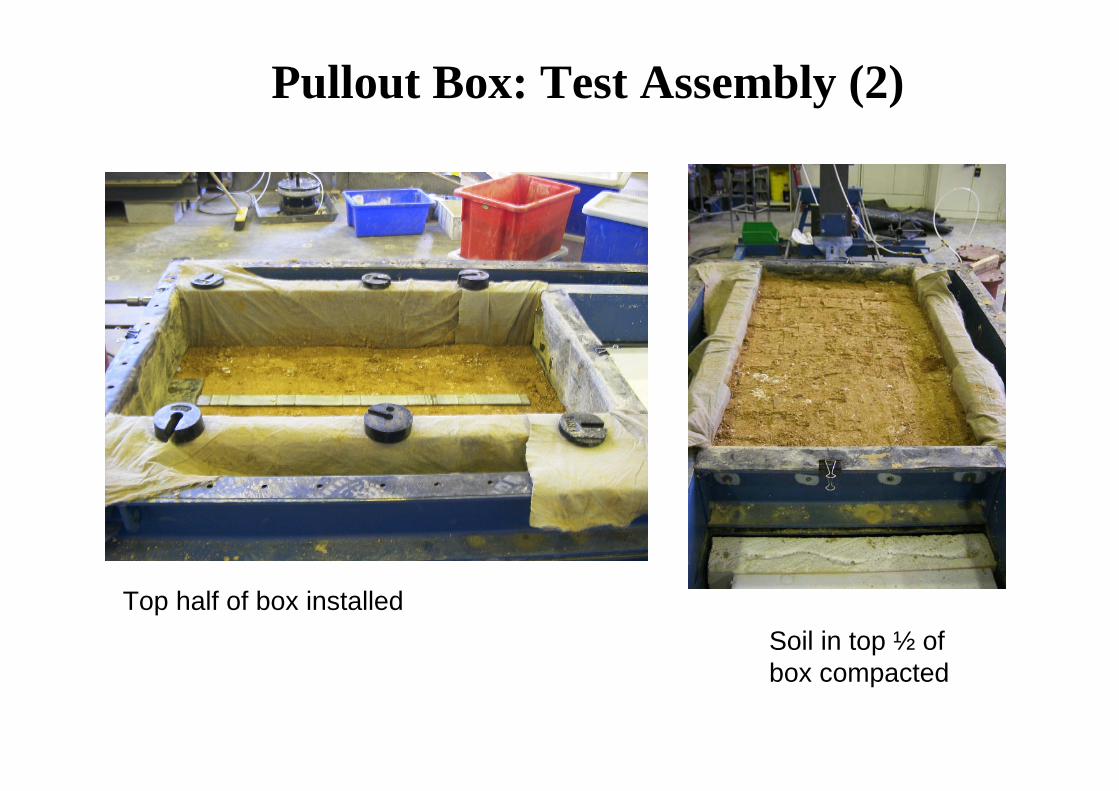
Pullout Box: Test Assembly (2)
Top half of box installedSoil in top ½ of box compacted

OB Mine
• For mining project in Qld.– in the middle of nowhere. – an challenging project.
General Fill
Select Fill
relieving slab
precastwall panels
5.5
m
4.0 m 2.0 m Foundation Soil
Reinforcement (geosynthetic straps)
Concentrated Line Load
2.7 m Concentrated Patch Load
• Working load:Front = 50kN/mRear = 25 kN/m
Lo S-C.R. (2003) “The influence of constrained dilatancy on pullout resistance of geosynthetic strap reinforcement”. Geosynthetic Intl, 10[2]:47-55.

OB Mine
• Simplified eqns for calculating Tmax and Lp problematic.• FLAC analyses conducted • At working load: T = 11.1kN/m. Lateral movement due
to application of LL is ~20mm.• What is T* for reinforcement rupture and pullout
resistance check.• Continue FLAC analysis beyond working load and
proceed to factored load.• What should be the factored soil parameters
– φ φ*– What should be the factored interface strength?

OB Mine
• Factored interface strength:
No interface yielding 14.52.0
Reduced interface yielding12.41.0
Extensive interface yielding11.11.25
RemarksT* (kN/m)Partial factor on f
** Issue of multiple failure modes **

Reinforced embankment
• Road embankment at L-Swamp: – 45 min north of Sydney– on the way to Central Coast

Reinforced embankment
• X-section
0 20 40 60 80Horizontal Distance (m)
-15
-10
-5
0
5
Ele
vatio
n (m
R.L
.)
Existing Embankment
Berm(Ordinary Fill)
Embankment Core (Light weight Fill)
R.L. 5.5mR.L. 4.8m
R.L. 3.1m
R.L. 1.1m
I2.2, I2.6
I2.1
Ordinary Fill
P2.1(P1.1)
P2.2(P1.2)
P2.3(P1.3)
P2.4(P1.4)
P2.5(P1.5)
P2.6(P1.6)
P2.7(P1.7)
P2.8(P1.8)
P2.10(P1.10)
P2.11(P1.11)
P2.12(P1.12)
P2.9(P1.9)
P2.13
P2.14
West
HPG Piezometer Earth Pressure Cell Inclinometer( ) Line-1 instrumentation Horizonal position of load bolts
Existing Lenghan Drive
LB8 LB9 LB10 LB11 LB12 LB13 LB14
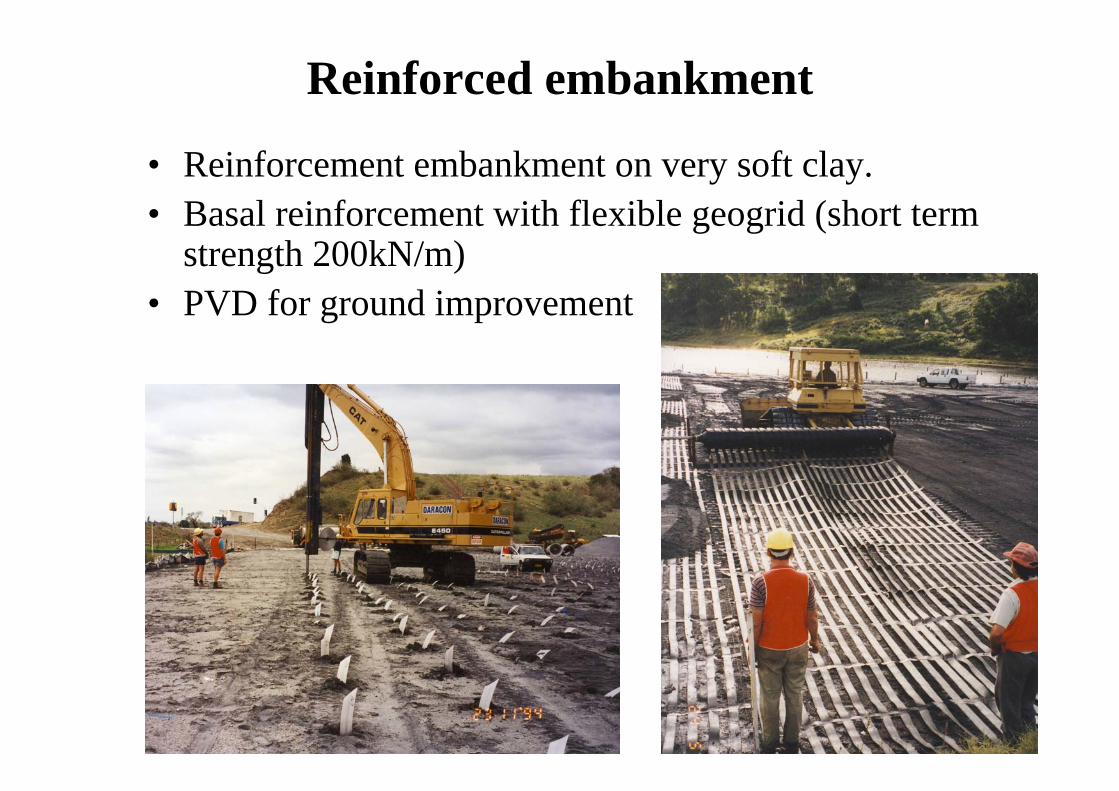
Reinforced embankment
• Reinforcement embankment on very soft clay.• Basal reinforcement with flexible geogrid (short term
strength 200kN/m)• PVD for ground improvement

Reinforced embankment
• Extensive instrumentation with 9 years of data.• Contribution of reinforcement to enhancing stability
and reducing settlement is slight.• However, it constrained lateral movement at
foundation level and thus prevent “lateral spreading”of embankment fill. ** The embankment fill is not an elastic material. Its strength & stiffness depends on confining stress.

Do you want me to go thro’ the 9 years of data ??

Thank YouThank You
Findings
• Realistic & detailed modelling.• Movement prediction higher than observed. • Probable due to over-conservative interpretation of
foundation condition.• Displacement pattern do not show the initiation of a
failure mechanism.• Continue the analysis by progressively reduce
foundation strength parameters until collapse is detected. This can be achieved “objectively” in FLAC.– FOS on tanφ’ of foundation ≥ 1.5.– Reinforcement tension remaining less than the rupture
strength.

Numerical model
• Computed horizontal settlement.
-2.000
-1.000
0.000
1.000
2.000
3.000
4.000
(*10^1)ndition with 20 kPa plus sill beam loading Contour interval = 20mm
Maximum lateral movement = 175 mm
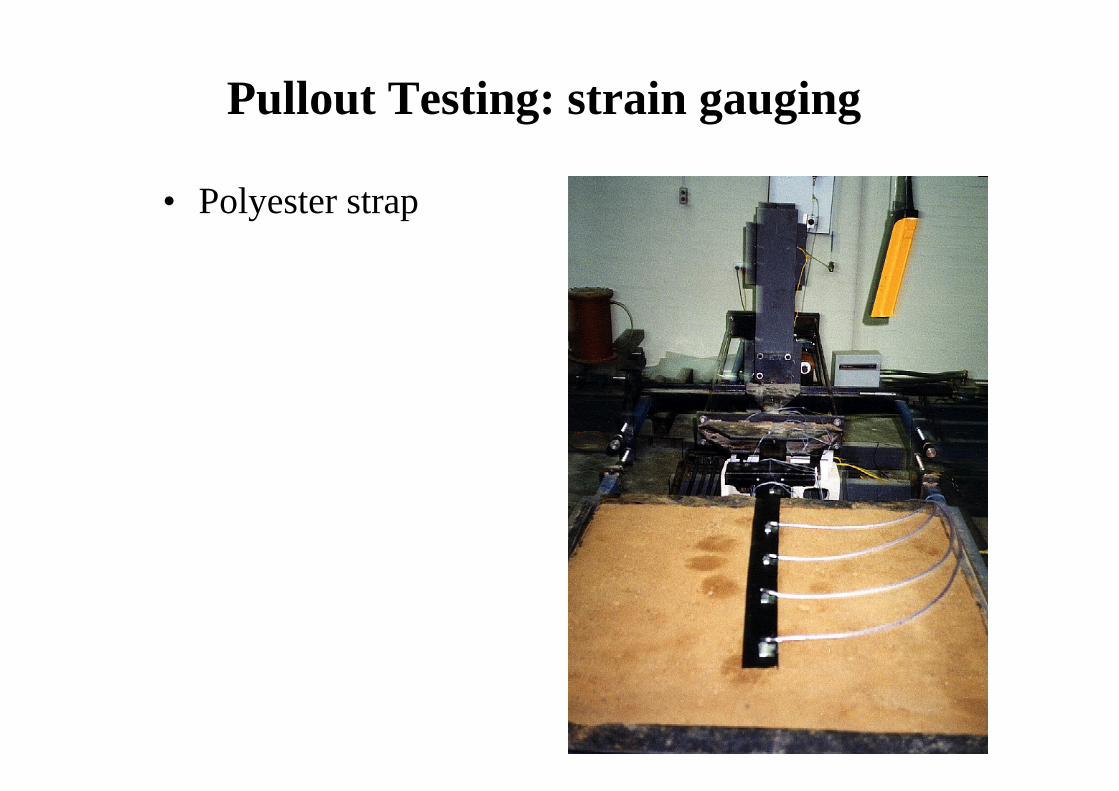
Pullout Testing: strain gauging
• Polyester strap

Progressive Pullout failure
• Progressive failure– Due to reinf extensibility– Lead to scaling factor α
Rp = (f).σv.(perimeter).Lp = (αF).σv.(perimeter).Lp
τ
x-relative
τ
x-relative
τ
x-relative
reinforcementfront rear
x-relative

Top and Bottom half of split box

Pullout Testing• Flexible sleeve to
– Remove shear stress transfer– Avoid interference with settlement of soil
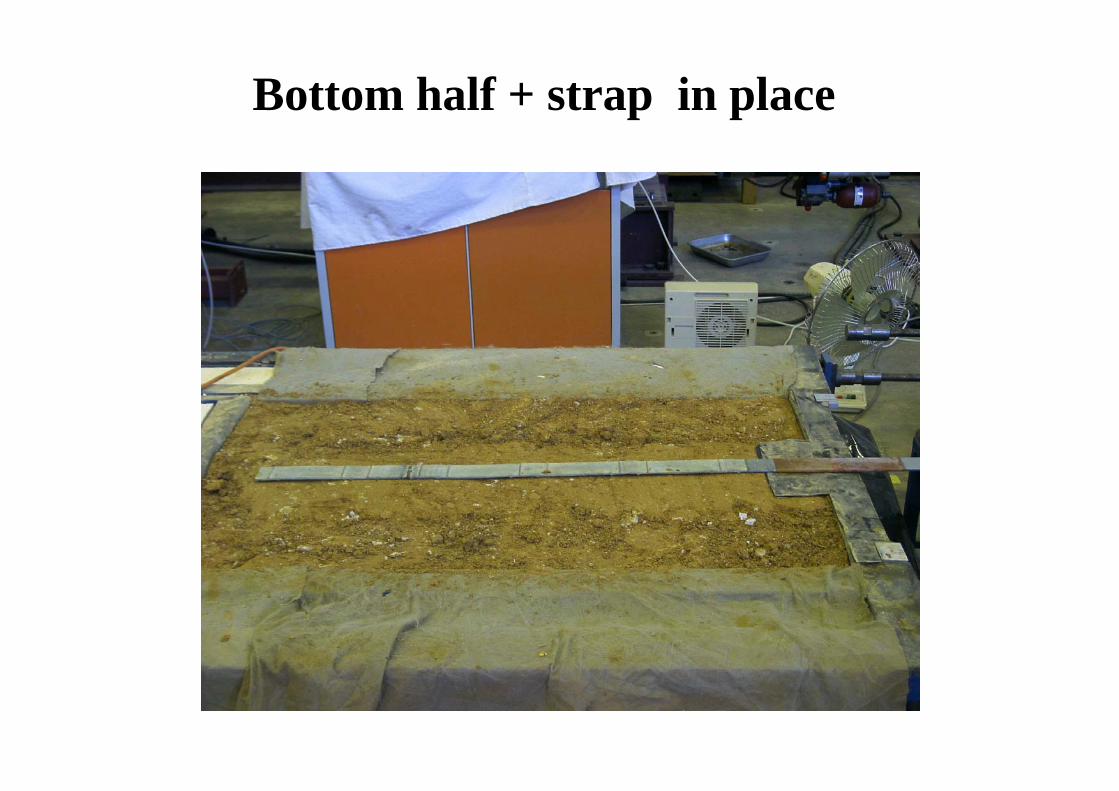
Bottom half + strap in place
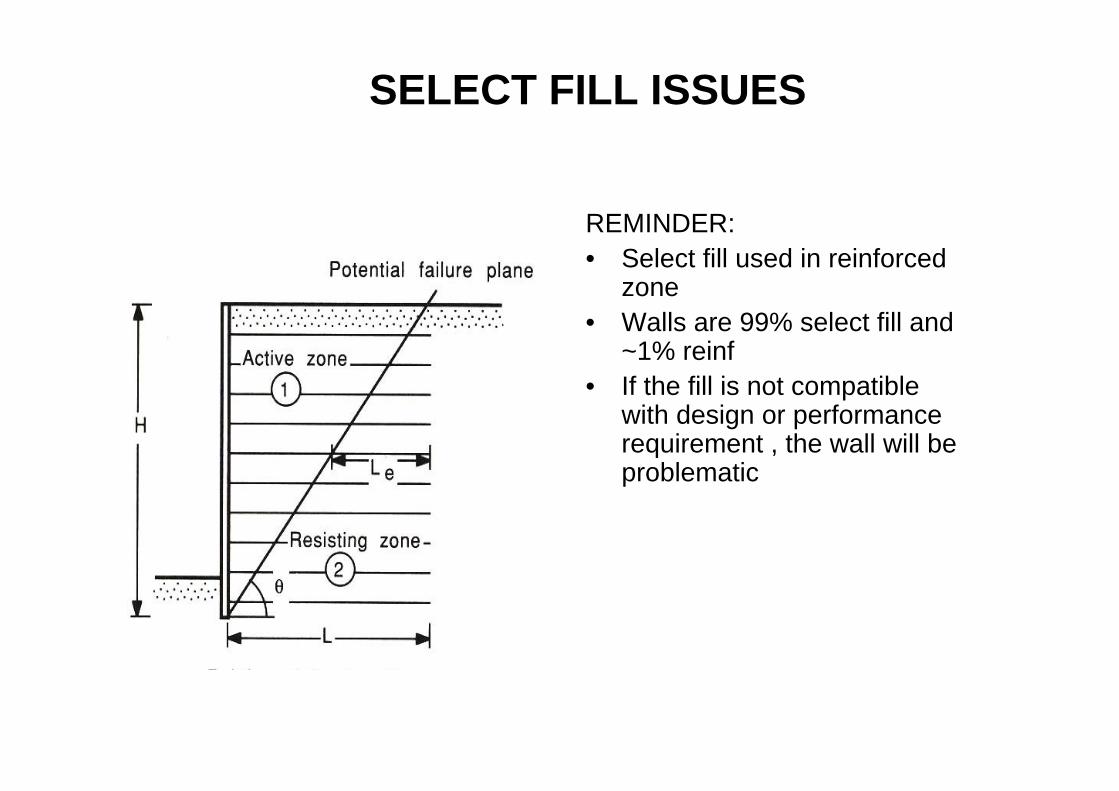
SELECT FILL ISSUES
REMINDER:• Select fill used in reinforced
zone• Walls are 99% select fill and
~1% reinf• If the fill is not compatible
with design or performance requirement , the wall will be problematic

RS Wall: stresses and Interactions


