
The Texas Medical Center Library The Texas Medical Center Library
DigitalCommons@TMC DigitalCommons@TMC
UT School of Public Health Dissertations (Open Access) School of Public Health
Spring 5-2019
REDESIGNING CARE: EVALUATION OF A POSTPARTUM REDESIGNING CARE: EVALUATION OF A POSTPARTUM
DEPRESSION SCREENING AND TREATMENT PROGRAM IN DEPRESSION SCREENING AND TREATMENT PROGRAM IN
OBSTETRIC CLINICS IN HOUSTON, TEXAS OBSTETRIC CLINICS IN HOUSTON, TEXAS
HALEY D. JACKSON UTHealth School of Public Health
Follow this and additional works at: https://digitalcommons.library.tmc.edu/uthsph_dissertsopen
Part of the Community Psychology Commons, Health Psychology Commons, and the Public Health
Commons
Recommended Citation Recommended Citation JACKSON, HALEY D., "REDESIGNING CARE: EVALUATION OF A POSTPARTUM DEPRESSION SCREENING AND TREATMENT PROGRAM IN OBSTETRIC CLINICS IN HOUSTON, TEXAS" (2019). UT School of Public Health Dissertations (Open Access). 60. https://digitalcommons.library.tmc.edu/uthsph_dissertsopen/60
This is brought to you for free and open access by the School of Public Health at DigitalCommons@TMC. It has been accepted for inclusion in UT School of Public Health Dissertations (Open Access) by an authorized administrator of DigitalCommons@TMC. For more information, please contact [email protected].

REDESIGNING CARE: EVALUATION OF A POSTPARTUM DEPRESSION
SCREENING AND TREATMENT PROGRAM IN OBSTETRIC CLINICS IN HOUSTON,
TEXAS
by
HALEY D JACKSON, MPH, BS
APPROVED:
CATHERINE L. TROISI, PHD
BEATRICE J. SELWYN, SCD
LUCY J. PURYEAR, MD
ROBERT MORGAN, PHD
DEAN, THE UNIVERSITY OF TEXASSCHOOL OF PUBLIC HEALTH

Copyrightby
Haley D Jackson, BS, MPH, DrPH2019

DEDICATION
To Willie Joseph Jackson

REDESIGNING CARE: EVALUATION OF A POSTPARTUM DEPRESSION
SCREENING AND TREATMENT PROGRAM IN OBSTETRICS CLINICS IN
HOUSTON, TX
by
HALEY D JACKSONBS, MERCER UNIVERSITY, 2006
MPH, MERCER UNIVERSITY SCHOOL OF MEDICINE, 2008
Presented to the Faculty of The University of Texas
School of Public Health
in Partial Fulfillment
of the Requirements
for the Degree of
DOCTOR OF PUBLIC HEALTH
THE UNIVERSITY OF TEXASSCHOOL OF PUBLIC HEALTH
Houston, TexasMay 2019

REDESIGNING CARE: EVALUATION OF A POSTPARTUM DEPRESSION
SCREENING AND TREATMENT PROGRAM IN OBSTETRIC CLINICS IN HOUSTON,
TEXAS
Haley D Jackson, BS, MPH, DrPHThe University of Texas
School of Public Health, 2019
Dissertation Chair: Beatrice J Selwyn, ScD
Postpartum depression is a common complication of childbirth and is often
underdiagnosed although it affects about 13-15% of new mothers (O’Hara and Swain, 1996;
Munk-Olsen et al., 2006). To improve detection and treatment for postpartum depression,
four obstetric clinics in Houston, Texas were trained to use the Edinburgh Postnatal
Depression Scale (EPDS) to screen women for postpartum depression at the 6 week
postpartum visit. The purpose of this study was to evaluate compliance with screening
women for postpartum depression at the 6 week postpartum visit, with referring women that
score at-risk to the women’s reproductive mental health clinic, and with treating at-risk
women referred to the women’s reproductive mental health clinic in two service delivery
models - co-located and integrated. The co-located model refers to 3 obstetric clinics and the
women’s reproductive mental health clinic being located within a single building, while the
integrated model refers to a women’s reproductive mental health provider being embedded
inside of a single obstetric clinic.
Postpartum women presenting for a 6 week postpartum visit at four obstetric clinics
in Houston, Texas from October 1, 2014 – September 30, 2016 were included in the study

and their outcomes were traced across the continuum of the training protocol from screening,
referral to care and treatment at the women’s reproductive mental health clinic. The
integrated service delivery model screened women at the 6 week postpartum visit
significantly more than the co-located service delivery model (p < 0.001) and was 62% more
likely to refer women at-risk of postpartum depression to the women’s reproductive mental
health.
There was not a significant difference in getting women into treatment between the
two service delivery models; however, when considering outcomes of the protocol and off
protocol findings, the rate of women getting into treatment is higher in both models
compared to what has been reported in the literature (Rowan P. , Greisinger, Brehm, Smith,
& McReynolds, 2012) (Horowitz & Cousins, 2006).

TABLE OF CONTENTS
List of Tables ............................................................................................................................. i
List of Figures ........................................................................................................................... ii
List of Appendices ................................................................................................................... iii
Background................................................................................................................................1
Public Health Significance...................................................................................................4
Literature Review.......................................................................................................................6
Defining Maternal Depression.............................................................................................6Screening for Maternal Depression .....................................................................................6Systems of Care/Health Services Delivery ..........................................................................9Impact of Healthcare System Design on Health Outcomes...............................................10
Conceptual Models ..................................................................................................................12
Donabedian Quality-of-Care Framework ..........................................................................12Framework for Levels of Integrated Healthcare................................................................13
Methods....................................................................................................................................16
Research Aims ...................................................................................................................16Study Design......................................................................................................................16Definitions and Measures ..................................................................................................17Service Delivery Models....................................................................................................18Procedures..........................................................................................................................18Ascertainment ....................................................................................................................22Sample Size........................................................................................................................25Analysis..............................................................................................................................26
Results......................................................................................................................................29
Service Delivery Model Characteristics ............................................................................29Population Characteristics .................................................................................................29Specific Aim 1 ...................................................................................................................31Specific Aim 2 ...................................................................................................................31Specific Aim 3 ...................................................................................................................32Confounding and Interaction .............................................................................................32Further Evaluation .............................................................................................................35
Discussion ................................................................................................................................48
Limitations .........................................................................................................................51Future Research .................................................................................................................54Future Program Design ......................................................................................................55
Conclusion ...............................................................................................................................58
Appendices...............................................................................................................................59
References................................................................................................................................69

i
LIST OF TABLES
Table 1. Depression screening tools and associated characteristics (American College of
Obstetricians and Gynecologists, 2015). .................................................................................. 8
Table 2. Inclusion and exclusion criteria for postpartum study population............................ 23
Table 3. Staffing and operational characteristics of trained obstetric practices by service
delivery model, October 1, 2015 – September 30, 2016. ....................................................... 37
Table 4. Comparison of outcomes of interest (screened at 6 week postpartum visit, at-risk of
postpartum depression (PPD), referred to women's reproductive mental health clinic within 1
day, completed an appointment at the women's reproductive mental health within 60 days of
referral), by service delivery model, October 1, 2014 - September 30, 2016......................... 38
Table 5. Stratified analysis to assess confounding and interaction between service delivery
model and sociodemographic characteristics for screening at the 6 week postpartum visit,
October 1, 2014 – September 30, 2016................................................................................... 39
Table 6. Stratified analysis to assess for confounding and interaction between service
delivery model and sociodemographic characteristics for scoring at-risk at the 6 week
postpartum visit, October 1, 2014 – September 30, 2016. ................................................... 40
Table 7. Stratified analysis to assess for confounding and interaction between service
delivery model and sociodemographic characteristics for referral within 1 day, October 1,
2014 – September 30, 2016. ................................................................................................... 41
Table 8. Stratified analysis to assess for confounding and interaction between service
delivery model and sociodemographic characteristics for completing an appointment at the
women’s reproductive mental health clinic within 60 days of referral, October 1, 2014 –
November 30, 2016................................................................................................................. 42

ii
Table 9. Sociodemographic characteristics of unique women at the 6 week postpartum visit
that received a best practice advisory (BPA) alert and were screened the first time the BPA
alert fired at 6 weeks postpartum visit, screened at-risk for postpartum depression on the
EPDS, were referred within 1 day of scoring at-risk on the EPDS and were treated at the
women’s reproductive mental health clinic within 60 days of referral, by service delivery
model, October 1, 2014 – September 20, 2016....................................................................... 43
Table 10. Referral rates and outcomes for women at-risk women of postpartum depression at
the 6 week postpartum visit, comparing two service delivery models, October 1, 2014 –
September 30, 2016. ............................................................................................................... 45
Table 11. Treatment rates and outcomes for women at-risk of postpartum depression at the 6
week postpartum visit that received a referral to the women’s reproductive mental health
clinic, comparing service delivery models, October 1, 2014 – November 30, 2016.............. 46

ii
LIST OF FIGURES
Figure 1. Donabedian Framework for Quality of Care (Lighter, 2015). ................................ 13
Figure 2. Core descriptions for six levels of integration (Heath, Wise and Reynolds, 2013). 15
Figure 3. Distribution of EPDS scores for all women screened at 6 weeks postpartum in the
co-located and integrated service delivery models. ................................................................ 47

iii
LIST OF APPENDICES
Appendix A. Edinburgh Postnatal Depression Scale.............................................................. 59
Appendix B. Screening and Referral Process Map for Obstetric Clinics ............................... 60
Appendix C. Results from published literature on outcomes from screening for postpartum
depression (Exposure A: Sit & Wisner, 2009; Exposure B: LaRocco-Cockburn, et al., 2013).
................................................................................................................................................. 61
Appendix D. Screenshot of sample size calculation from nQuery. ........................................ 62
Appendix E. Map of trained obstetric clinics and women's reproductive mental health
services by location and service delivery model type............................................................. 63
Appendix F. Stacking diagram of co-located service delivery model and floor plan for
integrated service delivery model. .......................................................................................... 64
Appendix G. Cascading diagram depicting sample size included and excluded for study
population, combined service delivery models, October 1, 2014 - September 30, 2016. ...... 66
Appendix H. Detailed information on referral rates and outcomes for women at-risk of
postpartum depression at the 6 week postpartum visit, comparing service delivery models,
October 1, 2014 – September 30, 2016................................................................................... 67
Appendix I. Detailed information on treatment rates and outcomes for women at-risk of
postpartum depression at the 6 week postpartum visit, comparing service delivery models,
October 1, 2014 – September 30, 2016................................................................................... 68

1
BACKGROUND
Postpartum psychiatric disorders span a continuum and are generally classified as
postpartum blues (often referred to as baby blues), postpartum depression and postpartum
psychosis (Di Florio, Smith, & Jones, 2013). Maternal depression, also referred to as
perinatal depression, spans pregnancy and the year following delivery (American College of
Obstetricians and Gynecologists, 2015). After delivery, women are vulnerable to postpartum
psychiatric disorders due to the rapid decline in estrogen and progesterone, as well as the new
responsibility of caring for a newborn (Nolen-Hoeksema, 2001). Postpartum blues is the
most common and typically resolves within the first 2 weeks postpartum (Bashiri &
Spielvogel, 1999). Postpartum psychosis is the rarest, affecting about 0.2% of women and is
considered a medical emergency (Di Florio, Smith, & Jones, 2013). Postpartum depression
affects approximately 13-15% of new mothers and can be diagnosed up to 1 year after
delivery (O’Hara and Swain, 1996; Munk-Olsen et al., 2006). Santoro et al. (2010) estimate
that 45-65% of women with no prior history of depression experience their first episode of
depression within the first year postpartum. Furthermore, epidemiologic studies have
demonstrated that women are more likely to be admitted to a psychiatric unit after giving
birth than at any other time in their lives (Kendall et al., 1976; Evans et al., 2001).
Among younger and socioeconomically disadvantaged mothers, the prevalence of
postpartum depression is about 23% (Hobfoll et al., 1995). Risk factors for developing
postpartum depression include a history of depression, experiencing depression or anxiety
during the pregnancy, and low socioeconomic status (O’Hara and Swain, 1996). In addition,
a woman’s relationship with her partner can be a predictive variable for postpartum

2
depression; women that are less satisfied, have higher levels of conflict, and receive less
support from their partners are potentially at greater risk for postpartum depression (O’Hara
and Swain, 1996).
Because maternal depression is often underdiagnosed, recent literature has
encouraged screening to improve the identification of women that may benefit from
treatment (Evins, Theofrastous, & Galvin, 2000; American Council of Obstetricians and
Gynecologists, 2015). Using the Edinburgh Postnatal Depression Scale (EPDS), a tool
validated to identify maternal depression, with a cut-off of ≥ 10 points, Evins, Theofrastous,
& Galvin (2000) found that having a universal postpartum depression screening protocol in
an outpatient setting improved detection rates compared to not having a universal screening
protocol (35.4% and 6.3%, respectively). Further, the American College of Obstetricians and
Gynecologists (2015) endorses screening during pregnancy and postpartum, but only with
appropriate follow-up and treatment. Because a woman’s risk of developing depression is
higher in the first year postpartum, obstetric providers are key to improving the recognition
of postpartum depression (Bhat, Reed, & Unutzer, 2017). Many women consider their
obstetric provider to be their primary care provider, seeking care from obstetric and
gynecological providers between pregnancy episodes (Melville et al., 2014).
Validated screening tools are available to assist with the identification of maternal
depression (Boyd, Le, & Somberg, 2005; Myers, et al., 2013). The Edinburgh Postnatal
Depression Scale was developed by Cox, Holden and Sagovsky (1987) to screen new
mothers for postpartum depression taking into account that many symptoms of new
motherhood may overlap with common symptoms of depression. It is arguably the most

3
commonly used tool to identify maternal depression (Boyd, Le, & Somberg, 2005). While
most extensively used, the EPDS compares favorably to other validated tools that measure
depression including the Patient Health Questionnaire (PHQ-9) (Yawn et al., 2009).
Women experiencing symptoms of postpartum psychiatric illnesses often refrain from
treatment, despite the availability of services (Moore, Ayres and Drey, 2016; Rowan et al.,
2012; Horowitz & Cousins, 2006). The Center on the Developing Child at Harvard
University (2009) found that large numbers of affected women often are not identified and
only 15% of affected women get treatment (de Albuquerque, 2017). Reasons women do not
seek treatment when available vary from lack of knowledge of the illness, poor literacy,
failure to disclose symptoms to their provider, to shame and/or social stigma (Moore, Ayres
and Drey, 2016). Healthcare service delivery design has the potential to impact access to and
use of health care resources, which can affect healthcare outcomes of individuals and
populations. Ramdas, Teisberg and Tucker (2012) postulate that location of service delivery
is an often overlooked characteristic that influences outcomes. The authors go on to say that
when access to services is difficult, patients are less likely to adhere to a provider’s
recommendations, which can compromise outcomes (Ramdas, Teisberg and Tucker, 2012).
Applying service delivery design concepts to treating women for postpartum psychiatric
disorders may have implications on a woman’s likelihood to follow-through and receive
available care for a treatable condition.

4
Public Health Significance
Postpartum depression has implications far reaching beyond the affected mother
(Goodman et al., 2011; Bernard-Bonnin, 2004; Curtis et al., 2014; Balbierz et al., 2015;
Tuttle and Kendall, 2011). Not only is the mother impacted, but the child and family are also
at risk of experiencing negative consequences (Goodman et al., 2011). Research indicates
that children of depressed women often experience negative behavioral and cognitive
consequences beginning in infancy and continuing throughout adolescence (Bernard-Bonnin,
2004).
Negative consequences for the child may include, but are not limited to, poor mother-
infant bonding, withdrawal, anger, lower cognitive performance, passive noncompliance,
anxiety and conduct disorders, substance and alcohol dependence and attention deficit /
hyperactivity disorder (Bernard-Bonnin, 2004). In addition to negative effects on the child,
Curtis et al. (2014) found robust evidence that maternal mental illness places families with
young children at risk for homelessness. Balbierz et al. (2015) examined the association
between postpartum depression and parenting and found that, compared to non-depressed
mothers, mothers with postpartum depression were less likely to always use a car seat, less
likely to place the infant in the back to sleep position, and more likely to bring their babies to
the emergency room. Children of depressed mothers also have higher medical claims than
children of healthy women because they bear a higher burden of illness, use health services
more frequently and have more medical office and emergency department visits (Tuttle and
Kendall, 2011). Because maternal depression has potentially far-reaching harmful effects on
families and children, its widespread incidence has the potential to have negative and

5
potentially preventable impacts on children, women and families. (Center on the Developing
Child at Harvard University, 2009).
In 2014, the Women’s Mental Health Delivery System Reform Incentive Payments
(DSRIP) project began with two goals: (1) train obstetric and pediatric practices to
implement universal screening for maternal depression in hopes of improving the detection
of this treatable condition, and (2) to expand access to women’s reproductive mental health
services in Greater Houston. This research will explore process and short-term outcomes of
postpartum screening in the project, comparing two distinct service delivery models: an
integrated model where women’s reproductive mental health services are embedded into the
obstetric clinic, and a co-located model where women’s reproductive mental health services
are in the same building with the obstetric clinic.
Using four obstetric practices that were trained to use a validated screening tool and
protocol further described later in the paper, the current research aims to compare compliance
with implementing universal postpartum depression screening among postpartum women
within two distinct service delivery models. Furthermore, the aim is to compare compliance
with implementing universal referral for postpartum women who screen at-risk for
postpartum depression within two distinct service delivery models and lastly, to compare
follow-through to treatment among at-risk postpartum women referred to women’s
reproductive mental health services within two distinct delivery models.

6
LITERATURE REVIEW
Defining Maternal Depression
The Diagnostic and Statistical Manual of Mental Disorders, Fifth Edition (DSM-V;
2013), defines maternal depression as a diagnosis of major depression and is differentiated by
the peripartum-onset specifier “during pregnancy or within 4 weeks after childbirth.” The
previous version, DSM-IV (2000), recognized major depression with a postpartum-onset.
The onset-specifier was broadened in DSM-V to recognize that the onset of depression can
occur throughout the peripartum period. Though this is the definition in the DSM-V, several
experts dispute that the onset be limited to the first four weeks after delivery. Instead, experts
agree that the onset can occur at any time within the first year after delivery (ACOG, 2015).
Screening for Maternal Depression
The American College of Obstetricians and Gynecologists (ACOG) (2015) states that
screening for maternal depression is not sufficient to improve clinical outcomes. ACOG
advocates that screening must be combined with appropriate follow-up and treatment when
indicated. They further recommend that clinicians screen patients at least once during the
perinatal period for depression symptoms using a standardized, validated tool and suggests
that clinical staff in obstetrics and gynecology practices be prepared to initiate medical
therapy, refer patients to appropriate behavioral health resources when indicated, or both.
Several instruments have been validated to assist with systematically screening for
maternal depression during pregnancy and the postpartum period (Table 1). de Albuquerque
Moraes (2017) reviewed various instruments used over a recent 5-year period to screen and
diagnose postpartum depression and found the Edinburgh Postnatal Depression Scale (EPDS)

7
to be the most commonly used validated tool. The EPDS consists of 10 self-reported items,
takes less than 5 minutes to complete, has been translated into more than 12 languages, has a
low required reading level, and is easy to score (ACOG, 2012). The EPDS was developed to
avoid over-identification of postpartum depression based on physical symptoms such as
fatigue, weight and appetite changes, and problems with sleeping that can be suggestive of
depression but are a normal part of postpartum recovery (Yawn, 2009). Other validated
scales include the Patient Health Questionnaire 9, Beck Depression Inventory, Postpartum
Depression Screening Scale and the Center for Epidemiologic Studies Depression Scale;
however, these screening tools include somatic symptoms, which can make differentiating
normal physiological responses and symptoms of postpartum depression difficult (Whiffen,
1988).

8
Table 1. Depression screening tools and associated characteristics (American College of
Obstetricians and Gynecologists, 2015).
Because women are at higher risk for depression than men, especially during
reproductive years, Bhat, Reed, & Unutzer (2017) posit that obstetrician-gynecologists play a
key role in recognizing women in need of extra support and treatment for depression and
provide a framework for managing depression within a clinic practice. In addition to seeing
the woman frequently for care during phases of life when she is at highest risk, many women
also consider their obstetric provider as their primary care provider (Melville et al., 2014).
Rowan et al. (2012) implemented systematic screening for maternal depression in
obstetric clinics in Houston and found that 4.6% (N=2,199) of pregnant women screened
positive for symptoms of maternal depression. When referred for behavioral health
assessment, none of the women pursued further treatment. The prevalence of depression

9
during postpartum visits was slightly higher (4.9%) with 17.9% self-reporting receiving
treatment after referral (Rowan, 2012). Rowan et al. (2013) conducted a follow-up study to
understand barriers to receiving further treatment and concluded that better coordination and
additional resources and education within the clinic setting may positively impact women
seeking treatment for maternal depression.
Systems of Care/Health Services Delivery
Crossing the Quality Chasm (2001) was released in 2001 and proposed a transformed
health care system, challenging stakeholders to act and bring about change to improve quality
of care via health care delivery. Before Crossing the Quality Chasm, Stroul & Freidman
(1986) introduced the system of care approach in response to the systemic problems in
serving children, youth and young adults with mental health challenges and their families.
Originally, the goal of systems of care was to create a comprehensive spectrum of mental
health and other necessary services organized into a coordinated network to meet the
multiple needs of children and their families (Stroul et al., 2015). With demonstrated
outcomes and improvements due to the structured framework, systems of care gained
popularity and application in other areas of health care. Updated in 2010, the system of care
framework now incorporates applicability to other populations, recognizes its relevance
across the developmental spectrum from early childhood to adults, broadens
conceptualization of services to incorporate a public health approach and captures the
dynamic nature of systems of care (Stroul et al., 2015). Systems of care intends to provide a
framework and philosophy to guide service delivery for people with mental health challenges
and should be viewed as a paradigm shift to describe how a range of services can be

10
provided, which are guided by philosophy and supported by infrastructure (Stroul et al.,
2015). It is not intended for any two implementations to be alike; each implementation will
engage in its own process based on its resources, goals and existing landscape (Stroul et al.,
2015).
The systems of care model consists of three interrelated parts: (1) conceptualization,
(2) operationalization and (3) implementation (Stroul et al., 2015). Conceptualization
includes the set of values and principles that are the foundation for the services provided.
Operationalization is the infrastructure and includes providers, technology, patients, clinics
and other critical components. Lastly, implementation includes the intervention at the
services delivery level that are consistent with the values and principles (Stroul et al., 2015).
Vinson et al. (2001) conducted a systematic review of the literature to examine twenty-seven
communities that implemented systems of care and their outcomes over a five-year period.
Researchers found that after five years, no system fully implemented a system of care to
comprise an ideal system, even those sites with experience in system reform (Vinson et al.,
2001). This indicates there are challenges with practical application; however, implementing
components of the full model proved beneficial (Vinson, et al., 2001). The updated systems
of care framework can be applied to other areas of mental health, such as maternal
depression, to improve outcomes for mothers, babies and families.
Impact of Healthcare System Design on Health Outcomes
Healthcare system design can impact health outcomes (Heath, Romero, & Reynolds,
2013; Gjerdingen & Yawn, 2007). Heath, Romero & Reynolds (2013) present a conceptual

11
framework, the Framework for Levels of Integrated Healthcare, for bridging healthcare and
bringing various types of care together, specifically primary care and mental health care. The
proposed framework is a continuum of three models, each with increasing levels of
collaboration and integration among various types of care, but with the goal of treating the
whole patient (Health, Romero & Reynolds, 2013). The three models of care are
coordination, co-location and integration, in ascending order of collaboration (Health,
Romero & Reynolds, 2013). Authors of the framework hypothesize that higher levels of
collaboration and integration between primary care and mental health providers likely
improves positive health outcomes for the patient (Health, Romero & Reynolds, 2013).
Furthermore, Gjerdingen and Yawn (2007) state that for screening for maternal
depression to positively impact clinical outcomes, it must to be combined with care within a
system that can identify women at risk, include collaborative relationships between medical
providers and mental health providers (Framework for Levels of Integrated Healthcare), and
connect women to appropriate treatment and follow up. Following the Framework for Levels
of Integrated Healthcare proposed by Heath, Romero and Reynolds (2013), Myors et al.,
(2013) reviewed outcomes of various levels of collaboration and integrated services for
perinatal mental health. For patients and families, benefits of integrated care models included
individualized care, access to multidisclipinary services with various treatments, detailed
assessment and planning, more choices for patients and averting distress to children and
families (Myors et al., 2013). Authors also reported benefits to providers and the
organizations, which included improved confidence and communication among providers
and a reduction in wasted resources and redundancies in care (Myors et al., 2013).
12
CONCEPTUAL MODELS
Donabedian Quality-of-Care Framework
The Donabedian framework is arguably the most referenced quality of care
framework (Ayanian & Markel, 2016). Consisting of three components, the Donabedian
framework proposes a triad of structure, process and outcome to evaluate health care quality
(Ayanian & Markel, 2016; Figure 1). Structure indicates the setting in which care is delivered
and affects processes and outcomes. Process describes the components of care delivered.
Outcome indicates the combined effects of structure and process and is chosen to measure
performance or process. To impact outcome, structure and process should be manipulated.
As it relates to this proposed research, the Donabedian framework will serve as the
theoretical framework to build upon aims 1 and 2. Aim 1 is to compare compliance with
implementing universal postpartum depression screening among postpartum women within
two distinct service delivery models. Structure includes the clinic, clinic location and staff
that will be screening and workflow. Process encompasses the screening and referral process
for postpartum depression, related to aim 2, which will compare compliance with
implementing universal referral for postpartum women who screen at-risk for postpartum
depression within two distinct service delivery models. Lastly, the outcome will be follow-
through with treatment for postpartum depression at the women’s reproductive mental health
clinic.

13
Figure 1. Donabedian Framework for Quality of Care (Lighter, 2015).
Framework for Levels of Integrated Healthcare
Heath, Romero, & Reynolds (2013) suggest that integration, the bringing together of
healthcare components, is a key component of healthcare that is essential to improving a
patient’s experience of care. Traditionally, integration has been used to reference various
primary care and behavioral health service delivery models. Recently, Heath, Wise and
Reynolds (2013) proposed an overarching framework for levels of integration that includes
three categories: coordinated, co-located and integrated care. Within each level, there are two
degrees that follow a continuum (Figure 2). Each of the three categories has a key element.
The key element for coordinated care is communication, for co-location it is physical
proximity and for integration it is behavioral change (Heath, Wise and Reynolds, 2013).
Authors make a point to note that co-location does not guarantee more collaboration, but that
it can provide some benefit as it may reduce the time spent travelling from one provider to

14
another (Health, Wise and Reynolds, 2013). Authors also point out that providing a single
service within an integrated setting is considered integrated care because it is provided within
the context of that integrated site’s whole person care (Heath, Wise and Reynolds, 2013).
As it relates to this proposed research, the framework for levels of integrated
healthcare will serve as the framework to build upon research aims 1, 2 and 3. Aims 1 and 2
were previously explained in the paragraph above. Aim 3 is to compare follow-through to
treatment among at-risk postpartum women referred to women’s reproductive mental health
services within two distinct delivery models.

15
Figure 2. Core descriptions for six levels of integration (Heath, Wise and Reynolds, 2013).

16
METHODS
Research Aims
1. To compare compliance with implementing universal postpartum depression screening
among postpartum women within two distinct service delivery models.
2. To compare compliance with implementing universal referral for postpartum women
who screen at-risk for postpartum depression within two distinct service delivery models.
3. To compare follow-through to treatment among at-risk postpartum women referred to
women’s reproductive mental health services within two distinct delivery models.
Study Design
A cross-sectional study design using historical data will be used for aims 1 and 2. A
historical cohort will be used for aim 3.
1. To evaluate compliance with screening and referral, a descriptive analysis will be used.
2. To further evaluate referral follow-through by service delivery model (co-located versus
integrated), a cohort study design will be used. Women who sought obstetric care at a
trained obstetric clinic (exposure), completed the EPDS at the 6-week postpartum visit,
were at high risk (defined as an EPDS score ≥ 10 or a response of “Yes, quite often” to
question 10 on the EPDS), and accepted a referral for treatment from the obstetric
provider will be tracked to determine the percentage (or rate) of seeking treatment at the
women’s reproductive mental health clinic within 60 days of referral (outcome). Trained
obstetric clinics were educated and provided a validated tool to screen all women at the 6

17
week postpartum visit and trained on a standardized process. Women seeking treatment
without a referral and women seeking treatment at a mental health clinic outside of the
health system are excluded from this study.
Definitions and Measures
- Staff: any person supporting the clinic, but not a provider; can include a registered
nurse, medical assistant or other non-providers
- Provider: any person licensed to provide direct medical care to patients in the clinic;
includes a medical doctor, nurse practitioner, physician’s assistant and/or certified
nurse midwife
- Edinburgh Postnatal Depression Scale (EPDS): a validated screening instrument
completed by new mothers to assess their risk of postpartum depression; consists of
10 self-reported items
- Universal postpartum depression screening: every woman completing a postpartum
visit between 5-7 weeks after delivery is offered an EPDS to screen for postpartum
depression. In this dissertation, the period is referred to as the “6-week postpartum
visit”.
- At-risk: an EPDS score ≥ 10, or a response of “Yes, quite often” to question 10
regarding suicidality on the EPDS

18
- Compliance: Percentage of eligible women that are screened, referred and/or treated
that meet the criteria at the 6 week postpartum visit
- Treatment / Rate of referral completion: completing at least one appointment for
mental health services at the women’s reproductive mental health clinic within 60
days of receiving the referral from their obstetric provider.
- Service delivery model: explanation of the infrastructure and relational location
between the obstetric clinic and women’s reproductive mental health clinic. This
study includes 2 models: co-located and integrated.
Service Delivery Models
There are two levels of service integration within the obstetric clinics: co-located and
integrated (Appendix E), and they are located in different geographic areas of Houston. The
co-located refers to obstetric practices located within a single hospital where women who
receive obstetrical care can also see a women’s reproductive mental health provider located
within the same building where they receive obstetric care (Appendix F). The integrated
model refers to an obstetric practice that has a women’s reproductive mental health provider
embedded in the same clinic space; therefore, the women could receive both services within
the same space.
Procedures
While the Women’s Mental Health Delivery System Reform Incentive Payment
(DSRIP) project trained pediatricians and obstetricians to implement universal screening for

19
maternal depression, this research will only include trained obstetrics clinics. Of the four
trained obstetric clinics, three are located inside of a hospital in the Texas Medical Center
and one clinic is located in the Greater Houston community, south of the Texas Medical
Center (Appendix E). Two of the obstetric practices are privately managed and the other two
have an academic affiliation with a medical school in Houston, Texas.
In 2014, a training team was formed that included a psychiatrist, practice supervisor
for the women’s reproductive mental health clinic and a project manager. A PowerPoint slide
deck, handouts and an evaluation were developed to accompany the training. The training
consisted of three sections: (1) an overview of postpartum depression, (2) the importance of
screening and why the obstetrician is important in the screening process, (3) how to screen
using the Edinburgh Postnatal Depression Scale (EPDS) (Appendix A and Appendix B) and
(4) how to submit an order in the electronic medical record to refer mothers identified at-risk
and wanting a referral for services to the women’s mental reproductive health clinic.
The Edinburgh Postnatal Depression Scale (EPDS) was used to screen women for
postpartum depression (Appendix A). The 10-item self-reported screening tool asks patients
about their experience over the past week and usually takes less than five minutes to
complete. The EPDS has been validated extensively for use during pregnancy and the
postpartum period, is available in several languages, and has a sensitivity of 59%-100% and a
specificity of 49%-100% (Cox, Holden & Sagovsky, 1987; Harris et al., 1989; Murray &
Carothers, 1990; Adouard, Glangeaud-Freudenthal, Golse, 2005, de Albuquerque Moraes, et
al., 2017). The original article validating the EPDS used a cut-point score of ≥ 10 (Cox et al.,
1987). This cut-point was adopted for the project described.

20
Obstetric providers and clinic staff were trained to utilize the EPDS twice during
pregnancy (at the first prenatal visit and in the third trimester of pregnancy), and at the “6
week” postpartum visit to assess a woman’s risk for maternal depression, since it is a
sensitive period for both mother and baby. In the universal screening protocol provided
during training, providers and staff are instructed to treat each new screening interval as
unique. Because universal screening is standard of care within the clinics, newly hired
providers and staff are trained on the screening processes during orientation as part of
learning clinic procedures and processes.
A process map of the screening and referral workflow is located in Appendix B. The
EPDS was self-administered by the patient and a staff member entered the patient’s
responses into an EPDS flow sheet in the electronic medical record. The EPDS flow sheet
scores the entered responses and populates a total score ranging from 0 – 30. Zero indicates
low risk for maternal depression and 30 indicates significant risk. Clinic staff were trained to
notify the obstetrician for any total EPDS scores ≥10 or for any patient selecting “Yes, quite
often” to question ten, which asks about suicidality. For an EPDS score ≥ 10 and/or “yes,
quite often” responses to question 10, the obstetric provider was trained to have a
conversation with the patient about how she is feeling and to suggest and offer a referral to
see a women’s mental reproductive mental health professional.
One referral and treatment option is the women’s reproductive mental health clinic
within the hospital system. At the women’s reproductive mental health clinic, mental health
experts offer consultation, evaluation, diagnosis and treatment for perinatal mood disorders
and conditions related to a woman’s reproductive life cycle. Staffing at the women’s

21
reproductive mental health clinic includes four psychiatrists, one psychologist and one social
worker. Other options for referral include mental health providers that are in the Houston
community; however, because these providers are not within the same hospital system, the
electronic medical record does not capture any external referrals in a discrete field. Some
patients may have an established mental health provider and choose to continue seeking
treatment from this provider, and the electronic medical record does not capture the
information. If the patient is at-risk and accepts an internal referral for further care at the
women’s reproductive mental health clinic within the system, an order is entered into the
electronic medical record and is electronically routed to the women’s reproductive mental
health clinic.
Once an order is received at the women’s reproductive mental health clinic, staff
contact the referred patient via telephone within 24 hours to verify patient information and to
schedule an appointment with a mental health provider. Each electronic referral is worked by
a member of the scheduling team and the outcome of the referral is captured within the
electronic medical record. For patients that are scheduled, a reminder call is completed 1 day
in advance of the scheduled appointment. Patients are defined as following-through with
treatment if their appointment with a mental health provider at the women’s reproductive
mental health clinics is completed within 60 days of receiving the electronic referral. Though
completing an appointment within 60 days was used for measurement in this study, the
Women’s Mental Health DSRIP Project’s goal was to see any woman referred within 7-10
days of the referral.

22
The DSRIP project plan included the addition of community locations to improve
access to services for women who are unable to travel to the Texas Medical Center for
treatment. At the start of the project in 2013, there was one location for the women’s
reproductive mental health clinic, which was on the hospital’s main campus in the Texas
Medical Center. In January 2014, a second location was added and embedded into an
OB/Gyn clinic in the community. The embedded model is referred to as “integrated”
throughout this paper. Women’s reproductive mental health providers are available at the co-
located clinic Monday through Friday from 8am – 5pm and at the integrated clinic two days
per week from 8am - 5pm.
Ascertainment
The study population includes female patients seen for a 6 week postpartum visit at
the 4 trained obstetric clinics from October 1, 2014 – September 30, 2016. Inclusion and
exclusion criteria are provided in Table 2.

23
Table 2. Inclusion and exclusion criteria for postpartum study population.
Inclusion Criteria Exclusion Criteria
Women of all ages
Women completing a “6 week”
postpartum visit from October 1,
2014 – September 30, 2016 at
one of the 4 trained obstetric
clinics. For this research, the “6
week” visit includes any
postpartum visit that occurs at 5-
7 weeks postpartum.
Men
Women completing an
appointment outside of the
defined 6 week postpartum visit
range (5-7 weeks postpartum)
1. Indication of presenting for a 6 week postpartum visit: Data provided on when a woman
presented for a 6 week postpartum visit came from a Best Practice Advisory (BPA) alert
that flags in the electronic medical record when a woman is at the clinic 5-7 weeks
postpartum. The BPA alert data from a woman’s electronic medical record came from a
Business Objects report and was exported into Excel. The Excel file provided data on the
total number of BPA alerts that fired at the 6 week postpartum visit (5-7 weeks range) by
a patient’s unique medical record. For duplicate medical record numbers in the dataset,
the chronological first instance of the BPA flag was included in the dataset to assess the
volume of unique patients seen during the 6 week postpartum period who were eligible to
complete the EPDS. Other duplicate patients were removed from the dataset.
2. Indication of compliance with screening at the 6 week postpartum visit: Data entered into
the woman’s electronic medical record came from a Business Objects report and was
exported into Excel. The Excel file included the patient’s unique medical record number,

24
appointment date, clinic name, select demographic variables (race, date of birth, marital
status, insurance type, gravidity) and a score for the EPDS if the woman was screened at
the 6 week postpartum visit. A numerical value in the EPDS score field was considered
as a woman being screened at the 6 week postpartum visit. Alternatively, a blank cell in
the EPDS score field was considered as a woman not being screened at the 6 week
postpartum visit.
3. Indication of compliance with referral: Data came from a QlikView dashboard and was
exported into Excel. The dashboard displayed all referrals to the women’s reproductive
mental health clinic by medical record number from October 1, 2014 – September 30,
2016. The referral data was matched to the data of unique medical records of women that
had an EPDS score ≥ 10 from the screening dataset. Only patients that had a referral to
the women’s reproductive mental health clinic within 1 day of an at-risk EPDS score at
the 6 week postpartum visit were considered as referred. Alternatively, no referral or a
referral to the women’s reproductive mental health clinic outside of 1 day was considered
as not referred at the 6 week postpartum visit.
4. Indication of follow-through with treatment by service delivery model: Data came from
the Business and Financial Operations Team as an Excel file. Data displayed all
completed appointments at the women’s reproductive mental health clinic by medical
record number from October 1, 2014 – November 30, 2016. October and November 2016
were included in the completed appointments data to ensure that women completing an
appointment within 60 days were accurately captured in the treatment data. The
completed appointment data was matched to the data of unique medical records of at-risk
women that were referred to the women’s reproductive mental health clinic. Only women

25
at-risk women that a completed appointment at the women’s reproductive mental health
clinic within 60 days of receiving a referral were considered as treated. Alternatively, no
completed visit or a completed visit at the women’s reproductive mental health clinic
outside of 60 days was considered as not treated.
5. Outcomes for at-risk women that were not referred within 1 day and outcomes for at-risk
women that did not complete an appointment at the women’s reproductive mental health
clinic within 60 days: unique medical record numbers for at-risk women were obtained
from the existing at-risk dataset. Data on at-risk women that were not referred was
obtained through chart review. Similarly, data on at-risk women that were referred and
did not complete an appointment at the women’s reproductive mental health clinic was
obtained through chart review.
Sample Size
The necessary sample size for the study is 32 women per group based on sample size
analysis specifying a power of .80, and an alpha level of .05 (Sit & Wisner, 2009; LaRocco-
Cockburn, et al., 2013). The sample size for this study exceeded the minimum required with
2,729 women who were eligible to be screened and 1,462 woman that were screened. All
women that presented for a 6 week postpartum visit and had a best practice advisory (BPA)
alert flag from October 1, 2014 – September 30, 2016 at one of the 4 obstetric clinics
participating in the project were included. A cascading diagram of data included and
excluded is available in Appendix G.

26
Analysis
Descriptive statistics are used to describe characteristics of the four obstetric practices
and include number of providers by type, number of staff and operational descriptors.
Descriptive statistics are also be used to detail sociodemographic characteristics of patients
screened at the 6 week postpartum visit, identified as at-risk (scoring ≥ 10 on the EPDS or a
response of “Yes, quite often” to question 10), referred for treatment within 1 day, and
completing treatment at the women’s reproductive mental health clinic. A distribution of
EPDS scores for all women screened at 6 week postpartum at trained obstetric clinics is
included. Chart review was used to determine outcomes of at-risk women that were not
referred within 1 day and at-risk women that were referred and not treated within 60 days.
Using OpenEpi, chi-square tests were used to assess compliance with screening
women at the 6 week postpartum visit, referral within 1 day to the women’s reproductive
mental health clinic and treatment by service delivery model to answer specific research aims
1, 2 and 3 (Dean, Sullivan, & Soe, 2013). Fisher exact test was used for cell values less than
5. For chi-square and Fisher Exact tests, two-tailed p-value less than 0.05 were considered
statistically significant. To further detect any difference in risk between the two service
delivery model types (co-located and integrated) for screening at the 6 week postpartum visit,
at-risk, referral within 1 day and treatment within 60 days of referral, risk ratios with 95%
confidence intervals were calculated with the co-located model as the reference group.
Using OpenEpi, stratified analysis was used to assess confounding and interaction
between the service delivery models and sociodemographic variables (Dean, Sullivan, & Soe,

27
2013). Sociodemographic variables analyzed included race, age, gravidity, relationship status
and insurance status because of its availability in the data provided and insight into the
population of women within the models. For stratified analysis, sociodemographic variables
were grouped accordingly:
Race: Black / African American; Other (White, Native Hawaiian / Other Pacific
Islander, American Indian / Alaska Native, Asian)
Age: ≤ 29 years; ≥ 30 years
Gravidity: Low (≤2 pregnancies); High (≥ 3 pregnancies)
Relationship: Married; Other (single, divorced, separated, significant other, other)
Insurance: Commercial; Government funded (Medicaid / Medicare, Children’s Health
Insurance Plan (CHIP))
To assess confounding between service delivery models and sociodemographic variables, the
crude risk ratio was compared to the Mantel Haenszel adjusted risk ratio. Variables were
considered as potential confounders if there was a difference between the crude and adjusted
risk ratio that was greater than 10% (Szklo & Nieto, 2006). The percentage difference
between the crude and adjusted risk ratios was calculated using the following formula:
Potential confounder if RR1 – RR2 > 10%RR1
To assess for interaction, the Breslow-Day Test of Interaction was computed in OpenEpi and
a p-value less than 0.05 indicated the presence of interaction. For stratified analysis, any cell

28
values of zero (0) were transformed to 0.5 and 0.5 was added to all cell values within the
strata (Dean, Sullivan, & Soe, 2013).

29
RESULTS
Service Delivery Model Characteristics
From October 1, 2015 – September 30, 2016, characteristics of the two service
delivery models varied by staffing and operations (Table 3). The co-located model with 3
clinics completed more visits and deliveries than the integrated model with 1 clinic. Overall,
a higher percentage of women that delivered in the integrated model completed a postpartum
visit compared to women in the co-located model (220/232 versus 4,075/4,855).
The co-located service delivery model had more staff compared to the integrated
model, with three levels of providers available to treat patients (Table 3). There were no
certified nurse midwife providers in the integrated model. On average, there were 135
deliveries per provider in the co-located model compared to 58 deliveries per provider in the
integrated model. About 2.9 nursing and clinical support staff were available per clinical FTE
in the co-located model, compared to approximately 2.3 in the integrated model.
Population Characteristics
Demographic characteristics of women presenting for a 6 week postpartum visit,
those who were screened using the EPDS, those who scored at-risk for postpartum
depression on the EPDS, those who were referred to the women’s reproductive mental health
clinic within 1 day and those who completed an appointment at the women’s reproductive
mental health clinic with 60 days are described in Table 9. High fidelity of screening existed
for nearly all population characteristics examined in the integrated model, while the co-
located model had more variation among screening by population characteristics. From
October 1, 2014 – September 30, 2016, 2,494 women presented for a 6 week postpartum visit
in the co-located model, compared to 235 in the integrated model (Table 9). White women

30
represented the largest proportion in the co-located model and were most likely to be
screened in the co-located model (51.2%). There was high compliance of screening by race
within the integrated model. Native Hawaiians / Other Pacific Islanders, American Indians /
Alaska Natives and Asians were all universally screened (100%), followed by Whites and
Blacks / African Americans (98.3% and 93.2%, respectively). In both service delivery
models, co-located and integrated, patients presenting for the 6 week visit postpartum were
generally married (81.2% vs. 80.0%) women who identified as white (76.1% vs. 74.0%)
between 30-34 years of age (40.3% vs. 37.0%) with commercial insurance (83.0% vs.
97.0%) that had one pregnancy (38.9% vs. 31.5%). The distribution of EPDS scores was
skewed positive in both service delivery models indicating that most EPDS scores were low
risk and on the lower end of the 0-30 range (Figure 3). The mode and median for the
distribution was the same in both models (0 and 3, respectively). Mean and range EPDS
scores varied slightly by service delivery model: 4.0 mean, 0 – 24 range in the integrated
model and 4.3 mean and 0 – 28 range in the co-located model.
Among all races screened and in both models, Black / African American women had
the highest prevalence of scoring at-risk for postpartum depression (Table 9). Overall, 19.4%
of Black / African American women scored at-risk in the co-located model compared to
17.1% in the integrated model. In both models, Asian women had the second highest
prevalence of scoring at-risk for postpartum depression (13.1% co-located; 16.7%,
integrated) and White women had the lowest prevalence (8.3% co-located; 6.4% integrated).
In both models, married women were least likely to score at-risk (8.5% co-located; 7.1%
integrated), while single and divorced women were most likely to score at-risk. The
proportion of women scoring at-risk for postpartum depression by insurance type was

31
greatest for those with Medicaid / Medicare and Children’s Health Insurance Plan (CHIP) in
the co-located model (17.9% and 18.2%, respectively). This outcome was not observed in the
integrated model in which 97% of women at the 6 week postpartum visit had commercial
insurance; instead, the highest proportion of women scoring at-risk for postpartum depression
were those with commercial insurance (9.0%).
Specific Aim 1
Screening compliance varied by service delivery model (Table 4). Overall 97.4% of
women that completed a 6 week postpartum visit in the integrated model were screened for
postpartum depression using the EPDS, compared to 49.4% of women in the co-located
model (p < 0.001). Postpartum women seen in the integrated service delivery model for a 6
week visit were nearly two times more likely to be screened using the EPDS than women in
the co-located model (RR = 1.97, 95% CI: 1.89, 2.06).
Among women screened for postpartum depression at the 6 week postpartum visit,
10% scored at-risk for postpartum depression in the co-located model, while 8.7% scored at-
risk in the integrated model (Table 4). No women selected “yes, quite often” to question 10
on the EPDS which inquires about thoughts of harming oneself. No significant relationship
was found between service delivery model and the rate of women scoring at-risk for
postpartum depression on the EPDS (p = 0.55). Postpartum women seen in the integrated
service delivery model for a 6 week visit were 13% less likely to score at-risk on the EPDS
compared to women in the co-located model (RR = 0.87, 95% CI: 0.55, 1.36).
Specific Aim 2
Compliance with referring women at-risk for postpartum depression to the women’s
reproductive mental health clinic varied by service delivery model (Table 4). Thirty percent

32
(n = 6) of the 20 women who scored at-risk for postpartum depression in the integrated
model were referred to the women’s reproductive mental health clinic, compared to 18.5% (n
= 23) in the co-located model (p = 0.24). Postpartum women that scored at-risk at the 6 week
postpartum visit in the integrated service delivery model were 62% more likely to receive a
referral to the women’s reproductive mental health clinic within 1 day of an at-risk EPDS
score compared to women in the co-located model (RR = 1.62, 95% CI: 0.75, 3.47).
Specific Aim 3
At-risk women that received a referral in the integrated model were 36% less likely to
complete an appointment at the women’s reproductive mental health clinic than women in
the co-located model (RR = 0.64, 95% CI: 0.19, 2.12). Of the six at-risk women referred for
mental health services within the healthcare system from the integrated clinic, two (33.3%)
completed an appointment within 60 days of receiving the referral (Table 4), while 52.2%
(12/23) of women referred to the women’s reproductive mental health clinic completed an
appointment within 60 days of receiving the referral in the co-located model (p = 0.72).
Confounding and Interaction
Stratified analysis for women who were screened at the 6 week postpartum visit and
sociodemographic characteristics showed that regardless of the characteristic, screening
occurred approximately twice as often in the integrated service delivery model as in the co-
located (Table 5). For each sociodemographic characteristic analyzed, the crude risk ratio and
the adjusted risk ratio were similar, showing no confounding effects between the service
delivery model and the stratified characteristic. The Breslow Day test for interaction showed
no interaction.

33
Stratified analysis of women at-risk for postpartum depression and sociodemographic
characteristics showed that regardless of the characteristic, women in the co-located model
were at higher risk for postpartum depression compared to women in the integrated model
(Table 6). Women with commercial insurance in the integrated and co-located service
delivery models were equally at-risk for postpartum depression (RR = 1.02, 95% CI: 0.64,
1.61). For all sociodemographic characteristics analyzed for women at-risk, the crude risk
ratio and the adjusted risk ratio were similar, indicating no confounding effects between the
service delivery model and the stratified characteristic. The Breslow Day test for interaction
showed no interaction.
Stratified analysis of women who scored at-risk at the 6 week postpartum visit and
were referred within 1 day and sociodemographic characteristics showed that regardless of
the characteristic, at-risk women in the integrated model were more likely to be referred to
the women’s reproductive mental health clinic compared to women in the co-located model,
except for at-risk Black /African American women and at-risk women ≤ 29 years of age
(Table 7). Black/African American women at-risk of postpartum depression in the integrated
model were 38% less likely to be referred to the women’s reproductive mental health clinic
compared to Black / African American women at-risk of postpartum depression in the co-
located model (RR = 0.62, 95% CI: 0.09, 4.21). Women ≤ 29 years of age at-risk of
postpartum depression in the integrated model were 10% less likely to be referred to the
women’s reproductive mental health clinic compared to women ≤ 29 years of age at-risk of
postpartum depression in the co-located model (RR = 0.90, 95% CI: 0.31, 2.59). For all
sociodemographic characteristics analyzed for women at-risk of postpartum depression that
were referred to the women’s reproductive mental health clinic within 1 day, the crude risk

34
ratio and the adjusted risk ratio were similar, indicating no confounding effects between the
service delivery model and the stratified characteristic, with the exception of age. The 10.2%
difference between the crude risk ratio and the adjusted risk ratio for age group is suggestive
of a confounding variable. The Breslow Day test for interaction showed no statistically
significant interaction.
Lastly, stratified analysis of women who scored at-risk at the 6 week postpartum visit,
were referred within 1 day and completed an appointment at the women’s reproductive
mental health clinic within 60 days and sociodemographic characteristics showed that
regardless of the characteristic, women in the integrated model were less likely to complete a
visit within 60 days of referral, except for women with high gravidity and women with
government funded insurance (Table 8). At risk women with high gravidity that received a
referral in the integrated model were 2.5 times more likely to complete an appointment at the
women’s reproductive mental health clinic within 60 days of referral compared to women
with high gravidity in the co-located model (RR = 2.50, 95% CI: 0.27, 23.36). Though
stratified analysis showed that at risk women with government funded insurance that
received a referral in the integrated model were 2 times more likely to complete an
appointment at the women’s reproductive mental health clinic within 60 days of referral
compared to women with government funded insurance in the co-located model (RR = 2.00,
95% CI: 0.15, 26.73), it should be noted that this calculation is unstable due to small cell
values. For each sociodemographic characteristic analyzed for screening, the crude risk ratio
and the adjusted risk ratio were similar, showing no confounding effects between the service
delivery model and the stratified characteristic. The Breslow Day test for interaction showed
no interaction.

35
Further Evaluation
Chart review findings showed that women in both service delivery models who were
at-risk of postpartum depression and did not receive a referral to the women’s reproductive
mental health clinic within 1 day of scoring positive on the EPDS according to the protocol,
were referred for mental health care in some other way (Table 10) . Of the 14 women that
were at-risk of postpartum depression in the integrated model and did not receive a referral to
the women’s reproductive mental health clinic within 1 day of scoring positive on the EPDS,
30% (n=6) were referred off protocol to a mental health provider. Chart review revealed that
four (4) women were established patients at the women’s reproductive mental health clinic
and two (2) women had received a referral to the women’s reproductive mental health clinic
prior to scoring positive at 6 week postpartum visit. Similarly, of the 101 women that were
at-risk of postpartum depression in the co-located model and did not receive a referral to the
women’s reproductive mental health clinic within 1 day of scoring positive on the EPDS,
11.3% (n=14) were referred off protocol to a mental health provider. Six (6) women were
referred to the women’s reproductive mental health clinic before scoring at-risk on the EPDS
at the 6 week postpartum visit, five (5) women were established patients at the women’s
reproductive mental health clinic, two (2) women had received a referral to the women’s
reproductive mental health clinic more than one day after screening positive at her 6 week
postpartum visit, and one (1) woman in the co-located model reported being under
psychiatric care by an outside psychiatrist. (Appendix H).
Chart review findings showed that women in both service delivery models completed
an appointment with a mental health provider, but off protocol (Table 11). Of the 4 women
that were at-risk for postpartum depression at the 6 week postpartum visit and referred to the
Commented [S1]: Having the “off protocol” here makes itsound like the provider was “off protocol”.

36
women’s reproductive mental health clinic but did not complete an appointment within 60
days in the integrated model, one (1) patient was triaged to the internal pediatric mental
health clinic due to an age of < 18 years and completed an appointment within 60 days at the
pediatric mental health clinic. Of the 11 women in the co-located model that were at-risk of
postpartum depression at the 6 week postpartum visit and referred to the women’s
reproductive mental health clinic but did not complete an appointment within 60 days in the
integrated model, one (1) patient declined to schedule an appointment during initial contact
from the women’s reproductive mental health clinic, but did complete an appointment after
60 days. (Appendix I)

37
Table 3. Staffing and operational characteristics of trained obstetric practices by service delivery model, October 1, 2015 –September 30, 2016.
Service Delivery
Model Clinic Type
Obstetricians
(n)
Clinical FTE*
for
Obstetricians
Mid-level
(n)
Certified
Nurse
Midwives
(n)
Nursing
(n)
Clinical
(n)
Administrative
(n)
All Visits
Completed
(n)
Deliveries
(n)
Postpartum
Visits
Completed
(n)
Distinct
Patients
Completing
Postpartum
Visit
(n)
Co-located
Practice A Private 10 10.00 0 5 9 16 8 54,779 2,286 3,228 2,218
Practice B Private 4 3.85 0 0 1 10 3 25,888 769 1,240 824
Practice C Academic 16 7.49 1 0 13 12 14 23,248 1,800 1,245 1,033Subtotal 30 21.34 1 5 22 39 25 103,915 4,855 5,713 4,075
Integrated
Practice D Academic 3 1.33 1 0 1 2 2 4,719 232 275 220
Total 33 22.67 2 5 24 41 27 108,634 5,087 5,988 4,295
Providers Support
OperationsStaffing
* FTE = full time equivalent

38
Table 4. Comparison of outcomes of interest (screened at 6 week postpartum visit, at-risk of postpartum depression (PPD),referred to women's reproductive mental health clinic within 1 day, completed an appointment at the women's reproductive mentalhealth within 60 days of referral), by service delivery model, October 1, 2014 - September 30, 2016.
Category
Service Delivery
Model
Compliance
n (%) Risk Ratio 95% CI x2
p-value
Screened at 6 week postpartum visit
Presenting at 6 week postpartum visit with BPA alert Integrated (n = 235) 229 (97.4) 1.97 1.89, 2.06 <0.001
Co-located (n = 2,494) 1,233 (49.4) Ref
At-risk of postpartum depression
Screened Integrated 20 (8.7) 0.87 0.55, 1.36 0.55
Co-located 124 (10.0) Ref
Referral of at-risk within 1 day
At-risk Integrated 6 (30.0) 1.62 0.75, 3.47 0.24
Co-located 23 (18.5) Ref
Treatment within 60 days for the at-risk referred within 1 day
Referred Integrated 2 (33.3) 0.64 0.19, 2.12 0.72*
Co-located 12 (52.2) Ref
Notes.
Mantel Haenszel chi-square
* Fisher Exact test used for cell values < 5
Ref = Reference group for risk ratio calculations

39
Table 5. Stratified analysis to assess confounding and interaction between service deliverymodel and sociodemographic characteristics for screening at the 6 week postpartum visit,October 1, 2014 – September 30, 2016.
Characteristic Group
Service
Delivery Model
6 week
Postpartum
Visit
(n)
Screened at
6 week
Postpartum
Visit
(%)
Stratum-
specific
Risk Ratio
(95% CI)
Crude
Risk Ratio
(95% CI)
Adjusted*
Risk Ratio
(95% CI)
Test for
Interaction
p-value**
Race Black / AA Integrated 44 93.2 2.08
(1.81, 2.40)
1.97
(1.89, 2.06)
1.98
(1.89, 2.07)
0.44
Co-located 346 44.8 Ref
Other Integrated 189 98.4 1.96
(1.88, 2.05)Co-located 2143 50.2 Ref
Age ≤ 29 years Integrated 102 98.0 2.01
(1.86, 2.17)
1.97
(1.89, 2.06)
1.98
(1.89 , 2.07)
0.54
Co-located 801 48.8 Ref
≥ 30 years Integrated 133 97.0 1.95
(1.85, 2.07)Co-located 1693 49.7 Ref
Gravidity Low (≤ 2) Integrated 154 98.1 2.00
(1.91, 2.11)
1.96
(1.88, 2.06)
1.96
(1.88, 2.05)
0.33
Co-located 1725 49.2 Ref
High (≥ 3) Integrated 80 96.3 1.90
(1.75, 2.07)Co-located 712 50.7 Ref
Relationship Married Integrated 188 97.9 1.94
(1.84, 2.03)
1.97
(1.89, 2.06)
1.97
(1.89, 2.06)
0.10
Co-located 2024 50.6 Ref
Other Integrated 47 95.7 2.15
(1.91, 2.41)Co-located 470 44.5 Ref
Insurance Commercial Integrated 228 97.8 1.92
(1.83, 2.01)
1.97
(1.88, 2.06)
1.92
(1.84, 2.02)
0.78
Co-located 2071 50.9 Ref
Government funded Integrated 7 85.7 2.01
(1.46, 2.78)Co-located 406 42.6 Ref
Excluded "Unable to obtain" and "Patient refused".
* Mantel Hantzel Adjusted Risk Ratio
** Breslow Day Test for Interaction

40
Table 6. Stratified analysis to assess for confounding and interaction between servicedelivery model and sociodemographic characteristics for scoring at-risk at the 6 weekpostpartum visit, October 1, 2014 – September 30, 2016.
Characteristic Group
Service
Delivery Model
Screened at
6 week
Postpartum
Visit
(n)
At-risk for
Postpartum
Depression
(%)
Stratum-
specific
Risk Ratio
(95% CI)
Crude
Risk Ratio
(95% CI)
Adjusted*
Risk Ratio
(95% CI)
Test for
Interaction
p-value**
Race Black / AA Integrated 41 17.1 0.88
(0.42, 1.86)
0.87
(1.56, 1.37)
0.83
(0.53, 1.29)
0.84
Co-located 155 19.4 Ref
Other Integrated 186 7.0 0.80
(0.46, 1.40)Co-located 1075 8.7 Ref
Age ≤ 29 years Integrated 100 11.0 0.94
(0.50, 1.74)
0.87
(0.55, 1.36)
0.84
(0.53, 1.32)
0.64
Co-located 391 11.8 Ref
≥ 30 years Integrated 129 7.0 0.75
(0.39, 1.46)Co-located 842 9.3 Ref
Gravidity Low (≤ 2) Integrated 151 8.6 0.89
(0.51, 1.56)
0.88
(0.56, 1.39)
0.88
(0.56, 1.38)
0.95
Co-located 848 9.7 Ref
High (≥ 3) Integrated 77 9.1 0.86
(0.56, 2.89)Co-located 361 10.5 Ref
Relationship Married Integrated 184 7.1 0.83
(0.47, 1.46)
0.87
(0.55, 1.36)
0.85
(0.54, 1.33)
0.91
Co-located 1,024 8.5 Ref
Other Integrated 45 15.6 0.88
(0.55, 1.36)Co-located 209 17.7 Ref
Insurance Commercial Integrated 223 9.0 1.02
(0.64, 1.61)
0.88
(0.57, 1.37)
0.97
(0.62, 1.53)
0.50
Co-located 1,054 8.8 Ref
Government funded Integrated 6*** 0.0 0.39
(0.03, 5.81)Co-located 173 17.9 Ref
Excluded "Unable to obtain" and "Patient refused".
* Mantel Hantzel Adjusted Risk Ratio
** Breslow Day Test for Interaction
***used for cell values of 0

41
Table 7. Stratified analysis to assess for confounding and interaction between servicedelivery model and sociodemographic characteristics for referral within 1 day, October 1,2014 – September 30, 2016.
Characteristic Group
Service
Delivery Model
At-risk for
Postpartum
Depression
(n)
Referred within
1 day
(%)
Stratum-
specific
Risk Ratio
(95% CI)
Crude
Risk Ratio
(95% CI)
Adjusted*
Risk Ratio
(95% CI)
Test for
Interaction
p-value**
Race Black / AA Integrated 7 14.3 0.62
(0.09, 4.21)
1.62
(0.75, 3.47)
1.59
(0.75, 3.39)
0.22
Co-located 30 23.3 Ref
Other Integrated 13 38.5 2.26
(1.00, 5.13)Co-located 94 17.0 Ref
Age ≤ 29 years Integrated 11 27.3 0.90
(0.31, 2.59)
1.62
(0.75, 3.47)
1.41
(0.67, 2.98)
0.13
Co-located 46 30.4 Ref
≥ 30 years Integrated 9 33.3 2.89
(0.95, 8.76)Co-located 78 11.5 Ref
Gravidity Low (≤ 2) Integrated 13 30.8 8.41
(2.12, 33.36)
6.00
(2.54, 14.15)
5.75
(2.52, 13.12)
0.45
Co-located 82 3.7 Ref
High (≥ 3) Integrated 7 57.1 4.34
(1.54, 12.27)Co-located 38 13.2 Ref
Relationship Married Integrated 13 30.8 1.79
(0.70, 4.55)
1.62
(0.75, 3.47)
1.60
(0.75, 3.44)
0.72
Co-located 87 17.2 Ref
Other Integrated 7 28.6 1.32
(0.35, 4.96)Co-located 37 21.6 Ref
Insurance Commercial Integrated 20 30.0 1.47
(0.74, 3.16)
1.65
(0.79, 3.39)
1.55
(0.74, 3.25)
0.45
Co-located 93 20.4 Ref
Government funded Integrated 0*** 0.0 3.56
(0.42, 30.18)Co-located 31 12.9 Ref
Notes.
Excluded "Unable to obtain" and "Patient refused".
* Mantel Hantzel Adjusted Risk Ratio
** Breslow Day Test for Interaction
*** 0.5 used for cell values of zero

42
Table 8. Stratified analysis to assess for confounding and interaction between servicedelivery model and sociodemographic characteristics for completing an appointment atthe women’s reproductive mental health clinic within 60 days of referral, October 1, 2014– November 30, 2016.
Characteristic Group
Service
Delivery Model
Referred
within
1 day
(n)
Treated
within
60 days
(%)
Stratum-
specific
Risk Ratio
(95% CI)
Crude
Risk Ratio
(95% CI)
Adjusted*
Risk Ratio
(95% CI)
Test for
Interaction
p-value**
Race Black / AA Integrated 1*** 0.0 0.58
(0.06, 6.13)
0.74
(0.26, 2.10)
0.74
(0.26, 2.13)
0.81
Co-located 7 57.1 Ref
Other Integrated 5 40.0 0.80
(0.25, 2.60)Co-located 16 50.0 Ref
Age ≤ 29 years Integrated 3 33.3 0.78
(0.14, 4.30)
0.64
(0.19, 2.12)
0.61
(0.19, 2.12)
0.72
Co-located 14 42.9 Ref
≥ 30 years Integrated 3 33.3 0.50
(0.09, 2.64)Co-located 9 66.7 Ref
Gravidity Low (≤ 2) Integrated 4 25.0 0.41
(0.07, 2.32)
0.64
(0.19, 2.12)
0.67
(0.18, 2.47)
0.21
Co-located 18 61.1 Ref
High (≥ 3) Integrated 2 50.0 2.50
(0.27, 23.36)Co-located 5 20.0 Ref
Relationship Married Integrated 4 50.0 0.94
(0.32, 2.78)
0.74
(0.26, 2.10)
0.74
(0.26, 2.10)
0.55
Co-located 15 53.3 Ref
Other Integrated 2*** 0.0 0.40
(0.03, 5.25)Co-located 8 50.0 Ref
Insurance Commercial Integrated 6 33.3 0.58
(0.17, 1.90)
0.68
(0.24, 2.00)
0.68
(0.23, 1.98)
0.39
Co-located 19 57.9 Ref
Government funded Integrated 0*** 0.0 2.00
(0.15, 26.73)Co-located 4 25.0 Ref
* Mantel Hantzel Adjusted Risk Ratio
** Breslow Day Test for Interaction
*** 0.5 used for cell values of zero

43
Table 9. Sociodemographic characteristics of unique women at the 6 week postpartum visit that received a best practice advisory(BPA) alert and were screened the first time the BPA alert fired at 6 weeks postpartum visit, were screened at-risk for postpartumdepression on the EPDS, were referred within 1 day of scoring at-risk on the EPDS and were treated at the women’s reproductivemental health clinic within 60 days of referral, by service delivery model, October 1, 2014 – September 20, 2016.
A.
Characteristic n % n % n % n % n % n % n % n % n % n %
Total 2,494 100.0 1,233 49.4 124 10.0 23 18.5 12 52.2 235 100.0 229 97.4 20 8.7 6 30.0 2 33.3
Race
White 1,897 76.1 972 51.2 81 8.3 15 18.5 8 53.3 174 74.0 171 98.3 11 6.4 5 45.5 2 40.0
Black / African American 346 13.9 155 44.8 30 19.4 7 23.3 4 57.1 44 18.7 41 93.2 7 17.1 1 14.3 0 0.0
Native Hawai ian / Other Paci fic Islander 4 0.2 0 0.0 0 0.0 0 0.0 0 0.0 1 0.4 1 100.0 0 0.0 0 0.0 0 0.0
American Indian / Alaska Native 13 0.5 4 30.8 0 0.0 0 0.0 0 0.0 2 0.9 2 100.0 0 0.0 0 0.0 0 0.0
Asian 229 9.2 99 43.2 13 13.1 1 7.7 0 0.0 12 5.1 12 100.0 2 16.7 0 0.0 0 0.0
Unable to Obtain 5 0.2 3 60.0 0 0.0 0 0.0 0 0.0 2 0.9 2 100.0 0 0.0 0 0.0 0 0.0
Age Group (in years)
<20 29 1.2 8 27.6 4 1.0 2 50.0 0 0.0 4 1.7 4 100.0 2 1.0 1 50.0 0 0.0
20-24 201 8.1 96 47.8 15 15.6 3 20.0 1 33.3 22 9.4 22 100.0 2 9.1 1 50.0 0 0.0
25-29 571 22.9 287 50.3 27 9.4 9 33.3 5 55.6 76 32.3 74 97.4 7 9.5 1 14.3 1 100.0
30-34 1,006 40.3 509 50.6 37 7.3 5 13.5 2 40.0 87 37.0 85 97.7 3 3.5 1 33.3 0 0.0
35-39 559 22.4 273 48.8 35 12.8 4 11.4 4 100.0 41 17.4 39 95.1 6 15.4 2 33.3 1 50.0
40-44 118 4.7 55 46.6 5 9.1 0 0.0 0 0.0 5 2.1 5 100.0 0 0.0 0 0.0 0 0.0
45-49 8 0.3 5 62.5 1 20.0 0 0.0 0 0.0 0 0.0 0 0.0 0 0.0 0 0.0 0 0.0
>49 2 0.1 0 0.0 0 2.0 0 0.0 0 0.0 0 0.0 0 0.0 0 2.0 0 0.0 0 0.0
EPDS
At-risk*
Referrals
Received
Unique
Patients
Treated
Co-located IntegratedPatients
presenting
for a 6-week
postpartum
visit with
BPA alert Screened
EPDS
At-risk*
Referrals
Received
Unique
Patients
Treated
Patients
presenting
for a 6-week
postpartum
visit with
BPA alert Screened

44
Table 9. (Continued). Sociodemographic characteristics of unique women at the 6 week postpartum visit that received a bestpractice advisory (BPA) alert and were screened the first time the BPA alert fired at 6 weeks postpartum visit, screened at-risk forpostpartum depression on the EPDS, were referred within 1 day of scoring at-risk on the EPDS and were treated at the women’sreproductive mental health clinic within 60 days of referral, by service delivery model, October 1, 2014 – September 20, 2016.B.
Characteristic n % n % n % n % n % n % n % n % n % n %
Total 2,494 100.0 1,233 49.4 124 10.0 23 18.5 12 52.2 235 100.0 229 97.4 20 8.7 6 30.0 2 33.3
Gravidity**
0 93 3.7 43 46.2 4 9.3 2 50.0 2 100.0 14 6.0 14 100.0 3 21.4 1 33.3 0 0.0
1 969 38.9 486 50.2 47 9.7 8 17.0 4 50.0 74 31.5 71 95.9 6 8.5 3 50.0 1 33.3
2 663 26.6 319 48.1 31 9.7 8 25.8 5 62.5 66 28.1 66 100.0 4 6.1 0 0.0 0 0.0
3 392 15.7 214 54.6 24 11.2 3 12.5 0 0.0 43 18.3 42 97.7 2 4.8 0 0.0 0 0.0
4 183 7.3 89 48.6 9 3.0 1 11.1 0 0.0 27 11.5 26 96.3 3 3.0 2 66.7 1 50.0
5 80 3.2 35 43.8 2 5.7 0 0.0 0 0.0 6 2.6 5 83.3 1 20.0 0 0.0 0 0.0
≥ 6 57 2.3 23 40.4 3 13.0 1 33.3 1 100.0 4 1.7 4 100.0 1 25.0 0 0.0 0 0.0
Unable to obtain 57 2.3 24 42.1 4 16.7 0 0.0 0 0.0 1 0.4 1 100.0 0 0.0 0 0.0 0 0.0
Relationship Status
Married 2,024 81.2 1,024 50.6 87 8.5 15 17.2 8 53.3 188 80.0 184 97.9 13 7.1 4 30.8 2 50.0
Single 428 17.2 191 44.6 35 18.3 8 22.9 4 50.0 44 18.7 42 95.5 7 16.7 2 28.6 0 0.0
Divorced 9 0.4 5 55.6 1 20.0 0 0.0 0 0.0 2 0.9 2 100.0 0 0.0 0 0.0 0 0.0
Separated 9 0.4 4 44.4 0 0.0 0 0.0 0 0.0 1 0.4 1 100.0 0 0.0 0 0.0 0 0.0
Significant other 23 0.9 9 39.1 1 11.1 0 0.0 0 0.0 0 0.0 0 0.0 0 0.0 0 0.0 0 0.0
Other 1 0.0 0 0.0 0 0.0 0 0.0 0 0.0 0 0.0 0 0.0 0 0.0 0 0.0 0 0.0
Type of Insurance
Commercial 2,071 83.0 1,054 50.9 93 8.8 19 20.4 11 57.9 228 97.0 223 97.8 20 9.0 6 30.0 2 33.3
Medicaid / Medicare 384 15.4 162 42.2 29 17.9 4 13.8 1 25.0 7 3.0 6 85.7 0 0.0 0 0.0 0 0.0
Children's Health Insurance Plan (CHIP) 22 0.9 11 50.0 2 18.2 0 0.0 0 0.0 0 0.0 0 0.0 0 0.0 0 0.0 0 0.0
Unable to obtain 17 0.7 6 35.3 0 0.0 0 0.0 0 0.0 0 0.0 0 0.0 0 0.0 0 0.0 0 0.0
Notes.
Treated is defined as a patient completing an appointment at The Women’s Place within 60 days of receiving a referral.
* At-risk is an EPDS score ≥ 10 and/or a response of "Yes, quite often" to question 10.
EPDS
At-risk*
Referrals
Received
Unique
Patients
Treated
Co-located IntegratedPatients
presenting
for a 6-week
postpartum
visit with
BPA alert Screened
EPDS
At-risk*
Referrals
Received
Unique
Patients
Treated
Patients
presenting
for a 6-week
postpartum
visit with
BPA alert Screened
** Gravidity is the total number of pregnancies.

45
Table 10. Referral rates and outcomes for women at-risk women of postpartum depression at the 6 week postpartum visit,comparing two service delivery models, October 1, 2014 – September 30, 2016.

46
Table 11. Treatment rates and outcomes for women at-risk of postpartum depression at the 6 week postpartum visit that received areferral to the women’s reproductive mental health clinic, comparing service delivery models, October 1, 2014 – November 30,2016.

47
Figure 3. Distribution of EPDS scores for all women screened at 6 week the postpartum visit,comparing service delivery model.

48
DISCUSSION
The purpose of this study was to compare compliance with implementing universal
postpartum depression screening at the 6 week postpartum visit, referral to the women’s
reproductive mental health clinic within 1 day for women at-risk, and follow-through with an
appointment within 60 days of referral for women at-risk between co-located and integrated
service delivery models. Because women’s reproductive mental health services were
provided in the same clinical space that women received their obstetric care in the integrated
model, it was hypothesized that the integrated model would have higher compliance adhering
to the prescribed protocol compared to the co-located service delivery model. In general, the
outcomes of this study support this hypothesis.
Overall, the integrated service delivery model was significantly more compliant with
implementing universal postpartum depression screening at the 6 week postpartum visit to
identify women at-risk of postpartum depression. The integrated model also referred women
at-risk for postpartum depression to treatment at the women’s reproductive mental health
clinic at a higher rate than the co-located model. There was not a significant difference in the
percentage of women referred for treatment who completed a visit at the women’s
reproductive mental health clinic within 60 days between the co-located and integrated
service delivery models.
There are a few considerations that may help explain the higher screening and referral
rates within the integrated service delivery model. First, the close proximity of medical
providers and clinical staff to the women’s reproductive mental health providers may
increase the likelihood of screening, referring and adhering to the prescribed protocol. With a
smaller clinic and more proximate working environment, it’s plausible that the clinic team

49
responsible for screening has more interaction and collaboration with the women’s
reproductive mental health provider embedded in the clinic, resulting in improved screening
and referral. In addition, the lower patient volume and activity in the integrated model may
result in easier adoption of the protocol when compared to the busier, higher volume clinics
in the co-located model.
Though not a significant difference, women in the co-located model had a higher
prevalence of at-risk compared to women in the integrated model. The geographic location of
the models along with the insurance type of the population within the model may lend some
explanation to the variation. The co-located model is located in the city center of Houston,
Texas while the integrated model is in a suburban area. Given that populations in urban areas
tend to experience more poverty, this may explain the higher proportion of at-risk women
found in the co-located model in the urban core of a major metropolitan city. In addition,
25% of the women at-risk for postpartum depression in the co-located model had government
funded insurance, which can be used an indicator of income since it provides healthcare
coverage based on low-income status. The high prevalence of women at-risk for postpartum
depression with government funded insurance in the co-located model should be noted given
that more than 50% of births in Texas are to women on Medicaid (Smith, et al., 2016). Given
the well-documented potential long-term effects that postpartum depression has on the child,
and the high risk of postpartum depression among women with government funded
insurance, getting this population of women into care should be a focus because of its
potential to positively impact a significant segment of the population in Texas for generations
to come (Bernard-Bonnin, 2004).

50
While referral rates were higher in the integrated model, reasons that every at-risk
woman is not referred should more thoroughly explored in further research. Some potential
reasons that all at-risk women were not referred should be considered. Potential reasons
include: some at-risk women may have refused a referral because they have a mental health
provider they are already seeing as demonstrated by one patient in the co-located model
through chart review, inability to afford the additional cost of mental health care, refusal of
treatment due to stigma associated with seeking treatment for mental health, lack of interest
in seeking treatment and / or delaying a referral until later. Considering the operational flow
of a practice, it is also possible that some women that screened at-risk at the six week
postpartum visit were not offered a referral to the women’s mental health clinic. Another
plausible explanation may be that the women’s reproductive mental health provider that is
embedded in the integrated model may initiate treatment at the time of screening, bypassing
the referral process within the protocol and negating the ability to track in the electronic
medical record.
Sociodemographic characteristics did not change the strength of the association
between service delivery model and getting screened for postpartum depression at a 6 week
postpartum visit, scoring at-risk on the EPDS or for getting treatment within 60 days of
referral. One challenge of this study was small sample sizes as the protocol progressed and
women fell out of the sample. Small sample sizes can affect confounding, creating instability
and making it difficult to draw conclusions about a population. Age was considered a
potential confounder for being referred to the women’s reproductive mental health clinic;
however, it is difficult to draw conclusions given the small cell values.

51
Though this study aimed to evaluate the prescribed universal screening protocol
implemented in two service delivery models, chart review findings demonstrated that women
at-risk of postpartum depression were getting referred and treated off protocol. These
findings demonstrate that implementing such a prescribed protocol into clinical practice may
have additional benefits to women at risk of postpartum depression, outside of the specified
time frames within the protocol. Based on the data, strict definitions within the protocol and
small numbers, rates of treatment appear to be higher in the co-located model; yet, when
evaluating all outcomes including what occurred off protocol using available information in
the electronic medical record, it appears that the integrated model may have been equally
successful at getting women into care for postpartum depression. In the co-located model,
there was a significant lack of available data in the electronic medical record.
Compared to previous studies that evaluated getting women at-risk for postpartum
depression into treatment, when considering the combined outcomes of the protocol and off-
protocol experiences, the integrated and co-located service delivery models got more women
into care. Rowan et al. (2012) reported that 17.9% (N=28) of women screened and referred
for postpartum depression sought treatment, while Horowitz and Cousins (2006) reported
that 12.0% (N=122). This study found that 50.0% (N=6) and 56.5% (N=23) of women at risk
for postpartum depression that were referred followed through with treatment.
Limitations
The Women’s Mental Health DSRIP project, the basis for this study, was developed
as a quality improvement initiative to increase screening for postpartum depression among
obstetric providers and to improve access to women’s reproductive mental health services

52
and not designed as a research study. For this reason, several limitations should be
considered.
First, the electronic medical record (EMR) used to capture patient-level data for the
healthcare system does not track any mental health related treatment that occurs outside of
the health system. Anything documented about a patient’s mental health care outside of the
system is self-reported and entered into the EMR as free text which must be extracted by
chart review; therefore, only referrals from internal obstetric providers to the internal
women’s reproductive mental health providers were included for all study subjects. Any
referrals to external mental health providers were not captured in a discrete field within the
EMR and were not considered in this study. In addition, patients that screened at-risk on the
EPDS and were offered a referral to the internal women’s reproductive mental health clinic
may have refused an internal referral for reasons unknown and which were not considered in
this study (e.g., patient has an established mental health provider, patient does not want to
seek treatment at the time referral is offered, etc.). If any such patient(s) existed, they were
categorized (erroneously) as not following through with treatment.
Second, there were large differences in clinic staffing and operational volumes
between the two service delivery models. Since only one clinic was included in the integrated
service delivery model, compared to three clinics in the co-located model, variation likely
exists between the three clinics included in the co-located model which was not accounted
for in this study.
Third, outcomes for screening, at-risk for postpartum depression, referral within 1 day
and treatment within 60 days during pregnancy are not taken into account in this study, only
the postpartum period. Because the training protocol also included screening during the first

53
and third trimesters of pregnancy, women may have been screened for depression during
pregnancy and refused the EPDS at the 6-week visit for a variety of reasons, including that
they accepted a referral and sought treatment earlier in their pregnancy episode. These
possible outcomes are not accounted for collectively in this study and were only evaluated
for women at-risk.
Fourth, only the first two years of data post-training are included which does not
allow for large sample sizes in the at-risk, referral and treatment categories, particularly for
the integrated service delivery model. Ramp-up time for staff to fully adopt the new process
into clinical flow was included and may have led to erroneously excluding patients that were
referred. For example, prior to implementing this universal screening protocol, obstetric
clinic staff would call, send an internal instant message, or walk a patient to the women’s
reproductive mental health clinic, all of which were methods of referral. It is possible that
some women scoring at-risk on the EPDS at the 6 week postpartum visit were referred via
phone, instant message, or walked over, especially during the initial time period after training
which was included in this study. Excluding a few of the initial months after implementation
and adding more years of data would increase the sample size of the patient population that
was screened, which would lead to increases in the data set to include more patients that fall
into the at-risk, referral and treatment groups, allowing for more stable and accurate
conclusions.
Fifth, data on the volume of postpartum patients that should have been screened is
subject to error. Postpartum patients that should have been screened (patients presenting for a
6-week postpartum visit in Table 9), is based on a best practice advisory (BPA) alert that
signals clinical staff to screen the patient for postpartum depression using the EPDS at the 6

54
week postpartum visit. The BPA alert is driven by the gestational age data field in the
electronic medical record, which is entered into the patient’s electronic medical record by the
obstetric provider during the first prenatal visit. If this field is not updated based on the
patient’s true pregnancy episode experience (i.e., fetal demise, preterm birth, etc.), it is
possible that the number of postpartum patients that should have been screened is inaccurate.
Future Research
Additional research on service delivery models and their impact on getting women at-
risk of depression into treatment should be considered. The potential to design healthcare that
delivers improved outcomes for women, infants, children and their families has the potential
to positively impact population health.
Since the training protocol included screening women for depression during
pregnancy, future research should evaluate universal screening, at-risk, referral and follow-
through with treatment during pregnancy, which may provide further insight into the
outcomes found in this study that isolated the 6 week postpartum period. Outcomes from the
pregnancy period may have an impact on postpartum screening, referral and treatment
outcomes since, in theory, the same patients should have experienced the screening process
twice while pregnant.
Next, future research should measure outcomes for all women that were screened
(pregnant and postpartum), referred and treated. Although providers and staff at the 4
obstetric clinics were trained to follow a protocol with prescribed timing intervals at which to
screen, there are likely quantifiable outcomes associated with getting women into treatment
by introducing and educating women on maternal depression and introducing the EPDS tool
at visits, which was not completely analyzed in this study. Instead of matching patients

55
across the continuum, analyzing the data so that all outcomes are considered, regardless of
when the patient was screened, may yield different results. Information from the chart review
demonstrated that that women are screened and referred, or simply referred to the women’s
reproductive mental health clinic outside of the prescribed timing intervals in the protocol.
There was stark variation between staffing and operational characteristics of the co-
located and integrated models. Even within the co-located model, there were 3 obstetric
clinics that exhibit variation. For future comparison of service delivery models, including
only one obstetric clinic in the co-located model may result in a more equitable comparison.
In addition, matching on clinic type, for example using one academic clinic in each model,
may help to control for factors across both models.
Last, comparing differences in screening and referral rates by level of provider,
nursing staff and clinical staff should be evaluated. The role of the person that introduces the
EPDS to the woman being screened may influence whether or not she completes the
screening tool. For this protocol, a nurse or medical assistant was trained to introduce the
EPDS to the women being screened and the provider would offer a referral to women at-risk.
Future Program Design
Though outcomes revealed a significant difference between the co-located and
integrated service delivery models for screening, there was not a significant difference in the
prevalence of women scoring at-risk for postpartum depression at the 6 week visit, referral or
follow-through with treatment between service delivery models. Given that women were at-
risk in both service delivery models that did not receive a referral or get treatment, using
qualitative methods to observe clinic staff screening women, providers offering a referral and

56
interviewing or conducting focus groups to learn from their experiences may be insightful to
aid in improving the process and future program design.
In addition, exploring additional methods to deliver treatment that meets women
where they are is suggested. When designing the service delivery models, the project team
hypothesized that the integrated model would reduce stigma associated with seeking mental
health treatment and result in a higher rate of at-risk women being treated. The integrated
model was designed so that the psychiatrist shared the same clinical space where women
received their routine obstetric care throughout their pregnancy episode. We hypothesized
that the patients’ familiarity with clinic - the same clinic space, waiting room, check-in/out
staff, rooming staff, seeing the psychiatrist working in the clinic - would reduce stigma and
increase referrals and follow-through with treatment. For both service delivery models,
instead of having new mothers return to the clinic on a different day for an appointment with
a provider at the women’s reproductive mental health clinic, women scoring at-risk could 1)
see a women’s reproductive mental health provider for a brief evaluation before leaving the
appointment at which they screen at-risk to establish a patient-provider relationship, and/or
2) have an option for a telemedicine visit scheduled at their convenience from any location,
including the comfort of their home. Telemedicine may be an option that facilitates more
follow-through with treatment, especially for new mothers that are healing and adjusting to
motherhood.
Lastly, future continuous improvement for the program should include improving
data capture at each step of the protocol, with a focus on accurately identifying women that
should be screened at the 6 week postpartum visit. When comparing the volume of BPA
alerts signaled at the 6 week postpartum visit used in this study (Table 9) to the volume of

57
postpartum visits completed and deliveries from the operational data (Table 3), it is clear that
there is a large discrepancy and likely an error with the BPA alert data. The BPA alert
algorithm should be reassessed, corrected to signal staff at the correct screening time period,
tested and once verified with reference to the medical record, the last step should be to
correct and re-test the algorithm for accuracy with the medical record data. Alternatively,
instead of relying on the BPA alert to signal based on an algorithm, using the visit type
“postpartum” to train staff when to screen women for postpartum depression may yield
improved and more accurate screening.

58
CONCLUSION
This study evaluated differences in implementing a universal postpartum depression
screening protocol within two service delivery models – co-located and integrated – to
determine if one design was superior at getting women at-risk for postpartum depression into
treatment. There was not a significant difference in getting women into treatment between
the two service delivery models; however, when considering outcomes of the protocol and
off protocol findings, the rate of women getting into treatment is higher in both models
compared to what has been reported in the literature (Rowan P. , Greisinger, Brehm, Smith,
& McReynolds, 2012) (Horowitz & Cousins, 2006).

59
APPENDICES
Appendix A. Edinburgh Postnatal Depression Scale

60
Appendix B. Screening and Referral Process Map for Obstetric Clinics

61
Appendix C. Results from published literature on outcomes from screening for postpartumdepression (Exposure A: Sit & Wisner, 2009; Exposure B: LaRocco-Cockburn, et al.,2013).
Screening Positive Screens Treatment Rates
ExposureTime of
Screening N % N % N %A Postnatal - - 29 - 16 55.2B Postnatal - - 102 - 91 89.2

62
Appendix D. Screenshot of sample size calculation from nQuery.

63
Appendix E. Map of trained obstetric clinics and women's reproductive mental healthservices by location and service delivery model type.

64
Appendix F. Stacking diagram of co-located service delivery model and floor plan forintegrated service delivery model.
FloorObstetric Clinic C 15
1413121110
9Obstetric Clinic B 8
7654
Obstetric Clinic A Mental Health Clinic 321
Co-located Service Delivery Model:Single building (15 floors) with 3 outpatient obstetric clinics that are co-located with a women’s reproductive mental health clinic.

65
Integrated Service Delivery Model:Single outpatient obstetric clinic (1 floor) with a women’s reproductivemental health clinic in the same clinical space as obstetric care.
Women’s reproductive mentalhealth services provided in 2
consult rooms that are adjacent

66
Appendix G. Cascading diagram depicting sample size included and excluded for studypopulation, combined service delivery models, October 1, 2014 - September 30, 2016.
Begin with
2,729
Women presenting at
the 6 week postpartum
visit
[BPA alert flags]
1,462
Women screened at the
6 week postpartum visit
[EPDS entered into
EMR]
1,267
Women not screened at
the 6 week postpartum
visit
[No EPDS entered into
EMR]
144
Women scoring at-risk on
the EPDS at the 6 week
postpartum visit
[EPDS score ≥ 10; “Yes, quite
often” to Q10 entered into
EMR]
29
Women scoring at-risk on the EPDS
at the 6 week postpartum visit and
referred to the women’s
reproductive mental health clinic
within 1 day
[Order entered into EMR within 1
day of at-risk EDPS at 6 week
postpartum visit]
14
Women scoring at-risk on the EPDS at the
6 week postpartum visit, referred to the
women’s reproductive mental health
clinic within 1 day and completing an
appointment at the women’s
reproductive mental health clinic within
60 days
[Completed visit documented within EMR
within 60 days of order date]
15
Women scoring at-risk on the EPDS at the
6 week postpartum visit, referred to the
women’s reproductive mental health
clinic within 1 day who did not complete
an appointment at the women’s
reproductive mental health clinic within
60 days
[No completed visit documented within
EMR within 60 days of order date]
ExcludedIncluded
Included
Included
Included
Excluded
Excluded
Excluded
115
Women scoring at-risk on the EPDS
at the 6 week postpartum visit and
not referred to the women’s
reproductive mental health clinic
within 1 day
[No order entered into EMR within
1 day of at-risk EDPS at 6 week
postpartum visit]
1,318
Women scoring not at-risk
on the EPDS at the 6 week
postpartum visit
[EPDS score < 10; “Never,
Sometimes, Hardly ever” to
Q10 entered into EMR]

67
Appendix H. Detailed information on referral rates and outcomes for women at-risk of postpartum depression at the 6 weekpostpartum visit, comparing service delivery models, October 1, 2014 – September 30, 2016.
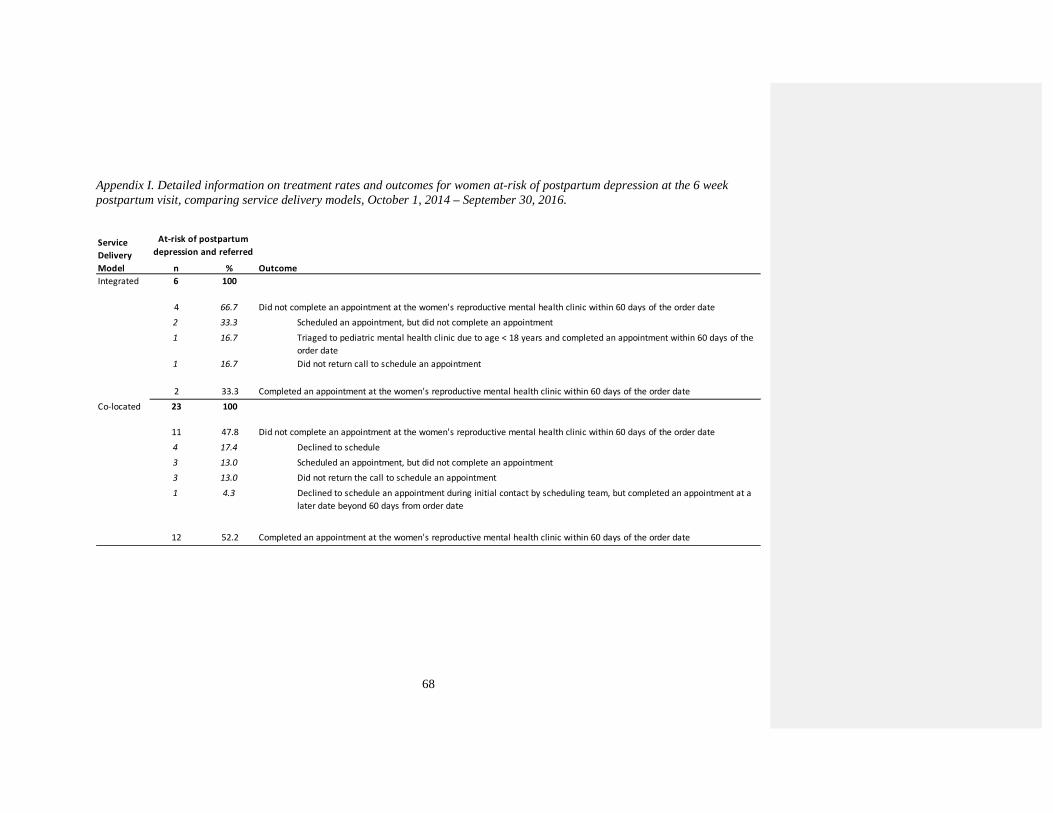
68
Appendix I. Detailed information on treatment rates and outcomes for women at-risk of postpartum depression at the 6 weekpostpartum visit, comparing service delivery models, October 1, 2014 – September 30, 2016.
n % Outcome
Integrated 6 100
4 66.7 Did not complete an appointment at the women's reproductive mental health clinic within 60 days of the order date
2 33.3 Scheduled an appointment, but did not complete an appointment
1 16.7 Triaged to pediatric mental health clinic due to age < 18 years and completed an appointment within 60 days of the
order date
1 16.7 Did not return call to schedule an appointment
2 33.3 Completed an appointment at the women's reproductive mental health clinic within 60 days of the order date
Co-located 23 100
11 47.8 Did not complete an appointment at the women's reproductive mental health clinic within 60 days of the order date
4 17.4 Declined to schedule
3 13.0 Scheduled an appointment, but did not complete an appointment
3 13.0 Did not return the call to schedule an appointment
1 4.3 Declined to schedule an appointment during initial contact by scheduling team, but completed an appointment at a
later date beyond 60 days from order date
12 52.2 Completed an appointment at the women's reproductive mental health clinic within 60 days of the order date
At-risk of postpartum
depression and referredService
Delivery
Model

69
REFERENCES
Adouard, F., Glangeaud-Freudenthal, N. M., & Glose, B. (2005). Validation of the
Edinburgh Postnatal Depression Scale (EPDS) in a sampe of women with high-risk
pregnancies in France. Archives of Women's Mental Health , 89-95.
American College of Obstetricians and Gynecologists. (2015). Committee opinion No. 630.
Screening for perinal depression. Obstetrics and Gynecology, 1268-1271.
American Psychiatric Association. (2000). Diagnostic and statistical manual of mental
disorders (4th ed.). Washington, D.C.: American Psychiatric Publishing .
American Psychiatric Association. (2013). Diagnostic and statistical manual of mental
disorders (5th ed.). Arlington, VA: American Psychiatric Publishing .
Austin, P. C. (2011). An introduction to propensity score methods for reducing the effects of
confounding in observational studies. Multivariate Behavioral Research, 399-424.
Ayanian, J. Z., & Markel, H. (2016, July 21). Donabedian's Lasting Frameowrk for Health
Care Quality. The New England Journal of Medicine, pp. 205-207.
Balbierz, A., Bodnar-Deren, S., Wang, J. J., & Howell, E. A. (2015). Maternal depressive
symptoms and parenting practices 3-months postpartum. Maternal and Child Health
Journal, 1212-1219.
Bashiri, N., & Spielvogel, A. M. (1999). Postpartum Depression: a cross-cultural perspective.
Primary Care Update for OB/GYNS, 82-87.
Bernard-Bonnin, A. C. (2004). Maternal depression and child development. Paediatric Child
Health, 575-583.
Bhat, A., Reed, S., & Unutzer, J. (2017). The obstetrician gynecologist's role in detecting,
preventing and treateing depression. Obstetrics & Gynecology, 157-163.
Born, L., Zinga, D., & Shauna, D. P. (2006). Update on the treatment of depression during
pregnancy. Therapy, 153-162.
Boyd, R. C., Le, H. N., & Somberg, R. (2005). Review of screening instruments for
postpartum depression. Women's Mental Health Archives, 141-153.
Committee on Quality Health Care in America, I. o. (2001). Crossing the quality chasm: a
new health system for the 21st century. Washington, D.C.: National Academy Press.

70
Connelly, C. D., Baker-Ericzen, M. J., Hazen, A. L., Landsverk, J., & Horowitz, S. M.
(2010). A model for maternal depression. Journal of WOmen's Health, 1747-1757.
Cox, J., Holden, J., & Sagovsky, R. (1987). Detection of postnatal depression: Development
of the 10-item Edinburgh Postnatal Depression Scale. British Journal of psychiatry,
782-786.
Curtis, M. A., Corman, H., Noonan, K., & Reichman, N. E. (2014). Maternal depression as a
risk factor for family homelessness. American Journal of Public Health, 1664-1670.
de Albuquerque Moraes, G. P., Lorenzo, L., Pontes, G. A., Montenegro, M. C., & Cantilino,
A. (2017). Screening and diagnosing postpartum depression: when and how? Trenda
in Psychiatry and Psychotherapy, 54-61.
Dean, A. G., Sullivan, K. M., & Soe, M. M. (2013, April 6). OpenEpi: Open Source
Epidemiologic Statistics for Public Health. Retrieved from Two by Two Tables:
https://www.openepi.com/Menu/OE_Menu.htm
Di Florio, A., Smith, S., & Jones, I. (2013). Postpartum Psychosis. The Obstetrician &
Gynaecologist, 145-150.
Dimidjiam, S., Sherwood, N., Sherwood, N. E., Simon, G. E., B. J., Welch, S. S., . . . Beck,
A. (2017). A pragmatic randomized trial of behavioral activation for depressed
pregnant women. Journal of Consult Clinical Psychology, 26-36.
Evans, J., Heron, J., Francomb, H., Oke, S., & Golding, J. (2001). Cohort study of depressed
mood during pregnancy and after childbirth. British Journal of Medicine, 257-260.
Evins, G. G., Theofrastous, J. P., & Galvin, S. L. (2000). Postpartum depression: A
comparison of screening and routine clinical evaluation. American Journal of
Obstetrics and Gynecology, 1080-1082.
Gjerdingen, D. K., & Yawn, B. P. (2007). Postpartum depression screening: importance,
methods, barriers, and recommendations for practice. Journal of the American Board
of Family Medicine, 280-288.
Goodman, S. H., Rouse, M. H., Connell, A. M., Broth, M. R., & Heyward, D. (2011).
Maternal depression and child psychopathology: a meta-analytic review. Clinical
Chld Familty Psychology Review, 1-27.

71
Harris, B., Huckle, P., Thomas, R., John, S., & Fung, H. (1989). The use of rating sclaes to
identify post-natal depression. British Journal of Psychiatry, 813-817.
Heath, B., Romero, P., & Reynolds, K. A. (2013). A review and proposed standard
framework for levels of integrated care. Washington, D.C.: SAMHSA-HRSA Center
for Integrated Health Solutions.
Hobfall, S. E., Ritter, C., Lavin, J., Hulsizer, M. R., & Cameron, R. P. (1995). Depression
prevalence and incidence among inner-city pregnant and postpartum women. Journal
of Consulting and Clinical Psychology, 445-453.
Hodges, S., Ferreira, K., Israel, N., & Mazza, J. (2006). Strategies for system of care
development: Making change in complex systems. Tampa, FL: Research and Training
Center for Children's Mental Health, Louis de la Parte Florida Mental Health
Institute.
Horowitz, J. A., & Cousins, A. (2006). Postpartum Depression Treatment Rates for At-Risk
Women. Nursing Research, S23S27.
Kaltenback, L. (2008, April 11). How to use propensity score analysis. Retrieved from
Vanderbilt University Medical Center, Clinical Research Center :
http://www.mc.vanderbilt.edu/crc/workshop_files/2008-04-11.pdf
Kendall, R. E., Wainwright, S., Hailey, A., & Shannon, B. (1976). The influence of
childbirth on psychiatric morbidity. Psychological Medicine, 297-302.
Kohn, L. T., Corrigan, J., & Donaldson, M. S. (2000). To err is human:Building a safer
health system. Washington, D.C.: National Academy Press.
LaRocco-Cockburn, A., Reed, S. D., Melville, J., Croicu, C., Inspektor, M., Edmondson, E.,
& Katon, W. (2013). Improving depression treatment for women: Integrating a
collaborative care depression intervention into OB-Gyn care. Contemporary Clinical
Trials, 362-370.
Lavendar, T. J., Ebert, L., & Jones, D. (2016). An evaluation of perinatal mental health
inverventions. Women and Birth, 399-406.
Lavin, J., Hobfall, S. F., Ritter, C., Hulsizer, M. R., & Cameron, R. P. (1995). Depression
prevalence and incidence among inner-city pregnant and postpartum women. Journal
Consulting and Clinical Psychology, 445-453.

72
Lighter, D. E. (2015). How (and why) do quality improvement professionals measure
performance? International Journal of Pediatrics and Adolescent Medicine, 7-11.
Melville, J. L., Reed, S. D., Russo, J., Croicu, C. A., Ludman, E., LaRocco-Cockburn, A., &
Katon, W. (2014). Improving care for depression in obstetrics and gynecology.
Obstetrics & Gynecology, 1-10.
Moore, M. A., Ayres, S., & Drey, N. (2016). A thematic analysis of stigma and disclosure for
perinatal depression on an online forum. Journal of Medical Internet Research.
Murray, L., & Carothers, A. D. (1990). The validation of the Edinburgh Postnatal Depression
Scale on a community sample. British Journal of Psychiatry, 288-290.
Myers, E. R., Aubuchon-Endsley, N., Bastian, L. A., Gierisch, J. M., Kemper, A. R., Swamy,
G. K., . . . Sanders, G. D. (2013). Efficacy and safety of screening for postpartum
depression. Comparative effectiveness review 106. Agency for Healthcare Research
and Quality .
Myors, K. A., Schmied, V., Johnson, M., & Cleary, M. (2013). Collaboration and integrated
services for perinatal mental health: an integrative review. Child and Adolescent
Mental health, 1-10.
Nolen-Hoeksema, S. (2001). Gender differences in depression. Current Directions in
Psychological Science, 173-176.
O'Hara, M. W., & Swain, A. M. (1996). Rates and risk of postpartum depression - a meta-
analysis. International review of Psychiatry, 37-54.
Ramadas, K., Teisberg, E., & Tucker, A. L. (2012). Four ways to reinvent service delivery.
Harvard Business Review.
Rowan, P. J., Greisinger, A., Upadhyaya, M., & Smith, F. (2013). Why don't depressed
pregnant women follow through with mental health referral? Journal of Women's
Health, Issues & Care, 1-8.
Rowan, P., Greisinger, A., Brehm, B., Smith, F., & McReynolds, E. (2012). Outcomes from
implementing systematic antepartum depression screening in obstetrics . Archives of
Women's Mental Health.

73
Santoro, S., Peabody, H., Schoenman, J., & Chochley, N. (2010). Identifying and treating
maternal depression: Strategies and considerations for health plans. Washington,
D.C.: National Institiue for Health Care Management .
Shat, Amirtha, Reed, S., & Unutzer, J. (2017). The obstetrician-gynecologist's role in
detecting, preventing, and treating depression. Obstetrics and Gynecology, 157-163.
Sit, D. K., & Wisner, K. L. (2009). The identification of postpartum depression. Clinical
Obstetrics and Gynecology, 456-468.
Smith, V. K., Gifford, K., Ellis, E., Edwards, B., Rudowitz, R., Hinton, E., . . . Valentine, A.
(2016, October). Births Financed by Medicaid. Retrieved from Henry J Kaiser Family
Foundation : https://www.kff.org/medicaid/state-indicator/births-financed-by-
medicaid/?currentTimeframe=0&sortModel=%7B%22colId%22:%22Location%22,%
22sort%22:%22asc%22%7D
Stroul, B. A., Blau, G. M., & Friedman, R. M. (2010). Issue brief: Updating the system of
care concept and philsophy. Washington, D.C.: Georgetown University Center for
Child and Human Development, National Technical Assistance Center for Children's
Mental health.
Stroul, B., Goldman, S., Rider, F., & Friedman, R. (2015). Toolkit for expanding the system
of care approach. Washington, D.C.: George Washington Center for Child and
Human Development, National Technical Assitance Center for Children's Mental
Health.
Stuart-Parrigon, K., & Stuart, S. (2014). Perinatal depression: An update and overview.
Current Psychiatry Reports, 1-9.
Szklo, M., & Nieto, F. J. (2006). Epidemiology: Beyong the Basics. Jones & Bartlett
Learning, 2nd edition.
Thomas, M., Hutchinson, M., Castro, G., Nau, M., Shumway, M., Stotland, N., & Spielvogel,
A. (2017). Meeting women where they are: Integration of care as the foundation of
treatment for at-risk pregnant and postpartum women . Journal of Maternal and Child
Health, 452-457.
Tuttle, C. R., & Kendall, D. (2011). Maternal depression: What employers need to know and
what they can do. Washington, D.C.: National Business Group on Health .

74
Vinson, N. B., Brannan, A. M., Baughman, L. N., Wilce, M., & Gawron, T. (2001). The
system-of-care model: implementation in twenty-seven communities. Journal of
Emotional and Behavioral Disorders, 30-42.
Whiffen, V. E. (1988). Screening for postpartum depression: a methodoligcal note. Journal
of Clinical Psychology, 367-371.
Yawn, B. P., Pace, W., Wollan, P. C., Bertram, S., Kurland, M., Graham, D., & Dietrich, A.
(2009). Concordance of Edinburgh Postnatal Depression Scale (EPDS) and Patient
Health Questionnaire (PHQ-9) to Assess Increased Risk of Depression among
Postpartum Women. Journal of the American Board of Family Medicine, 483-491.


