Recommendations for best
technological and operational
practices for oil spill response in
the NPA region
Häkkinen, Jani & Rytkönen, Jorma
November 2020
APP4SEA Report T.1.1.1
AP
P4S
EA
Re
com
me
nd
atio
ns fo
r be
st
techn
olo
gic
al a
nd
op
era
tio
na
l
pra
ctice
s f
or
oil
sp
ill r
espo
nse
in t
he
NP
A r
egio
n
Fin
nis
h E
nvir
on
me
nt
Ins
titu
te
Ma
rine
Rese
arc
h C
entr
e
He
lsin
ki/F
inla
nd

APP4SEA
The 21st century brought unprecedented interest in the Arctic resources, turning the
region from the world's unknown periphery into the center of global attention.
Within the next 50 years, local coastal communities, their habitual environment and
traditional lifestyle will undergo severe changes, starting from climatic perturbations
and ending with petroleum industrial intervention and increased shipping presence.
The APP4SEA project, financed by the Northern Periphery and Arctic Programme will
contribute to environmental protection of the Arctic waters and saving the habitual
lifestyle of the local communities. It will improve oil spill preparedness of local
authorities and public awareness about potential oil tanker accidents at sea.
Disclaimer: All reasonable measures have been taken to ensure the quality, reliability, and
accuracy of the information in this report. This report is intended to provide information and
general guidance only. If you are seeking advice on any matters relating to information on this
report, you should contact the University of Oulu with your specific query or seek advice from
a qualified professional expert.

Recommendations for best technological and operational practices for oil spill response in the NPA region APP4SEA
1
Summary This report is one of the outcomes of the project Arctic Preparedness Platform for Oil Spill and
Other Environmental Accidents (APP4SEA), funded by the EU Northern Periphery and Arctic
Programme. The aim of this report is to describe the use of suitable oil spill response (OSR)
methods for the Arctic Area with a primary focus on the open water environment. Coastal
protection and activities in shallow water have been not included.
The three most promising tools for OSR in the Arctic are mechanical recovery, in-situ burning
and the use of dispersants. The report uses and references the latest data and scientific
literature in discussing these tools’ pros and cons. The data published by the Arctic Council’s
Emergency Prevention, Preparedness and Response (EPPR) Working Group in particular has
been an excellent source for determining the use of OSR tools in different environmental
conditions. Remote sensing and monitoring tools are also briefly discussed.
Share knowledge on oil behavior on sea, oil spill response
methods, experience with tools and models;
Introduce cutting edge technologies;
Provide local authorities and general public with access to the
knowledge bank.

Recommendations for best technological and operational practices for oil spill response in the NPA region APP4SEA
2
Contents
Summary .............................................................................................................................. 1
Contents ............................................................................................................................... 2
Introduction ........................................................................................................................... 4
Basic features of the Arctic ................................................................................................... 6
Fate of oil in ice-infested waters ............................................................................................ 9
Oil characteristics ............................................................................................................ 10
Oil on ice ......................................................................................................................... 13
Oil under ice .................................................................................................................... 13
Mechanical Recovery .......................................................................................................... 17
In-Situ Burning .................................................................................................................... 22
Dispersants ......................................................................................................................... 30
Debate about toxicity ....................................................................................................... 32
Economic discussion ....................................................................................................... 35
Bioremediation and natural attenuation ............................................................................... 37
Some recent guidelines ....................................................................................................... 40
COSRVA report ............................................................................................................... 40
Gap analyses for COSRVA report ................................................................................... 41
Results - examples .......................................................................................................... 44
General observations ...................................................................................................... 48
Other guidelines .............................................................................................................. 48
Modelling of oil spill movements .......................................................................................... 50
Monitoring ........................................................................................................................... 61
Oil spill detection ............................................................................................................. 61
Other means for oil spill detection .................................................................................... 63
Monitoring onboard vessels and offshore structures ........................................................ 65

Recommendations for best technological and operational practices for oil spill response in the NPA region APP4SEA
3
Autonomous drifting buoys, drifters ................................................................................. 66
References ......................................................................................................................... 68

Recommendations for best technological and operational practices for oil spill response in the NPA region APP4SEA
4
Introduction
The Arctic is an area in the Northern hemisphere defined here as where the climate is cold
and harsh, where ice often occurs and where there is a lack of light for many months of the
year. The Arctic is also remote with limited infrastructure, often creating logistics problems.
Because most conventional response technologies require prompt action, they have a limited
potential in the Arctic. Since 1920 there have been sporadic oil and gas activities in the Arctic,
and the activities will probably increase in the future with more accessible areas created by
higher temperatures and the melting of ice. In addition, more activities related to tanker traffic
are expected, so the increase in activities related to the handling of oil will increase the risk of
oil spills. When oil is spilt at sea, the oil is weathered and the composition is changed
depending on the environmental conditions and the oil type. An oil spill may cause serious
damage to the pristine Arctic environment. To counteract the negative effects of an oil spill, it
is important to improve the operational capability for handling oil spills in Arctic areas with
proper oil spill contingency planning.
This report is part of the work carried out within the project “Arctic Preparedness Platform for
Oil Spill and Other Environmental Damages” (APP4SEA), funded by the EU Northern
Periphery and Arctic (NPA) Programme. The main goal of APP4SEA was to improve oil spill
response (OSR) preparedness in the NPA region. This was to be achieved through the
following actions:
- Pooling oil spill response competencies across the region;
- Upskilling local authorities in charge of oil spill response through transfer of best
practices and tools;
- Raising awareness in coastal communities about the risks associated with increased
marine traffic.
Protecting natural and cultural heritage, marine bird species and the livelihood of coastal
communities was set as the overall goals of the project.
Project objectives covered a set of important items where the most vital goals were:
- to introduce local coastal authorities to state-of-the-art technologies to improve their
organizational knowledge and operational performance;
- to make sure that internationally/locally discovered know-how is recognized and used;

Recommendations for best technological and operational practices for oil spill response in the NPA region APP4SEA
5
- to form a transnational expert pool to share knowledge on oil behavior on sea, oil spill
response methods, experience with tools and models;
- to provide local authorities and communities with an open access knowledge bank;
- to offer a decision-making tool that can be used to improve efficient response and thus
minimise ecological impacts and
- to offer interactive educational material for educational institutions.
This report is one of the outcomes of the APP4SEA. Other themes considered the
development of the interactive smart map tool with the selected data layers and tools and
toolkits for OSR professionals. See: https://app4sea.interreg-npa.eu/outputs-and-results/
The report concentrates mainly on three OSR methods seen as suitable in the Arctic area:
mechanical response, in-situ burning and the use of dispersants. Natural oil biodegradation –
attenuation – is also discussed shortly. The description of the harsh nature and special
vulnerable Arctic conditions are only mentioned briefly in this report, and the reader is
encouraged to seek out detailed data from the reports of the Arctic Councils AMAP (Arctic
Monitoring and Assessment Programme) Working Group (https://www.amap.no/). The latest
data of the Council’s Emergency Prevention, Preparedness and Response (EPPR) form a
solid data bank for evaluating best OSR practices in the Arctic area.
Other important factors handled in this report are the use of remote sensing, satellites, use of
UAVs (drones) and other tools suitable for detecting oil. The modelling of oil spill trajectories
is also discussed and several known models and their basic features are covered.
During the execution phase, the APP4SEA project also interacted with specialists and oil-
combating authorities of the Arctic area through involvement with the large-scale oil in ice trial
arrangements in 2016 in Oulu, Finland. The objective of the MOSPA Agreement ( Agreement
on Cooperation on Marine Oil Pollution Preparedness and Response in the Arctic) is to
strengthen cooperation, coordination and mutual assistance among the Parties on oil pollution
preparedness and response in the Arctic in order to protect the marine environment from oil
pollution. The MOSPA Agreement was signed in Kiruna on May 15th, 2013 by all eight Arctic
states and entered into force in 2016.

Recommendations for best technological and operational practices for oil spill response in the NPA region APP4SEA
6
Basic features of the
Arctic From the environmental point of view, the Arctic forms a unique and sensitive environment,
where any oil spill may cause severe damage. A typical feature for the Arctic is the extreme
seasonal variations which reflects the ecological sensitivity of the area. The short summer
season is an important mating season for many waterfowl and other animals, and various
species crowd certain Arctic areas during the short summer seasons. Cold water forms a
rich environment for aquatic life where whales and other mammals feed themselves and
have certain areas as their playground. Fish species are numerous, and there are important
spawning areas where any oil spill may endanger fish stocks and cause long-term decline.
Bottom animals and all species living close to coastlines and in shallow water are the kinds
of animals to be targeted for protection.
The Arctic area is a very large area with different geological formations, islands and rocks
and deep-water basins. There are numerous types of shorelines, which greatly affects oil
recovery options or coastal protection operations against drifting oil slick. Oceanographic
and coastal seasonal variations have significant impact on nature and the air temperature
variations and winds create rapidly changing conditions where all operations could be
difficult and time consuming.
Ice is a chief characteristic of Arctic conditions. Open water has the freezing phase with
different ice forms all with their own behavior with spilled oil. Once the sea area is frozen,
conditions are often stable, but winds may cause the formation of ice ridges and form
dynamic drifting ice conditions. Operations can be carried out on the ice in winter. Finally,
spring is the melting season with the ice breakup, after which it is again an open water area.
The cold climate also means that the spilled oil will usually have a slower oil alteration
process with slower weathering and persistence of spilled oil. The cold air temperature in
turn affects the personnel and all equipment. Cold temperatures, high wind and poor visibility
are risk factors affecting safety. The high viscosity of oil, for example, may block pumps and
hoses and stop recovery operations.

Recommendations for best technological and operational practices for oil spill response in the NPA region APP4SEA
7
From the operational point of view, perhaps the main challenge for the OSR operations is
the long distances and remoteness of the Arctic area. There is no infrastructure or logistical
support to conduct operations. In the case of an oil spill, the resources to dealing with the oil
may be very limited and the deployment time for necessary equipment and other resources
may be long. It is very likely that the first responders will be forced to improvise
countermeasures. There might also be environmental conditions that make any operation
too risky for the responders or equipment, and even finding out the oil’s location could be a
challenge, especially in severe ice conditions.
Seasonal daylight variability is also a special feature in the High North. The long dark
season during the winter affects safety issues and makes it difficult to find the oil to be
collected. There are also a lot of days when fog will reduce the visibility and produce extra
difficulties for responders. Poor visibility or icing phenomena may endanger aircraft
operations and significantly affect marine operations.
Seasonal variation also affects clean-up operations in shallow water and close to the
shorelines. There are a lot of different shore types, some open and some covered by ice,
where certain recovery tools will not be favourable. Seasonal variation will greatly affect the
conditions met at certain shorelines. There are also land areas where permafrost is an issue
and needs to be considered, especially if some support stations or logistic centers are
established in summer.
The safety of the responders and other staff is central to Arctic OSR operations. Guidelines
and occupational heathy concerns have been listed for example in EPPR (2017a) and in
many guidelines made for personnel working within the oil and gas industry In the Arctic
area (https://www.seapro.org/toolbox.html).
Conditions must be safe if a response is to be attempted. Monitors must be used to
safeguard the health and safety of response personnel. An explosive, toxic atmosphere can
develop in spills of high-sulfur crude oils and volatile oils (EPPR 2017a). It is likely, however,
that in the case of a remote oil spill in the Arctic, the significant parts of the volatile have
evaporated before any significant countermeasures or equipment are transported to the area
under operation. This occupational health concern is anyhow an important issue for first
responders and for crew surveying the area to build up the situational awareness view for
the command center.

Recommendations for best technological and operational practices for oil spill response in the NPA region APP4SEA
8
It is primarily the cold weather and extreme weather conditions which may be concerns for
responders in the Arctic. Seasonal daylight variations may also bring extra challenges
especially in winter when the amount of daylight is minimal. The wind-chill effect is also a
factor to consider with regard to good clothing and support stations. It is likely that the
extreme environmental conditions may considerably reduce operational efficiency: icing of
the equipment, failures due to the extreme cold and problems of water and food supplies are
typical failures that accompany typical challenges with electric supplies and batteries in the
cold.
For coastal protection work, cleaning efforts and working on the ice, another concern is
bears. Sea mammals and their feeding and reproduction sites are special areas to be taken
into account, too.

Recommendations for best technological and operational practices for oil spill response in the NPA region APP4SEA
9
Fate of oil in ice-infested
waters The fate of oil in ice depends significantly on the ice concentration and on the processes and
possible encapsulation rate of oil around ice. Various ice formations from stable columnar ice
to pack ice formation will significantly affect the selection of the optimal countermeasure.
Usually the mid-winter conditions form stable conditions for the countermeasures, and some
recovery efforts may be possible based on the ice field. The freezing season and the ice break
up conditions with moving ice makes even the surveillance of oil difficult and can block all
effective countermeasures. Sometimes the only effective way to deal with oil is oil detection
in the ice and then to wait for spring for real countermeasures. Oil can also be trapped under
ice, partly inside the ice blocks, and can penetrate through the brine channels of the ice up to
the ice surface. Thus, oil-ice interaction can be very complex, as illustrated in Figure 1.
Figure 1. Illustration of oil and ice processes (adapted from Bobra, A.M. and Fingas, M. 1986)
(Source: ExxonMobil).
Evaporation is the major weathering process that occurs for spills on ice or in pack ice. Oil
evaporation rates on ice, in leads and among pack ice are generally slower than for spills on
open water. This is because the temperatures are lower in ice situations, and the oil slicks are
much thicker. The presence of a snow cover also greatly reduces the evaporation rate of oil.

Recommendations for best technological and operational practices for oil spill response in the NPA region APP4SEA
10
Ultimately, spills on or in ice will reach the same final degree of evaporation as spills on water
(Buist I. A. et al. 2013).
Oil characteristics
There are a lot of different oil types available and used in the marine industry for fuel for ships.
Typical oils are bunker oils, which have a variety of viscosities and thus different behavior in
the water if spilled out at sea. Of growing importance is marine diesels, with the low sulphur
content. Most important, however, is still the transportation of crude oil, which usually poses
the most significant risk for the environment due to the large transport units of the oil. Bunker
oil spills usually have the size of a few hundred tons of oil, but the ruptured tank releases of
an oil tanker may be in the order of several thousand tons.
The chemical composition of crude oils from different producing regions, and even from within
a particular formation, can vary tremendously. Crude oils contain thousands of different
chemical compounds. Hydrocarbons are the most abundant compounds in crude oils,
accounting for up to 98% of the total composition. While carbon (80-87% by weight) and
hydrogen (10-15%) are the main elements in petroleum, sulfur (0-10%), nitrogen (0-1%), and
oxygen (0-5%) are important minor constituents. Crude oils also contain widely varying
concentrations of trace metals (Buist, I.A. et. al 2013).
The essential feature of crude oil with regard to the ISB is the high amount of volatiles, i.e.
light hydrocarbons. These hydrocarbons, C1 – C12, have the tendency to evaporate quickly
and most of the crude oils usually will lose a significant amount of their mass by evaporation
once spilled into the sea. Technically these lighter hydrocarbons are alkane alkanes, and the
whole oil mixture contains a lot of other hydrocarbons such as cycloalkanes, aromatics,
asphaltenes and more. More detailed descriptions of crude oils and the properties of various
types of crude oil can be found from the literature.
Most crude oils are insoluble in water and will spread via wind and currents. They also usually
float on water, except for some more rare types w a higher amount of asphaltenes and other
heavy hydrocarbon fractions. Crude oils also form emulsions, which depends significantly on
the wave energy and environmental conditions. This tendency to form emulsions with
evaporation, dissolution and more is generally called oil alteration. Generally fresh oil is easier
to ignite due to the high amount of volatiles. The more altered the oil is, the more difficult it is

Recommendations for best technological and operational practices for oil spill response in the NPA region APP4SEA
11
to use ISB as a countermeasure. The time period between the initial accident point and the
point where the oil is too altered to ignite is called the window of opportunity.
The tendency of oil to form emulsions, for example. a mousse type of mixture (water-in-oil),
requires wave energy and is thus rather unlikely in the case of oil in ice interaction. Wind
waves are effectively reduced due to the ice floes or pack ice, thus the oil alteration process
is more dependent on evaporation only. Ice also restricts the spread of oil, thus the oil can be
found in higher thicknesses, reducing evaporation compared to free spreading in open water
conditions. Lower temperatures also decrease the evaporation rate.
Spills of some crude oils (generally those with higher concentrations of asphaltenes) will start
to form an emulsion within a few minutes of being spilled and will form a highly viscous and
stable emulsion within hours. Other crude oils must lose some of their lighter components
through evaporation before the concentrations of their asphaltenes and resins are raised to
the levels required to stabilise emulsions. Most distilled petroleum products do not easily
emulsify at all.
There are a few test results available on the degree of emulsification with ice conditions. Most
of them were conducted as tank tests or in wave flumes. If no wave energy was present and
the temperature was cold, practically no emulsification was noted. Adding wave energy and
temperature led to significant emulsification. Payne, J. R. et al. (1987), for example, reports
an increase of water content up to 50% in a six-day test for one type of crude oil in open water
conditions. The same oil for first year ice in the break up dynamic situation resulted in the
water content increasing rapidly by 64%, staying stable six days in the test conditions! For
multi-year ice, the emulsification noted was slower, and during the six-day test period 28% of
the water content was achieved.
Similar results were achieved in Finland after the Antonio Gramsci oil accident in 1987, where
practically no emulsification took place during the first 20 days in stable winter conditions.
Then spring came and swell movements started to emit energy to the system resulting in close
to 28% water content during a 34-day of period. The observations were also supported by
tank and flume tests, which showed up to 75% emulsion rates due to the waves in beach
conditions already in short periods (Hirvi, J. P. et al 1992). The oil type was the Soviet Blend,
known nowadays as the Russian Blend.
Emulsification as a process may be the unexpected factor which can endanger the response
options: even if the evaporation causes a significant loss of oil during the first days, the rapid

Recommendations for best technological and operational practices for oil spill response in the NPA region APP4SEA
12
emulsification may increase the total amount of the mass to be recovered rapidly. As a
consequence, there might be significantly larger mass of oil to be recovered than was
expected based on the data related to the initial amount of spilled oil. Modern oil spill models
use the empirical data of various oils to estimate the fate of oil and give estimates for the oil
spreading as sk. oil trajectories.
Recently some Table Top evaluations were made in the Gulf of Finland for ten different oil
spill scenarios (Laine, V. et al. 2018). One of the scenarios consisted of 20,000 tons of light
crude oil release, and several model tools were used to predict the fate of the oil. The scope
of this study was to test the local preparedness of the authorities to alert and mobilize
resources in all of these scenarios. Using sophisticated tools like ALOHA, SpillMod (Ivchenko,
A. 2011), and ADIOS (ARCOPOL 2013) it was noted that depending on the model and the
wave and current data used in the analyses, the initial 20,000 tons of oil spill will enlarge
significantly in spite of the high tendency of evaporation which already after the first day (open
water conditions) will reduce the oil on the water by 6,000 tons. Wave energy rapidly increased
the amount of oil on the water resulting in volumes in the range of 70,000–120,000 tons
depending on the model used (Rytkönen, J. et al 2018). Here only three days of drifting were
modelled in a variety of environmental conditions. It is likely also that in heavy wave conditions
the light crude will gradually loose volatiles, absorb more water in and sink under the water
surface, thus escaping all OSR actions (Figure 2).
Figure 2. An example of the modelled oil spill trajectory in the Gulf of Finland using SpillMod
model. All curves represent the possible oil spill trajectories based on several years wave and
current statistical data. Different colors represent the different months of the year (Rytkönen
J et al 2018).

Recommendations for best technological and operational practices for oil spill response in the NPA region APP4SEA
13
Crude oil is a raw material for refined oil products; these are products in general use for
humans in various sectors of the economy. Marine fuel oils usually consist of Heavy Fuel Oils
(HFO), Intermediate Fuel Oils (IFO) and Marine Diesel Oils (MDO). Some of the HFO types
are denser than water and will sink to the bottom if poured into the sea. Some of the IFO types,
once spilled into the sea, may alter and sink under the water surface but still continue drifting
in the water column and again rise to the surface or beach line depending on the density
differences of oil and water in certain environmental conditions. These refined oil types form
the largest parts of the ship’s own fuel oil and they are also transported by the product tankers,
thus forming a risk for a significant oil spill if any of the cargo tanks were to be damaged. There
are also other types of refined oil products transported by ships such as kerosines, jet fuels,
by-products of crude oil and some new oil types like tar oil, pine oil, bio fuels and gasoline.
Oil on ice
In icy conditions, oil may also exist on the ice. If oil is spilled into the sea and has time to
spread, it may end up on the ice if the weather conditions suddenly shift toward frozen
conditions. Oil can also be trapped on the ice floes in dynamic pack ice conditions. Some of
the oil trapped under ice floes may also seep through the ice especially in the spring, forming
melting pools where oil will float on the water. Oil spilled on ice spreads much more slowly
than on water and covers a smaller final area, thus slicks on ice tend to be much thicker: The
roughness of ice is the key factor for the oil spreading – the more roughness, the less the oil
will spread. Smooth first year ice has roughness typically between 3 and 30 mm. Ice ridges,
pressurized conditions and ice ridges may increase the roughness and even stop the oil
spreading on the ice. Snow on the ice also acts as an absorbent, thus reducing the oil
spreading effectively.
Oil under ice
The maximum average oil layer thickness under sea ice can range from several centimeters
for spills in early winter to tens of centimeters in April for a spill under ice at the end of the ice
growth cycle. The maximum oil thickness in the deepest pools could vary from 10 to over 30
cm, respectively. Actual values will depend on the local ice conditions at the time of the spill
(Buist I. A. et al. 2013).
Even large spills (thousands of cubic meters) of crude oil underneath solid (or fast) ice will
usually be contained within short distances from the spill source, depending on under-ice

Recommendations for best technological and operational practices for oil spill response in the NPA region APP4SEA
14
currents and ice roughness. Natural variations in first-year ice thickness provide huge natural
“reservoirs” to effectively contain oil spilled underneath the ice within a relatively small area.
Table 1. Comparison of crude oil spreading (volume 10,000 bbl) in open water, under solid ice
and on smooth ice (Buist I . et al. 2013).
Figure 3. Illustration of oil spreading under and fast smooth ice (Dickins, D. F. & Glover, N.
1996).
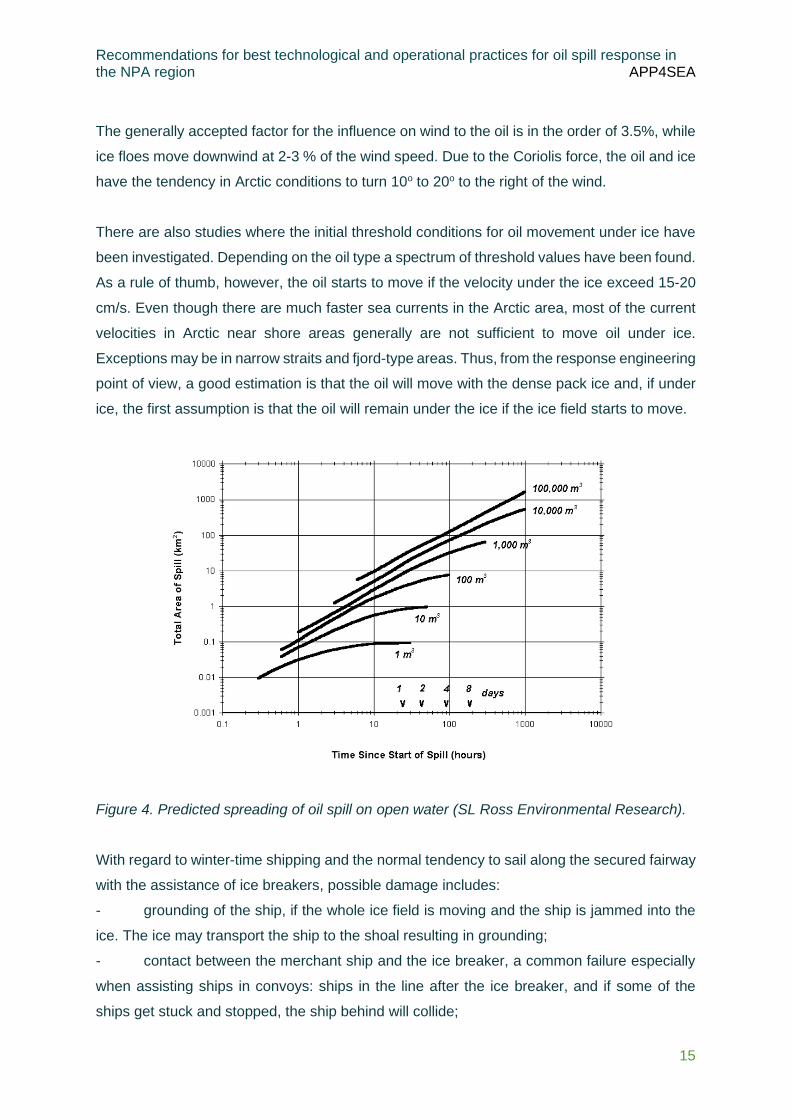
There are a lot of formulas available concerning oil spreading in open water conditions and
empirical data on how these formulas can also be used for ice-infested waters. Figure 4 below
shows one of those diagrams developed for oil spills in open water conditions. The estimated
spill radius rate can further be estimated for ice conditions using empirical coefficient, smaller
than one, found from the literature: The more severe the ice conditions and the higher ratio
for the ice/open water relationship, the less spreading will exists. Studies show that when the
pack ice ratio is higher than 60-70%, the ice blocks the spreading and oil and the ice moves
together due to currents and winds. For lower ice concentrations, i.e. from 30 to 60%, the oil
and the ice will move at different rates under the influence of wind.
Recommendations for best technological and operational practices for oil spill response in the NPA region APP4SEA
15
The generally accepted factor for the influence on wind to the oil is in the order of 3.5%, while
ice floes move downwind at 2-3 % of the wind speed. Due to the Coriolis force, the oil and ice
have the tendency in Arctic conditions to turn 10o to 20o to the right of the wind.
There are also studies where the initial threshold conditions for oil movement under ice have
been investigated. Depending on the oil type a spectrum of threshold values have been found.
As a rule of thumb, however, the oil starts to move if the velocity under the ice exceed 15-20
cm/s. Even though there are much faster sea currents in the Arctic area, most of the current
velocities in Arctic near shore areas generally are not sufficient to move oil under ice.
Exceptions may be in narrow straits and fjord-type areas. Thus, from the response engineering
point of view, a good estimation is that the oil will move with the dense pack ice and, if under
ice, the first assumption is that the oil will remain under the ice if the ice field starts to move.
Figure 4. Predicted spreading of oil spill on open water (SL Ross Environmental Research).
With regard to winter-time shipping and the normal tendency to sail along the secured fairway
with the assistance of ice breakers, possible damage includes:
- grounding of the ship, if the whole ice field is moving and the ship is jammed into the
ice. The ice may transport the ship to the shoal resulting in grounding;
- contact between the merchant ship and the ice breaker, a common failure especially
when assisting ships in convoys: ships in the line after the ice breaker, and if some of the
ships get stuck and stopped, the ship behind will collide;

Recommendations for best technological and operational practices for oil spill response in the NPA region APP4SEA
16
- collision of the ship in the ice channel: narrow ice channel will lead to the collision, and
ships may hit sideways or partly bow-to-bow;
- icing: the ship is gradually covered by spray ice and will lose stability and capsize;
- ice pressure: the ship is jammed to the ice. Moving ice will break the hull and cause
massive damage and even sinking of the ship.

Recommendations for best technological and operational practices for oil spill response in the NPA region APP4SEA
17
Mechanical Recovery
Mechanical recovery has been understood as a method to contain and collect oil from the
water’s surface for disposal. This approach requires storage of recovered fluids until they can
be properly managed. The following operational sub-systems for this approach were in this
report:
- mechanical recovery with two vessels with a boom;
- mechanical recovery with a single vessel with an outrigger (sweeping arms and inbuilt
oil lifting system to the recovery tank);
- three vessels with Vessel of Opportunity (VOO) with boom and
- single vessel in ice.
VOO may be a local commercial or recreational vessel identified to assist in responding to
large oil spills. Employing VOO and boat crews to assist in emergency response can help the
local communities recover during a period of disruption. The advantage here is to use local
crew and operators which have the best knowledge of the local circumstances and
environmental conditions. The system is used in Alaska (for example https://www.seapro.org/
), and similar preparedness in using local fishermen in emergency operations exists in
Norway.
The three vessels system is also used in the Baltic Sea, where two smaller boats or tugboats
may tow a U-shaped boom with an opening in the top of the U form. The third vessel, having
the inbuilt recovery system with sweeping arms, has her position just in the opening and
collects all the oil forced to spill out when towing the boom with a velocity of 1-2 knots.
Unlike other remediation technologies, skimmers can be used to recover oils across a wide
range of viscosities. Skimmers exist that can effectively recover oil across all of the ASTM
viscosity categories (I through V).
Many “rules of thumb” about the selection of oil spill skimmers are based on performance tests
conducted in the 1970s through the 1990s. Because skimming technology has not changed
appreciably since that time, the standing rules of thumb are probably applicable to
commercially available skimmers today. Emerging skimmer technologies are being developed
in academic settings to improve the oil recovery capabilities of oleophilic skimmers. Ongoing
Recommendations for best technological and operational practices for oil spill response in the NPA region APP4SEA
18
research includes the development of grooved patterns on drum skimmers, novel oleophilic
surface coatings, and the application of nanotechnology to novel oleophilic surfaces.
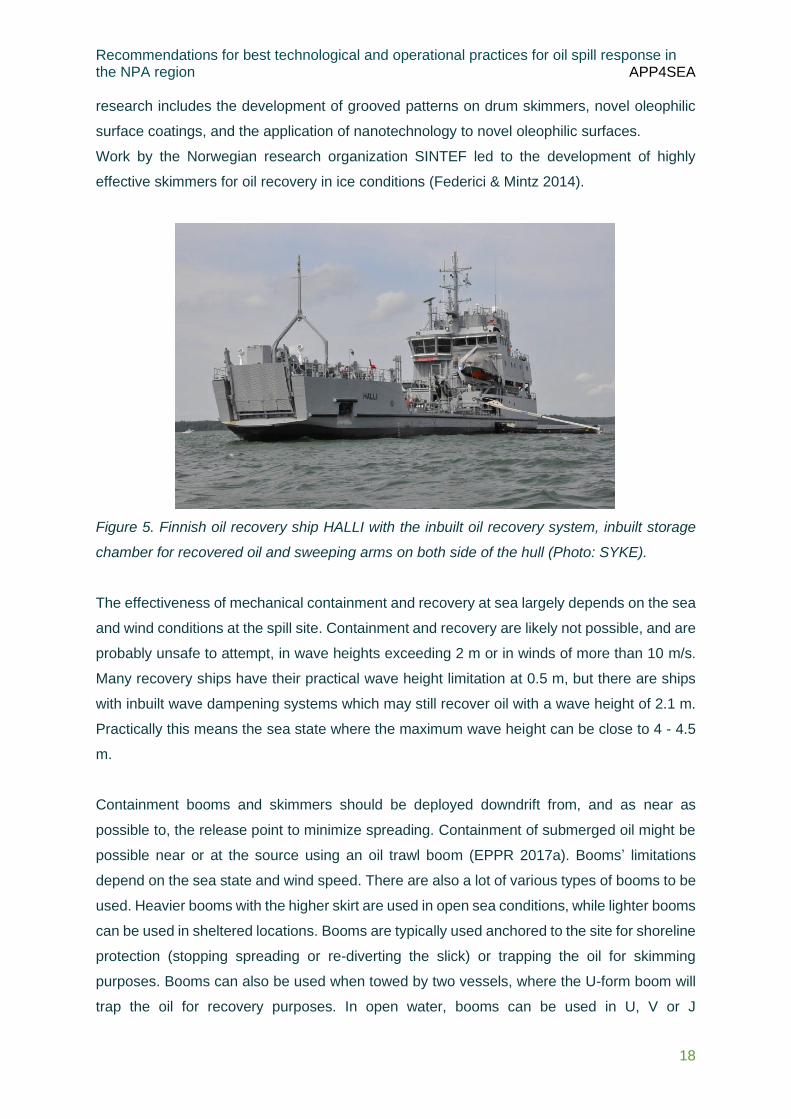
Work by the Norwegian research organization SINTEF led to the development of highly
effective skimmers for oil recovery in ice conditions (Federici & Mintz 2014).
Figure 5. Finnish oil recovery ship HALLI with the inbuilt oil recovery system, inbuilt storage
chamber for recovered oil and sweeping arms on both side of the hull (Photo: SYKE).
The effectiveness of mechanical containment and recovery at sea largely depends on the sea
and wind conditions at the spill site. Containment and recovery are likely not possible, and are
probably unsafe to attempt, in wave heights exceeding 2 m or in winds of more than 10 m/s.
Many recovery ships have their practical wave height limitation at 0.5 m, but there are ships
with inbuilt wave dampening systems which may still recover oil with a wave height of 2.1 m.
Practically this means the sea state where the maximum wave height can be close to 4 - 4.5
m.
Containment booms and skimmers should be deployed downdrift from, and as near as
possible to, the release point to minimize spreading. Containment of submerged oil might be
possible near or at the source using an oil trawl boom (EPPR 2017a). Booms’ limitations
depend on the sea state and wind speed. There are also a lot of various types of booms to be
used. Heavier booms with the higher skirt are used in open sea conditions, while lighter booms
can be used in sheltered locations. Booms are typically used anchored to the site for shoreline
protection (stopping spreading or re-diverting the slick) or trapping the oil for skimming
purposes. Booms can also be used when towed by two vessels, where the U-form boom will
trap the oil for recovery purposes. In open water, booms can be used in U, V or J

Recommendations for best technological and operational practices for oil spill response in the NPA region APP4SEA
19
configurations. Interception of free-floating, thin slicks is not as effective as containment and
removal of oil at source.
Skimmers are typically used to recover oil from the boomed area, or an opening is left to the
top of the U-form boom from where the recovery ship will take the oil into her storage tanks.
Storage options include barges, towable tanks, tankers and/or other means that are
appropriate for the type and volume of oil being recovered. For Arctic incidents in remote
locations, the lack of storage and disposal options can quickly become a serious impediment
to the success of continuous mechanical oil recovery (EPPR 2017a).
Short period breaking waves decrease significantly the effectiveness of the countermeasure
– larger parts of the oil will be mixed to the upper water column, thus reducing the mechanical
containment and recovery, ISB or the use of dispersants.
At present, the only viable countermeasure to deal with oil layers trapped beneath or within
the ice involves waiting for the oil to surface in spring melt. Monitoring the spill in the interim
may be the only practical option (EPPR 2017a). In river conditions, however, open ice slots
can be sawn through the ice, and oil moving with the current will carry oil into these slots. In
Finland, special saw machines have been constructed to saw slots to the ice. The initial
purpose of sawing slots is to more easily allow the ice break up in the rivers in the spring-time
and to avoid ice jams causing local flooding problems. Ice slots with containment barriers or
fabrics can be used if the river flow velocity exceeds the initial threshold velocity of oil under
ice.
Ship propulsion, especially with the azimuth type of propulsion system can also be used to
sweep oil under ice flows to the surface further to be recovered by mechanical means or
dispersed by ship’s spraying system.
Ice creates many problems for mechanical recovery, and depending on the ice form
encountered, the main problems can be summarized as:
- limited access to oil: ice slush or small ice cubicles may block the system’s input
channels or belts;
- reduced oil flow to the skimmer: the mixture of oil and ice bristles will decrease the
total oil pick up ratio. The water/ice content of the recovery tank will be significant;

Recommendations for best technological and operational practices for oil spill response in the NPA region APP4SEA
20
- icing/freezing/jamming of equipment: moving parts of the system will be stopped due
to the freezing. Pumps and hoses will be blocked by the high viscosity oil. Ice and possible
debris will boost the formation of blockages;
- separation of oil from ice is difficult: excess hot water or steam is required, causing the
water (oil pick up ratio will be higher);
- oiling/cleaning of ice: part of the oil is touched by ice blocks and will remain in the sea.
Some modern ice brush skimmers can be used to loosen and recover oil from the surfaces of
the ice blocks;
- deflection of oil together with ice: ice and slush will form a kind of barrier between the
skimmer and oil to be recovered;
- strength and durability considerations: special high durable steels, and materials
tested in cold environment need to be used here;
- detection, monitoring of slick: detection of oil among ice or under ice is difficult.
Figure 6. A brush type bucket skimmer designed for oil recovery among ice. (Photo: SYKE)

Recommendations for best technological and operational practices for oil spill response in the NPA region APP4SEA
21
Figure 7. Robust large-scale ice brushes onboard oil recovery vessel LOUHI during the Oulu
Ice Trial in 2016. These ice brushes have been designed for oil recovery in ice. (photo:
SYKE)

Recommendations for best technological and operational practices for oil spill response in the NPA region APP4SEA
22
In-Situ Burning
Oil recovery methods adapted for the Arctic should be simple, low tech, and at the same time
also efficient. One of the methods best suited for the Arctic is in-situ burning (ISB), which can
be very efficient (> 90 %), with limited logistic demands (Buist 1999, Buist et al 2013). Fresh
oil slicks can be initiated very quickly by igniting the oil with devices as simple as an oil-soaked
sorbent pad.
In ice conditions, the ice itself often provides natural containment of spilled oil, keeping it thick
and slowing weathering processes for extended periods of time, thus allowing oil burning
operations to proceed with only helicopters and igniters (Buist et al. 2013). ISB is recognized
as a viable alternative for cleaning up oil spills on land and water. It can rapidly reduce the
volume of spilled oil and eliminate the need to collect, store, transport, and dispose of
recovered oil, and can also shorten the response time to a spill, thus reducing the chances
that the spill will spread on the water surface or further into land. However, some precautionary
measures are necessary, since there are also a few drawbacks with ISB, such as the smoke
production and risk of secondary fires (Fritt-Rasmussen 2010).
ISB is one of the countermeasures available for responding to oil spills in marine but also in
ice and snow conditions. Actually, ISB in oil spill response has been utilized since the 1960s
and it is the oldest response method. ISB involves the controlled burning of oil that has spilled
from a vessel or a facility, at the location of the spill. The main purpose is to reduce the amount
of oil beaching and the burning rate of thick (1 cm or more), large (3 m diameter or more)
slicks of relatively fresh oil has been measured to be in the range of 3 mm/minute (Buist et al.
2013). When conducted properly, ISB significantly reduces the amount of oil on the water and
minimizes the adverse effect of the oil on the environment. Recently, many very extended and
detailed studies have been published about ISB in different ice conditions and the applicability
of this method in Arctic conditions (e.g. Buist et al. 2013, Federici & Mintz 2014, Fritt-
Rasmussen and Petrich 2017, Fingas 2018).
The three factors with the highest influence on the efficiency of ISB are: (1) slick thickness, (2)
oil properties (flash point, volatility, API Gravity) and (3) emulsification of oil. Oil slick thickness
is the most important factor concerning the success of ISB. Slick thickness should be at least
2–3 mm in order to support burning. Of course, a slick thickness can be maintained by using
fire-resistant booms. The oil slick should have a thickness of at least 1 mm to allow the oil to

Recommendations for best technological and operational practices for oil spill response in the NPA region APP4SEA
23
ignite properly and to achieve a reasonable result. If the slick thickness is less than 1 mm, ISB
is no longer profitable (Nordvik et al 2003, Fingas 2011).
Slicks, once ignited, will burn until the thickness of the underlying oil reaches about 1 mm. The
oil removal efficiency is thus proportional to the thickness of the slick at ignition (Buist et al.
2013). The oil slick must be thick enough to insulate itself from the underlying water: > 2 to 3
mm for weathered crude oils and lighter fuel oils; > 5 mm for light (30% water) emulsions; and
> 10 mm for residual fuel oils. Once ignition takes place, sustained burning of the slick requires
that sufficient heat be radiated to the slick to maintain the slick at temperatures above the oil's
fire point (Buist et al. 2013). Very dense or highly emulsified oil requires a thicker slick (3-10
mm) for the burning (Nordvik et al. 2003).
It is the vapours that burns, not oil, so when igniting a liquid fuel it must be converted to the
gaseous form and mixed with air to allow for ignition (Buist 2003). A fuel/oil with a high vapour
pressure usually indicates a liquid that easily forms ignitable vapours. The minimum
temperature where the vapour/air mixture can ignite is called the flashpoint. The flashpoint
increases with increased weathering of the oil, but of course the burning is self-sustained
giving a rise in temperature of the fuel to the fire point, which is the lowest liquid temperature
where the evaporation rate is sufficient to create flammable vapour-air mixtures (Nordvik et al.
2003).
After the formation of the emulsion, it is difficult to ignite and burn the oil, but by increasing the
thickness of the oil, this is possible even if the oil is already well emulsified. If the emulsion
has not formed yet, an ignition is possible for any oil with an oil thickness of 2-3 mm, regardless
of other properties of the oil (Federici & Mintz 2014). Experimental burns with certain oils
emulsified with 50% water or more have shown that effective ISB may be feasible. On the
other hand, other oils with as little as 10-20% water have been extremely difficult to ignite with
conventional ignition systems. It should be assumed that any oil that has become emulsified
to levels of 25% water or more will be difficult to ignite; any oil emulsified to levels in excess
of 50% water should be assumed to be unignitable (Buist et al. 2013). Most oil is suitable for
ISB but one important exception is very light, refined oil products like gasoline, butane and
propane, for which burning poses a safety risk. Oils or chemicals with a flammability point
under 37.8°C and vapor pressure under 40 psi should be excluded from ISB (Nordvik et al.
2003). Oils with API gravity of at least 20° will probably burn with high efficiency. In order to
burn spilled oil, three elements must be present: fuel, oxygen and a source of ignition. The oil
must be heated to a temperature at which sufficient hydrocarbons are vaporized to support
combustion in the air above the slick (Fingas 2011).

Recommendations for best technological and operational practices for oil spill response in the NPA region APP4SEA
24
When less than 30% ice is present, the oil will spread out and the thickness of the slick will
reach the minimum required thickness rapidly. Then use of fire-resistant booms will prevent
the oil slick from spreading and secure a sufficient oil slick thickness. Using fire-resistant
booms to gather the oil for ISB requires less equipment than does collecting the oil for skimmer
use (Fingas et al. 1999). The material used varies a lot, and some are manufactured from
steel, fire-resistant fabrics and others employing active water cooling (Buist 2000). Also so-
called chemical herders can be used to improve the efficiency of ISB. These herder chemicals
can be used to gather oil to thicker slicks and it has been shown that they increase the
efficiency of ISB in large scale experiments made in tanks as well as in field experiments (Buist
et al. 2011a; Buist et al. 2011b). The herding agents work by reducing the surface tension of
the surrounding water significantly. When this monolayer of surfactants reaches the thin oil
slick, the balance between interfacial forces acting on the slick is changed and the oil is
contracted into thicker layers (Buist et al., 2010). Unlike in wind herding, herding agents do
not need a boundary to work against and can work well in open waters (Buist et al., 2010).
There is a limited window of opportunity for using ISB and this window is defined by the time
it takes the oil slick to emulsify. While most oils are suitable for removal by ISB, there is a
limited timeframe after the initial spill in which ISB will be effective. As oil weathers over time,
it becomes emulsified with water, and suffers evaporative losses of its volatile compounds.
Both emulsification and evaporative loss increase with time and decrease the efficiency of
ISB.
The window of opportunity for ISB is a function of oil weathering. ISB was estimated to be a
viable response option for up to 72 hours after a spill, depending on the type of oil (heavy oils
will have a shorter window of opportunity). For light and medium crude oils, ISB could be
performed for 40–60 hours after a spill. For heavy crude oil, however, ISB became almost
completely ineffective after just 1–2 hours because of the profound effect of oil weathering on
burning efficiency (Nordvik 1995).

Recommendations for best technological and operational practices for oil spill response in the NPA region APP4SEA
25
Figure 8. Principle of the in-situ burning in broken ice (Joint Industry Project,
www.arcticresponsetechnology. ).
In ice conditions, the window of opportunity is greatly extended compared with open water
conditions. Ice cover was found to reduce oil weathering, allowing a longer time window for
ISB (Fritt-Rasmussen et al. 2012; Fritt-Rasmussen and Brandvik 2011). Of course, conditions
are much more complicated in the case of oil spills in ice and oil distribution in different ice
conditions may vary a lot (reviewed in e.g. Fritt-Rasmussen 2010; Buist et al. 2013; Fritt-
Rasmussen and Petrich 2017).
Usually ISB has been tested in static pack ice conditions while only a few tests have been
performed in dynamic ice conditions, indicating that ISB can be sensitive to movements, ice
coverage, oil thickness and presence or absence of frazil ice. Burning of oil in broken ice
during break-up will be easier than during freeze-up. Oil spilled in dense pack ice will drift with
the ice. It has also been shown that the interface between ice and oil is more efficient at
transferring heat from the oil to the underlying ice than water.

Recommendations for best technological and operational practices for oil spill response in the NPA region APP4SEA
26
Figure 9. Burning of oil in a melt pool (Source: D Dickins; in Buist I.A et al. 2013).
Data on ISB efficiency in moving ice is scarce, while data and lessons learned in more stable
ice conditions can be found. The older tests have showed some of the following lessons
learned (Rasmussen, J.F. & Norut, C.P. 2017):
- burning oil in solid ice – tests showed a reduction rate between 1-3 mm/min
depending on the test case. Burning efficiencies varied, but reached in some tests 85-96%!
Tests conducted for emulsified crude oils, however, showed smaller reduction rates.
- burning oil in broken ice/pack ice – there is a variety of test results available made
both in laboratory and in field environments. Results show a success rate between 30-90%
depending on the test arrangements. The minimum slick thickness obtained for the ISB has
been 2.5 mm on cold water. High emulsified oils have also been noted to inhibit the burning,
and lower temperatures also to reduce the burning rate. Some of the newer test results,
however, indicated also that emulsified oils can be ignited and burned if the correct igniter is
used. Brash ice was shown to reduce the burning, and more wind resulted often in a higher
regression rate. The field ISB tests in broken ice have generally showed that the ice coverage
is of high importance for burning oil in broken ice. With 60-70% to 90% ice cover, the ice will
act as natural containment. Up to 30% of the oil will spread as in open water. In between those
ranges, the conditions are difficult as the oil can spread to an extent that will make additional
containment necessary but not possible.
- burning oil in snow – oil can be burned in snow with great success. Tests have shown
even more than 90% reduction can be achieved if the contaminated place can be handled

Recommendations for best technological and operational practices for oil spill response in the NPA region APP4SEA
27
properly. It has also been noted that very low concentrations of oil can be ignited with some
additional fuel.
- burning oil in ice cavities – There are a number of recent studies looking at the ISB
of oil in ice cavities reported in Fritt-Rasmussen, J. & Norut, C.P. (2017). Tests have been
carried out in small-scale laboratory experiments and in large-scale field experiments.
Generally, if the oil is trapped in small cavities in the ice, the surrounding ice decreases the
burning by the ice walls that act as a significant heat sink. Particularly for small cavities, these
losses are considerable lateral heat loss. Small-scale studies emphasized that the cavities
must have a diameter larger than 4.5 cm; otherwise the heat losses to the surroundings are
too high to sustain continuous burning. In the large-scale experiments, significant reduction of
oil was noted, and in some tests the reduction rate was close to 85%, corresponding close to
2.5 mm/s of oil regression rate.
It was noted that the heat flux from the flames melts the ice and increases the cavity diameter,
hence the larger burning surface of the oil leads to increased mass loss rate. The impact of
the wall is, however, found to decrease with an increasing diameter of the hole. A strong
coupling between mass loss rate and geometrical changes were thus found (Farahani, H. F.
et al. 2015).
It has been demonstrated that higher slick thicknesses are needed to burn oil on ice compared
to burning oil on water (reviewed in Fritt-Rasmussen 2010; Buist et al. 2013; Fritt-Rasmussen
and Petrich 2017). Both the burning rate and the burning efficiency are also lower for burning
oil in ice than on water (Buist and Dickins, 2003). On the other hand, for spills under ice during
freeze-up or in winter, the oil can remain burnable for many months until it appears on the ice
surface the following spring. Spills in close pack ice will be ignitable for days longer than the
equivalent spill in open water. Spills in loose drift ice will likely have a window of opportunity
for burning similar to open water conditions (Buist et al. 2013). Burning oil in ice is a standard
method for dealing with oil in ice. The natural containment of ice can serve to thicken oil
sufficiently for ignition and burning to take place.
ISB was one of the main subjects studied in the Horizon 2020 project GRACE
(https://www.grace-oil-project.eu/en-US). This project compiled the lessons learned of past
studies and also demonstrated the use of the ISB in the field tests arranged in Greenland.
ISB of oil has been shown to be of high efficiency in controlled field experiments with high ice
concentration. Initial field studies from the 1970s and 1980s proved that ignition of crude oil
released during melting from land fast ice can be highly effective. These tests also showed

Recommendations for best technological and operational practices for oil spill response in the NPA region APP4SEA
28
that the effective burning and especially the ignition of the oil has a relatively short window of
opportunity for the successful reduction of the oil. Most older tests were also conducted as
small-scale laboratory tests or in relatively small meso-scale field tests. One of the past large-
scale ISB operations were made during the Deepwater Horizon accident in the Gulf of Mexico,
where large amounts of oil were burned in more than 400 burns (Mabile, N. 2012).
Table 2. Summary of experiments and operational experience with ISB of different types in
various sea conditions (Buist et al. 2013).

Recommendations for best technological and operational practices for oil spill response in the NPA region APP4SEA
29
Figure 10. Map showing experimental ISB locations, taken from Buist et al (2013).

Recommendations for best technological and operational practices for oil spill response in the NPA region APP4SEA
30
Dispersants
Chemical dispersants enhance natural dispersion by reducing the surface tension at the
oil/water interface, making it easier for waves to create small oil droplets that remain in
suspension for long periods and are rapidly diluted in the water column. The main reason to
use dispersants is to reduce the amount of oil drifting to shorelines in the case of a very large
oil spill. In addition, the aim is to reduce the exposure of birds and mammals to oil on the water
surface (e.g. Prince 2015). Furthermore, it has been thought that the use of dispersants may
increase the biodegradation of oil in the water column (e.g. Brakstad et al. 2017). In addition,
the use of dispersants may decrease evaporation of volatile organic compounds (VOC) when
there is less surface oil (Curd 2011). The effectiveness of the method is a very important issue
for its rational use. It has varied in laboratory conditions between 5-35%, while in large-scale
tank tests the efficiency of dispersants has been great, ranging at their best from 82 to 99%
even in cold conditions (Fingas 2008, Belore, et al. 2009). However, the opposite research
results occur where the efficiency has fallen to a low level (e.g. Lewis and Daling 2007).
Dispersants’ ability to increase biodegradation of oil still needs to be tested, as some studies
show that dispersants reduce biodegradation while other studies show that dispersants have
very little effect on biodegradation (Fingas 2008). It has also been shown that many of the
commercial dispersants may have lower effectiveness in waters like the Baltic Sea with low
salinity, but these problems can be avoided by modifying the dispersants to be more suitable
in these conditions (Lewis and Daling 2007).
It has been shown that dispersants can be effective even in ice-covered waters, but of course
the energy of breaking waves has a positive effect on the effectiveness of dispersants.
Chemical treatments are most effective during the first few hours after the oil spill. Oil viscosity
is a reasonable indicator of the effectiveness of chemical dispersion. Oils are most dispersible
when their viscosity is low (less than 2,000 cSt), and they become undispersible when their
viscosity is high (Federici and Mintz 2014). Actually, most oils remain dispersible until they are
cooled well below their “pour point” i.e. the temperature at which the oil behaves like a
semisolid. The pour point for many Arctic crude oils is well below the freezing point of
seawater. The increase in viscosity related to cold temperatures in the Arctic is not nearly as
severe as the rapid increase in viscosity of oil affected by evaporation and emulsification
processes in open water (JIP 2017). In addition, research has shown that the motion and
interaction of broken ice pieces actually enhances the dispersion process by providing surface
turbulence at higher levels than would occur naturally with non-breaking waves in open water

Recommendations for best technological and operational practices for oil spill response in the NPA region APP4SEA
31
(Owens and Belore 2004). It seems that cold temperatures do not much affect the
dispersibility of oils or their potential for biodegradation by indigenous microorganisms (JIP
2017). Many large-scale tank and basin tests as well as field experiments have shown that
cold temperatures do not reduce the dispersibility of many oils or the activity of the dispersant
(Brandvik et al. 1995; Brown and Goodman 1996; Owens and Belore 2004). The effectiveness
of the dispersants has been at their best between 82-99% in cold water conditions and
dispersants can be effective in partly ice-covered waters (Fingas 2008; Belore et al. 2009). As
stated also in EPPR (2017a) dispersants are effective in a wide range of ice conditions and
actually the slower oil weathering processes in the presence of ice can expand the window of
opportunity for dispersant application. As energy levels in the upper water column tend to
diminish in very high ice concentrations (>60%) supplemental mixing energy may however be
required. Dispersants are not applicable in solid ice; however, they have been tested
successfully with oil between floes in high ice concentrations (70 to 80%). CRRC (2017) stated
in their review that there are many open questions still; for example, while some of the major
environmental factors affecting dispersant effectiveness have been well studied, the
influences of other variables have not. For example, the general trends for low salinity and
hyper-saline waters and oils with viscosities above 2000 centipoise are less well known.
Furthermore, the degree of dispersion effectiveness for non-Corexit dispersants over a broad
range of oils and environmental conditions has been less studied and therefore is uncertain
(CRRC 2017).
For spreading dispersants, vessels with spray arms can be utilized, and helicopter spray
buckets can cover small areas or, if broader area coverage is required, fixed-wing aircraft can
be utilized (EPPR 2017b). Aerial application of dispersants is a response strategy commonly
used in many areas of the world. This tool has applications for incidents during the Arctic
summer open water period and during periods of open drift ice in non-freezing temperatures.
Basically, the dispersion of the oil at near freezing temperature occurs as long as the oil
remains fluid. Furthermore, a new controllable applicator arm was developed to deliver
dispersant more effectively to isolated oil pockets in the ice (Daling et al. 2010). Of course, the
low winter temperatures, the long periods of darkness during the winter, the long distance as
well as the presence of ice pose challenges to the operational use of dispersants. For
dispersant application, cold can impede proper spray and dosing of different dispersant
products. If there is not enough mixing energy, dispersion may not be effective (EPPR 2017b).
The shearing, caused by the motion of small pieces of ice in non-breaking waves, may
enhance dispersion by providing additional near surface mixing energy that would otherwise
not be present in the absence of ice (Owens & Belore 2004). Prop wash provides additional
energy to enable dispersion of dispersant-treated oil in ice-free, ice-infested, and full ice cover
Recommendations for best technological and operational practices for oil spill response in the NPA region APP4SEA
32
waters (broken by an ice breaker) when available mixing energy is insufficient. The
advantages of using azimuthal stern drive (ASD) ice-capable vessels or jet drives from small
support boats to add mechanical mixing energy to support oil dispersion were well known from
basin tests (Daling et al. 2010).
In the case of subsea application, it is important to notice that subsea conditions in Arctic are
the same as elsewhere. For example, water temperatures at depth in the Gulf of Mexico
approach temperatures in the lower water column in the Arctic within a few degrees. However,
NRC (2014) concluded that more work was needed to understand the effectiveness, systems
design, and short- and long-term impacts of subsea dispersant delivery in Arctic waters (NRC,
2014).
Debate about toxicity
Nowadays the major active components in oil dispersants are surfactants. Surfactants are
surface-active agents which possess both hydrophilic and hydrophobic properties causing
dispersants to be both water and oil compatible. When oil slick is disturbed e.g. by waves, the
surfactants form a film at the water-oil boundary and the oil is dispersed as smaller droplets
and surfactants prevents the oil recombining back to oil slick (Hemmer et al. 2011). Some
studies have shown that oil-degrading microbes may colonize the droplets within a few days.
There are also studies showing that dispersants themselves are less toxic than both naturally
dispersed and dispersant-treated oil (NRC 2005). Also, laboratory experiments have
demonstrated that indigenous Arctic microorganisms effectively degraded both fresh and
weathered oil regardless of whether it was dispersed naturally or with the addition of
dispersants (McFarlin et al. 2014). NRC (2014) concluded that naturally available levels of
nutrients and oxygen could sustain effective microbial degradation, in Arctic as well as
temperate waters. So at least in theory, when the oil breaks into small droplets the surface-to-
volume ratio of the oil increases making them more vulnerable to hydrocarbon degrading
bacteria which can degrade oil at the water-oil interface (Hamdan & Fulmer 2011).
However, the effect of dispersants on biodegradation is still a matter of dispute. Some papers
state that dispersants inhibit biodegradation others indicate that dispersants have little effect
on biodegradation (Fingas 2008). Xia et al. (2009) demonstrated, however, that dispersants
had positive influence on biodegradation of oil. The biodegration was most efficient when oil
dispersants were at a 2:10 ratio, followed by 3:10, 1:10 and 4:10. The test also showed that
the biodegration had the highest effect in high temperatures and in waters having high
salinities (33 ppt) (Xia et al. 2009). Also, a study by Brakstad et al. (2017) showed that a
Recommendations for best technological and operational practices for oil spill response in the NPA region APP4SEA
33
common oil spill dispersant did not inhibit biodegradation of oil at dispersant concentrations
relevant for response operations. In contrast, however, some papers stated that inhibition is a
matter of the surfactant in the dispersant itself and the factors of environmental conditions. It
is clear on the basis of current literature that the surfactants in some of the current dispersant
formulations can inhibit biodegradation (Fingas 2008). The study of Hamdan & Fulmer (2011)
showed that even if dispersants may enhance the availability of hydrocarbons to biodegrading
bacteria, the dispersant also kill those bacteria causing negative biodegradation results.
The LC50 values of dispersants used in the early 1970s ranged from about 5 to 50 mg/L to
the rainbow trout in 96-hour exposures. In contrast, LC50 values for dispersants commercially
available today vary from 200 to 500 mg/L and contain a mixture of surfactants and less toxic
solvents. The results of dispersant toxicity testing show that dispersants vary in their toxicity
to various species, but dispersant toxicity is less than the toxicity of dispersed oil. Of the recent
toxicity studies of dispersed oil, some researchers found that chemically-dispersed oil was
more toxic than physically-dispersed oil. Most of these found that the cause for this was the
increased PAHs, typically about 5 to 10 times, in the water column. Others noted the increased
amount of total oil in the water column. Some noted the damage to fish gills caused by the
increased number of droplets. A few researchers noted that the toxicity of chemically-
dispersed oil was roughly equivalent to physically-dispersed oil (Fingas 2008).
Wise & Wise (2011) did a large review concerning the ecotoxicity of oil dispersants. They
surveyed 38 peer-reviewed articles concerning the toxicity of 35 different chemical
dispersants. It was notable that most studies examined only the lethality of the dispersants.
However, also nonlethal end points were studied including predator/prey recognition, enzyme
activity changes and success of hatchability. The animals studied included Daphnia (small
planktonic crustaceans), anemones, corals, crustaceans, starfish, mollusks, fish, birds, and
rats. Studies in birds and mammals are noticeably lacking. The variety of chemical
dispersants, the variability in test methods, and the lack of distinct species overlap between
studies make it difficult to compare and deduce which dispersant is most toxic and which is
least.
One of the most reliable studies was conducted by The United States Environmental
Protection Agency (EPA) and they used altogether eight of the dispersants they allow to be
used commercially. The tests studied the toxicity of dispersants alone, dispersants with oil,
and oil alone. The toxicity tests were carried out on the minnow Menidia beryllina (96-hour
test) and the crustacean Mysidopsis bahia (48-hour test) and also with human cell lines.
According to their tests, dispersants had no significant estrogenic or androgenic activity in

Recommendations for best technological and operational practices for oil spill response in the NPA region APP4SEA
34
human cell line assays. Cytotoxicity was only observed at concentrations above 10 ppm. The
results of the ecotoxicity tests showed low toxicity of all 8 dispersants (3 to >5000 ppm).
Lousiana Crude oil toxicity was 4.4 mg/L LC50 for mysid and 2.9 mg/L Menidia. When
dispersants and crude oil were mixed, then LC50s varied between 0.4 and 13.1 mg/L and
these mixtures classified as slightly to highly toxic. With mysid it was observed that oil alone
had similar toxicity when compared to dispersant-oil mixtures. All 8 dispersants alone were
less toxic than dispersant-oil mixtures (Hemmer et al. 2010).
The JIP (2014) made a literature review and based on their findings the existing laboratory
data, experimental field studies and monitoring following actual spills show that dispersed oil
may potentially cause environmental impacts but only to organisms in the vicinity of dispersed
oil and/or in cases when the rate of dilution of the dispersed oil plume is slow (e.g. sensitive
areas close to shore). Even though the impact exists, the sessile organisms would most
probably be impacted. The toxicity of oil/dispersant mixtures is related to the oil in the mixture
and not the dispersant. There is no evidence that Arctic species are more or less sensitive
than other temperate climate species that have been tested with dispersed oil. Prince (2015)
concluded that the potential environmental costs of adding these chemicals to a polluted area
are likely outweighed by the much shorter residence time, and hence integrated environmental
impact, of the spilled oil in the environment.
A thorough state-of-the-art report reviewing ecotoxicity of dispersant and dispersed oil was
made by Coastal Response Research Center (CRRC 2018) summarizing the very complex
issue as follows: Environmental conditions in the Arctic (e.g., low temperatures, extreme light
cycles, sea ice) may affect the behavior, distribution, and fate of spilled oil, dispersant, and
dispersed oil, the extent to which marine biota are exposed to oil and to dispersants, and the
effects of those exposures. Based on this very extensive study, dispersants change exposures
to oil in several ways, e.g. the amount of oil in water and water surface, droplet size and
fraction of dissolved oil as well as the array and relative concentrations of petroleum
hydrocarbons that are bioavailable to aquatic species. The CRRC (2018) report stated that
there are actual differences between the physiology of Arctic and temperate species. The
limited numbers of studies on Arctic species show that they respond similarly to temperate
species when exposed to toxicants. Data about oil and dispersed oil toxicity to Arctic species
is limited which leads to uncertainty in predicting impacts, particularly because of the shifting
baseline due to changes in Arctic environments. Compared to more temperate regions, the
unique ecosystems and aspects of biology/aggregation due to time of year and life history in
the Arctic create uncertainty in assessments related to dispersed and undispersed oil.

Recommendations for best technological and operational practices for oil spill response in the NPA region APP4SEA
35
Economic discussion
Tegeback and Hasselström (2012) estimated in their study that if 10,000 tons of oil
contaminated a coastline of the Baltic Sea, the costs would be 100–400 million euros including
direct (e.g. clean-up), market (e.g. tourism and fisheries industry) and non-market costs (i.e.
environmental and other impacts that are not easily measured in a market). Similarly, Halonen
(2007) stated that in the case of a spill of 30,000 tons of oil, the estimated costs of clean-up
could reach 1.5 billion euros. According to ITOPF (2012), the most expensive oil spill in history
is the EXXON VALDEZ (Alaska, 1989). Clean-up alone cost approximately 2.5 billion USD
and total costs (including fines, penalties and claims settlements) have been estimated to be
as much as 7 billion USD.
The only source in which the costs of different recovery methods are compared seems to be
Etkins (2000). The use of dispersants is the cheapest method and the cost reduction is due to
the lower labour costs, i.e. fewer personnel for a shorter period of time and even lower overall
equipment costs that are required with dispersant application compared to mechanical
containment and recovery operations.
Etkins (2000) showed the analysis of clean-up costs from 97 spills in the oil spill intelligence
report (OSIR). This analysis showed that clean-up responses in which dispersants were the
only or primary method were less expensive than spills involving other response measures.
The costs of use of dispersants only were almost 6-fold cheaper than if only other methods
were used, and 6.5-fold cheaper if dispersants were used as a secondary or tertiary method.
When comparing dispersants only to the cases where dispersants were used as the primary
method, the costs did not differ markedly. One of the reasons for limited costs when
dispersants are used is the mitigation of shoreline impact, which reduces the need of
expensive shoreline clean-up.
Allen & Ferek (1993) reported field effectiveness of different recovery methods at their best
and claimed that ISB had best field effectiveness (90-98%), followed by dispersants (80-90%)
and mechanical recovery (10-20%). Natural remediation also has high effectiveness, up to
90%, but of course it takes a long time and has a tremendous environmental impact. The
actual effectiveness of any clean-up methodology depends, of course, on the actual
application methods, the individual circumstances of the spill (location, oil type, amount of oil),
and unpredictable variables such as weather.

Recommendations for best technological and operational practices for oil spill response in the NPA region APP4SEA
36
The Deepwater Horizon oil spill released an estimated 4.9 million barrels of Lousiana sweet
crude oil into the Gulf of Mexico. Of the quantities of oil removed from surface waters, 17%
were from the direct capture of oil from well head, 3% from the skimming of oil from the surface,
5% from booming and burning and 8% using dispersants (Hemmer et al. 2011).

Recommendations for best technological and operational practices for oil spill response in the NPA region APP4SEA
37
Bioremediation and
natural attenuation In addition to active recovery methods, there are also passive option, i.e. natural attenuation
or bioremediation. In case of the Exxon Valdez spill in Prince William Sound, Alaska, and the
Deepwater Horizon oil spill in the Gulf of Mexico, only 15 to 25% of the oil was effectively
removed by mechanical methods. Despite numerous clean-up efforts, including mechanical
recovery and ISB, bacteria in the water carried out the bulk of the clean-up operation
(Vergeynst et al. 2018). In the case of the Deepwater Horizon incident in 2010, ca. 780,000
m3 of light crude oil were released into the marine environment from the seabed. It has been
found that the oil dispersed in the water column was degraded by naturally occurring
microorganisms in deep water (1,000 m) at temperatures of 4-5°C, which are not far from
Arctic sea temperatures. In the case of the tanker Exxon Valdez, the biodegradation was
enhanced by adding nutrients to the spilled oil. Despite intensive oil combat and clean-up, a
portion of the spilled oil was buried in the shoreline sediment and oil is still being released
from some pockets 25 years after the incident (Wegeberg et al. 2018).
In the case of an acute oil spill, decisions on which methods to use for combating the oil spill
must be taken, and the choice of oil spill response technique(s) should be carefully balanced
with the presence of marine organisms in the sea and on the sea surface in a Net
Environmental Benefit Analysis (NEBA) (Wegeberg et al. 2018). A NEBA is a process that
formalizes the evaluation and comparison of the expected response effectiveness versus the
potential environmental impacts of the oil spill, as well as impacts from response options
(Camus and Smit 2018). Knowledge of the biology and ecology of the specific region is key
to the application of a NEBA in a meaningful manner. The output from the NEBA process is
the selection of response technique(s) that minimize the overall impacts of a potential spill
on the environment, and promote the most rapid and effective recovery as well as
restoration of the affected area (IPIECA-IOGP 2015). A NEBA provides a protocol for
weighing the advantages and disadvantages of various spill responses with regard to flora
and fauna and their habitats within the specific area of concern, compared with no response
(Camus and Smit 2018).

Recommendations for best technological and operational practices for oil spill response in the NPA region APP4SEA
38
Bioremediation is natural biodegrading of spilled oil, which to a certain extent can be
accelerated through the addition of nutrients, oil-degrading bacteria, or both. Nutrient and
bacteria addition have been tested, and some positive effects have been observed. Many
compounds in crude oil are environmentally benign, but significant amounts are toxigenic or
mutagenic. The latter are the ones we are most interested in removing or destroying in an oil
spill. Bioremediation is a technology that provides an opportunity to convert the toxigenic
compounds to nontoxic products without further disruption to the local environment.
Generalizing based on two excellent and very detailed reviews (Vergeynst et al. 2018 and
Wegeberg et al. 2018) for biodegradation of oil in the marine environment, several factors
have to be met and there are certain limitations in Arctic conditions for this process. First, the
presence of a microbial organism capable of degrading the oil is required. The number of oil-
degrading bacteria constitutes only a fraction of the total number of bacteria in seawater.
Although the number of oil-degrading bacteria is low in pristine water, the number may
increase following an oil spill. The absence of specific oil-degrading bacteria may, however,
limit oil degradation in pristine Arctic waters. For biodegradation, sufficient nutrients are
needed. The Arctic is generally an environment with very low amounts of nutrients such as
nitrogen and phosphorus. These nutrients feed algae and bacteria in the water and without
them, the bacteria cannot grow. A microbial flora may be adapted to low temperatures, but
the general expectation is that low temperatures will lead to lower degradation rates. In cold
waters the oil is more viscous and this prevents it from being broken up into small droplets in
the sea. Biodegradation happens at the water-oil interface and oil-eating microbes can only
consume and breakdown oil when it is dispersed into small droplets. The speed of microbial
utilization of oil is primarily related to the amount of surface area exposed to aerobic
processes. Thick layers of oil, physically weathered oil, or oil isolated to less aerobic
environments undergo biodegradation more slowly than dispersed oil. During the Arctic
spring and summer, massive phytoplankton blooms occur and glaciers release suspended
mineral particles which will stick to the oil droplet and together sink to the seafloor. Microbial
degradation of oil on the seafloor occurs much slower than in the water column. Arctic
summers with all-day sunlight may help the microbes to break up oil molecules into smaller
pieces. However, it may also make the oil compounds more toxic for aquatic organisms.
The knowledge presently available regarding natural degradation of oil under Arctic
conditions shows a complex picture depending on oil type (light/heavy) and ambient
conditions: temperature, nutrients, time of year, and more. Wegeberg et al. (2018) stated
that PAH degraders were found and in very low densities from Arctic waters. It is highly likely
that also more complex PAH degraders occur naturally in Arctic seawater, but in extremely
low densities. On the other hand, the review of JIP (2014) stated that the microbial

Recommendations for best technological and operational practices for oil spill response in the NPA region APP4SEA
39
communities rapidly adapt to increasing abundance of hydrocarbon utilizers in all aquatic
environments that have been studied. Microbial communities in the Arctic are adapted to life
in this extreme environment and rapidly respond to carbon-rich but nitrogen-poor petroleum
resources. Even though many of the organisms are unique, there are also similar bacteria
known to respond to oil in other sea areas.
Nonetheless, it should be noted that bioremediation especially in ice conditions is a slow
process that very seldom, if ever, can be considered as the primary countermeasure. Most
likely, the most beneficial use of bioremediation is as a secondary combating method that
completes the recovery result after application of some other clean-up method. It should be
remembered that using natural attenuation or bioremediation as an option requires a long-
term and very active environmental monitoring program, so it is not really a passive, do-
nothing option.

Recommendations for best technological and operational practices for oil spill response in the NPA region APP4SEA
40
Some recent guidelines
COSRVA report
One of the most recent guidelines for the best practices and selection of the optimal oil spill
recovery means in the Arctic is the Circumpolar Oil Spill Viability Analyses (COSRVA),
prepared by the EPPR Working Group of the Arctic Council (EPPR 2017b). It gives estimates
for the percentage of time the environmental conditions may be favorable, marginal or not
favorable for a certain oil spill countermeasure selected. Generally, the open water season in
the Arctic offers more favorable conditions for OSR than in the winter. Also, conditions for
response are usually better in autumn than in spring The geographical coverage of the
COSRVA is shown below in Figure 11. It can be noted that the Northern Baltic Sea has been
excluded, but the area practically covers the North Atlantic, the Bering Sea, Barents Sea,
Norwegian Sea, Baffin Bay and the Hudson Bay. Thus, the AMAP map covers the area of the
intersecting national waters of Denmark (Faroe Islands), Canada, Greenland, Iceland,
Norway, Russia, and the United States.
Another valuable report on Arctic oil spill recovery is the “Guide to Oil Spill Response in Snow
and Ice Conditions in the Arctic” prepared by the EPPR Working Group (EPPR 2015). Practical
information on the tactics and usage of various response techniques is also given in an
updated version of the past Field Guide for Oil Spill Response in Arctic Waters (EPPR 2017a).
The environmental conditions and attributes to describe the metocean conditions are: wind
speed, wave height, air temperature, sea surface temperature, sea ice coverage, visibility
(horizontal) and daylight or darkness. The main response options handled in this analysis were
mechanical recovery, dispersants and ISB.
The general approach of the COSRVA report was to compare a set of metocean conditions
listed above for a given location to information about the limitations on oil spill response
systems. The limitations of the selected response options were identified against all selected
metocean attributes. Then these “combined data” sets were used for selected sea areas for
different time periods to determine whether conditions during that time would be favorable,
marginal, or not favorable for a response. The results of the COSRVA analyses in fact estimate
the percentage of time that environmental conditions may be suitable for a given
countermeasure, or not. The description of the methodology is given in EPPR (2017b).

Recommendations for best technological and operational practices for oil spill response in the NPA region APP4SEA
41
Figure 11. Study area of the COSRVA assessment based on the AMAPS’s definition for the
boundary (EPPR 2017b).
Table 3. Design conditions and parameters for viable response analyses (EPPR 2017b).
Gap analyses for COSRVA report
The viable response analyses do not include the overall operational picture or data on the
certain response tools available in the area. For example, if the conditions have been
analyzed to be favorable for a certain response tool, the lack of this equipment in the
response area is not included in the analysis. Also, the possible deployment time from the
depots or any transport time is not included, but need to be planned separately. The same

Recommendations for best technological and operational practices for oil spill response in the NPA region APP4SEA
42
holds for other resources supporting the operations like crew onboard, necessary service or
logistic solutions.
COSRVA uses a 25 x 25 km2 grid for the analyses, which may not be suitable for coastal
areas with a lot of shallow embankments, rocks, islands and curvy coastal lines. For a closer
look of certain restricted areas, other means are need for surveillance and final analyses for
the recovery options. For some restricted sheltered areas, the overall analyses may give a
false estimation as not favorable or marginal when in fact, due to the good shelter or micro
climate of the area under surveillance, the selected countermeasure would fit this area well.
Thus, a parallel to the COSRVA tool is needed to use all available surveillance means to get
a fresh situational awareness view of the target area. Satellite pictures and SAR images
taken from the surveillance air crafts are needed to ensure the proper tactics are used.
Novel drone concepts, especially the fixed wing aircrafts, have a long range and can be
used as support tools for the surveillance team trying to map the oil-infested area and to get
an idea of whether certain areas can be protected by booms, or certain recovery tools could
be directed to the focus areas.
In a remote area and over long distances, the local environmental conditions may vary a lot
from the original point made for decision up to the final environmental conditions when the
recovery tools have been transported to the site. Even if the COSRVA analyses estimate
that a certain main option would be favorable or not favorable, there could still be a window
of opportunity to use certain tools or tactics.
The response effectiveness of certain response tools may differ a lot from those given in the
literature or in the sales catalog. Most of the mechanical recovery tools have been tested in
laboratory conditions, and often the announced oil pick up ratios describe theoretical
maximum recovery capacities for a given system. Mechanical means have been used a long
time, and there is a certain understanding on their limitations for given wave and wind
conditions. Cold air temperatures, however, will often pose additional difficulties for the
systems. For example, some mechanical skimmers may still work well partly submerged in
the water, but the cold air may easily freeze the hoses or oil scraping systems which in turn
will block the work of the whole system. Cold temperatures may also move the oil from the
Newtonian fluid more toward a pseodoplastic type increasing the viscosity so much that
conventional pumping systems will no longer work without any additional heating by hot
water or steam. There are mechanical recovery systems available designed for the winter
conditions with modern heating systems for the key parts of the systems. However, if one

Recommendations for best technological and operational practices for oil spill response in the NPA region APP4SEA
43
component of these system would fail by freezing, usually it means the whole oil recovery
efficiency will remain practically close to zero.
The same holds for the use of dispersants. Even if the first ideas for the use of dispersants
are favorable, the sudden change of the air temperatures or wind velocities will endanger the
success. A water surface that is too calm will not produce enough energy for dispersants to
speed up the oil dispersion unless some energy ( ships’ wake or water cannons) can be
used. If the distance of the oil spill site is too far to be reached by ships with dispersant
spraying units, the use of aircrafts requires sufficient wave energy at the operation site.
The COSRVA analyses do not take into consideration the oil type and/or weathering for the
response effectiveness. They do give an estimation of the usefulness of certain response
methods in the area, but the final decision-making requires additional information about the
spreading, wave dynamics on the oil slick and oil type to understand if some of the main oil
alteration characteristics have taken the most favorable option out and if some other
alternative solution needs to be used.
The COSRVA analyses contain only three main response methods (with modifications,
altogether ten methods!), which may be limited in dealing with the real situation. The optimal
the response toolbox may have alternative methods and tactical innovations which are not
analyzed here, and may enable a better response when assessed in light of the specific
scenario.

Recommendations for best technological and operational practices for oil spill response in the NPA region APP4SEA
44
Figure 12. A comparison of the all response options; structural icing and daylight/darkness
impact not included. Colors: green – favorable, yellow - marginal, red – not favorable. EPPR
2017b.
Results - examples
The following Figures 13 and 14 represents the reporting for analyzed main
countermeasures, i.e. mechanical recovery, ISB or the use of dispersants.

Recommendations for best technological and operational practices for oil spill response in the NPA region APP4SEA
45
Figure 13. Annual percentage of time for conditions being favorable (green), marginal
(yellow) or not favorable (red). EPPR 2017b.

Recommendations for best technological and operational practices for oil spill response in the NPA region APP4SEA
46
Figure 14. An example of the COSRVA results for the Beaufort Sea. Similar figures gave been
published for all Arctic sea areas in EPPR 2017b.

Recommendations for best technological and operational practices for oil spill response in the NPA region APP4SEA
47
Some general observations can be made:
- the mechanical recovery systems are designed primarily for the open water conditions
and suitable also for the low ice concentration. Thus, their usage in mid-winter or in the High
Arctic is restricted, sk. not favorable;
- the single vessel in ice system is designed for much higher concentrations of ice. This
concept may then be usable when the open water concepts fail due to excessive ice. The new
Finnish type of heavy-duty ice brush systems may have potential also for heavier ice
conditions, but their oil pick up ratios have not been tested in real conditions yet. Small-scale
studies and laboratory tests have confirmed their potential;
- in the Arctic during the summer, a lot of areas are ice-free, which means the
mechanical response may be a good response option. However, wind and wave height limit
the use of additional booms, trawling systems and the oil pick up of the sweeping arms
(outriggers) of the vessels, thus reducing the theoretical value of the oil pick up ratio. Some
new recovery vessels with the inbuilt wave attenuation systems may still work in the sea state
of a wave height up to 2.1 m. Usually the booms and outrigger systems of the vessels will start
to reach their limits when the wave height exceeds 0.6 m or when the recovery speed exceeds
2 knots. It should be noted that the ice brushes of modern recovery vessels may also be used
in the open water: the bucket-type recovery brushes with the long arm can be used in the
same way as skimmers, jointly with booms to enrich the oil being recovered.
- visibility conditions may reduce the operational response of any of the selected
systems. Visibility conditions are typically worse in summer than in winter in the Arctic;
- the dispersant systems mounted onboard the vessels seem to have higher ice
tolerance than the concept with two vessels and the boom: the ice floes will easily fill the
boomed area and disturb the oil recovery operation;
- conditions for all dispersant systems studied seem to be favorable or at least marginal
in the summer period, while being not favorable in winter;
- wind and visibility conditions are not favorable for dispersant systems based on
aircrafts, while cold (icing) may significantly affect systems mounted onboard the vessels;
- for ISB, conditions are more likely to be favorable or marginal for the vessels with fire
booms than the other two options analyzed (chopper in ice conditions/chopper with herders);
- as with dispersants, ISB may be carried out with a vessel or an aircraft. For ISB /
helicopter with ice, ice coverage must be large enough to maintain the oil thickness for ignition;
- ISB with helicopters and herders would be viable at least some of the time year-round
at all locations except the High Arctic.

Recommendations for best technological and operational practices for oil spill response in the NPA region APP4SEA
48
When looking at the overall viability of all systems analyzed, all systems seem to meet the
conditions “not favourable” more than 50% of the time over the whole area, some of them over
75% of the time (EPPR 2017b). Figure 14 above gives a good idea of the general viability of
the systems analyzed.
General observations
The following general observations can be made:
Conditions were favorable at least 10% of the time for the following systems:
- Dispersant – Vessel Application (17%),
- Dispersant – Helicopter Application (16%),
- Mechanical Recovery – Two Vessels with Boom (13%), and
- Dispersant – Fixed-wing Application (12%).
Conditions were either favorable or marginal at least 25% of the time
(combined) for the following systems:
- Dispersant – Vessel Application (47%),
- Mechanical Recovery – Two Vessels with Boom (35%), and
- Mechanical Recovery – Single Vessel with Outrigger (25%)
Finally, conditions were found to be not favorable at least 90% of the time for:
- In-situ Burning – Helicopter with Ice Containment (94%),
- Mechanical Recovery – Three Vessels of Opportunity with Boom (92%),
- and
- In-situ Burning – Helicopter with Herder (90%)
Other guidelines
Currently there are two main guidelines available for oil spill response specifically for Arctic
conditions: The Field Guide Response in Arctic Waters (hereafter, “Field Guide”) was recently
updated (EPPR 2017a) and is mainly focused on supporting the response and operations.
The other guidebook, “Guide to Oil Spill Response in Snow and Ice Conditions” (EPPR 2015),
in turn focuses on planning and decision-making processes. The EPPR 2015 version has also

Recommendations for best technological and operational practices for oil spill response in the NPA region APP4SEA
49
later been published by the IMO (International Maritime Organization) in 2017 for more global
usage. This guidebook has generic, strategic ang global objectives and focuses on ice and
snow oiled from potential marine sources as well as ice and snow in the marine coastal
environment oiled from potential terrestrial sources. The key areas are planning, preparation,
response, and implementation.
The Field Guide contains updated material and is reorganized to remove repetitions found in
the first edition from 1998. It focuses on practical oil spill response strategies and tools for
application in open water, ice and snow conditions in remote areas during cold weather. It also
provides information relevant to the marine offshore and coastal environments, and to large
rivers and lakes where oil is transported and where spills pose a threat to the environment
and public health.
Some of the baseline lessons learned of these two guidebooks for the oil spill recovery in the
Arctic have also been reviewed and discussed in this report.
The extended Field Guide applies to any cold regions with ice and snow, not just the Arctic.
The Field Guide also has a large application range with oil types: they have been grouped into
three main categories to make the application easier. Globally there are many different crude
oil types, various refined oils and the behavior of all these oil types differ a lot. Here the oil
types have been mainly characterized by viscosity which, from the point of view of recovery
ability, is perhaps the most critical feature of oil in ice and cold conditions.
Figure 15. The oil viscosity types used in the Field Guide (EPPR 2017a).

Recommendations for best technological and operational practices for oil spill response in the NPA region APP4SEA
50
Modelling of oil spill
movements To successfully respond to oil spills, a reliable mathematical model to predict oil movement as
well as the weathering of the oil is needed. Calculations help responders focus the response
efforts on the right places, i.e. where oil actually exists. This is even more important in ice
conditions, when the poor visibility and darkness make visual observations of oil movements
difficult. An oil and ice model is normally based on a 3D oceanographic water circulation model
and uses the sea currents from this circulation model.
The OILMAP software suite, developed by Applied Science Associates (Figure 16), is the most
widely used model for predicting oil spill trajectories in the presence of ice. OILMAP provides
rapid predictions of the movement of spilled oil. It includes simple graphical procedures for
entering both wind and hydrodynamic data and specifying a spill scenario. More information
can be found at http://www.asascience.com/software/oilmap/. OILMAP is a Lagrangian
particle-tracking model in which each particle is given an additional degree of freedom to
simulate the gravitational spreading of oil into a thin slick. The model calculates particle
trajectories using inputs of ocean currents, winds, and ice conditions from observations or
circulation models. It also takes into account changes in oil density and viscosity due to
weathering by evaporation and emulsification. Oil-ice interaction is parameterized by
assuming that the oil moves with the ice at concentrations >30% and with ocean surface
currents at concentrations <30% (Blanken et al 2016). Another very similar and much-used
model is the SIMAP, which contains the same trajectory calculation algorithms as OILMAP.
SIMAP provides detailed predictions of the three-dimensional trajectory, fate, biological
effects, and other impacts of spilled oil and fuels. More information can be found at
http://asascience.com/software/simap/. OILMAP is a simplified version of SIMAP designed for
operational use and for contingency planning. OILMAP uses a reduced number of pseudo-
components to represent the oil and so requires less data than SIMAP to define the oil
composition (French-McCay et al. 2017).

Recommendations for best technological and operational practices for oil spill response in the NPA region APP4SEA
51
Figure 16. A snapshot showing some features of the OilmapWeb tool.
http://staging.asascience.com/software/oilmap/oilmapweb.shtml
There are several sea ice models for the Arctic Ocean that are formed from operational
global ocean (hydrodynamic) models (French McKay et al 2017):
- European Global Ocean Observing System (EUROGOOS) website
(http://eurogoos.eu/models/) provides a catalogue of, and links to, existing global,
regional, and coastal ocean models generated from the GOOS Regional Alliances
(GRAs).
- The Arctic Ocean models include those built off the Nucleus for European Modelling for
the Ocean (NEMO) system (used by the Finnish Meteorological Institute, U.K. Met
Office, and Mercator Ocean), which is coupled with the thermodynamic–dynamic sea
ice model Louvain-la-Neuve Sea Ice Model (LIM)
(http://www.elic.ucl.ac.be/repomodx/lim/), the Helsinki Multi-category sea-Ice model
(HELMI) developed by the Finnish Meteorological Institute (Haapala et al. 2005;
Mårtensson et al. 2012)
- The Towards an Operational Prediction system for the North Atlantic European coastal
Zones (TOPAZ) (http://topaz.nersc.no/) was developed by Nansen Environmental and
Remote Sensing Centre (NERSC), Bergen, Norway. TOPAZ is currently the Arctic

Recommendations for best technological and operational practices for oil spill response in the NPA region APP4SEA
52
Ocean forecast platform within the European monitoring and forecast service MyOcean
http://eurogoos.eu/modelling_inventory/eurogoos-136/). Forecast products are
available at http://eurogoos.eu/roos/arctic-roos/ .
At the moment, operational models have not been implemented with sufficient spatial
resolution or skill to define sea ice characteristics and dynamics needed for high resolution oil
spill trajectory forecast modelling.
Depending on location and environmental state variables, the ice condition may vary
significantly and also change relatively fast. The ice condition is characterized by a wide range
of parameters such as multi-year ice or first-year ice, ice type, ice concentration, ice thickness,
ice floe size, ice ridges, ice drift and season. The combination of parameters often leads to
the use of ice descriptions such as fast ice, pack ice, drift ice, broken ice, brash ice, grease
ice, and frazil ice. The spreading of oil is greatly affected by the ice conditions.
With ice concentration of about 40% and a slow drift ice situation the ice may work as a natural
barrier. The ice may capture the oil slick between the ice floes and thereby prevent it from
spreading. If the spill occurs on top of an ice field, the presence of a snow layer also affects
the behavior of the spill as oil may be absorbed and contained by the snow.
Ice concentrations of over 60% can naturally contain oil in relatively thick films (of a millimeter
or more). Freeze-up oil/ice interactions are controlled by grease and ice slush. Encapsulation
of under-ice spills stops weathering but limits access. The ice drift rate controls the thickness
of the oil layer that can accumulate on the surface with an extended release. Spring migration
through porous ice exposes fresh oil naturally (Westerberg 2012).
The JIP research program advanced oil spill trajectory modelling by supporting the
development of several improved higher-resolution ice drift models that outperform existing
models both in pack ice environments with high ice concentrations and more dispersed
dynamic ice associated with Marginal Ice Zones (MIZ). Nansen Environmental and Remote
Sensing Centre (NERSC) (Ólason et al. 2016) performed the JIP Phase 1 ice modelling
efforts, focusing on three model developments: (1) a discrete element (DE) model for the
Marginal Ice Zone (MIZ), (2) the Elasto-Brittle (EB) ice rheology model, which is an
improvement over the standard (historically used) EVP rheology algorithm for the ice pack,
and (3) integration of a wave-in-ice model (WIM) into a high-resolution version of their TOPAZ
ocean and ice model. NERSC noticed the DE model was best under MIZ conditions, but it is
not suitable for operational use and takes too much time and effort. The newly developed EB

Recommendations for best technological and operational practices for oil spill response in the NPA region APP4SEA
53
model showed significant improvement in performance over the present Elastic-Viscous-
Plastic (EVP) modelling approach used in the operational forecast and reanalysis versions of
their TOPAZ coupled ice-ocean model. NERSC also integrated a wave-in-ice model (WIM)
into a newly updated version of TOPAZ to characterize waves in the Marginal Ice Zone (MIZ).
The models OILMAP and SIMAP were updated, integrating the NERSC ice modelling
products for use in transport and oil weathering algorithms. Besides the remarkable
improvements of the models, while comparing updated models with in-situ data it was noticed
that the accuracy of individual oil model trajectories projected weeks to months into the future
were expected to be low. This is why in the case of real spill, forecasts should be updated
frequently (on a time scale of hours to days) e.g. with satellite data, aerial observations or
drifter data (Ólason et al. 2016; French-McKay et al. 2017).
In addition to OILMAP and SIMAP, there are many other software programs used to forecast
oil spill drifting in open water conditions. Spill event models operate on comparatively small
scales in space and time. During and after the occurrence of a spill event, a spill is distributed
in the environment in accordance with the properties of the substance(s) and the
environmental conditions. Oil drift modelling has been developed much since the 1980s, and
there are now several models available. Differences in forecasting quality are mainly related
to externalities, e.g. model set-up. Several commercial or free software programs are available
and those listed or described below are just a sample:
ADIOS2
ADIOS® (Automated Data Inquiry for Oil Spills) is NOAA's oil weathering model. It is an oil
spill response tool that models how different types of oil weather undergo physical and
chemical changes in the marine environment. See more at
http://response.restoration.noaa.gov
BSH dmod
The BSH dmod model is described in Dick and Soetje (1990) and applied in e.g. Murawski
and Nielsen (2013). The model is able to deal with ship driving fuel oils and a variety of natural
crude oils.
CAROCS
The Computer Aided Rescue and Oil Combating System (CAROCS) model is described in
Chybicki et al. (2008). It was designed and developed by the Maritime Institute in Gdansk
(MIG). Among the processes influencing oil spill dispersion, this model considers 1) advection
caused by sea currents and wind, 2) wave height and direction, 3) vertical and horizontal

Recommendations for best technological and operational practices for oil spill response in the NPA region APP4SEA
54
diffusion of oil spill droplets, and 4) vaporization and dispersion. The model also utilizes the
High Resolution Operational Model for the Baltic Sea (HIROMB) hydrodynamic operational
model designed specifically for the Baltic Sea as well as the WAM4 wave forecast model as
input. Together with the POSEIDON model, it is used in the integrative GIS framework
presented in Kulawiak et al. (2010).
GNOME
The General NOAA Operational Modeling Environment (GNOME) model (Figure 17) supports
the NOAA/National Ocean Service (NOS), Office of Response and Restoration (OR&R),
Emergency Response Division (ERD) standard for best guess and minimum regret trajectories
by providing information about where the spill is most likely to go (Best Guess Solution) and
the uncertainty bound (Minimum Regret Solution). Further information:
http://response.restoration.noaa.gov/ as well as NOAA (2002), Beegle-Krause et al. (2003),
Chen et al. (2011), NOAA (2012).
Figure 17. GNOME model output depicting relative distribution of oil.
https://response.restoration.noaa.gov/oil-and-chemical-spills/oil-spills/response-
tools/gnome.html .

Recommendations for best technological and operational practices for oil spill response in the NPA region APP4SEA
55
MEDSLIK2
The oil drifting model in the Mediterranean area, MEDSLIK2 (De Dominicis et al. 2013a, b), is
similar to Seatrack Web, but the backtracking is missing in MEDSLIK2.
MOHID
The Mohid Desktop Spill Simulator has been developed within the ARCOPOL (The Atlantic
Regions’ Coastal Pollution Response) project (ARCOPOL 2011a). It is a fast oil and inert spill
Lagrangian simulator integrating offline metocean forecasts from several different institutions
in the Atlantic Area for the regions or ARCOPOL partners. This desktop client application
allows end users to have control over model simulations. Parameters such as the date and
time of the event, location and oil spill volume are provided to the users; this interactive tool
integrates best available metocean forecasts (waves, meteorological, hydrodynamics) from
different institutions in the Atlantic Area. Metocean data are continuously gathered from
remote servers or ftp sites, and then automatically interpolated and pre-processed to be
available for the simulators. This simulation tool can also import initial data and export results
from/to remote servers, using OGC WFS services. Simulations are provided to end users in a
matter of seconds, and thus can be very useful in emergency situations. The backtracking
modelling feature and the possibility of importing spill locations from remote servers with
observed data (for example, from flight surveillance or remote sensing) allow the potential for
application to evaluate possible contamination sources. The numerical model used to simulate
spill fate and behavior in this application is the Lagrangian component of the MOHID water
modelling system, including an oil spill module.
MOTHY
MOTHY is a 3D pollutant drift model implemented by Météo-France for the Mediterranean
Sea and the Black Sea (also worldwide). Operated since 1994 in the marine forecast section
at Météo-France, MOTHY was used extensively for the Erika and the Prestige incidents. The
system is operated at the request of CEDRE for support of the oil spill fighting operations and
on demands of the Marine Rescue Coordination Centres for support of the search and rescue
operations. CEDRE is also developing the MOTHY for HNS spill modelling. A meteorologist
on duty is able to run the model around the clock. About 500 interventions each year are
conducted with an averaged time response of 30 minutes. Pollutants can be oil or floating
objects. Current in the mixed layer is computed using a combination of a shallow water model
driven by the wind and the atmospheric pressure, coupled to an analytical turbulent viscosity
model, so as to represent vertical current shear, and a background current provided by an
oceanic model (MERCATOR or MFS). A continuous profile from surface to bottom describes
the water column. The length of the forecast is, for most cases, 2 or 3 days but 10-day
Recommendations for best technological and operational practices for oil spill response in the NPA region APP4SEA
56
forecasts are available. For specific cases, probabilistic forecasts up to 10 days can be
managed. Additional oil spill model capabilities: beaching,
sedimentation, and backtracking. MOTHY predicts each pollutant parcel in size, position
coordinates (Lat, Lon), position in the water column (surface, bottom or in the column) or
beached. Documents on the Mothy model can be found at:
http://www.meteorologie.eu.org/mothy/english.html and
http://www.meteorologie.eu.org/mothy/references/ .
OD3D
OD3D (Martinsen et al. 1994, Wettre et al. 2001) calculates the drift and chemical evolution
of a marine oil spill in the guise of a number of “superparticles,” each of which represents a
certain amount of oil or its byproducts. The user may choose from a range of oil types for the
spilled oil. The oil slick is modified by advection due to currents and by weathering,
evaporation, dispersion, emulsification due to exposure to air, water and waves over time. In
addition, the model includes a novel deep blowout sub-model for oil sources below the surface.
The core of OD3D has been developed in cooperation with SINTEF (Trondheim, Norway).
OilMARS
The 3D Oil Spill Model for the Arctic Seas (OilMARS) was developed at the Arctic and Antarctic
Research Institute (AARI, St Petersburg, Russia). The model simulates the transport and
transformation of oil pollution on the sea surface after continuous/instantaneous accidental oil
spills from stationary or moving sources, the spreading of the observed oil slicks on the sea
surface, and the oil pollution in the water column (Stanovoy et al. 2012).
OILSPILL
The Oil spill Risk Analysis Model of the U.S. Geological Survey is described in Smith et al.
(1982).
OSCAR
SINTEF has the OSCAR modelling tool for oil spill drift and spreading estimations. It is
scenario-based software. http://www.sintef.no
OSERIT
The Belgian MUMM's OSERIT oil drift and fate model interface (Dulière et al. 2013) is a 24/7
accessible support tool for evaluation of an oil spill report by MUMM duty personnel, Coast
Guard Centers and other governmental authorities involved in oil pollution response at sea or
the follow-up of (presumed) illegal pollution. The user-friendly interface allows duty personnel

Recommendations for best technological and operational practices for oil spill response in the NPA region APP4SEA
57
of these organizations to automatically obtain a first, quick simulation of the spill drift by
entering, at the very least, the spill time and location. When using the oil model interface, a
simulation will be generated in near-real time that contains either (1) a forecasting of the drift
(simulation of future trajectory up to 4 days), which can be used to evaluate the possible impact
of an oil spill on resources at risk, or (2) a backtracking of the drift (simulation of past trajectory
up to 4 days), which may facilitate the identification of the alleged polluter or pollution source
– e.g. when combined with AIS data. OSERIT development was funded by the Belgian Federal
Science Policy Office (BELSPO).
OSIS
Oil Spill Identification System: http://www.osis.biz/ss2.asp
POM-RW
A 3D hybrid flow/transport model to predict the dispersal of oil pollution in coastal waters
(Korotenko et al. 2000,2002,2004). The transport module of the model takes predetermined
current and turbulent diffusivities and uses Lagrangian tracking to predict the motion of
individual particles (droplets), the sum of which constitutes a hypothetical oil spill. The basic
processes affecting the fate of the oil spill are taken into account and parameterized in the
transport model. Originally a Russian model, extensively applied in the Caspian Sea.
RiskTool
The Russian model RiskTool (Ivchenko 2013a) is a derivative of the spill transport model
SPILLMOD (Ovsienko 2002). It utilises historical meteorological and hydrological data from
the Baltic Sea region as forcing to facilitate realistic risk assessments for oil stranding.
Information about RiskTool, of which documentation is limited, is complicated by the fact that
a number of software products with the same or very similar name have been published for a
variety of purposes in the realm of risk assessment. An application with a very similar name
(DynamicRiskTool) has been developed within the ARCOPOL project in 2011 for marine traffic
accidents (ARCOPOL 2011b).
Seatrack Web
Seatrack Web is the de facto official HELCOM oil drift forecasting and hindcasting system
hosted by SMHI (Swedish Meteorological and Hydrological Institute), and developed by SMHI
and FCOO (Defence Center for Operational Oceanography, Denmark) and BSH (Federal
Maritime and Hydrographic Agency, Germany) and FMI (Finnish Meteorological Institute).
Seatrack Web (Liungman and Mattsson 2011; SMHI 2012) is a user-friendly system for
forecasts and backtracking of drift and spreading of oil, chemicals, algae and substances in

Recommendations for best technological and operational practices for oil spill response in the NPA region APP4SEA
58
water in the Gulf of Bothnia, the Gulf of Finland, the Baltic Sea, the Sounds, Kattegat,
Skagerack and eastern part of the North Sea (out to 3° E). Seatrack Web's aim is to provide
a tool for authorities in HELCOM countries for oil spill prediction, combating and identification
of illegal polluters. STW uses the latest technology, 3D modelling, updated atmospheric and
ocean forecasts and observations, satellite information and HELCOM's AIS system to provide
a fast and effective service which is used operationally throughout the Baltic region by Coast
Guards, Border Guards, Rescue Services and Environmental Institutes. The Seatrack system,
including the oil spreading model PADM (Particle Dispersion Model) and graphical user
interface, is continually being improved and optimized by a team of experts at SMHI, DCOO,
BSH and FMI.
Figure 18. The results in Seatrack Web are presented graphically. The image shows the extent
of ice, an oil discharge and a calculation of a fictive oil discharge.
https://www.smhi.se/en/services/professional-services/environment/forecasts-of-oil-spills-
1.7624
SPILLMOD
The Russian spill transport model SPILLMOD (Ovsienko 2002; Ivchenko 2013b) was
developed by the late S. Ovsienko. It has been applied in the Baltic Sea.

Recommendations for best technological and operational practices for oil spill response in the NPA region APP4SEA
59
Figure 19. An example of the SPILLMOD calculation where the estimated trajectories of an oil
spill have been calculated using statistical long-term wind and current data (Laine, V. et al
2018).
COHERENS
Models developed using the COHERENS (Luyten et al. 1999) modelling tool represent the
group of 3D circulation and transport models most commonly used for biogeochemical
applications, e.g. phytoplankton dynamics. These are traditionally concerned with dissolved
and particular components in the water phase.
There is, however, and increasing interest in using and further developing 3D models also for
HNS applications. COHERENS stands for COupled Hydrodynamical Ecological model for
REgioNal Shelf seas, and originates from RBINS-MUMM, Belgium. It is a 3D finite difference,
s-layer, multi-purpose numerical model designed for application in coastal and shelf seas,
estuaries, lakes and reservoirs. The code is open source, available to the public since 2000.
It is multi-platform and has an extremely good documentation (1,500+ pages). COHERENS is
modular in its design, and very flexible and expandable. It is actively developed and constantly
evolving.
DREAM
DREAM (Dose-related Risk and Effects Assessment Model) is a particle model developed by
SINTEF. DREAM is part of MEMW (Marine Environmental Modeling Workbench) that also
contains OSCAR (Oil Spill Contingency and Response for contingency planning) and
ParTrack, for drill muds, cuttings, and associated chemicals. The SINTEF OWM (the Oil
Weathering Module), available as a separate model, is also used as the weathering engine in
OSCAR. The possibilities of MEMW are comprehensive. Examples:

Recommendations for best technological and operational practices for oil spill response in the NPA region APP4SEA
60
• Particle model for oil, chemicals and solid material (such as sediments)
• Extensive chemical and oil database that can be extended or adjusted by the user
• Biological module (effect on fish, plankton, etc.)
• Use of GIS (for example to designate ecologically sensitive areas)
• Definition of mechanical recovery systems (like skimmers, dispersants)
• Extensive graphical output (particles, concentrations, concentrations per component, etc.)
• Graphical presentation of flow, wind, etc.
• Definition of habitat and depth grid
• 3D particle behavior
• Allows import of bathymetric database.
A particular feature of DREAM is that oil or chemical products can be fed into the program by
specifying the real components. These components are defined in DREAM using many
chemical and physical specifications. After a spill, these components behave differently: some
evaporate, some dissolve, etc. DREAM is able to give detailed information on behavior and
spread for the different phases and components of the spill (Jong 2004). DREAM is not
publicly available, but SINTEF may run the model for a substantial fee.

Recommendations for best technological and operational practices for oil spill response in the NPA region APP4SEA
61
Monitoring Successful countermeasures against oil spill require an adequate preparedness, a large
toolbox of oil recovery methods, trained personnel and excellent communication and
surveillance means. When an accident takes place and results in an oil spill outflow from a
ship or from a drilling platform, it is of primary importance to have tools to locate the spill, to
follow the spill and to have tools to follow effectiveness of the selected countermeasures. The
fresh data describing the fate of an oil spill is crucial knowledge for the on-scene commander
of the responders to form a situational awareness view of the case.
There is a large set of sensors and tools available for oil spill detection and tracking. The usual
way to initiate countermeasures against detected oil spill is based on the first alert made by
the ship(s) in distress, some other party close the accident or a third party getting data based
on remote-controlled means. Typical remote-controlled party is a surveillance aircraft or
helicopter flying over the oil spill and detecting a spill and giving the first warning to authorities.
Another option is to get an alert via satellite images, for example as a part of the EMSA’s
CleanSeaNet service. After receiving the initial information about the oil spill, the combatting
authority needs on-line information about the expected size, position, drift velocity and
direction to mobilize the required countermeasures and to have time to localize special
sensitive areas to be protected by booms or other relevant ways (Rytkönen, J. et al 2018).
Oil spill detection
There are basically three main reasons why crude oil and refined oils are detectable with
optical sensors, i.e. based on the visible spectrum:
- in optical terms the refraction index is greater than for the water,
- the light absorption coefficient is stronger than for water and
- oil tends to be fluorescent when subjected to bright natural light.
The above-mentioned properties make it possible also to measure the thickness of the oil
slick. Additionally, classification into the basic oil categories can be made, i.e. whether or not
the oil may belong to crude oil, refined light oils, or heavy oils.

Recommendations for best technological and operational practices for oil spill response in the NPA region APP4SEA
62
Typically, the information required both for satellite and airborne surveillance tasks includes
- the area of the oil slick and its position,
- estimated oil type and physical properties,
- estimated oil slick thickness: very often 80% of the amount of oil will stay in 20% of the total
area of the oil slick, making this information of perhaps the greatest importance from the
countermeasures point of view,
- oil alteration, dispersed oil extension and
- confidence level of the oil detected (or possible other source of pollutant or algae blooming.
Information about the confidence level is more accurate if the visual observations can be
confirmed by thermal images.
The most common sensor types for remote monitoring are infrared sensors, sensors using
microwaves (both active and passive). The most common active sensor type is the Synthetic
Aperture Radar (SAR) which probes variations of the short gravity-capillary waves.
Satellites currently offer reliable images for oil combating authorities to determine if a certain
sea area is affected by oil spills or not. In an operative situation, there is a need to get more
detailed data, confirmation of the slick size and type and of the oil slick spreading
phenomenon, so various surveillance means are needed to receive a sufficiently accurate
view of the situation.
SAR satellite images cannot provide information on the nature of a spill (for instance whether
it is mineral oil, fish or vegetable oil, or other), but spills from vessels often appear as long,
linear dark lines (indicating a substance discharging as the vessel is moving), with a bright
spot (the vessel) at the tip. Vessel detection is also available through the CleanSeaNet service.
CleanSeaNet is a satellite-based oil spill surveillance and vessel detection service which
analyzes SAR images from satellites to detect possible oil spills on the sea surface. If a vessel
is detected in a satellite image, its identity can often be determined by correlating the satellite
data with vessel positioning reports from the European monitoring systems operated at EMSA,
such as SafeSeaNet. http://www.emsa.europa.eu/ssn-main.html Even though SAR satellites
may be the most advanced satellite-sensor combination, optical satellites are also used for
spill detection. Due to the many constraints, however, the optical satellite images are often
used as secondary remote monitoring options as SAR satellites will give a better response for
oil slick detection. Table 4 shows a set of optical satellite types available.

Recommendations for best technological and operational practices for oil spill response in the NPA region APP4SEA
63
Table 4. Operational optical satellites (Puestow, T, 2013).
Other means for oil spill detection
The choice of sensors or platform used to carry out detection or surveillance tasks depends
heavily on the each case: environmental conditions and season, as well the spill
characteristics, may vary case by case. For open water oil spill detection, the optimal devices
might be different than for ice conditions. To get an understanding of the suitable means
available, the remote surveillance task can be divided into two main categories: deployment
platforms and sensors/systems onboard those platforms. The third category is then the
integrated use of the set of sensors and devices to fulfil the oil detection task to support the
operative countermeasures and to improve the operational situational view over the accidental
and surrounding area.
Many of the recent guidelines available are concentrated on the oil-in-ice characteristics and
the various environmental conditions where oil and ice can interact. Oil slicks in ice conditions
can be met in:
- freezing conditions,
- early stages of ice formation (frazil ice, pancake ice), where oil can also be trapped in a
horizontal layer over the forming ice layer,
- between the ice floes where the ice and water coverage ratio will vary between 0 and 100
- moving ice and
Recommendations for best technological and operational practices for oil spill response in the NPA region APP4SEA
64
- in the conditions where oil may lie partly or totally under ice, covered by snow (Rytkönen, J.
2018).
There are three main activities related to management of oil spills in the marine environment
in which satellite remote sensing has a role: contingency planning, emergency response and
monitoring:
- Contingency planning for oil spills involves gathering baseline data, identifying economically
and environmentally sensitive areas and assessing the availability of facilities and equipment
to be used in clean-up efforts should an oil spill occur.
- Emergency response to a specific oil spill incident involves identification of the location and
extent of a spill and short-term monitoring of the spill.
- A monitoring program involves frequent imaging of areas where spills or illegal dumping are
likely to occur (Northwest Pacific Action Plan [NOWPAP]).
Satellites have regular orbit runs over oceans and coastal areas; thus they can be used
effectively for gathering statistical information. Oil slicks can be found all over the world.
The advantages of using satellites for oil spill detection are the following:
- They can cover a large area in a short period of time
- Data may be transmitted via the internet almost immediately
- Many radar satellites are useful in detecting large offshore spills and spotting anomalies
- Some operational commercial satellites can be tasked to respond to emergencies within
a range of 90 minutes to 4 hours.
Disadvantages include the following:
- The timing and frequency of overpasses by satellite systems may not be optimal for the
situation
- Clear skies are needed to perform optical work
- The probability of detecting oil may be low
- Developing algorithms to highlight oil slicks is difficult
- Extensive time may be required to convert data into actionable information.
Recommendations for best technological and operational practices for oil spill response in the NPA region APP4SEA
65
Extensive studies conducted by SINTEF in Oil In Ice – JIP and in Arctic Oil Spill Response
Technology Joint Industry Programme (JIP) and recent R&D Finland in sensor technology
have also listed a set of modern sensors and their suitability areas as follows:
•Passive optical sensors: cameras and multispectral imaging systems, ultraviolet (UV) and
Near-InfraRed (NIR) sensors, hyperspectral sensors
•Passive Thermal InfraRed sensors (TIRs) and Micro-Wave Radiometer (MWR) systems
•Active radar sensors: Side-Looking Airborne Radar (SLAR) and Synthetic Aperture Radar
(SAR) systems, Marine Radar, Ground Penetrating Radar (GPR)
•Active Laser and fluorosensors: fluorosensors, Tunable Diode Laser Spectroscopy (TDLS),
Laser-Ultrasonic Remote Sensing of Oil Thickness (LURSOT), Light Detection and Ranging
LiDAR
•Experimental sensors: Acoustic Sensors, Nuclear Magnetic Resonance (NMR)
Spectroscopy, trained dogs.
Monitoring onboard vessels and offshore
structures
Common systems for oil spill detection onboard vessels are visual observations using the
naked eye, binoculars, cameras and video cameras. It is also common knowledge that
skippers of response vessels have outdoor observers on the deck (or keep the bridged door
open) to notice any oil smell, for example in dark situations where the poor visibility makes it
not possible to use optical means to detect oil.
There are also numerous, more sophisticated tools for oil detection such as:
- oil radars, which use of the ship’s existing X-band radar. They have options also for
wave monitoring algorithms, radar with horizontal and vertical polarization and often
support for the ship’s IR censor system;
- infrared camera systems;
- UAVs (unmanned aerial vehicle) (drones)
- AUVs (autonomous underwater vehicle) and
- tethered balloon systems.
UAVs may also offer solutions for surveillance close to the vessel or offshore platform (copter
type solutions) or remote operations with fixed wing solutions. There are commercially

Recommendations for best technological and operational practices for oil spill response in the NPA region APP4SEA
66
available solutions where UAVs can be launched from the ship deck and also various means
to get the UAV back after a surveillance flight.
Figure 20. Tekever AR5 – a fixed wing UAS for oil spill surveillance (Rees, M. 2017).
Autonomous drifting buoys, drifters
Autonomous drifting buoys for oil spill monitoring are specially designed buoys to be used to
follow oil spill movement. During the oil spill, these buoys will be carried out to the spill site,
deployed in the water and left to move with the oil. The system will send position data and
thus give on-line information about the drift and current position of the oil slick.
A typical drift buoy uses Iridium telemetry which is the most cost-effective means of
transmitting data for environmental applications. The Iridium modem provides the end users
with lower transmission costs and an increase in data throughput.
Drifters are also used in Finland for operative oil combating. The competent oil combating
authority, the Finnish Environment Institute (SYKE), has a joint agreement with the Finnish
Meteorological Institute (FMI) and Finnish Border Guard to use drifters in accident situations:
In the case of a detected large-scale oil spill, the Finnish Border Guard will deploy drifters
using a patrol boat, ship or helicopter. Data sent by the drifter will be received by FMI and be
transferred to SYKE where the trajectories will be analyzed using SeaTrack Web numerical
analyses. Similar procedures could also be used in Arctic conditions, where drifters can be
deployed from helicopter, aircraft or larger UAV.

Recommendations for best technological and operational practices for oil spill response in the NPA region APP4SEA
67
Table 5. Remote sensing technologies – sensors and their application range (Watkins, R
2016).

Recommendations for best technological and operational practices for oil spill response in the NPA region APP4SEA
68
References
Allen, A. A and Ferek R. J. (1993). Advantages and disadvantages of burning spilled oil,
Proceedings of the 1993 International Oil Spill Conference, 765, 1993.
Allen, A.A., Jaeger, D., Mabile, N.J. and Costanzo, D. (2011). The Use of Controlled Burning
during the Gulf of Mexico Deepwater Horizon MC-252 Oil Spill Response. International Oil
Spill Conference Proceedings: March 2011, Vol. 2011, No. 1, pp. abs194.
ARCOPOL (2011a). MOHID Desktop Spill Simulator: Detailed User Manual. Version 1,
30/12/2011; auth. Fernandes, R. et al.; 30 p.
ARCOPOL (2011b). Updating Risk Maps & Decision Support Tools: Technical Report on
Dynamic Risk Analysis Tool, Future Implementations and Guidelines for Transferability in the
Atlantic Regions. Version 1, 30/12/2011; auth. Fernandes, R. et al.; 66 p.
Arctic Oil Spill Response Technology Joint Industry Programme (2014). Environmental
Impacts of Arctic Oil Spills and Arctic Spill Response Technologies. Literature Review and
Recommendations. December 2014. 205 pp.
Beegle-Krause, C.J., Callahan, J. and O’Connor, C. (2003). NOAA model extended to use
nowcast/forecast currents. IOSC Proceedings 2003(1): 991-994.
Belore, R.C., K. Trudel, J.V. Mullin, and A. Guarino (2009). Large-scale cold water dispersant
effectiveness experiments with Alaskan crude oils and Corexit 9500 and 9527 dispersants.
Marine Pollution Bulletin 58: 118–128.
Blanken, H., Tremblayb, L.B., Gaskina, S. and Slavin A. (2016). Modelling the long-term
evolution of worst-case Arctic oil spills. Marine Pollution Bulletin 116 Pp.315–331.
Brakstad, G., Ribicic, D. Winkler, A. and Netzer, R. (2017). Biodegradation of dispersed oil in
seawater is not inhibited by a commercial oil spill dispersant. Marine Pollution Bulletin Volume
129, Issue 2, April 2018, pp. 555-561.

Recommendations for best technological and operational practices for oil spill response in the NPA region APP4SEA
69
Buist, I. (1999). Windows-of-opportunity for in situ burning. In: Proceedings In Situ Burning of
Oil Spills Workshop, New Orleans, LA, 2–4 November 1998. Published by NIST and MMS,
NIST SP 935. pp. 21-30.
Buist, I. (2000). In situ burning of oil spills in ice and snow. Alaska Clean Seas, International
Oil and Ice workshop 2000, Anchorage and Prudehoe Bay, 38 p.
Buist, I. (2003). Window of Opportunity for In Situ Burning, Spill Science & Technology Bulletin,
Vol. 8, No. 4, 2003: 341-346.
Buist, I. & Dickins, D. (2003). Test to determine the limits to in situ burning of thin oil slicks in
broken ice. Final Report. SL Ross Environmental Research Ltd. and DF Dickins Associates
Ltd. and Alaska Clean Seas.
Buist, I., Potter, S. & Sørstrøm, S.E. (2010). Barents Sea field test of herder to thicken oil for
in situ burning in drift ice. Proceedings of the 33rd Arctic Marine Oil Spill Programme (AMOP)
Technical Seminar, Environment Canada, vol. 2, pp.725-742.
Buist, I., Potter, S., Nedwed, T. and Mullin, J. (2011a). Herding Surfactants to Contract and
Thicken Oil Spills in Pack Ice for in Situ Burning, Cold Regions Science and Technology, 67,
2011: 3-23. https://doi.org/10.1016/j.coldregions.2011.02.004 .
Buist, I., Potter, S. and Nedwed, T. (2011b) Herding Agents to Thicken Oil Spills in Drift Ice
for In Situ Burning: New Developments. International Oil Spill Conference Proceedings: 2011-
230.
Buist, I. A, Potter, S.G., Trudel, B.K., Shelnutt, S.R., Walker, A.H., Scholz, D.K., Brandvik,
P.J., Fritt-Rasmussen, J., Allen, A.A., and Smith, P. (2013). In Situ Burning in Ice-Affected
Waters: State of knowledge report. Final report 7.1.1. Report from Arctic Oil Spill Response
Technology Joint Industry Programme (JIP). p. 1-294.
Camus, L., Smit, M.G.D. (2018). Environmental effects of Arctic oil spills and spill response
technologies, introduction to a 5-year joint industry effort, Marine Environmental Research
(2018), doi: 10.1016/j.marenvres.2017.12.008.

Recommendations for best technological and operational practices for oil spill response in the NPA region APP4SEA
70
Cheng, Y., Li, X., Xu, Q., Garcia-Pineda, O., Baltazar Andersen, O. and Pichel, W.G. (2011).
SAR observation and model tracking of an oil spill event in coastal waters. Marine Pollution
Bulletin 62: 350–363.
Chybicki, A., Kulawiak, M., Lubniewski, Z., Luba, M. Moszynski, M. and Dabrowski, J. (2008).
GIS for remote sensing, analysis and visualization of marine pollution and other marine
ecosystem components. Proceedings of 1st International Conference on Information
Technology, 2008, p.223–226. Available at:
http://ieeexplore.ieee.org/iel5/4609442/4621577/04621628.pdf?arnumber=4621628
Coastal Response Research Center (CRRC), (2017). State-of-the-Science of Dispersants and
Dispersed Oil (DDO) in U.S. Arctic Waters: Efficacy & Effectiveness" Coastal Response
Research Center. 1. https://scholars.unh.edu/crrc/1
Coastal Response Research Center (CRRC) (2018). State-of the Science of Dispersants and
Dispersed Oil (DDO) in U.S. Arctic Waters: Eco-Toxicity and Sublethal Impacts. Coastal
Response Research Center. 2. https://scholars.unh.edu/crrc/2
Curd, H., (2011). The use of dispersant for the control of volatile organic compounds. Int. Oil
Spill Conf. Proc. abs359 http://dx.doi.org/10.7901/2169-3358-2011-1-359
Daling, P.S., A. Holumsnes, C. Rasmussen, P.J. Brandvik, and F. Leirvik, (2010).
Development and Field Testing of a Flexible System for Application of Dispersants on Oil
Spills in Ice. In proceedings of the thirty-third AMOP Technical Seminar on Environmental
Contamination and Response, Environment Canada, Ottawa, pp.787-814.
De Dominicis, M., Pinardi, N., Zodiatis, G. and Lardner, R. (2013a). MEDSLIK-II, a Lagrangian
marine surface oil spill model for short-term forecasting – Part 1: Theory. Geosci. Model Dev.
6: 1851-1869.
De Dominicis, M., Pinardi, N., Zodiatis, G. and Archetti, R. (2013b). MEDSLIK-II, a Lagrangian
marine surface oil spill model for short-term forecasting – Part 2: Numerical simulations and
validations. Geosci. Model Dev. 6: 1871-1888.
Dick, S., Soetje, K.C. (1990). Ein operationelles Ölausbreitungsmodell für die Deutsche Bucht.
An operational oil dispersion model for the German Bight. Deutsche Hydrographische

Recommendations for best technological and operational practices for oil spill response in the NPA region APP4SEA
71
Zeitschrift, Ergänzungsheft Reihe A, Nr. 16. Bundesamt Für Seeschiffahrt und Hydrographie,
Hamburg; 43 p.
Dulière, V., Ovidio, F. and Legrand, S. (2013). Development of an Integrated Software for
Forecasting the Impacts of Accidental Oil Pollution- OSERIT. Final Report. Brussels: Belgian
Science PolicyOffice 2013. (Research Programme Science for a Sustainable Development);
65 p.
EPPR (2015). Guide to Oil Spill Response in Snow and Ice Conditions. Arctic Council’s
Emergency prevention, Preparedness and Response Working Group (EPPR). ISBN: 978-82-
999755-6-8.
EPPR (2017a). Field Guide for Oil Spill Response in Arctic Waters (Second Edition). The
Emergency Prevention Preparedness and Response (EPPR) Working Group. Prepared by
Owens, E. H., Dickins, D. F. and Solsberg, L. 380 p.
EPPR, (2017b). Circumpolar Oil Spill Response Viability Analysis (COSRVA). Technical
Report. ISBN 978-82-93600-04-6 (print). 134pp.
Etkin,D. S., (2000). “Worldwide Analysis of Marine Oil Spill Cleanup Cost Factors,”
Arctic and Marine Oil spill Program Technical Seminar, Environmental Research Consulting
Winchester, Massachusetts, USA.
Federici, C. and Mintz, J. (2014). Oil Properties and Their Impact on Spill Response Options
- Literature Review. IRM-2014-U-007490, May 2014.
Fingas, M. (2008). A Review of Literature Related to Oil Spill Dispersants Especially Relevant
to Alaska 2002-2008 for Prince William Sound Regional Citizens’ Advisory Council
(PWSRCAC) Anchorage, Alaska.
Fingas, M. (2011). Oil Spill Science and Technology, Elsevier.
Fingas, M.F., Lambert, P., Li, K., Wang, Z., Ackerman, F., Nelson, R., Goldthrop, M., Mullin,
J.V., Turpin, R., Nadeau, R., Campagna, P., Schuetz, S., Morganti, M. & Hiltabrand, R.R.
(1999). Studies of emissions from oil fires. Proceedings of the 1999 Oil Spill Conference, API
publication No. 4686B, American Petroleum Institute, Washington, D.C., pp. 541-547.

Recommendations for best technological and operational practices for oil spill response in the NPA region APP4SEA
72
French-McCay, D.P., Tajalli-Bakhsh, T., Jayko, K. and Malcolm L. (2017). Validation of oil spill
transport and fate modelling in Arctic ice. Arctic Science 4: 71–97 (2018)
dx.doi.org/10.1139/as-2017-0027.
Fritt-Rasmussen, J. (2010). In Situ burning of Arctic marine oil spills: Ignitability of various oil
types weathered at different ice conditions. A combined laboratory and field study. Technical
University of Denmark, Department of Civil Engineering.
Fritt-Rasmussen, J. (2010). In Situ Burning of Arctic Marine Oil Spills: Ignitability of Various
Oil Types Weathered at Different Ice Conditions. A combined laboratory and field study.
Dissertation for the degree philosophiae doctor (PhD) at the Technical University of Denmark.
DTU Civil Engineering Report R-229.
Fritt-Rasmussen, J and Brandvik, P. J. (2011). Measuring Ignitability for in Situ Burning of Oil
Spills Weathered Under Arctic Conditions: From Laboratory Studies to Large-Scale Field
Experiments, Marine Pollution Bulletin, 62: 1780-1795.
Fritt-Rasmussen, J.,, Brandvik, P.J., Villumsen, A. and Stenby, E.H. (2012). Comparing
ignitability for in situ burning of oil spills for an asphaltenic, a waxy and a light crude oil as a
function of weathering conditions under arctic conditions, Cold Regions Science and
Technology, 72, 2012: 1-6.
Fritt-Rasmussen, J. & Norut, C. P. (2017). Literature review report of oil in ice. Report D 4.1.
of the project GRACE (Integrated oil spill response actions and environmental effects).
ITOPF, (2012). Use of dispersants to treat oil spills. Technical Information Papers.
JIP, Arctic Oil Spill Response Technology Joint Industry Programme (2014). Environmental
Impacts of Arctic Oil Spills and Arctic Spill Response Technologies Literature Review and
Recommendations.
JIP, Arctic Oil Spill Response Technology Joint Industry Programme (2017). SYNTHESIS
REPORT, Series of advanced research projects and reports on: dispersants, environmental
effects, trajectory modelling, remote sensing, mechanical recovery and in situ burning.
Haapala, J., Lönnroth, N., and Stössel, A. (2005). A numerical study of open water formation
in sea ice. J. Geophys. Res. 110: C09011. doi: 10.1029/2003JC002200.

Recommendations for best technological and operational practices for oil spill response in the NPA region APP4SEA
73
Hamdan, L.J. and Fulmer ,P.A. (2011). Effects of COREXIT® EC9500A on bacteria from a
beach oiled by the Deepwater Horizon spill. Aquat Microb Ecol 63:101-109.
https://doi.org/10.3354/ame01482.
Hemmer, M.J., Barron, M.G. and Greene, R.M. (2010). Comparative Toxicity of Louisiana
Sweet Crude Oil (LSC) and Chemically Dispersed LSC to Two Gulf of Mexico Aquatic Test
Species, U.S. Environmental Protection Agency Office of Research and Development.
Hemmer M.J., Barron M.G., and Greene R.M. (2011). Comparative Toxicity Of Eight Oil Spill
Dispersants, Louisiana Sweet Crude Oil (LSC), And Chemically Dispersed LSC To Two
Aquatic Test Species. Environmental Science & Technology. 30(10): 2244-2252.
IPIECA-IOGP (2015). Response strategy development using net environmental benefit
analysis (NEBA). Good practice guidelines for incident management and emergency
personnel. IOGP report 527.
Ivchenko, A. (2013a). Oil Spill Risk Tool (version 2.0 for Baltic). User’s manual. State
Oceanographic Institute, Moscow, RF. 8 p.
Ivchenko, A. (2013b). SpillMod, version 2.1 – Baltic Sea. User's guide. State Oceanographic
Institute, Moscow, RF. 30 p.
Jong, de, K. (2004). A Comparison of Four Particle Models. CALPREA-project. RIKZ/OS-
2004.121w.
Korotenko, K.A., Mamedov, R.M. and Mooers, C.N.K. (2000). Prediction of the dispersal of oil
transport in the Caspian Sea resulting from a continuous release. Spill Science and
Technology Bulletin 6: 323-339.
Korotenko, K.A., Mamedov, R.M. and Mooers, C.N.K. (2002). Prediction of the Transport and
Dispersal of Oil in the South Caspian Sea Resulting from Blowouts. Environmental Fluid
Mechanics 1: 383–414.
Korotenko, K.A., Mamedov, R.M., Kontar, A.E. and Korotenko, L.A. (2004). Particle tracking
method in the approach for prediction of oil slick transport in the sea: modelling oil pollution
resulting from river input. Journal of Marine Systems 48: 159– 170.
Recommendations for best technological and operational practices for oil spill response in the NPA region APP4SEA
74
Kulawiak, M., Chybicki, A. and Moszynski, M. (2010). Web-Based GIS as a Tool for Supporting
Marine Research. Marine Geodesy 33: 135 — 153.
Laine, V., et al. (2018). Baltic Sea case study – A Practical Demonstration on the use of Open
Risk Guideline. Baltic Sea Environment Proceedings No 165.
Leendert Vergeynst, Susse Wegeberg, Jens Aamand, Pia Lassen, Ulrich Gosewinkel, Janne
Fritt-Rasmussen, Kim Gustavson, Anders Mosbech 2018. Biodegradation of marine oil spills
in the Arctic with a Greenland perspective, Science of The Total Environment,Volume 626,
Pages 1243-1258, https://www.sciencedirect.com/science/article/pii/S0048969718302110 .
Lewis, A. and Daling, P.S. (2007). Oil in Ice - JIP – A Review of Studies of Oil Spill Dispersant
Effectiveness in Arctic Conditions. SINTEF.
Liungman, O. and Mattsson, J. (2011). Scientific Documentation of Seatrack Web; physical
processes, algorithms and references. 32 p.
Luyten, P.J., Jones, J.E., Proctor, R., Tabor, A., Tett P. and Wild-Allen, K. (1999). COHERENS
— A coupled hydrodynamical-ecological model for regional and shelf seas: User
Documentation. MUMM Report, Management Unit of the Mathematical Models of the North
Sea, Belgium, 911 p.
Mabile, N. (2012). Controlled In Situ Burning: Transition from Alternative Technology to
Conventional Spill Response Option. In: Proceedings of the 33rd Arctic and Marine Oil Spill
Program (AMOP) Technical Seminar. Environment Canada, Ottawa, ON, Canada, 584 p.
Martinsen, E. A., Melsom, A., Sveen, V., Grong, E., Reistad, M., Halvorsen, N., Johansen, Ø.
and Skognes, K. (1994). The operational oil drift system at DNMI., Norwegian Meteorological
Institute, Oslo, Norway, 125, 52, 1994. Molitor, E. (2006). Miljöfarliga transporter till sjöss.
Kartläggning och riskanalys. Uppsala University.
McFarlin, K. M., Prince, R. C., Perkins, R., and Leigh, M. B. (2014). Biodegradation of
dispersed oil in arctic seawater at -1C. PLOS One 9:e84297.

Recommendations for best technological and operational practices for oil spill response in the NPA region APP4SEA
75
Murawski, J. and Nielsen, J.W. (2013). Applications of an oil drift and fate model for fairway
design. Ch. 11 in: Soomere, T. and Quak, E. (eds.), Preventive methods for coastal protection,
Springer International publishing, Switzerland.
Mårtensson, S., Meier, H.E.M., Pemberton, P., and Haapala, J. (2012). Ridged sea ice
characteristics in the Arctic from a coupled multicategory sea ice model. J. Geophys. Res.
117: C00D15. doi: 10.1029/2010JC006936.
NOAA (2002). GNOME User’s Manual. 91 p.
NOAA (2012). General NOAA Operational Modeling Environment (GNOME) Technical
Documentation. NOAA Technical Memorandum NOS OR&R 40. 101 p.
Nordvik, A (1995) The Technology Windows-of-Opportunity for Marine Oil Spill Response as
Related to Oil Weathering and Operations, Spill Science and Technology Bulletin, Vol. 2, No.
1: 17-46.
Nordvik, A.B., Champ, M.A. and Bitting, K.R. (2003). Estimating Time Windows for Burning
Oil at Sea: Processes and Factors, Spill Science & Technology Bulletin, Vol. 8, No. 4: 347-
359.
NRC (2005). Oil Spill Dispersants - Efficacy and Effects. National Research Council, The
National Academies Press, Washington, USA.
NRC (2014). Responding to Oil Spills in the U.S. Arctic Marine Environment. Washington, DC:
National Academies Press. USA.
Ólason, E., Bouillon, S., and Rampal, P. (2016). Sea ice model developments in view of oil
spill forecasting. ART JIP Oil Spill Trajectory Modeling Programme. NERSC Technical
Report, Bergen, Norway. http://www.arcticresponsetechnology.org/wp-
content/uploads/2016/06/Trajectory-Modelling-Report-Final.pdf .
Ovsienko, S. (2002). An updated assessment of the risk for oil spills in the Baltic Sea area. 77
p.
Owens C.K. and Belore R.S. (2004). Dispersant Effectiveness Testing in Cold Water and
Brash Ice. AMOP Proceedings. 35(35): 819-839.
Recommendations for best technological and operational practices for oil spill response in the NPA region APP4SEA
76
Prince, R.C. (2015). Oil spill dispersants: boon or bane? Environ Sci. Technol. 2015 Jun
2;49(11):6376-84. doi: 10.1021/acs.est.5b00961.
Puestow, T. et al (2013). OIL SPILL DETECTION AND MAPPING IN LOW VISIBILITY AND
ICE: SURFACE REMOTE SENSING. FINAL REPORT 5.1 Report from Joint Industry
Programme to define the state-of-the-art for surface remote sensing technologies to monitor
oil under varying conditions of ice and visibility. Arctic Oil Spill Response Technology – Joint
Industry Programme. 84 p.
Rees, M. (2017). European Maritime Safety Agency Selects TEKEVER AR5 UAS.
http://www.unmannedsystemstechnology.com/2017/06/european-maritime-safety-agency-
selects-tekever-ar5-uas/ .
Rytkönen, J. (2018). Data stream synergy from in situ oil spill detection and monitoring,
combined with satellite data. GRACE project’s Consortium meeting in Nuuk, Greenland. 29.-
31.5.2018. 18 slides.
Rytkönen, J., Pärts, S. & Kouts, T. (2018). Data stream synergy from in-situ oil spill detection
and monitoring combined with satellite data. Project GRACE, Deliverable D 1.9., 54 p.
SMHI (2012). Manual, Seatrack Web. A user-friendly system for forecasts and backtracking
of drift and spreading of oil, chemicals and substances in water. 30 p.
Smith, R.A., Slack, J.R., Wyant, T. and Lanfear, K.J. (1982). The Oil spill risk analysis model
of the U.S. Geological Survey. U.S.G.S. Professional Paper 127. 44 p.
Stanovoy, V.V., Eremina, T.R., Isaev, A.V., Neelov, I.A., Vankevich, R.E. and Ryabchenko,
V.A. (2012). Modeling of Oil Spills in Ice Conditions in the Gulf of Finland on the Basis of an
Operative Forecasting System. Oceanology 52: 754–759.
Tegeback, A. and Hasselström, L. (2012). Costs associated with a major oil spill in the Baltic
Sea. BalticMaster project report. Available at:
www.balticmaster.org/media/files/general_files_1200.pdf

Recommendations for best technological and operational practices for oil spill response in the NPA region APP4SEA
77
Watkins, R., et al. (2016). REMOTE SENSING GUIDE TO OIL SPILL DETECTION IN ICE-
COVERED WATERS. Technical Report of the Arctic Oil Spill Response Technology – Joint
Industry Programme. 34 Pp.
Watts, K. (2004). A Determination of Oil Persistence. A Historical Perspective. Conference
paper made by Barbara Davis, Dagmar Etkin and Mark Landry. Freshwater Spills
Symposium. New Orleans, April 7. 2004. 18 slides.
Wegeberg, S., Johnsen, A., Aamand, J., Lassen, P., Gosewinkel, U., Fritt-Rasmussen, J.,
Rigét, F., Gustavson, K. & Mosbech, A. (2018). Arctic marine potential of microbial oil
degradation. Aarhus University, DCE – Danish Centre for Environment and Energy, 54
pp. Scientific Report from DCE – Danish Centre for Environment and Energy No. 271
http://dce2.au.dk/pub/SR271.pdf
Westerberg V. (2012). Arctic Oil Spill Response. Recovery operations - Management and
Performance. M.Sc. Thesis work at SSPA. 2012.
Wettre, C., Johansen, Ø., and Skognes, K. (2001). Development of a 3-dimensional oil drift
model at DNMI, Norwegian Meteorological Institute, Oslo, Norway, 50, 2001.
Wise, J. and Wise, J.P. Sr. (2011). A review of the toxicity of chemical dispersants. Rev
Environ Health. 2011;26(4):281-300.
Xia, W., Li, J., Zheng, X., Zhao, J., Liu, A., Tang, C., et al. (2009). Influence of Environmental
Factors on Biodegradation of Dispersed Diesel Oil in Seawater. Environmental Forensics,
354-358.


