
How good are the second generation reanalysis datasets? Presented at ASES July 8, 2014 by Gwendalyn Bender Co-authors: William Gustafson, Louise Leahy P.hD, and Mark Stoelinga P.hD

Page Internal use © Vaisala
Agenda
§ Solar Resource Assessment Options § What are Reanalysis Datasets? § Comparison of Datasets
§ Reanalysis vs Satellite § Long-term Bias Adjustment
§ Applications
07/08/2014 2
Page Internal use © Vaisala
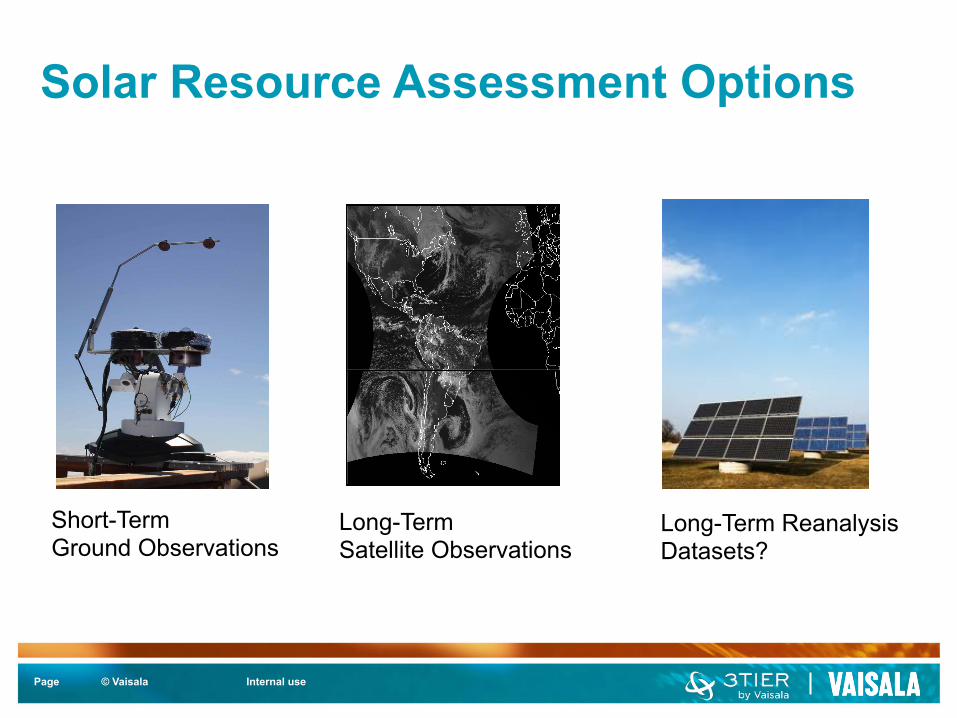
Solar Resource Assessment Options
Short-Term Ground Observations
Long-Term Satellite Observations
Long-Term Reanalysis Datasets?

Page Internal use © Vaisala
Why bother with long-term data if you have a year of ground-based observations?
4% above long-term mean
7% below long-term mean

Page Internal use © Vaisala
The Question
§ Could we use the second generation of reanalysis datasets for solar resource assessment?
5

Page Internal use © Vaisala
Reanalysis Datasets – What are they? § A global, gridded, 3-dimensional description of all weather
variables at sub-daily time resolution over a period of several decades.
§ It is produced by feeding all available observations (ground and satellite) into a data assimilation (DA) system, which uses a global numerical weather prediction model to “fill in the gaps” while retaining fidelity to the available observations.
§ The modeling and DA are performed consistently over the entire period of record, to ensure that at least the DA method does not introduce discontinuities in the data.

Page Internal use © Vaisala
Reanalysis Dataset Assessments
Cons § While they provide
parameters that can be used to derive GHI they can not be directly used to derive DNI or Diffuse information
§ Historically known for not resolving clouds well enough for solar resource assessment (Perez et al., 2013)
§ Their focus is on non-solar applications
Pros § Globally consistent in
methodology, resolution, time steps and parameters provided
§ Updated regularly. Consistently produced back to 1979
§ Solar resource and weather data derived from the same source
§ Can be used as a site specific time series or to generate large scale maps (including anomaly maps)

Page Internal use © Vaisala
A brief history of reanalysis data sets § First-Generation:
§ NCAR/NCEP Reanalysis Project (NNRP) § Produced in mid 1990s with a coarse resolution of underlying model (2.5
deg) and goes back to 1948. Updated within a few days. Older DA system. § Nevertheless, NNRP has been a workhorse! § Other follow-up data sets, with slight improvements: ERA-15, ERA-40,
JRA-25, R2
§ Second-Generation: § CFSR (NOAA / National Weather Service / NCEP) § ERA-Interim (European Centre for Med. Range Weather Forecasts) § MERRA (NASA) § Produced in mid to late 2000s with a 34-year record with a high-resolution
of the underlying model (~0.5 degree). Updated DA system. Updates lag a few weeks.
§ More output variables, vertical levels, and temporal frequency

Page Internal use © Vaisala
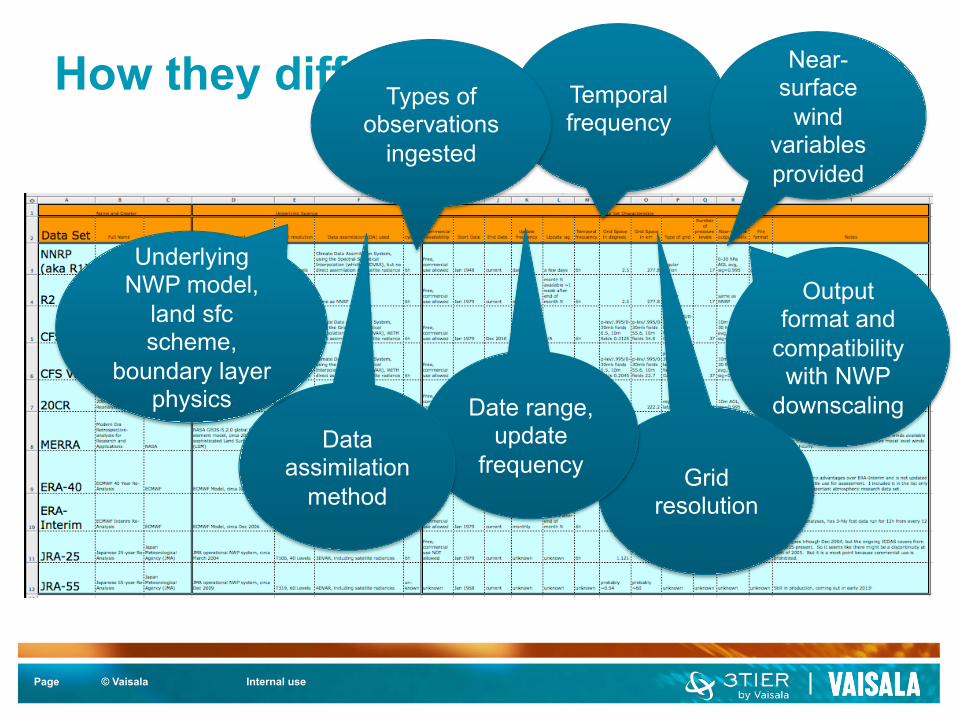
How they differ:
Page Internal use © Vaisala
How they differ:
Output format and
compatibility with NWP
downscaling
Temporal frequency
Grid resolution
Near-surface
wind variables provided
Date range, update
frequency
Types of observations
ingested
Data assimilation
method
Underlying NWP model,
land sfc scheme,
boundary layer physics

Page Internal use © Vaisala
How they differ:

Page Internal use © Vaisala
The Set-up…. § Used the “short wave down welling” fields from the MERRA and
ERA-I reanalysis datasets § This is not exactly the same as but can be used as a substitute for
Global Horizontal Irradiance (GHI) § Didn’t use NNRP because the first generation data is already known to
be insufficient for solar resource assessment § Didn’t use CFSR because the change in methodology in 2011 reduces
its usefulness as a long-term record § Interpolated to hourly time series from ~6hr for the purposes of this study
§ Used the GHI values from the satellite derived 3TIER Services global solar dataset
§ Compared all 3 datasets to actual ground station observations of GHI at ~165 stations globally distributed
§ Some variation in number of stations based on overlap in years available
12

Page Internal use © Vaisala
…The Results for 3TIER Satellite Data
13
Out of 163 stations: Mean Bias Error in W/m2 is 4.19, Mean Bias Error in Percent is 2.05%

Page Internal use © Vaisala
…The Results for ERA-I
14
Out of 140 stations: Mean Bias Error in W/m2 is -24.93, Mean Bias Error in Percent is -12.81%

Page Internal use © Vaisala
…The Results for MERRA
15
Out of 165 stations: Mean Bias Error in W/m2 is 18.49, Mean Bias Error in Percent is 9.33%

Page Internal use © Vaisala
The Question § Can we use a correction to ground observations to adjust for
the reanalysis data’s inability to resolve clouds properly?
§ Why bother? § A solar project is a 20+ year investment and currently even the
best satellite records have only ~15 years of historical data available
§ If we can have confidence in a bias corrected time series based on reanalysis data we would have a 30+ year record to make our energy estimates from.
§ The satellite algorithms currently in use don’t always resolve all climates equally well, notably desert environments are challenging. Having another option could be useful.
16

Page Internal use © Vaisala
Long-term Data + Short-term Observations
Cons § Algorithm for correcting the
satellite record to the ground observations must have skill but not over fit
§ Corrections will only be as accurate as the ground station data
§ Limited distances between project site and and observational site can be used
Pros § Ground station observations
can be used to improve the accuracy of the long-term data
§ Puts the short-term observations into the context of over a decade of resource data
§ Accepted, and sometimes required, methodology for finance providers

Page Internal use © Vaisala
The Set-up…. § At 5 sample sites we have multiple years of high quality publicly
available GHI observations § Sites chosen represent a variety of climates, some of which the satellite data
does well in and some that provide challenges § Using Model Output Statistics (MOS)* as the method for bias correction
we § Used 1 year of the observational data for training and compared the results to
the ~2 years outside the training period not used in the correction process § Corrected the satellite data as a baseline for what we were trying to achieve § Corrected the MERRA data as it had performed the best previously
§ All results shown in the next slides are for the years outside the training period
18
* For more detail on MOS corrections see: “Evaluation of Procedures to Improve Solar Resource Assessments” from ASES proceedings 2012

Page Internal use © Vaisala
…The Results for Sde Boker, Israel
19
Satellite Data MERRA Data
Raw MOS-Corrected Raw MOS-
Corrected Daily
Correlation 0.97 0.97 0.94 0.94
RMS (W m-2) 30.43 25.62 40.57 38.32
Monthly
Correlation 0.99 0.99 0.99 0.99
RMS (W m-2) 17.81 7.74 17.56 11.5
Global Horizontal Irradiance
1 2 3 4 5 6 7 8 9 10 11 12 1 2 3 4 5 6 7 8 9 10 11 12
Month2008 2009
240280320360400440480520560600640680720
W/m
2
GroundMOS−corrected MERRAMOS−corrected Satellite

Page Internal use © Vaisala
…The Results for Desert Rock, USA
20
Satellite Data MERRA Data
Raw MOS-Corrected Raw MOS-
Corrected Daily
Correlation 0.98 0.99 0.93 0.92
RMS (W m-2) 32.43 25.59 55.07 53.54
Monthly
Correlation 0.99 1 0.99 0.99
RMS (W m-2) 20.91 12.22 24.54 17.85
Global Horizontal Irradiance
1 2 3 4 5 6 7 8 9 10 11 12 1 2 3 4 5 6 7 8 9 10 11 12
Month2010 2011
160200240280320360400440480520560600640680720
W/m
2
GroundMOS−corrected MERRAMOS−corrected Satellite

Page Internal use © Vaisala
…The Results for Solar Village, Saudi Arabia
21
Global Horizontal Irradiance
1 2 3 4 5 6 7 8 9 10 11 12 1 2 3 4 5 6 7 8 9 10 11 12
Month2000 2001
280320360400440480520560600640680720
W/m
2
GroundMOS−corrected MERRAMOS−corrected Satellite
Satellite Data MERRA Data
Raw MOS-Corrected Raw MOS-
Corrected Daily
Correlation 0.94 0.95 0.86 0.83
RMS (W m-2)
36.88 33.11 51.35 55.30
Monthly
Correlation 0.97 0.97 0.95 0.94
RMS (W m-2) 24.88 21.54 23.44 28.64
Page Internal use © Vaisala
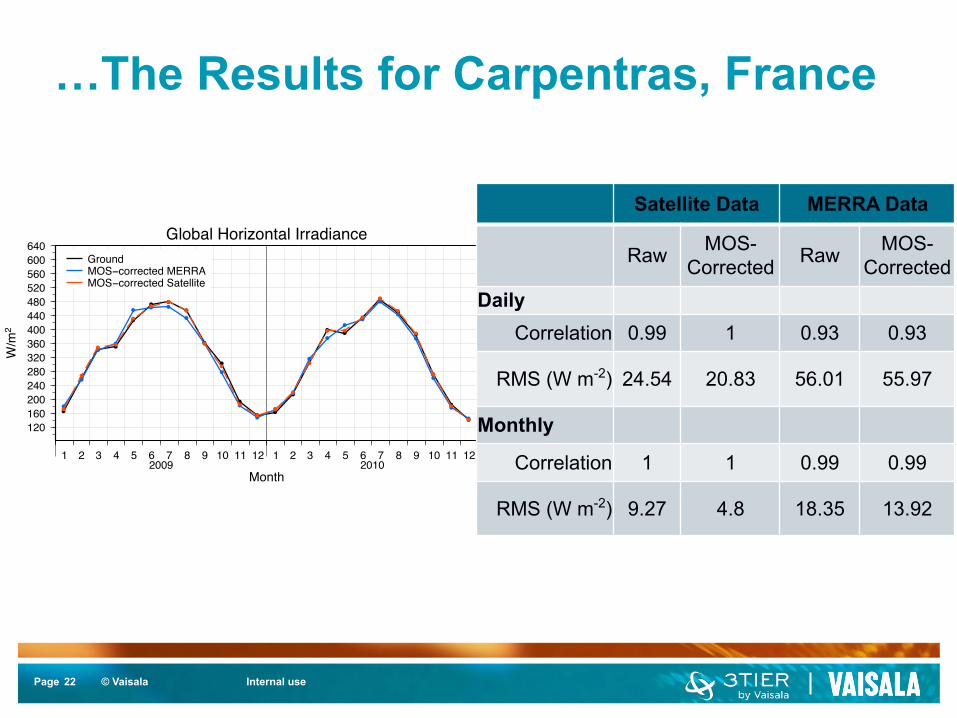
…The Results for Carpentras, France
22
Global Horizontal Irradiance
1 2 3 4 5 6 7 8 9 10 11 12 1 2 3 4 5 6 7 8 9 10 11 12
Month2009 2010
120160200240280320360400440480520560600640
W/m
2
GroundMOS−corrected MERRAMOS−corrected Satellite
Satellite Data MERRA Data
Raw MOS-Corrected Raw MOS-
Corrected Daily
Correlation 0.99 1 0.93 0.93
RMS (W m-2) 24.54 20.83 56.01 55.97
Monthly
Correlation 1 1 0.99 0.99
RMS (W m-2) 9.27 4.8 18.35 13.92

Page Internal use © Vaisala
…The Results for Takamtsu, Japan
23
Satellite Data MERRA Data
Raw MOS-Corrected Raw MOS-
Corrected Daily
Correlation 0.97 0.98 0.81 0.80
RMS (W m-2) 37.68 28.40 91.68 77.81
Monthly
Correlation 0.99 1 0.96 0.94
RMS (W m-2) 22.61 8.35 54.22 22.31
Global Horizontal Irradiance
1 2 3 4 5 6 7 8 9 10 11 12 1 2 3 4 5 6 7 8 9 10 11 12
Month2011 2012
160200240280320360400440480520
W/m
2
GroundMOS−corrected MERRAMOS−corrected Satellite

Page Internal use © Vaisala
Conclusions § In cloudy locations one year of training data is insufficient to make
up for the reanalysis data not being able to resolve cloud cover well (see Takamatsu Japan results)
§ In typically sunny locations the reanalysis data shows promise with a year of correction but does not meet or improve upon what we can already do with satellite data (see Sde Boker Israel results)
§ More work could be done in the pursuit of a record extension to investigate better ways to improve the reanalysis data + correction results. Such as:
§ Correcting with long-term satellite data § Using more variables derived from the reanalysis data to seed the MOS
algorithm
24

Page Internal use © Vaisala
Questions?
§ For follow up questions email: § Gwen Bender [email protected]
– LinkedIn: www.linkedin.com/pub/gwen-bender/0/498/57b/ – Twitter: @GwendalynBender
Or: § Bill Gustafson [email protected]
– LinkedIn: www.linkedin.com/pub/william-gustafson/7/b27/898 § Louise Leahy [email protected]
– LinkedIn: www.linkedin.com/pub/louise-leahy/27/496/a66 § Mark Stoelinga [email protected]
– LinkedIn: www.linkedin.com/pub/mark-stoelinga/36/b45/45a
25


