International Journal of Latest Engineering and Management Research (IJLEMR)
ISSN: 2455-4847
www.ijlemr.com || REETA-2K16 ǁ PP. 330-346
www.ijlemr.com 330 | Page
Reactive power optimization and voltage control in Distribution
System using particle swarm optimization
R. Rajesh PG Student [PS], Dept. of EEE,
SITS, Kadapa,
Andhra Pradesh, India.
Abstract: The renewable policies in various countries are driving significant growth of grid connected
renewable generation sources such as Solar Photovoltaic (PV), wind, biomass, Fuel Cell (FC), or microturbines.
Among all the proportion of photovoltaic (PV) generation into existing power system generation mix has
significantly increased in recent times. Most of the PV plants are getting connected to low/medium voltage
distribution level as distributed generation (DG). The uptake of an intermittent power from the PVs is
challenging the power system operation and control. The network voltage control is one of the major challenges
during the operation of the distribution connected PVs. The active power injection from a PV plant causes
variable voltage rise. This forces the existing voltage control devices such as on-load tap-changer (OLTC) and
voltage regulator (VR) to operate continuously. The consequence is the reduction of the operating life of the
voltage control mechanism. Also, the conventional non-coordinated reactive power control results in the
operation of the VR at its control limit (VR runaway condition). But the existing methods are does not consider
detailed impact of DG such as PV on autonomous local control setting of voltage regulator. This paper proposes
a new technique for voltage regulation of a radial medium (MV) distribution system in presence of distribution
generation (DG) units. The proposed technique consists of the coordinated actions of on-load tap changer
(OLTC) of transformer and reactive power coordination in the distribution network by the impact of PV
generation. Simulation results reveal that the proposed control method is capable of maintaining the system
voltage within the permitted range.
Keywords: Distribution system, Photovoltaics, on-load tap changer, volatage regulator, reactive power
coordination.
I. INTRODUCTION Solar photovoltaic distributed generation (PV-DG) systems are one of the fastest-growing types of
renewable energy sources being integrated worldwide onto distribution systems.The cumulative global capacity
of PV generation is expected to grow up to 200GWp by the year 2017. The cumulative global installed capacity
is approximately 137GW, till the end of 2013. PV plants are integrated both at the transmission level and the
distribution level from the power system integration point of view.Most of the PV plants are getting connected
to low/medium voltage distribution level as distributed generation (DG). However, PV-DG impacts on
distribution systems can be either steady-state or dynamic in nature, and they include:
Changes in feeder voltage profiles, including voltage rise and unbalance.
Changes in feeder loading, including potential equip-ment and component overload.
Frequent operation of voltage-control and regulation devices, such as load tap changers (LTCs), line
voltage regulators (VRs), and capacitor banks
Reactive-power flow fluctuations due to operation of switched capacitor banks
Overvoltage issues can allow the DGs to absorb reactive power
Power quality, PV-DG intermittency may lead to voltage fluctuation issues.
The severity of these impacts varies with the penetration level, the location of the PV-DG, and the
electrical characteristics of the distribution systems. For instance, a high PV-DG penetration level could cause a
feeder to become an active circuit and inject power back to the transmission system. This high penetration
condition may affect voltage profiles, over current protection, and capacitor-bank operation. Such a situation
may occur on feeders selected for integrating multiple utility-scale PV-DG plants. Because both PV-DG output
and feeder load vary throughout the day, it is necessary to investigate impacts for different degrees of
penetration of PV-DG and also to assess the effects under various conditions of feeder loading. The injection of
PV generator active power impacts the operation of OLTCS and VRs. Present day voltage control practices do
not consider detailed impacts of PVs on these voltage control mechanisms.
International Journal of Latest Engineering and Management Research (IJLEMR)
ISSN: 2455-4847
www.ijlemr.com || REETA-2K16 ǁ PP. 330-346
www.ijlemr.com 331 | Page
This paper presents the detailed analysis of the impact PV on OLTCs and VRs and reactive power
coordination. Various voltage regulation strategies to tackle the possible adverse impact of PVs are also
developed.
II. PV GRID INTEGRATION STANDARDS AND GENERATION MODELING The capacity of a PV plant determines the voltage level at which it should be integrated. The PV
generation is getting integrated mostly at the low voltage and the medium voltage distribution level. The grid
integration standards are evolving in various countries in order to achieve a seamless integration. The PV plants
need to comply with the various technical requirements prescribed in a grid integration standard. The set of
technical requirements depend upon the voltage level at which the PV plant is getting integrated. The power
system operators in different countries have developed the country specific guidelines in the integration
standards. The major low voltage and medium voltage standards reviewed here are as follows.
IEC61727-Photovoltaic systems characteristics of the utility interface
IEEE1547-Standard for interconnecting distributed resources with electricpower systems
VDEARN4105-Technical requirements for the connection to and parallel operation with LV distribution
networks (Germany)
BDEW-Technical Guideline for generating plants connected to the MV network (Germany)
G83-Recommendations for the connection of type tested small-scale embedded generators (up to 16A per
phase) in parallel with LV distribution systems (UK)
The aim of reviewing the guidelines is to study the network operator’s expectations from the PV inverters. The
existing standards try to address some of the grid integration challenges. The technical requirements in the
standards can be categorized into three broad areas, the protection set points, the power quality limits and the
grid support functions. This is discussed in upcoming sections in detail.
A.Protection Settings
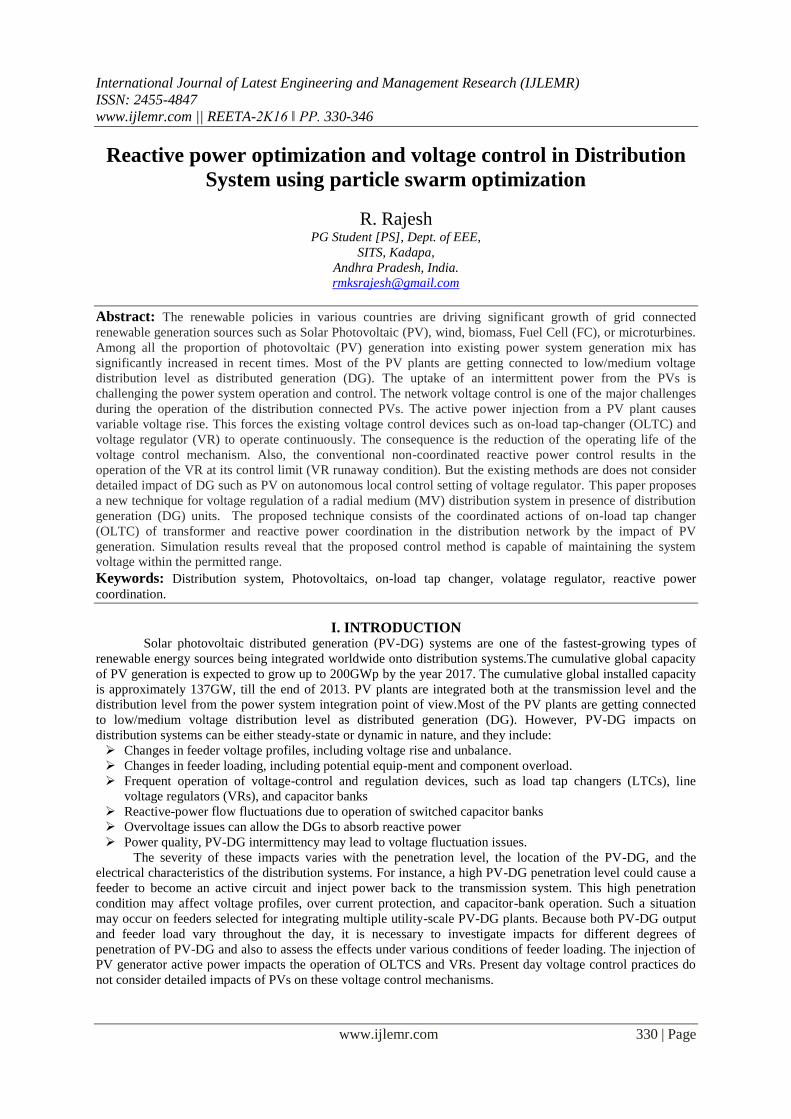
There are two kinds of PV generation protection settings. There are the PV plant settings, which protect
a PV generator itself from abnormal operating conditions. The other kind of protection settings mitigate the
impact of a PV plant on a utility network during abnormal power system conditions. The grid integration
standards mostly specify the requirements which mitigate the impact on a utility network.
Fig.1. Typical PV generator protection
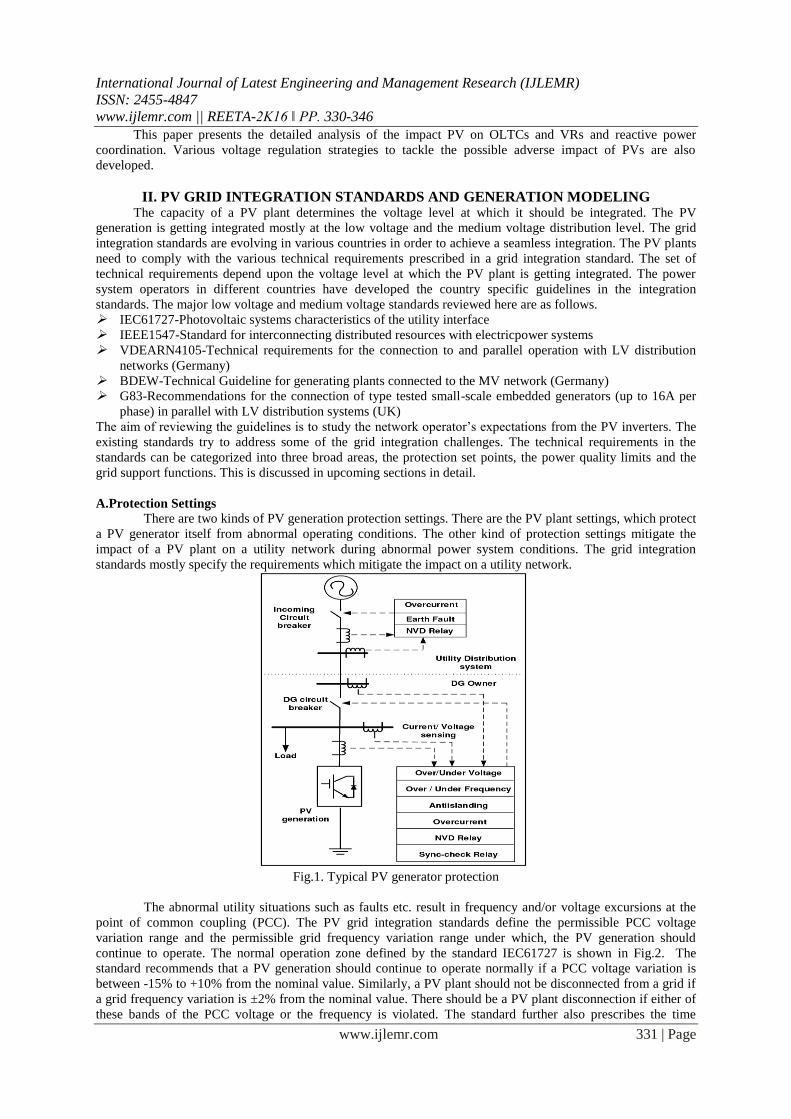
The abnormal utility situations such as faults etc. result in frequency and/or voltage excursions at the
point of common coupling (PCC). The PV grid integration standards define the permissible PCC voltage
variation range and the permissible grid frequency variation range under which, the PV generation should
continue to operate. The normal operation zone defined by the standard IEC61727 is shown in Fig.2. The
standard recommends that a PV generation should continue to operate normally if a PCC voltage variation is
between -15% to +10% from the nominal value. Similarly, a PV plant should not be disconnected from a grid if
a grid frequency variation is ±2% from the nominal value. There should be a PV plant disconnection if either of
these bands of the PCC voltage or the frequency is violated. The standard further also prescribes the time
International Journal of Latest Engineering and Management Research (IJLEMR)
ISSN: 2455-4847
www.ijlemr.com || REETA-2K16 ǁ PP. 330-346
www.ijlemr.com 332 | Page
interval within which disconnection of the PV plant should occur if the grid frequency or the PCC voltage
violation is detected.
Fig.2.Permissible PCC voltage and frequency variation
B.Power Quality Limits
The impact on the power quality due to an introduction of PV generation is mitigated by prescribing
limits in the grid codes. The standards prescribe the limits on the harmonic distortion, the unbalance and the
voltage flicker to mitigate the possible adverse impact due to PV generation.
C. Grid Support Features
The network operators are expecting increased participation from the PV generations into the grid
support operations. This is due to the vast growth of the PV generation units. The grid support features expected
from a PV generation are described in some of the standards. These can be subdivided into two major
categories, namely the dynamic grid support features and the steady state grid support features.
1) Dynamic grid support
This category of features includes the services provided by a PV generation duringsystem disturbance
events. The major services expected in various grid codes are the low voltage ride through, the fault reactive
current injection and the frequency support.
2) Steady state voltage support
The most pressing steady state operational challenge faced by the IEEE1547 distributionnetwork
operator is an intermittent overvoltage due to a PV plant. expects a PV plant to operate at a unity power factor.
The operation of a PV generation at an unity power factor means no contribution from a PV inverter towards the
reactive power or the voltage support functionality. The network operators are increasingly demanding a
contribution from PV generators towards a steady state voltage control functionality. The voltage support
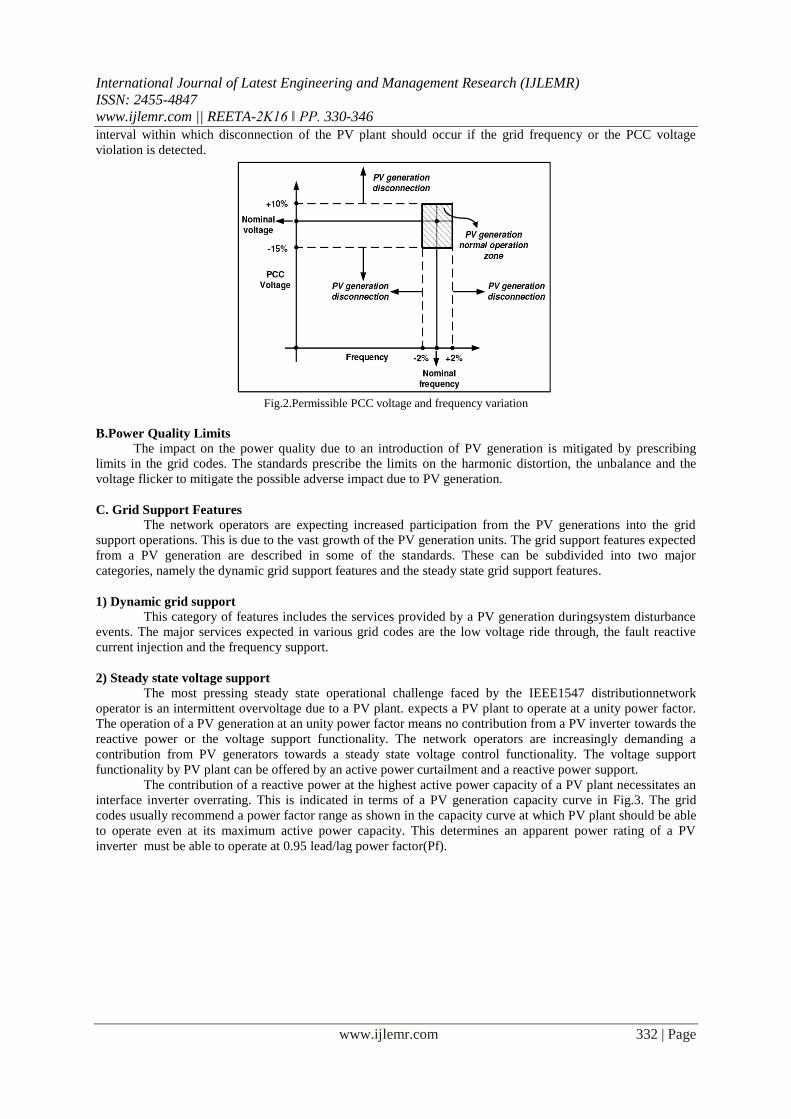
functionality by PV plant can be offered by an active power curtailment and a reactive power support.
The contribution of a reactive power at the highest active power capacity of a PV plant necessitates an
interface inverter overrating. This is indicated in terms of a PV generation capacity curve in Fig.3. The grid
codes usually recommend a power factor range as shown in the capacity curve at which PV plant should be able
to operate even at its maximum active power capacity. This determines an apparent power rating of a PV
inverter must be able to operate at 0.95 lead/lag power factor(Pf).
International Journal of Latest Engineering and Management Research (IJLEMR)
ISSN: 2455-4847
www.ijlemr.com || REETA-2K16 ǁ PP. 330-346
www.ijlemr.com 333 | Page
Fig.3.Solar generation capacity curve
The various LV and MV network standards both expect PV generation to offer a reactive power support as
requested by a network operator. Most of the standards expect a reactive power support through the following
different ways.
1 Constant power factor (Pf)
2 Constant reactive power (Q)
3 Variable power factor as active power varies ( Pf(P) characteristic )
4 Variable reactive power as voltage varies (Q(U) characteristic
The constant Pf mode and constant Q mode expect a PV plant to operate at a constant preset Pf or a
constant reactive power value when active power varies. However the other two modes of operational
characteristics Pf (P) and Q (U) adopt variable reactive power injections when active power or PV plant point of
common coupling voltage varies.
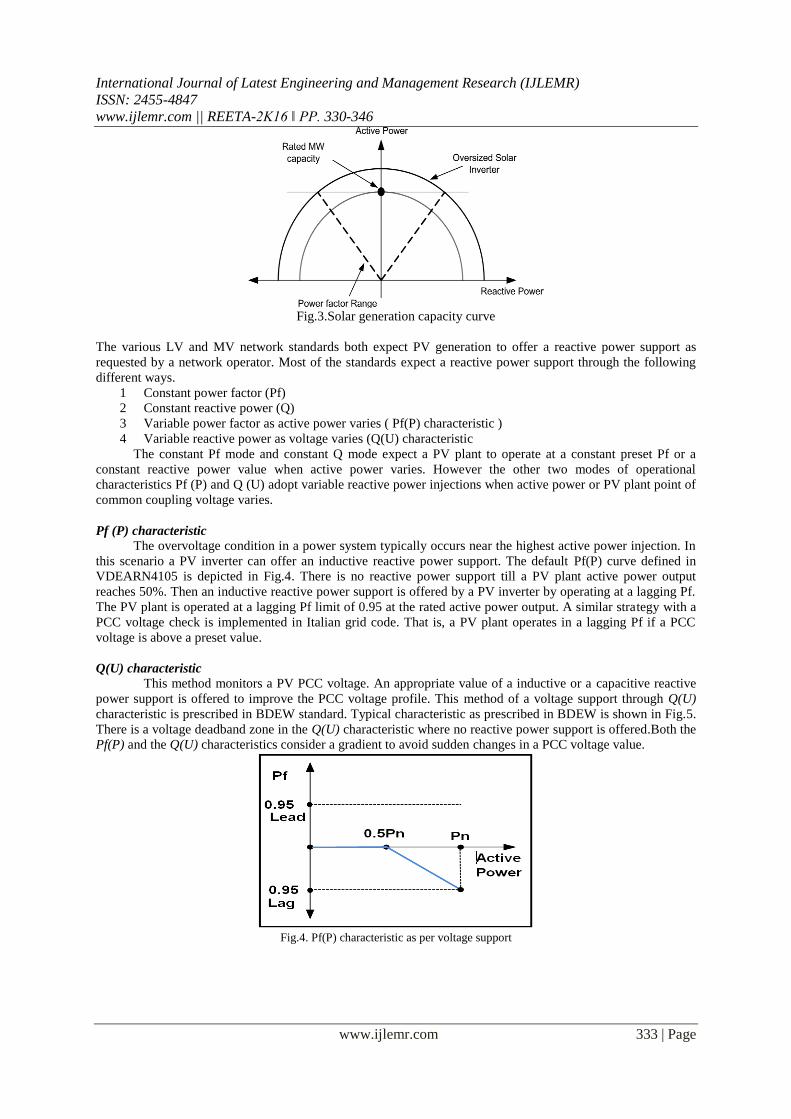
Pf (P) characteristic
The overvoltage condition in a power system typically occurs near the highest active power injection. In
this scenario a PV inverter can offer an inductive reactive power support. The default Pf(P) curve defined in
VDEARN4105 is depicted in Fig.4. There is no reactive power support till a PV plant active power output
reaches 50%. Then an inductive reactive power support is offered by a PV inverter by operating at a lagging Pf.
The PV plant is operated at a lagging Pf limit of 0.95 at the rated active power output. A similar strategy with a
PCC voltage check is implemented in Italian grid code. That is, a PV plant operates in a lagging Pf if a PCC
voltage is above a preset value.
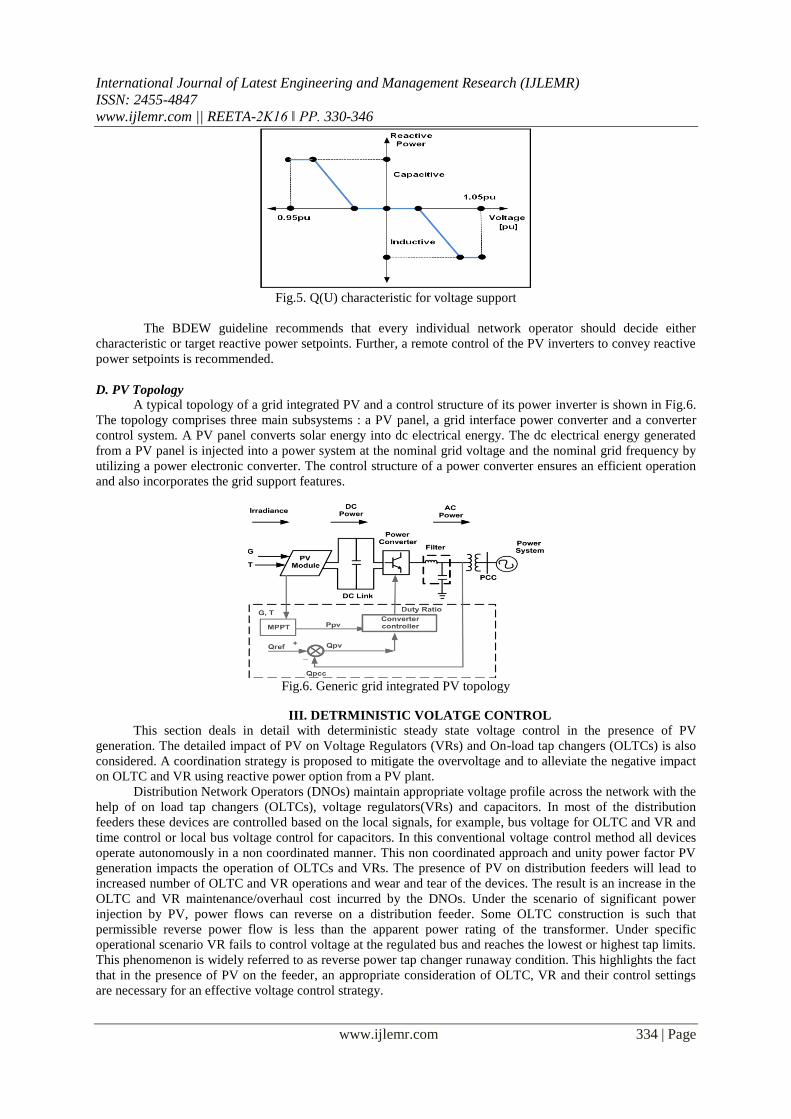
Q(U) characteristic
This method monitors a PV PCC voltage. An appropriate value of a inductive or a capacitive reactive
power support is offered to improve the PCC voltage profile. This method of a voltage support through Q(U)
characteristic is prescribed in BDEW standard. Typical characteristic as prescribed in BDEW is shown in Fig.5.
There is a voltage deadband zone in the Q(U) characteristic where no reactive power support is offered.Both the
Pf(P) and the Q(U) characteristics consider a gradient to avoid sudden changes in a PCC voltage value.
Fig.4. Pf(P) characteristic as per voltage support
International Journal of Latest Engineering and Management Research (IJLEMR)
ISSN: 2455-4847
www.ijlemr.com || REETA-2K16 ǁ PP. 330-346
www.ijlemr.com 334 | Page
Fig.5. Q(U) characteristic for voltage support
The BDEW guideline recommends that every individual network operator should decide either
characteristic or target reactive power setpoints. Further, a remote control of the PV inverters to convey reactive
power setpoints is recommended.
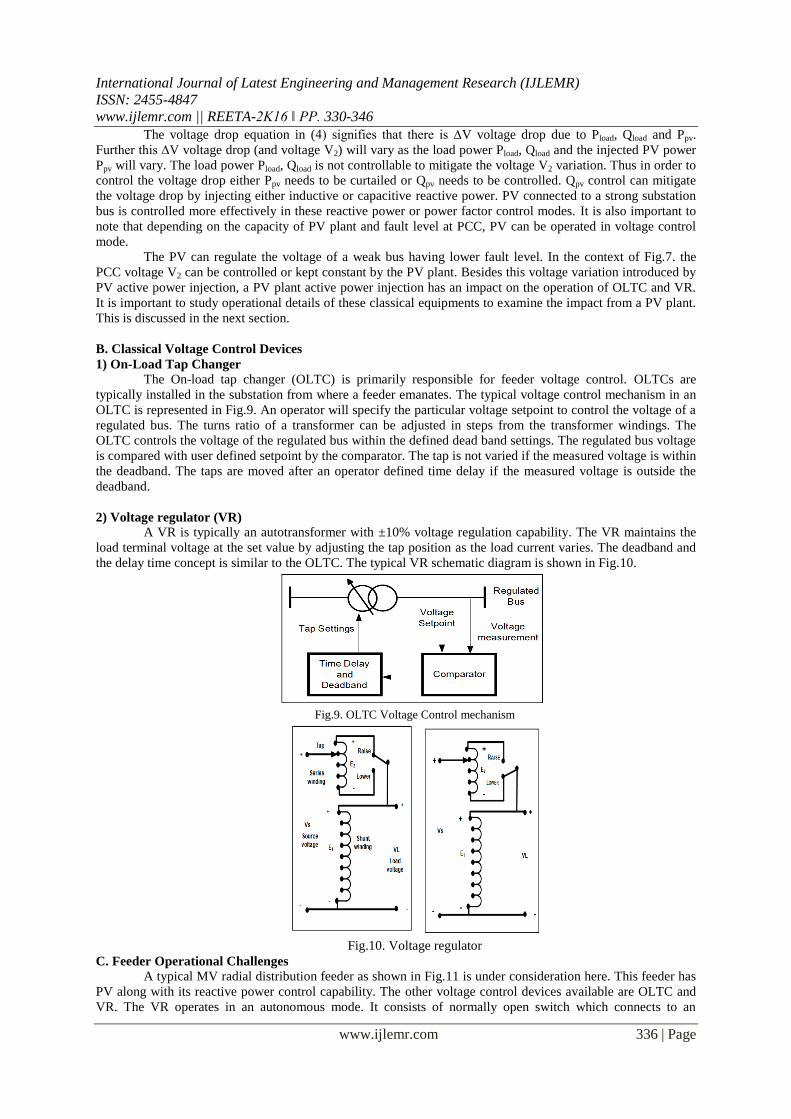
D. PV Topology
A typical topology of a grid integrated PV and a control structure of its power inverter is shown in Fig.6.
The topology comprises three main subsystems : a PV panel, a grid interface power converter and a converter
control system. A PV panel converts solar energy into dc electrical energy. The dc electrical energy generated
from a PV panel is injected into a power system at the nominal grid voltage and the nominal grid frequency by
utilizing a power electronic converter. The control structure of a power converter ensures an efficient operation
and also incorporates the grid support features.
Fig.6. Generic grid integrated PV topology
III. DETRMINISTIC VOLATGE CONTROL
This section deals in detail with deterministic steady state voltage control in the presence of PV
generation. The detailed impact of PV on Voltage Regulators (VRs) and On-load tap changers (OLTCs) is also
considered. A coordination strategy is proposed to mitigate the overvoltage and to alleviate the negative impact
on OLTC and VR using reactive power option from a PV plant.
Distribution Network Operators (DNOs) maintain appropriate voltage profile across the network with the
help of on load tap changers (OLTCs), voltage regulators(VRs) and capacitors. In most of the distribution
feeders these devices are controlled based on the local signals, for example, bus voltage for OLTC and VR and
time control or local bus voltage control for capacitors. In this conventional voltage control method all devices
operate autonomously in a non coordinated manner. This non coordinated approach and unity power factor PV
generation impacts the operation of OLTCs and VRs. The presence of PV on distribution feeders will lead to
increased number of OLTC and VR operations and wear and tear of the devices. The result is an increase in the
OLTC and VR maintenance/overhaul cost incurred by the DNOs. Under the scenario of significant power
injection by PV, power flows can reverse on a distribution feeder. Some OLTC construction is such that
permissible reverse power flow is less than the apparent power rating of the transformer. Under specific
operational scenario VR fails to control voltage at the regulated bus and reaches the lowest or highest tap limits.
This phenomenon is widely referred to as reverse power tap changer runaway condition. This highlights the fact
that in the presence of PV on the feeder, an appropriate consideration of OLTC, VR and their control settings
are necessary for an effective voltage control strategy.

International Journal of Latest Engineering and Management Research (IJLEMR)
ISSN: 2455-4847
www.ijlemr.com || REETA-2K16 ǁ PP. 330-346
www.ijlemr.com 335 | Page
Most of the recent approaches replace local autonomous control of the voltage control devices with
communication based supervisory control. voltage control devices are remotely dispatched on an hourly basis
through a communication channel to achieve flat voltage profile in the system without DG with Unity power
factor PV in distribution systems is considered. Further, two way communication based real time smart grid
Volt-Var control is proposed. Though the above mentioned schemes will certainly be able to alleviate the
challenges, they require communication with all voltage control devices.
Fig.7. PCC voltage control by PV plant
However the operation of VRs is still autonomous based on local signals, without communication links
on many distribution feeders. The switched capacitors also lack communication links on some feeders and timer
control is still operational in Europe. Considering this fact, a combined local and remote voltage control strategy
is discussed. It proposed that by opting for complete remote control of voltage control devices, they could lose
their ability to react to load changes. A local communication-less Volt-Var control in the presence of
synchronous machine based DG is considered.
Most of the available literatures does not consider detailed impact of DG such as PV on autonomous
local control setting of VR. It is also important to have an insight into what possible interaction a PV and its
reactive power settings will have with the autonomous operation of a VR. This chapter investigates these
challenges and proposes an optimal coordination strategy.
A. Radial Feeder Voltage Variation
Fig.7. is a simple equivalent circuit of a radial feeder. The feeder has a connected load and a PV
generator. The active/reactive power consumption by a load and the active power injection by a PV both will
cause a voltage drop on a feeder. This voltage drop can be mathematically derived as follows. In Fig.7. V1 is a
constant substation voltage. The vector diagram of the operation of feeder is shown in Fig.8.
Fig.8. Vector diagram of radial feeder
Current I flowing on the feeder can be calculated as:
PV generation MPPT active power is denoted by Ppv and reactive power output is Qpv. Load power is
denoted by Pload and Qload. R + jX represent impedance of the line. Let us denote ∆V as the voltage drop across
the feeder impedance R+j.X,
Substituting the eq.(4.1) in (4.2) :
The imaginary term in eq.(3) on the distribution feeders is typically very small and can be neglected.
Thus voltage drop ∆V on the feeder can be calculated as :
International Journal of Latest Engineering and Management Research (IJLEMR)
ISSN: 2455-4847
www.ijlemr.com || REETA-2K16 ǁ PP. 330-346
www.ijlemr.com 336 | Page
The voltage drop equation in (4) signifies that there is ∆V voltage drop due to Pload, Qload and Ppv.
Further this ∆V voltage drop (and voltage V2) will vary as the load power Pload, Qload and the injected PV power
Ppv will vary. The load power Pload, Qload is not controllable to mitigate the voltage V2 variation. Thus in order to
control the voltage drop either Ppv needs to be curtailed or Qpv needs to be controlled. Qpv control can mitigate
the voltage drop by injecting either inductive or capacitive reactive power. PV connected to a strong substation
bus is controlled more effectively in these reactive power or power factor control modes. It is also important to
note that depending on the capacity of PV plant and fault level at PCC, PV can be operated in voltage control
mode.
The PV can regulate the voltage of a weak bus having lower fault level. In the context of Fig.7. the
PCC voltage V2 can be controlled or kept constant by the PV plant. Besides this voltage variation introduced by
PV active power injection, a PV plant active power injection has an impact on the operation of OLTC and VR.
It is important to study operational details of these classical equipments to examine the impact from a PV plant.
This is discussed in the next section.
B. Classical Voltage Control Devices
1) On-Load Tap Changer
The On-load tap changer (OLTC) is primarily responsible for feeder voltage control. OLTCs are
typically installed in the substation from where a feeder emanates. The typical voltage control mechanism in an
OLTC is represented in Fig.9. An operator will specify the particular voltage setpoint to control the voltage of a
regulated bus. The turns ratio of a transformer can be adjusted in steps from the transformer windings. The
OLTC controls the voltage of the regulated bus within the defined dead band settings. The regulated bus voltage
is compared with user defined setpoint by the comparator. The tap is not varied if the measured voltage is within
the deadband. The taps are moved after an operator defined time delay if the measured voltage is outside the
deadband.
2) Voltage regulator (VR)
A VR is typically an autotransformer with ±10% voltage regulation capability. The VR maintains the
load terminal voltage at the set value by adjusting the tap position as the load current varies. The deadband and
the delay time concept is similar to the OLTC. The typical VR schematic diagram is shown in Fig.10.
Fig.9. OLTC Voltage Control mechanism
Fig.10. Voltage regulator
C. Feeder Operational Challenges
A typical MV radial distribution feeder as shown in Fig.11 is under consideration here. This feeder has
PV along with its reactive power control capability. The other voltage control devices available are OLTC and
VR. The VR operates in an autonomous mode. It consists of normally open switch which connects to an

International Journal of Latest Engineering and Management Research (IJLEMR)
ISSN: 2455-4847
www.ijlemr.com || REETA-2K16 ǁ PP. 330-346
www.ijlemr.com 337 | Page
alternate power feeding point. A grid integrated PV model is Fig.6. The converter control achieves the best
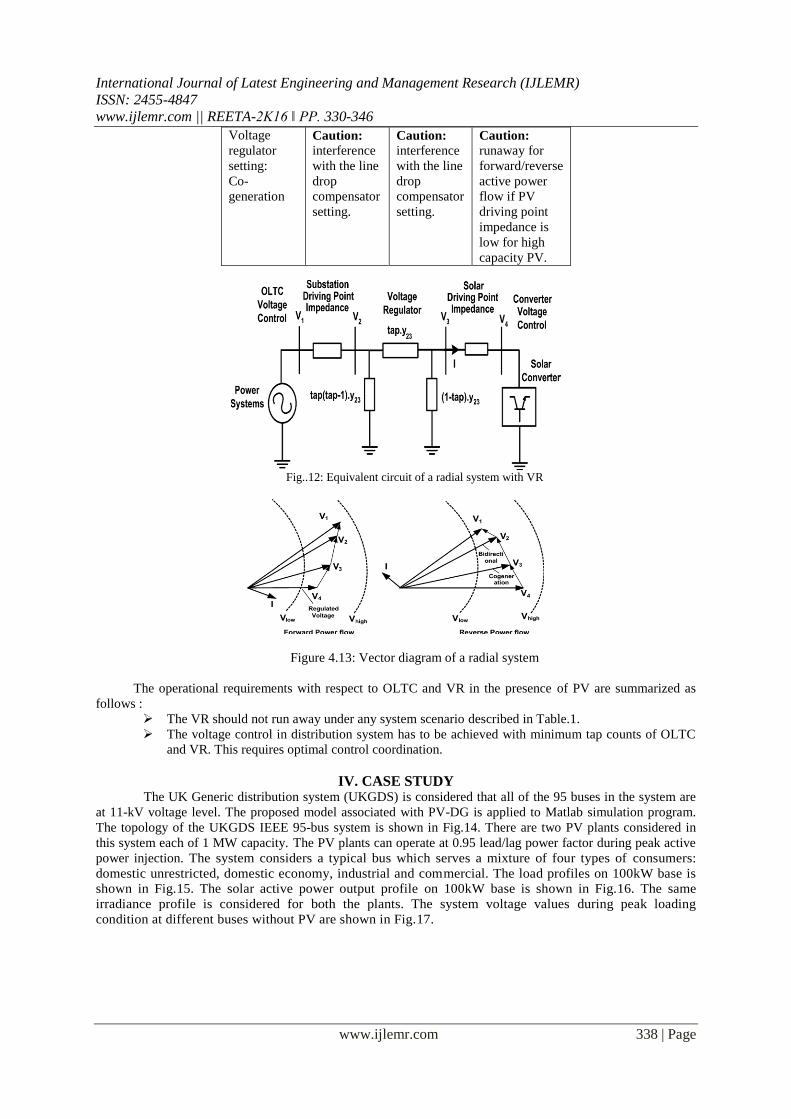
possible active power capture through MPPT. Fig.12 shows the equivalent circuit of the MV distribution feeder
of Fig.11. There is a possibility of power flows in the reverse direction towards the source substation OLTC,
particularly when PV penetration is high. This causes a rise in the load voltage as can be seen from the vector
diagram in Fig.13. The voltage control challenge will be more complex where a PV plant has a reactive power
control option. There will be interaction between VR and PV voltage control. The nature of the control
interaction between VR and PV and its overall effectiveness depends on various factors such as the driving point
impedance, PV capacity, PV reactive power setting, VR setting, and system topology. Table1 summarizes
generic interactions between VR autonomous mode and PV reactive power setting. It is not difficult to
appreciate that for low driving point impedance i.e. strong voltage source there is a real risk of the VR hitting its
limit or operating in runaway condition thus compromising its control effectiveness. There are primarily two
autonomous operational modes of VR where they can potentially interact with a PV voltage control action. The
details of the operational challenges during these VR operational modes are discussed next with reference to the
model feeder topology of Fig. 4.11 and Fig. 4.12.
Fig.11. Radial system topology
Table 1: Interaction between PV reactive power support mode and VR autonomous setting
PV plant setting
Unity Pf Constant Q
or pf, Pf(P)
or Q(U)
Constant
voltage
Voltage
regulator
setting:
Bidirectional
Caution: Runaway
during
reverse
power flow
if low
substation
driving point
impedance.
Caution: runaway
during
reverse
power flow
if low
substation
driving
point
impedance
and no
optimum Q
from PV.
Caution: runaway during
reverse power
flow if low
substation
driving point
impedance and
no optimum
voltage set
point from PV.
Voltage
regulator
setting:
Reactive
bidirectional
Mostly for
loop
distribution
systems.
Caution: No impact
on reactive
current
setting of
VR due to
PV.
Mostly in
loop
distribution
systems.
Caution: reactive
current set
point of VR
can be
impacted by
PV.
Mostly in loop
distribution
systems.
Caution: reactive current
set point of VR
can be
impacted by
PV.
International Journal of Latest Engineering and Management Research (IJLEMR)
ISSN: 2455-4847
www.ijlemr.com || REETA-2K16 ǁ PP. 330-346
www.ijlemr.com 338 | Page
Voltage
regulator
setting:
Co-
generation
Caution: interference
with the line
drop
compensator
setting.
Caution: interference
with the line
drop
compensator
setting.
Caution: runaway for
forward/reverse
active power
flow if PV
driving point
impedance is
low for high
capacity PV.
Fig..12: Equivalent circuit of a radial system with VR
Figure 4.13: Vector diagram of a radial system
The operational requirements with respect to OLTC and VR in the presence of PV are summarized as
follows :
The VR should not run away under any system scenario described in Table.1.
The voltage control in distribution system has to be achieved with minimum tap counts of OLTC
and VR. This requires optimal control coordination.
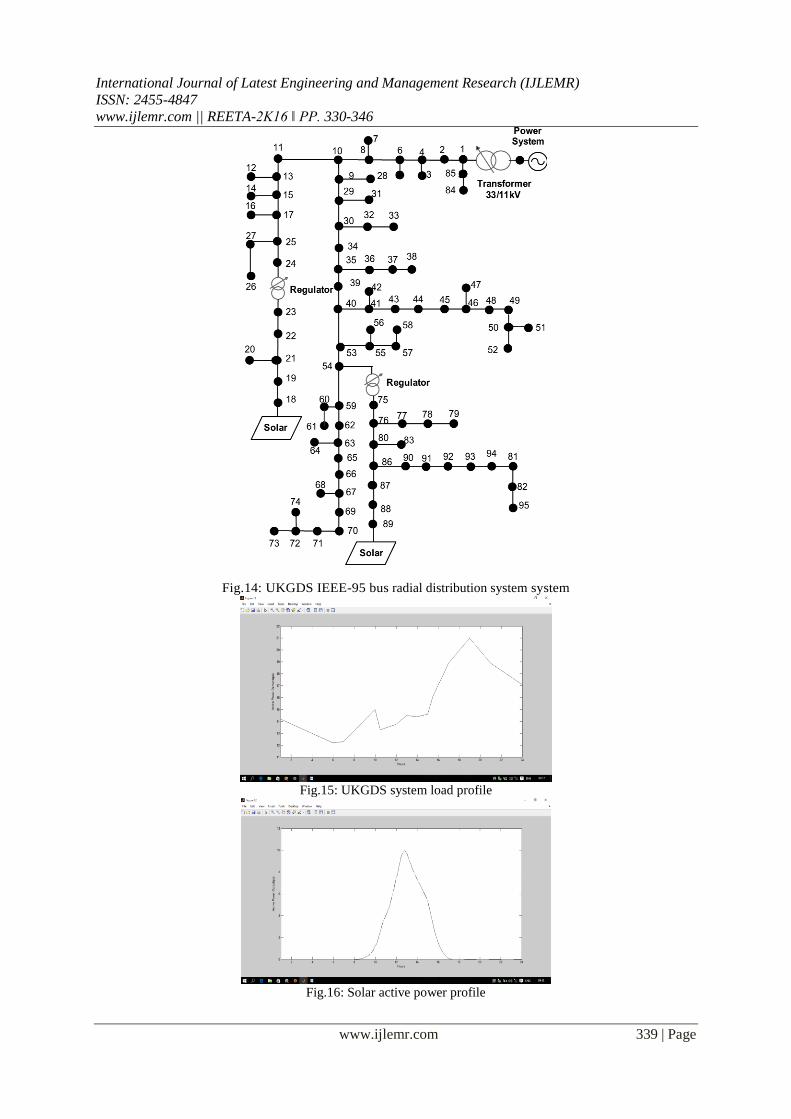
IV. CASE STUDY The UK Generic distribution system (UKGDS) is considered that all of the 95 buses in the system are
at 11-kV voltage level. The proposed model associated with PV-DG is applied to Matlab simulation program.
The topology of the UKGDS IEEE 95-bus system is shown in Fig.14. There are two PV plants considered in
this system each of 1 MW capacity. The PV plants can operate at 0.95 lead/lag power factor during peak active
power injection. The system considers a typical bus which serves a mixture of four types of consumers:
domestic unrestricted, domestic economy, industrial and commercial. The load profiles on 100kW base is
shown in Fig.15. The solar active power output profile on 100kW base is shown in Fig.16. The same
irradiance profile is considered for both the plants. The system voltage values during peak loading
condition at different buses without PV are shown in Fig.17.
International Journal of Latest Engineering and Management Research (IJLEMR)
ISSN: 2455-4847
www.ijlemr.com || REETA-2K16 ǁ PP. 330-346
www.ijlemr.com 339 | Page
Fig.14: UKGDS IEEE-95 bus radial distribution system system
Fig.15: UKGDS system load profile
Fig.16: Solar active power profile

International Journal of Latest Engineering and Management Research (IJLEMR)
ISSN: 2455-4847
www.ijlemr.com || REETA-2K16 ǁ PP. 330-346
www.ijlemr.com 340 | Page
Fig.17. UKGDS system voltages during peak load condition without PV (nominal voltage at bus 1)
SIMULATION RESULTS The UKGDS system considers two DGs at bus 18 and 89. The PV generation plants are considered at the
same locations. The VR is considered in an autonomous mode. Both OLTC and PV generation plants are
coordinated to achieve the voltage control. The objective function guarantees reduced tap counts and reduced
operation of VR in non preferred zone in a preferential manner formulated using weighted combinations. The
scalar weights Wc and Wr are varied such that Wc + Wr = 1. Table 2 demonstrates simulation results for different
values of weights. In Table 2, VR1 represents VR connected between bus 54 and 75, and VR 2 represents VR
connected between bus 24 and 23. Parameters for the penalty function are chosen such that, the penalty function
value should not be too small or too large as compared to base case tap count objective function when equal
weights are assigned for both objective functions. At the end of the control range for the voltage regulator (at tap
position ±16), the penalty value is significantly higher than the tap count objective function (when the weight Wr
corresponding to the voltage regulator runaway is non zero). This ensures that even for the smaller value of Wr
the voltage regulator operation at absolute limit is avoided. In order to maintain the control margin for the
voltage regulator and avoid runaway, a higher tap non-preferred zone is defined. The preferred zone for both VR
is considered to be between tap positions +10 to -10.
Case 1 is considered at unity power factor non-coordinated operation. It can be observed that in Case 1 the total
number of tap count is 76 and number of operations of VR1 in the non preferred zone is 11 and that for VR2 is
8. The next case demonstrates the minimization of tap operation in the non preferred zone. The weight Wr is set
to 1 and no weight is attached to tap counts. It can be observed that all the operation of the VR1 occurs in
preferred zone. But the total tap count remains 61 which is high. In the third case weight Wc is set to 1 and no
weight is attached to the penalty function. Tap counts are reduced to 33 but tap operation instances in the non
preferred zone are 9 for VR1 and 12 for VR2. This casedemonstrates the benefits of penalty function.
Conventional objective functions do not consider the proposed penalty. It can be observed that though tap
counts are reduced, tap operation happens close to its limit. Case 4 gives the most satisfactory value of the
objective function. The following step by step procedure is considered while tuning weights.
Step 1: There are two objectives : tap counts minimization and avoiding operation in the non preferred zone.
Tap count minimization is considered to be the preferred objective in this study. The weight tuning is done in
preferential manner, so intuitively weight assigned for tap count minimization Wc has to be higher.
Step 2: Wc is set to 1 and Wr to 0 and the best possible objective value of the tap count is calculated. Table 2
shows the values achieved.
Step 3: Wr is set to 1 and Wc to 0 and the best possible objective value of the tap in the preferred zone is
calculated. Table 2 shows the values achieved.
Step 4: The target reduction in tap counts from the base case is decided. In this simulation study it is considered
50.
Step 5: The values of Wc are varied in steps of 0.1 from 0 to 1. The values of both objective functions are noted.
Fig.18 shows the variation in both objective function values. Case 1 tap count is 76, considering target tap count
reduction to 50, the weight range selected is Wc from 0.6 to 1.
Step 6: While selecting the final value of Wc (from 0.6 to 1) along with the frequency of operation of voltage
regulators in non preferred zone, the voltage regulator control margin is also considered. The control margin of a
voltage regulator is defined as the difference between the voltage regulator limit and the nearest operation of the
voltage regulator to its limit.

International Journal of Latest Engineering and Management Research (IJLEMR)
ISSN: 2455-4847
www.ijlemr.com || REETA-2K16 ǁ PP. 330-346
www.ijlemr.com 341 | Page
Fig.18.. Variation in both objective function values at different weights
Fig.19. VR control margin at different weights
Fig.20. OLTC and VR maintenance interval
Step 7: The voltage regulator preferred zone of operation is considered between tap values +10 to -10. Hence a
value above 6 is a good control margin. For every value of weight Wc from 0.6 to 1, the control margin for both
voltage regulators is plotted. Fig.19 demonstrate the control margin for both VR in the system.
Step 8: It can be observed from Fig.18 and Fig.19 that Wc equal to 0.8 offers the same number of tap operations
in non preferred zone as Wc equal to 0.7 and the same control margin as can be achieved by Wc equal to 0.9,
hence the final selection of weights is Wc is equal to 0.8 and Wr is equal to 0.2. Thus the final optimal weight
tuning is achieved for Case 4 of Table 2.
Table 2: UKGDS 95 bus system performance
Case Weights Tap Count
Operation in non
preferred zone
Wc Wr OLTC VR1 VR2 Total VR1 VR2 Total
1 - - 40 19 17 76 11 8 19
2 0.0 1.0 40 4 17 61 0 8 8
3 1.0 0.0 29 2 2 33 9 12 21
4 0.8 0.2 25 14 2 41 12 0 12

International Journal of Latest Engineering and Management Research (IJLEMR)
ISSN: 2455-4847
www.ijlemr.com || REETA-2K16 ǁ PP. 330-346
www.ijlemr.com 342 | Page
Table 3: Percentage reduction in OLTC and VR tap count
Case 2 3 4
OLTC 0% 27.5% 37.7%
VR1+VR2 41.66% 88.9% 55.56%
Table 4: OLTC and VR Set Points
Set points Dead band
OLTC 1.01 0.02
VR1,VR2 1.02 0.02
Table 5: Tap count with no reactive power support from solar at zero irradiance
OLTC VR1 VR2 TOTAL
29 10 11 50
Fig21. Voltages during peak load condition and peak solar injection at different buses (Optimal case Wc =0.8
and Wr=0.2)
Fig.22. Hourly PV plant voltage setpoints

International Journal of Latest Engineering and Management Research (IJLEMR)
ISSN: 2455-4847
www.ijlemr.com || REETA-2K16 ǁ PP. 330-346
www.ijlemr.com 343 | Page
The results of Table 2 are confirmed with 30 sec time step load flow. Table 3 shows the percentage
reduction in the OLTC and VR tap counts. Typical life of transformer and VR is 30 years. The typical
maintenance interval of OLTC and VR is after 3 years. So in the base case, a total of 10 maintenance schedules
are considered for each VR and OLTC. Fig.20. shows a reduction in maintenance intervals for this test system if
the daily percentage reduction as in Table 3 is achieved. Fig.21 shows voltage values at different buses for Case
4 during the peak solar injection and the peak load. It can be observed that in both operating conditions, the
voltage profile across the feeder is maintained within ±5%. Table 4 shows OLTC and VR set points. The hourly
voltage set points for both PV plants are shown in Fig.22.
Table 5 demonstrates Case 3 for which Wc is 1 and Wr is 0. The comparison with case 3 in Table 2
shows that, there is significant increase in tap counts when no reactive power support is considered from PV at
zero irradiance.
The operation of both PV plants for a particular day under consideration is represented in Fig. 22. The
active power and apparent power consumption of both the PV plants is represented in Fig. 22. The solid line
represents the inverter capacity. Fig.22. demonstrates sufficient reactive power margin available at all the
operating values. Also PV plant operates at MPPT at all instants. As can be observed from Fig. 21, there are in
total 24 optimal voltage set points calculated. It can be observed from Fig.17. that the voltage at bus 52 is
acceptable but lower during peak load condition. Distribution feeders are equipped with switched capacitor at
bus 52.
Fig. 23. PV plant operation
The simulation model of the UKGDS IEEE 95-bus system with two switched bank capacitors is shown
in Fig.24.The capacitor bank C1 and C2 each has rating of 200 kVAr at rated voltage (1pu). This will ensure
that voltage at bus 52 is 1pu. Both VR and capacitor are in autonomous mode. So, based on the daily load and
irradiance profile, OLTC and PV reactive power set points are coordinated. Again similar to the base case,
scalar weights Wc and Wr are varied such that Wc + Wr = 1. Table 6 demonstrates simulation results for base case

International Journal of Latest Engineering and Management Research (IJLEMR)
ISSN: 2455-4847
www.ijlemr.com || REETA-2K16 ǁ PP. 330-346
www.ijlemr.com 344 | Page
and optimal case. Fig.25. shows the PV plant voltage set points for the optimal it can also be seen from fig.26
and fig.27 that voltages at all buses remain within the prescribed limits.
Fig.24. UKGDS IEEE-95 bus system simulation model with two switched capacitor bank at bus 52
Fig.25: PV plant voltage setpoints with capacitors at bus 52
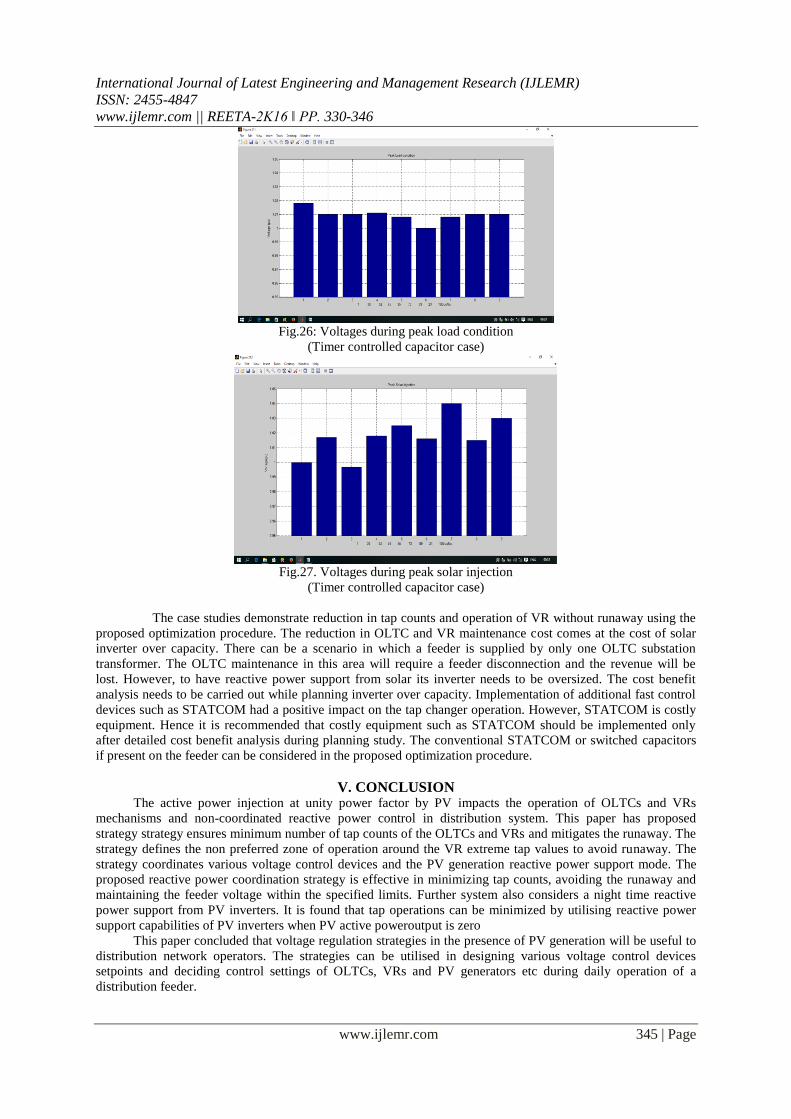
The following advantages are observed with the inclusion of capacitor:
The number of tap counts is to achieve voltage control is lower when capacitors are placed at Bus 52.
The number of operations of the voltage regulator in the non preferred zone is reduced with the presence
of capacitor.
Reactive power utilization from PV inverter is less when capacitor is considered.
International Journal of Latest Engineering and Management Research (IJLEMR)
ISSN: 2455-4847
www.ijlemr.com || REETA-2K16 ǁ PP. 330-346
www.ijlemr.com 345 | Page
Fig.26: Voltages during peak load condition
(Timer controlled capacitor case)
Fig.27. Voltages during peak solar injection
(Timer controlled capacitor case)
The case studies demonstrate reduction in tap counts and operation of VR without runaway using the
proposed optimization procedure. The reduction in OLTC and VR maintenance cost comes at the cost of solar
inverter over capacity. There can be a scenario in which a feeder is supplied by only one OLTC substation
transformer. The OLTC maintenance in this area will require a feeder disconnection and the revenue will be
lost. However, to have reactive power support from solar its inverter needs to be oversized. The cost benefit
analysis needs to be carried out while planning inverter over capacity. Implementation of additional fast control
devices such as STATCOM had a positive impact on the tap changer operation. However, STATCOM is costly
equipment. Hence it is recommended that costly equipment such as STATCOM should be implemented only
after detailed cost benefit analysis during planning study. The conventional STATCOM or switched capacitors
if present on the feeder can be considered in the proposed optimization procedure.
V. CONCLUSION The active power injection at unity power factor by PV impacts the operation of OLTCs and VRs
mechanisms and non-coordinated reactive power control in distribution system. This paper has proposed
strategy strategy ensures minimum number of tap counts of the OLTCs and VRs and mitigates the runaway. The
strategy defines the non preferred zone of operation around the VR extreme tap values to avoid runaway. The
strategy coordinates various voltage control devices and the PV generation reactive power support mode. The
proposed reactive power coordination strategy is effective in minimizing tap counts, avoiding the runaway and
maintaining the feeder voltage within the specified limits. Further system also considers a night time reactive
power support from PV inverters. It is found that tap operations can be minimized by utilising reactive power
support capabilities of PV inverters when PV active poweroutput is zero
This paper concluded that voltage regulation strategies in the presence of PV generation will be useful to
distribution network operators. The strategies can be utilised in designing various voltage control devices
setpoints and deciding control settings of OLTCs, VRs and PV generators etc during daily operation of a
distribution feeder.

International Journal of Latest Engineering and Management Research (IJLEMR)
ISSN: 2455-4847
www.ijlemr.com || REETA-2K16 ǁ PP. 330-346
www.ijlemr.com 346 | Page
REFERENCES [1] “Global market outlook for photovoltaics until 2016,” May 2012 [On-line]. Available:
http://www.epia.org/
[2] Shaaban, M.F. ; Atwa, Y.M. ; El-Saadany, E.F. “DG allocation for benefit maximization in distribution
networks ,“ IEEE Transactions on Power Systems, Vol. 28, no.2 ,pp. 639 – 649, May. 2013.
[3] R. Tonkoski, L. Lopes, and T. EL-Fouly, “Coordinated active powercurtailment of grid connected pv
inverters for overvoltage prevention,”IEEE Trans. Sustain. Energy, vol. 2, no. 2, pp. 139–147, Apr.
2011.
[4] A. G. Madureira and J. A. P. Lopes, “Voltage and reactive power control in MV networks
integrating microgrids,” Proc. ICREPQ, vol. 7, pp. 1–5, 2007.
[5] L. M. Cipcigan and P. C. Taylor, “Investigation of the reverse power flow requirements of high
penetrations of small-scale embedded generation,” IET Renewable Power Gen., vol. 1, no. 3, pp. 160–
166, 2007.
[6] F. A. Viawan and D. Karlsson, “Voltage and reactive power control in system with synchronous
machine-based distributed generation,” IEEE Trans. Power Del., vol. 23, no. 2, pp. 1079–1087,
Apr. 2008.
[7] R. A. Walling and K. Clark, “Grid support functions implemented in utility-scale PV system,” in
Proc. IEEE PES Transm. Distrib. Conf. Expo., 2010, pp. 1–5.
[8] S. Civanlar and J. J. Grainger, “Forecasting distribution feeder loads: Modeling and application
to Volt/Var control,” IEEE Trans. Power,Del., vol. 3, no. 1, pp. 255–264, Jan. 1988.
[9] M. Liu, S. K. Tso, and Y. Cheng, “An extended nonlinear primal dual interior-point algorithm for
reactive-power optimization of large scale power system with discrete control variables,” IEEE Trans.
Power Syst., vol. 17, no. 4, pp. 982–991, Nov. 2002.
[10] A. Malekpour and A. Pahwa, “Reactive power and voltage control in distribution system with
photovoltaic generation,” in Proc. IEEE North Amer. Power Symp., 2012, pp. 1–6.
[11] E. T. Jauch, “Possible effects of smart grid functions on LTC transformers,” IEEE Trans. Ind.
Appl., vol. 47, no. 2, pp. 1013–1021, Mar.–Apr. 2011.
[12] R. Singh, B. C. Pal, and R. A. Jabr, “Distribution system state estimation through Gaussian
mixture model of the load as pseudo-measurement,” IET Gen., Transm. Distrib., vol. 4, no. 1, pp.
50–59, 2010.
R.RAJESH has received the B.Tech (Electrical And Electronics Engineering) degree
from sri venkateswara college of engineering & techonolohy, chittoor in 2011 and
persuing M.Tech (Power Systems) in srinivasa institute of technology, kadapa.


