
Re-thinking the environmental dimensions of upgrading and
embeddedness in production networks: The case of Kenyan
horticulture farmers
A thesis submitted to the University of Manchester for the degree of
Doctor of Philosophy in the Faculty of Humanities
2017
Aarti Krishnan
School of Environment, Education and Development

2
Table of Contents
List of Tables ............................................................................................................................ 7
List of Figures .......................................................................................................................... 9
List of Maps.............................................................................................................................. 9
List of Appendices ................................................................................................................ 10
List of Abbreviations ............................................................................................................ 11
Abstract................................................................................................................................... 13
Declaration ............................................................................................................................. 14
Copyright Statement ............................................................................................................. 15
Acknowledgement and Dedication .................................................................................... 16
1. Introduction .................................................................................................................... 23
1.1 Research gap: Kenyan farmers, the environment and multiple end markets .... 26
1.1.1 The importance of FFV in Kenya and the growth of Northern markets ...... 27
1.1.2 Marginalization due to standards developed by Northern supermarkets .. 28
1.1.3 The proliferation of regional and local supermarkets and standards in
Kenya ............................................................................................................................... 32
1.1.4 Types of environmental pressures across production networks ................... 35
1.2 Conceptual gap: the importance of the environment across global, regional and
local production networks ............................................................................................... 38
1.2.1 Rationale for using production network and value chain frameworks ....... 39
1.2.2 Importance of adapting the GPN and GVC framework: Environment,
epistemologies and multiple end markets ................................................................. 40
1.3 Research questions and structure of the thesis ....................................................... 42
1.4 Key contributions of the thesis .................................................................................. 45
2. Exploring the environmental dimensions of embeddedness and systematizing
governance in global, regional and local production networks ..................................... 50
2.1 Introduction ................................................................................................................. 50
2.2 Why is embeddedness important in value chains and production networks? .. 51
2.2.1 Embeddedness in GPNs ...................................................................................... 52
2.2.2 Societal embeddedness ........................................................................................ 55

3
2.2.3 Network embeddedness ...................................................................................... 57
2.2.4 Territorial embeddedness .................................................................................... 66
2.2.5 Re-environmentalization ..................................................................................... 76
2.3 Breaking down the components of governance: Complexity, Codifiability and
Capabilities ......................................................................................................................... 82
2.3.1 Complexity, Codifiability and Capabilities versus the five governance
typologies ........................................................................................................................ 83
2.3.2 Complexity ............................................................................................................ 84
2.3.3 Codification and Capabilities.............................................................................. 86
2.3.4 Extending the concept of capabilities: Implicit capabilities ........................... 97
2.3.5 Summary of Complexity, Codifiability and Capabilities ............................... 99
2.3.6 Determinants of environmental upgrading: Linking embeddedness and
governance across global, regional and local production networks .................... 100
3. Rethinking environmental upgrading in production networks .............................. 104
3.1 Introduction ............................................................................................................... 104
3.1.1 Conceptual origins and limits of economic and social upgrading .............. 105
3.1.2 Environmental upgrading: Definition, typologies and links to economic
and social upgrading ................................................................................................... 108
3.1.3 Categories of environmental upgrading for farmers .................................... 112
3.1.4 Strategic environmental upgrading ................................................................. 114
3.2 Environmental outcomes of environmental upgrading ...................................... 117
3.3 Why is environmental upgrading a dynamic process across farmers in GPNs,
RPNs and LPNs? ............................................................................................................. 120
3.3.1 Factors shaping environmental upgrading .................................................... 123
3.4 Concluding remarks ................................................................................................. 126
4. Research strategy: Context, production network mapping, methodology and
methods ................................................................................................................................ 127
4.1 Introduction ............................................................................................................... 127
4.2 Crop selection ............................................................................................................ 128
4. 3 Production network mapping ................................................................................ 133
4.3.1 Defining a GPN, RPN and LPN farmer........................................................... 134
4
4.3.2 Mapping the Kenyan horticulture global production network ................... 135
4.3.4 Mapping the Kenyan horticulture Regional production network .............. 137
4.3.5 Mapping the Kenyan horticulture local production network ...................... 139
4.4 Research methodology ............................................................................................. 140
4.4.1 The methods applied .......................................................................................... 141
4.5 Data collection ........................................................................................................... 143
4.5.1 Phase 1: Qualitative data collection (October 2014-January 2015) .............. 143
4.5.2 Phase 2: Survey data collection: Sampling in production networks .......... 147
4.5.3 Phase 2: Survey data collection: Design and disbursement ......................... 161
4.5.4 Phase 3: Follow up qualitative data collection ............................................... 167
4.5.5 Research sub-questions and data collection methods used ......................... 168
4.6 Limitations of data collection .................................................................................. 169
4.7 Data analysis .............................................................................................................. 170
4.8 Ethical considerations ............................................................................................... 172
5. Exploring environmental dimensions of embeddedness and governance of
Kenyan horticulture farmers in global, regional and local production networks ..... 174
5.1 Introduction ............................................................................................................... 174
5.2 Exploring re-environmentalization, network, societal and territorial
embeddedness for Kenyan farmers in global, regional and local production
networks ........................................................................................................................... 175
5.2.1 Network architecture, structure and societal embeddedness ...................... 175
5.2.2 Network stability and durability ...................................................................... 190
5.2.3 Measuring network embeddedness ................................................................. 198
5.2.4 Territorial embeddedness .................................................................................. 200
5.2.5 Territorial embeddedness- Fixed ..................................................................... 202
5.2.6 Territorial embeddedness- Fluid ...................................................................... 208
5.2.7 Measuring territorial embeddedness ............................................................... 213
5.2.8 Degrees of re-environmentalization ................................................................ 214
5.3 Exploring Complexity, Codifiability and Capabilities across farmers
participating in global, regional and local production networks ............................. 218

5
5.3.1 Factors shaping governance: Unpacking Complexity .................................. 218
5.3.2 De-codification and Capabilities ...................................................................... 221
5.3.3 Summary of de-codification and capabilities ................................................. 233
5.3.4 Implicit capabilities ............................................................................................ 234
5.4. Concluding Remarks ............................................................................................... 236
6. Unpacking environmental upgrading and its links to embeddedness and
governance of Kenyan horticulture farmers in global, regional and local production
networks ............................................................................................................................... 241
6.1 Introduction ............................................................................................................... 241
6.2 Environmental upgrading across farmers in GPNs, RPNs and LPNs .............. 242
6.2.1 Low and High complexity product and process environmental upgrading
........................................................................................................................................ 242
6.2.2 Environmental upgrading: Strategic ............................................................... 251
6.2.3 Economic and social upgrading/downgrading and the relationship with
environmental upgrading/downgrading ................................................................. 259
6.3 Quantitative analysis of determinants of environmental upgrading ................ 267
6.3.1 Intuition of econometric model used ............................................................... 271
6.3.2 Results for Low complexity product and process environmental upgrading
(Regression 1) ............................................................................................................... 273
6.3.3 Results for combined Low and High complexity product and process
environmental upgrading (Regression 2) ................................................................ 277
6.3.4 Results strategic environmental upgrading (Regression 3).......................... 283
6.3.5 Simulating the heterogeneous differences between farmers in GPNs, RPNs
and LPNs ....................................................................................................................... 288
6.4 Concluding remarks ................................................................................................. 292
7. Exploring the environmental outcomes of environmental upgrading ................... 304
7.1 Introduction ............................................................................................................... 304
7.2 Identifying environmental outcomes ..................................................................... 305
7.2.1 Environmental outcome: Improved resource efficiency and pollution
management ................................................................................................................. 307
7.2.2. Environmental outcome: Pre-emptive conservation .................................... 309

6
7.2.3 Environmental indexes ...................................................................................... 312
7.3 Environmental upgrading, environmental outcomes and its links to economic
and social upgrading ...................................................................................................... 313
7.3.1 Regression results: implications of environmental upgrading .................... 314
7.4 Long term effects of environmental upgrading and downgrading ................... 320
7.5 Concluding remarks ................................................................................................. 321
8. Conclusion: Analytical observations and contributions ........................................... 324
8.1 Thesis contributions .................................................................................................. 326
8.1.1 Environmental upgrading and environmental outcomes ............................ 326
8.1.2. Implications of re-environmentalization for GPN, RPN and LPN farmers
........................................................................................................................................ 334
8.1.3 Rethinking understanding of governance across value chains and
production networks ................................................................................................... 337
8.2 Methodological contributions and limitations ...................................................... 341
8.3 Contribution to the debate on sustainable development in value chains and
production networks ...................................................................................................... 342
8.4 Contribution to the debate on globalization and regional development in value
chains and production networks .................................................................................. 345
8.5 Further research ......................................................................................................... 348
References ............................................................................................................................ 351
Appendices .......................................................................................................................... 384
Final word count (main text and footnotes): 85,878
7
List of Tables
List of tables Page no.
Table 1.1: Kenyan exports and unit values 28
Table 2.1: Density, intensity and quality of strong, weak and intermediate ties 60-61
Table 2.2 Ease of re-environmentalization 79-80
Table 2.3: De-codification and capabilities categorization 96
Table 3.1: Adaptation types 116
Table 4.1: Characteristics of crops selected in 2005 130
Table 4.2: Characteristics of crops selected in 2013 131
Table 4.3: farmer categories classification 135
Table 4.4: breakdown of respondents by actor type 144
Table 4.5: Example of coding of respondents 145-146
Table 4.6: Multiple imperfect sampling frames 151
Table 4.7: Sample selected of farmers 160
Table 4.8: Examples of environmental upgrades 163
Table 4.9: Main sections in questionnaire 163-164
Table 4.10: Phase 3 follow up interviews 168
Table 4.11: data collection by empirical research sub-question 168
Table 4.12: Data analysis by research sub-question 172
Table 5.1: Network architecture 186
Table 5.2: Network stability (All values % of each farmer category) 191
Table 5.3: Index of Network embeddedness 199
Table 5.4: Territorial Fixed: Natural endowments I 204
Table 5.5: Territorial Fixed: Natural endowments II 204
Table 5.6: Territorial Fluid: Pest incidences, climate variability and shock
perception by farmer category
210
Table 5.7: Index of territorial embeddedness fixed and fluid 213
Table 5.8: Comparing ease of re-environmentalization 216
Table 5.9: Low and high complexity of transactions 220
Table 5.10: Learning sources for GPN farmers 226
Table 5.11: Learning sources for RPN farmers 229
Table 5.12: Learning sources for local farmers 232
Table 5.13: Physical, productive and social capital 235-236
Table 6.1: List of LCEPP and HCEPP 243
Table 6.2: Performance of LCEPP across farmers in GPNs, RPNs and LPNs. 245
Table 6.3: Performance of HCEPP across farmers in GPNs, RPNs and LPNs 247-248
Table 6.4: Comparing LCEPP and HCEPP environmental upgrades 250
Table 6.5: Level of strategic environmental upgrades 252-253
Table 6.6: Learning mechanisms strategic environmental upgrading 257
Table 6.7: Economic process upgrading - Standards and certifications 260
Table 6.8: Value addition- Economic product upgrading 261

8
Table 6.9: Farm gate sale price and net gain 2014 (in Ksh) 262
Table 6.10: Strategic diversification and simultaneous selling 263
Table 6.11: Descriptives of key variables 268-270
Table 6.12: Regression results for low complexity product and process
environmental upgrading (two-step)
274
Table 6.13: Results for Low complexity + high complexity product and
process environmental upgrading (two-step)
280
Table 6.14: Regression for strategic environmental upgrading (two-step) 285
Table: 6.15: Comparing environmental upgrading, re-environmentalization
and governance across farmers in GPNs, RPNs and LPNs
299
Table 6.16: Linking economic, social and environmental upgrading and
downgrading
302
Table 7.1: Improved resource efficiency and pollution management 308
Table 7.2: Pre-emptive conservation indicators 311
Table 7.3: Environmental index of environmental outcomes 312
Table 7.4: Environmental upgrading, environmental outcomes and income 314
Table 7.5: Results for environmental upgrading types (iterated SUR) 319
9
List of Figures
List of Figures Page no.
Figure 1.1: GlobalGAP requirements: Economic, social and environmental 31
Figure 1.2: Layers of environmental pressures 38
Figure 2.1: Embeddedness explained 78
Figure 2.2: Matrix of learning 92
Figure 2.3: Leaning mechanisms for de-codification 93
Figure 2.4: Connecting complexity, codifiability and capabilities 99-100
Figure 3.1: Environmental upgrading types 117
Figure 3.2: Overall Framework 124
Figure 4.1: Simplified GPN farmer product flow 136
Figure 4.2: Simplified RPN farmer product flow 138
Figure 4.3: Simplified LPN farmer product flow 139
Figure 4.4: Sampling process simplified 152
Figure 4.5: Multiplicity overlaps for farmer categories 159
Figure 4.6: Tree diagram of nodes 171
Figure 5.1: Farmer input and buyers before and after participation in GPN 177
Figure 5.2: Farmer input and buyers before and after participation in RPN 182
Figure 5.3: Farmer input and buyers before and after participation in LPN 184
Figure 5.4: Part of a Farmer agreement contract of a large Kenyan
exporter
195
Figure 5.5: De-codifiability and capabilities 234
Figure 6.1: Stages in two sequential double hurdle econometric model 273
Figure 6.2: Simulations for environmental upgrading- LCEPP+HCEPP 290
Figure 6.3: Simulations for strategic environmental upgrading 290
List of Maps
List of Maps Page no.
Map 1: Location of selected counties within Kenya 153
Map 2: Universe of farmers in each county by crop type 154
Map 3: Share of area under production by crop and county 156
Map 4: Share of production by crop and county 157
Map 5: Snow peas, Garden peas, Mango and Avocado: Farmers sampled
by county
161

10
List of Appendices
List of Appendices Pg no
Appendix 1: List of key in-depth interviews 384
Appendix 2: List of focus group discussions 388
Appendix 3: Data for sampling – universe of farmers 389
Appendix 4: Multiple frames sampling methodology 390
Appendix 5: Questionnaire: Production networks and the environment 394
Appendix 6: Research assistant contract and confidentiality agreement 408
Appendix 7: Invitation letter to participate in research 412
Appendix 8: Consent form interviews, focus groups and surveys 413
Appendix 9: Farmer appreciation certificate 415
Appendix 10: Polychoric principal component analysis 416
Appendix 11: Robustness of polychroic PCA using Principal component
analysis
419
Appendix 12: Selection correction ordered probit model 420
Appendix 13: Low Complexity Product and Process Environmental
Upgrades- Stage 1 Regression
425
Appendix 14: Box Cox test for specification and identification test 426
Appendix 15: Endogeneity tests 427
Appendix 16: Model validity and falsification (across all regressions) 428
Appendix 17: Robustness with linear regressions (for second stage) 429
Appendix 18: Robustness with FIML for LCEPP 431
Appendix 19: LCEPP+HCEPP upgrades Stage 1 Regression 432
Appendix 20: Endogeneity tests for LCEPP+HCEPP 433
Appendix 21: Robustness tests for LCEPP+HCEPP Stage 2 434
Appendix 22: Robustness test with FIML for LCEPP+HCEPP 435
Appendix 23: Strategic environmental upgrading Stage 1 Regression 436
Appendix 24: Endogeneity tests for SEU 437
Appendix 25: Robustness for Stage 2 SEU 438
Appendix 26: Robustness test with FIML for SEU 439
Appendix 27: Complete results for simulation of environmental upgrades 440
Appendix 28: ISURE econometric model 443
Appendix 29: Robustness check using conditional mixed process estimator:
Environmental outcomes
446
Appendix 30: Falsification tests for exclusion restrictions 447
Appendix 31: Robustness test with normalized crop yields: Linear
regression
447
Appendix 32: Thresholds of environmental upgrading 448

11
List of Abbreviations
AAFN Alternate agri-food network
AO Area officer (Kenya)
BA Business Association (Kenya)
CGOV County Government in Kenya
CSO Civil Society Organizations
EDU Education Institution (Kenya)
EU European Union
FFV Fresh fruit and vegetables
FGD Focus Group Discussions
FPEAK Fresh Produce Exporters Association of Kenya
GAP Good Agricultural Practices
GHG Greenhouse gas emissions
GP Garden Peas
GPN Global Production Networks
GS Global supermarket/ Northern Retailer
GVC Global Value Chains
GOV Kenyan National government
HCD Horticulture Crops Directorate
HCEPP High Complexity Product and Process upgrade
IREPM Improved Resource Efficiency and Pollution Management
ISUR Iterated Seemingly Unrelated Regression
ITC Intracen
KARLO Kenya Agriculture and Livestock Research Organization
KEP Kenyan Export Firm
12
KePHIS Kenya Plant health inspectorate Service
KHCP Kenya Horticulture Competitiveness Project
KNCAP Kenyan National Climate Change Action Plan
KW Kruskal-Wallis Test
LCEPP Low Complexity Product and Process upgrade
LPN Local Production Network
PC Pre-emptive Conservation
PMO Primary Marketing Organization
PN Production Network
MRL Maximum Residue Limit
NEMA National Environment Management Authority
RPN Regional Production Network
RS Regional supermarket
RVC Regional Value Chains
SEU Strategic Environmental Upgrading
SP Snow Peas
SSA Sub-Saharan Africa
VC Value Chains
13
Abstract Re-thinking the environmental dimensions of upgrading and embeddedness in
production networks: The case of Kenyan horticulture farmers
Aarti Krishnan, September 2017
Stringent Northern private food standards have created onerous requirements for horticulture farmers in Kenya who wish to supply global value chains (GVC) and production networks (GPNs) governed by global lead firms. Simultaneously, Southern (regional) supermarkets have emerged over the last few decades leading to the formation of regional production networks (RPNs), which provide a new market opportunity and require meeting different regional private and public standards. Both Northern and regional standards are increasingly including complex environmental requirements that risk farmer exclusion from participation in both global and regional markets. This is exacerbated by bio-physical aspects of climate variability and extremes that impinge on crop quality and yield. A key problem therefore arises from the ability of farmers across not only GPNs but also RPNs and local production networks (LPNs) to cope with different environmental upgrading and downgrading pressures, emerging from standards and bio-physical aspects. The overarching research question this thesis seeks to address is: What are the dynamics of environmental upgrading, embeddedness and governance for farmers in global, regional and local production networks?
This thesis seeks to make three contributions to the GPN and GVC literatures. The first is integrating the natural environment through a concept I call re-environmentalization. I suggest farmers dis-embed from previous relationships and interactions with their environment/land and re-embed into new socio-ecological relationships in GPNs, RPNs or LPNs. The second contribution enriches production network and value chain analysis by adding a dimension of ‘changing epistemologies’ wherein I explicate understandings of governance through the lens of a farmer. I view governance as something that ‘is experienced’ rather than focus on the lead firms’ perspective of ‘governing’. I question the linearity of upgrading, studying what it means to a farmer, instead of assuming that all upgrades are beneficial. The third contribution is to compare how re-environmentalization and governance, effect a farmers’ ability to environmentally upgrade heterogeneously across global, regional and local production networks, thereby going beyond the North-South analysis prevalent in GPN literature. The thesis is based on field research in Kenya involving 102 key informant interviews, 6 focus group discussions and a survey of 579 farmers across four counties (Murang’a, Machakos, Nyandarua, Meru) producing snow peas, garden peas, avocados and mangoes. The analysis uses a mixed method approach, drawing on econometric models along with qualitative data to provide triangulated and robust comparisons across production networks.
The empirical findings of the research indicate that the trajectories of environmental upgrading/ downgrading are complex and dynamic across farmers in GPNs, RPNs and LPNs. This is because the process through which farmers re-environmentalize into GPNs is contested, as relationships with Northern firms’ breed dis-trust and inhibit the use of tacit knowledge. This prevents farmers from performing environmental upgrading in a sustainable way. Furthermore, I debunk the implicit assumption that economically upgrading, by adhering to Northern and regional standards is sustainable, and instead show that these standards can trigger environmental downgrading. RPN farmers, because of their entrepreneurial capacity and smoother process of re-environmentalizing into regional networks, compared to farmers in GPNs, are able to internalize knowledge and environmentally upgrade more sustainably. Finally, LPN farmers perform the least environmental upgrades, due to minimal support from other network actors. Overall, I establish that it is critical to incorporate environmental dimensions in production network and value chain analysis.

14
Declaration
No portion of the work referred to in the thesis has been submitted in support of an
application for another degree or qualification of this or any other university or other
institute of learning.
Aarti Krishnan
27th November 2017
15
Copyright Statement
I. The author of this thesis (including any appendices and/or schedules to this
thesis) owns certain copyright or related rights in it (the “Copyright”) and
s/he has given The University of Manchester certain rights to use such
Copyright, including for administrative purposes.
II. Copies of this thesis, either in full or in extracts and whether in hard or
electronic copy, may be made only in accordance with the Copyright,
Designs and Patents Act 1988 (as amended) and regulations issued under it
or, where appropriate, in accordance with licensing agreements which the
University has from time to time. This page must form part of any such
copies made.
III. The ownership of certain Copyright, patents, designs, trademarks and other
intellectual property (the “Intellectual Property”) and any reproductions of
copyright works in the thesis, for example graphs and tables
(“Reproductions”), which may be described in this thesis, may not be
owned by the author and may be owned by third parties. Such Intellectual
Property and Reproductions cannot and must not be made available for use
without the prior written permission of the owner(s) of the relevant
Intellectual Property and/or Reproductions.
IV. Further information on the conditions under which disclosure, publication
and commercialisation of this thesis, the Copyright and any Intellectual
Property and/or Reproductions described in it may take place is available
in the University IP Policy (see
http://documents.manchester.ac.uk/DocuInfo.aspx?DocID=487), in any
relevant Thesis restriction declarations deposited in the University Library,
The University Library’s regulations (see
http://www.manchester.ac.uk/library/aboutus/regulations) and in The
University’s policy on Presentation of Theses

16
Acknowledgement and Dedication
The PhD journey has been a long and winding road. I began with an optimistic wave
of hope that I would contribute something profound through my research, which had
critical mass to change lives. While to some extent I believe I have achieved that
through the support of so many people to whom I will always be eternally grateful, it
has not been without its struggles and difficulties. However, as I near the end of my
PhD I feel a new wave wash over me, like something special and wonderful is
disappearing and I am not sure how I am supposed to feel? Grateful that it is over? Or
uncertain about what is next? #ThePhDJourney
Reminiscing, I realized I started my PhD journey early on in life (before the actual
PhD). During my time as an undergraduate student of finance I studied commodities,
following which I worked in the commodity markets, which led me to my interaction
with the farming community. This ultimately guided me to where I am supposed to
be. I must add though that this was a winding path that took me six long years to
reach… but I finally found my place! #FunnyHowLifeWorks.
The PhD life is one of the most revealing times, quite often I found myself wondering
how I ended up here and questioned all the decisions I made. However, what I did
know was that I wanted to be an agent who pushed for change, I wanted my voice
and the voice of hundreds of farmers to be heard…I wanted to #MakeADifference!
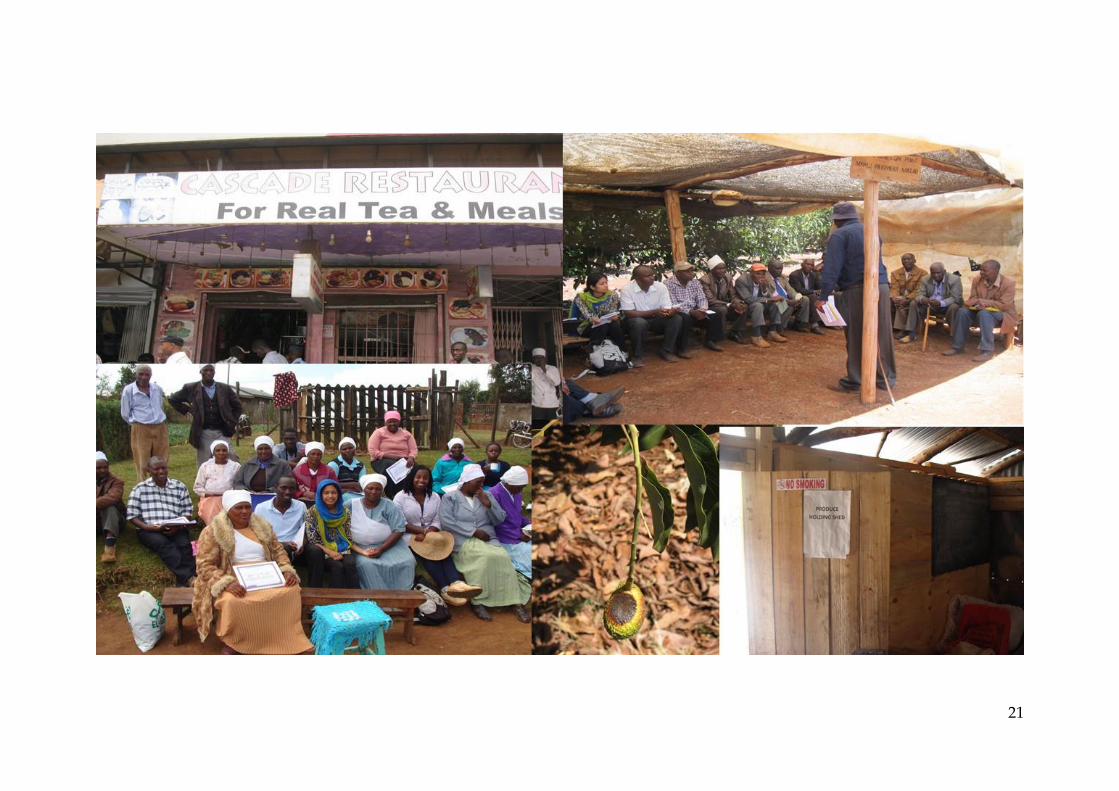
Going to the field was one of the best experiences of my life. I met some of the brightest
minds -Patrick, Polycarp, Mona, Sharon, Clarine, Viktor- researchers hired for helping
me with the survey and interviews - who survived the 35 degrees sun 12 hours a day,
living in places without functional bathrooms and fighting off monkeys who would
compete with us to eat the food from our plate! I am thrilled that I could share this
adventure with you! In the field, I heard stories of struggle and hope, of fortitude in
the face of loss and determination to create resilient livelihoods in the face of hardship.
Even though this thesis highlights the many challenges farmers face, it also elucidates
the rise of a new breed of farmers that create positive change. It offers a narrative of
optimism to a brighter future for Kenya. #KenyaOnTheRise #PositivityPersonified
In life sometimes you get lucky, you meet people for a reason. Even though the reason
may not be immediately apparent. I have been fortunate to meet many such people….
One of them is my mentor, Stephanie Barrientos. She gave me a chance to work with
her even before I knew what value chains were! She saw potential in me for which I
am and will always be forever grateful #MeetingTheRightPeople
Through my journey I had the good fortune to be surrounded by the most amazing
people—Rory, Rachel, Kojo, Corinna, Judith, Alma, Juan, Piyawadee, Huraera, Beth,
Chris, Subashish, Debjani, Natalie, Karishma, Simon, Eyob, Bala, Dani, Sally, Kate,
Pablo, Vidhya, Sama, Kat, Lujia and Somjita- thank you for listening to me ramble

17
through the years, giving me advice and keeping me sane. We have grown to be a
family! Purnima… my foodie in crime…. .life was taken away from you too early. I
wish you were there to see me now.
A big shoutout to Martin Hess, thank you for stepping in towards the end and helping
me cross the finish line. I would also like to show my appreciation for the support I
received from the amazing staff at GDI- Kunal, Armando, Admos, Diana, David, Phil,
Prasenjit, Osman, Denise, Yinfang the communication team (Minna, Emma, Caroline
and Chris) for making all my blogs, videos come to life and the admin team –
Monique, Elaine, Emma, Peter, Kate, Micheal and James. Everyone has been so kind
and helpful. It has been a joy and honour to get to know all of you. Thank you to Alex
Hughes, Stefano Ponte and Valentina DeMarchi for giving me advice and guidance
through the formative stages of my thinking. #FeelingBlessed.
Through the course of the PhD I realized that ‘’I’ was not the right word to use- it
should actually be a ‘We’, as without the cumulative cooperation of the fantastic
farmers I interviewed and help from my friends, there wouldn’t be a PhD! I owe this
to all of you and words cannot express my gratitude.
Some people describe the PhD process as a very long roller-coaster. But to me it was
not just a roller-coaster, but alsoa haunted house, trampoline, bungee cord and a zip
line. In other words, an extreme theme park, which is both exciting and terrifying I
recall a sunny morning, when I was sitting in the Horticultural Crops Directorate in
Nairobi, looking through a bunch of weather beaten reports in cardboard folders, a
few hours into this very long exercise I was joined by a special friend…
My very own garden snake (I was later told it was a green Mamba!), that was
hibernating in one of the folders I had sitting next to me. I had obviously awoken it as
I manhandled the files! Prompltly the office room was filled with cries of terror, I must
admit I found myself standing atop a table! Eventually someome brave decided to do
something about it and tried to move it out of sight, unfortunately the snake was badly

18
hurt. Apologies! I did not mean to have to battle wild animals #OneScaryRide. And
yes, I did go back to sit at that exact spot to look at more reports, feeling satisfied I
conquered a big fear! Never thought I would have such as adventure while doing a
PhD! Like any ride, at the end there is always a sense of contentment.
#ControllingMyDestiny.
My PhD journey has allowed me to travel through three continents to present my
work and organize sessions #AroundTheWorld; and had the opportunity to meet all
my GVC/GPN academic celebrities. I must admit I was pretty awestruck! I also got to
meet the who-is-who of the policy world – from the WTO, UNCTAD to the ILO!
#MyHeroes. It all ended in the viva voce on the fateful morning of the 18th of October,
I wanted to express my appreciation to Khalid and Peter Dannenberg for taking the
time to read my thesis, give me such insightful feedback and share their wisdom with
me.
Finally, I would like to dedicate this thesis to three people that mean more to me than
anything else in the world. My parents, Manjula and Krishnan, and my sister Anjali.
They are my pillars of strength, my inspiration, and I am everything I am because of
them! Thank you for staying by my side through the ups and downs. I cannot even
begin to tell you how much it meant to me! #MyStrength
As I write this acknowledgement, I feel a sense of finality. The time has come to close
a chapter in my life that I have held onto for so long. Like at the end of all ardours
eventful journeys (some perhaps more heroic than others). I felt the need to go back
to the beginning and sit in the Arthur Lewis building by my desk, where it all began,
and reflect on the last few years.
My desk in the Arthur Lewis building

19
There were two significant nuggets of learning I took away- the first is learning about
the academic world and delving headfirst into a sea of information and the second,
learning was about myself. I am a different person from who I was 4 years ago, in so
many ways that are difficult to explain. I feel like I can be an instrument of change,
that I am ready to go out into the real word armed with the wisdom that I accumulated
and a better sense of self! #ChangeTheWorld #ChangeOneLife?
If I put together all the hashtags – it sums up my PhD life - #FunnyHowLifeWorks,
#MakeADifference, #KenyaOnTheRise, #PositivityPersonified,
#MeetingTheRightPeople, #FeelingBlessed , #OneScaryRide, #ControllingMyDestiny,
#AroundTheWorld, #MyHeroes,#MyStrength, #ChangeTheWorld , #ChangeOneLife
… all in all not I think this is the best decision I ever made!
It is with mixed feelings that I hand in this thesis, I will miss my daily routines, my
cup of tea, my walk to my desk, my interactions with staff and friends. Not only is
GDI my family, but Manchester has grown to be my ‘home’ #IHeartManchester (and
even the rain!). That being said, while I am nervous about what it next, I am also
excited to see what the future holds … and be part of creating a world where we truly
#LeaveNoOneBehind!
Thank you for a million memories …

21

22

1. Introduction
“How green are your [Kenyan] beans?” (Prospect magazine, 2009)
“Horticultural production is primarily involved in the intensive use of resources, such as land,
water, labour and inputs such as fertilisers and pesticides. The use of such resources in a
concentrated space and time has the potential to negatively impact on the local environment
and worker welfare” (Wainwright et al., 2014: 503)
The quotes presented above elucidate the centrality of the environment in
horticultural production. The first is a headline from a popular magazine, which
brings to light the potential implications on the environment when exporting Kenyan
produce to Northern markets (such as the European Union) through global value
chains, while the second quote explicates the effects on natural resources of farmers
and their level of well-being. The significance of horticulture in Kenya is magnified
because fresh fruits and vegetables (FFV) have become one of the country’s foremost
foreign exchange earners with over 3.5 million farmers depending on it for their
livelihoods (SNV, 2012). This underlines the importance of systematically
understanding and measuring the role of the environment in shaping farmers’ ability
to grow produce and sell to Northern markets. However, for farmers to participate in
Northern markets, they need to comply with stringent private standards with
escalating environmental requirements that are mandated by global (or Northern)
supermarkets. Farmers who are unable to cope with these standards tend to get
marginalized from these markets.
Simultaneously, regional supermarkets in Kenya have expanded by over 200%
between 2007-2014, and have pushed for the development of private ‘regional
standards’ and codes of conduct, with burgeoning environmental requirements
(Barrientos et al., 2016a; Krishnan, 2017) as part of regional value chains. Although
this outlet provides farmers with an option to diversify their end markets, it also
demands acquisition of new skills to comply with regional codes. Thus, an increased

24
possibility of marginalization from regional markets also arises. Research on value
chains has focused primarily on North-South linkages and has not adequately studied
the emergence and implications of South-South (or polycentric) trade (Horner and
Nadvi, 2017) or of the environment (Bolwig et al., 2010). Furthermore, the possibility
of exclusion from participation in both Northern and regional markets is further
exacerbated by bio-physical aspects of climate variability (sudden rise/fall in
temperature and rainfall) and climate extremes (increasing frequency of droughts)
that impinge on crop quality, yield and condition of natural resources (Challinor et
al., 2007).
Thus, a key empirical knowledge gap emerges, suggesting a need to compare and
contrast the different types of environmental pressures emerging from standards and
bio-physical aspects that impact farmer’s ability to cope and participate in not only
Northern but also regional markets. I classify a third category of farmers - local
farmers, who sell to domestic wholesalers, kiosks and spot markets, and use them as
a counterfactual to compare across farmers selling to global and regional markets.
Such a comparison helps unpack whether participating in different markets leads to
sustainable environmental outcomes.
In order to address the empirical knowledge gap described, I utilize global value chain
and global production network approaches. Global value chains (GVCs) explicate
input-output structures of how goods and services are produced and flow between
fragmented stages, of production to consumption (Kaplinsky and Morris, 2001). GVCs
primarily focus on the importance of global lead firms, and how they govern i.e. exert
power on the other actors within the chain (Gereffi, 1999). This suggests a skewed
focus on vertical forms of governance (Henderson et al., 2002). Global production
networks (GPNs), expanded the concept beyond the vertical to incorporate horizontal
actors. They stated the inclusion of horizontal actors posited the polycentric nature of
relations (ibid). Furthermore, through the concept of embeddedness they included
socio-cultural aspects which provide a path dependent context to network formation
25
and development (Henderson et al., 2002; Hess, 2004). Nielson and Pritchard (2009)
argue that both concepts inter-related and thus this thesis will use them as
complementary concepts.
I theoretically/analytically interrogate the current understandings of upgrading,
embeddedness and governance in global production networks/ global value chains
(GPNs/GVCs), by building on these concepts with three key aspects in mind. The first
relates to integrating the environment more deeply into concepts of embeddedness,
which I do through pushing the boundaries of embeddedness to develop what I call
re-environmentalization; and by rethinking how to conceptualize and measure
environmental upgrading. The second aspect, is to move beyond conventional North-
South understandings of GPNs/GVCs to include within its remit emerging regional
production networks (RPNs) and local production networks (LPNs) and the
implications of the co-existence of GPNs, RPNs and LPNs, which enables unpacking
what governance is and means across production networks. The final aspect is
associated with the level of analysis and the point of entry. In this thesis, I
epistemologically focus on the farmer thereby going beyond the lead firm centric
approach that is common for production network/value chain (GPN/GVC) analysis.
By combining these three aspects, I arrive at my overarching research question: What
are the dynamics of environmental upgrading, embeddedness and governance for farmers in
global, regional and local production networks? I aim to show the dynamic and
heterogeneous nature of how - across global, regional and local production networks
- farmers’ environmentally upgrade, the outcomes of upgrading and illustrate how
embeddedness and governance shape farmers’ ability to environmentally upgrade.
Methodologically, I take a mixed-method approach. While GPN (and related GVC)
research has been dominated by qualitative work, there is a need for “finding common
ground” (Coe, 2012: 395) between rigorous quantitative analysis and qualitative case
studies (Coe et al., 2004; Hess and Yeung, 2006). This thesis endeavours to address this

26
need by using a mix-method approach which includes data collection through a novel
sampling methodology, a survey of 579 farmers, 102 in-depth interviews and 5 focus
group discussions; and data analysis through qualitative means and econometric
analysis. Thereby, I seek to achieve validated, robust and triangulated results.
The objective of this chapter is to identify the key empirical and conceptual knowledge
gaps and provide an overall research context to help address these gaps. The chapter
is structured into four sections. The first section develops the empirical case for
Kenyan horticulture, outlining the evolution of Northern and regional markets, as
well as the environmental challenges faced by farmers. In the second section, I discuss
the rationale for using a GPN/GVC lens, and expand on the importance of integrating
the environment and using a farmer-focused epistemological stance, which I
investigate across multiple production networks. The third section examines the
research sub-questions in more detail and provides an overall structure of the thesis.
The final section fleshes out the key conceptual, methodological and empirical
contributions to knowledge this research will provide.
1.1 Research gap: Kenyan farmers, the environment and multiple end
markets
There has been much research on farmers selling through GVCs to Northern markets
having to comply with increasingly stringent sustainability standards, incorporating
rigorous environmental requirements (e.g. Ponte and Ewert, 2009). However, research
on value chains has insufficiently focused on growing regional southern firms that
trade within a single world region, such as a continent or bloc (Evers et al., 2014;
Horner, 2016) as opposed to trading globally (across world regions i.e. North-South).
This is especially important given the rapid proliferation of regional markets and
regional environmental standards; along with the possibilities for farmers to supply
simultaneously into both Northern and regional markets (Pickles et al., 2016;
Barrientos et al., 2016a). This raises a key empirical question relating to the different
27
types of environmental pressures that exist and whether they play out differently for
farmers selling into Northern or Southern end markets.
In this section, I provide the research context by identifying the multiple layers of
environmental pressures, including bio-physical aspects of climate variability and
climate extremes, farmers experience whilst supplying into Northern and regional
markets. I also compare these to a counterfactual group of farmers supplying into
LPNs in Kenya. I highlight the rationale of selecting FFV as a case study, the
evolutionary dynamics of how farmers began selling into both Northern and regional
markets, specifically focusing on the growth of supermarkets. Overall, this
necessitates conceptual extension of GPN/GVC analysis to account for the
environment, epistemological shifts and participation across different production
networks, which I discuss further in section 1.2.
1.1.1 The importance of FFV in Kenya and the growth of Northern markets
African fruit and vegetable exports grew nine-fold from US$ 1.26 billion (2.5% share
of world fruit and vegetable trade) in 2001 to US$ 12.36 billion (8.3% share of world
trade) in 2012 (ITC, 2014). Within the fruit and vegetable sector the ‘fresh’ category
has seen a phenomenal increase in Sub-Saharan Africa (Jaffee, 2003; Minnot and Ngigi,
2004; Jaffee et al., 2011). Kenya is the second largest exporter of fresh fruits and
vegetables (FFV) from Sub-Saharan Africa, with FFV being one of the country’s
foremost foreign exchange earners (HCDA, 2012), having contributed 33% of
agricultural GDP in 2013 (World Bank, 2015) and having grown at a compound rate
of 10-12% per annum from 2003-2013 (ITC, 2014). An estimated 3.5 million farmers are
involved in horticulture production in Kenya making it an important source of
livelihoods (KHCP, 2014; SNV, 2012). Table 1.1, shows that the volume and value of
exports of FFV continues to increase. Although there was a dip in export value
between 2010 to 2014, due to Kenya’s non-compliance with the European Union (EUs)
maximum residue level (MRLs) requirement on their crops. Nevertheless, the unit
value has continued to rise steadily.

28
Table 1.1: Kenyan exports and unit values
Sector analysis 2001 2005 2010 2013 2015
Export of FFV (volumes '000MT) 45.58 87.00 156.31 119.10 131.43
Export of FFV (value Million
KES)
4248.27 17054.00 24205.70 21936.00 25279.24
per unit of FFV exported
(KES/kg)
93.21 196.02 154.85 184.18 192.34
Source: ITC 2016
It is estimated that only 10% of Kenyan FFV production is exported, yet exports
contribute to over 80% of total FFV revenues (Krishnan, 2017) and are thus a critical
income stream for the sector and the country. The key Northern markets for export of
FFV commodities remain the EU, especially the UK. The UK imports approximately
66% of Kenya’s fresh vegetable exports and about 10% of fresh fruit as of 2014, whilst
the rest of the EU imports about 26% of Kenyan fresh vegetables. The key vegetables
exported include green beans (60% of total vegetable exports), followed by peas which
include snow peas, garden peas and snap peas, that make up 15% of vegetable exports
(HCDA, 2016). In recent years, the rate of increase in snow and garden peas are at par
with green beans (ibid). In terms of fresh fruit, avocados and mangoes constitute
almost 90% of all Kenyan fruit exports making them important cash cows (ITC, 2014).
The thesis will thus focus on snow peas, garden peas, avocados and mangoes because
of their growing importance in the Kenyan context. In chapter 4, I delve into further
details on each of these commodities.
1.1.2 Marginalization due to standards developed by Northern supermarkets
Here, I lay out a brief historical account of how Northern supermarkets, especially
from the EU, entered into Kenya and how this changed livelihoods of Kenyan farmers.
Much of the high value FFV was first introduced to Kenya in the early 1900s, with
white settlers founding the East African Agricultural and Horticultural Society (Minot
and Ngigi, 2004). By the 1960s a large inflow of foreign direct investment had begun,
especially in Kenyan pineapples spearheaded by lead firms such as Del Monte. This
was the beginning of the marginalization of smallholder farmers, since they could not
meet the quantity and quality requirements of large exporting houses and therefore

29
could only sell produce to local markets (ibid). For instance, private sector foreign
direct investment flooded Kenyan horticulture in the mid-1960s, and brought with it
-new crops and technology which restructured the institutional and regulatory
environment within Kenya (English, Jaffee and Okello, 2004). It subsequently led to
the formation of the Horticultural Crops Development Authority (HCDA) in 1967
which played a facilitative role in co-ordinating various participants in the industry
(Dijkstra, 1997; Harris et al, 2000).
When UK supermarkets first entered the market, they purchased from wholesalers.
Although this provided flexibility in terms of sourcing from numerous producers and
through a number of distribution channels, it prevented supermarkets from
specifying product parameters along the chain or having any control over the process
of production (Dolan and Humphrey, 2004; Dolan, Humphrey and Harris-Pascal,
1999). By the 1990s supermarkets gained approximately 80% of the FFV market share
and began restructuring of the chain (ibid).
Supermarket restructuring occurred to maintain their competitive edge, meet
increasing consumer demands of food safety, comply with mandatory regulatory
requirements of public authorities and capture higher market shares. Consequently,
supermarkets began dictating terms of trade to Kenyan producers (Jaffee, 2003; Dolan
and Humphrey, 2004; Ouma, 2010; Jaffee, et al., 2011). They also started developing
their own private food hygiene and quality standards, which they imposed on
suppliers, who in turn pushed the costs and responsibility onto producers, mostly
small-scale farmers in Kenya, which make up 80% of FFV producers (Evers et al., 2014;
ITC, 2011). For example, indigenous varieties of mangoes (e.g. Batawi), avocados (eg:
G6 and Pueble) and garden peas were replaced by export varieties such as Apple
Mangoes, Haas Avocados and Ambassador peas; and new products that were non-
indigenous to Kenya such as snow peas were introduced in the mid 1970-80s
(Krishnan, 2017). This meant that not only did Northern supermarkets exude control
30
over the production practices of farmers through standards but also over the ‘types’
of crops that were produced.
Many studies have documented that private standards are key tools used by Northern
supermarkets to control the quality and volume of production of FFV in Kenya. The
most important standard in horticulture in Kenya is GlobalGAP, which was
developed by Northern retailers, (Djama et al., 2011). GlobalGAP is a business to
business sustainability and food safety certification with several hundred control
points and compliance criteria (GlobalGAP, 2016). The evolution of such standards
began between 1997 and 2000 as EU legislative policy developed a series of hygiene
controls and food safety measures through directives (Henson and Mitullah, 2004). At
the same time, European retailers formed a producer working group that created
EurepGAP, a certification scheme that encompassed EU legislative policy and was
marketed to countries such as Kenya, as falling broadly under the remit of good
agricultural practices (Garbutt, 2005). EurepGAP eventually evolved into GlobalGAP.
Although instated as voluntary standards, they have rapidly become ‘defacto
mandatory’ and thus created barriers to entry (Henson, 2008). There is not just
GlobalGAP, but several other standards also exist such as Rainforest Alliance and
Organic, which are continuously remodelling themselves to include more
environmental components to meet the changing demands of the market. GlobalGAP,
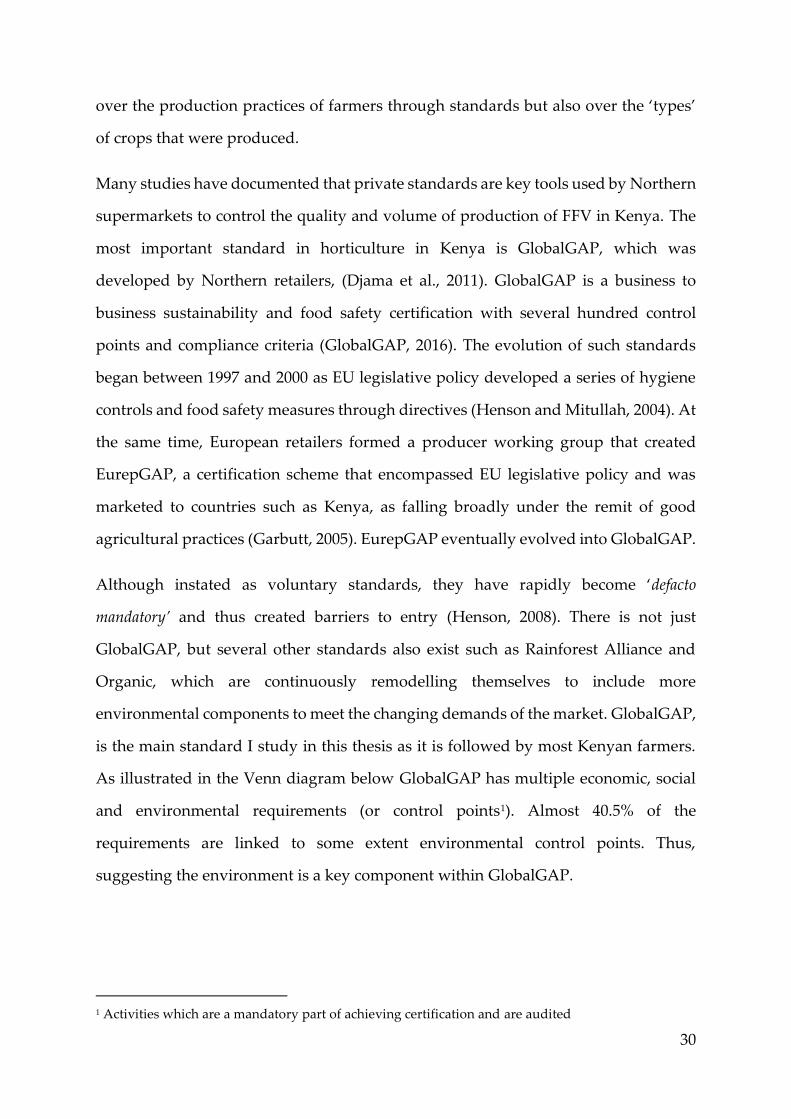
is the main standard I study in this thesis as it is followed by most Kenyan farmers.
As illustrated in the Venn diagram below GlobalGAP has multiple economic, social
and environmental requirements (or control points1). Almost 40.5% of the
requirements are linked to some extent environmental control points. Thus,
suggesting the environment is a key component within GlobalGAP.
1 Activities which are a mandatory part of achieving certification and are audited

31
Figure 1.1: GlobalGAP requirements: economic, social and environmental
Source: Author’s analysis of GlobalGAP control points
Even private supermarket standards such as Tesco Nature and M&S Farm to Fork
began evolving with greater focus on environmental requirements, due to pressures
from consumers, Non-governmental organization (NGOs) and Civil society
organizations (CSOs) (Hughes, 2000; Nadvi, 2008). This led to setting sustainability
agendas and goals through various measures, including greener goals for business
and CSR activities, which are meant to contribute to ‘economic development while
improving the quality of life’ (WBCSD, 1999:3). For instance, UK supermarket
Sainsbury’s goals is to reduce pollution throughout its food network (Sainsbury,
2013). This has increased the depth of supermarket environmental requirements
through boosting environmental components in private standards and these global
environmental requirements trickle down to the local level (Nelson and Tallontire
2014). Farmers experience pressures such as the mandated use of certain types of
inputs like organic fertilizers, or changing processes like irrigation methods, waste
recycling or implementing conservation techniques (Ouma, 2010; GlobalGAP, 2014)
which they need to fulfil in order to sell to Northern supermarkets. When Kenyan
farmers cannot fulfil environmental mandates, or comply with such standards, they
are marginalized from selling to Northern supermarkets (Barrientos and Visser 2013;

32
Evers et al., 2014). Furthermore, even LPNs in Kenya are slowly changing, with main
buyers such as local wet markets becoming increasingly regulated by municipal
authorities and several local brokers registering with the government (Krishnan,
2017). The formalization of these markets has caused a demand for better quality
produce (ibid).
1.1.3 The proliferation of regional and local supermarkets and standards in Kenya
With approximately 90% of FFV (by volume) sold to the local markets and regional
supermarkets (Muendo et al.,2004; Evers et al., 2014), it is vital to examine the regional
dynamics of FFV markets. The growth of supermarkets in the Global South began
with liberalization of foreign direct investment (FDI) in retail and food processing in
the private sector, leading to what Reardon et al (2003) call a ‘supermarket revolution’.
The ‘tidal wave of FDI’ (pg: 1143) commenced in the mid-1990s across South America,
East Asia and South Africa, followed by a second wave in South East Asia, Central
America and Mexico in the late 1990s, and then most Sub-Saharan Africa countries
(except South Africa) in the third wave that was set in motion in the early 2000s
(Reardon et al., 2003; IFPRI, 2005). Kenya is firmly placed in the third wave of the
supermarket revolution. However, unlike other sub-Saharan countries, for instance
Zimbabwe and Zambia, supermarkets are ‘home grown’ in Kenya, i.e. they are funded
almost completely through indigenous private and government investment, rather
than FDI inflows (Neven and Reardon, 2004).
Supermarkets (a term used here to also refer to hypermarkets, discount outlets and
convenience stores) in Kenya have expanded from an insignificant niche market in the
1990s to over 20% of urban food retail in 2003 (Neven and Reardon, 2004) to 34% in
2014 (Euromonitor, 2015)2. Larger Kenyan chains, such as Nakumatt, Uchumi,
Chandarana and Tuskys, were founded in between the 1960s-1980s, followed by
smaller chains such as Naivas and Zucchini in the 1990s. Together these six retailers
2 Country level results are about 10% of national grocery sales in 2014 (Planet retail, 2014)
33
are estimated to control over 95% of all Kenyan supermarket FFV sales, which is about
7-8% of total domestic FFV sales (Krishnan, 2017). The number of supermarket outlets
in Kenya has followed an upward trend, growing from approximately 60 in 2007 to
192 by 2014 (author calculations), an increase of 200% suggesting intense domestic
inter-chain competition.
Furthermore, revenue earned by the three largest supermarkets increased by 43%
between 2007 and 2014, a substantially faster growth rate than the more saturated
supermarkets in Europe (McKinsey, 2015). FFV sales in Kenya have increased from a
minor share of 1-2% of supermarket turnover in 2007 to 5-10% in 2015 (ibid). The
Kenyan Economic Survey 2012 indicated that retail (and wholesale) trade was the
second biggest contributor to the country’s economic growth (18.5% compounded
growth rate between 2008-2012). Kenyan supermarkets have expanded not only into
urban and peri-urban areas within Kenya, but they have also expanded regionally
within East Africa (Barrientos et al, 2016a).
To differentiate themselves from traditional markets, Kenyan supermarkets require
farmers to comply with private standards or public standards (IFPRI, 2005). In terms
of regional supermarket private standards, Neven and Reardon (2004) and Krishnan
(2017) find that most Kenyan supermarket chains (Uchumi, Nakumatt, Tuskys,
Chandrana, Naivas) have not developed written standards, and instead range from
purely visual (based on product appearance) to more specific (showing records of
types of pesticides applied for example). However, supermarkets often expect farmers
to comply with the Horticultural Crops Directorate (HCD) Code of conduct for good
agricultural practices, a regional public standard.
In 1995, the HCDA3 set up its first code of conduct as a memorandum of
understanding between the buyer and the seller, however more recent versions of
3 Over the last 3 years, the horticultural crops development authority (HCDA) has been granted more
autonomy and renamed to the Horticultural Crops Directorate (HCD) under the Agriculture and

34
these guidelines are focused on ensuring that exporting companies fulfil all
GlobalGAP requirements (Waarts and Meijerink, 2010). The HCD code of conduct was
expanded to include regional supermarkets in 2010, by creating a ‘stripped down’
version of GlobalGAP. Recently it is increasingly incorporating environmental
requirements within the remit of their standard. Approximately, 54% of the
requirements within the HCD code of conduct are environmental (including overlaps
with economic and social requirements). A similar endeavour was undertaken in 2004,
trying to create KenyaGAP (that was benchmarked to GlobalGAP) to attune to local
conditions (Tallontire et al., 2005, 2011). The Fresh Produce Exporters Association of
Kenya (FPEAK) was a key business association that abetted formalizing and
developing KenyaGAP (ibid). However, KenyaGAP failed to take off due to the lack
of uptake or support from international retailers (Ouma, 2010; Tallontire et al., 2011).
Although regional supermarket standards are less stringent than their European
counterparts, regional supermarkets are increasingly implementing higher levels of
quality control to maintain their competitiveness (Barrientos et al., 2016a).The uptake
of regional standards has led to formalization of crop procurement (Reardon and
Berdegue, 2002), by creating preferred supplier lists i.e. selecting suppliers who not
only comply with regional standards but can also provide steady year-round, reliable,
good quality supply at competitive prices (Hernandez et al., 2007). If farmers are
unable to cope with environmental pressures and regional standards, it also may lead
to marginalization and exclusion due to the evolving stringency of regional standards
and regional supermarket code of conducts (Pickles et al., 2016; Krishnan, 2017).
The change in local production networks is also evident. Krishnan (2017) shows that
high rejection rates of export from Northern markets have allowed better quality
produce to flow into local markets. Thus, local buyers such as wholesalers, wet
Food Authority. This move came in relation to devolution in Kenya as well as in response to the
Maximum Residue Limits scare of 2010. As a result, while its previous role mainly consisted of co-
ordination of agricultural activities, the HCD has gained increased ability to regulate, enforce
contracts and provide conflict resolution mechanisms in order to reduce contract risk
35
markets and brokers have begun demanding better quality produce to compete with
Kenyan supermarkets and ensure they meet consumer demand (ibid). This suggests
that development of local markets is effected by both Northern and regional markets.
Thus, there is a need to interrogate how farmers selling into regional supermarkets
and to local buyers, are different from those selling into Northern markets, by taking
into account new environmental pressures, changes in procurement strategies and the
possibility of a new waves of marginalization. In Chapters 2 and 3, I endeavour to
conceptually unpack the factors that cause environmental pressures and
marginalization when selling into global, regional supermarkets and local markets
respectively. In the next section, I outline the varying types of environmental
pressures experienced by farmers, not only those that emerge from Northern or
regional standards but also bio-physical hazards of climate variability and extremes,
which are normally beyond the remit of sustainability standards.
1.1.4 Types of environmental pressures across production networks
Global and regional standards usually do not include mandatory requirements linked
to bio-physical pressures of climate variability or extremes. For instance, sustainability
standards such as GlobalGAP and Organic set out some criteria for adapting and
mitigating uncertain climate conditions (e.g. GlobalGAP, 2014; Organic, 2017) but
these are generally vague and are not critical for attaining certification (ibid)4. Several
research articles provide evidence (Kabubo-Mariara and Karanja, 2007; Morton, 2007;
Challinor et al., 2007; Rao et al., 2011) that small-scale farmers, especially in Kenya,
struggle coping with climate variability and extremes (droughts, floods), causing loss
in assets, income, livelihoods, crop quality and productivity, which in turn impact
ability to sell to global or regional supermarkets.
4Even Rainforest Alliance focuses most resources on REDD+ or carbon project validation and not on
adaption (Rainforest, 2017)
36
Climate variability refers to fluctuations of precipitation (rainfall) and temperature
above the ‘mean average conditions’, with experiencing below ‘normal’ conditions
and others experiencing above ‘normal’ conditions (Semenov and Porter, 1995; Katz
and Brown, 1992)5. Climate variability causes sudden increases (or decreases) in
temperature and rainfall, which directly impact crop production by reducing
productivity and yields between 5-40% in semi-arid regions of Kenya (Herrero et al.,
2010; Lobell and Field, 2007; Rao et al., 2011), diminishing plant health by increased
pest attacks (Rotter and Van De Geijn, 1999), affecting plant defence mechanisms
(Coakley et al., 1999; Cammel and Knight, 1992), and enabling growth of new
pathogens amplifying probability of diseases (Cannon, 1998; Gritti et al., 2006).
Over the short term, such variability can result in soil erosion, drops in water levels,
increased runoff, reduced biodiversity (Arnell, 1999; Olesen and Bindi, 2002), while
the long-term effects lead to loss of livelihood (Government of Kenya, 2013). This has
significant consequences because only 12% of Kenya’s total land area is considered to
have high potential for farming (Kabubo-Mariara and Karanja, 2007). Together, these
factors affect crop volumes, quality and also indirectly impact on the ability to adhere
to the GAPs set out in food standards (Hall and Allen, 1993; Bolwig et al., 2010), thus
potentially causing many farmers to default on contracts and be blacklisted from
global and regional supermarket supplier lists.
Additionally, as Coppola and Giorgi (2005) demonstrate, the occurrence of extremes
is likely to outstrip changes in climate variability, causing even more serious damage
to farmer crop production such as decreases plant’s water use efficiency, changes in
patterns of seasonality by shrinking the growing season, livelihoods and health
5Climate change is distinguished from climate variability because it entails a change in the state of
climate over decades or longer (IPCC, 2007). Although climate change exerts significant influence on
farmers’ decision making, the yield of crops in a given year depends on the meteorological conditions
of that specific year. These year to year changes in mean state (standard deviation) of nature are
climate variability (Burke & Lobell, 2010). This research will focus on the short-term changes in
climate i.e. climate variability that cause serious impacts on farmers’ welfare (Rao et al., 2011)

37
(Rosenzweig and Hillel, 1998; Coakley et al., 1999; Rounsevell et al., 1999; Government
of Kenya, 2013). Extreme events such as floods destroy the limited infrastructure
leaving already resource scarce farmers with no recourse (Bryan et al., 2013). The
Kenyan National Climate Change Action Plan 2013-17 (KNCAP) delineates the annual
burden of climate variability and extremes to be equivalent to 2.6% of country’s GDP.
Thus, bio-physical environmental pressures of climate variability and extremes, risk
compounding exclusion and marginalization of farmers from participating in global,
regional or local production networks. This thesis therefore, attempts to integrate such
bio-physical aspects into GPN and GVC analysis through the concept of adaptation
(e.g. Adger et al 2005, Adger et al 2007), so that the full gamut of aspects of ‘the natural
environment’ can be fleshed out.
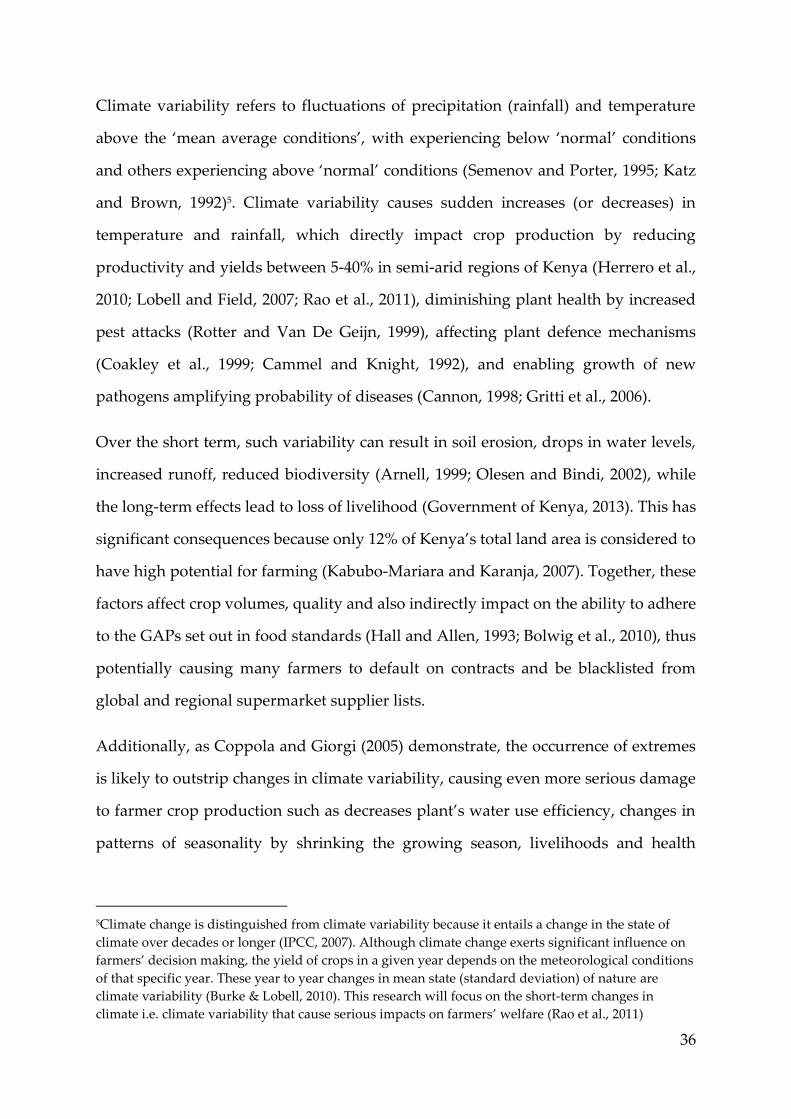
In sum, Figure 1.2 provides a simplistic depiction of the layers of environmental
pressures which affect the participation of farmers supplying to global, regional
supermarkets and local markets. It elucidates that farmers supplying to global
supermarkets haveto interact with Northern standards and the respective
environmental requirements arising from those. Farmers supplying to regional
supermarkets adhere to regional standards like the HCD code of conduct or specific
standards of regional supermarkets. However, both types of farmers need to cope
with local level bio-physical hazards of climate variability and extremes. In sum,
farmers need to reconcile multi-layer environmental pressures originating from their
networks of production.
38
Figure 1.2: Layers of environmental pressures
Source: Author’s construction
This warrants a need to compare the different factors that affect farmers’ ability to
cope with environmental pressures when selling into multiple end markets. It
involves consideration of whether adhering to Northern or regional standards abets
improving farmers’ environmental outcomes and if it leads to sustainable production.
This empirical gap calls for conceptually linking the environment with VC/PN
analysis, and analytically change its focus so as to account for farmer experiences in
the context of changing end markets. In the following section, I discuss the importance
of developing a theoretical case that accounts for the aforementioned points.
1.2 Conceptual gap: the importance of the environment across global,
regional and local production networks
As explained in the previous section, in this thesis I aim to contribute to GPN/GVC
analysis in three ways to address the empirical gap. The first, is to take into account
the ‘environment’ more holistically. The second, is the need to re-centre the point of
entry into GPN/GVC analysis to consider epistemologies from a farmer perspective
and therefore give farmers more agency in the process. The third, is an attempt to
analytically unpack how production networks are restructured with the proliferation
of regional supermarkets (i.e. the emergence of new lead firms in the Global South)

39
standards and procurement practices and local buyers. This is achieved by rethinking
what the core components of the GPN/GVC framework - embeddedness, governance
and upgrading, would mean when accounting for the environment, farmer
perspectives and multiple end markets. In this section, I start by discussing the
rationale for using a value chain and production network lens, followed briefly by
how I plan to add these three dimensions into the GPN/GVC framework (chapter 2
and 3 thereafter provides a detailed conceptual discussion).
1.2.1 Rationale for using production network and value chain frameworks
The dis-integration of production and the change in trade flows of capital,
intermediary and final goods has spurred the development of global value chains and
global production networks, that account for a growing share of overall production
and employment worldwide, especially in export-oriented industries (e.g. Feenstra
1998). The emergent literature on global value chains (GVCs) has focused on how
production and material flows are organized and has detailed how global ‘lead’ firms
(multinational corporations) are increasingly becoming more powerful and
controlling how transactions within these chains are governed (Gereffi, 1994; Gereffi
1999; Gereffi et al., 2005). The GVC framework is geared towards understanding how
inter-firm linkages spanning international borders between lead firms and suppliers
are governed, as well as the related trajectories of upgrading (Gereffi et al., 2005).
Gereffi and colleagues’ pioneering work on GVCs was further developed by
researchers who drew on network analysis as relational processes in which power is
exercised (Dicken et al., 2001; Dicken, 2003) through expounding the concept of global
production networks (GPNs). The GPN framework extends the linear nature of the
vertical relationships put forward by the GVC approach to include horizontal actors
(non-firm: governments, CSOs, NGOs, community) (Henderson et al., 2002; Coe et al.,
2004), as well as socio-cultural dynamics through the concept of embeddedness (Hess,
2004). This thesis will draw on governance and upgrading aspects from GVC
literature, and embeddedness from GPN literature to discuss three key pillars of
40
GPN/GVC frameworks. With increasing recognition of the similarities in insights of
the two approaches (e.g. Neilson et al., 2014), GPN and GVC will be adopted as
complementary frameworks.
1.2.2 Importance of adapting the GPN and GVC framework: Environment,
epistemologies and multiple end markets
Thus far, GVC and related GPN analysis has insufficiently interrogated how the
natural environment shapes and influences participation, upgrading and how it
restructures the production networks (PNs) (Hudson, 200; Bolwig et al., 2010; Riisgard
et al., 2010). Directly or indirectly production, distribution and consumption in PNs
impinge on the natural environment, be it in terms of resources extracted for inputs
or impacts (e.g. pollution, biodiversity loss) as a result of outputs (Bridge, 2008; Coe
et al., 2008). Thus, each node and actor interacts with the natural environment in
different ways (Turner et al., 1994). Moreover, by virtue of their location and
livelihoods, farmers are tied to their farmlands and natural environment, and thus are
‘doubly exposed’ to both the effects of globalization (GPN participation) as well as
bio-physical hazards (O'Brien and Leichenko, 2000; Leichenko and O'Brien, 2008). As
I lay out in the previous section, climate variability and extremes are beyond the remit
of standards, yet directly impede the ability of farmers to participate in GPNs. Thus,
this thesis seeks to integrate these bio-physical pressures within the concept of
embeddedness and environmental upgrading in chapter 2 and 3 by drawing literature
on ‘adaptation’ to climate stresses. This allows for holistically integrating different
elements of the natural environment in PN/VC frameworks. Overall, I seek to build
an environmentally integrative conceptual framework to abet addressing the
empirical gap.
The second modification to GPN/GVC analysis is an epistemological one. The GVC
perspective gives prominence to TNCs or lead firms6 in the global North, which
6The term lead firms does not refer mainly to the market share of such firms, in comparison to other firms in the
same functional position, but to the fact that they (as a group) control certain functions and thus dictate the terms
of participation by other actors in different functional positions in the value chain. (Ponte and Gibbon, 2005)
41
determine the organization of the chain (Gereffi, 1994, 1999; Humphrey and Schmitz,
2002; Gereffi et al., 2005; Gibbon and Ponte, 2005; Nadvi, 2008; Lee and Gereffi, 2015).
Even GPN perspectives are biased towards organizational loci of lead firms or large
second tier suppliers (Yeung, 2006; Coe and Wrigley, 2007; Yeung and Coe, 2015),
powerful national or regional governments (e.g. Liu and Dicken, 2006), and sizeable
labour organizations (Cumbers et al., 2008; Rainnie et al., 2011). Thus, such research
has highlighted the centrality of global lead firms and large organizations in shaping
how local actors (farmers, suppliers, workers) in the global South insert into
GVCs/GPNs and the resultant upgrading possibilities. Yet it is argued, this emphasis
has a key limitation, insofar as it lacks a ‘refined model of agency, one that can better
help us understand the local dynamics’ (Murphy and Schindler, 2011:67).
To better capture local dynamics, there is a need to conceptualize an epistemological
shift in the ‘perspective’ which the PN is framed by. This is executed by re-centring
the GPN so that the analytical ‘entry point’ is farmers rather than northern lead firms.
Therefore, the GVC/GPN is mapped with a “farmer” frame of reference (I discuss this
further in Chapter 4), and moving away from global lead firm centrality. This
contributes to GPN and GVC scholarship by creating a conceptual space for the
agencies of low-tier southern actors (Murphy, 2012), and enabling understanding of
embeddedness, upgrading and governance structures through the perspective of
farmers.
The third issue within the current research on GPN/GVC analysis is the insufficient
focus on emerging polycentric trade be it through regional production networks
(RPNs) with southern lead firms, or growing domestic markets (Horner and Nadvi,
2017). This is especially important given the discussion on the rapid proliferation of
regional supermarkets, local markets, regional environmental standards, and the
possibilities that GPNs, RPNs and LPNs can co-exist in similar territories.

42
This thesis attempts to perform a comparative analysis across farmers participating in
GPNs, RPNs and local markets, and by doing so elucidates that dynamic and
heterogeneous processes involved in how each of these actors environmentally embed
into global, regional and local markets; how the governance patterns vary and the
diverse environmental upgrading trajectories traversed. Thus, I will be able to shed
light on the factors that cause environmental pressures and the related outcomes that
emerge across farmers. This enables answering the main research question of - What
are the dynamics of environmental upgrading, embeddedness and governance for farmers in
global, regional and local production networks?
1.3 Research questions and structure of the thesis
The main research question is broken into 5 sub-questions. The first two sub-questions
are more conceptual, while the last three are empirical.
The first conceptual research sub-question is -how can environmental dimensions be
inserted into conceptualizations of embeddedness and how does governance differ across
farmers in global, regional and local production networks? This question effectively has two
parts and seeks to first integrate the natural environment into conceptualizations of
embeddedness, which encompasses the socio-spatial arrangements in which firms
functionally, territorially and relationally embed (Henderson et al., 2002). I examine
this in Chapter 2 by extending the concept of territorial embeddedness to account for
the natural environment. Subsequently, I coin the term re-environmentalization to
capture the different ways in which farmers alter socio-ecological relationships to
embed into GPNs and RPNs. Addressing the latter half of the question, I explicate
governance through the lens of a farmer, unearthing how farmers’ experience
governance, in GPNs, RPNs and LPNs. I expedite this by deconstructing the key
variables of complexity, codification and capabilities by building on Gereffi et al.’s
(2005) framework on inter-firm governance. In the thesis, I express codification and
capabilities as consisting of internal (tacit) and external (more explicit) forms of
knowledge and implicit (ex-ante) capabilities.
43
The second conceptual research sub-question aims to conceptualize environmental
upgrading and its outcomes for farmers in global, regional and local production networks. I
unpack this in Chapter 3 by building and expanding the current understandings of
environmental upgrading (e.g. De Marchi et al., 2013a, 2013b). I develop three key
types of environmental upgrading- product, process and strategic, and nuance them
to account for different levels of complexity and climate variability. By using an
epistemological position of a farmer, I explicate what upgrading means to a farmer,
thereby shifting away from comprehending upgrading from a lead firm centric
perspective, as is prevalent within economic upgrading literature. I also provide a
systematic way to measure environmental outcomes (using indicator based methods),
which occur as a consequence of environmental upgrading.
In Chapter 4, I layout the research strategy, which includes mapping the GPN, RPN
and LPN, as well as listing the various methods used in data collection and analysis.
This thesis has a multi-level research strategy. It first begins by mapping global,
regional and local production networks, and re-centring them in order to consider the
farmer as a point of entry into the network. The results from mapping are then used
to develop a mixed-method approach to primary data collection and analysis. The
benefits of using both quantitative and qualitative modes of inquiry, is that it aids in
converging findings by triangulation, thereby providing a more comprehensive and
robust account of the results. This chapter also explicates a systematic sampling
procedure to ensure results are close to representative.
The third, fourth and fifth sub-questions are empirically driven. The third question,
addressed in Chapter 5, is: How do the environmental dimensions of embeddedness and
governance vary across farmers participating in global, regional and local production
networks? The chapter primarily draws on concepts from chapter 2 and is supported
by empirical evidence gathered through the survey, interviews and focus group
discussions in chapter 4. Chapter 5 begins by delving deeper into societal, territorial
and network embeddedness in a GPN, RPN and LPN context, before explaining the

44
dynamic and heterogeneous processes of how these farmers re-environmentalize,
showing that farmers re-environmentalize into RPNs with most ease compared to
LPNs and GPNs. The second section of this chapter focuses on factors shaping
governance- complexity, codifiability and capabilities. I find that RPN farmers have
better ability to internalize knowledge compared to LPN and GPN farmers. While
GPN farmers receive the most external knowledge, they are unable to internalize
knowledge efficiently because of the low trust in their buyers and weak bargaining
position.
Chapter 6 addresses the fourth research sub-question: Do Kenyan horticultural farmers
participating in global, regional and local production networks environmentally upgrade
heterogeneously and to what extent do embeddedness, codifiability and capabilities affect
environmental upgrading? Overall, I find that GPN farmers environmentally upgrade
the most followed by RPN and LPN farmers. This chapter demonstrates that processes
of embedding in GPNs, RPNs and LPNs (through re-environmentalization) and
governance (depicted through different levels of capabilities and ability to codifying
complex tasks) have a statistically significant impact on environmental upgrading. I
use a sequential econometric model that aids in asserting the different extents to which
re-environmentalization, governance and other controls (including economic and
social upgrading) affect environmental upgrading, and will also be able to show how
these differ across farmers in each PN.
I reveal that the trajectories of environmental upgrading for GPN farmers is contested
because farmers struggle to re-environmentalize smoothly into new networks and are
forced to perform environmental upgrades that are detrimental to their natural
environment/farmland. The case for LPN farmers is quite different, as it is not the
process of embedding into networks, but the lack of extension services and horizontal
actor support that reduces their ability to environmentally upgrade. At the opposite
end of the spectrum, RPN farmers receive both support and are easily able to embed
into new networks, thus environmentally upgrading to levels similar to GPN farmers.

45
In this chapter, I also discuss the linkages between economic, social and
environmental upgrading and downgrading, debunking the assumption of
upgrading always being beneficial, that is prevalent in GPN/GVC literature.
The final research sub-question details the implications of environmental upgrading
i.e. does environmental upgrading lead to positive environmental outcomes? which I discuss
in Chapter 7. While VC/PN research has focused on the effects of economic upgrading,
linked to income (or rent generation for firms), and social upgrading linked to living
wages and entitlements; there has been insufficient analysis of what the
environmental outcomes are. By identifying and measuring the environmental
outcomes, I am able to show that there is a direct correlation between performing more
environmental upgrades and achieving positive environmental outcomes. However,
these differ significantly depending on the complexity of the environmental upgrades
executed.
Finally, Chapter 8 provides an overall summary to the thesis and endeavours to flesh
out further implications of re-environmentalization, upgrading and governance in
VCs/PNs. The chapter touches on the links between upgrading and sustainable
development, by calling for a need to develop a new model for understanding what
sustainable development is and means, in a value chain/production network context.
I also discuss the changing face of regional (South-South) development in the context
of growing formalization of food retail, intimating the possibility of this situation
reproducing older ideas of North-South dominated economic globalization.
1.4 Key contributions of the thesis
This thesis adds to GPN/GVC literature by enriching understandings and
measurements of its pillars of embeddedness, governance and upgrading. In this
thesis, I highlight three types of contributions. The first are conceptual, extending the
production network framework by adding new theories to enhance how we define
and interpret the key pillars of GPN/GVCs. The second are empirical contributions;
and the third type of contribution relates to the measurement and quantification of

46
embeddedness, governance and upgrading. I explicate the contributions of each of
these three briefly here and revisit them in greater depth in Chapter 8.
The conceptual contributions relate to re-conceptualizing embeddedness, governance
and upgrading when accounting for the environment and farmer epistemologies. I
coin the term re-environmentalization to help unpack the level of ‘ease’ or
‘contestation’ involved when farmers attempt to embed into new networks, follow
new practices that emerge from regional and global standards and cope with
uncertain climate variability and extremes. Thus, embedding into GPNs and RPNs
involves not only changes in social relations, but also the environmental relationships
farmers have with their natural environment/farmland. I draw on an array of
literature from network approaches (e.g. Granovetter 1973, 1985; Gulati, 1995),
relational proximity (e.g.: Murphy, 2012), ecological embeddedness (e.g. Penker,
2006.) and adaptation (e.g. Adger 1995, 2006) to enrich the concept of embeddedness
in GPN/GVC analysis. By inserting the ‘environment’ into embeddedness, I am able
to study not only network, societal and territorial forms, but also how they shape and
are shaped by the environment.
A second conceptual contribution relates to systematizing the definition of upgrading
and rethinking environmental upgrading. While economic upgrading has been
defined to focus on firms and first tier suppliers (product, process, functional and
chain upgrading), social upgrading epistemologically concentrates on the workers by
measuring changes in their wages, living standards, and entitlements (Barrientos et
al., 2011). This seems to suggest that the unit of analysis across both forms of upgrading
differ. Thus, it is essential to first elucidate upgrading ‘for whom ‘to ensure that a
constant unit of analysis is used throughout the comparison. In my thesis, I utilize
farmer epistemologies, and therefore I focus on what upgrading ‘would mean to a
farmer’ rather than to a lead firm or a worker. By doing so, I problematize some of the
implicit assumptions that are widespread in GVC/GPN literature.

47
I build on the work of Demarchi et al (2012, 2013a,b) to develop three key categories
of environmental upgrading, that comprehend upgrading from a farmer lens and
push the concept to include ‘strategic environmental upgrading’ which draws heavily
on literature on adaption to climate stresses to include a type of environmental
upgrading that is a segue into integrating climate related perspectives into literature
with GPN/GVC frameworks.
The third conceptual contribution relates to de-constructing governance in a
GPN/GVC framework. Thus far, akin to upgrading, governance has been understood
from the point of view of the lead firm (Dallas, 2015). For instance, the three
components of governance from the Gereffi et al. (2005) framework are complexity of
transactions, the codification of the transaction and the selection of suppliers by lead
firms depending on suppliers’ capabilities. This is a lead firm centric understanding
of governance. In this thesis, I shift the understanding of governance by focusing on
farmers to explicate how governance is experienced, i.e. farmer capabilities and their
ability to de-codify complex transactions. Thereby, this approach gives more agency
to the farmer and enables nuancing understandings of governance.
There are two intended empirical contributions of this thesis. The first is associated
with performing comparative case study of the dynamic process of re-
environmentalization and governance experienced by farmers, and investigating the
complex and non-linear trajectories of environmental upgrading and its outcomes,
across farmers in global, regional and local production networks. This thesis debunks
the notion of the linearity in the trajectory of environmental upgrading, elucidating
that it is a heterogeneous process which can involve economic, social and
environmental downgrading. The trajectories vary considerably across farmers
participating in global, regional and local production networks. To my knowledge
this is one of the only studies that compares across the three different production
networks to elucidate the similarities, differences and various trajectories of
upgrading.
48
The second empirical contribution is the conditions under which environmental
upgrading/downgrading occur vis-à-vis economic and social
upgrading/downgrading. Previous research (e.g. Milberg and Winkler, 2011) has
debated the links between economic and social upgrading and downgrading, stating
that economic upgrading usually leads to social upgrading. In this context, this thesis
seeks to add environmental upgrading and downgrading to the mix, suggesting that
it is difficult to determine if environmental upgrading leads or follows economic and
social upgrading. This thesis finds that performing economic upgrades such as
adhering to certifications and strategic diversification, and social upgrades such as
being part of a farmer group, trigger environmental downgrading across farmers in
global, regional and local production networks.
The final type of contribution of this thesis is methodological, i.e. measuring and
quantifying re-environmentalization, governance and upgrading in VCs/PNs. To my
knowledge, no previous research has attempted to do so taking into account farmers’
epistemology. Each of the indicators are derived from various disciplines of literature
ranging from economic geography, environmental and ecological economics to
economic sociology. Another important methodological contribution is that this thesis
has developed a systematic sampling process that is useful when there is a dearth of
data/ lack of data, budget and time constraints and when the samples are very small.
This sampling method ensures that data collected is internally valid and
representative so that the results achieved can be aggregated. By aggregation I mean
that the data can be cumulated at various levels of analysis or scales. For instance, in
this thesis I have collected farmer data which enables me to unpack upgrading,
embeddedness and governance at the level of analysis of a chain, with the farmer as
the key point of reference. However, because the data is close to representative, it is
possible for me to aggregate my findings to the scale of the sub-county, county, region
and nation, thus allowing me to simulate results that are robust and valid.

49
Overall, this thesis highlights the importance of integrating the natural environment
into VC/PN analysis, unpacking embeddedness, governance and upgrading through
a farmer lens, and considering both these aspects considering the co-existence of
global, regional and local production. The next two chapters (2,3) provide the
theoretical underpinnings for the thesis.

50
2. Exploring the environmental dimensions of embeddedness
and systematizing governance in global, regional and local
production networks
2.1 Introduction
GPN and GVC analysis has focused on understanding North-South vertical and
horizontal linkages between lead firms and suppliers, as well as trajectories of
economic and social upgrading (e.g. Henderson et al., 2002; Gereffi et al., 2005; Ponte
and Ewert, 2009; Barrientos et al., 2011). However, two aspects have been
insufficiently interrogated, which this chapter plans to address. The first is to integrate
the environment into PN/VC analysis through the concepts of embeddedness. The
second involves moving away from the lead firm-centricity of GPN analysis to focus
on farmers and thereby nuance understandings of governance in production networks
and value chains from a farmer perspective. This provides GPN analysis with a
refined model of agency (Murphy and Schindler, 2011). Finally, I unpack these two
aspects considering regional and local production networks, hence moving beyond
the North-South duality of GPNs to focus on emerging South-South RPNs and LPNs
literature. I divide the research sub-question into two parts. The first part relating to
environmental embeddedness is addressed, in section 2.2 - how can environmental
dimensions be inserted into conceptualizations of embeddedness? The second part on
governance, is explicated in section 2.3, - how can understandings of governance be
systemized for farmers in global, regional and local production networks?
To answer the first part of the research sub-question, I review and expand
comprehensions of societal, network and territorial embeddedness within production
networks. To facilitate integrating the natural environment, I extend the definition of
territoriality. Finally, I proceed to discuss the concept of re-environmentalization, that
occurs at the nexus of societal, network and territorial embeddedness. To address the
second part of the research sub-question, I explore governance in terms of complexity,
codification and capabilities and attempt to unpack how it should be understood

51
epistemologically from a farmer perspective across GPNs, RPNs and LPNs. The last
section of this chapter proceeds to explore how embeddedness and governance are
related and describes why they are key determinants of environmental upgrading
(which I explore in Chapter 3 in depth).
2.2 Why is embeddedness important in value chains and production
networks?
Embeddedness is critical to how lead firms, carrying geographically rooted
characteristics, anchor and flourish in localities. The concept takes into account the
social-cultural contexts of varieties of capitalism, heritage and norms of lead firms’
country of origins which GVC literature views only as an ‘external influence’ (Hess,
2004; Hess and Yeung, 2006). Hess (2004) and Wilkinson (1997:309) aptly point out
that ‘economic activity is socially constructed and historically determined by
individuals and collective actions expressed through organizations and institutions’.
Even Williamson (2000: 610) suggests that embeddedness has been an
‘underdeveloped part of the story’ that has been neglected by new institutional
economics. Thus, the importance of embeddedness has also been widely recognised
by a variety of social scientists.
I begin by briefly discussing how the work of Polanyi and Granovetter has influenced
the concept of embeddedness, before examining how Henderson et al. (2002) and Hess
(2004) have deployed the concept in the context of production networks. I explore each
of the three types of embeddedness- societal, network and territorial. There is a
twofold reason for spelling each out in depth. The first is that although GPN analysis
has provided a plethora of examples for how firms embed (e.g.: Hess and Yeung, 2006;
Hughes et al. 2008), very few studies delve into how farmers are embedded or
chose/compelled to embed into global, regional and local production networks.
Secondly, for the purposes of quantification, it becomes essential to nuance each of the
types of embeddedness so that they can be converted into robust indicators, which
will be unpacked in Chapter 5. In section 2.2.4 of this chapter, I expand territorial

52
embeddedness to include what I call ‘fixed’ (including natural endowments) and
‘fluid’ (including bio-physical) aspects, thereby integrating the ‘natural environment’.
The chapter then elaborates the concept of re-environmentalization, which involves
dis-embedding from previous networks and practices and re-embedding into new
networks forming new socio-environmental relationships in GPNs, RPNs and LPNs.
In sum suggesting that farmers’ re-environmentalize differently across PNs. I then
unravel the varied process and mechanisms of re-environmentalization in the
subsequent sections.
2.2.1 Embeddedness in GPNs
Much of the thinking on embeddedness originates from Karl Polanyi’s (1944)
pioneering work, ‘The Great Transformation’, wherein he argues that the economy is
an institutionalised process7 (Polanyi, 1957). Whilst studying the human economy,
Polanyi states that the ‘human economy is embedded and enmeshed in institutions,
economic and non-economic’ (ibid: 250). Within this, he identifies three types of
institutional patterns of reciprocity, redistribution and exchange which represent
economic transactions within societies. Reciprocity and redistribution prevailed in
non-market economies, which occurred on the basis of shared beliefs, norms and
values; while market exchanges reflected the rational, self-interested optimizing
behaviour of economic man, which considered price as the key underlying norm of
society (Krippner, 2002; Hess, 2004). Thereby, Polanyi viewed that market economies
were dis-embedded from social aspects of society. However, previous to the self-
regulating market economies of 18th century England, market economies were moored
to social relations (Zukin and DiMaggio, 1990). This led Polanyi to argue that 'instead
of economy being embedded in social relations, social relations are embedded in the
economic system' (Polanyi, 1944: 57). Much of his research was devoted to
7 Process refers to the transfer of goods constituting economic activity.

53
demonstrating the subordination of markets to other institutional forms, culturally
and historically (Krippner, 2002)8.
Another objective of Polanyi was to demonstrate that the market is a fully social
institution, consisting of complex interactions of politics and culture (ibid). Thus, even
dis-embedded market societies are, to different degrees, embedded systems
influenced by non-economic and economic institutions (Hess, 2004). Polanyi’s concept
of embeddedness is not particularly focused on individual or collective (firm) actors,
but is rather a form of exchange that dis-embeds from society (ibid).
Granovetter differs from Polanyi as he elucidates that non-market societies (and
reciprocal exchange) are more strategic than what Polyani indicated (Zukin and
Dimaggio, 1990). To demonstrate this, he shifted analytical focus from abstract
economies and societies to the scale of actors and networks, by focusing on their social
relations and structures, which he claimed would shed light on trust building,
opportunistic behaviour and malfeasance (Granovetter 1985, 2005)9.
Granovetter distinguished between over-socialized and under-socialized views of
economic action. Over-socialization describes an internalized concept of socialization,
wherein people are obedient to the dictates of consensually developed systems of
norms and values (Parsons, 1937; Wrong, 1961; Granovetter, 1985). Under-
socialization operates within classical and neo-classical economics perception of the
utilitarian tradition (Granovetter, 1985). Thus, Granovetter suggested that both over-
socialization and under-socialization were implicitly atomistic, in the sense of
overlooking how ‘social action is embedded in networks of ongoing social relations’
(Krippner 2002:777).
8 He asserted that market society could not exist in its pure form as it would lead to the rise of a
‘double movement’ where society would try to protect itself from market degradation, and only state
action could quell the spontaneous resistance of fictitious commodities (land, labour, money) to
conform to the market. 9 Granovetter stated that, in reciprocal exchanges trust may actually led to increased opportunistic
behaviour (Granovetter, 1985).

54
Granovetter (1992) provided a key contribution by combining social networks and
social structures to distinguish two forms of embeddedness: ‘relational’ involving
cohesive dyadic ties between actors to gain information; and ‘structural’, which refers
to the broad network setting of social relationships between actors i.e. their
positionality in the network. I unpack both these aspects in Section 2.2.3, within
network embeddedness. Overall, Granovetter provided not only a concrete way to
understand embeddedness between individual/collective actors and markets, but also
as a territorially bounded network of social relations (Hess, 2004), which heavily
influences the concept of network embeddedness, in a GPN context.
Various literature from organization and business studies (e.g. Zukin and Dimaggio,
1990; Sit and Liu, 2000; Halinen and Tornroos, 1998), economic geography (e.g.
Giddens, 1990; Dicken and Thrift, 1992; Henderson et al. 2002; Hess, 2004) and
business systems literature (e.g. Whitley, 1992) draws on both Polanyi and
Granovetter to conceive of different forms of embeddedness at the analytical scale of
the firm. In the GPN context, Hess (2004) scrutinizes the spatiality of embeddedness,
to understand ‘who or what’ embedded actors are and ‘what they are embedded in’,
stating that economic action is grounded in 'societal' structures. In a GPN context,
Hess and Coe (2006: 1207) describe embeddedness as ‘the social relationships between
both economic and non-economic actors across multiple scales’. This suggests firms are
constituted and reshaped by institutional and ‘spatial arrangements of places they
inhabit’.
Hess (2004) advocates that when comprehending the ‘globalized’ aspects of scale is
critical. He suggests that embeddedness is “a process of transnational network building or
embedding, creating and maintaining personal relationships of trust at various, interrelated
geographical scales” (ibid: 176). This is distinct from Giddens’ (1990, 1991)
understanding of maintaining trust, which he expresses through the concept of dis-
embeddedness, stating that dis-embeddedness occurs when social relations are
detached from their localized context of interaction, due to the establishment of expert

55
systems on which actors put their trust. Hess (2004) contends that actors cannot be
truly dis-embedded, and both local and non-local forms of embeddedness (including
path dependency) are critical to understanding what embeddedness means in a
globalized context. Thus, he posits that personal trust is not lost, but instead is de-
localized. With this in mind, the GPN framework involves three main forms of
embeddedness- societal, network and territorial (Henderson et al. 2002; Coe et al.
2008), which are discussed in the next section.
These forms of embeddedness are especially relevant for this thesis as they are
malleable enough to be expressed in relation to different actors and across global,
regional and local scales. Since embeddedness incorporates both local and trans-
national characteristics. In the coming sections, I will explicate societal, network and
territorial embeddedness in depth, from the point of view of suppliers (farmers’
perspective) and their relationships with other firm (vertical) and non-firm
(horizontal) actors. Ultimately, I will attempt to elicit indicators that best describe how
farmers dis-embed and then re-embed into societies and different end markets (global,
regional and local) to use in the empirical chapters.
2.2.2 Societal embeddedness
Within the GPN context, societal embeddedness draws on Polanyi’s work,
organizational studies and business systems literature, to reflect as Hess (2004: 176)
calls the ’genetic code’ of an actor. This consists of three key facets, cultural, cognitive
and path dependency (including regulatory and institutional settings), which shape
the economic actions of actors. The cultural facet, as elucidated by Zukin and
DiMaggio (1990), explains that economic behaviour is culturally embedded i.e. there
is a shared collective agency in shaping goals which limit market exchange in
culturally significant objects or relations. Cultural embeddedness in depicted in the
form of beliefs and norms that prescribe strategies for self-interested action (pg: 17),
which in turn creates informal rules that impact the ability and legitimacy of how
actors can engage; this simultaneously distorts pure market forces. Cultural aspects

56
also take the form of the imprints and heritage of global actors (such as lead firms),
which shape and reshape actions of individuals and collective actors in local contexts,
within and beyond their respective societies (Hess and Coe, 2006). Such histories tend
to enable and/or constrain less powerful actors, especially because business systems
tend to retain specific characteristics which prevent convergence across boundaries
(Whitley, 1999). Thus, there is a dynamic interplay of how local actors deviate from
their ‘normal’ shared values and norms by responding and restructuring to new
‘normals’ of lead firms, whilst simultaneously struggling to impose their personal
beliefs (Krauss and Krishnan, 2016)
The other facet of societal embeddedness is the level of cognitive abilities of the actors
involved. The neo-classical concept of rationality within rational choice theory hinges
on individuals, rather than collectives, making rational self-regarding decisions by
processing all information to determine options available and then choosing one
which optimizes utility (Becker, 1976; Abell, 2000; Levin and Milgrom, 2004).
However, there are several limitations to this conventional understanding of
rationality. First, preferences of local actors may not be monotonic, in the sense that
preferences are path dependent i.e. made with knowledge available from past
histories (which include not only cultural elements, but also institutional and
regulatory settings) and the state of knowledge at the time. Second, actors act only
under partial information and uncertainty (Smith, 2003; Hodgson, 2012). This suggests
that behaviour is scripted by histories and thus ‘markets’ are bounded by a mutual set
of assumptions (Simon, 1972; Zukin and DiMaggio, 1990). Zukin and DiMaggio (1990)
criticize the neo-classical description of rationality, suggesting that the cognitive
process is ‘structured regularities of mental processes that limit the exercise of
economic reasoning’ (Pg: 15-16).
This suggests that actors act in a bounded (constraint) rational sense for several
reasons. First, in uncertain environments, actors work with incomplete information.
Secondly, they are affected by the society they reside in. For instance, self-regarding
57
behaviour may impact an actor’s position within society. Thirdly, actors are impacted
by cultural imprints of the wider society (such as an international firm). Overall, these
limit individual computational and deliberative capacity (Simon,1982; Selten, 1998).
In essence, actors are unable to behave as utility maximizers, rather follow a
‘satisfice’10 condition where a satisfactory outcome is selected through a process of
thought based recognition and heuristic searchers from a space of possibilities (Simon,
1995; Kahneman and Tversky, 1979; Tversky and Kahneman, 1992). Thus, bounded
rationality is an ex post rationality, that is iterative because it relies on the dynamic
‘process of learning by doing’ (Selten and Stoecker, 1986). Overall this indicates that
there is a variety of individual rationality that comes into play when embedding in GPNs
and RPNs. This means that the cognitive mechanisms of actors (suppliers/ farmers)
are not only impacted by the path dependent nature of their own heritage and
histories but also the cultural baggage and institutional fabrics of global and regional
lead firms.
Thus, in this thesis I define societal embeddedness as the dynamic interplay of how
cultural, cognitive and path dependent mechanisms influence and reshape economic behaviour
of farmers as they attempt to socially embed into global and regional PNs. This research adds
to the literature on societal embeddedness in two ways – first by providing agency to
lower tier suppliers such as farmers. Secondly, by unpacking embeddedness across
different end markets, I will be able to compare and contrast North-South versus
South-South networks, thereby explicating differences in how cultural and cognitive
mechanisms abet in the expansion, stability and contraction on PNs.
2.2.3 Network embeddedness
In this thesis, in order to map the process and mechanisms of network embeddedness
across farmers in GPNs, RPNs and LPNs, I begin by de-constructing what network
embeddedness means. Thereafter I will use the concept to develop robust indicators
10 Accepting the first satisfactory decision reducing deliberative capacity (Simon, 1987).

58
that can be used in the quantitative study to compare across farmers in Chapter 5,6
and 7.
Henderson et al (2002) describe network embeddedness in a GPN context, to depict
the relational and structural nature of the relationships of a network of actors, be they
individual (at varying scales) or organizational). While this definition is an excellent
starting point, there is a need to flesh out the various nuances of network
embeddedness, to systematize our understandings of the concept. To further
explicate network embeddedness, I draw heavily on the Granovetterian
conceptualization of relational and structural embeddedness. Relational, primarily
constitutes the social content of a tie i.e. the cohesiveness (affectual or exchange)
within dyadic relations between actors in networks (Granovetter, 1985; Gluckler, 2001;
Gulati and Gargiulo, 1999). I will explicate this relationality under network
architecture, stability and durability (as suggested in Hess, 2004). Structural
embeddedness, refers to the broad network setting of social relationships between
actors, looking more at the positional aspects (Gulati, 1998; Emirbayer and Goodwin
,1994: 1417), which I explore under network structure. Network embeddedness assists
in providing a complete map of the connectedness (and structure of evolution) of
various actor-networks (Hess and Coe, 2006).
Network architecture and structure
Coe et al. (2004) suggest the architecture of network connectedness relates to the form
of organization for instance arm’s length relationships (ties) with other actors, which
are measured by the strength, weakness, intensity and quality of the relationship. This
links into the relational aspect of embeddedness I described above. Here, I will
elaborate and define strong and weak ties
Drawing from Granovetter (1973: 1361), as well as business and organizational studies
(Zukin and DiMaggio, 1990; Gluckler, 2001), the strength of a tie is conditioned on a
'combination of the amount of time, the emotional intensity, the intimacy (mutual

59
confiding), and the reciprocal services which characterize the tie’. Gulati (1998) and
Rowley et al. (2000) stress the strength and quality of dyadic ties in specific types of
economic organization (arm’s length, hierarchy), relates to whether they are direct
(have closer Euclidian distance) and enable ‘exchange of high-quality information and
tacit knowledge’. Over time, as ties become denser it leads to increased dependency,
eventually producing relational trust and cooperation (Coleman, 1988; Larson, 1992).
Another indicator of the strength of ties is the intensity i.e. the frequency of tie
repetition between dyads (Gulati, 1995b; Gulati and Gargiulo, 1999). The repeated tie
effect increases cohesiveness leading to reciprocal relationships and trust building
between actors (Dyer and Singh, 1998; Uzzi, 1997). Such gains from strength of ties
leads to external economies wherein firms form strategic alliances to pool skills,
spread risks and achieve economies of scale (Hagedoorn, 1993), thus leading to long
term reciprocal relationships (Uzzi, 1996). In sum, the thesis will define a strong tie to be
intense, dense, and consist of high quality and reciprocal, interactions as depicted in table 2.1.
At the other end of the spectrum are weak ties, which are defined as ties which are
indirect because they carry relatively low-quality information, through second and
third order ties (Gulati, 1995a; Gulati, 1995b; Rowley, 1997). For instance, studies have
shown that farmers in GPNs may have stronger, more cohesive and better-quality ties
than local farmers, and are thus privy to useful information and support from other
network actors (e.g. McCulloch and Ota, 2002; Swinnen and Marteans, 2007). The thesis
defines a weak tie as consisting of sparse, low intensity and low-quality interactions, which is
summarized in table 2.1. However, this is not to say that weak ties are not advantageous.
Weak ties can be conduits across which an actor can access novel information (Rowley
et al. 2000; Granovetter, 2005), what Granovetter refers to as the ‘strength of weak ties’
(1973, 1983). In some cases, weak ties can transmit and diffuse information, reducing
the overall social distance between network actors, with less ‘costs’ than strong ties;
thereby benefitting second and third order relationships (Granovetter, 1973, 2005;
Hansen, 1999; Levin and Cross, 2004).

60
In an attempt to compare and contrast the strength and weakness of ties across farmers
into GPNs, RPNs and LPNs, there are situations when perhaps some cannot be
classified ‘purely’ as having strong or weak ties, and may display mixed
characteristics in terms of density, intensity and quality. For this reason, table 2.1 has
a category called ‘intermediate ties’ which capture these mixed attributes, and falls
between the spectrum of strong and weak.
Table 2.1: Density, intensity and quality of strong, weak and intermediate ties
Tie type/ Attributes Strong Intermediate Weak
Density Euclidean distance
between the ties is
low i.e. farmers can
easily reach other
vertical and
horizontal actors
they have ties
with- through
telephones or by
visiting.
Euclidean distance
between the ties is
intermediate
(between the two).
Farmers can reach
other vertical and
horizontal actors
they have ties
with, but not
always easily.
Euclidean distance
between the ties is
high i.e. farmers
cannot easily reach
other vertical and
horizontal actors
they have ties
with.
Intensity Frequency of
interaction is high,
which means
farmers are
frequently able to
meet other vertical
and horizontal
actors they have
ties with and
confide in them.
Frequency of
interaction is
intermediate
between strong and
weak ties, which
means farmers are
able to meet other
vertical and
horizontal actors
they have ties with
often and also
confide in them to
some extent.
Frequency of
interaction is low
or even indirect.
Farmers are
unable to
frequently meet
other vertical and
horizontal actors
they have ties with
Quality The transfer of
knowledge and
support farmers
receive is high, and
they are able to
contact other
actors as and when
The transfer of
knowledge and
support farmers
receive is in
between, and they
can contact other
actors but with
The transfer of
knowledge and
support farmers
receive is low, and
they are unable to
contact other

61
needed; and most
importantly there
is a level of
reciprocity in the
relationship.
some difficulty.
While there is a
certain level of
reciprocity in the
relationship, the
relationship is
mostly business
linked and has no
informal
component of
mutual confiding.
actors as and when
needed.
Source: Author’s construction
The strength or weakness of a tie is determined by the positionality of the actor vis-a-
vis the network. Several studies (e.g. Barrientos et al. 2003; Tallontire et al. 2005; Bair,
2005) have identified the power asymmetry in buyer driven networks, with farmers
required to adhere to international and regional retailers’ requirements. Thus, they are
structurally in a weak position to bargain for better conditions. This understanding of
positionality comes from what Burt (1987) refers to as ‘structural equivalence’, which
identifies actors (farmers) sharing the same patterns of relationships with other actors,
thus enabling assessment of whether the strength or weakness of the ties benefits them
or not. Therefore, I can compare positionality not only across GPNs, RPNs and LPNs,
but also between farmers in a specific network.
To better understand ‘how’ strong and weak ties and farmer positionality across
different end markets impacts the network architecture, I draw on literature from
relational proximity. The concept of relational proximity has emerged from various
literatures including economic sociology, economic geography, organizational
studies, and actor network theory (e.g.: Amin, 1999; Bathelt and Gluckler, 2003; Bathelt
et al. 2004; Gluckler, 2005; Yeung, 2005; Grabher, 2006). This suggests that
‘relationality is a process through which network linkages are established, sustained,
and reorganized over time and space by the power struggles11 between, and the social
11 Power in this thesis is viewed as realist power i.e. power over (corporate and collective) and
network power i.e. power to achieve common goals (Allen 2003, in Arnold and Hess, forthcoming).
62
networking strategies of, businesspeople located in a diversity of places or regions’
(Murphy 2012: 4). At a firm level, various literatures (e.g. Yeung, 1998; Coe and Lee,
2006) have discussed how power struggles determine dominant corporate culture,
especially in relation to mergers, acquisitions or joint ventures. At the farm level,
various authors (e.g. Nielson and Pritchard, 2011; Nelson and Tallontire, 2014) suggest
power struggles manifest at micro and cognitive levels through an individuals’ sense
of empowerment (for example in overcoming obstacles) and control over livelihoods
(Murphy, 2012). It is also derived from an individual’s positionality in the relevant
economic system. This positionality stems relationally from experiences of social
interactions and responses to structural conditions that create power imbalances
amongst actors linked in networks (Sheppard, 2002). Thus, it is not ‘distance’ that
cause power imbalance in relationships but ‘the degree to which individuals, firms,
and communities are bound by relations of common interest, purpose, or passion, and
held together by routines and varying degrees of mutuality’ (Amin and Cohendet,
2004: 74; Murphy, 2006: 430), which is referred to as relational proximity.
Much literature has alluded to power struggles and contestations between farmers
and lead firms in GPNs (e.g. Barrientos, 2013; Alford et al. 2017), suggesting that even
with strong ties, power struggles can dampen the positive benefits whilst
compounding the exploitative. To be able to reap the positive benefits from dyadic
ties there is a need for power struggles to lead to mutually recognizable and
appropriate behaviour patterns. The empirics in chapter 5 can illuminate whether
farmers in RPNs and LPNs face similar challenges and struggles as farmers in GPNs,
thereby abetting understanding whether positive shared outcomes are generated.
In sum, this sub-section nuanced the definition of network architecture and structural
embeddedness, citing three key components: (1). The relational aspect of
embeddedness which links to the strength/weakness of ties. These are described as
density (Euclidean distance between the ties), intensity (the frequency of interaction)
63
and quality (the transfer of fine grained knowledge and support); (2). The positionality
of the actors or how they are structurally embedded vis-a-vis the network; and finally,
(3). The social content defined by the power struggles and contestation that occur in
spaces between ties i.e. the relational proximity, which in turn shapes the strength or
weakness of a tie. This new definition will be used to compare across farmers in
different PNs.
To sustain a relationship over time, there is a need to imbue trust and demonstrate
trustworthiness, which both Polanyi and Granovetter state is critical to long term
relationships. As relational trust becomes prominent, it augments network stability
and durability (Gulati, 1995b; Zucchella, 2006), which I examine in the following
section.
Network stability and durability
In this section, I plan to deepen how trust is engendered and to outline the stability
that it brings in dyadic ties, which I empirically expand in Chapter 5 for farmers and
their networks. Stability and durability have been quite loosely defined in GPN
literature. This thesis endeavours to nuance their components. This thesis, similar to
Hess (2004), will define stability as a process and an outcome of trust creation,
augmenting a co-operative culture; while durability is expressed as increasing
flexibility and adaptability of the relationship in a network which occurs over time.
The subsequent paragraphs will deepen understandings of trust and cooperation, key
components that make up network stability.
Henderson et al. (2002: 453) regard network embeddedness to be a “product of a
process of trust building between network agents, which is important for successful
and stable relationships”. When embedded in network ties, trust tends to assist
stability of the relationship (Gulati, 1995b; Nooteboom, Berger and Noorderhaven,
1997). Thus, to understand network stability at the outset, it is necessary to first define
what trust means. In transaction cost literature, trust is viewed as a highly specific

64
asset that increases transaction efficiency and reduces opportunism12 (Williamson
1998, 2000). Trust is viewed as an investment emerging from rational decisions,
because it reduces long run costs, encourages long term partnerships and
discriminates those considered untrustworthy (Dimaggio and Louch, 1998;
Fafchamps, 2001). Economic sociologists also perceive trust to be an asset within
relationships that helps mobilize and deploy resources, supports the transfer of tacit
and idiosyncratic information13, thus increasing capabilities and the adaptability of
firms to respond to shocks (Uzzi, 1997; Dimaggio and Louch, 1998; Murphy, 2006).
Both schools viewtrust as an asset. This indicates that network stability will increase
with reduction in transaction costs and the creation of strong ties (Uzzi, 1997;
Dimaggio and Louch, 1998; Gertler, 2003; Bathelt et al., 2004; Mackinnon et al., 2004),
which reduces opportunism and abets trust building (Williamson, 1998). However,
Granovetter (1983) and Burt (1987) show that, even if ties are strong, they may become
redundant as complacency may set in, suggesting trust increases opportunism and
malfeasance.
Second, in the context of production networks, and drawing from Zuker (1986) and
Schmitz (1999)14, trust may be ascribed or earned. Ascribed trust is implicit trust
derived from being part of a group or society. Earned trust develops through
commercial interactions or from personal experience, or by collective expectations of
what actors associate as trustworthy (e.g. through reputation, appearance) (ibid).
According to Schmitz (1999), the shift from ascribed to earned trust is critical when
12 Opportunism arises when contracts are not supported by credible commitments or are self-
enforcing, leading to default or incompletion. Ex-ante measures such as increased vertical integration
or stringent contracts prevent ex-post hazards of opportunism. Opportunism is further perpetuated
by bounded rationality (Williamson, 1998). 13 Idiosyncatic information is particular knowledge and skill sets which are difficult to summarize, for
example peculiarities of a machine (Jensen and Meckling, 1995) 14 Schmitz (1999) applied trust to collective efficiency in clusters, however, this can be unpacked at a
micro level as well.
65
competing to participate in global markets. This would involve de-localizing ascribed
trust by network building, creating and maintaining personal relations of trust at
various, interrelated geographical scales, leading to developing earned trust.
However, Nadvi (1999a) contends, trust rich ties are not necessarily information rich,
calling for a need to view trust cautiously.
This thesis views trust as a characteristic of a relationship, that can be earned or
ascribed, which occurs depending on the network architecture (strength/ weakness of
a tie, relational proximity) and structure (positionality).. While various studies,
spanning automotive (e.g. Sturgeon, 2003; Sturgeon et al. 2008) and electronics (e.g.
Hess and Coe, 2006) sectors, have presented evidence of trust between first and second
tier suppliers and lead firms, very limited research has unpacked the same for
horticulture, especially when considering regional lead firms and farmers supplying
to them.
Creating trust leads to another mechanism of promoting network stability, that is
actors in networks bring about temporal stability through cooperation that results
from complex bargaining processes. Continuous cooperation gives rise to a tendency
toward conflict avoidance and incremental change (Messner and Meyer-Stamer,
2000). Thus, network stabilization can increase social cohesion, further strengthening
ties and favouring the development of a "consensus culture" creating a symbiotic
relationship between the network actors (Kuran, 1988). A cooperative culture reduces
contestation and power struggles and engenders trust, which could significantly affect
farmers in global and regional production networks. In Chapter 5 and 6, I will explore
whether consensus culture or contestation from increased power struggles arise across
farmers engaged in global, regional and local production networks.
The final aspect of network embeddedness which I study in this thesis is durability,
which refers to the adaptability and flexibility of actors and firms to respond and
restructure their positionality to idiosyncratic and covariate shocks arising from the

66
changes in the network (Sheppard, 2002). For instance, increased trust and creating
positive shared experiences, enhancing capabilities, augmenting innovativeness and
aiding in building institutional thickness of places (Amin and Thrift, 1995; Morgan
and Cooke, 1998; Nadvi, 1999a,b; Helmsing, 2001; Glückler, 2005; Murphy, 2006),
abets suppliers’ ability to respond to changes in lead firm requirements (Bathelt and
Taylor, 2002; Dallas, 2015) and adapt to new ‘normals’ more efficiently. I will briefly
discuss, although not dwell on, durability, as it is beyond the scope of the thesis. This
is because unpacking durability would involve trying to elucidate whether farmers
have been able to adapt to changes over time and mapping their trajectories, and I was
not able to collect data over time. Therefore, I discuss this aspect in the concluding
chapter, viewing it more as an outcome of network architecture, structure and
stability.
In sum, I unpack key dimensions of network embeddedness, which I will use in
chapter 5 and 6 to qualitatively and quantitatively elicit the process of how farmers
dis-embed from social relations (societies and networks) associated with localized
contexts. I discuss how trust is delocalized rather than devolved and how they re-
embed by recasting dis-embedded social relations into new markets and networks.
Overall, in this thesis network embeddedness consists of two main facets: the
architecture and structure which deals with the strength, quality and intensity of ties
as well as an actor’s positionality vis-a-vis the network and power struggles between
ties; and the stability and durability of a relationship which is contingent on building
earned and ascribed trust and engendering trustworthiness, and ability of actors to
adapt and respond to changes imposed on them.
2.2.4 Territorial embeddedness
The third form of embeddedness highlighted in the GPN framework is territorial. In
this thesis, I will extend understandings of territorial embeddedness by integrating
the natural environment. I add two critical elements: first, natural endowments that
are ‘fixed’ to a specific place, and second, bio-physical aspects that are ‘fluid’ because
67
they are uncertain. This is a crucial step to addressing the first research sub-question
exploring how to integrate environmental dimensions into conceptualizations of
embeddedness. I begin by first explaining what territorial embeddedness means in a
GPN context before fleshing out the fixed and fluid aspects of it.
Territorial embeddedness refers to the extent to which firms are ‘anchored’ in specific
territories, and how actors embed themselves by absorbing pre-existent social
dynamics of a place (Henderson et al. 2002; Hess, 2004). The anchoring of firms in
territories could create new regional or local networks and social relations, leading to
local development (Amin and Thrift, 1995). Henderson et al. (2002) provide an
example of global (or external) firms anchoring in places where local clusters of small
medium enterprises already exist, while related studies on agriculture (e.g. Ouma,
2010; Rao and Qaim, 2011; Tallontire et al. 2011) have shown that lead firms prefer to
anchor into regions where farmers are already organized into groups, taking
advantage of social networks and labour markets. However, when such conditions
are no longer fulfilled, firms may choose to dis-embed, for instance through cutting
ties with local organizations (and actors) and/or closing plants which may undermine
regional growth and value capture trajectories (Hess and Coe, 2006). However,
questions arise as to whether similar consequences play out in regional or local
markets due to growth of regional lead firms, which I explore in the empirical
chapters.
Territorial embeddedness may be seen as the degree of actor commitment, observed
through firms’ asset-specific investments (physical assets, human assets, site or
temporal specificity), so that particular exchange transactions can recur (Williamson
1975, 1998). Asset specificity is a symbol of trust augmenting network stability.
Effectively, territoriality then relates to how economic, social and political
arrangements are shaped and reconstituted by the ‘places firms inhabit’ (Henderson
et al 2002: 446). For instance, changing conditions of market requirements and lack of

68
asset specific support have marginalized many farmers in the South from
participating in global markets (Shiferaw et al., 2009).
But how do firms choose ‘places to inhabit’? There is a need to scrutinize factors
beyond economic, political and social in order to truly understand what ‘place’ means.
According to Kaplinksy and Morris (2016), places are selected for potential,
appropriation, protection and sustenance of rents in GVCs/GPNs. ‘Gifts of nature’
enable producers, and by extension firms they sell to, to have access to particular
natural endowments such as land or resource deposits (Kaplinky and Morris 2016:
627). This emphasis has been echoed through different perspectives across various
disciplines, from trade theorists in economics, to political ecologists. For example,
Morris and Kirwan (2011:333) note that ’nature is not a mere backdrop to economic
action but is symmetrically entangled with the economic’. The concept of
embeddedness may thus be extended to include the natural environment (Whatmore
and Thorne, 1997; Murdoch, 2000; Morris and Kirwan, 2011). Place consists of both
natural endowments, and uncertain bio-physical hazards such as climate variability
and shocks (Adger, 1999; O’Brien and Leichenko, 2000), which impact how actors
anchor themselves and how they upgrade. This thesis extends territorial
embeddedness to consider both fixed (natural endowments) and fluid (bio-physical
aspects) within its remit to capture what territorial embeddedness constitutes.
The next section explicates the extensions of territorial embeddedness, and then goes
on to discuss how the nexus of territorial, network and societal embeddedness leads
to a process of re-environmentalization, which involves changing socio-
environmental relationships to suit participation in global and regional markets. By
doing so, in chapters 5 and 6, I will be able to compare how farmers participating in
global, regional and local farmers embed and re-environmentalize.
2.2.4.1 Territorial embeddedness: fixed
I draw on the concept of ecological embeddedness, often discussed within literature
on alternate agricultural food networks (AAFNs), to expound the ecological aspects

69
of territorial embeddedness. Ecology is deeply embedded into AAFNs because of their
turn towards re-localization (or ‘place’). That involves seeking direct relationships by
offering closer points of production and distribution (Renting et al., 2003) in order to
address consumer concerns for health, ethical and environmental consequences of
commercial agriculture, animal welfare and fair trade (Winter, 2003; Higgins et al.,
2008).
The term ecological is understood in two different ways. The first (e.g. Costanza, 2000;
Penker, 2006) refers to ecology as a ‘state’ which includes the physical surroundings
(and natural endowments) such as soil, streams, atmosphere and terrain. Costanza et
al. (1997) state that natural endowments (or capital) ‘provide a flow of useful goods or
services, both as a “source” of inputs and as a “sink” for waste’ (cited in Van der Werf
and Petit, 2002:132). For instance, Penker (2006) attempted to measure and map the
ecological embeddedness of bread supply chains in Austria through a life cycle
analysis, wherein she measured energy use at different nodes (post farm and
distribution) at national and regional scales.
The second way to look at ecology, is linked to the physical surroundings approach,
wherein ecology is seen as ‘relationships’ of organisms with the natural environment,
both non-human (birds, insects, animals) and human (suppliers and consumers) (e.g.
Murdoch, 2000; Higgins et al. 2008; Pretty, 2008). Whiteman and Cooper (2000) explain
ecological embeddedness as a means for humans to experientially or tacitly learn
environmental sensitive knowledge of specific places (and non-humans) to continue
to subsist. Much of the AAFN literature (e.g. Hinrichs, 2000; Kirwan, 2004) extends
the ‘relationship’ aspect of ecology, by employing a Granovetterian notion of social
embeddedness into a domain of human interactions with natural objects. This
suggests that “relationships extend beyond the exchange context and stretch ‘back’ to
the farm; meaning the natural objects and processes are not physically present at the
point of exchange” (Morris and Kirwan 2011: 325).

70
Ecological relationships between the natural environment, producers and consumers
can be seen as ongoing, meaning there are continuous interactions between humans
and non-humans, akin to the way social relations are ongoing in the Granovetterian
sense (ibid). Thus, naturally or ecologically embedding signifies production is
embedded in local contexts and the social ties developed can modify and shape
economic interactions (Hinrichs, 2000; Murdoch, 2000). Therefore, integrating an
ecological dimension into territorial embeddedness enhances understandings of
place, and also demonstrates how ecological embeddedness is enmeshed with societal
and network embeddedness, deepening understanding of the latter concepts (Sonnino
and Marsden, 2006). This can be especially relevant when comparing farmers across
global, regional and local production networks, as they entail different processes of
network and societal embeddedness, which in turn would influence their
environmental relationships. This thesis contributes to extending the concept of territorial
embeddedness in GPNs by including natural endowments, which reside in a ‘place’ at micro
levels (e.g. soil quality, water access on farmland), and thus are also included in decisions to
anchor in places. These natural endowments are referred to as ‘fixed’ because actors have
control over modifying and improving them. Thus, the intrinsic link between ecology and
territories is recognized. In the next section, I spell out this intrinsic link in further
detail by looking at the reciprocal relationship farmers have with their environment.
Ecological reciprocity
Ecological reciprocity exemplifies the give and take between humans and natural
objects (endowments). I posit that farmers participating in global, regional and local
PNs will experience ecologically reciprocal relationships differently. These differences
will be unpacked in Chapter 5 and 6.
Tacit ecological information is gathered by humans (individuals and societies), who
are physically located in specific places, and utilized (Kittinger et al., 2012) to create
dynamic feedback loops due to the path dependent nature of complex interactions.
71
Such relationships in turn support or disrupt livelihoods and the natural environment
(ibid).
Since farmers are dependent on natural endowments as they are intrinsically linked
to their livelihoods (O’Hara and Stagl, 2001), they have a variety of relationships with
their natural environment. For instance, farmers participating in global and regional
markets need to adhere to complex standards of lead firms. Their livelihood is defined
by their ability to comply with lead firm requirements, which provides them with
opportunities to earn income and accumulate assets. Such revenue earning is one of
the primary motivations for farmers to use their natural endowments/ farmland
(Reardon and Vosti, 1995; Cary and Wilkinson, 1997; Honlonkou, 2004; Lichtenberg,
2004). However, continuous livelihood expansion (through commercialization)
degrades land quality, which reduces income and thereby diminishes capacity of
farmers to undertake investments required to improve soil quality (Shiferaw et al.,
2009). This leads to marginalization from commercial (global, regional or local)
markets and may increase poverty (Scherr, 2000; Reardon and Vosti, 1995).
Farmers are also motivated to conserve their natural environments and resources (e.g.
land, water quality, soil quality). For example, Neill and Lee (2001), claim that
subjectively perceived factors such as personal norms, interests, and values propagate
performing better environmental practices. These are driven by stewardship i.e.
considering the environment as if one’s own land is someone else’s property (Wallace
and Clearfield, 1997; Chouinard et al., 2008). Social-psychology (the theory of planned
behaviour, theory of reasoned action) delves into how personal attitudes and beliefs
can create behavioural change that leads to championing environmental stewardship
(Beedell and Rehman, 1999, 2000; Burton, 2004). Ryanet al., (2003) found that farmer’s
attachment to their land is another key factor. Much research has alluded to farmers’
enjoyment of their work, as well as health and love of their land as a key factor that
motivates preservation (Liffman et al., 2000; Fish et al., 2003; Chouinard et al., 2008).
Kolstad (2011) and Ahnstrom et al. (2009) found that conservation also happens for

72
altruistic reasons or bequeathing land to kin that benefit the collective, be it for a
community or group, so that they can reap benefits of better environments.
Furthermore, farmers tend to ‘reserve’ their position when they are uncertain about
the future. By reserving their position, farmers tend to safeguard against future losses,
thereby being able to bequest their land to their kin (inter-generational passage)
(Perrings, 1991; Foster, 2002). Farmers may thus continue to commercialize until a
‘critical threshold’ is reached, and then stop. Such thresholds are not only influenced
by farmers’ interaction with the environment, but are also shaped by socio-cultural
practices (Farber et al., 2002). For example, if trees have historically been used as a
natural means to reduce the effects of downstream flooding, individuals may wish to
maintain tree cover at least at the critical thresholds and not fell trees to expanding
farm area to produce greater volumes (ibid). Thus, farmers may not act rationally as
they are risk averse and work under uncertainty (see section 2.2.2), instead farmers
prefer to acquire new information through dynamic learning loops (learning by
doing), and act under bounded rationality, or what is called ‘reserved rationality’ in
ecological economics (Perrings, 1991).
This illustrates that farmers’ motivations are not only commercial or linked to profit
maximization, but they may be willing to forego profits, to maintain stewardship,
attachment to their land, for both altruistic and bequest reasons so as to ensure long-
term sustainability (McCann et al., 1997; Chouinard et al., 2008). This suggests that
farmers have a variety of rationalities linked to conserving their natural environments.
Thus, utility is not always maximized through increased payoff, as discussed in a
utilitarian sense, but is rather a careful combination of motivations, which may not be
rational. Tigges et al. (1998) argue that livelihoods and localities are not separable and
that inserting power dynamics into social relationships changes the construction of a
locality, which becomes invested with social meanings. Power asymmetries,
enforcement of specific interests and struggles within these relationships impact
decisions relating to resource deployment and courses of action made by actors (ibid).

73
Thus, ecological reciprocity affects the use, production and quality of ‘state’ of fixed
natural endowments, leading to a dynamic cyclical effect on relationships and natural
endowments.
Therefore, farmers act not as self-regarding individuals, but rather irrationally, be it
for altruistic reasons, bequest, attachment or stewardship, and often under contested
settings. These are bounded (reserved) conditions that aim to achieve the most
satisfactory outcome (see section 2.2.2 for discussion on bounded rationality) that
would improve network architecture and stability and co-operation, rather than
maximizing profits. Territorially embedding can create ecologically reciprocal
relationships, which impact and are influenced by network and societal
embeddedness. However, ‘place’ is not only composed of fixed stocks of endowments,
but also bio-physical elements which are fluid in nature i.e. uncertain hazards that
impact stocks of natural capital (Parry et al., 2004). The degradation of natural
endowments and increased impacts due to bio-physical stresses affects quality of
crops and farmers’ ability to continue to participate in a production network. This
thesis argues that to augment understandings of territorial embeddedness, there is a
need to also include such fluid aspects (uncertain and uncontrollable) of the natural
environment, to broaden the meaning of ‘places’ to anchor in.
2.2.4.2 Territorial embeddedness: Fluid
By virtue of ‘place’, farmers participating in VCs/PNs are not only challenged by
power struggles, contestations due to inhibitive standards and lead firm
requirements, but also need to cope with changing bio-physical hazards15. These bio-
physical aspects are described as ‘fluid’ in the thesis because they are uncertain (and
cause varyring degress of damage) in the sense that their occurrence cannot be
controlled over the short term. O’Brien and Leichenko (2000) explicate the ‘double
exposure’ nature of interactions of globalisation and environmental change. They
15 Hazards are described as the physical manifestation of climate variability or change (Brooks, 2003)
74
suggest that particular regions and social groups (e.g. farmers) are simultaneously
confronted by both; and the most significant environmental change that affects
agricultural production relates to bio-physical16 forces such as climate change,
variability and extremes (Leichenko and O’Brien, 2008). In a PN context, ‘place’
cannot be only understood in terms of power asymmetries that impact social-
economic relationships, and the ‘state’ of fixed natural endowments, but also a unique
set of geographical elements at a particular time to account for how humans (in this
case farmers) cope and interact with bio-physical hazards (Adger, 1999; Kelly and
Adger, 2000; O’Brien et al., 2004; Fussel and Klien, 2006; Fussel, 2007; Kasperson and
Kasperson, 2001; Turner et al., 2003).
This thesis will focus on two bio-physical hazards. The first, climate variability, is
defined as short term temperature and precipitation fluctuations from the climate
mean (Zhou et al., 2004). The second, climate extremes, include unforeseen droughts
and floods. One of the key impacts from increased risk to climate variability and
extremes can be a reduction in crop yield and impact on crop quality due to
deteriorating soil, water and biodiversity (e.g. Porter and Semenov 2005; Lobell et al.,
2007). Reductions in crop yields and quality impinge on a farmer’s ability to fulfil lead
firm requirements (of crop quality and volumes), thereby potentially marginalizing or
excluding them from participating in global and regional production networks
(Reardon et al., 2003; Evers et al., 2014).
Farmers need to cope and employ various adaptation measures by adjusting their
ecological-socio-economic systems in response to actual or expected climatic stimuli
(Smit and Wandel, 2006; Laderach et al., 2011). Thus, territorial fluid embeddedness
accounts for ‘place’ based uncertain bio-physical stresses, that simultaneously
16 Biophysical is defined as a “physical component associated with the nature of the hazard and its
first-order physical impacts, and a biological or social component associated with the properties of
the affected system that act to amplify or reduce the damage resulting from these first-order impacts”
(Brooks, 2003:4)

75
compound the effect of natural endowments, as well as hinder the ability to
participate in production networks. However, the process of coping does not occur in
isolation, but is moulded and reshaped by the way farmers experience and chose to
socially embed in global or regional markets, and is therefore affected by processes of
network and socially embedding. This thesis will spell out the specific types of coping
mechanisms or adaption measures in further detail as part of strategic environmental
upgrading in Chapter 3.
In sum, this thesis endeavours to incorporate the natural environment into the concept
of embeddedness through extending the dimension of territorial embeddedness.
Territorial embeddedness is the degree of actor commitment to regions they anchor
in, which reshapes the economic, social and political arrangements of the places firms
inhabit (Henderson et al., 2002). But ‘places’ firms inhabit also consist of fixed (natural
endowments) and fluid (bio-physical stresses) ecological aspects that also critically
influence the degree of actor commitment and the coping ability of farmers (suppliers)
who inhabit these places. While the fixed aspect of natural endowments takes stock of
physical natural resources owned or accessed by farmers, the fluid aspects account for
the probability of uncertain climate extremes and climate variability affecting crop
production and quality. Both thereby influence farmers’ ability to participate in PNs.
With farmer livelihoods are inseparable from the natural environment, farmers act
under bounded or reserved rationality wherein they want to maximize income but
not at the cost of environmental degradation for multiple reasons such as inter-
generational passage, attachment to land or stewardship. This causes several
contestations and power struggles (especially linked to adherence to global or regional
standards), which impinge on the network architecture and stability suggesting the
environment is enmeshed in social relations and markets. The ecologically reciprocal
relationships developed affect the decisions of how farmers embed and experience
embedding, which can vary across farmers selling into global, regional and local
production networks. This discussion intimates that aspects of territorial (including
76
fixed and fluid), network and societal embeddedness influence socio-ecological
relationships. I call the process through which these three forms of embeddedness
interact ‘re-environmentalization’, which I explain in the next section.
2.2.5 Re-environmentalization
Changing networks and social relations alter the relationships farmers have with their
environment. This leads to a new give and take between humans and natural objects
(with serious environmental consequences for fixed-natural endowments and ability
to cope with fluid bio-physical pressures), which in effect creates different types of
dynamic ecologically reciprocal relationships. Farmers (individually and collectively)
are required to alter relationships not only with the societies and networks they
operate in, but also with natural objects, and this process of altering socio-ecological
relationships in localities is referred to as re-environmentalizion. Effectively re-
environmentalization rests at the nexus of societal, network and territorial
embeddedness.
I will begin by explaining the process of re-environmentalization before outlining two
extreme types of re-environmentalization. This will be used as a means to elucidate
how farmers re-environmentalize differently into global, regional and local PNs in
chapter 5.
The growth of international markets has caused changes in the structure, architecture,
positionality and stability of social, economic and environmental relationships. The
dis-embedding power of globalization has been described as a state where social
relations are detached from localized contexts of interactions, and where the
establishment of expert systems is a means of building trust in relationships (Giddens,
1990; 1991). O’Hara and Stagl (2001) argue that global markets are shaped primarily
by compliance with norms of powerful actors and meeting their own requirements of
efficiency and rationality, thus reinforcing special interests (McMichael, 1996; Altvater
and Mahnkopf, 1997). They go on to discuss the reliance on abstract expert systems
and faceless commitments, undermine values of trust and reliability. The production

77
of crops is centred on technical requirements of large retailers and not on indigenous
modalities of consumption of households in places sharing cultural identity (O’Hara
and Stagl, 2001).
Conversely, GPN literature states that trust is not devolved but can be de-localised at
various scales (e.g. Hess, 2004). Dis-embedding from social relations and indigenous
markets, and re-embedding into GPNs or RPNs can lead to positive benefits in terms
of increased earned trust, improved capabilities and cooperation (e.g. Schmitz, 1999;
Neven et al., 2009; Horner, 2014). Re-embedding means “the re-appropriation or
recasting of dis-embedded social relations so as to pin them down (however partially
or transitorily) to local conditions of time and place” (in Klintman, 2012: 61)
By extending territorial embeddedness to integrate the natural environment through
fixed and fluid aspects, I suggest that ‘places’ where firms anchor are not just reshaped
by socio-political-institutional arrangements, but affect the natural environment.
Therefore, not only do farmers dis-embed from previous networks and indigenous
markets to re-embed in GPNs or RPNs, they also get detached from previous relations
they have with their environment i.e. de-environmentalize. The subsequent-
appropriation or recasting of de-environmentalized socio—environmental relations to global
or regional production networks is the process of ‘re-environmentalization’.
The process of re-environmentalization throws up important questions, such as
whether it is a contested or cooperative process. For instance, can the dependence on
standards eliminate local and relational interpretations? Will only global or regional
lead firms determine how the system works? Or, despite strong dis-embedding forces,
do farmers aim to cooperate and develop new normals, gearing towards
configurations of stability, reciprocity and redistribution to maximize shared utility
(Ghezzi and Mingione 2007)? This thesis aims to show that the process of re-
environmentalization can differ across farmers once they embed in GPNs and RPNs,
especially due to the different stringency in expert systems, varying environmental

78
demands and the diverse network architectures and forms of stability that exist. That
is to say, the process, mechanisms and effects of re-environmentalization could vary
significantly.
In sum, the socio-ecological reciprocal relationships that ensue are a result of changes
due to re-embedding in societies, networks and new markets. These in turn impact
the process of territorially embedding, be it degradation of natural endowments or
lack of coping capacity, which cyclically affects the network architecture and stability
of the tie. Thus, re-environmentalization is a dynamic and cyclical process that affects
each form of embeddedness in a non-linear way, as shown in figure 2.1. Cumulatively,
the success of re-environmentalization will determine future trajectories for evolution
of ecological and social relationships.
Figure 2.1: Embeddedness explained
Source: Author’s construction
Figure 2.1 illustrates the key variables within each form of embeddedness discussed
in this thesis. In sum, societal embeddedness is the 'genetic code' (Hess, 2004: 176)

79
wherein network actors (individuals or collectives) are path dependent and their
beliefs, culture and actions are influenced by history and heritage (ibid). Network
embeddedness relates to understanding how re-embedding in diverse PNs, may
change architectures (strength, quality, intensity of ties and positionality) and stability
(earned, ascribed trust and cooperation) in relationships. Territorial embeddedness,
in the case of a PN, refers to how actors anchor themselves in host localities, which is
extended in this thesis to include fixed (natural endowments, drawing from AAFN
literature) and fluid (bio-physical hazards, drawing from literature on adaptation)
aspects. Further, processes of re-embedding in different PNs also impact the
relationship between farmers, societies and their ecosystems (natural environments)
propelling ecologically reciprocal relationships with dynamic feedback loops. These
loops are experiential, i.e. based on learning from past experiences and it is therefore
a dynamic process which causally affects how farmers embed in PNs.
Overall, there are different degrees or ease with which re-environmentalization occurs
for farmers in global, regional and local production networks. Table 2.2 helps draw
out the extreme ends of the spectrum of re-environmentalization. It illustrates that
farmers in each PN can, to different degrees, experience different forms of re-
environmentalization, whether as a smooth process, leading to mutual benefit and
shared outcomes, or as part of a more contested process.
Table 2.2 Ease of re-environmentalization
Ease of re-
environmentalization in
GPNs and RPNs
Type 1 Type 2
Network Architecture -Strong to intermediate
ties, high quality and
intense ties;
-Relatively equal
distribution of power,
with less contestations
and struggles
-Intermediate to weak
ties, low quality and
intensity
-highly asymmetrical
power relations and
frequent struggles
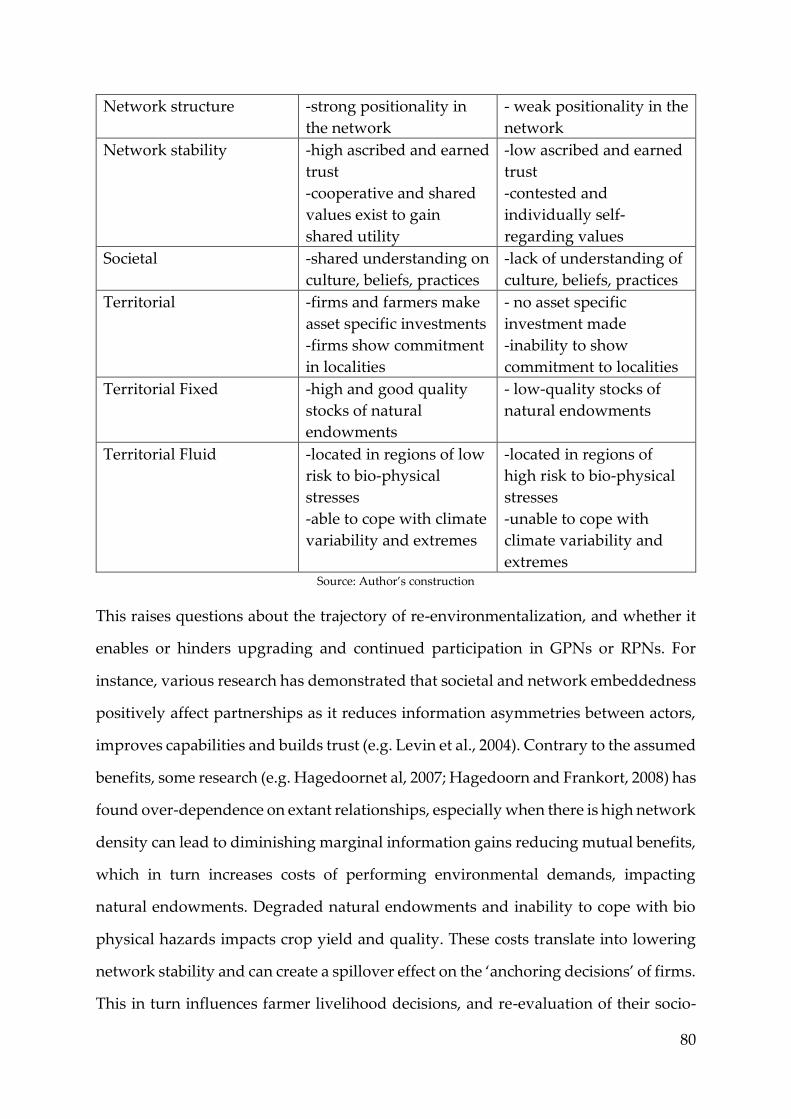
80
Network structure -strong positionality in
the network
- weak positionality in the
network
Network stability -high ascribed and earned
trust
-cooperative and shared
values exist to gain
shared utility
-low ascribed and earned
trust
-contested and
individually self-
regarding values
Societal -shared understanding on
culture, beliefs, practices
-lack of understanding of
culture, beliefs, practices
Territorial -firms and farmers make
asset specific investments
-firms show commitment
in localities
- no asset specific
investment made
-inability to show
commitment to localities
Territorial Fixed -high and good quality
stocks of natural
endowments
- low-quality stocks of
natural endowments
Territorial Fluid -located in regions of low
risk to bio-physical
stresses
-able to cope with climate
variability and extremes
-located in regions of
high risk to bio-physical
stresses
-unable to cope with
climate variability and
extremes Source: Author’s construction
This raises questions about the trajectory of re-environmentalization, and whether it
enables or hinders upgrading and continued participation in GPNs or RPNs. For
instance, various research has demonstrated that societal and network embeddedness
positively affect partnerships as it reduces information asymmetries between actors,
improves capabilities and builds trust (e.g. Levin et al., 2004). Contrary to the assumed
benefits, some research (e.g. Hagedoornet al, 2007; Hagedoorn and Frankort, 2008) has
found over-dependence on extant relationships, especially when there is high network
density can lead to diminishing marginal information gains reducing mutual benefits,
which in turn increases costs of performing environmental demands, impacting
natural endowments. Degraded natural endowments and inability to cope with bio
physical hazards impacts crop yield and quality. These costs translate into lowering
network stability and can create a spillover effect on the ‘anchoring decisions’ of firms.
This in turn influences farmer livelihood decisions, and re-evaluation of their socio-

81
environmental relationships, which may cause exclusion from participation. Thus,
the durability of the relationship is key to ensure positive outcomes of re-
environmentalization.
In sum, this thesis will bring to light the heterogeneous processes through which
farmers in global, regional and local production networks re-environmentalize by re-
appropriating or recasting of detached social relations and interactions with the
environment, leading to embedding in new networks forming different types of
ecologically reciprocal relationships. It plans to do this qualitatively as well as
quantitatively17 so that it is possible to measure not only ‘how’, but also the ‘extent’ to
which, farmers are different across each PN. As this thesis adopts a farmer-centric
epistemology, creating indicators provides a systematic way to unearth
embeddedness through the lens of the specific reference point (farmers, in this case),
rather than from a lead firm centric perspective. I use the various categories identified
within figure 2.1, to measure and discuss embeddedness of Kenyan farmers in
Chapter 5.
The next section explicates the second tenant of the GPN/GVC framework,
governance, and unpacks why and how there is a need to look at it differently when
taking into account farmer epistemologies and participation in different end markets.
This thesis argues that different forms of embeddedness and governance are key
determinants of environmental upgrading. While this chapter focuses on
embeddedness and governance, the next chapter explores environmental upgrading
in depth.
17For example, Penker (2006) endeavoured to quantify and map ecological and social embeddedness by
developing indicators related to the energy use of the lifecycle of the bread value chain. She used interview data
to create indicators relating to each node and actor in the chain. Development economics, social network analysis
and economic sociology have also inadvertently tried to quantify embeddedness through the inclusion of social
capital, place, location, strength of tie and historical institutional environment variables in regressions.
82
2.3 Breaking down the components of governance: Complexity,
Codifiability and Capabilities
It is critical to address the growing importance of regional markets, considering
farmers participating in GPNs are governed differently to farmers in RPNs. This calls
for a need to slightly nuance the lens through which governance is understood in a
value chain context. In this section, I first begin by elucidating the importance of
governance in VCs and PNs and why the thesis focuses on complexity, codifiability
and capabilities – the fundamental factors that define the governance structures. I
discuss further implications of not engaging with the Gereffi et al. (2005) five
governance types of market, modular, captive, relational and hierarchical in the next
section and in Chapter 8. In the next sections, I will examine in detail each governance
factor, which will be empirically unpacked in chapter 5 and 6 to illustrate how farmers
are governed and experience governance across production networks as well as the
links to embeddedness.
Gereffi and Korzeniewicz (1994) highlight explicit coordination of dis-integrated
production through a dichotomous distinction of buyer and producer driven chains.
They stipulate chains are ‘driven’ by lead firm strategies who govern by defining chain
membership and controlling value distribution. Along with this, the identification of
quasi-hierarchies in buyer-supplier ties (Humphrey and Schmitz, 2002) and
modularity (Sturgeon, 2002) preceded the seminal article by Gereffi et al. (2005) on
value chain governance theory building.
Gereffi et al. (2005) drew on literatures on transaction costs (e.g.: Williamson, 1989,
1998; Powell, 1990; Baldwin and Clark, 2000) and dynamic capabilities (e.g. Lall, 1993;
Teece et al., 1997) to develop a simplified framework isolating variables that shape
and influence these governance structures. The key variables they isolate are
complexity, codifiability and capability. A framework using these variables provides
a clear view of the ‘fundamental forces underlying specific empirical situations that
might be overlooked’ (Gereffi et al., 2005: 82). Drawing on in-depth studies of
83
particular industries, including garments (Gereffi, 1999), footwear (Schmitz, 1999),
horticulture (Dolan and Humphrey, 2000) and electronics (Sturgeon, 2002), Gereffi et
al. devised five inter-firm governance types by combining complexity, codifiability
and capabilities. Each governance type represented a specific industry and could over
time be transmutable between governance modes (Dallas, 2015) and can also be used
as a tool to comprehend modes of relationships of particular firms (Blazek, 2016).
The main unit of analysis within the GVC governance framework is the lead firm. It
is the main point of entry on which the GVC framework epistemologically stands.
Thus, when attempting to alter the entry point to farmers rather than firms, a more
refined agency is provided to other actors, enabling a better understanding of local
dynamics and implications for farmers in a value chain/production network. In sum,
rather than understanding governance from the reference point of the lead firm i.e.
how lead firms govern the chain and their suppliers, this thesis unpacks how farmers
experience governance.
2.3.1 Complexity, Codifiability and Capabilities versus the five governance
typologies
Complexity, codifiability and capabilities, as described in Gereffi et al. (2005), are
building blocks that shape governance. Several pieces of research (Pietrobelli and
Saliola, 2008; Brancati et al., 2016; Dallas, 2015) have enumerated that each of these
factors are dynamic and heterogeneous, that is they vary across firms and over time.
Thus, they can also vary across farmers who participate in global markets versus
farmers in regional markets, as lead firms differ in both networks. Additionally, this
difference is not necessarily limited to farmers across each chain, but also between
some farmers in the same chain. For instance, Neven et al. (2004) found that only a
certain set of more capitalized farmers (higher capabilities) were able to sell into
regional markets. Thus, many farmers were eventually excluded from participating in
RPNs. Furthermore, some farmers may have better relationships with lead firms and
superior capabilities than other farmers selling to the same lead firm. Viewed in this

84
way, there is a need to study each micro level linkage separately, rather than
combining them to form a specific governance typology of relational, captive or arms-
length. Combining complexity, codifiability and capability could hide nuanced
differences between farmers and across farmers in GPNs, RPNs and LPNs.
Another drawback is the process of attributing different levels of high and low
complexity, codifiability and capability in order to develop each governance type.
Gereffi et al (2005) categorize capabilities, codification and complexity of transaction
into’ high or low’. However, such a categorization is heuristic, relative to a situation
and abstract. Furthermore, it could also be plagues by research bias. Thus, caution
must be invoked while aggregating into specific GVC typologies of arm’s length,
modular, captive, hierarchy and relational using descriptors such as ‘high’ or ‘low’.
Therefore, to circumvent these issues, I propose using each factor- complexity,
codifiability and capabilities as a separate explanatory variable, instead of using it as
Gereffi et al. (2005) did in a collective sense to determine each type of governance
structure. By studying each separately, I can flesh out the nuances of each factor rather
than condensing them into a governance type. In the next sections, I flesh out
complexity, codifiability and capabilities taking into account farmer perspectives
(epistemologies) and different PNs.
2.3.2 Complexity
There is a need to unpack what complexity means, especially when considering
farmer perspectives and multiple PNs, as it needs to be defined beyond the firm-
centric understanding of complexity. I start by reviewing the current
conceptualizations of complexity, before pointing out some of the limitations and
examining it through an altered perspective.
Complexity in a GVC context refers to the degree to which complex information and
knowledge is transmitted between buyers and suppliers to sustain a particular
85
transaction18 (Gereffi et al., 2005; Sturgeon et al., 2008; Pietrobelli and Saliola, 2008). In
a buyer-driven chain, lead firms increasingly define the terms of chain membership
(Ponte and Sturgeon, 2014) by demanding just in time supply and improved product
differentiation to meet consumer expectations, hence passing increasingly complex
transactions upstream (Gereffi et al., 2005).
In the context of agriculture, the introduction of technical standards, certification
requirements and codes of conduct are key instruments promulgating complexity
(Dolan and Humphrey, 2000; Tallontire et al., 2005). Complexity of transactions in a
value chain sense involves complex product and process related specifications to
create customized products (Gereffi et al., 2005). Increased complexity in standards
requirements has caused marginalization and exclusion of suppliers in the global
South from participating in GVCs (Ponte, 2002; Gibbon and Ponte, 2005; Barrientos et
al., 2003; Tallontire et al., 2005; Henson and Humphrey, 2010). For instance, to
participate in European markets, farmers in Kenya have to adhere to international
government food safety standards (e.g.: Sanitary and Phytosanitary measures), and
private voluntary standards (business to business - ISO 22000, business to consumer -
GlobalGAP, Tesco Nature). However, these standards will vary in their level of
complexity (and stringency) depending on the lead firm and the destination of the end
market. As discussed in Chapter 1, in the Kenyan context, regional private standards
are less complex than global standards and are thus easier for farmers to adhere to.
For farmers, there are some complex transactions that are more sophisticated in terms
of the information and knowledge that need to be complied with.
It is important to note that several agricultural standards are generally bundles of
good agricultural and environmental practices/tasks that are packaged, in a normative
sense, and are made prescriptive depending on the country context (Henson, 2008).
18 Transaction in this thesis is defined as a discrete occurrence, which frequently recurs. The
uncertainty to which they are subject, and degree of asset specificity, enable distinguishing between
each transaction (Williamson, 1998)
86
Since farmers have intrinsic ties to their natural environment for livelihoods (see
section 2.2.4), they would perform certain environmental practices to promulgate
sustenance of their natural environment. Hence, when comprehending complexity of
transactions from a farmer reference point, it is critical to consider that farmers would
find some of the tasks of less complex (low complexity) because they may be better
known and closer to indigenous practices; while other tasks are found to be of high
complexity, those that are more exogenous and have possibly been encountered by
farmers only because they sell to regional or international lead firms (and otherwise
may have stayed unknown to the farmer). For instance, a study by Okello et al. (2011)
showed that six highly complex tasks linked to shifting to safer pesticide, pesticide
storage, traceability, pesticide disposal pits, charcoal coolers and grading sheds, were
prime causes for Kenyan farmers’ exclusion from high value vegetable chains
exporting to Europe.
In sum, in order to examine complexity as it cuts across different PNs and standard
requirements, this thesis will divide complexity of tasks into different levels. Low
complexity reflecting the level of how indigenous and local the task is; and high
complexity reflecting how exogenous and sophisticated tasks are for farmers. Overall,
the degree of complexity relates to how complex the information and knowledge
transmitted between firms/horizontal actors to farmers is, so as to sustain a particular
transaction/ task. Chapter 5 will empirically delve deeper into unpacking the different
high and low complexity tasks for farmers, while Chapter 6 will reveal how high and
low complexity affect environmental upgrading, and explore whether different
complexity entails varied levels of embeddedness and re-environmentalization across
farmers in GPNs, RPNs and LPNs.
2.3.3 Codification and Capabilities
This section begins by explaining why we need to look at codification and capabilities
differently when accounting for farmer epistemologies and diverse PNs. It is essential
to broaden understandings as to what these terms mean and how to define them. It is

87
necessary to shift away from the firm centric VC/PN focus to describing these
variables from the point of view of ‘who exercises power over’ rather than what
codification and capabilities would mean to farmers, i.e. ‘whom power is exercised
on’ or ‘how power is experienced’. Nuancing these definitions enables answering the
second part of the research sub-question of how to systemize understandings of
governance for farmers in global, regional and local production networks?
The second factor that influences governance is codifiability. Codification is the extent
to which information and knowledge within complex transactions can be codified, to
increase the intensity and ease of transfer between buyers and suppliers (Gereffi et al.,
2005). In a transaction cost sense, codification is said to be efficient when transmission
occurs with minimum transaction-specific investment (Pietrobelli and Saliola, 2008).
The overarching sense of codification stems on the ability of lead firms to codify
complex transactions which range from developing digitized technical standards
which are hands-off to those that require constant mentoring and interaction (Gertler,
2003). However, codification from a supplier/ farmer point of view would relate to the
process by which farmers ‘de-codify’ information and knowledge put forward by lead
firms, in order to upgrade and participate in global or regional production networks.
Therefore, rather than studying how codification takes place, this thesis will focus on
the process through which de-codification occurs, thereby giving a refined model of
agency to farmers in global, regional and local production networks.
The ability to de-codify is closely linked to the third factor in the Gereffi et al. (2005)
framework of capabilities. Capabilities refer to the competence of suppliers i.e. how well
suppliers can handle complex transactions with a given degree of codifiability (Saliola and
Zanfei, 2009). The competence of a supplier is linked to a supplier’s ability to de-
codify, and therefore, in this thesis, capabilities and de-codification are considered as
overlapping concepts. To further understanding of de-codification and capabilities, I
will begin by explaining how tacit and explicit knowledge influence codification, the
learning mechanisms involved in gaining knowledge to abet de-codification, and
88
finally examine the importance of what this thesis calls ‘implicit capabilities’ or the ex-
ante capabilities farmers possess as ICT and productive assets that helps them
participate in global or regional production networks.
Tacit versus explicit knowledge: the ease of codification
The transfer and communication of knowledge is key to comprehending codification.
Knowledge is experiential and consists of know-how, know-what and know-who at
an individual level (Kogut and Zander, 1992, 1993). Know-what is linked to
information19 that can be broken down, coded and communicated as data (Johnson et
al., 2002), while know-how refers to accumulated practical skill enabling to do
something efficiently (von Hippel, 1994). Know-how is acquired and learnt (Kogut
and Zander, 1992) and is the main focus of Micheal Polanyi’s (1966, 1997) notion of
tacit knowledge i.e. experiential based personal learning suggesting some parts are
easy to articulate and codify while some knowledge remains sticky (Johnson et al.,
2002; Ancori et al., 2000). Know-who becomes increasingly important as product
manufacturing becomes more fragmented creating different sources of knowledge
(Pavitt, 1998; Ernst and Kim, 2002). Know-who knowledge is affected by social and
cultural context determining the formation of knowledge and the form it takes
(Johnson et al., 2002). While know-what is primarily concerned with complexity of
transaction, i.e. depending on the requirements emerging in the specific network,
know-how is clearly linked to the accumulation and acquisition of tacit knowledge
and learning that ensues thereafter. Know what, know-how and know-who may differ
across farmers supplying into global, regional and local PNs, not only because of the
different degrees of complexity and codifiability, but also because of the different
ways in which these farmers are network and socially embedded.
19Information is defined as a message containing structured data, which can be transmitted without
loss of integrity once rules for deciphering are known (Cowan et al., 2000; Kogut and Zander, 1992)
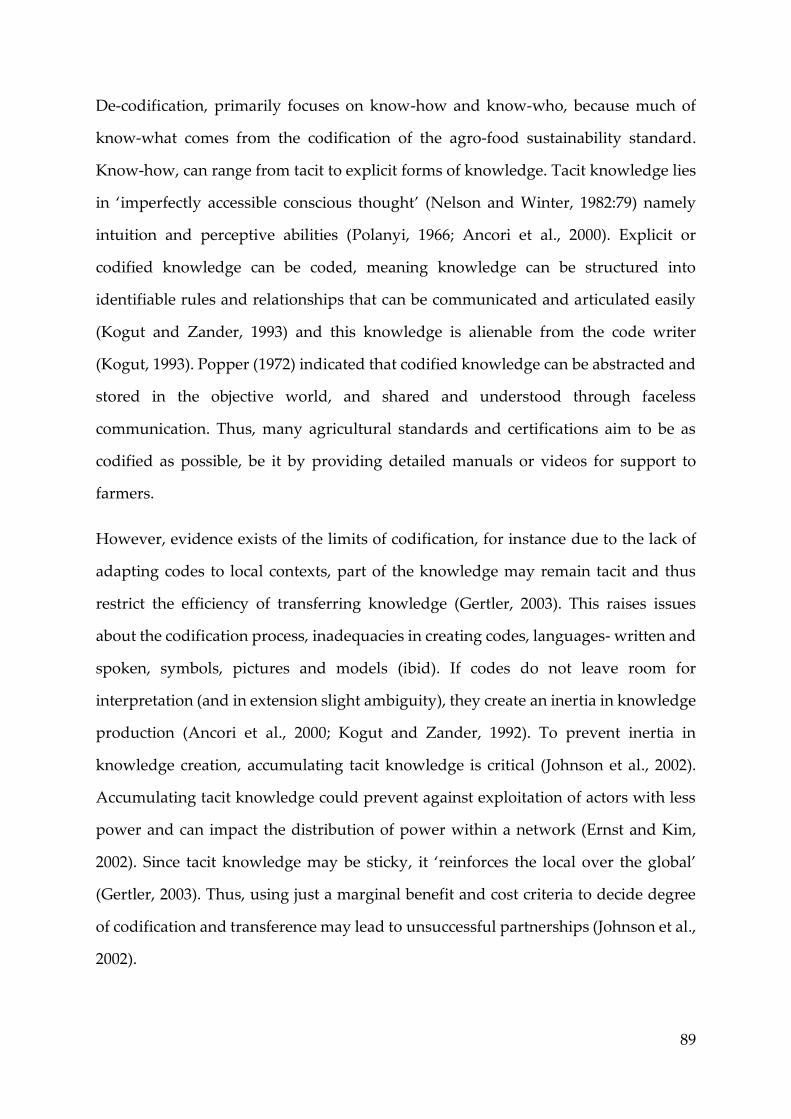
89
De-codification, primarily focuses on know-how and know-who, because much of
know-what comes from the codification of the agro-food sustainability standard.
Know-how, can range from tacit to explicit forms of knowledge. Tacit knowledge lies
in ‘imperfectly accessible conscious thought’ (Nelson and Winter, 1982:79) namely
intuition and perceptive abilities (Polanyi, 1966; Ancori et al., 2000). Explicit or
codified knowledge can be coded, meaning knowledge can be structured into
identifiable rules and relationships that can be communicated and articulated easily
(Kogut and Zander, 1993) and this knowledge is alienable from the code writer
(Kogut, 1993). Popper (1972) indicated that codified knowledge can be abstracted and
stored in the objective world, and shared and understood through faceless
communication. Thus, many agricultural standards and certifications aim to be as
codified as possible, be it by providing detailed manuals or videos for support to
farmers.
However, evidence exists of the limits of codification, for instance due to the lack of
adapting codes to local contexts, part of the knowledge may remain tacit and thus
restrict the efficiency of transferring knowledge (Gertler, 2003). This raises issues
about the codification process, inadequacies in creating codes, languages- written and
spoken, symbols, pictures and models (ibid). If codes do not leave room for
interpretation (and in extension slight ambiguity), they create an inertia in knowledge
production (Ancori et al., 2000; Kogut and Zander, 1992). To prevent inertia in
knowledge creation, accumulating tacit knowledge is critical (Johnson et al., 2002).
Accumulating tacit knowledge could prevent against exploitation of actors with less
power and can impact the distribution of power within a network (Ernst and Kim,
2002). Since tacit knowledge may be sticky, it ‘reinforces the local over the global’
(Gertler, 2003). Thus, using just a marginal benefit and cost criteria to decide degree
of codification and transference may lead to unsuccessful partnerships (Johnson et al.,
2002).

90
However, tacit and codified (or also called explicit) knowledge should be viewed as
complementary (Lam, 2000; Gertler, 2003). Tacit knowledge (e.g. norms, habits,
experiences) shape codified knowledge and the way codified knowledge is created
(e.g. rules, procedures, manuals) will influence the way learning processes are
directed and assimilated thus leading to new forms of tacit knowledge (Ancori et al.,
2000). For instance, requirements within certifications are converted into codified
form (e.g. through a manual), but in order to mobilize it across different socio-
economic-cultural contexts there is a need to engage with different forms of tacit
knowledge (Ancori et al., 2000; O’Hara and Stagl, 2001). This highlights a need to
understand how tacit and explicit knowledge influence learning mechanisms for
farmers and to what extent this differs across farmers participating in global, regional
and local markets. The next sub-section identifies the different learning mechanisms
of tacit and explicit knowledge.
Systematizing key variables of de-codification and capabilities: Learning
mechanisms
Tacit knowledge is best conveyed through demonstration and practice, by close
interactions with all actors involved developing relationships where observation,
repetition, imitation, and correction are employed to learn (Nonaka, 1991; Gertler,
2003). Codified knowledge, in contrast, is primarily acquired through formal study or
logical deduction. However, when codifiability is low, then knowledge is acquired
through Arrow’s (1962) idea of learning by doing or collectively through problem
solving exercises (Kogut and Zander, 1992) or through learning-by interacting
(Lundvall and Johnson, 1994), which moves partially into the realm of tacit
knowledge. The discussion above suggests tacit and codified cannot viewed in the
binary sense but rather as a dynamic gradation and causal, wherein tacit and codified
knowledge can be both substitutable and complementary depending on the context
and the transaction requirement (e.g. Ernst and Kim, 2002; Lam, 2000; Ancori et al.,
2000; Gertler, 2003).

91
The tacit-codified gradation is encompassed by using Bell and Albu’s (1999)
distinction between internal and external learning. They describe internal as passive
experiences or trail by error, which are broadly classified as tacit forms of knowledge,
with minimal or no codifiability of the transaction. External learning, relates to
collaborations, explicit training, know-how diffusion between buyers and suppliers,
which are broadly more codified forms of knowledge. This distinction suggests that
external includes codified but also tacit elements, because knowledge remains sticky
resulting in the need to draw on practice oriented learning (Maskell and Malmberg,
1999). This thesis will use the internal and external learning distinction to classify learning
from tacit to gradually increasingly codified.
However, acquisition and accumulation of tacit and codified knowledge may not only
differ across end markets linked to global or regional PNs, but also occurs
heterogeneously across individual farmers as well. This suggests that there is a need
to consider the divergence that arises across and between farmers. For instance, in a
GPN context, knowledge can reside at the level of an individual’s cognitive abilities.
But if farmers are part of a primary marketing organization (PMO), then they gain
codified knowledge collectively, where collective knowledge refers to accumulation,
storage, distribution and sharing of knowledge among members of an organization
(Lam, 2000). These collective and individual forms of knowledge could evolve due to
changes in societal and network embeddedness. Thus, there is need to further nuance
this gradation of internal-external learning, by integrating it with the individual and
collective scale.
Lam (2000) proposed an ideal typology for combining tacit and codified knowledge
with individual/collective capability to generate four relevant categories of learning.
Figure 2.2 depicts the 2x2 matrix, where the first quadrant is embrained knowledge,
(individual-codified/external) which focuses on individual cognitive skill and formal
study. For instance, scientific knowledge such as laws of nature that are rational and
universal form part of this category (Lam, 2000).
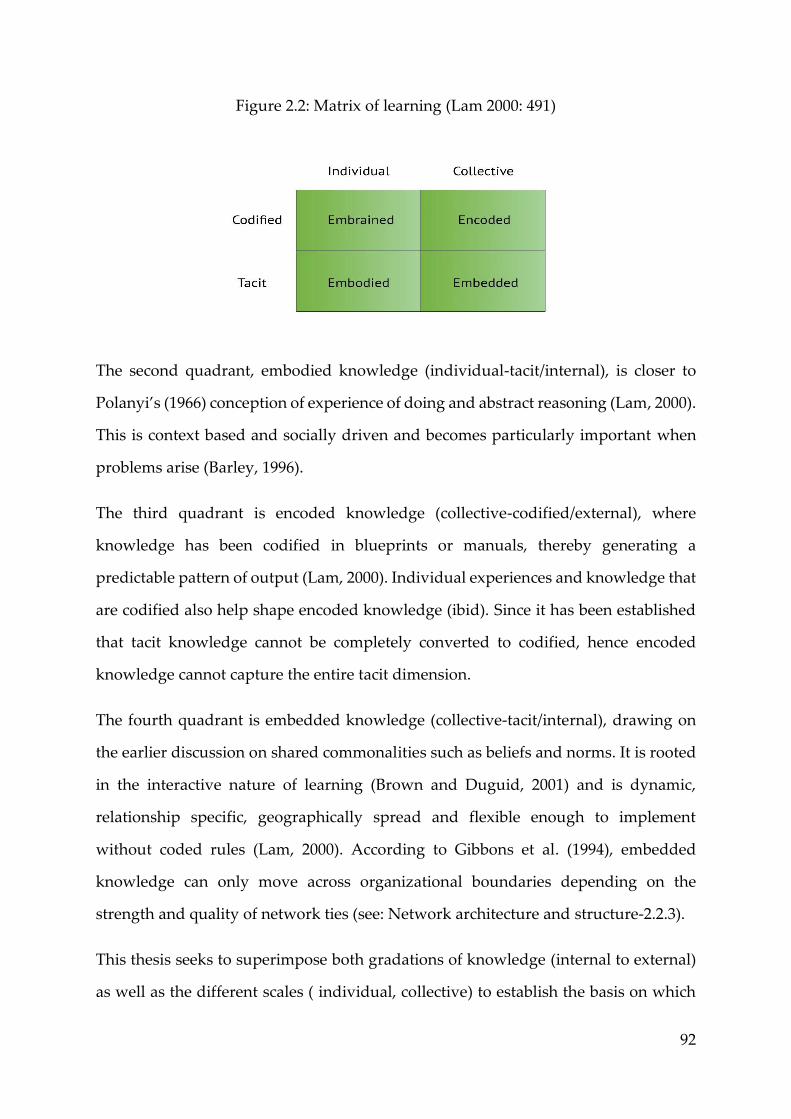
92
Figure 2.2: Matrix of learning (Lam 2000: 491)
The second quadrant, embodied knowledge (individual-tacit/internal), is closer to
Polanyi’s (1966) conception of experience of doing and abstract reasoning (Lam, 2000).
This is context based and socially driven and becomes particularly important when
problems arise (Barley, 1996).
The third quadrant is encoded knowledge (collective-codified/external), where
knowledge has been codified in blueprints or manuals, thereby generating a
predictable pattern of output (Lam, 2000). Individual experiences and knowledge that
are codified also help shape encoded knowledge (ibid). Since it has been established
that tacit knowledge cannot be completely converted to codified, hence encoded
knowledge cannot capture the entire tacit dimension.
The fourth quadrant is embedded knowledge (collective-tacit/internal), drawing on
the earlier discussion on shared commonalities such as beliefs and norms. It is rooted
in the interactive nature of learning (Brown and Duguid, 2001) and is dynamic,
relationship specific, geographically spread and flexible enough to implement
without coded rules (Lam, 2000). According to Gibbons et al. (1994), embedded
knowledge can only move across organizational boundaries depending on the
strength and quality of network ties (see: Network architecture and structure-2.2.3).
This thesis seeks to superimpose both gradations of knowledge (internal to external)
as well as the different scales ( individual, collective) to establish the basis on which

93
learning occurs. This learning then explains the capabilities farmers need to be able to
de-codify complex transactions. Clearly, these may vary between farmers supplying
into export, regional and local markets.
Figure 2.3 below is a heuristic depiction of the gradation of knowledge and learning
process across scales. Embodied knowledge is classified as an internal learning
mechanism as it relies on tacit knowledge and is acquired through learning by doing,
while embedded, encoded and embrained knowledge are classified under varying
degrees of external learning, because of how they are absorbed, acquired and
appropriated. The bi-directional arrows signify that there are dynamic loops between
internal and external and tacit and codified that influence each other. These learning
mechanisms are key to unearthing the ‘competence’ of the farmer to be able to
upgrade and continue to participate in a particular production network.
Figure 2.3: Leaning mechanisms for de-codification
Source: Author’s construction
When participating in GPNs/GVCs, Ernst and Kim (2002) suggest that lead firms can
actively and passively influence knowledge transferability. They do so actively by
controlling the know-what and know-how of knowledge, and passively by
territorially anchoring into places and taking advantage of local contexts. However,
these modes of learning can vary for farmers in RPNs, depending on the power
asymmetry and their level of capabilities and de-codification.

94
Pietrobelli and Rabellotti (2011) provide an excellent example of linking GVC
governance structures to modes of learning acquisition. They explicate that if
complexity of transactions and capabilities of supplier base are high, even if there is
low codifiability, high levels of tacit knowledge exist. Direct transfer mechanisms can
take place through face-to-face interactions, personal communication and mentoring.
While in situations when complexity is high, but the capability of the suppler base is
low, then deliberate transfers of knowledge only function for a narrow range of tasks.
Furthermore, imitation and spillovers are also frequent learning mechanisms when
direct transfers are not present.
Superimposing their work on figure 2.2 and 2.3, would suggest that internal
knowledge is mostly embodied and accrued through personal experience, while
external knowledge is accrued through direct transfer, imitations and replications
which position themselves at various points in the gradation between external and
internal knowledge. For instance, imitation will be mostly embedded knowledge
while direct transfer will be encoded and embrained. Thus, the need to adhere to
complex and sophisticated standards would suggest that farmers participating in
GPNs tend to have higher levels of external knowledge (embedded, encoded and
embrained). RPN and LPN farmers may have both internal and external knowledge,
while local farmers are likely to rely on internal, embodied forms.
Know-who: why it matters in production networks
Studying learning mechanisms in a GPN/GVC context is incomplete without
understanding ‘know-who’ i.e. ‘who’ delivers external learning. Without this, it
would not be possible to know-what to learn (Johonson et al., 2002). This thesis
categorizes knowledge sources as individual, local community, horizontal and vertical
actors, as they differ across GPNs, RPNs and LPNs.
Local community actors are those who are spatially (and relationally) proximate. They
may aid knowledge creation through embodied and embedded methods. Vertical

95
actors are those who participate in a PN (e.g.: lead firms, brokers) and enable transfer
of external knowledge (with elements of internal knowledge) by replication of
technology, face to face interactions and direct transfers. Most vertical actors seek to
develop long term relationships by creating competent supplier bases (Gereffi et al.,
2005).
Horizontal actors are those discussed in the GPN literature as non-firm actors (e.g.
sub-national and national governments, CSOs, business associations, educational
institutions). The role of horizontal actors can be key. Kadarusman and Nadvi (2013)
highlight, through an example of Indonesian garment and electronic firms, that the
GVC provides very limited insight into the agency of local firms to engage with the
upgrading process. They find that the incremental knowledge of intermediaries (and
horizontal actors) along the chain needs to be considered to fully understand how
transactions can be codified and successfully completed. Similar to vertical actors,
horizontal actors also transfer codified knowledge; however, their local links enable
the passage of tacit knowledge in different contexts. Thus, they can create embedded,
encoded and embrained knowledge.
One last category to depict the embodied form of knowledge included relates to the
self. This involves personal cognitive skills, personal experiences and abstract
reasoning to make sense of the world and complete transactions.
Putting it together
Integrating the gradation of learning (internal and external), along with Lam (2000)’s
types of learning, and know-who, enables the development of robust indicators for
de-codification and capabilities. Table 2.3 provides details of the variables that will be
utilized in the thesis, enabling comprehension of the capabilities, learning processes
and mechanisms that exist across, and the differences between, farmers supplying into
global, regional and local production networks.

96
Table 2.3: De-codification and capabilities categorization
Capability
classification
Learning
mechanism
Learning process Know-who
Internal Personal experience Embodied Self
External Imitation, face to
face, spillover
embedded,
embodied
Community
External Direct transfer, face
to face, replication,
pressure of
compliance
embedded,
encoded,
embrained
Vertical
External Direct transfer, face
to face, replication
embedded,
encoded,
embrained
Horizontal
Source: Author’s construction
Absorptive capacity
Having established that there are different levels of internal and external knowledge,
various methods of individual (embrained, embodied) and collective (encoded,
embedded) learning through different modes (e.g. direct transfer, spillover, face-to-
face, imitation), what matters is also the ability of farmers to harness and mobilize
these forms of knowledge to be able to successfully complete a complex transaction.
Such abilities may vary significantly between farmers supplying into each market, and
also between farmers in the same production network. These differences may exist
due to the intensity of effort or commitment, which Cohen and Lavinthal (1990) term
absorptive capacity. Similarly, for Ernst and Kim (2002), “how fast and successfully
the local suppliers internalize and translate transferred knowledge into their own
capability through learning will be largely determined by their absorptive capacity”
(pg: 1425). Intensity of effort, representing the cognitive and physical energy
investment made by actors in the organization (and in internalization) determines the
speed at which tacit and codified knowledge is converted (Kim, 1998). This will
determine successful appropriation and acquisition of knowledge.
The divergence in absorptive capacity becomes even more pronounced due to the
sticky nature of knowledge (Von Hippel, 1994). What is tacit to one individual could
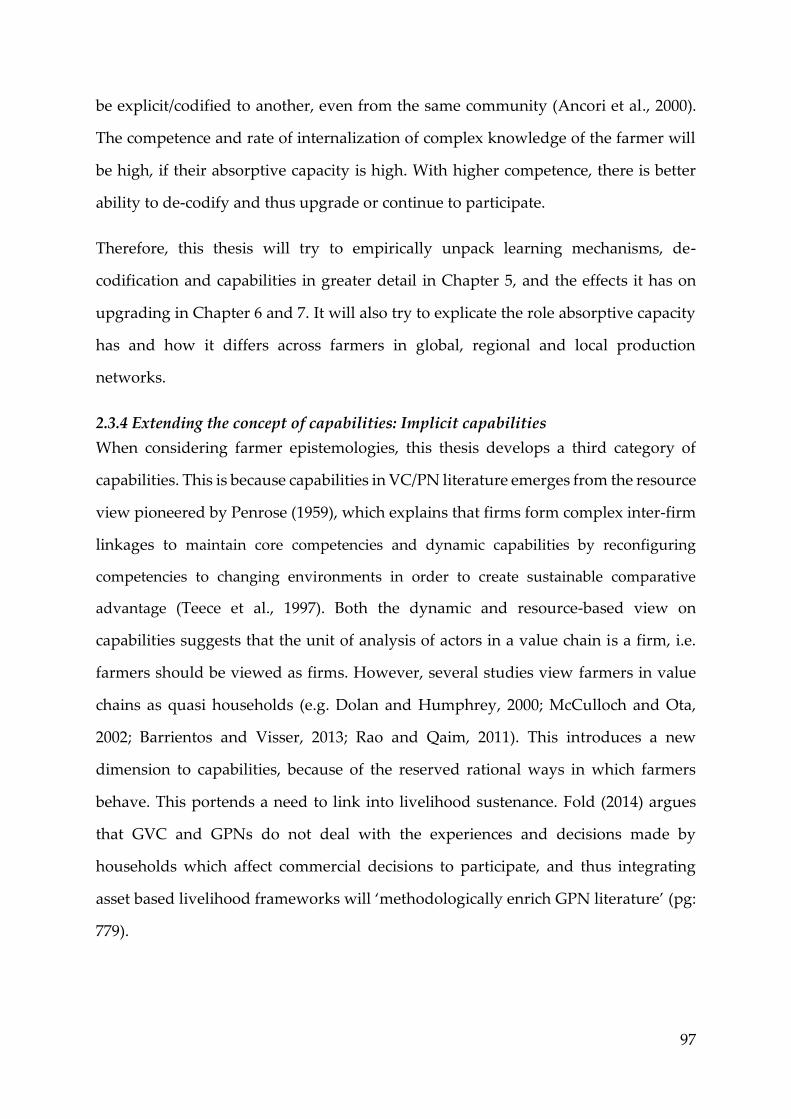
97
be explicit/codified to another, even from the same community (Ancori et al., 2000).
The competence and rate of internalization of complex knowledge of the farmer will
be high, if their absorptive capacity is high. With higher competence, there is better
ability to de-codify and thus upgrade or continue to participate.
Therefore, this thesis will try to empirically unpack learning mechanisms, de-
codification and capabilities in greater detail in Chapter 5, and the effects it has on
upgrading in Chapter 6 and 7. It will also try to explicate the role absorptive capacity
has and how it differs across farmers in global, regional and local production
networks.
2.3.4 Extending the concept of capabilities: Implicit capabilities
When considering farmer epistemologies, this thesis develops a third category of
capabilities. This is because capabilities in VC/PN literature emerges from the resource
view pioneered by Penrose (1959), which explains that firms form complex inter-firm
linkages to maintain core competencies and dynamic capabilities by reconfiguring
competencies to changing environments in order to create sustainable comparative
advantage (Teece et al., 1997). Both the dynamic and resource-based view on
capabilities suggests that the unit of analysis of actors in a value chain is a firm, i.e.
farmers should be viewed as firms. However, several studies view farmers in value
chains as quasi households (e.g. Dolan and Humphrey, 2000; McCulloch and Ota,
2002; Barrientos and Visser, 2013; Rao and Qaim, 2011). This introduces a new
dimension to capabilities, because of the reserved rational ways in which farmers
behave. This portends a need to link into livelihood sustenance. Fold (2014) argues
that GVC and GPNs do not deal with the experiences and decisions made by
households which affect commercial decisions to participate, and thus integrating
asset based livelihood frameworks will ‘methodologically enrich GPN literature’ (pg:
779).

98
I will draw on asset models within livelihood frameworks20 (Bebbington, 1999,
Scoones, 1998; Carter and Barrett, 2006; Moser and Felton, 2007) to demonstrate that
assets or stocks of capital are implicit capabilities required by resource poor actors to
participate in markets (Booysen et al., 2008) or what Lall (1993) refers to as ‘ex-ante
capabilities’. Assets consist of tangible assets (e.g. stores and material resources) and
intangible assets (claims and access) and are important determinants of personal
capabilities (cf. Chambers and Conway, 1992: 10). Scoones (1998) explicates that
possessing assets can enable the pursuit of better livelihoods. The two types this thesis
will unpack are:
Physical capital: stocks of technical equipment for consumption such as communication
(e.g.TV, radio, mobile, computer), housing structures, lighting sources, transportation
(e.g. car, bicycle).
Productive capital: monetary and durable which is productive for income generation
capacity, such as machinery, gold, stocks, insurance.
In sum, these assets or stocks of capital are referred to as implicit or ex-ante capabilities
(assets farmers had before participating in a particular chain), which is included
within capabilities. These are implicit because they are possessed or accessed by actors
regardless of chain participation, as they are ‘personal’ (Scoones, 1998). They can also
be examined as suppliers’ competence bases (Pietrobelli and Saliola, 2008), which may
be important determinants that cause lead firms to territorially embed. These implicit
assets may vary considerably between global, regional and local farmers. For instance,
several papers (e.g. McCulloch and Ota, 2002; Okello et al., 2007; Neven et al., 2009)
found that farmers with higher capitalization, in terms of productive and physical
assets, were more likely to be able to participate in GPNs than farmers with less assets.
20 This thesis does not seek to engage in livelihood frameworks and is only drawing on asset models to
develop the implicit capabilities category. Further research could delve deeper into the links with
livelihoods.

99
Thus, this thesis will include implicit capabilities within the remit of ‘de-codification’
and ‘capabilities’.
2.3.5 Summary of Complexity, Codifiability and Capabilities
I account for farmer perspectives when studying complexity, codifiability and
capabilities across diverse PNs. Overall, studying complexity, codifiability and
capabilities as separate variables, rather than through specific governance structures,
enables comprehending their dynamic and heterogeneous nature across farmers. By
revealing the distinct differences across farmers in each network, it contributes by
furthering and nuancing the governance and learning in VCs/PNs.
The figure below sums up how complexity, codifiability and capabilities are
interconnected. The complexity of transactions relates to sophistication in standards
or requirements set by lead firms. These can be classified into two categories- low
complexity, when the level of sophistication is low or the transaction is already known
to the farmer as it is performed indigenously; and high complexity involving relatively
exogenous, more sophisticated tasks that are unknown to the farmer.
Second, rather than studying whether lead firms can codify complex transactions, this
thesis unpacks the ability of farmers to de-codify complex transactions, thus
overlapping with the capabilities farmers must have to comply with the transaction.
The key tenets that abet understanding the ability of de-codification and capabilities
are the processes of internal (tacit) and external knowledge (codified knowledge).
Further these processes are nuanced when the spectrum of internal and external
include Lam’s (2000) typology of learning at individual and collective levels -
embrained (tacit) to encoded, embodied and embedded, which are explicit. I also add
a third category of implicit capabilities by drawing on livelihood frameworks (assets
owned and accessed). Furthermore, addressing ’know-who’, the thesis identifies
vertical, horizontal and community level stakeholders who enable learning to occur.
Figure 2.4: Connecting complexity, codifiability and capabilities

100
Source: Author’s construction
2.3.6 Determinants of environmental upgrading: Linking embeddedness and
governance across global, regional and local production networks
While much of the understanding of embeddedness in a GPN context has focused on
lead firms, this thesis seeks to use the concept to study the process and mechanism
through which farmers embed in global, regional and local production networks.
Thus, by making farmers the entry point of the research, this thesis seeks to provide a
refined model of agency to help understand the local dynamics and compare across
farmers in diverse PNs. The key research sub-question of this chapter is a conceptual
one, on how to integrate environmental dimensions into conceptualizations of embeddedness
and systemize understandings of governance (for farmers) in global, regional and local
production networks.
Within the concept of embeddedness, I contribute by introducing the term ‘re-
environmentalization’ and nuancing network, societal and territorial embeddedness
so that they can be quantified. Drawing from the work of Hess (2004) I examine
societal embeddedness, as a dynamic interplay of how cultural, cognitive and path
dependent mechanisms influence and reshape their economic behaviour. I advocate
that the cognitive mechanisms of actors (suppliers/ farmers) are not only impacted by
the path dependent nature of their own heritage and histories, but also the cultural
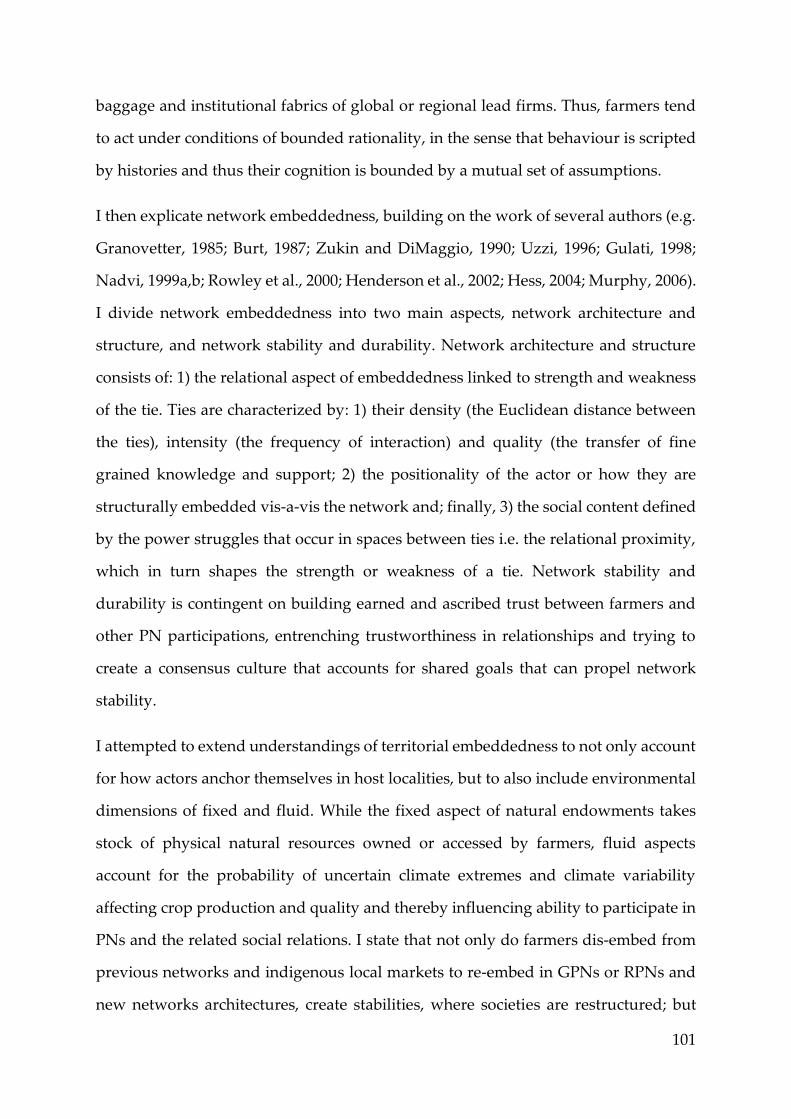
101
baggage and institutional fabrics of global or regional lead firms. Thus, farmers tend
to act under conditions of bounded rationality, in the sense that behaviour is scripted
by histories and thus their cognition is bounded by a mutual set of assumptions.
I then explicate network embeddedness, building on the work of several authors (e.g.
Granovetter, 1985; Burt, 1987; Zukin and DiMaggio, 1990; Uzzi, 1996; Gulati, 1998;
Nadvi, 1999a,b; Rowley et al., 2000; Henderson et al., 2002; Hess, 2004; Murphy, 2006).
I divide network embeddedness into two main aspects, network architecture and
structure, and network stability and durability. Network architecture and structure
consists of: 1) the relational aspect of embeddedness linked to strength and weakness
of the tie. Ties are characterized by: 1) their density (the Euclidean distance between
the ties), intensity (the frequency of interaction) and quality (the transfer of fine
grained knowledge and support; 2) the positionality of the actor or how they are
structurally embedded vis-a-vis the network and; finally, 3) the social content defined
by the power struggles that occur in spaces between ties i.e. the relational proximity,
which in turn shapes the strength or weakness of a tie. Network stability and
durability is contingent on building earned and ascribed trust between farmers and
other PN participations, entrenching trustworthiness in relationships and trying to
create a consensus culture that accounts for shared goals that can propel network
stability.
I attempted to extend understandings of territorial embeddedness to not only account
for how actors anchor themselves in host localities, but to also include environmental
dimensions of fixed and fluid. While the fixed aspect of natural endowments takes
stock of physical natural resources owned or accessed by farmers, fluid aspects
account for the probability of uncertain climate extremes and climate variability
affecting crop production and quality and thereby influencing ability to participate in
PNs and the related social relations. I state that not only do farmers dis-embed from
previous networks and indigenous local markets to re-embed in GPNs or RPNs and
new networks architectures, create stabilities, where societies are restructured; but
102
they also get detached from previous relations they have with their environment. This
leads to their appropriation or recasting of detached socio-environmental relations to
global or regional production networks. In turn, new give and take between humans
and natural objects occurs, in effect creating different types of dynamic ecologically
reciprocal relationships. This process of re-environmentalization can differ across
farmers in global and regional markets, especially due to the different stringency in
expert systems, varying environmental demands and the diverse network
architectures and forms of stability that exist.
The second part of the research sub-question involved furthering understandings of
governance with farmer epistemologies in global, regional and local production
networks. I do this by unpacking the 3C’s. The complexity of transactions can be
classified into low complexity, when the level of sophistication is low or the
transaction is already known to the farmer as it is performed indigenously; and high
complexity involving relatively exogenous, more sophisticated tasks that are
unknown to the farmer. The other ‘C’ refers to the ability of farmers to de-codify
complex transactions, thus overlapping with the capabilities farmers must have to
comply with the transaction. De-codification is expedited through garnering internal
and external learning (ranges of tacit and explicit knowledge) at individual and
collective levels and ex-ante implicit capabilities which consider competency through
owned and accessible assets. The thesis argues that each of these variables differ across
farmers participating in global, regional and local PNs because each of the processes
are inherently dynamic and there are heterogeneous differences in how farmer absorb
and perform tasks.
However, both embeddedness and governance factors are clearly interlinked. For
instance, network stability is critical to long-term relationship sustenance, as trust
forms a basis for mutual gain for sharing tacit knowledge (Ettlinger, 2003; Gertler,
2003). Even capabilities are not developed in isolation. Rather they are affected by
dense networks consisting of formal and informal relationships between actors, which
103
in many cases aids in gaining access to lumpy information (Lall, 1993). At a cognitive
level, societal embeddedness determines the tacit nature of human knowledge, the
acquisition of know-how and the dynamic links with collective knowledge (Lam,
2000). The stickiness of knowledge overlaps with how actors are embedded in
different production networks. Further strong network architectures and structures
augment trust building, stemming opportunistic behaviour and thus reinforcing
effective knowledge sharing and success (ibid).
Of course, these interlinkages are not homogenous across farmers supplying into
global, regional and local end markets. In Chapter 5, this thesis will unravel
differences in the process and mechanisms of how farmers embed in these markets,
the different degrees of re-environmentalization and the heterogeneity in terms of de-
codification and capabilities of complex tasks. It will thereby provide a basis to
compare across PNs which may have significant implications when it comes to
devising targeted policies.
I rethink and extend conceptualizations of environmental upgrading in Chapter 3 and
flesh out the dynamic relationship of different forms of embeddedness and the
governance have with upgrading, both qualitatively and quantitatively in Chapter 6
and Chapter 7.

104
3. Rethinking environmental upgrading in production networks
3.1 Introduction
This chapter focuses on the third pillar of VC/PN literature, upgrading. Research has
focused considerably on economic and social upgrading, yet with little attention to
either environmental upgrading (cf. De Marchi et al. 2013a, 2013b) or environmental
implications of participating in GPNs/GVCs (Bolwig et al., 2010; Dalgaard et al., 2008).
Environmental upgrading is increasingly important as discussed in Chapter 1,
because of a rise in environmental (and sustainability) standards and the need to cope
with climate variability and extremes. This thesis will attempt to decompose what
environmental upgrading means to a farmer, what factors drive farmers to
environmentally upgrade (namely re-environmentalization and governance), and will
also elaborate the implications i.e. the outcomes of environmental upgrading. With
that in mind, this thesis seeks to answer the research sub-question of: how can
environmental upgrading and its outcomes be conceptualized for farmers in global, regional
and local production networks?
I begin with rethinking environmental upgrading across global, regional and local
production networks, moving beyond the North-South lens through which upgrading

105
is usually viewed. I discuss three key types of environmental upgrading- product,
process and strategic. I reveal that environmental upgrading is inherently dynamic
and non-linear, because farmers participating in different end markets upgrade
heterogeneously and may choose to downgrade depending on the situation.
Consequently, the non-linearity is exacerbated because both the re-
environmentalization and governance, which shape the process of upgrading, are also
inherently dynamic.
This chapter is structured as follows. I commence by briefly unpacking the origins of
economic and social upgrading, and then highlight key limitations linked to the
dearth of studies of upgrading through a farmer lens. Subsequently, I define and
develop three types of environmental upgrading. Then in section 3.2, I provide a
systematic way to measure environmental outcomes (using indicator based methods),
as a consequence of environmental upgrading. The last section (3.3) brings together
the concepts of re-environmentalization, governance (complexity, codifiability and
capabilities) drawing from Chapter 2, and environmental upgrading, which I will
empirically unpack in chapter 6.
3.1.1 Conceptual origins and limits of economic and social upgrading
This section discusses the conceptual underpinnings of economic and social
upgrading that are more widely studied, before environmental upgrading, since
environmental upgrading is intrinsically linked to economic and social upgrading
(DeMarchi, 2013a; DeMarchi, 2013b; Khattak et al., 2015). The definition and
components of upgrading have been informed through multiple strands of literature.
Within mainstream macro-economics, new trade theory (e.g. Krugman-Heplman) and
empirical trade (e.g. Feenstra, Leamer) has found upgrading to occur due to labour
mobility, economies of scale, technological advancement, and spillovers. Within
cluster and innovation literature, upgrading has been viewed as incremental,
experiential learning i.e. learning by doing and interacting (Foray and Lundvall, 1998)

106
linked to proximity in regions, which in turn increased competitiveness (Nadvi,
1999a,b).
From economic sociology, Gereffi (1994, 1999) challenged the macroeconomic view of
mainstream economists, and also the fixation on local horizontal inter-firm dynamics
and learning in cluster and innovation literature. He proposed the foundations of
upgrading as composing of vertical backward (sourcing) and forward (marketing)
linkages, that occurred due to increased fragmentation of production. Gereffi (1999:
51-52) defined industrial upgrading as a ‘process of improving the ability of a firm or an
economy to move to more profitable and/or technologically sophisticated capital and skill-
intensive economic niches’. Rents were crucial to this understanding of upgrading.
Gereffi (1999) drew on the Schumpeterian notion of economic rent wherein firms
innovate and use this to maintain a barrier to entry, enabling rent accumulation at
least in the short term (Kaplinsky, 1998).
Humphrey and Schmitz (2002) and Humphrey (2004) stylized industrial upgrading
by reconciling across GVC, cluster and innovation system literature to develop a four-
fold typology of economic upgrading. The key types are: process upgrading, which
involves reorganizing production systems or improving technology (embodied and
disembodied technological change) to increase efficiency of the production processes
such as using certifications; product upgrading which involves producing more
sophisticated and complex product lines that are defined by increased unit values and
value addition usually measured through product sophistication indexes (Lall et al.,
2006; Hausman, 2007; Assche and Gangnes, 2010; Zhu and Fu 2013); functional
upgrading, which means acquiring higher level functions or abandoning lower level
ones (Blazek, 2016); and chain upgrading, which is organizational succession by a
supplier shifting towards a new GVC (ibid).
Several authors, including Blazek (2016), Navas-Aleman (2011), Barrientos et al.
(2016a), have nuanced and added more substance by extending these typologies

107
beyond the North-South lens of upgrading to include South-South and regional level
analysis. However, economic upgrading is still focused on lead firms, or first/second
tier firms, overlooking the agency of lower tier actors (Tokalti, 2013). Moreover, there
is a tendency to study the benefits of upgrading in relation to the actor that dominates
the relationship (Starosta, 2010).
Since this thesis focuses on farmers, there is a need to rethink upgrading in their terms.
This helps understand what upgrading (not only economically/socially but also
environmentally) means to farmers, and its implications for them, thereby answering
upgrading ‘for whom’ and ‘what it means’. For instance, a process upgrade such as
acquiring organic certification might mean improved reputation and compliance with
corporate social responsibility (CSR) goals for a lead firm but at the same time it may
reduce crop yield by increasing pest and disease attacks for the farmer, thereby
reducing their overall competitiveness (Krauss and Krishnan, 2016). Thus, the same
upgrade may impact less powerful actors differently. Furthermore, this also enables
comparing and contrasting whether upgrading has different implications on farmers
participating in global, regional and local PNs. Therefore, I will address the limitation
linked to upgrading for whom, by rethinking environmental upgrading.
Research on social upgrading, pioneered by Barrinetos et al. (2011) and Milberg and
Winkler (2011), has come closer to answering ‘for whom’ by concentrating on workers
and thereby shifted the focus from the firm. Social upgrading emerged because
economic upgrading mostly failed to include labour within its remit. If considered, it
was treated as an endogenous factor of production (Barrientos et al., 2003; Barrientos
et al., 2011). Social upgrading is defined in terms of measurable aspects such as labour
productivity and skill, wages and the permanency of employment, working hours,
social protection, health, safety and union/ self-help group participation (Barrientos
and Visser, 2013); as well as enabling rights (Sen, 2000) based on principles of social
justice – freedom of association and no discrimination (Elliott and Freeman, 2003;
Barrientos and Smith, 2007). Social upgrading is thus a “process of improvement in the

108
rights and entitlements of workers as social actors, which enhances the quality of their
employment” (Barrientos et al., 2011: 324).
The next section addresses the limitations of understanding what environmental
upgrading means for farmers and, builds on recent related work (e.g. Jeppsen and
Hansen, 2004; Orsato, 2009; DeMarchi et al., 2013a, 2013b; Goger, 2013; Poulsen et al.,
2016), offers three key types - product, process and strategic.
3.1.2 Environmental upgrading: Definition, typologies and links to economic and
social upgrading
Most research has focused on environmental certifications and seals (e.g. Klooster,
2005; Ponte, 2008; Raynolds et al., 2007), and not yet been unpacked for farmers in
global, regional and local PNs. However, the environment upgrading is becoming
ever present as several authors (e.g. Vachon and Klassen, 2008, DeMarchi et al., 2013a;
Goger, 2013; Khattak et al, 2015) have discussed that environmental performance also
has a business case, and enhances competitiveness of lead firms and suppliers. This
suggests that environmental upgrading is motivated by commercial indicators such
as rents, as well as improvements in the natural environment. Thus, it is intrinsically
linked to economic upgrading.
Current conceptualizations of environmental upgrading in GVCs/GPNs are inspired
by several strands of literature. Corporate social responsibility (CSR) is one strand that
focuses on improving economic, social and environmental conditions through
creating sustainability goals and integrating environmental issues deeply into firm
strategies (Bettiol et al., 2011; Lund-Thomsen, 2008). Another strand, strategic
management literature, is centred on the economic advantages of employing various
strategies to achieve environmental competitiveness (Orsato, 2009). Orsato highlights
four key environmental strategies. First, eco-efficiency, which focuses on improving
organizational processes by offering lower costs, with examples including reducing
waste and energy consumption through the chain. Second, beyond compliance

109
leadership, which occurs when a company focuses on differentiation and thus uses eco-
labelling to make consumers aware of their green products (form of reputation
insurance). Third, eco branding, which is when a firm’s focus is on eco-friendly
products and services, warranting a price premium over non-eco-friendly goods.
Fourth, environmental cost leadership in which firms radically alter products and
services (or even enter new industries) to compete on lower price. DeMarchi et al.
(2013b) suggest the addition of a blue ocean strategy which involves developing
innovative strategies that can change the structure of the industry.
Another strand of literature on why and how environmental upgrading can occur
emerges from transaction cost approaches. Jeppsen and Hansen (2004) use the
internalization21 perspective within ‘transaction costs’ to suggest that environmental
upgrading takes place when Northern firms deeply integrate with Southern firms by
making asset specific investments. They also highlight the importance of collaboration
arising from having environmental competences, stressing that cooperation or
contestation could impede or facilitate competitiveness and upgrading (ibid). Overall,
the various strands of literature reiterate the importance of entrenching environmental
thinking into value chains by fostering cooperation with suppliers (Srivastava, 2007).
Overarchingly, environmental upgrading is a change in production systems, moving towards
more environmentally friendly products and processes.
The GPN/GVC literature draws on (and complements) research on the above
discussed literatures of transaction costs, comparative advantage, CSR and strategic
management as well as acknowledges the importance of local actors and institutions
in shaping upgrading. In a GPN/GVC context, adopting green strategies would
involve considering the entire PN and the interactions across different actors enabling
or dis-enabling the greening process (Bettiol et al., 2011). DeMarchi et al. (2013b:66)
21Internalization theory argues that cross border integration takes place due to various market failures
in host markets, especially related to knowledge or technology and therefore incentivises cross border
hierarchies to economize transaction costs (Jeppsen and Hansen 2004).

110
define environmental upgrading as “the process by which economic actors move towards a
production system that avoids or reduces the environmental damage from their products,
processes or managerial systems”. Reducing or avoiding environmental damage consists
of lowering firm ecological footprints, be it greenhouse gas reduction, wasteful
consumption of natural resources or degradation.
To create specific typologies, DeMarchi et al. (2013b) illustrate the complementarities
between economic and environmental upgrading in GVCs, drawing heavily from
Orsato (2009)’s green strategies:
“by coupling economic and environmental upgrading, a firm can increase its
power within the VC – due to its new competences, market relationships or
technology control, ‘moving up’ in the VC and in the value captured by the
firm. At the same time, by implementing a sustainability strategy, the firm
affects the greening of its VC, modifying its relationships with other players in
the VC (i.e. pushing suppliers’ environmental upgrading or affecting buyer
selection)” (DeMarchi et al., 2013b: 66).
The four types of environmental upgrading are as follows. Bettiol et al. (2011) and
DeMarchi et al. (2013b) link process upgrading to eco-efficiency, wherein firms alter
practices and processes through introducing new environmental goals and standards.
Beyond compliance leadership is linked to process and functional upgrading since it
induces firms to also develop new functions and play a new/additional role in the VC.
If a firm’s comparative advantage were based on differentiation, then product
upgrading would relate to eco-branding and environmental cost leadership.
Environmental cost leadership may also cause inter-sectoral upgrading as it may
change the industry structure.
While the definition of environmental upgrading put forward by DeMarhci et al.
(2013b) is insightful, it still implies the centricity of the firm. For example, it would
become more complicated if DeMarchi et al. (2013b) also studied the farmers involved

111
in the production, finishing and sourcing of wood besides just focusing on lead firms
and large suppliers. A process of eco-labelling or environmental cost leadership
would be very difficult for a small-scale farmer to achieve with limited financial and
natural resources. In buyer driven chains, green strategies and standards are set based
on sustainability priorities of lead firms (Jeppsen and Hansen, 2004) and powerful
intermediaries rather than farmers (Barrientos and Visser, 2013).
To address the question of what upgrading means to a farmer, one must account for
how farmers are embedded and the capabilities (and de-codification ability) they
possess to be able to adhere to technocratic environmental requirements prescribed
by lead firms, and whether these requirements create positive environmental
implications for farmers, rather than only for lead firms. For instance, Klooster (2005)
explains that environmental values of actors in agro-VCs differ significantly, and thus
environmental upgrading would have different ‘meanings’ for different actors. Thus,
the definition of environmental upgrading needs to be modified in order to take them
into account.
As discussed in Chapter 2 (section 2.2), farmers act under reserved rationality because
their natural resources and livelihoods are inseparable. Farmers have diverging
rationales of why they would perform different environmental upgrades, be it
standards-driven requirements to continue to sell into GPNs or RPNs or conservation
for bequest, stewardship or attachment to farmland. This means that both performing
and reaping benefits of environmental upgrading to farmers is a negotiation between
sustainability priorities of global or regional lead firms. In this sense, their choice of
performing environmental upgrades is bound by their cognitive limits and their ease
of re-environmentalizing into GPNs/RPNs.
Furthermore, the negotiation is not only between priorities of lead firms, but a toss-
up between performing economic, social and environmental upgrades. The implicit
assumption is that economic upgrading is the maximization of Schumpeterian

112
economic rents or income (Kaplinsky, 1998; Gereffi, 1999; Goger, 2013). Social
upgrading assumes welfare maximization based on labour productivity and
entitlements (Barrientos and Smith, 2007; Barrientos et al., 2011). The case for
environmental upgrading differs slightly because of reserved rationality. Thus,
environmental upgrading not only has environmental implications, but also has
commercial implications and well-being aspects, especially when accounting for
fulfilling household collective wants. Hence, this thesis proposes the importance of
not studying environmental upgrading in isolation of economic and social.
Farmers, because of ‘place’, are also affected by fluid territorial aspects of climate
variability and extremes, which also needs to be accounted for within the remit of
environmental upgrading, as it intersects and influences eco-efficiency and beyond
cost leadership forms of environmental upgrading. For instance, standards may be
ineffective because unseasonal rains and increased temperature could reduce crop
quality. In the next section, I attempt to address the issues discussed to create three
related categories of environmental upgrading. By ensuring that I use a farmers’
perspective, I am able to ‘what it means’ to farmers, to provide a more concrete way
to link in the implications of firm level strategies on farmers. These categories will
then be used to compare across farmers participating in global, regional and local
production networks, as they may differ in terms of the types of environmental
upgrades they perform.
3.1.3 Categories of environmental upgrading for farmers
I begin with re-looking at the current definition of environmental upgrading within
GPN/GVC literature, and modifying it to arrive at one that fits farmer epistemologies.
The present definition of environmental upgrading by DeMarchi et al. (2013b) has two
dimensions, the transaction/ task – “process by which economic actors move towards
a production system” (pg: 66) and the outcome – “that avoids or reduces the
environmental damage from their products, processes or managerial systems “(pg:
66). This thesis, also uses a similar definition with the two dimensions, but rather than

113
focusing on just managerial systems, it creates a more generic definition, that can be
applied to farmers as well, thus defining environmental upgrading as ‘a process by
which actors modify or alter production systems and practices (the task related aspect) that
result in positive (or reduces negative) environmental outcomes (the outcome related aspect)’.
The task-related part of the definition leads to two key categories of environmental
upgrading proposed by this thesis:
Process environmental upgrading involves the reorganization of production systems or
use of superior technology that leads to greener processes or an increase in efficiency
of the production process. This is related to eco-efficiency, where farmers can
transform processes to meet new environmental or sustainability standards or be
mentored to conform to a code of conduct. Some examples may include using new
spray schedules to reduce wastages of pesticides; drip irrigation for reduction in
wasteful water usage. While in some cases it may relate to beyond cost leadership if
farmers develop and perform eco-friendly functions outside the remit of
environmental standards or lead firm codes of conduct.
Product environmental upgrading involves a move to more sophisticated,
environmentally-friendly product lines; (e.g. through using organic fertilizers; safe
pesticides), again drawing a close connection with economic product upgrading.
Clearly both environmental process and product upgrading are linked. For example,
cleaner and more energy efficient process upgrading could also lead to improved
product upgrading. Ponte and Ewert (2009) suggest that there are numerous overlaps
between different types of upgrading. Taking a normative view of each type
independently could make categories very narrow. In this thesis, therefore, I will look at
environmental product and process upgrading under one category. Ponte and Ewert (2009)
further go on to provide further justification that “terms such as ‘‘process,” ‘‘product,”
and ‘‘functional” upgrading should be used only as partial guides to arrive at a more
complex and fine-tuned picture of upgrading” (2009: 1647).

114
To achieve this ‘fine tuning’, I refer back to Chapter 2, section 2.3.2 on complexity of
transactions/tasks. As I mentioned there, farmers have intrinsic ties to their natural
environment for sustenance - be it income, livelihoods, attachment or bequest and
would perform certain environmental practices to promulgate sustenance of their
natural environment. Hence, when comprehending complexity of transactions from a
farmer reference point it is critical to consider that farmers would find some of the
tasks of low complexity because they may be better known and closer to indigenous
practices; while other tasks of high complexity, are more exogenous and have possibly
been encountered by farmers only because they sell to regional or international lead
firms (and otherwise may have stayed unknown to the farmer). I use this criterion of
low and high complexity to ‘fine tune’ environmental product and process upgrading.
Thus, I develop two variations:
- Low complexity environmental product and process upgrading (LCEPP)
- High complexity environmental product and process upgrading (HCEPP)
By doing so, I seek to develop a clearer picture of the extent and level of complexity
involved in the environmental upgrades farmers perform in each type of PN.
However, there is a third form of environmental upgrading that is usually not driven
by standards or mentoring of farmers. Instead it relates to coping with bio-physical
hazards of climate variability and shocks, usually beyond the purview of standards. I
call this ‘strategic environmental upgrading’.
3.1.4 Strategic environmental upgrading
Strategic environmental upgrading (SEU) links back to the bio-physical aspect within
territorial fluid embeddedness in Chapter 2, section 2.2.4. Territorial fluid
embeddedness involves accounting for ‘place’ based uncertain climate variability and
extremes. It suggests the need for farmers to cope by ‘adapting’ to climate stresses in
order to continue to participate in PNs and conserve their natural environment. The
process of coping and adapting may vary across farmers in different PN’s as they have
had to re-environmentalize i.e. detach from previous socio-environmental relations,

115
and re-embed in new networks and markets which compose of different socio-
environmental relations. I draw on literature from adaptation to climate change to
nuance and express the different forms of strategic environmental upgrading. I refer
to this type as ‘strategic’ because it is linked to activities that are performed to reduce or avoid
damage i.e. going beyond compliance and showing environmental cost leadership through
stewardship, be it by increasing biodiversity or performing functions that promote
conservation.
The definition of adaption varies with different schools of thought. Some stress the
bio-physical element, for example, emphasising “adjustments in ecological-socio-
economic systems in response to actual or expected climatic stimuli” (Smit et al., 2000:
225). Others (e.g. Pielke, 1998: 159) focuses on “adjustments in individual groups and
institutional behaviour in order to reduce society’s vulnerability to climate”. This
thesis focuses on individual level or autonomous adaption, wherein adaption is a
more reactive process i.e. it does not constitute “a conscious response to climatic
stimuli but is triggered by ecological changes in natural systems and by market or
welfare changes in human systems” (in Huq et al., 2004:31). Going back to the reserved
rationality of the farmer, they act in self-interest, and aim to conserve their
environment while also participating in GPNs or RPNs, and thus adapt privately (as
an individual, household or group) (IPCC, 2007).
However, that is not to say farmers cannot plan adaption, by taking deliberate action
to maintain a desired state (Huq et al., 2004). Farmers need to employ various
adaptation measures to cope by adjusting systems to moderate uncertain climate
impacts (Laderach et al., 2011; Smit and Wandel, 2006). Adaption can be of various
types, as shown in table 3.1. For instance, they can be performed in anticipation of a
hazard (IPCC, 2001) or performed concurrently with the hazard (e.g. during or after
unseasonal rains or sudden changes in temperatures) (IPCC, 2001, 2007). Furthermore,
they can be incremental in nature such as during times of water shortage growing
drought resistant crops, while a steeper degree of adjustment would be to move away
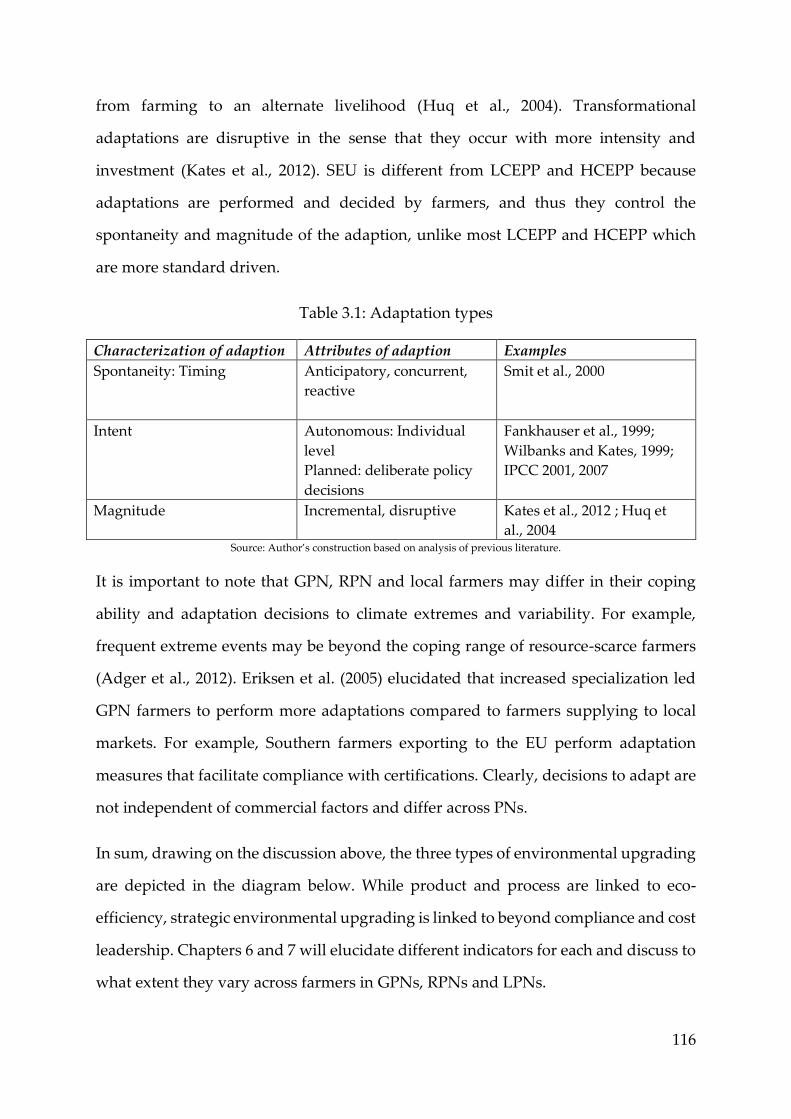
116
from farming to an alternate livelihood (Huq et al., 2004). Transformational
adaptations are disruptive in the sense that they occur with more intensity and
investment (Kates et al., 2012). SEU is different from LCEPP and HCEPP because
adaptations are performed and decided by farmers, and thus they control the
spontaneity and magnitude of the adaption, unlike most LCEPP and HCEPP which
are more standard driven.
Table 3.1: Adaptation types
Characterization of adaption Attributes of adaption Examples
Spontaneity: Timing Anticipatory, concurrent,
reactive
Smit et al., 2000
Intent Autonomous: Individual
level
Planned: deliberate policy
decisions
Fankhauser et al., 1999;
Wilbanks and Kates, 1999;
IPCC 2001, 2007
Magnitude Incremental, disruptive Kates et al., 2012 ; Huq et
al., 2004 Source: Author’s construction based on analysis of previous literature.
It is important to note that GPN, RPN and local farmers may differ in their coping
ability and adaptation decisions to climate extremes and variability. For example,
frequent extreme events may be beyond the coping range of resource-scarce farmers
(Adger et al., 2012). Eriksen et al. (2005) elucidated that increased specialization led
GPN farmers to perform more adaptations compared to farmers supplying to local
markets. For example, Southern farmers exporting to the EU perform adaptation
measures that facilitate compliance with certifications. Clearly, decisions to adapt are
not independent of commercial factors and differ across PNs.
In sum, drawing on the discussion above, the three types of environmental upgrading
are depicted in the diagram below. While product and process are linked to eco-
efficiency, strategic environmental upgrading is linked to beyond compliance and cost
leadership. Chapters 6 and 7 will elucidate different indicators for each and discuss to
what extent they vary across farmers in GPNs, RPNs and LPNs.

117
Figure 3.1: Environmental upgrading types
Source: Author’s construction
This sub-section unpacked part of the definition of environmental upgrading, linked
to the tasks/transactions - the “process by which economic actors move towards a
production system”. The next sub-section unearths the latter half of the definition, i.e.
the outcome – “that result in positive (or reduces negative) environmental outcomes”
3.2 Environmental outcomes of environmental upgrading
The DeMarchi et al. (2013a) definition of environmental upgrading uses the terms
‘avoid’ or ‘reduce’ environmental damage (pp: 66) which does not necessarily
examine a range of environmental impacts or outcomes or help in measuring it.
Through the example of the furniture industry, DeMarchi et al. (2013a) discuss lead
firm and first/second tier green strategies that include GHG emission reductions,
optimizing logistics, eco product building and obtaining environmental process
certifications.
However, some of these impacts may be direct, indirect, long or short term; reversible
or irreversible (Canter, 1977). Some might aim to ‘reduce’ damage while others are

118
pre-emptive and avoid damages. Some effects are more visible for farmers, as
compared to others (Adger, 2006) and therefore there is a need to further flesh out the
different dimensions of environmental damage. Three main types of environmental
impacts are identified- direct, indirect, avoid damage (Boxall et al., 1996, Farber et al.,
2002; Garrod and Willis, 1999; Glasson et al., 2013; Worldbank, 2016). Thus, rather than
loosely using terms such as ‘avoid’ or ‘reduce’, I choose to use a more generic positive
or reduced negative environmental outcomes that encompasses a range of
environmental impacts. This, I believe, can help measuring and systematizing
understandings of environmental upgrading.
Keeping this in mind, I propose a definition of environmental upgrading as ‘a process
by which actors modify or alter production systems and practices that result in positive
(or reduces negative) environmental outcomes’. I ultimately explore whether participating
in a GPN, RPN and LPN leads to positive or negative outcomes, and to what extent
do these differ.
The positive or negative outcomes are categorized into three main types (drawing on
Boxall et al., 1996; Farber et al., 2002; Garrod and Willis, 1999; Glasson et al., 2013;
Worldbank, 2016):
1) Direct: these are observable, easier to assess and can be attributed an economic
value and measure. For example, crop yield increase, energy gains through greener
processes. These measures usually entail incremental and autonomous adaption
practices.
2) Indirect: these effects are not always observable or valued by market forces, and
may have longer term impacts that only become visible over time. For example, these
include land degradation due to poor water quality or salinization or acidification
over time and modification of sub terrain water flows due to flooding. These measures
entail incremental and autonomous adaption (See table 3.1).
119
3) Avoid damages: such effects are harder to value immediately because they include
social costs22 such as planting more trees, enhancing biodiversity or mitigating impacts
which arise from climate shocks such as flood risk or drought risk by building
protective infrastructure. As mentioned in the previous section, resource scarce
farmers struggle to mitigate because of higher costs involved (Adger et al., 2007).
These measures entail disruptive and planned adaption (See table 3.1).
This thesis identifies two main categories of positive or negative environmental
outcomes, which are indicative of ‘reducing’ and ‘avoiding’ environmental damages.
The first is improved resource efficiency and pollution management (IREPM), which relates
to conserving and reusing natural resources and hence reduces direct and indirect
environmental impacts arising due to De Marchi et al (2013b)’s eco-inefficiency of
farmers. The second is pre-emptive conservation (PC) which includes reduction in losses
of yield and assets due to performing tasks to avoid damage, arising due to
performing environmental cost leadership and beyond compliance leadership. Each
of the outcomes are explicated in Chapter 7 for the Kenyan case. This is a clear
indicator of whether performing environmental upgrades is beneficial for the farmer
or not, and to what extent it is across farmers in GPNs, RPNs compared to LPNs.
So far, this chapter has highlighted why environmental upgrading needs to be studied
differently for farmers, the three key types – LECPP, HECPP and SEU; and the main
outcomes of environmental upgrading, as IREPM and PC. However, when unpacking
what environmental upgrading ‘means’ to farmers, the trajectories come into play. For
instance, upgrading may not always be beneficial or possible and downgrading in
some cases abets achieving better outcomes. The next section elucidates the dynamic
nature of environmental upgrading, by looking at its trajectories, and also delineates
its relationship with economic and social upgrading and downgrading. These
22 what a society would be willing and able to pay for a service, WTP, or what it would be willing to
accept to forego that service, WTA. The two valuation concepts may differ substantially in practice
(Hannemann, 1991).

120
trajectories are dynamic and vary across farmers supplying to different end markets.
In Chapter 6, I unpack environmental upgrading, and its relationship to economic and
social upgrading empirically.
3.3 Why is environmental upgrading a dynamic process across farmers in
GPNs, RPNs and LPNs?
I begin by demonstrating why environmental upgrading is an inherently non-linear
process involving complex trajectories that vary across PNs and the interconnections
it has with economic and social upgrading. I then, explicate the links between re-
environmentalization, governance and environmental upgrading, by bringing
together chapter 2 and 3 to develop a causal framework which I then empirically flesh
out in Chapter 6 and 7.
Evidence suggests that insertion into GPNs leads to economic and social upgrading
and the possibility of increased value capture and entitlements. However, the
Schumpeterian notion of economic upgrading conjectures a linear nature of
upgrading, which Tokatli (2013) has criticised stating that upgrading is a non-linear
process and does not always yield better returns. Ponte and Ewert (2009: 1637) add to
this by arguing that ‘going up the value-added ladder is only one of the possible
trajectories of upgrading’ and not always beneficial, which is echoed by Coe and Hess
(2011) who point to the ‘dark side’ of coupling. Downgrading (and decoupling) can
yield positive benefits (Horner, 2014; Blazek, 2016), and should not be interpreted as
having a negative outcome because that arises due to a misuse of market power
against powerless lower tier suppliers (ibid).
Economic downgrading, for instance through abandoning certain asset specific
requirements related to complying with northern standards and employing different
managerial strategies to cater to alternate end markets, could lead to positive
trajectories over time (Gibbon and Ponte, 2005; Pickles et al., 2016). In some cases,
functional downgrading, when a producer moves down a node in the PN could also

121
prove to improve profitability (Gibbon and Ponte, 2005; Ponte and Ewert, 2009;
Riisgard et al., 2011).
Environmental downgrading involves creating negative outcomes on the natural
environment, such as reduced resource efficiency, increased levels of pollution (air,
water, soil) and lower levels of bio-diversity, causing the degradation of natural
resources (i.e. farmland, personal ecosystem services). Environmental downgrades
are clearly linked to economic and social upgrading/downgrading. For instance,
suppliers in buyer-driven chains may be relegated to the low road. That is a situation
of immersing growth where intense competition leads to a fall in the terms of trade
outweighing the gains (Bhagwati, 1958; Kaplinsky and Morris, 2001). In this situation,
social downgrading occurs, i.e. where labour conditions are worsened along with
economic downgrading (Barrientos et al., 2011). This means that the well-being of
farmers is affected in terms of working conditions and income, which in turn reduces
their ability to invest in good agricultural practices and may cause environmental
downgrading.
While it is possible for a high road strategy, where both economic and social
upgrading occur, it may or may not lead to environmental upgrading. It may depend
on the opportunity cost of performing environment upgrades vis-a-vis economic and
social. Performing higher levels of environmental upgrades may not lead to sustaining
rents without performing economic functional upgrades as well. According to
Schmitz and Knorringa (2000), some lead firms prevent lower tier suppliers from
functionally upgrading, creating a short-term monopoly. The lack of proper
mentoring, due to weak ties, low trust and inadequate face-to-face interactions
between lead firms and lower tier suppliers, could lead to performing environmental
upgrades incorrectly, which exacerbates conditions for environmental downgrading.
Downgrading develops new meanings in the context of emerging regional PNs. The
growth of Southern (and regional) end markets involves a relative shift in the

122
governance regime as new regional and Southern lead firms emerge who impose
different regional standards (Evers et al., 2014; Pickles et al., 2016). Consequentially,
growing Southern markets can provide suppliers with new markets, and even
upgrading and diversification opportunities (spurring opportunistic behaviour),
including the possibility to simultaneously serve regional buyers in RPNs along with
northern buyers in GPNs and thus strategically diversify (Bazan and Navas-Aleman,
2003; Navas-Aleman, 2011; Barrientos et al., 2016a). Strategic diversification is a
process whereby GPN suppliers spread their risk by simultaneously participating in
multiple value chains with different governance regimes (different lead buyers)
(Navas-Aleman, 2011; Barrientos et al., 2016a). For example, Navas-Aleman (2011)
demonstrates that selling into multiple chains simultaneously is common in Latin
American footwear clusters with lower levels of quasi-hierarchical governance.
Furthermore, the proliferation of RPNs could promote chain downgrading, wherein
farmers can exclude themselves completely from GPNs and make a strategic choice to
sell into RPNs instead. If farmers experienced environmental downgrading in GPNs,
it is possible because of their intrinsic link to the environment (i.e. their motivation to
conserve their environment) that they may opt to economically downgrade and insert
into RPNs instead. This implies that the process of environmental upgrading varies
across farmers in GPNs, RPNs and that it overlaps with economic and social
upgrading.
But it is tough to explicitly discuss if economic or environmental upgrading lead or
follow each other. Rather, they appear complementary and when substituted, long-
term environmental degradation may emerge on farms, leading to economic and
social downgrading. Through the Kenyan case study, this thesis will endeavour to
unpack the relationship between environmental, economic and social upgrading and
downgrading, and how it may differ across farmers in different production networks
in Chapter 6.
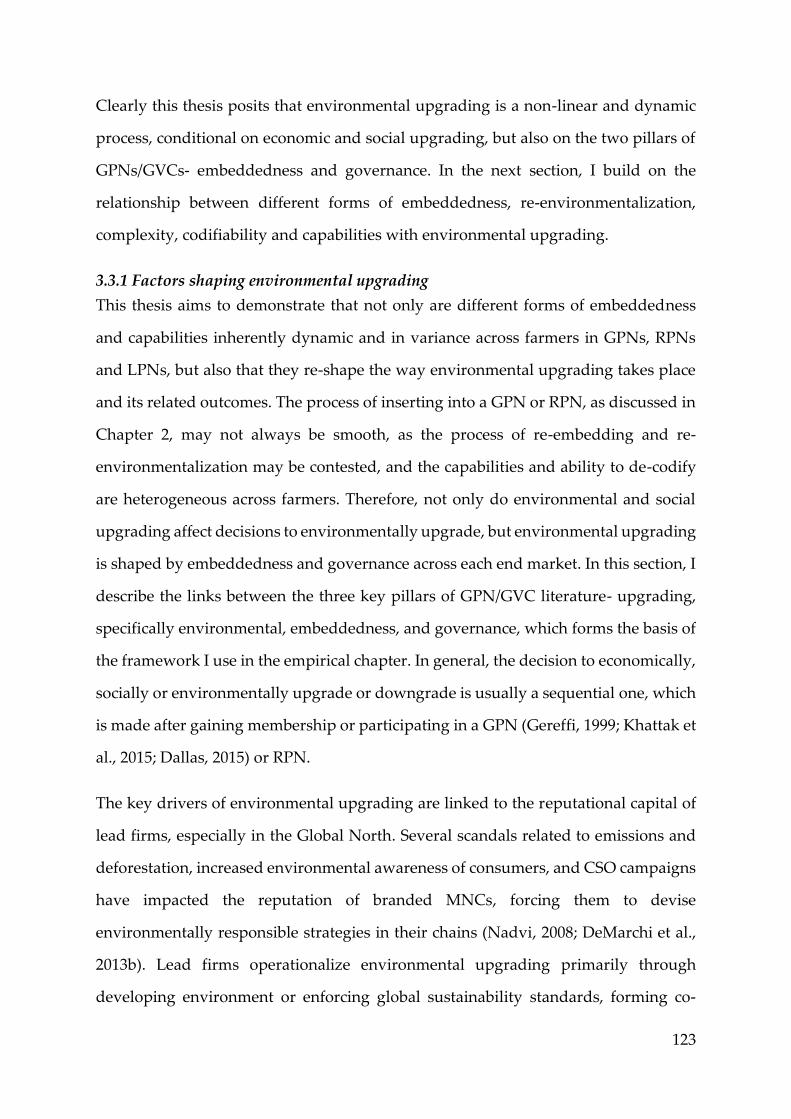
123
Clearly this thesis posits that environmental upgrading is a non-linear and dynamic
process, conditional on economic and social upgrading, but also on the two pillars of
GPNs/GVCs- embeddedness and governance. In the next section, I build on the
relationship between different forms of embeddedness, re-environmentalization,
complexity, codifiability and capabilities with environmental upgrading.
3.3.1 Factors shaping environmental upgrading
This thesis aims to demonstrate that not only are different forms of embeddedness
and capabilities inherently dynamic and in variance across farmers in GPNs, RPNs
and LPNs, but also that they re-shape the way environmental upgrading takes place
and its related outcomes. The process of inserting into a GPN or RPN, as discussed in
Chapter 2, may not always be smooth, as the process of re-embedding and re-
environmentalization may be contested, and the capabilities and ability to de-codify
are heterogeneous across farmers. Therefore, not only do environmental and social
upgrading affect decisions to environmentally upgrade, but environmental upgrading
is shaped by embeddedness and governance across each end market. In this section, I
describe the links between the three key pillars of GPN/GVC literature- upgrading,
specifically environmental, embeddedness, and governance, which forms the basis of
the framework I use in the empirical chapter. In general, the decision to economically,
socially or environmentally upgrade or downgrade is usually a sequential one, which
is made after gaining membership or participating in a GPN (Gereffi, 1999; Khattak et
al., 2015; Dallas, 2015) or RPN.
The key drivers of environmental upgrading are linked to the reputational capital of
lead firms, especially in the Global North. Several scandals related to emissions and
deforestation, increased environmental awareness of consumers, and CSO campaigns
have impacted the reputation of branded MNCs, forcing them to devise
environmentally responsible strategies in their chains (Nadvi, 2008; DeMarchi et al.,
2013b). Lead firms operationalize environmental upgrading primarily through
developing environment or enforcing global sustainability standards, forming co-
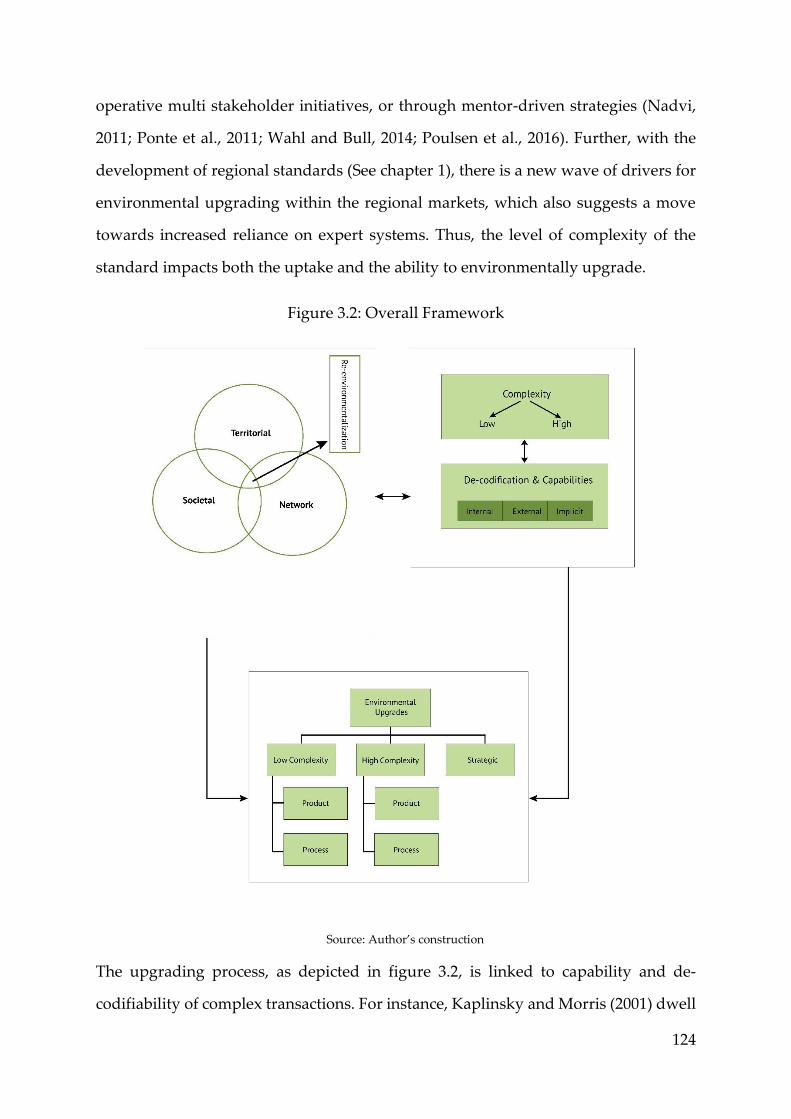
124
operative multi stakeholder initiatives, or through mentor-driven strategies (Nadvi,
2011; Ponte et al., 2011; Wahl and Bull, 2014; Poulsen et al., 2016). Further, with the
development of regional standards (See chapter 1), there is a new wave of drivers for
environmental upgrading within the regional markets, which also suggests a move
towards increased reliance on expert systems. Thus, the level of complexity of the
standard impacts both the uptake and the ability to environmentally upgrade.
Figure 3.2: Overall Framework
Source: Author’s construction
The upgrading process, as depicted in figure 3.2, is linked to capability and de-
codifiability of complex transactions. For instance, Kaplinsky and Morris (2001) dwell

125
on the importance of dynamic capabilities, stating that long term growth cannot be
achieved through creating entry barriers and quasi monopolistic conditions, but
rather depends on the development of capabilities. Kaplinsky and Wamae (2010) and
Pietrobelli and Rabelloti (2011) echo the importance of different learning mechanisms
such as direct transfers, face to face, through pressure and know-who (which I discuss
in chapter 2, section 2.3) as key to impeding or enhancing upgrading prospects. For
instance, DeMarchi et al (2013a, b) show that trust and relational proximity are key to
improving environmental performance but, as discussed in Chapter 2 section 2.2.3,
trust and relational proximity vary across farmers in GPNs, RPNs and LPNs.
Figure 3.2 also shows the process of re-environmentalization, how lead firms
territorially embed (anchor themselves), the network architecture (strength and
quality of ties), the structure or positionality of the farmers in the network, as well as
societal and institutional factors, are critical to building relational proximity, fostering
trust and forming new socio-ecological relationships thus shaping the process of
environmental upgrading. Furthermore, the ease of re-environmentalization suggests
that contestation leaves less scope for negotiation (Messner and Meyer-Stamer, 2000)
for farmers. Only re-alignment through cooperation to system interests can bring out
network stability, earned trust and enhance farmers’ ability to cope with degradation
of fixed and uncertainty of fluid aspects if being territorially embedded. Re-
environmentalization is an iterative and dynamic process, which varies across farmers
in GPNs, RPNs and LPNs and drives how each of these farmers cope with embedding
into new markets (global or regional networks and expert systems), and is a critical
determinant of environmental upgrading.
In sum, this thesis uses the key factors of re-environmentalization and governance,
along with economic and social upgrading, to explain to what extent they impact
environmental upgrading, and how they vary across farmers in different PNs. I
empirically unpack this in Chapter 6 and 7.

126
3.4 Concluding remarks
This chapter endeavoured to answer the second conceptual research sub-question of:
How to conceptualize environmental upgrading and its outcomes for farmers in global,
regional and local production networks? I did so by developing a case for why
environmental upgrading needs to be viewed differently when considering farmer
perspectives. One of the reasons to view environmental upgrading differently is
because of the reserved rational conditions under which farmers act, i.e. varied
motivations they have to both conserve their natural environment and maximize
incomes. Thus, all upgrades are not given equal weightage or ascribed positive
benefits by farmers. Because of these differences, I suggest the need to modify the
main types of environmental upgrading laid out in De Marchi et al. (2013b) to LCEPP
and HCEPP. I further advance the types of environmental upgrading by including
strategic environmental upgrading (SEU), as these tasks are performed to reduce or
avoid damage to climate variability and extremes, which are frequently outside the
remit of produce and process upgrading. I then unpack two main environmental
outcomes, of IREPM and PC, which aim at reducing or avoiding adverse
environmental impacts and enhancing environmental performance.
I contest the assumed linearity in the process of upgrading, stating that environmental
upgrading is a dynamic process that can lead or follow both economic and social
upgrading. Critically, I also suggest that environmental upgrading is shaped and
influenced by the two pillars of GPN/GVC analysis- different forms of embeddedness
and governance indicators. I aim to demonstrate that ease of re-environmentalization
and capabilities and de-codifiability shape the trajectory of environmental upgrading
and that this trajectory varies dynamically across farmers in global, regional and local
PNs. This is because farmers across each PN re-environmentalize differently, have
heterogeneous levels of capabilities and absorptive capacities and thus would chose
to environmentally upgrade through different trajectories. I unpack the empirics in
Chapter 6 and 7.

127
4. Research strategy: Context, production network mapping,
methodology and methods
4.1 Introduction
To unpack the three-fold knowledge gap of a). Integrating the environment into
PN/VC analysis; b). Farmer perspectives; and c). Studying across global, regional and
local PNs; I aim to develop a multi-level research strategy. This will enable answering
the key research question of: What are the dynamics of environmental upgrading,
embeddedness and governance for farmers in global, regional and local production networks?
This multi-level research strategy first maps each Kenyan horticulture production
network, by recentering it in order to consider the farmer as a point of entry into the
network, thereby providing farmers agency in the mapping process. This helps
address knowledge gap (b) and (c) addressed above (gap (a) is theoretically addressed
in Chapter 2 and 3). The results from mapping are then used in developing a mix-
method approach to primary data collection and analysis. The benefits of using both
quantitative and qualitative modes of inquiry, aid in converging findings by
triangulation, thereby providing a more comprehensive and robust account of the
results.
A key aspect of performing a successful mixed-methods approach is developing a
systematic sampling procedure when there is a dearth of data availability. In the case
of Kenya since there is no comprehensive list with data on farmers selling into global,
regional or local production networks, this thesis contributes to the methodology of
mapping in PNs and VCs by developing a sampling procedure that is representative.
By doing so, I address an important critique of VC/PN literature related to the
aggregation of findings across scales. For instance, Bair and Peters (2006) state that
caution needs to be adhered to when attempting to generalize findings across scale,
thus questioning if understanding firm level results is enough to generalize regional
or national level results (Khattak et al., 2015). Developing a grassroots level sampling

128
method enables improving robustness of results when scaled from micro to regional
or national levels.
The structure of this chapter is as follows. I begin discussing the rationale for crop
selection and map the global, regional and local production networks. This mapping
process helps provide the research context and elicit key actors who will be primary
respondents in the thesis. The next section expounds the mixed method approach,
before explaining the three phases of data collection. Each phase is described in detail
including various qualitative modes of inquiry (semi-structured interviews, focus
group discussions and participant observations), followed by quantitative collection
through survey design and dissemination and explain the sampling method used.
Section 4.6, then discusses the main limitations I experience during data collection,
whilst section 4.7 delves into the qualitative and quantitative data analysis techniques
used by each research sub-question. Finally, the last section, describes various ethical
considerations that I considered through the data collection and writing process.
4.2 Crop selection
As I discuss in Chapter 1, Kenya is the second largest exporter of fresh fruits and
vegetables (FFV) from Sub-Saharan Africa. FFV is one of the country’s foremost
foreign exchange earners (HCDA, 2012), having contributed 33% of agricultural GDP
in 2013 (World Bank, 2016) and having grown at a compound rate of 10-12% per
annum from 2003-2013 (ITC, 2014).
It is estimated that 10% of FFV production is exported, but it contributes to over 80%
of total FFV revenues (Krishnan, 2017) and is thus a critical income stream for the
country. The key vegetables exported include green beans (60% of total vegetable
exports), followed by snow peas, garden peas and snap peas, that are about 15% of
the vegetable exports. The rate of increase in snow and garden peas is at par with
green beans (HCDA, 2016). In terms of fresh fruit, avocados and mangoes constitute
almost 90% of all Kenyan fruit exports (ITC, 2014). Besides this, snow peas (SP),
garden peas (GP), avocados and mangoes are also important high value sale crops

129
even in regional supermarkets (Krishnan, 2017). The thesis will thus focus on snow
peas, garden peas, avocados and mangoes because of their growing significance in the
Kenyan context.
Table 4.1 and table 4.2, below highlights the increasing importance of the selected
crops. There appears to be a shift in the geographies of sale of SP, GP, mangos and
avocados from Northern markets, increasingly to regional and local markets. For
instance, in 2005, 99% of the volume of SP was sold into GPNs, while the value stood
at 91% by 2013. Almost 50% of the production of mangoes and avocados, which were
sold to Northern markets by 2013, almost 15% more than the figures in 2005.
Interestingly for non-indigenous crops like SP, the regional market share has grown
from 1% to 4% between 2005-2013, showing a change in the preferences of consumers
within Kenya.

130
Table 4.1: Characteristics of crops selected in 2005
2005 Variables Mango Avocado Snow peas Garden peas
Crop type Tree Tree Short term Short term
Production Total crop production (000MT) 254.41 100.27 12.58 34.60
End markets: Northern Total crop production value (Million KES) 3125.05 1504.15 418.5 1638.66
% of crop exported (by volume) 39% 44% 99% 39%
% of crop exported (by value) 45% 50% 99% 51%
End markets: Local/traditional % of crop locally consumed (by volume) 60.90% 55.90% 0% 60.80%
End markets: Regional supermarkets % consumed through regional markets
(by volume)
0.10% 0.10% 1% 0.20%
Source: Author’s compilation from HCD reports

131
Table 4.2: Characteristics of crops selected in 2013
2013 Variables Mango Avocado Snow peas Garden peas
Crop type Tree Tree Short term Short term
Production Total crop production (000 MT) 582.9067 191.505 17.54934 62
End markets: Northern Total crop production value (Million KES) 6,199 3,347.969 829.4607 879.772662
% of crop exported (by volume) 45% 52% 91% 58%
% of crop exported (by value) 65% 65% 92% 63%
End markets: Local/traditional % of crop locally consumed (by volume) 52.20% 45.50% 5% 39.40%
End markets: Regional supermarkets % consumed through regional markets
(by volume) 2.80% 2.50% 4% 2.60%
Source: Author’s compilation from HCD reports

132
In sum, the crops selected are emerging as niche FFreV in Northern as well as regional
and local markets. The selection enables performing a comparative case study across
farmers selling these crops to Northern supermarkets versus regional supermarkets
and local markets. This is one of the few studies that also compares tree crops of
avocados and mangoes to short term crops of garden peas and snow peas.
The key environmental challenges for growing snow and garden peas relate to
continuous need to apply chemicals (fertilizers and pesticides) that change soil
chemistry and reduce formation of organic matter (Olesen and Bindi, 2002). This
escalates the probability of soil erosion and reduce percolation of water that enables
maintaining soil moisture, which in turn reduces crop yield and quality (Kabubo-
Mariara and Karanja, 2007). In Machakos county, there has been considerable increase
in ground water salinity, due to evaporation causing a high concentration of salts, this
has reduced the quality of the soil and thus the growth of mango and avocado trees.
While some of the environmental challenges are exogenous, in the sense they are
linked to bio-physical elements of climate variability and extremes, that compound
the effects of natural resource degradation. For instance, the Kenyan Agriculture and
Livestock Organization (KARLO) 2015 cropping report suggests that pest and disease
attacks have trebled since 2005, due to consistent warming in the regions of Murang’a
and Meru, which are important regions of production of all the four crops, this has
increased incidences of aphids, black spot and mildew. The National Environmental
Monitoring Agency report on climate baselines (2016) shows that snow peas growing
regions in Nyandarua suffer frost far more frequently than before, which wipes out
crops overnight. The uncertainty in rainfall patterns in Murang’a, has caused
significant drop in water availability, which has decreased productivity of soil, and
lead to a fall in garden peas and avocado volumes. The next section provides a
mapping of farmers selling into GPNs, RPNs and LPNs for the selected crops.

133
4. 3 Production network mapping
Value chain mapping is defined as a process to determine the input-output structure
of each node and the different stakeholders (Fredrick, 2014). Kaplinksy and Morris
(2001) delineate a generic method of mapping with two stages. The first is related to
the ‘point of entry’ and ‘focal point’ of the research, whilst the second depends on the
‘issue’ or ‘objective’ under investigation that enables attributing values to the variables
and links that are being studied.
Identifying the point of entry into a value chain has serious implications for
understandings of environmental upgrading for farmers. Much of GVC/GPN
research, especially in relation to upgrading or value capture, has begun with a top-
down approach by focusing on the lead firm. The point of entry enables identifying
dyadic ties or links of the focal actor selected with other actors in the network and,
therefore, determines the ‘perspective’ with which the VC/PN is framed and helps
sculpt the implications of upgrading (Murphy, 2012). By making farmers the entry
point of my research, I suggest an epistemological shift. This helps create a refined
model of agency, one that can better help us understand the local dynamics Murphy
and Schindler (2011:67). Thus, by re-centring the VC/PN so that the ‘entry point’ is
farmers, this thesis can map dyadic and second order ties and develop a farmer
perspective to frame upgrading. In the next sub-section, I map the ties of farmers with
vertical and horizontal actors in the GPN, RPN and LPN.
The second aspect of mapping, as explained by Kaplinsky and Morris (2000), is linked
to the main objectives of the study i.e. ‘to put numbers and values to the variables
under investigation’ (pp: 53). This warrants collecting data through a specific lens, so
that appropriate implications can be drawn. Therefore, a critical requirement to collect
data through a specific lens requires understanding what ‘representativeness’ would
mean in this context. In an agro-PN/VC context, the exchange of fresh commodities
through global, regional or local networks forms the basis of farmer participation in a
specific type of network. So, representativeness of a production network is

134
determined by the volume of the flow of commodities (rather than the number of
farmers that participate in a chain23). Furthermore, since this thesis seeks to perform a
comparative case study it will use the volume of commodities sold as a means to value
the input-output dyadic links in the production network. Based on the volume of
production, I develop a sampling methodology, which I discuss in section 4.6.2
In my study, mapping is a critical tool to identify the links between farmers and
different actors in their respective networks. But before I start explicating the mapping
process, I define what I mean by a GPN, RPN and LPN farmer.
4.3.1 Defining a GPN, RPN and LPN farmer
I begin by first defining how I define a GPN, RPN and LPN farmer, and then map the
linkages in each PN. I differentiate each type of farmer by the volume of commodity
they sell into specific end markets. This thesis differentiates each type of farmer by the
volume of commodity they sell into specific end markets. Table 4.3 below explains
that a GPN farmer sells over 55% of his/her produce into a Northern market (directly
to the lead firm/ Kenyan export company or specific intermediaries) and less than 45%
to regional market or local market or to other intermediaries. So, a GPN farmer
primarily participates in a GPN. Similarly, RPN farmers sell over 55% of their produce
to Kenyan supermarkets (or registered brokers who in turn sell to the same
supermarkets) and the remaining into any other markets and to other intermediates,
thus primarily participating in an RPN. LPN farmers sell over 55% of their produce to
local kiosks, wholesale markets, street vendors and traditional wet markets.
23 For instance, it is possible that 70% of all farmers in a chain are small-scale farmers but supply 35%
of overall volumes of product. Thus, the 70% of farmers would not be representative of the value
chain or network.
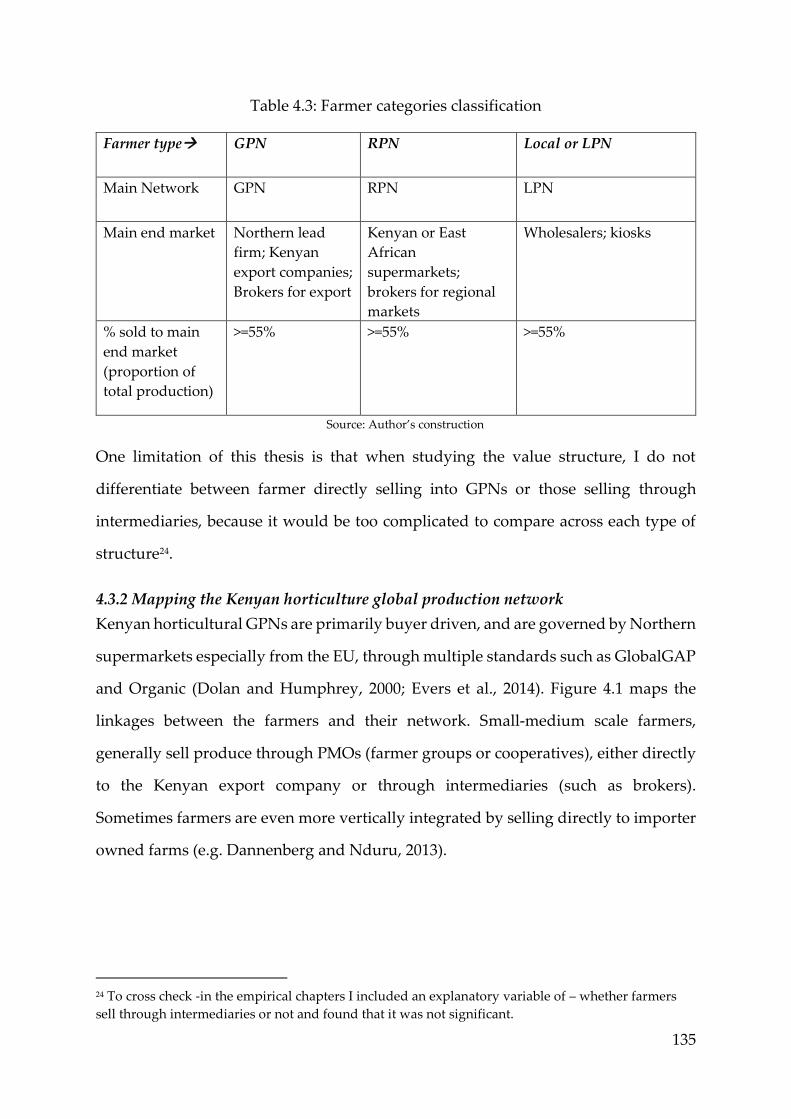
135
Table 4.3: Farmer categories classification
Farmer type GPN RPN Local or LPN
Main Network GPN RPN LPN
Main end market Northern lead
firm; Kenyan
export companies;
Brokers for export
Kenyan or East
African
supermarkets;
brokers for regional
markets
Wholesalers; kiosks
% sold to main
end market
(proportion of
total production)
>=55% >=55% >=55%
Source: Author’s construction
One limitation of this thesis is that when studying the value structure, I do not
differentiate between farmer directly selling into GPNs or those selling through
intermediaries, because it would be too complicated to compare across each type of
structure24.
4.3.2 Mapping the Kenyan horticulture global production network
Kenyan horticultural GPNs are primarily buyer driven, and are governed by Northern
supermarkets especially from the EU, through multiple standards such as GlobalGAP
and Organic (Dolan and Humphrey, 2000; Evers et al., 2014). Figure 4.1 maps the
linkages between the farmers and their network. Small-medium scale farmers,
generally sell produce through PMOs (farmer groups or cooperatives), either directly
to the Kenyan export company or through intermediaries (such as brokers).
Sometimes farmers are even more vertically integrated by selling directly to importer
owned farms (e.g. Dannenberg and Nduru, 2013).
24 To cross check -in the empirical chapters I included an explanatory variable of – whether farmers
sell through intermediaries or not and found that it was not significant.

136
Figure 4.1: Simplified GPN farmer product flow
Source: Author’s construction
The post production ‘sorting’ and grading produce ultimately determines if it ‘makes
the grade’ (i.e. complies with international private and public standards) to be sold in
GPNs. Sorting occurs before grading and is usually performed by trained PMOs or
brokers or the lead firm. There are commonly 3 grades. Grade 1 is compliant with
international standards and is procured by Kenyan exporter companies or purchased
by registered brokers (Okello et al., 2007; Dannenberg and Nduru, 2013; Krishnan,
2017). GPN farmers gain support from a host of vertical actors (Kenyan export firms
and registered brokers, as depicted with dotted lines in Figure 4.1) as well as to a lesser
extent through horizontal stakeholders (NGOs and business associations).
Furthermore, the HCD, in order to improve traceability of products and comply with
international private standards, requires Kenyan exporting firms to be vetted by
providing details of each farmer from whom they procure commodities (HCD, 2016).

137
By performing mapping, I identify three key stakeholders- county and national
governments, as important supporting actors, and Kenyan export firms, as key
buyers. I approached these key actors to interview (Appendix 1) as well as to elicit
farmer level data to generate a universe of GPN farmers for the sampling (which I
discuss in the subsequent section).
4.3.4 Mapping the Kenyan horticulture Regional production network
Regional supermarkets in Kenya have grown from an insignificant niche market in
the 1990s (Neven and Reardon, 2004) to 34% of urban food retail in 2014 (Euromonitor,
2015)25. The number of supermarket outlets in Kenya has followed an upward trend,
growing from approximately 60 in 2007 to 192 by 2014 (author calculations), an
increase of 200% suggesting intense domestic inter-chain competition (Reardon and
Timmer, 2007).
In order to gain a comparative advantage over local markets, regional supermarkets
are increasingly developing regional standards, the most common one followed is the
HCD code of conduct (See Chapter 1, section 1.2 for further details on the growth of
the regional market).
In terms of the product flow shown in figure 4.2, RPN farmers sell produce through
specialized agents26, who in turn sell it to regional supermarkets, while some farmers
directly cart their produce to the regional supermarket (Reardon et al., 2003; Krishnan,
2017). Supermarkets also procure a small percentage of SP, GP, mangoes and
avocados from local FFV from wet markets and wholesalers, while some are procured
from exporters. Thus, regional supermarkets, through varying ranges of private
standards, identify grade 1 produce that it is to be sold on their shelves (Krishnan,
2017). For instance, while Nakumatt has a centralized system of grading through Fresh
25 Country level results are about 10% of national grocery sales in 2014 (Planet Retail, 2014) 26 Specialized agents are those who are vetted and registered with the HCD and sell specifically to
certain regional supermarkets.

138
N Juici, others like Chandarana perform more in-store checks by qualified shop floor
managers (ibid).
Figure 4.2: Simplified RPN farmer product flow
Source: Author’s construction
However, the HCD has started playing a bigger role in RPNs, by trying to ensure
adherence to quality. The HCD has rolled out vetting requirements, similar to those
required for export to EU markets, to Kenyan supermarkets and agents (registered
brokers) who supply to Kenyan supermarkets. This was performed as a mode to
improve traceability requirements and increase written contracts circulated to farmers
so that they can arbitrate contractual risk (Waarts and Meijerink, 2010). Furthermore,
the enhanced quality of products is used as a comparative advantage by Kenyan
supermarkets to market their produce regionally through their chains and
subsidiaries within East Africa. RPN farmers were also provided support services (e.g.
trainings) from the sub-county, county governments and community members (e.g.

139
Rao and Qaim, 2011; Krishnan, 2017) as highlighted by the dotted lines. Through
mapping the RPN, I identified three key stakeholders from whom to elicit both
interview and farm level data to generate a universe of RPN farmers: national
governments, regional supermarkets and community members.
The growth of regional markets also provides an alternative opportunity to diversify
markets, reducing dependence on export markets (Evers et al., 2014). Various research
(e.g. Hernandez et al., 2007; Rao and Qaim, 2011; Krishnan, 2017) find that RPN
farmers earn considerably more than farmers selling into wet markets. While this is a
positive development for farmers, the burgeoning demand of adhering to regional
standards, may cause marginalization and exclusion from selling into RPNs, creating
parallels with what is happening in GPNs (Pickles et al., 2016; Krishnan, 2017).
4.3.5 Mapping the Kenyan horticulture local production network
In LPNs, farmers can either sell into local wholesale markets, kiosks or wet markets
directly or through brokers (Okello et al., 2007; Rao and Qaim, 2011), which are
depicted in the black lines in the volume flow illustration in figure 4.3.
Figure 4.3: Simplified local farmer product flow
Source: Author’s construction
140
Krishnan (2017) finds that wholesale markets in Kenya are slowly evolving into more
structured regulated markets that are controlled by municipal and local state agencies.
In some cases, farmers form a primary marketing organizations (PMO) sell either to
wholesalers/ kiosks or intermediaries. Almost no private standards exist, with quality
judged based on visual appearance and experience of the buyer (Ouma, 2010) and
there is no requirement for traceability. Most of the support received by local farmers,
as depicted by the dotted line in figure 4.3, emanates from community members, while
some training is disseminated via extension officers (sub-county and area officers),
NGOs and business associations.
The mapping process identifies the main stakeholders in LPNs (community members,
wholesalers, sub-county and area officers) to be interviewed, who possess information
or written records of the farmers. Section 4.5 describes how I use this information to
further develop a universe of local farmers for systematic and survey of PNs/VCs, and
for semi-structured interviews and focus group discussions.
In sum, the mapping process, provides a rich base for this thesis to begin the
investigation into the environmental pressures, upgrading processes and differences
that arise between GPN, RPN and local farmers. It elucidates the products flows, key
actors involved and the main governance instruments, which are used as key starting
points for collecting primary data.
4.4 Research methodology
The main research question is: What are the dynamics of environmental upgrading,
embeddedness and governance for farmers in global, regional and local production networks?
The first two sub-questions are more conceptual, while the last three are empirical.
Each of the empirically driven research sub-questions are answered using a mixed
method approach, combining quantitative and qualitative modes of inquiry (Creswell
and Plano-Clark, 2007). Mixed-methods serve two key purposes in this thesis. First,
concepts can be used in an integrated way i.e. qualitative data helps develop a
questionnaire for quantitative data collection. Secondly, it works as a strategy to

141
converge findings by triangulation, that is when combined can provide a more
comprehensive account of the inquiry so that the results can reinforce each other (Jick,
1979; Bryman, 2006; Creswell and Plano-Clark, 2007; Yin, 2009).
I use a comparative case study, by comparing across production networks, as my cases
are bounded by time and activity (Stake, 1995). This approach provides an in-depth
investigation of a subject, to determine the variables, and relationships between the
variables that influence the status of the subject of the study (Creswell 2009).
Comparative case studies are not only useful in answering how and why questions
(Yin, 2009), but also help control contextual factors and abet uncovering explanatory
variables (Ward, 2010). Thus, the approach is appropriate to understand how and why
horticulture farmers are embedded, governed and upgrade across different
production networks. To pursue a comparative case study using mixed methods, I
employ an ‘embedded design’. In an embedded design, Creswell (2009) delineates
utilizing ‘concurrent mixed methods’ where quantitative and qualitative forms of
inquiry are merged to derive a comprehensive analysis of the research problem. Thus,
both types of data collection occur concurrently and the information is integrated to
interpret overall results. The embedded design facilitates adding a qualitative strand
to a quantitative design (Creswell and Poth, 2017).
4.4.1 The methods applied
The various qualitative data collection modes used included documentary analysis,
semi-structured interviews, focus group discussions and participant observations.
Documentary analysis was a key method of data collection utilized through this
thesis. Each source was triangulated with multiple other documentary sources to
ensure validity of the data used. The diverse range of sources was useful in mapping
each production network (Kaplinsky and Morris, 2001; Barrientos, 2002). The research
aimed to use different types of sources cognisant of their origin and limitations.
142
Another method used was semi structured in-depth interviews. Researcher bias may
arise because interlocutors elicit only what they want to share which does not
necessarily represent actions accurately (Creswell and Poth, 2017). Thus, in order to
circumvent the shortcomings of interviews, I aimed to minimise researcher bias by
wording my questions carefully and leaving many open ended so that respondents
could direct and control the interview rather than have me prompt the conversation.
To maintain data validity, I cross referenced interview findings with data from
documentary analysis, focus groups and participant observation.
The third mode of data collection used in this thesis was focus group discussions
(FGDs). An advantage of FGDs is the opportunity to gain access to usually unspoken
group norms and processes (Bloor et al., 2001). The method’s downsides include
groups being dominated by individuals (Mikkelsen, 2005) and biases occurring due
to mis-interpretation of words and actions by both researchers and the participants of
the FGD. Thus, they are used in tandem with other methods for triangulation. The
most important use of the FGD for this study was both as an exploratory tool that fed
into my questionnaire as well as in a follow up capacity.
The fourth method used was participant observations, which helped obtaining a
holistic picture of contexts (Spradley, 2016). It abetted me to supplement and
triangulate interviews and FGDs with observations of their behaviour. I endeavoured
to assume a non-interfering passive position as active involvement of an outsider may
skew observation results. I tried to ensure that the respondents felt at ease so that there
was sufficient levels of trust established that enabled me to take an outsider, non-
interfering approach to participant observation. However, despite my best efforts, it
is possible that my presence could influence the outcome, to varying degrees. The next
sub-section highlights the data collection research strategy which includes the phases
of qualitative and quantitative data collection and the sampling strategy employed.
143
4.5 Data collection
The data collection timeline was divided into three phases. The first phase was
between October 2014-January 2015, the second between February 2015-April 2015,
and the third follow up phase between April 2016-May 2016. The first phase included
qualitative data collection, which fed into the survey design and development. The
second phase related to piloting and disbursing the survey, and performing internal
data validation. Finally, the third phase involved follow up qualitative data collection.
The sub-sections below discuss the three main phases of data collection.
4.5.1 Phase 1: Qualitative data collection (October 2014-January 2015)
Documentary analysis
Documentary analysis was a relevant factor for all research sub-questions. These
sources included journal articles, reports on sustainability by supra-national
organizations, NGOs and educational institutions, press releases, media publications,
printed interviews, and national government publications available online.
Additionally, hard copy data was collected from the Kenyan National Archives, the
Kenyan National Bureau of Statistics and the National Environmental Monitoring
Authority of Kenya. Documentary analysis was used a way to gain a secondary
insight into farmers in Kenya and the institutional environment, production network
dynamics and environmental issues that prevailed.
Semi-structured interviews
The semi-structured, in-depth interviews entailed asking a variety of actors’ questions
related to how they are embedded in networks, the difficulties and contestations they
face, the key environmental pressures, their capabilities, and environmental
upgrading opportunities. The selection of respondents arose through mapping the
network ties for the different types of farmers (GPN, RPN and local), aiming to capture
all the actors that were linked to them. A total of 102 in-depth interviews (including
repeats) were conducted, ranging in length from 5 to 45 minutes. The vast majority,
96, were conducted during Phase 1. Table 4.4 shows a summary of my respondents

144
categorized by actor type, while Appendix 1 houses an exhaustive list of all
respondents.
Table 4.4: breakdown of respondents by actor type
Stakeholder type Stakeholder Phase 1
Farmers Farmer: GPN 14
Farmer: Regional 9
Farmer: local 14
Horizontal
stakeholders
National Government 4
County government 8
Area officers 4
Business association 2
Donors 7
Educational Institution 4
Government autonomous
organizations
6
NGOs 3
Vertical
stakeholders
Agro-vets/Dealers 3
Broker 3
Regional supermarket 10
Kenyan export firms 3
Audit firm
Northern retailer 2 Source: Author’s construction
I adapted my interview strategy by interview mode, i.e. direct or electronic
communication, and by stakeholder type. Of the 102 interviews conducted, 98 were in
person and 4 via skype. In-person interviews provided better interactions with
stakeholders as they appreciated someone coming from far away to hear their
perspective. However, some stakeholders were not able to meet in person due to work
commitments and an electronic medium was used in this case. I adapted my style with
respondents who were less literate, and in some cases, asked my research assistants
to aid in conducting the interview (details the training provided to research assistants
are mentioned later in this section).
I contacted respondents 1-3 weeks in advance by telephone or email to set up the
interview and emailed them briefs of my research. Before conducting the interview

145
(on the day), I began by explaining the goals and context of my study (similar to the
brief previously sent to them), and thereafter used open-ended questions to retain
flexibility. All respondents were given forms that enquired as to whether they
preferred to stay anonymous or not. Respondents were also given an option to refuse
participating in the interview before, or even during, the interview.
As advised by my supervisors and fellow PhD students, I refrained from utilising a
tape recorder as it made interviewees uncomfortable. Instead, I took notes on a note
pad and entered my notes into my computer immediately after the interview. This
helped with the flow of the conversation. I was able to conduct 85% of the interviews
in English, even with farmers, as many were fluent in the language.
Appendix 1 provides an exhaustive list of farmers, vertical and horizonal actors
interviewed. I list which type of actor they are, their organizations and affiliations,
date and place of interview. The first column in the list, is a code, which I use to
reference each respondent in my empirical chapters. The coding begins numerically,
as in #1, #2 etc., which signifies the interview number which is derived from the
chronology in which the respondents were interviewed. This is followed by the
respondent which is GOV for national government, CGOV for county government,
RS for regional supermarket etc. Table 4.5, column 1 and 2 lists the respondents and
their related codes. Finally, in column 3, both the number and the respondent codes
are put together to get the overall coding reference used in this thesis.
Table 4.5: Example of coding of respondents
Respondent type Respondent code Overall Coding reference used
(example)
GPN farmers KGPN #1KGPN
RPN farmers KRPN #1KRPN
LPN farmers KLPN #1KLPN
National government GOV #1GOV
County government CGOV #1CGOV
Area officer AO #1AO
Business association BA #1BA

146
Donor DONOR #1DONOR
Educational institute EDU #1EDU
Other organization
(NEMA/ PCPB)
ORG #1ORG
KePHIS KEPHIS #1KEPHIS
NGOs NGO #1NGO
Agrovet AGROVET #1AGROVET
Broker BROKER #1BROKER
Regional supermarket RS #1RS
Kenyan export firm KEF #1KEF
Audit company AUDIT #1AUDIT
Northern retailer GS #1GS Source: Author’s construction
Focus group discussions
Focus-group discussions (FGDs) were conducted in particular to help address the
third and fourth research sub-questions linked to how farmers environmentally
embed, their capabilities and how they perform and are impacted by environmental
upgrading/ downgrading (Appendix 2 has a list of FGDs performed- these are codded
as #kf in this thesis). I conducted 4 focus group discussions with farmers with an
average of between 5-7 participants in phase 1. Each group consisted of GPN farmers,
RPN farmers and local farmers. Some of these farmers were classified as downgraded
farmers (if they stopped participating in a GPN and began participating in a RPN or
LPN). Each focus group was conducted in a different location so that it represented
all the four counties selected in the thesis.
I asked farmers 3-4 weeks in advance as to whether they would like to participate in
a FGD, giving them an opportunity to ask questions relating to the process and an
option to drop out if their concerns were not addressed adequately. All groups
received a standard information sheet in advance, with the objectives of the research,
the goal of the discussion and the modalities of consent verbalised at the outset of the
sessions. Three research assistants from the University of Nairobi and one from
Egreton University, who I had trained with relation to my research, were present.
147
These students spoke three local languages (Swahili, Kamba, Mureuvian) and
therefore helped conduct the FGD.
The questions were divided into three exercises. The first exercise asked farmers about
changes in their network and communities since participation in production
networks. The second exercise asked participants to discuss the support services they
received and issues they had with performing upgrades. The third exercise asked
farmers to discuss the implications and outcomes they experienced, especially linked
to the environment, since participating in the production network. These results were
instrumental in developing the questionnaire.
Participant observations
I would observe behaviours of farmers during various farmer group meetings, some
conducted in churches on Sundays, while others were held in the office of village
leaders. In these meetings, farmers would frequently state several issues they faced
when supplying into GPNs, RPNs and LPNs. I attended approximately four meetings
of this nature. These observations enabled me to gain insight into aspects of power
and embeddedness crucial to my thesis.
4.5.2 Phase 2: Survey data collection: Sampling in production networks
The second research phase (between Jan 2015-April 2015) consisted of developing the
survey, which included a rigorous sampling process followed by piloting and
disbursement. In this section, I begin by explaining the systematic sampling process
this thesis followed to ensure that the sample was close to representative. The
sampling procedure has internal validity and increases precision of the results. Such
a sampling process has not, to my knowledge, been performed in VC/PN related
studies when accounting for farmers. This may be because, especially in a developing
county context, PN based datasets do not exist. Published studies rely on survey
instruments, such as McCulloch and Ota (2002), Hernandez et al. (2007), Swinnen and
Marteans (2007), Rao and Qaim (2011, 2013). Currently, only a few small to medium-

148
size datasets exist for GPN farmers in Kenya (e.g. Tegemeo Agricultural Monitoring
and Policy Analysis Project, Kenya Bureau of Statistics), with no database as yet for
regional or local horticultural farmers. Therefore, there was a need to create a universe
across farmers in GPNs, RPNs and LPNs growing SP, GP, avocados and mangoes.
Before explaining my own sampling process, I briefly review some of the other
sampling procedures published, and lay out some of the shortcomings of other
methods and difficulties that arise when attempting to sample in a representative
fashion. McCulloch and Ota (2002) sampled GVC farmers based on partial lists
acquired from 2 Kenyan export companies and sampled the remaining group
purposively. Rao and Qaim (2011, 2013) purposively sampled regional and local
vegetable farmers by stratifying based on locations of maximum production, and then
randomly oversampled RPN farmers from complete lists obtained from regional
supermarkets and supermarket traders. Hernandez et al (2007) performed a two-stage
stratified random sample of tomato farmers. The first level of stratification was
performed by identifying main zones of production of RPN and LPN farmers, and
then farmers were randomly sampled from the selected regions. Sampling areas were
weighted on the basis of the number of tomato producers in the different zones.
Farmers were then classified as local or supermarket farmers from the lists procured
from wholesalers and supermarkets.
Another example emanated from the work of Swinnen and Marteans (2007). They
sampled 300 French bean growing households from 15 villages in three rural
communities in Senegal. To ensure sufficient coverage in available data, they used a
stratification method to include French bean farmers. The remaining sample was
drawn from non-French bean farmers. Lists were developed to create a sampling
universe in the three rural communities. Households were randomly selected.
However, since French bean farmers are rare, they were oversampled27 and remaining
27 Oversampling is required when respondents are members of a rare sub-population (Kalton and Anderson,
1986).

149
non-French bean farmers were sampled from the same region. Deaton (1997)
delineated a procedure to correct for oversampling by attributing inverse of
probability weights, which was followed by Swinnen and Marteans (2007). They gave
inverse probability weights to French bean producers and non-producers to ensure
representativeness. The procedure followed by Swinnen and Marteans (2007) comes
closest to a systematic way of representative sampling. However, it does not take into
account multiple end markets- global, regional and local, and neither does it
systematically account for the fact that farmers may participate simultaneously in
different PNs causing issues of multiplicity. The thesis spells out a systematic and
representative sampling procedure that can be used across end markets, as well as
under conditions when data is unavailable and sufficient coverage is an issue.
Another problem with designing a GPN/GVC sampling methodology, especially one
that compares GPN versus RPN versus LPN farmers, is the difficulty in developing
an experimental set up. Experimental and quasi-experimental designs involve
studying impact of treatment with random (and non-random) assignment of subjects
to treatment conditions (Keppel, 1991). In a GVC/GPN context, this is difficult because
of the lack of a clear assignment rule. For example, if GlobalGAP/HCD code of conduct
adoption were used as an assignment rule to divide the sample of GPN/RPN farmers
from local farmers, then issues of self-selection can occur. This means that farmers are
not assigned whether to be part of a global or regional PN, rather they can choose if
they want to uptake GlobalGAP/HCD code of conduct at any point of time.
Furthermore, contamination bias exists as farmers can participate in GVCs/GPNs and
downgrade depending on external factors, making it complicated to develop a true
experiment. In such cases, it is important to advance a methodology that is flexible
enough to account for these problems, yet which enables developing a sample that is
close to representative.
150
Conventional survey sampling, such as census based methods, depend on a complete
frame28 that consists of a list of all sampling units that can be identified, which would
suggest perfect frame and coverage (Mecatti and Singh, 2014). This type of sampling
is very time consuming and expensive. When data is not readily available in a census
format, sampling frames may suffer from under-coverage or over-coverage (Singh
and Mecatti, 2011). Under-coverage occurs when a frame is not complete. Thus, to
overcome this, additional frames need to be collected to cover the target population
(Mecatti and Singh, 2014). Currently with the dearth of data relating to Kenyan
farmers in GPNs, RPNs and LPNs, there is a need to create a universe using lists for
optimum coverage across all three farmer categories growing SP, GP, avocados and
mangoes.
To create imperfect sampling frames of farmers growing SP, GP, avocados and
mangoes, data was acquired from various actors who were identified through the
mapping process. These were mainly the key vertical buyers, and horizontal actors
(county government officials and area officers). A list of key actors from whom data
was sourced, is given in table 4.6 below. As the table indicates local farmer lists were
obtained from area officers, sub-county officers as well as through snowball sampling
of local farmers. While RPN farmer lists were collated from four Kenyan supermarket
chains, area officers, HCD vetting documents and through snowballing of RPN
farmers. Finally, GPN farmer lists were compiled from HCD traceability and exporter
vetting lists, area officers and sub-county level lists. Each of these lists consisted of
information such as name of farmer, location, crops grown, percentage of area under
crop, total land size, and volume of crop sold. Location details were unclear in the list.
Therefore, the most accurate administrative unit selected was the sub-county.
Over-coverage was another issue encountered i.e. duplication (farmers being counted
more than once) because of the same farmer being listed in multiple locations (maybe
28 Source material from where a sample is drawn

151
because they migrated recently) or because they sell to multiple end markets and
therefore appear on more than one list (Mecatti and Singh, 2014). Thus, I had to adjust
for this duplication. For instance, the same GPN farmer was present in both the HCD
list as well as a sub-county list. Therefore, each farmer across each list was matched
on name, land size, volume sold (> 55% sold to a specific PN as delineated in table 4.3)
and crops grown and the overall list de-duplicated. A total of approximately 16,740
farmers were identified in all to create a universe from which GPN, RPN and local
farmers could be sampled.
Table 4.6: Multiple imperfect sampling frames
Farmer category Mode 1 Mode 2 Mode 3 Universe (no.
of farmers)
Local Area officer/ sub-
county
government lists
Snowballing:
through
community
members
10227
RPN Supermarket lists Area officer/ HCD
lists
Snowballing:
through
community
members
388
GPN HCD lists
(national
government)
Area officer/ sub-
county government
lists
6125
Source: Author’s construction
A multi-stage sampling methodology was followed. A simplified process of each stage
is depicted in figure 4.4. The first stage involves finding hotspots of farmer density i.e.
sub-counties and counties from the various lists procured, and then de-duplicating
farmers who appear more than once on these lists (creating a universe of farmers). The
second stage involves triangulating this data with production data acquired from the
HCD. The third stage is to perform stratified random sampling from each list and
ensure that each farmer sampled sells into a specific end market (and does not overlap
as it is possible for farmers to sell into more than one end market simultaneously). I
explicate each of these process in greater detail below.

152
Figure 4.4: Sampling process simplified
Source: Author’s construction
The first stage involved selecting hotspots of farmer density i.e. sub-counties and
counties where a maximum number of export, regional and local farmers for the
selected crops could be found. From the lists, four counties accounted for over 95% of
all farmers- Murang’a, Nyandarua, Meru and Machakos. The map below highlights
the four selected counties within Kenya.
•Farmer hotspots from list
•De-duplicating within lists to form universeStage 1
•Triangulating list with production data Stage 2
•Stratified random sampling
•Second level de-duplication to prevent farmer overlap across end markets
Stage 3

153
Map 1: Location of selected counties within Kenya
Source: Author’s construction
Two sub-counties within each county were selected as primary sampling units
(Murang’a: Kandara, Gatanga; Nyandaura- Kipipiri, Kinangop; Meru- Buuri,
Central/South Imenti; Machakos: Yatta/ Mwala, Kagundo) based on proportional
sampling of farmers in each PN. However, for the sake of simplicity and ease of
understanding, I present only county level results, even though the primary sampling

154
unit is the sub-county. Once the main regions were identified, a universe of farmers
from each of the four counties was selected. Map 2 shows the universe of farmers
across each category in each county and by crop type (Appendix 3, illustrates the
number of farmers in the universe- used for map2).
Map 2: Universe of farmers in each county by crop type
Source: Author’s construction
155
In the second stage, these hotspots were triangulated with data on production and
area under production, similar to Hernandez et al. (2007) and Marteans and Swinnen
(2007). This provided greater internal validation to the sampling process. Map 3 and
4 shows a 3-year moving average29 of the share of total crop area under production
and share of country production for each crop selected in 2013. The counties selected
on an average accounted for more than 50% of Kenya’s total production, except in
the case of mangoes. Makueni has the highest production of export variety mangoes.
However, due to cost constraints that county could not be visited and Machakos was
selected as the second highest producer.
29 A moving average provides more robust indicators of the production and area over time than just
single year averages. This facilitates capturing some of the volatility.

156
Map 3: Share of area under production by crop and county
Source: Author’s construction

157
Map 4: Share of production by crop and county
Source: Author’s construction
In stage 3, to assure a sufficient coverage in the data, the stratification aimed at
including sufficient GPN and RPN farmers, with the remainder of the sample drawn
from local farmers. A total of 579 farmers were sampled (from a target of 600 farmers,
21 questionnaires could not be used due to non-response30). Farmers were randomly
30 Appendix 4, has the calculation of adjusting for non-response

158
sampled (without replacement) from each of the sub-counties. Sample size was
calculated using Cronbach’s (1977) formula to obtain an adequate sample size31.
To correct for oversampling of GPN and RPN producers and draw correct inferences,
I applied a procedure described by Deaton (1997) and used sampling weights
calculated as the inverse inclusion probabilities. These inverse inclusion probabilities
were calculated at two stages. The first stage involved weighting the sampling areas
(sub-counties) by total number of farmers (so as to ensure that a proportional sample
is selected) and the second calculating a conditional probability (given a specific sub-
county) that the farmer selected is either on the export or regional or local list. The
inverse of these probabilities, will enable correcting any oversampling and allow
creating a representative sample (See Appendix 4 for a theoretical model for sampling
procedure).
However, further levels of duplication may exist. For example, a GPN farmer might
appear on a RPN farmer list because in reality farmers supply more than one end
market (Barrientos et al. 2016). Or a person from the same household may be listed as
a GPN farmer, while another member farming on the same land may be listed as a
local farmer. Thus, issues of multiplicity arise. Mecatti and Singh (2011, 2014) describe
multiplicity as a phenomenon when over-coverage occurs, causing duplication of
individuals on lists that lead to over-sampling. Figure 4.5 below depicts the possible
overlaps across farmer categories. The points of intersection in the Venn diagram
denote where multiplicity can occur.
31with standard assumptions of alpha =1.96, expected standard deviation= 0.5, variance=0.25

159
Figure 4.5: Multiplicity overlaps for farmer categories
Source: Author’s construction
There are three ways to correct for duplication arising from multiplicity overlaps. The
first is to perform de-duplication of the frames by identifying the duplicated
individuals at the design stage before the sample selection (Gonzales et al., 1996). The
second is after the sample selection, at the data collection stage, by screening out the
respondents if they had a chance of being selected in another sampling frame (Bankier,
1986). Finally, using procedures developed by Mecatti and Singh (2014), multiplicity-
adjusted weights were given, post sampling, to each individual along with the inverse
probability weights. This thesis followed Bankier (1986) by screening out farmers at
the time of sampling and does not use multiplicity weights. When interviewed, each
overlapping farmer was asked their main market of sale (C.f. table 4.3) and if they sold
more than 55% of their produce to a particular end market. They were thereafter
classified on that basis. This automatically screened out overlapping farmers. It was
possible to perform such a screening process due to the small size of the sample and
the relatively low number of overlaps. However, using Mecatti and Singh’s (2014)
multiplicity adjusted method increases precision and can be used when there are a
higher number of overlaps. Table 4.7, highlights the number of farmers selected per
county post the design weighting (by crop production and number of farmers).

160
Approximately 42% of the sample are GPN farmers, 12% regional and 45% local
farmers, in proportion to the overall population.
Table 4.7: Sample selected of farmers
Farmer
Category
Total
Number
County (farmer numbers)
Nyandarua Meru Machakos Murang'a
Local 261 98 50 52 61
RPN 72 28 21 7 16
GPN 246 88 61 37 60
Total 579 214 132 96 137
Source: Author’s construction
Map 5 reveals the sample that will be used in the thesis. It consists of farmer category
by county and location. The data suggests that SP is highly skewed in terms of GPN
farmers, as most of the produce is sold to the EU, compared to GP. Avocados and
mangoes are more equal across the three types of farmers.

161
Map 5: SP, GP, mango and avocado: Farmers sampled by county
Source: Author’s construction
4.5.3 Phase 2: Survey data collection: Design and disbursement
Phase 2 (Jan-March 2015) primarily involved developing the questionnaire, piloting it
and finally disbursing it to 600 farmers across the four selected counties, from which
579 were selected (the remaining had missing data and some outliers). The main
purpose of the survey was to answer research sub-questions linked to elucidating the
impact of environmental embeddedness, codification and capabilities on
162
environmental upgrading and its outcomes across multiple end markets. The survey
is a cross sectional study, with data collected at specific point of time.
Survey design process
The survey content was designed through a combination of qualitative methods
including documentary analysis, interviews and focus groups discussions. Rea and
Parker (2014) suggest that using multiple data sources improves the internal validity
and reliability of the research objectives, which in turn helps develop clearer
questions. Overall, interviews and focus groups conducted in phase 1 were used as
filters to incorporate key items in the questionnaire, thus acting as a screening process
to include the most important and relevant questions (Brace, 2008; Rea and Parker,
2014).
To answer the question linked to environmental upgrading, a list of upgrades were
identified first using documentary analysis for documents of various standards
(GlobalGAP, Organic, Tesco Nature standards, environmental impact assessment
documents and good agricultural practices manuals) and through interviews with
farmers and experts.
The research identified 27 environmental upgrades which are: Land related –e.g.
production propagation material and processes; water use; pest and disease control
hierarchy; chemical handling and others. The table below provides an example of
some of the upgrades under each of the bundles and the various options under each
(Appendix 5 has a full questionnaire). For instance, under water use, farmers were
asked if they used mechanised irrigation or not. If they answered yes, they were asked
whether it was drip, overhead or on the ground sprinklers. These are different product
and process environmental upgrades, which I will study in Chapter 6
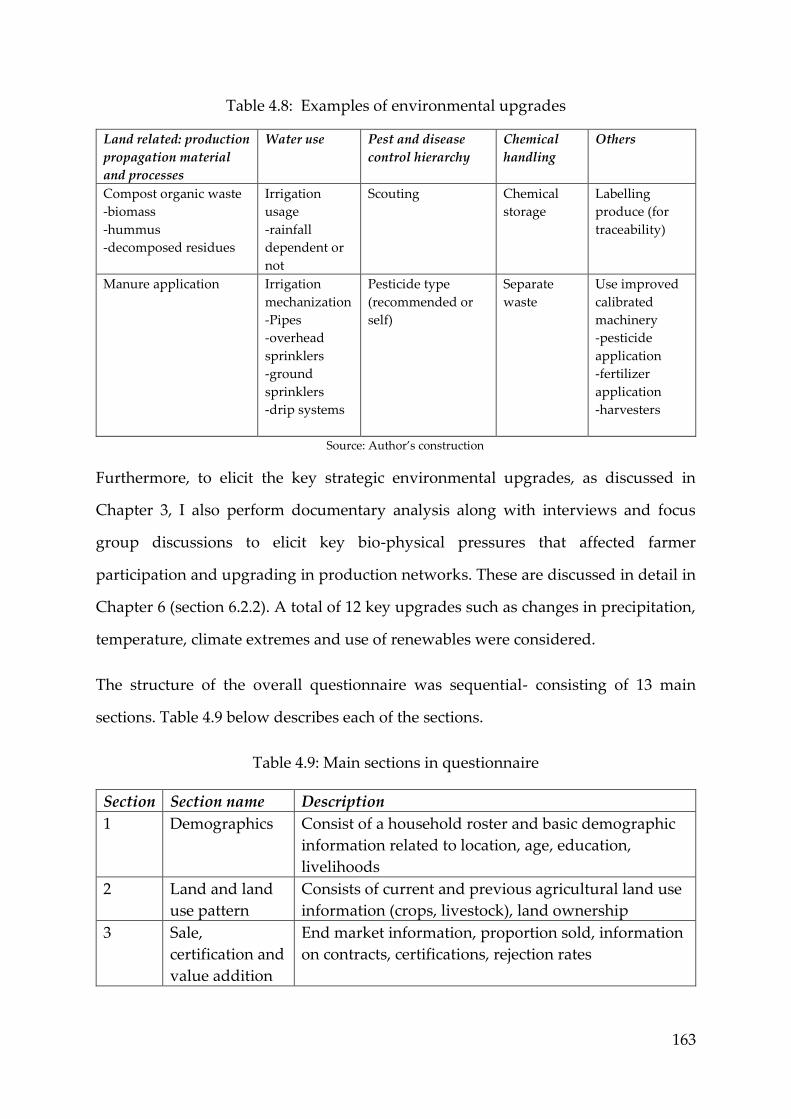
163
Table 4.8: Examples of environmental upgrades
Land related: production
propagation material
and processes
Water use Pest and disease
control hierarchy
Chemical
handling
Others
Compost organic waste
-biomass
-hummus
-decomposed residues
Irrigation
usage
-rainfall
dependent or
not
Scouting Chemical
storage
Labelling
produce (for
traceability)
Manure application
Irrigation
mechanization
-Pipes
-overhead
sprinklers
-ground
sprinklers
-drip systems
Pesticide type
(recommended or
self)
Separate
waste
Use improved
calibrated
machinery
-pesticide
application
-fertilizer
application
-harvesters
Source: Author’s construction
Furthermore, to elicit the key strategic environmental upgrades, as discussed in
Chapter 3, I also perform documentary analysis along with interviews and focus
group discussions to elicit key bio-physical pressures that affected farmer
participation and upgrading in production networks. These are discussed in detail in
Chapter 6 (section 6.2.2). A total of 12 key upgrades such as changes in precipitation,
temperature, climate extremes and use of renewables were considered.
The structure of the overall questionnaire was sequential- consisting of 13 main
sections. Table 4.9 below describes each of the sections.
Table 4.9: Main sections in questionnaire
Section Section name Description
1 Demographics Consist of a household roster and basic demographic
information related to location, age, education,
livelihoods
2 Land and land
use pattern
Consists of current and previous agricultural land use
information (crops, livestock), land ownership
3 Sale,
certification and
value addition
End market information, proportion sold, information
on contracts, certifications, rejection rates
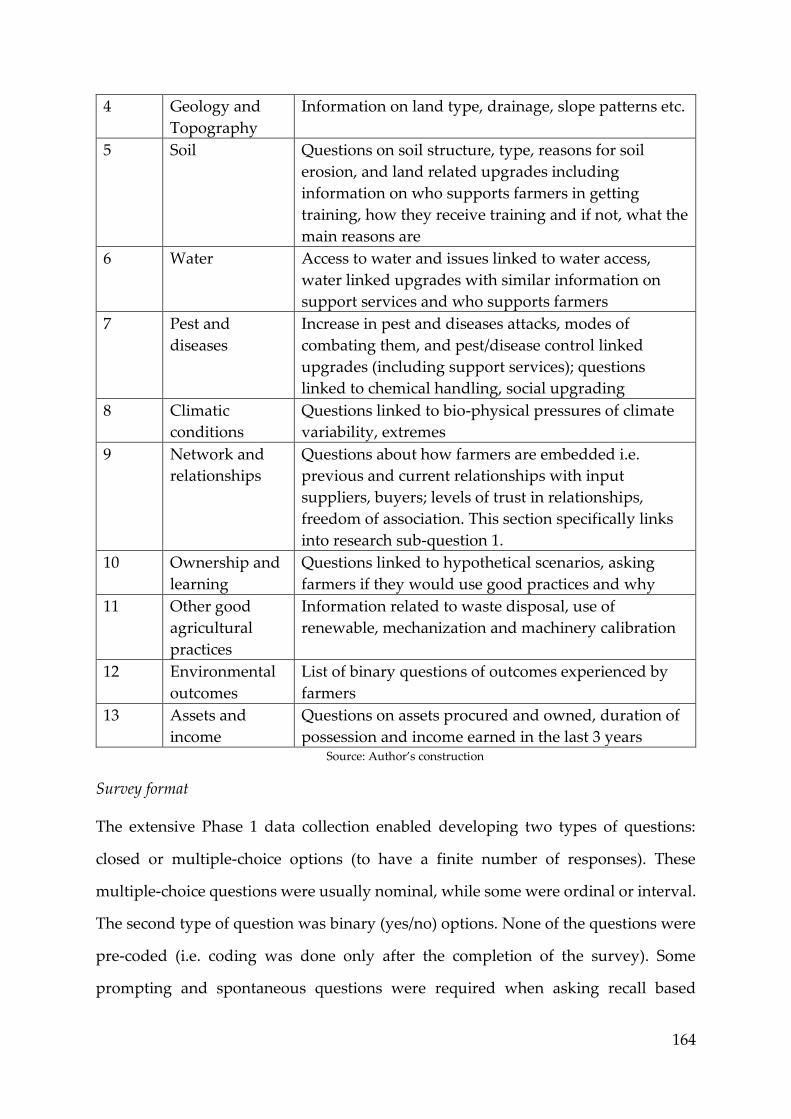
164
4 Geology and
Topography
Information on land type, drainage, slope patterns etc.
5 Soil Questions on soil structure, type, reasons for soil
erosion, and land related upgrades including
information on who supports farmers in getting
training, how they receive training and if not, what the
main reasons are
6 Water Access to water and issues linked to water access,
water linked upgrades with similar information on
support services and who supports farmers
7 Pest and
diseases
Increase in pest and diseases attacks, modes of
combating them, and pest/disease control linked
upgrades (including support services); questions
linked to chemical handling, social upgrading
8 Climatic
conditions
Questions linked to bio-physical pressures of climate
variability, extremes
9 Network and
relationships
Questions about how farmers are embedded i.e.
previous and current relationships with input
suppliers, buyers; levels of trust in relationships,
freedom of association. This section specifically links
into research sub-question 1.
10 Ownership and
learning
Questions linked to hypothetical scenarios, asking
farmers if they would use good practices and why
11 Other good
agricultural
practices
Information related to waste disposal, use of
renewable, mechanization and machinery calibration
12 Environmental
outcomes
List of binary questions of outcomes experienced by
farmers
13 Assets and
income
Questions on assets procured and owned, duration of
possession and income earned in the last 3 years Source: Author’s construction
Survey format
The extensive Phase 1 data collection enabled developing two types of questions:
closed or multiple-choice options (to have a finite number of responses). These
multiple-choice questions were usually nominal, while some were ordinal or interval.
The second type of question was binary (yes/no) options. None of the questions were
pre-coded (i.e. coding was done only after the completion of the survey). Some
prompting and spontaneous questions were required when asking recall based

165
questions, for instance on farmers previous relationships with other network actors
and so on. Brace (2008) suggested that prompting can aid in articulation and recall of
past actions, which may not immediately come to mind. Since there were a very
limited number of recall questions, this type of questioning was very rarely resorted
to.
Careful attention was paid to the wording of the questions. Four experts (three
extension officers and one researcher from Kenyan Agricultural and Livestock
Research Institute) were asked to review the questionnaire prior to piloting. Expert
opinions are a common practice in ensuring questionnaire item precision and validity
(Rea and Parker, 2014).
The survey was formatted, in a landscape style with check boxes, that enabled easy
completion by the hired interviewers. The format was sequential and repetitive in
nature. Therefore, it provided a systematic pattern that abetted in questionnaire
completion. The survey was translated into Kiswahili by agricultural officers at the
HCD, so that agricultural terms would be easily understood by the respondents.
The instrument used for the survey was specifically designed for the research
questions, thus it allows for internal validity. Creswell (2007: 141) indicates three main
types of internal validity- content (do the items measure the content they were
intended to measure?); predictive (is it possible to predict the criterion measure?) and
construct validity (do items measure hypothetical constructs or concepts?). The
research has high content, predicative and construct validity, firstly because the
instruments (and questionnaire items) created were tailored to the thesis research
objective, and second due to the use of primary qualitative data through interviews
and focus groups, feeding the documentary analysis so as to verify the importance
and significance of the content of each questionnaire item.
166
Furthermore, reliability of the data was checked in two ways. The first was internal
consistency in terms of ensuring that the responses to the questions within the
questionnaire are consistent. This was performed through a Cronbach’s alpha test for
reliability32. Secondly, through a pilot study it was ensured that the test-retest
correlations, i.e. that the respondents gave stable responses each time, was satisfied
(Fowler 1995, Brace 2008).
Survey dissemination
The dissemination team included the principal investigator (me) and four research
assistants, who were Masters students in agricultural economics from the University
of Nairobi and Egerton University (See Appendix 6: for copy of the RA contract and
confidentiality agreement). The students were recommended by lecturers at the
University of Nairobi and by the HCD. Training was provided to the research
assistants in the following areas:
• Brief of my main research topic and the expected results
• The questionnaire in detail, every question and respective multiple options
were carefully explained
• Reading materials were provided regarding the background of the research
project
• the confidentiality of disclosing results
• the ethical principles involved in interviewing respondents
Based on Fink’s (2002) four type categorization of questionnaire data collection
processes, this research uses an interview style structured record to collect
information under the categories discussed in table 4.9. Prior to interviewing the
respondent information about the research questions was verbally explained to each
farmer and only if they provided oral consent was the interview continued (See
Appendix 7: for a written version of the research topic and Appendix 8 for the
32 how closely related a set of items are as a group. It is considered to be a measure of scale reliability.

167
interviewee consent form). Farmers appeared to prefer oral over written consent, as
many preferred not to sign forms for confidentiality purposes. Therefore, farmers
were told that they could stop responding to the questionnaire at any point of time.
After completion of the interview, each farmer was presented with a certificate of
thanks for their time (See Appendix 9: for copy of farmer appreciation certificate).
The questionnaire was piloted in Kandara and Maragua constituencies in Murang’a
county to 14 local, 4 RPN and 12 GPN farmers (about 5% of the overall sample).
Piloting the questionnaire helped with changing the wording of the questions,
excluding questions that were not relevant, causing duplication of answer or sensitive
in nature (Creswell 2007, Brace 2008). Furthermore, it gave an approximate idea of the
time required to complete the questionnaire and the comfort the respondent had with
answering questions. The four research assistants hired for administering the survey
were also able to practice the process of questioning prior to the survey. There was a
period of one week to make changes to the questionnaire between the administration
of questionnaires to the selected sample33 and the pilot study. Several questions were
dropped and many simplified in order to ensure that the questionnaire would be easy
to follow and would not take more than 30 minutes.
4.5.4 Phase 3: Follow up qualitative data collection
Phase 3 took place between April-May 2016. To enhance reliability of the qualitative
data, Mays and Pope (1995) suggest getting second opinions on the interpretative
procedures. Thus, in phase 3, I followed up on several interviewees and attempted to
share the interpretation of results of my analysis with them. I conducted one FDG in
phase three to disseminate findings (Appendix 2 lists the FGDs). I also performed a
total of eight semi-structured follow up interviews with horizontal and vertical
stakeholders as shown in table 4.10 below, to disseminate and receive feedback on
results. This was yet another way to triangulate the results to ensure robustness.
33 Sampling process discussed in section 4.5.

168
Table 4.10: Phase 3 follow up interviews
Stakeholder type Stakeholder Phase 3
Horizontal
stakeholders
National
Government
2
County
government
1
Business
association
1
Donors 1
Vertical
stakeholders
Regional
supermarket
2
Audit firm 1 Source: Author’s construction
4.5.5 Research sub-questions and data collection methods used
In sum, each of the three-empirical research sub-questions use a combination of
methods which help collect robust and valid data. Table 4.11 summarizes the key data
collection modes used per research question.
Table 4.11: data collection by empirical research sub-question
Research Sub-question Data Collection modes
RQ3 - How do the environmental
dimensions of embeddedness and
governance vary across farmers
participating in global, regional and
local production networks?
Qualitative: Documentary analysis,
FDGs, Interviews, participant
observations
Quantitative: Survey (particularly
sections 1,2,3,9,13 from table 4.9)
RQ4 - Do Kenyan horticultural
farmers participating in global,
regional and local production
networks environmentally upgrade
heterogeneously and to what extent do
embeddedness, codifiability and
capabilities affect environmental
upgrading?
Qualitative : Documentary analysis,
FDGs, Interviews, participant
observations
Quantitative : Survey
RQ5 - Does environmental upgrading
lead to positive environmental
outcomes?
Qualitative: Documentary analysis,
FDGs, Interviews, participant
observations
Quantitative: Survey (particularly
section 12 from table 4.9)

169
4.6 Limitations of data collection
There were four main types of limitations encountered: researcher and respondent
bias, non-response, data access and budget constraints.
I have discussed triangulation of data through different data collection modes as a key
measure through which I attempted to reconcile researcher bias emerging due to pre-
conceived expectations or hypothesis from fieldwork by triangulating.
Respondent bias, was another key issue, especially in the survey. There were many
reasons why some questionnaires remained unanswered. For instance, respondents
did not feel comfortable answering the survey questions while some did not
understand the questions. Others, for personal reasons, refused to take part in the
survey mid-way. In some cases, the selected respondent was not home or delegated
answering the survey to another household member. To alleviate this issue, I calculate
non-response weights, which I use to adjust the sample weights (Appendix 4 for
weight explanations). In certain cases, respondent bias arose during in-depth
interviews or FGDs i.e. when they appeared to be giving incorrect or opposing
information for similar questions. To stem this, I used triangulation processes to
increase reliability and validity of the information.
Data access was an issue. Many collated databases of export firms and business
associations regarding supplier data were not made available to me. Furthermore,
census and household surveys data collected by Kenya Bureau of Statistics, IFPRI, and
value chain agricultural panel data collected by Tegemeo Agricultural Monitoring and
Policy Analysis Project (years: 1997, 2000, 2004, 2007, 2010) was also not made
available due to inhibitive costs and delayed availability. Therefore, sampling was
conducted using multiple frames. However, Mecatti and Singh (2014) statistically
proved that, when data does not exist, using multiple frames increases precision of
sampling and thus improves the quality of the results.

170
The threat of external validity for experimental research arises due to the uniqueness
of the setting and timing of data collection (Calder et al., 1982). For example, because
of the characteristic of participants in experiment and the research being time bound,
may lead to erroneous to generalize-able findings across other groups of individuals
and across time (Klink and Smith, 2001; Creswell, 2007). Such threats also affect multi-
frame survey studies, although I did perform test-rests correlation validity studies (to
check if similar responses were received by participants in the pilot and post pilot
stage). Data was only collected at a point of time and changes in contextual factors
could alter results over time. Therefore, the results are generalized only across a cross
section. Due to time and budget constraints it was not possible to collect data again
i.e. repeated measurement, or construct a panel data to study variation across time.
The questionnaire did ask certain recall questions, especially related to farmer
relationships with other actors, income, assets and conditions before participating in
their current chains/networks. Thus, I was able to create a synthetic scenario of the
past based on recall (Rea and Parker, 2014). However, non-sampling errors arose
because of recall questions (respondent misinterpretation, incorrect recall, deliberate
misinterpretation) may impact the validity and reliability of the data (ibid). As far as
possible, based on triangulation of answers with other questions and through
participant observations, I attempted to disregard questionnaires with high non-
sampling errors
4.7 Data analysis
Qualitative: NVivo software was utilized to create specific nodes, which characterise
the primary data (transcripts and notes) collated from the field, along with the
documentary analysis. A total of 55 nodes were created. Figure 4.6 provides a tree
diagram of the key nodes included.

171
Figure 4.6: Tree diagram of nodes
Source: Author’s construction
Quantitative: Survey data was coded and cleaned in Stata. To reduce chances of non-
sampling errors – (mistakes in data processing), the coded results were randomly
checked by an expert third party34, to ensure limited errors. Post coding, econometric
analysis was conducted on the data. The econometric models applied are: descriptive
statistics, including averages, t-tests and chi square tests and more developed
econometric models of principal component analysis methods were used in research
sub-question 3 and 5, double hurdle models were utilized in research sub-question 4
and iterated seemingly unrelated regressions (ISUR) was applied in research sub-
question 5. The intuition and theoretical considerations related to each model are
discussed in the empirical chapters 5, 6 and 7.
The table below illustrates the data analysis methods employed to address each
empirical research sub-question.
34 The third party was given a short-term contract (2 weeks) and signed the confidentiality agreement.
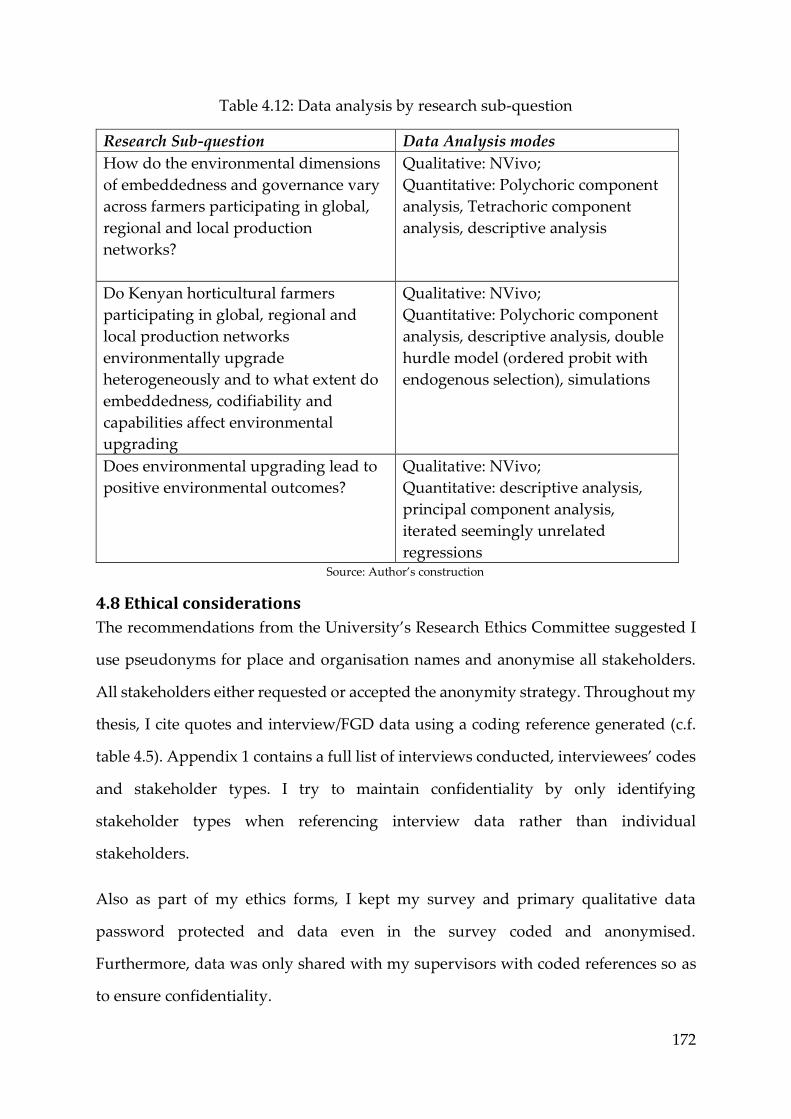
172
Table 4.12: Data analysis by research sub-question
Research Sub-question Data Analysis modes
How do the environmental dimensions
of embeddedness and governance vary
across farmers participating in global,
regional and local production
networks?
Qualitative: NVivo;
Quantitative: Polychoric component
analysis, Tetrachoric component
analysis, descriptive analysis
Do Kenyan horticultural farmers
participating in global, regional and
local production networks
environmentally upgrade
heterogeneously and to what extent do
embeddedness, codifiability and
capabilities affect environmental
upgrading
Qualitative: NVivo;
Quantitative: Polychoric component
analysis, descriptive analysis, double
hurdle model (ordered probit with
endogenous selection), simulations
Does environmental upgrading lead to
positive environmental outcomes?
Qualitative: NVivo;
Quantitative: descriptive analysis,
principal component analysis,
iterated seemingly unrelated
regressions Source: Author’s construction
4.8 Ethical considerations
The recommendations from the University’s Research Ethics Committee suggested I
use pseudonyms for place and organisation names and anonymise all stakeholders.
All stakeholders either requested or accepted the anonymity strategy. Throughout my
thesis, I cite quotes and interview/FGD data using a coding reference generated (c.f.
table 4.5). Appendix 1 contains a full list of interviews conducted, interviewees’ codes
and stakeholder types. I try to maintain confidentiality by only identifying
stakeholder types when referencing interview data rather than individual
stakeholders.
Also as part of my ethics forms, I kept my survey and primary qualitative data
password protected and data even in the survey coded and anonymised.
Furthermore, data was only shared with my supervisors with coded references so as
to ensure confidentiality.

173
Overall, this thesis is one of the first of its kind to perform a mixed-method approach
to compare across farmers in global, regional and local production networks. The
mixed-method approach enables improved triangulation and provides robust results.
Developing a robust sampling methodology also ensures proper aggregation and
results and the ability to simulate results across scales in a VC/PN context.
The next chapter is my first empirical chapter which, using both quantitative survey
data and qualitative interviews and FGDs, will explore the third research sub-question
of: How do the environmental dimensions of embeddedness and governance vary across
farmers participating in global, regional and local production networks?
174
5. Exploring environmental dimensions of embeddedness and
governance of Kenyan horticulture farmers in global, regional and
local production networks
5.1 Introduction
The increasing threat of environmental hazards, pressures from standards and the
emergence of RPNs and LPNs, has been insufficiently studied in Kenya. As I discuss
in Chapter 2, it is indeed critical to integrate the environment into PN/VC analysis,
while also considering changing end markets and farmer epistemologies. This chapter
seeks to take the first step in empirically deconstructing the different dimensions of
the environment in PNs/VCs. In this chapter, I answer the third research sub-question:
How do the environmental dimensions of embeddedness and governance vary across farmers
participating in global, regional and local production networks? The chapter primarily
draws on concepts of the ease of re-environmentalization and governance discussed
in Chapter 2, as along with empirical evidence gathered in the field by survey,
interviews and focus group discussions.
I divide this chapter into three major sections. The first is section 5.2, which delves into
explicating the different processes and mechanisms through which GPN, RPN and
LPN farmers are able to re-environmentalize. I carry out this analysis by unpacking
and quantifying societal, network embeddedness and territorial embeddedness across
diverse PNs and then illustrate how they interact with each other and shape socio-
ecological relationships farmers have with their environment. The second section, 5.3,
focuses on understanding the factors shaping governance- complexity, de-
codifiability and capabilities, from a farmer lens. In this section, I spell out and
quantify the different learning mechanisms across farmers in global, regional and local
PNs, whilst highlighting the importance of tacit knowledge. The last section briefly
explains why and how re-environmentalization and governance are related to each
other and why they form critical factors in influencing environmental upgrading. I
discuss their links with environmental upgrading in greater depth in Chapter 6.

175
5.2 Exploring re-environmentalization, network, societal and territorial
embeddedness for Kenyan farmers in global, regional and local production
networks
This section sets out to explicate the concept of re-environmentalization, which is how
I seek to integrate the environment into embeddedness in a PN/VC context. This
section starts off by elucidating how societies and relationships have evolved and been
altered when farmers embed into global, regional and local production networks. I
then proceed to unearth the changes in networks, especially whether such changes
have been smooth and cooperative or laden with struggles, contestation and distrust.
I also empirically explain and measure territorial embeddedness, including the
extensions of fixed (natural endowments) and fluid (bio-physical hazards) which I
developed in Chapter 2 (section 2.2.4). Finally, I analyse the cross links and
dependencies between the three forms of embeddedness, which lead to a smooth type
1 form of re-environmentalization or a contested type 2 form (further details on type
1 and 2 are in Chapter 2, section 2.2.5). Within each section of societal, network and
territorial embeddedness, I first discuss it in relation to GPN farmers, and then
compare them to RPN farmers followed by LPN farmers.
5.2.1 Network architecture, structure and societal embeddedness
Farmers who now participate in GPNs and RPNs have had to dis-embed i.e. detach
from indigenous social relations and localized contexts of interaction and markets, to
recast and form new social relations by re-embedding into global and regional
production networks. I explicate these processes of societal and network dis-
embedding and re-embedding in the next few paragraphs.
GPN farmers
I begin with a discussion on the experience dis-embedding has brought about by
farmers who now export to the Global North. By growing export-oriented crops,
farmers have had to change their crop varieties and grow what they call relatively
‘alien crops’ (Government Interviews: #1kcgov, #2kgov) that were not cultivated in
Kenya historically. Snow peas and new varieties of garden peas, avocados and

176
mangoes were introduced by Europeans in the late 1970s. Several horizontal actors
like National and county governments, Fresh Producers Export Association of Kenya
(FPEAK) and vertical actors such as Kenyan exporting firms began advocating the
higher remuneration potential of such crops. These actors also stressed the advantages
of long-term contracts and livelihood stability as benefits of inserting into a GPN. This
encouraged farmers to switch their current produce for these export variety crops
(Interviews: #1kgov, #2kcgov, #5kcgov, #4kao, #1kba, #1kef).
Survey data also revealed that farmers switched from growing crops for local markets
to cater to Northern supermarkets. Approximately 62% of all GPN farmers
discontinued growing staple crops of maize and potato, and indigenous vegetables
such as kale and paw-paw, to plant export variety crops. One farmer interviewed
explained:
“I used to grow different crops before and went to any broker that gave me
most money...I did not need to worry about what to grow, but since I started
selling to exporters I need to only grow snow peas, because they only want
that.... things are so different from before” (Local farmer #20kLPN)
The quote above elucidates that switching to export crops has effectively changed the
livelihood trajectories of farmers by giving them access to new markets and thus
leading to new forms of network organization. Previously most farmers had arms-
length interactions with intermediaries for sale of multiple crops in informal local
markets or for subsistence (Farmers interviews: #19kLPN, #30kLPN), while current
export-oriented farmers began producing specific volumes of crops for organized
commercial sale at pre-defined seasonal intervals, which were usually sold to specific
intermediaries or Kenyan exporters. This altered farmers’ flexible terms of trade to
more rigid ones.
The figure below illustrates the changes in the buyers. Farmers who now export used
to sell approximately 79% of their produce to brokers, while they now sell 81% of their

177
produce to exporters (directly or through export agents35) and only 16% through local
brokers.
Figure 5.1: Farmer input and buyers before and after participation in GPN
Source: Author’s construction
The key instrument lead firms use to govern the buyer-driven PN relates to
establishing expert systems such as private standards of Northern retailers and
international certifications. The most common certification followed for about 95% of
all export produce is GlobalGAP, while Organic and Northern supermarket private
standards (e.g. M&S Farm to Fork, Sainsbury –Taste the Difference, Tesco- Tesco
Nature) are adhered to by the remaining 5% (Interviews: #1kba, #1Ndonor). Farmers
who adopted GlobalGAP, Organic or private standards had to change their modality
of production, by displacing indigenous practices and incorporating standardized
requirements, which include various control points like traceability, plant protection
35 Agents: they are different from brokers, because they are registered with the HCD and, therefore,
have to comply with traceability requirements. Brokers are usually not registered with the HCD and
do not specialize in selling to particular buyers.

178
products, produce handling, pre-harvest and post-harvest procedures, that are built
into certifications (Interviews: #1kcgov, #3kcgov, #4kcgov, #3Kao). As one sourcing
officer of a Northern retailer explained:
“We do this because it makes business sense, so that incorrect practices do not
impinge on quality of the product and that we can effectively monitor the entire
production process through various control points” (Supermarket: #1krs)
Thus, clearly, lead firms view developing standardized systems as offering
‘guarantees’ and as a way to reduce risk, by minimizing local interpretations and use
of local practices.
A number of studies have found lack of adherence to standards causes exclusion
(leaving the network) or marginalization (relegation to performing/growing less
remunerative crops) (e.g. Gibbon and Ponte, 2005; Ouma, 2010; Tallontire et al., 2011;
Evers et al., 2014; Barrientos et al., 2016), I found similar results through my survey. If
farmers want to continue to participate in a GPN they need to change their growing
practices to suit standards and their end buyers, along with their input suppliers i.e.
changing their ties. Input suppliers sell seeds and chemicals that are required for
complying with international certifications. Figure 5.1 shows that farmers used to
primarily buy seeds/saplings from village leaders (37%) but, since participating in the
GPN, they began to purchase it from agro-vets36 (64%), farmer groups37 and exporters
themselves (26%). Such a shift was necessary as lead firms expected specific varieties
of crops. Monsanto Kenya and the Kenya Seed Company would generally import the
required seed and sell to agro-vets and export firms across the country for distribution
to farmers (Interviews: #2kef, #1kaudit, #2kgov, #1kGPN, #2kGPN). Although the
procurement of chemicals such as pesticides and fertilizers were, and are still,
36Agro-vets: are local sellers of agricultural products 37 Farmer groups: Farmer groups can be formal or informal, and formed by virtue of bottom-up action
via likeminded farmers coming together to form a group or top-down which are formed by exporters
179
predominantly from agro-vets, there are clear distinctions in the types of chemicals
and the quantity to be applied on standing crop.
To facilitate the change in practices and input procurement ties, there were massive
institutional changes within Kenya. One of the main reasons for this change was
because the European Union reduced the maximum allowed residue level (MRL) of
certain types of pesticides applied to FFV in 2009. Kenya violated this protocol and
was banned from selling to European markets and given until September 2014 to
adjust their practices (Interview: #2kgov, #1kKePhis). To expedite the adjustment
process, the Pesticide Control Products Board (PCPB) was given increased autonomy
to purchase particular pesticides from abroad (mostly Holland) and then to test it on
Kenyan soil to verify the authenticity and efficacy38 of the product (Interview: #1korg).
Additionally, the Kenya Plant Health Inspectorate Service (KePHIS) would perform
random checks on various plots of land, as well as test products before being packed
and shipped, for residue (Interview: #1kKePhis, #2kKePhis). They also offer other
services such as soil testing so as to decide the optimum amount of chemical
application (Interview: #4kcgov, #1Ndonor, #2kf, #2kedu).
Kenyan export companies developed specialised spray schedules for different crops,
which were given to farmers in order to prevent exceeding residue limits (Interviews:
#1kef, #2kef, #3kef, #1kagrovet, #5kgov). This led to an escalation in the cost of
production of crops, especially for small-scale farmers, with many echoing their
inability to procure the required chemicals and understand how to use spray
schedules (Farmers interview: #4kLPN, #5kLPN).
Furthermore, following certifications involved much higher costs, and investment in
lumpy assets (i.e. costly fixed assets such as buying/hiring new pesticide spray
equipment, greenhouses, new irrigation machinery, sheds for storage of chemicals
and produce) (Interviews: ##1kgov, #2kcgov, #5kcgov, #4Kao, #2Kba, #1kef, #2kef,
38 Kenya does not manufacture pesticides, but rather imports it mostly from the Netherlands or India.

180
#1kaudit), which also impinged on farmer’s ability to participate in GPNs and gain
certification (I delve deeper into the lumpy assets discussion within territorial
embeddedness). Overall, inserting into GPNs clearly altered growing practices and
the overall organization of inputs and outputs.
There were difficulties in complying with standards due to the need to conform to
international expectations of performing practices and prevented use of local
practices, which affected both dyadic social relations and the societies in which
farmers live. GPN farmers replaced village elders and leaders, who used to be held in
high regard in society not only as knowledge providers but also as arbitrators for local
disputes (Farmer interview: #3kGPN). GPN farmers (especially farmer group leaders)
began becoming more important in society and looked on as the ‘go-to’ individuals
for support, especially because they were trained in requirements related to Northern
standards (Farmer interview: #4kLPN). GPN farmers also became important sources
of information for crop production (Farmer interview: #6kLPN, #8kRPN) and were
approached to help fetch farmers a fair price (Farmer interview: #3kGPN). Drawing
from the discussion on societal embeddedness in Chapter 2, the development of GPNs
not only changed institutional arrangements, but also led to the formation of new
‘norms’ by altering ‘who’ is important within society, and ‘what matters’ to a society.
Effectively, this led to the creation of a ‘new normal’. However, achieving this new
normal is a highly contested and dynamic process, which impacts the social relations
of farmers with their societies. One GPN farmer explained:
“I feel unhappy exporting [to the EU] sometimes. Lots of changes have
happened in my life since I started selling to Europe.... some of my friends
became jealous and stopped talking to me...”( Farmer #23kGPN)
Thus, changes in village dynamics were reported and, as farmers began shifting away
from their norms and beliefs to embrace new norms for commercial reasons, it
changed the way they were socially embedded into GPNs. This alludes to the fact that
181
re-embedding is not a simple process. Moreover, it is difficult to re-cast dis-embedded
social relations into new markets, because of changes in the structure of the network,
the institutional dynamics and the reliance on expert systems.
RPN Farmers
The case for farmers selling into RPNs is quite different from GPN and local farmers
as the development of regional markets has brought with it institutional changes
which trickle down to the social relationships of farmers. The expansion of regional
supermarkets from the early 2000s has also involved a new set of regional private and
public standards and related practices, in addition to the growth in supply to global
supermarkets. FFV sales to regional supermarkets are escalating continuously, and
this has led to a new segment of farmers supplying into regional markets. Within this
segment of RPN farmers, there were two key categories. The first are new entrants,
those who previously sold into local markets, and the second are farmers who have
‘downgraded’ from selling into GPNs and now primarily sell into RPNs. As figure 5.2
highlights, about 40% used to sell to Kenyan export firms, and 12% to brokers, prior
to joining the RPN. The survey conducted found that they now sell 80% of their
produce directly to regional supermarkets (or their agents) and less than 9% through
local brokers, clearly showing a shift in end markets

182
Figure 5.2: Farmer input and buyers before and after participation in RPN
Source: Author’s construction
The key standards used by farmers are the Horticultural Crop Directorate’s (HCD)
Code of Conduct which is basically a stripped-out version of GlobalGAP, that targets
mandatory control points. Regional supermarket private standards are still quite
nascent, and many rely on in-house checking by shop floor employees, as I discussed
in Chapter 1 section 1.1.3. Farmers who comply with the HCD Code of Conduct are
usually on preferred supplier lists of these supermarkets (Interviews: #1krs, #3krs,
#5krs, #6krs). There were significant variations in adhering to the HCD Code of
Conduct. For example, interviews with farmers who downgraded from selling to
global markets revealed that they were able to comply with requirements much more
easily than the new farmer entrants. The reasons for this will be discussed in detail
later in this chapter.
Figure 5.2 also highlighted that, similar to GPN farmers, the ties with input suppliers
also changed significantly. RPN farmersshifted from sourcing seeds/saplings from
183
village leaders (35%) to agro-vets and nurseries (75%). This was seen as important
because of the change in quality standards demanded by supermarkets and middle-
income consumers (c.f: Reardon et al., 2007; Guarin and Knorringa, 2014; McEwan et
al., 2015; Krishnan, 2017- who find that the rise of middle income consumers in SSA
has propelled growth of regional supermarkets). The figure suggests that chemical,
pesticide and fertilizer usage has gone up significantly, since farmers began
participating in RPNs. They are increasingly buying chemicals from agro-vets.
However, with no specific stipulations on the types of chemicals to be used (except
ones that are illegal) in RPNs, farmers have more freedom to choose their practices
and modes of application.
The proliferation of regional supermarkets has clearly lead to institutional changes, in
terms of instating a code of conduct, increased power to the HCD and the rise of
dedicated farmers selling into RPNs. These institutional changes, the change in dyadic
ties and the pressure to conform to regional buyer requirements has impacted social
relations of farmers in regional markets. However, the lower level of stringency in the
terms of trade of regional supermarkets has not forced RPN farmers to follow certain
practices to the same degree as GPN farmers.
In terms of societal changes, many RPN farmers claimed that they no longer looked
to village leaders for support and would usually look up to GPN farmers as they were
seen as a sign of wealth and prosperity (Farmers interviews: #21kRPN, #36kRPN).
Thus, like GPN farmers, RPN farmers were also beginning to live in societies that were
different post embedding into the RPN.
Local Farmers
In this thesis, I use local or LPN farmer as a counterfactual, so as to compare how RPN
and GPN farmers have changed post selling to new buyers. That is not to say there
has been no change in the dynamics of supplying traditional markets. For instance,
spillover effects could have occurred because of co-existence with global and regional
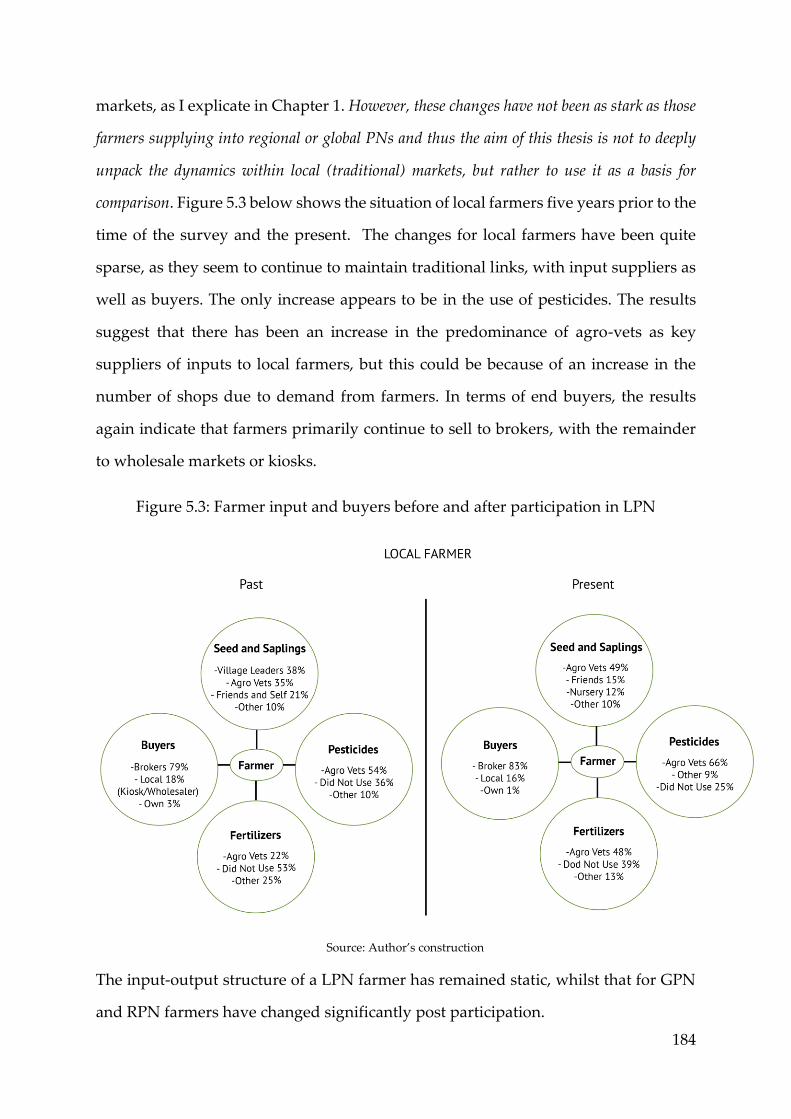
184
markets, as I explicate in Chapter 1. However, these changes have not been as stark as those
farmers supplying into regional or global PNs and thus the aim of this thesis is not to deeply
unpack the dynamics within local (traditional) markets, but rather to use it as a basis for
comparison. Figure 5.3 below shows the situation of local farmers five years prior to the
time of the survey and the present. The changes for local farmers have been quite
sparse, as they seem to continue to maintain traditional links, with input suppliers as
well as buyers. The only increase appears to be in the use of pesticides. The results
suggest that there has been an increase in the predominance of agro-vets as key
suppliers of inputs to local farmers, but this could be because of an increase in the
number of shops due to demand from farmers. In terms of end buyers, the results
again indicate that farmers primarily continue to sell to brokers, with the remainder
to wholesale markets or kiosks.
Figure 5.3: Farmer input and buyers before and after participation in LPN
Source: Author’s construction
The input-output structure of a LPN farmer has remained static, whilst that for GPN
and RPN farmers have changed significantly post participation.

185
Network architecture and structure
So far, I have elucidated the dyadic ties between farmers and other actors in a PN and
changes in societal embeddedness when inserting into GPNs and RPNs, but what is
also important to understand is the change in network architecture i.e. the social
content and composition of the tie itself. Are they significantly different across diverse
PNs? I explore this through the three key aspects which I have proposed in Chapter
2, which are: 1) the relational aspect of embeddedness which links into the
strength/weakness of the tie; 2) the positionality of the actor which are structural
aspects of embeddedness; and finally, 3) the social content defined by the power
struggles that occur in spaces between ties i.e. the relational proximity. I study all these
aspects in conjunction, as together they allude to the fact that re-embedding into GPNs
and RPNs is a contested and dynamic process.
Referring back to Chapter 2, I define the strength/weakness of the tie depending on
the tie density – a closer Euclidean distance between the ties is stronger; the higher
intensity (the frequency of interaction) and quality (the transfer of fine-grained
knowledge and support) is better for stronger ties, and the reverse for weaker ties. The
intermediate tie category consists of some aspects of strong and weak ties together
because it is very difficult to typologize farmers into the two extremes types of ties (c.f
table 2.1). In the survey, farmers were asked about the kind of tie they had based on
intensity, quality and density (See Appendix 5, for questionnaire).
The key ties are depicted in Table 5.1. It illustrates that most local farmers have
intermediate ties with seed suppliers, and generally intermediate or strong ties with
agro-vets. Agro-vets provide valuable information relating to the latest chemical
products and machinery available and hence have become important sources to
disseminate advice, especially for local farmers who generally have poor ties with
their main buyers – brokers. Local farmers complain that brokers do not necessarily
return to the same farmer every season, pay farmers very little for their produce and
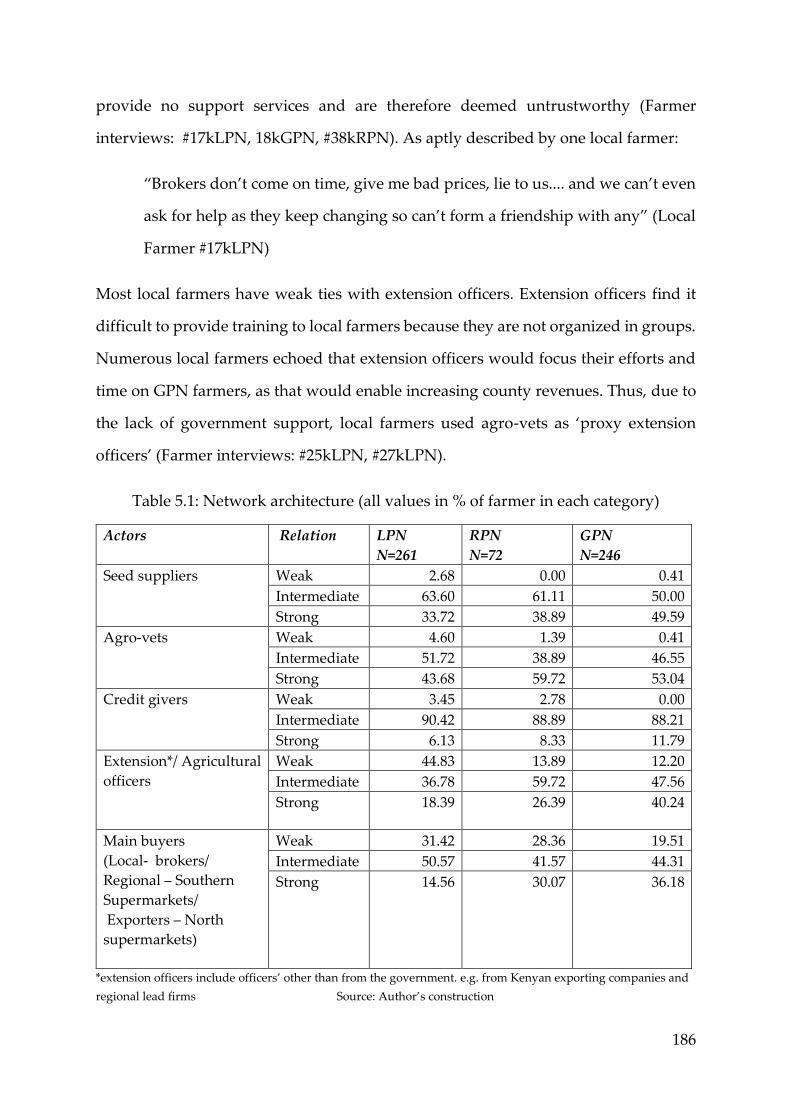
186
provide no support services and are therefore deemed untrustworthy (Farmer
interviews: #17kLPN, 18kGPN, #38kRPN). As aptly described by one local farmer:
“Brokers don’t come on time, give me bad prices, lie to us.... and we can’t even
ask for help as they keep changing so can’t form a friendship with any” (Local
Farmer #17kLPN)
Most local farmers have weak ties with extension officers. Extension officers find it
difficult to provide training to local farmers because they are not organized in groups.
Numerous local farmers echoed that extension officers would focus their efforts and
time on GPN farmers, as that would enable increasing county revenues. Thus, due to
the lack of government support, local farmers used agro-vets as ‘proxy extension
officers’ (Farmer interviews: #25kLPN, #27kLPN).
Table 5.1: Network architecture (all values in % of farmer in each category)
Actors Relation LPN
N=261
RPN
N=72
GPN
N=246
Seed suppliers
Weak 2.68 0.00 0.41
Intermediate 63.60 61.11 50.00
Strong 33.72 38.89 49.59
Agro-vets
Weak 4.60 1.39 0.41
Intermediate 51.72 38.89 46.55
Strong 43.68 59.72 53.04
Credit givers
Weak 3.45 2.78 0.00
Intermediate 90.42 88.89 88.21
Strong 6.13 8.33 11.79
Extension*/ Agricultural
officers
Weak 44.83 13.89 12.20
Intermediate 36.78 59.72 47.56
Strong 18.39 26.39 40.24
Main buyers
(Local- brokers/
Regional – Southern
Supermarkets/
Exporters – North
supermarkets)
Weak 31.42 28.36 19.51
Intermediate 50.57 41.57 44.31
Strong 14.56 30.07 36.18
*extension officers include officers’ other than from the government. e.g. from Kenyan exporting companies and
regional lead firms Source: Author’s construction
187
GPN farmers
The story appears to be quite different for GPN farmers. In essence the results find
that, rather than improve the possibility to embed in new markets, there are strong
forces of contestation that perpetuate marginalization of GPN farmers, and increase
the pressure to dis-embed from social relationships and GPNs.
GPN farmers, in general, seem to have strong to intermediate ties with extension
officers and many claimed to have friendly and supportive relations with county
officers, who came frequently to their area to train them (Interview: #1kGPN, #1kf,
#2kf). The main goals of these officers were to help GPN farmers increase productivity,
quality and comply with international certification (Interview: #1Kba), as explained
by one extension officer in Murang’a:
“We want farmers to learn GlobalGAP practices well so that they can have
good quality and our county can earn more than other counties...... I am good
friends with many farmers from a long long time... So, I want to help them and
the better they do, the better I do” (Interview: #1kcgov).
Hence, strong ties created reciprocal relationships, which increased trust, and led to
mutual gains. By hiring the local extension officers, Kenyan export companies tried to
improve their understanding of norms and cultures in the society from which they
sourced. This was an attempt to create a cooperative environment and foster relational
proximity i.e. by trying to bind together common interests (Section 2.2.2, Chapter 2).
However, achieving cooperation has been a difficult and contested process. Interviews
with GPN farmers highlighted the struggles and difficulties they faced attempting to
adhere to new environmental practices, which were very different to indigenous
practices (Farmer interviews: #1kGPN, #2kGPN, #4kLPN). One GPN farmer
elucidated:
“The pesticides they [exporters] told me to use were expensive and did not
prevent root rot [a disease] so I applied the ones I used to apply before I started

188
selling to them [Kenyan exporter firms]. I knew this would be better for the
crops and my soil… but they [Kenyan exporter firms] blacklisted me….”
(Farmer: #22kGPN).
Dis-embedding from indigenous markets and re-embedding into GPNs was wrought
with power struggles and contention because of the vastly different practices required
within global standards as compared to the local practices farmers used to follow.
Thus, by not integrating local farming practices and societal norms, farmers would
frequently be unable to cope with complex requirements. Those who defaulted
frequently on quality and volume of crop by not adhering to global standards
requirement would often be black listed and thus excluded from the chain.
Some GPN farmers preferred to cooperate and reduce contention (developing a
consensus culture, as Messner and Meyer-Stamer (2000) put it), thereby accepting
their low power status and lack of agency, so as to continue to participate in GPNs.
This meant that farmers acted in a way to promote their own self-interestedness and
self-regard, opportunistically seeking to continue to participate rather than return to
previous livelihoods, as two farmers explicated:
“I have always used manure as a fertilizer for my crops and made my own
compost… but these exporters said no... I am not allowed to... If I do, I will ruin
the crop quality and it will get rejected and I will not be paid... I feel scared to
lose the market …so I don’t apply… but I feel sad as my soil quality deteriorates
and I feel helpless as I can’t do anything” (Farmer: #10kGPN).
“I do whatever exporters tell me to, because I need to send my children to
school and don’t want them to stop buying from me. I have no other alternative
as I cannot get permanent employment in my area” (Farmer: #2kGPN).
The pursuit of commercial gains outweighed local norms, even if farmers believed
that new practices were not always beneficial for them (Interviews: #2kGPN, #1kGPN,
#23kGPN). Overall, even though GPN farmers have stronger ties with almost all

189
vertical and horizontal actors, the social content of the relationships is ‘not relationally
proximate’, as power struggles and contestations ensue within these ties. Therefore,
the GPN farmers’ weak positionality within the network and the contested network
architecture, made the process of re-casting dis-embedded relationships difficult.
Moreover, this had considerable implications for trust within the ties (network
stability), which I discuss in the next sub-section.
RPN farmers
Referring back to table 5.1, the case for RPN farmers seems to be similar to GPN
farmers because they appear to be forging strong ties with other actors and are more
proactive and entrepreneurial than local farmers. Over 90% of RPN farmers have
strong to intermediate relationships with extension officers. This is mostly because, as
discussed in the previous section, almost 40% of RPN farmers were part of GPNs, and
have continued to maintain good relationships with agricultural officers. Many have
also continued to keep good relations with input suppliers like agro-vets. As
explained by one regional farmer:
“I keep my relationships with my exporter friends and officers’ good as I want
their help when I grow my crops to make sure the quality is good... this helps
me get better price in Uchumi [ Kenyan supermarket]” (Farmer: #12kRPN).
Most RPN farmers interviewed suggested that if they had not participated in export
markets, they would not be able to access agricultural officers easily. However, even
the second category of ‘new RPN farmers’ claimed that they would actively ‘seek’ to
build good relationships with officers and peers who would help them (Farmer
interview: #22kGPN, #5kLPN). In the coming chapters, the thesis will unpack some of
the reasons that make them more proactive and entrepreneurial than GPN or LPN
farmers.
In sum, it seems that RPN and GPN farmers generally have intermediate and strong
ties with buyers as well as input suppliers, whilst LPN farmers usually have weak ties.
190
However, strong ties with buyers for GPN farmers is accompanied by low levels of
relational proximity and power struggles, which is not the case for RPN or local
farmers, as they have more flexibility in terms of the practices used. While this section
fleshed out the network architecture and structure, the next section attempts to
uncover how stable the network is, as well as the levels of trust, co-operation and
adaptability that ensure the relationship is sustained over the long term.
5.2.2 Network stability and durability
Recapping the definition of trust, it is not only viewed as an asset to reduce
malfeasance and opportunism but can also be implicit or ascribed, and earned i.e.
developed through personal experience and by collective expectations of what actors
associate as trustworthy (See Chapter 2, section 2.2.3, for more details on trust). This
thesis describes stability as the process of building earned and ascribed trust and
engendering trustworthiness in relationships. In this section, I demonstrate that GPN
farmers have low levels of earned trust and power to negotiate contractual terms with
their buyers, while RPN and LPN farmers have higher levels of earned and ascribed
trust with their buyers and other dyads. I begin by describing each network stability
and durability related indicator across each production network.
Network Stability indicator: Trust
Re-embedding into GPNs appears more closely linked to earned trust than ascribed
trust, especially because of the difficulty in re-casting dis-embedded relations into
GPNs. The formation of almost completely new networks and changes in societal
structure clearly impacts both earned and ascribed trust. Most GPN farmers expressed
the view that extension officers and Kenyan export companies were able to earn their
trust only through helping them gain access to inputs like seeds and pesticides, and
through providing them with certain mandatory training opportunities (e.g. pesticide
application training, traceability). Horizontal and vertical actors were deemed
trustworthy as they fulfilled basic collective expectations of farmers. Nonetheless,
GPN farmers frequently claimed that they struggled to understand the complex

191
requirements within standards, which suggests that trust rich ties may not carry the
right types of information (see also Nadvi 1999a for similar findings).
However, earned trust appears to be more complicated than this. As shown in column
1 of table 5.2, less than 27% of GPN farmers trusted that Kenyan export firms to give
them fair prices. They cited the lack of transparency in the cash transfer mechanisms
as being a key issue. There is a time lag of 2-4 weeks between farmers selling their
crop and the receipt of the money. Farmers struggle to live out of pocket for that
period (Interview: #1Kba, #2Ndonor, #2kedu). Distrust is exacerbated because Kenyan
export firms reject high levels of produce for ‘flimsy reasons‘, such as mild
discolouration or imperfect shape39, and were quick to remove farmers from preferred
supplier lists. So, Kenyan exporting companies and Northern lead firms struggled to
earn trust of the farmers. This shows that, despite having strong ties, trust could not
be earned, which raises questions as to whether the strength of a tie matters at all or
not. This is what Granovetter (1973, 1985) questions in his seminal work on the
strength of weak ties.
Table 5.2: Network stability (All values % of each farmer category)
(1) (2) (3) (4) (5) Crop customization
Farmer
category
Trust best
price
Ability to alter
terms of
contract
Forced to grow
certain crops
Forced to grow
specific volumes
Do buyers
buy non-
contracted
crops
LPN 4.61 50.19 3.45 3.45 86.50
RPN 36.39 62.5 6.94 15.28 78.75
GPN 26.42 46.26 30.89 65.04 12.46
Total 16.58 58.55 15.54 31.09 54.07
Source: Author’s construction
Global lead firms and Kenyan exporting companies could have demonstrated
commitment and earned trust towards farmers by making asset specific investments
39For instance: Specific dimensions of apple mangoes include a weight of approx. 523 grams per
mango, clean surface
192
but the Kenyan farmers surveyed found such elements to be lacking, which prevented
the development of reciprocal relationships. Many lead firms and Kenyan export
companies do not make lumpy investments in infrastructure and communication
systems, to the disappointment of many farmers. This also enables Kenyan exporter
firms to ‘just leave’ without prior notice40 because they have minimal investments in
locations. For example, two GPN farmers explained:
“Kipipiri is high in the Aberdare ranges, and we grow so much snow peas....
exporters (Northern supermarkets) say they will come and we grow.... but the
roads are bad and what should take 3 hours, ends up taking 7-8 hours, so
exporters suddenly decide when it comes to the season not to buy... I am very
suspicious of them now... don’t know if I want to grow snow peas anymore”
(Farmer: #22kGPN)
“Exporters said they would set up a shared drip irrigation across our plots...
and a communal water tank so that we water as per the irrigation schedule
they have given us... that was 3 years ago and they have still not fulfilled their
promise” (Farmer: #10kGPN)
Kenyan export firms were reported to only make low cost investments in basic
certification training and to provide access to inputs, yet not to make lumpy
investments that would enable easier access to markets or improve ease of selling for
farmers. Thus, they were not seen as trustworthy and were unable to earn farmer trust
despite having strong network architecture.
At the other end, Kenyan export companies reported frequent contractual default by
farmers due to opportunistic selling behaviour. Thus, even if there were strong ties, it
40 Kenyan exporters claimed that the high rejection and default in contracts (selling to other buyers)
was the main reason for leaving specific regions. However, many farmers were not informed of these
decisions (Interview: #1ke, #4cg, #5cg).

193
did not reduce opportunism and prevented farmers from earning the trust of lead
firms. Clearly earned trust is not mutually shared and consists of multiple layers.
In relation to local farmers, table 5.2, column 1 indicates that only about 5% trust that
brokers (their main buyer) will give them good prices. This is because brokers cut
commissions of over 5% when purchasing crops, justifying the cut in terms of logistics
expenses incurred (Farmer interviews: #26kLPN, #4kLPN). The lack of earned trust is
further entrenched as brokers do not provide local farmers with any support (access
to inputs, training, information on market price) or contracts and purchase
sporadically and randomly (Farmer interviews: #4kGPN, #6kGPN, #5kLPN). While at
the same time, local farmers often feel more secure selling to brokers, as they are given
cash on the spot (Interview: #30kLPN, #31kLPN, #1kbroker). Thus, trust is again multi-
layered and differs significantly from the mechanisms through which earned trust is
achieved in GPNs.
Almost 40% of RPN farmers surveyed stated that they trusted the Kenyan
supermarkets they sell to to provide them with good prices. The primary reason for
trusting relationships was the ability of farmers to provide high quality crops. Many
RPN farmers proactively tried to seek useful contacts and developed strong-
intermediate ties with vertical and horizontal actors. Moreover, regional
supermarkets prefer to buy from fewer suppliers, who consistently delivered good
produce and thus both regional supermarkets and RPN farmers were able to engender
earned trust. When it comes to engendering earned trust RPN farmers are able to do
so more than GPN farmers.
Network Stability: Contract terms
The second column in table 5.2 is the ability to alter the terms of the contract, which is
closely linked to stimulating earned trust. Overall, the results indicate that RPN
farmers were able to negotiate for better terms of trade and contracts compared to
GPN or LPN farmers. More than 60% of RPN farmers stated that they could negotiate

194
for better prices and alter terms of their contract. Interviews with RPN farmers
unearthed two reasons that enhanced their ability to negotiate for better prices. The
first was that farmers could go into a supermarket and see the retail price for that
week, thereby they could have an approximate idea of the mark-up. The second was
the ‘export quality produce’ premium that farmers demanded (Farmer interview:
#29kRPN, #33kRPN, #7kRPN, #8kRPN, #6krs).
However, good relationships were not homogenous across all RPN farmers, as the
category of ‘new regional farmers’ (who were not previously selling into GPNs or
RPNs) noted a difficulty in getting regional supermarkets to buy their produce.
Moreover, they also noted high levels of rejections, as explained by one regional
farmer:
“I did not get training before... just started selling to Nakumatt. I go to
Embakassi [their centralized grading unit in Nairobi] and then grade and reject
lots of my crops sometimes... I spend so much money to travel... they say it is
lower grade and does not meet their standards.... so they rate me as a medium
farmer... so I can’t ask for a better price” (Farmer: #33kRPN).
These characteristics were very similar to what was happening to GPN farmers,
because of the stringent and sometimes ad hoc way in which regional supermarkets
grade farmer produce. This suggests that waves of marginalization and exclusion
could also occur at regional levels. ‘New RPN farmers’ found it harder to embed into
RPNs than farmers who downgraded from GPNs to RPNs.
While almost half of the LPN farmers interviewed, stated that they would bargain for
better prices with brokers, depending on the prices their friends (other community
members) and GPN farmers would sell for. However, many went on to express that,
even though they were able to bargain, it rarely yielded better contract terms or better
prices.

195
About 46% of GPN farmers seemed to suggest that even though they could negotiate
for higher prices, and had a written contract, but these negotiations were rarely
successful, mainly due to low levels of trust, and poor collective action because of
ineffective farmer groups. In terms of contracts, about 60% of all GPN farmers were
provided written contracts for one year, compared to only 19% of RPN41 and less than
1% of LPN farmers. Interviews with GPN farmers suggested that having a written
contract did not necessarily provide farmers with a sense of security (Farmer
interviews: #8kRPN, #13kRPN), especially because Kenyan exporter firms and global
lead firms have legal clauses in their farmer agreement contracts such as “the packer
reserves the right to make statutory deductions” and “the packer has the right to
cancel the order if seen required” (e.g. See figure 5.4 below which has a section of an
original contract between a farmer and a Kenyan export company). This effectively
acts as a hedge against any market or price shocks for a Kenyan exporter firm or
international retailer and does not provide any protection to farmers. This showed
high power asymmetry prevented farmers from bargaining for better contract terms,
which in turn inhibited accumulation of earned trust for their buyers in GPNs.
Figure 5.4: Part of a Farmer agreement contract of a large Kenyan export firm
Source: HCD vetting form addendum
41 54% of RPN farmers had oral contracts, while 93% of local farmers had no contract.

196
Ineffective collective action by farmer groups (about 73% of farmers were part of a
group) and cooperatives was cited as a reason that led to the failure of bargaining for
better terms and propagated low earned and ascribed trust. This thesis identifies two
types of farmer groups. The first are bottom-up groups, which are formed by locals to
pursue common goals for the benefit of the group. Some of these groups consist of
over 200 members. Most of these groups were formed prior to members participating
in GPNs. Bottom-up groups inspired ascribed trust because they were already
organized, and reduced the transaction costs of Kenyan exporting companies and
global supermarkets. Bottom-up groups also appeared to have more power because
of their large and dense membership base, as explained by one GPN farmer:
“I am part of the XX [anonymized] farmer group of over 300 members, export
companies want us to be their ally, so they give in to some of our demands. We
asked for a hike in prices from Ksh 60/ kg of snow peas to Ksh 80/kg. We finally
agreed on Ksh 70/kg” (Farmer: #24kGPN)
The presence of ‘bottom-up’ groups highlights how lead firms and Kenyan exporting
companies choose to territorially embed (anchor) in regions and take advantage of a
farmer group’s established social networks. Thus, the pre-existence of farmer groups
enables asserting a certain level of collective power over the corporate power of lead
firms.
The second type of farmer groups identified are ‘top-down’, formed by Kenyan
exporter companies or village leaders exclusively for the purpose of inserting into
GPNs or RPNs. The formation of these groups reduced the dispersion of farmers and
helped Kenyan export companies to achieve economies of scale, driving down costs
(Interview: #1krs, #6krs, #1kef, #4kef) (similar findings were elicited by Okello et al.
(2011) for green beans in Kenya). Over 80% of all GPN farmers were part of top-down
groups. Since top-down groups are dependent on Kenyan exporting companies, their

197
members have low collective agency to bargain for better prices when compared to
bottom-up groups. A member of a top-down group explained:
“I am part of a group set up by xx [export company name anonymized] but
they do not let us change terms of our agreement. We cannot negotiate for
prices. We cannot even negotiate to farm the way we think is best” (farmer 2,
in #4k).
There are only a few cases where proactive top-down group members were able to
negotiate a change in terms of the contract. For instance, the Gatanga Farmers’ Group
could negotiate for a 3-year contract with Kakuzi (their main buyer), an improvement
over the one-year contract they had previously (Farmer interview: 1kGPN).
In sum, being part of a bottom-up group seems to inspire greater ascribed and earned
trust and suggest a smoother process of re-embedding into GPNs. In contrast, top-
down groups have lower power and are unable to bargain for better prices and do not
necessarily inspire earned trust.
Network stability: Crop customization
RPN and local farmers reported to having much more flexibility compared to GPN
farmers as depicted in columns 3 (freedom to grow other crops), 4 (volumes to be sold)
and 5 (whether buyers are willing to buy other crops from farmers, aside from what
they had asked for in the contract) in table 5.2, which are indicators of the control lead
firms have on farmers in terms of the flexibility they are willing to allow. Highly
flexible relationships can increase earned trust between ties. The results reveal that
RPN farmers were able to produce whatever crop they wanted and, because they did
not have written contracts, and were therefore not bound to supply specific volumes.
Only 12% of GPN farmers reported that Kenyan export companies bought other crops
from them, whilst the figure stood at almost 80% for RPN and local farmers, which
shows that most relations with GPN farmers are strong only within the remit of specific
export oriented crops. Lower flexibility impacted earned trust between farmers and their
buyers significantly, according to several interviewees.

198
Overall, the results on network stability indicate the process of re-embedding into
GPNs is not a linear process. GPN farmers struggle with de-localizing trust at various
geographical scales, because of the multi-layered nature of earned and ascribed trust.
As delineated in Chapter 2, Schmitz (1999) finds that earned trust leads to positive
benefits, this research finds that, although it is important, trust is not always an asset
and is highly complex. GPN farmers seem to have low ability to bargain for better
prices, or contracts, and lower flexibility in their relationships, while RPN farmers
have relatively stable networks because they developed reciprocal ascribed and
earned trust with their main buyers and more freedom to grow other crops and follow
different practices. LPN farmers are also seen to have higher trust in their buyers and
more flexibility than GPN farmers. This belies the assumption that strong ties and
network architecture propagates trust, when clearly in this study it is not the case, in
line with the Granovetterian notion of the strength of weak ties.
5.2.3 Measuring network embeddedness
The results clearly indicate that the degree of embedding in GPNs and RPNs is
heterogeneous, with considerable differences in the way they embed in networks. In
a nutshell, embedding is a contested process for GPN farmers and changes their social
and network relationships significantly, as compared with those of RPN and LPN
farmers. This section seeks to collapse all the information and indicators of network
architecture, structure and stability discussed thus far to form a unit of measurement
to be able to quantitatively compare across farmers in PNs.
In this thesis, I develop indices for embeddedness. An index is useful to reduce the
number of dimensions in data to provide a dimensionless value that carries all the
information in the variables, and which can then be compared across various
categories (e.g. Filmer and Pritchett, 2001; Branisa et al., 2009). I use polychoric and
tetrachoric econometric index constructing methods to develop a network architecture
and structure and a network stability index (see Appendix 10 for details on the
econometric method used), which follows Kolenikov and Angeles (2004, 2009).

199
Primarily drawing on table 5.1, I create the network architecture index, where values
close to 0= low level of network architecture (weak ties, power struggles and weak
positionality), while close to 1 refers to strong network architecture and less power
struggles. I draw on table 5.2 to create the network stability index, where 0 = is stability
i.e. low earned and ascribed trust, low ability to bargain and less flexibility, while
values close to 1 are high network stability.
Table 5.3: Index of network architecture, stability and durability
Farmer category Network architecture
Index
Std error
Network stability
index
Std error
LPN 0.336 0.008 0.763 0.008
RPN 0.396 0.014 0.892 0.022
GPN 0.557 0.009 0.475 0.017 Source: Author’s calculations (Appendix 11 contains robustness tests for the results)
The table above illustrates the index values, of GPN farmers as 0.557, compared to
0.396 of RPN farmers and 0.336 of LPN farmers, suggesting that GPN farmers have
the highest network architecture because they have more support due to strong ties
with input providers and buyers. However, despite having strong ties (density,
intensity, quality), there is considerable contestation within the ties due to lower
power and agency of farmers. Many GPN farmers struggle with compliance to
certifications as well as with the use of new environmental practices that they believe
are not optimal for their farms. Non-adherence and contesting standards causes
marginalization and, thus, some GPN farmers attempt to develop a consensus culture
by cooperating with lead buyers to be able to continue commercially selling to them.
A significant number of RPN farmers surveyed stopped selling into GPNs and
opportunistically began focusing on regional markets. These farmers generally
appeared to have strong ties and were seen as entrepreneurial as they managed to
maintain ties with network actors. Whilst the other set of what the thesis identifies as
‘new RPN farmers’ were proactive and also made an effort to build ties with PN actors

200
who could help them sell into RPNs. Local farmers on the other hand had weak ties,
with brokers their main buyers.
The case is reversed when it comes to network stability, with GPN farmers having the
lowest (0.475), followed by regional (0.892) and local (0.763). This is because most GPN
farmers have low levels of earned trust with their buyers, due to low transparency in
cash transfer mechanisms, high rejections, fear of being blacklisted from supplier lists,
unfavourable contract terms despite being part of a farmer group and low flexibility
in terms of freedom to grow other crops and volumes to produce. Both RPN and local
farmers have higher levels of earned and ascribed trust, more ability to bargain for
better terms of trade and much more freedom to choose the crops to grow and the
quantity to produce. In general, the findings confirm the ‘strength of weak ties’ that a
farmer’s ease of embedding into an RPN is smoother and less contested than
embedding into a GPN. Having shed light on the dynamic and non-linear nature of
how farmers in GPNs, RPNs and LPNs socially embed, the next section will cover
territorial embeddedness. Within this I unpack the environmental dimensions of
embeddedness and how it interacts with societal and network embeddedness in the
Kenyan horticulture case.
5.2.4 Territorial embeddedness
In this sub-section, I explain how lead firms territorially anchor in places and how this
impacts farmers’ in GPNs, RPNs and LPNs. I then discuss the fixed and fluid
environmental dimensions to embeddedness, and whether this also differs across
farmers. In GPN analysis, territorial embeddedness relates to the extent to which firms
are ‘anchored’ in specific territories, absorb specific place dynamics and show
commitment by making asset specific investments (Henderson et al., 2002; Hess, 2004).
Interviews and FGDs with farmers and other actors demonstrated that low levels of
trust and the need to ‘prevent feeling tied down’ pushed lead firms and Kenyan export
firms to make investments only in less expensive and recurring assets such as training,
providing fertilizers, pesticides and seeds (Interviews: #1kef, #3kef). On the other

201
hand, such major companies avoided fixed lumpy investments such as broader
infrastructural requirements – e.g. irrigation facilities, greenhouses, onsite residue
testing facilities42 or providing better logistic facilities (Interviews: #2kef). The only
heavy investment they made was in cool chain facilities and storage warehouses,
which limited the remit of spillovers of productive assets (e.g. better roads, irrigation
systems) into regions.
Consequently, in an attempt to speed up the process of inserting into GPNs, the state
(national and county) made investments in improving water access, subsidies, roads
and communication facilities in export counties. For instance, the HCD made major
investments in cool chains, setting up an ISO 140001 approved pack-house, cold store
facility for Kenyan export companies and special transport facilities through HCD
depots. Thus, much of the governmental support has been unevenly targeted to export
counties to help promote more exports, leaving farmers in other counties as well as
local farmers in export counties without much support (Interview: #1Ndonor, #4Kao,
#1kcgov).
Recently even Kenyan supermarkets and green grocers such as Nakumatt, Uchumi,
Chandarana and Zucchini have begun to make small investments in the development
of farming. For instance, they are sending personnel to provide GAP assistance to
farmers. Some are providing better logistics facilities to pick up and return rejected
produce. However, they too are not making any long term, lumpy investments to
improve overall infrastructure facilities for farmers (Interview: #3krs, #4krs, #8kcgov).
Hence global supermarkets, regional supermarkets and the state seem to generally
support farmers in small investments that enable them to sell into GPNs or RPNs, but
do not appear to be showing commitment in aspects linked to wider regional
42 The only testing facility is at KePHIS.

202
development that could have positive impacts on farmer participation in these
markets.
5.2.5 Territorial embeddedness- Fixed
However, as I point out, the natural environment, especially in the context of
agriculture, is not a mere backdrop but is enmeshed with the economic and social, and
is critical when firms choose ‘places to inhabit’. In this thesis, I define territorial
embeddedness to take into account the natural environment, arguing that ‘place’ for
farmers consists of natural endowments and uncertain bio-physical hazards. In this
section, I explore the fixed aspects of the natural environment – natural endowments
on farms. The results elucidate that livelihoods of farmers are intrinsically linked to
the potential of their natural endowments, thus intimating that participation in GPNs,
RPNs and LPNs is contingent on natural endowments. The process of re-embedding
into GPNs and RPNs varies significantly and influences ecological relationships
farmers have with their environment. I provide evidence of the changing
environmental relationships farmers have once they embed into GPNs and RPNs.
Kenyan export companies and global lead firms anchor in places with high
agricultural potential, that is areas which have soil, water, and climatic conditions
conducive to growing snow peas, garden peas, avocados and mangoes. As a result,
there is an automatic pre-selection of farmers (and farmer groups) who possess land
in these places (usually classified as high potential agricultural places by the National
Environment Monitoring Agency), and an exclusion of other farmers. Hence, specific
types of natural endowments are critical to participating in GPNs. For instance,
growing apple (export variety) mangoes is more attractive in Machakos and Makueni
County, compared to Kwale and Kilifi counties, due to better agro-ecological
conditions. Despite the productivity in Kwale and Kilifi being over 19 tons/hectare,
compared to about 11 tons/hectare in Machakos, the quality of the crop in Machakos
is better to export to Northern markets (Interviews: #4kgov).

203
The survey asked farmers various questions to ascertain their level of natural
endowments, which included three categories: 1) geology, topography and soil
conditions; 2) water access and use; and 3) land ownership and use (See Appendix 5
for questionnaire). Results are shown in tables 5.4 and 5.5, indicate that GPN, RPN
and local farmers had very similar territorial fixed embeddedness. This was because,
in order to perform a comparative case study analysis, farmers from similar locations
were sampled, and thus usually had comparable environmental assets. For instance,
an average of over 85% of all farmers were located in high potential zones (only a part
of Machakos county was considered a medium potential zone due to high levels of
soil salinisation43). Tables 5.3 and 5.4 (below) describe the different natural
endowments, across farmers surveyed.
In terms of topography it seems that almost 50% of the farmers surveyed were located
in areas where heavy winds are frequent problems, thus causing erosion and loss of
seeds and planting material (Interview: #1kf, #3kf). Looking at soil conditions in Table
5.4, it appears that GPN farmers had most difficulty with balancing their soil ph44
(78.54% compared to 62.5% for RPN farmers). The main reasons cited were increased
application of fertilizers and pesticides, as new strands of pests and diseases were
affecting their crops. GPN farmers also suffered most from weather related erosion,
due to floods, heavy rains and droughts. Increased frequency of tillage was also
mentioned as causing increased soil erosion and reducing productivity (Interviews;
#1Kao, #3Kao).
43Soil salinization: increasing salt content in the soil 44Soil ph is a measurement of acidity or alkalinity in the soil

204
Table 5.4: Territorial Fixed: Natural endowments I
Farmer Category
Geology, topography and soil condition (% of each category)
Access to water sources *** (% of each category)
Rainfall dependence (% each category)
High Potential zones
Poor or no Drainage
Organic matter insufficient**
Changes in soil Ph
Weather related erosion*
heavy winds
Less than 2
2 or more
LPN 85.44 21.07 20.31 69.35 45.98 46.74 62.45 37.55 48.66
RPN 91.66 12.50 8.33 62.50 43.06 47.22 61.11 38.89 20.83
GPN 90.25 11.11 15.71 78.54 46.36 55.56 50.96 49.04 18.70 Source: Author’s calculation from survey *includes erosion due to heavy rains ** organic matter: Hummus, decomposed residues, biomass; *** water sources
include: rivers, streams, groundwater, tap water through county supply or government community water projects
Table 5.5: Territorial Fixed: Natural endowments II
Farmer Category: Production Network
Land ownership (% of each category)
Average land size (acres)
Land under select crops (% of total land)
land owned and operated
land leased
land sharecropped land owned and leased
LPN 78.54 6.13 9.96 5.36 2.87 15
RPN 69.44 9.72 11.11 9.72 3.72 18
GPN 69.92 8.94 10.98 10.16 5.73 35 Source: Author’s calculation from survey

205
The results from the tables above suggest that GPN farmers were endowed with
greater access to water for irrigation and were less dependent on rainfall compared to
local farmers. The data shows that almost 50% of LPN farmers were dependent on
rainfall as their main source of irrigation, compared to less than 20% of RPN and GPN
farmers. The main water issues cited were similar across all farmer categories. About
60% of the sample felt that erratic rainfall was the biggest concern, followed by
approximately 21% stating it was becoming increasingly difficult to abstract from
water bodies, while 18% claimed the lack of governmental support mechanisms (such
as building dams and canals) was a serious concern.
A significant difference found across farmers was in terms of land size from Table 5.5.
GPN farmers own and operate twice the size of land compared to local farmers (5.73
acres versus 2.87 acres respectively). Additionally, about 11% of GPN and RPN
farmers also lease land, to ensure they produce the volumes as stated in their contracts.
In terms of land use under specific crops, about 35% of an average GPN farmer’s land
is under the selected crops, compared to 18% for regional and 15% for LPN farmers.
This reinforces that local farmers have more freedom and thus grow a more diverse
range of crops so that they can opportunistically sell different crops to multiple kiosks
and local buyers.
In sum, it appears that besides land size, farmers across GPNs, RPNs and LPNs have
very similar levels of natural endowments, but what is critical to understand is how
their ‘relationship’ with the natural environment has changed due to embedding into
GPNs and RPNs. How then do contested social relations get enmeshed with the
environment? I start breaking this down in the subsequent paragraphs.
Several GPN farmers echoed that stringent environmental requirements to fulfil
certification was degrading the quality of their soil, as aptly described by one farmer:
“There is money in the soil...I need to maintain soil quality to produce good
crops (which) will not be rejected by exporters... If I perform wrong practices,
206
my soil will get spoilt... and then I can’t continue get the right yield... so I will
be excluded from their lists” (Farmer: #32kGPN)
The quote alludes to the inherently inseparable nature of a farmer’s natural
environment and livelihoods. Therefore, farmers do not always act as rational agents.
That is to say, that along with trying to participate in GPNs, they also attempt to
conserve their natural environment, as they ‘care’ and are ’attached’ to it. Drawing on
the varieties of rationality discussion (see Chapter 2, section 2.2.4), farmers act under
reserved rational conditions, wherein they are motivated not only by commercial
gains but also conservation of their environment. This entrenches power struggles
between global lead firms and farmers.
GPN farmers also reported that continuously performing incorrect environmental
practices would reduce their incomes and thus prevent them from performing
activities required to improve the condition of their soil, creating a vicious cycle (and
irreversible soil damage) that could possibly marginalize them from supplying to such
markets (Interview: #2kf, #5kf)45. One GPN farmer explained this dynamic:
“I fear growing crops in blocks, rather than multi-cropping can cause
significant problems on my farm. Even though I intercrop at times, it is not
enough to fortify my soil... I need to apply more fertilisers... Then that ruins the
soil ph... Then I plant in blocks again... at least 3 times a year... I really worry
about my land... what can I give to my children in 10 years?” (Farmer:
#16kGPN)
This further elucidates the reserved rationality of farmers, suggesting that GPN
farmers cannot predict future outcomes, and would not want to perform activities
over a ‘threshold’ that they believe to be irreversibly damaging to their natural
45 Reardon and Vosti, 1995; Scherr, 2000; Shiferaw et al., 2009 also had similar findings.
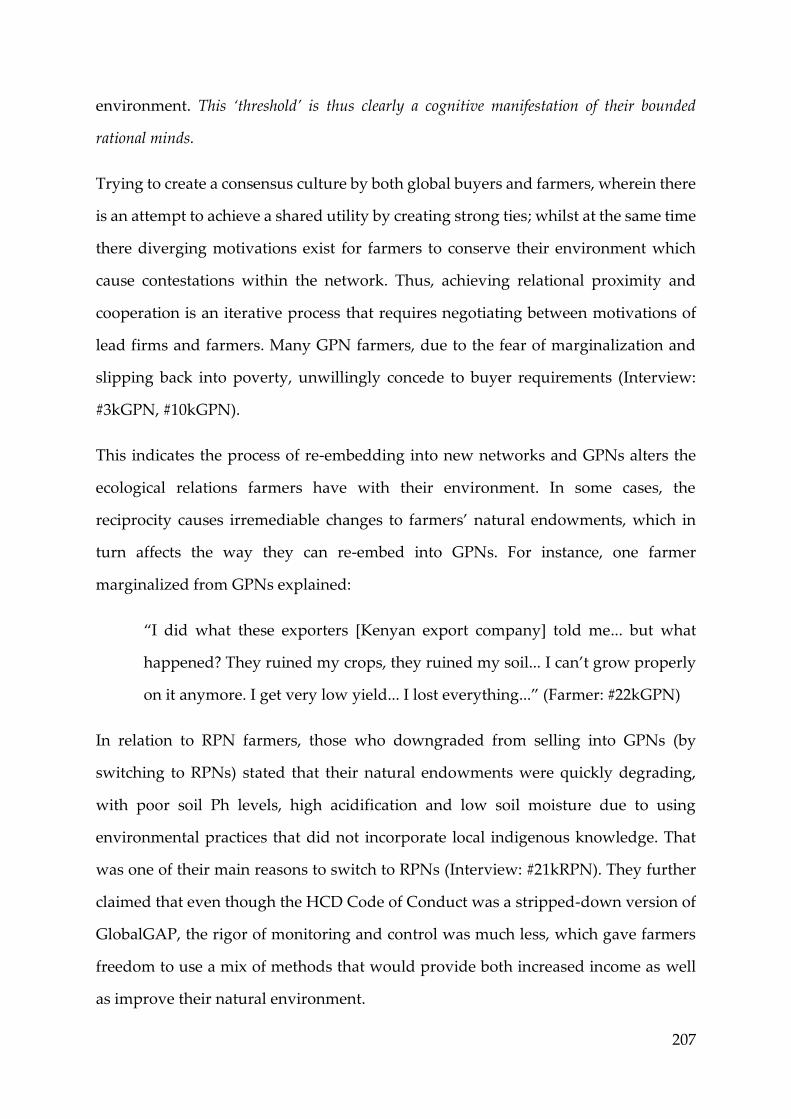
207
environment. This ‘threshold’ is thus clearly a cognitive manifestation of their bounded
rational minds.
Trying to create a consensus culture by both global buyers and farmers, wherein there
is an attempt to achieve a shared utility by creating strong ties; whilst at the same time
there diverging motivations exist for farmers to conserve their environment which
cause contestations within the network. Thus, achieving relational proximity and
cooperation is an iterative process that requires negotiating between motivations of
lead firms and farmers. Many GPN farmers, due to the fear of marginalization and
slipping back into poverty, unwillingly concede to buyer requirements (Interview:
#3kGPN, #10kGPN).
This indicates the process of re-embedding into new networks and GPNs alters the
ecological relations farmers have with their environment. In some cases, the
reciprocity causes irremediable changes to farmers’ natural endowments, which in
turn affects the way they can re-embed into GPNs. For instance, one farmer
marginalized from GPNs explained:
“I did what these exporters [Kenyan export company] told me... but what
happened? They ruined my crops, they ruined my soil... I can’t grow properly
on it anymore. I get very low yield... I lost everything...” (Farmer: #22kGPN)
In relation to RPN farmers, those who downgraded from selling into GPNs (by
switching to RPNs) stated that their natural endowments were quickly degrading,
with poor soil Ph levels, high acidification and low soil moisture due to using
environmental practices that did not incorporate local indigenous knowledge. That
was one of their main reasons to switch to RPNs (Interview: #21kRPN). They further
claimed that even though the HCD Code of Conduct was a stripped-down version of
GlobalGAP, the rigor of monitoring and control was much less, which gave farmers
freedom to use a mix of methods that would provide both increased income as well
as improve their natural environment.

208
Interviews with RPN farmers also suggested that they wanted to act as ‘stewards’ of
environmental good practices. Many would allow county officers to use their farm as
demonstration farms (to show training of GAPs for groups/other farmers). Therefore,
RPN farmers also act under reserved rationality, but this rationality is not a contested
one, as regional buyers are yet to develop stringent standards or enforce specific
environmental requirements. However, in the conclusion chapter (chapter 8), I will
elucidate that this is quickly changing and could possibly lead to new waves of
marginalisation from regional markets. LPN farmers seem to be mostly driven by
commercial gains, however most farmers did state that they would also want to
conserve their environment by doing practices they thought would enhance crop
yields (Farmer interview: #26kLPN, #27kLPN).
In sum, the results suggest that GPN and RPN farmers have similar levels of natural
endowments, followed by LPN. However, when territorially (fixed) embedding into
GPNs, the ecological relationships that develop are contested and causes irreversible
environmental degradation that may prevent farmers from continuing to participate.
The case of RPN farmers suggests that they have developed ecological relationships
with the environment that are not linked with power struggles with regional lead
firms and that this helps them conserve their environment. ‘Territories’ does not only
consist of natural endowments, but also includes bio-physical elements such as
climate variability and shocks, which I describe next.
5.2.6 Territorial embeddedness- Fluid
In short, territorial fluidity, refers to the probability that climate variability and
extremes impinge on crop quality and the need to adapt to such bio-physical hazards
(for a theoretical discussion see chapter 2, section 2.2.4). Overall, it appears that GPN,
RPN and LPN farmers are exposed to very similar levels of climate variability
(changes in rainfall, temperature) and climate shocks (floods and droughts), but their
process of adapting to these hazards varies significantly.

209
Since GPN, RPN and local farmers have been sampled from the same region, they are
faced with similar hazards of climate variability and extremes, however their ability
to cope with these differs significantly depending on whether they are part of a GPN,
RPN or LPN. I first start by expanding on the types of fluid bio-physical hazards
farmers face, and then begin unpacking the implications these have for ecological
relations.
As illustrated in table 5.6, increased temperature was unanimously cited as the biggest
cause for concern (over 81% across all farmer categories). Farmers stated that
increased temperature, with lower precipitation, was causing an increase in pests and
disease attacks on their crops. Pests such as Aphids, fruit fly, and diseases such as root
rot and blight were reported to be becoming ever more prevalent amongst crops,
which had not previously been the case (Interview: #1kf, #2kf, #1kKePhis). In terms of
unseasonal or delayed rains, LPN farmers were most impacted because almost 50% of
them are dependent on rainfall for irrigating crops, as explained by one LPN farmer:
“It [unseasonal rains, floods] is becoming even more uncertain. Earlier I could
predict when it would come... but now I cannot... We live in very unpredictable
times” (Farmer 1, #1kf)

210
Table 5.6: Territorial fluid: Pest incidences, climate variability and shock perception by farmer category
Farmer Category: Production network
Pest and disease attacks (% of each farmer category)
Rainfall (% of each farmer category)
Temperature (% of each farmer category)
Extreme climate shocks (% of each farmer category) *
Frequency of pest attacks
Frequency of disease attacks
Unseasonal rainfall
Delayed rainfall
Sudden increase temperature
Sudden decrease temperature
Local 93.87 92.72 60.54 74.33 86.97 55.17 65.13
RPN 93.06 88.89 59.72 70.83 81.94 63.89 72.22
GPN 94.72 91.46 58.13 64.63 88.62 54.07 61.79
* Farmers were asked whether they had experienced floods or droughts in the last two years. This information was triangulated with ward level data from the Kenyan
Meteorological Department. Thus, if a ward had experienced a flood or drought, all the farmers in that ward are shown as having experienced it.
Source: Author’s calculation from survey

211
A substantial percentage (about 59%) of GPN and RPN farmers reported having
experienced unseasonal and delayed rainfall. Such shifts in rainfall can impact sowing
and harvesting, such as by washing away farmer seeds or destroying standing crop
(Interview: #2Ndonor, #3Ndonor). Thus, climate variability was affecting crops yields,
quality, natural endowments and their livelihoods. This leads to default on contracts
and blacklisting from global and regional supermarket supplier lists.
This suggests that the inability to adapt to, or mitigate (I discuss the specifics of
adaptation in Chapter 6 under strategic environmental upgrading), climate variability
impacts not only ecological but also ongoing social relationships. The environmental
degradation caused by virtue of unforeseen events, further compounded the struggles
to meet certifications and augmented contestations between farmers, especially in
GPNs, and their main buyers.
GPN farmers would often complain about the difficulty of being able to cope with
climate extremes because there was no prescribed method of how to alleviate it with
certifications. The survey asked farmers if they had experienced a flood or drought
over the last two years46 (column 4 table 5.6). Over 60% of them claimed that they had
experienced an extreme event which had adversely impacted their productivity and
crop quality, as explained by one GPN farmer:
“GlobalGAP does not tell you what to do when you have a flood... I lose all my
crops if I don’t make sure I do everything I can to prevent it... Even though I
have lived with floods, they are increasing more and more now...” (Farmer 2,
#1kf).
One of the most important issues faced by GPN farmers related to the increase in pest
and disease attacks. Almost 60% of all GPN farmers claimed that the use of new
46 A period of two years was selected as the lagged effects of climate extremes occur in this time
period

212
chemicals (standard prescribed pesticides, biocides and insecticides) led to an increase
rather than an expected decrease in pest/insect attacks, as described by one farmer:
“I get spray schedules from exporters... I spray exactly like they say... but the
aphids don’t go away... They eat my plants... so I need to spray some more...
but when I do... then they say there is too much MRL... what can I do” (Farmer:
#18kGPN).
This is one of the main reasons for contention between GPN farmers and Northern
lead firms, and makes the process of re-embedding becomes even more difficult when
there is lack of consensus and cooperation. Overall, GPN farmers unanimously echoed
the increased risk of exclusion or marginalization from the chain, higher percentage
of contract default and environmental degradation of their farmland, to significantly
affect their relationships with buyers and other intermediaries.
RPN farmers also suffered considerably from bio-physical pressures. However, due
to the ease of re-embedding into RPNs, they were not always adversely affected to the
same extent as GPN farmers. Although a few RPN farmers did mention that inability
to cope excluded them from selling into regional markets, the majority of RPN farmers
mentioned that they endeavoured to perform various adaptation measures, so that
they could continue to ‘impress’ regional supermarkets by consistently providing
superior quality (close to export quality) and volumes (Interview: #36kRPN). LPN
farmers, because of weak ties and no requirement to follow any standard, claimed that
climate variability or extremes did not significantly impact their ability to sell to
brokers (Interview: #14kLPN).
In sum, embedding into GPNs and RPNs also brings with it bio-physical hazards that
impact the ongoing socio-ecological relationships farmers have with their main
buyers. Whilst this exacerbates the contentious nature of the relationship within
GPNs, it seems to be relatively less important in RPNs. But with the growing power

213
of regional lead firms and increased stringency in contracts, even RPN farmers may
begin to face similar problems.
5.2.7 Measuring territorial embeddedness
Clearly it is not just societal and network relations that have been altered when
embedding into GPNs and RPNs, but farmers interactions and relationships with their
natural environment have also changed significantly. In this section, I present the
quantification of territorial fixed and fluid embeddedness through an index value. The
variables for this index have been drawn from Table 5.4 and 5.5 for territorial fixed
and Table 5.6. for territorial fluid.
The values close to 0 suggest poor quality of natural endowments, while 1 indicates a
high level of quality of quality endowments. Table 5.7 shows the mean values of
territorial natural endowments range between 0.56-0.58, suggesting that GPN, RPN
and LPN farmers undergo territorial fixed embeddedness to similar degrees. But these
values cannot be studied in isolation, but rather in conjunction with ongoing social
and ecological relations, which will enable improving understanding of what it means
to anchor in territories.
In the case of territorial fluid embeddedness index, the values close to 0 suggest less
issues faced by bio-physical hazards, while 1 means more issues faced by bio-physical
hazards. Overall, in terms of magnitude, GPN, RPN and local farmers face very
similar levels of bio-physical hazards.
Table 5.7: Index of territorial embeddedness: fixed and fluid
Farmer Category: Production
network
Territorial: Fixed Territorial: Fluid
Mean Std. Err. Mean Std. Err.
LPN 0.569 0.014 0.746 0.011
RPN 0.573 0.026 0.725 0.023
GPN 0.578 0.014 0.766 0.013 Source: Author’s construction (Appendix 11 contains robustness tests for the results)

214
Overall, these index values only take into account the physical elements of rainfall,
temperature and shocks and not the contested ecological relationships. Thus,
territorial fixed and fluid embeddedness must be studied in conjunction with network
and societal embeddedness to comprehend the dynamic and heterogeneous socio-
ecological relationships. For instance, when territorial fixed and fluid aspects are
overlaid with the contested social relations due to embedding into GPNs, their
interaction with the environment is influenced by these social relations and can lead
to long term degradation. I explore this through re-environmentalization in the next
section.
5.2.8 Degrees of re-environmentalization
Farmers have had to re-embed into GPNs and RPNs by recasting and re-appropriating
previous relationships. Whilst, RPN farmers have been able to re-embed into RPNs
relatively easily, the process has been wrought with low levels of trust and power
struggles for farmers embedding in GPNs. Along with the changed social
relationships, farmers have also had to alter their relationship with the environment
due to demands made by Northern lead firms. Many GPN, and to an extent RPN,
farmers have had to de-environmentalize, by detaching from previous social and
environmental relationships, and then re-environmentalizing (a recasting of de-
environmentalized socio—environmental relations to global or regional production
networks).
The process of re-environmentalization attempts to achieve a shared utility in a
GPN/RPN, but when varieties of rationality persist it has proven to be dynamic and
contested. For instance, GPN farmers struggle because lead firms do not necessarily
share the environmental conservation related priorities of farmers.
Farmers are motivated to conserve their land not just for commercial reasons, but also
for bequest, as environmental stewards or because of attachment. Thus, the process of
re-environmentalization occurs under various constraints of varieties of rationality,

215
wherein GPN farmers want to cooperate so as to continue to participate and earn
rents, while at the same time they also want to conserve their environment.
Some farmers have experienced strong de-environmentalizing forces because of
environmental degradation caused due to performing environmental tasks, that in
turn led to a breakdown in social relationships eventually forcing farmers to dis-
embed from GPNs and instead re-embed into RPNs. One RPN farmer explained:
“I stopped selling into export markets as I felt it was hurting my soil, my crops,
and also ... my peace of mind.... I did not want it - my land to degrade more...
so I stopped using the chemicals they told me, I stopped using their spray
schedule.... but my soil will never be as good as before [before entering the
GPN] …” (Farmer #12kRPN).
In sum, the ease of re-environmentalization varies across farmers in each market,
drawing on the two types of re-environmentalization developed in section 2.2.5) is
shown in Table 5.8. Clearly GPN farmers are a mix of type 1 and type 2 (verging more
on type 2). For instance, when embedding into GPNs, farmers have strong ties but low
levels of relational proximity and weak positionality, thus mixed network
architectures. There also exists low levels of earned trust and a contested process of
building consensus culture. Furthermore, because global buyers do not allow local
interpretations within standards, it impinges on their rationality and belief systems.
Territorially firms do not show commitment by making lumpy asset specific
investments, but only make less expensive investments like providing training and
input supplies. GPN farmers claim that a significant reduction in quality natural
endowments and increase in frequency of bio-physical hazards has impacted not only
their natural environment, but their ongoing social relations, causing exclusion or
marginalization. Therefore, achieving a co-operative, shared utility is difficult.
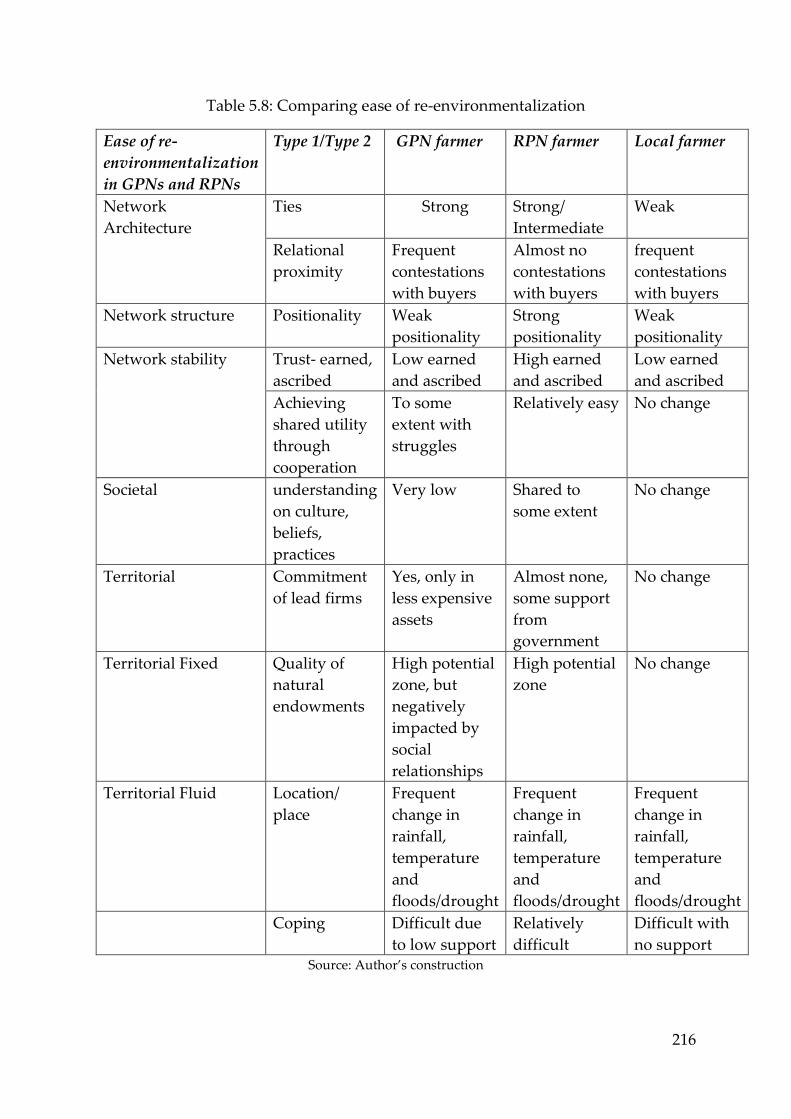
216
Table 5.8: Comparing ease of re-environmentalization
Ease of re-
environmentalization
in GPNs and RPNs
Type 1/Type 2 GPN farmer RPN farmer Local farmer
Network
Architecture
Ties Strong Strong/
Intermediate
Weak
Relational
proximity
Frequent
contestations
with buyers
Almost no
contestations
with buyers
frequent
contestations
with buyers
Network structure Positionality Weak
positionality
Strong
positionality
Weak
positionality
Network stability Trust- earned,
ascribed
Low earned
and ascribed
High earned
and ascribed
Low earned
and ascribed
Achieving
shared utility
through
cooperation
To some
extent with
struggles
Relatively easy No change
Societal understanding
on culture,
beliefs,
practices
Very low Shared to
some extent
No change
Territorial Commitment
of lead firms
Yes, only in
less expensive
assets
Almost none,
some support
from
government
No change
Territorial Fixed Quality of
natural
endowments
High potential
zone, but
negatively
impacted by
social
relationships
High potential
zone
No change
Territorial Fluid Location/
place
Frequent
change in
rainfall,
temperature
and
floods/drought
Frequent
change in
rainfall,
temperature
and
floods/drought
Frequent
change in
rainfall,
temperature
and
floods/drought
Coping Difficult due
to low support
Relatively
difficult
Difficult with
no support Source: Author’s construction

217
RPN farmers fit more into type 1 (smoother process of re-environmentalization), as
illustrated in the table above, because they have strong-intermediate ties and have less
power struggles or contestations. This is due to their entrepreneurial and proactive
ability to keep good relations. Many farmers opportunistically downgraded to
participate in RPNs and deliver higher quality produce which further strengthened
ties and increased trust with regional buyers. Regional lead firms have also not shown
any commitment in terms of making asset specific investments, but they do not
enforce stringent demands on RPN farmers because of less stringent regional
standards. Most RPN farmers are located in regions of higher agricultural potential
and faced with frequent bio-physical hazards. They are able to cope with
environmental changes and engender trust, a situation which GPN farmers are not
able to accomplish.
LPN farmers subsist mostly on arms-length relationships and receive no support from
brokers (their end buyers) or horizontal actors. Thus, they have weak ties and poor
network architecture, low levels of trust in brokers and struggle to cope with bio-
physical hazards. Local farmers state they have power struggles with brokers
especially in negotiating for better prices.
These factors of re-environmentalization are critical building blocks to unpack how
upgrading occurs across farmers in GPNs, RPNs and LPNs. I unpack the relationship
between upgrading and re-environmentalization in Chapter 6. In the next section, I
discuss governance, the second pillar of GPN/GVC analysis and a key determinant of
upgrading.

218
5.3 Exploring Complexity, Codifiability and Capabilities across farmers
participating in global, regional and local production networks
This thesis offers an alternative lens to study governance through farmer perspectives.
Rather than understanding governance from the reference point of the lead firm, i.e.
how lead firms govern the chain and their suppliers, I unpack how farmers experience
governance- using complexity, codifiability and capabilities. I reveal the dynamic and
heterogenous nature by which farmers in GPNs, RPNs and LPNs, de-codify complex
tasks, spelling out the difference in their capabilities. Overall GPN and RPN farmers
have better capabilities and ability to de-codify complex tasks, while LPN farmers,
due to weak ties, get far less support and are unable to enhance their capabilities.
The first section lays out high and low complex tasks that farmers in global, regional
and local production networks need to adhere to, while the second -section details the
de-codification and capabilities required by these farmers to perform complex
transactions, and also highlights how they are indeed dynamic. I primarily draw on
chapter 2, section 2.3 where I have re-conceptualized these terms.
5.3.1 Factors shaping governance: Unpacking Complexity
Complexity of transactions relates to the degree of sophisticated knowledge and
information transmitted between buyers and suppliers to be able to comply with a
transaction. When considering the farmer, as an entry point into the PN, complexity
will be linked to product specifications found in certifications, codes of conduct and
standards set by international or regional retailers. In the Kenyan case, GlobalGAP,
Organic, TescoNature and M&S Farm to Fork are the most commonly adhered to
sustainability standards, which consist of good agricultural and environmental
practices. Since farmers have intrinsic ties to their natural environment for sustenance,
be it income, livelihoods, attachment or bequest, they would perform certain
environmental practices to promulgate sustenance of their natural environment.

219
Hence, when comprehending complexity of transactions from a farmer reference
point, it is critical to consider that farmers would find some of the tasks of low
complexity because they may be better known and closer to indigenous practices. Other
tasks of high complexity, being more exogenous and having possibly been encountered
by farmers only because they sell to regional or international lead firms (and otherwise
may have stayed unknown to the farmer).
I draw on good agricultural and environmental practices to create a list of 39 tasks.
Many of these tasks overlap with various control points (hazard analysis critical
control point) in sustainability standards, while others are present in code of conducts
for companies or expert manuals of research institutions. To classify these complex
GAP tasks as low or high complexity, ranking exercises were carried out with
agricultural actors (4* agricultural officers, 3* area officers, 2* farmer group leaders, 20
farmers). These actors listed all tasks that were indigenously performed by them (and
they continue to practice them while being part of GPNs or RPNs as well), which I
classified as low complexity. The more exogenous tasks that arose purely because they
had to comply with lead firm requirements in GPNs or RPNs were classified as high
complexity tasks.
Table 5.9, below, identifies 17 low complexity tasks. These are primarily liked to crop
management practices of composing manure, organic waste, intercropping and tilling;
application and storage of chemicals and post-harvest maintenance. Interviews with
GPN and RPN farmers suggested that these tasks were part of agricultural practices
they had been doing for many years and thus did not find it difficult to comply with
(Interviews: #1-5kf, GPN/RPN farmers).
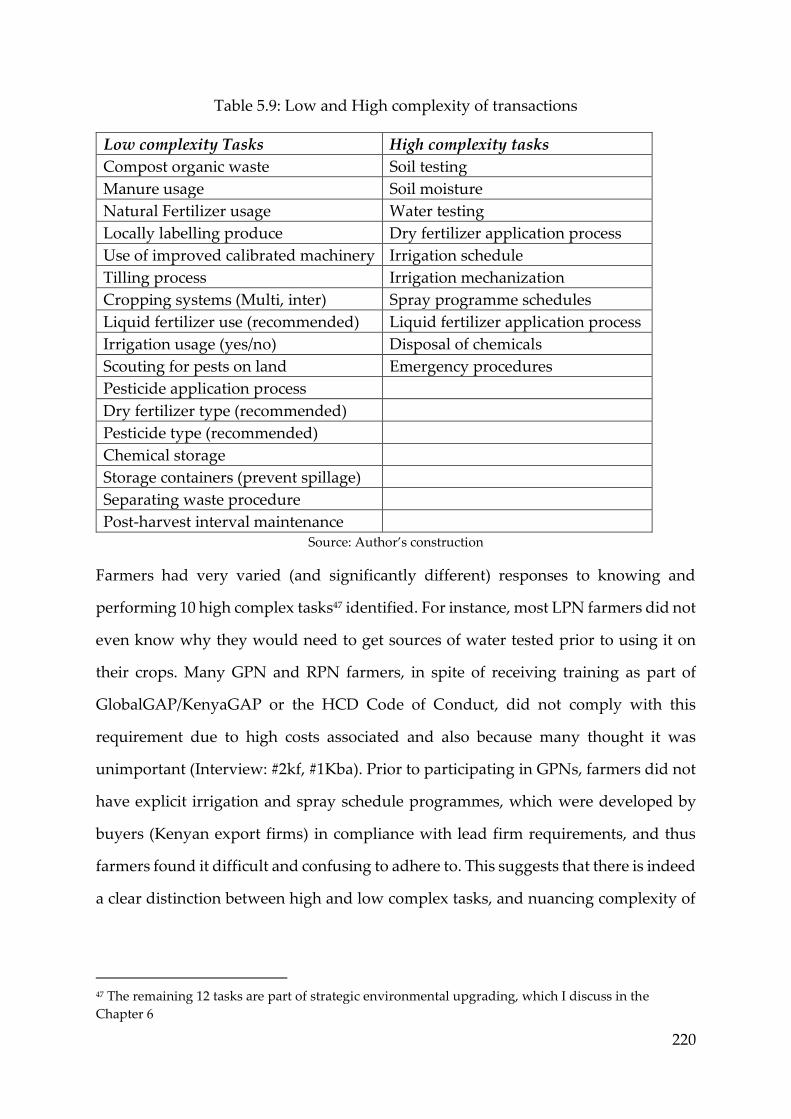
220
Table 5.9: Low and High complexity of transactions
Low complexity Tasks High complexity tasks
Compost organic waste Soil testing
Manure usage Soil moisture
Natural Fertilizer usage Water testing
Locally labelling produce Dry fertilizer application process
Use of improved calibrated machinery Irrigation schedule
Tilling process Irrigation mechanization
Cropping systems (Multi, inter) Spray programme schedules
Liquid fertilizer use (recommended) Liquid fertilizer application process
Irrigation usage (yes/no) Disposal of chemicals
Scouting for pests on land Emergency procedures
Pesticide application process
Dry fertilizer type (recommended)
Pesticide type (recommended)
Chemical storage
Storage containers (prevent spillage)
Separating waste procedure
Post-harvest interval maintenance Source: Author’s construction
Farmers had very varied (and significantly different) responses to knowing and
performing 10 high complex tasks47 identified. For instance, most LPN farmers did not
even know why they would need to get sources of water tested prior to using it on
their crops. Many GPN and RPN farmers, in spite of receiving training as part of
GlobalGAP/KenyaGAP or the HCD Code of Conduct, did not comply with this
requirement due to high costs associated and also because many thought it was
unimportant (Interview: #2kf, #1Kba). Prior to participating in GPNs, farmers did not
have explicit irrigation and spray schedule programmes, which were developed by
buyers (Kenyan export firms) in compliance with lead firm requirements, and thus
farmers found it difficult and confusing to adhere to. This suggests that there is indeed
a clear distinction between high and low complex tasks, and nuancing complexity of
47 The remaining 12 tasks are part of strategic environmental upgrading, which I discuss in the
Chapter 6

221
transactions has implications on farmers’ ability to de-codify and the capabilities
required to adhere to the tasks in question across PNs.
5.3.2 De-codification and Capabilities
This section delves into the learning mechanisms, internal and external knowledge
required to complete with high and low complex tasks, and attempts to highlight the
dynamic nature of de-codification and capabilities across each category of farmers,
suggesting that participating in a particular network has a significant bearing on these
variables.
The problem with Codification
Many GPN farmers reported difficulties with understanding how to de-codify tasks,
especially those of high complexity. GlobalGAP has a wealth of documents (manuals,
excel checklists) that attempt to codify every control point so that they can be applied
in a standardized format. Interviews with business associations and standards
implementers intimated that codification was meant to increase compliance rates and
reduce crop rejections (Interviews: #1Ndonor, #1Kba, #1Ndonor). However, GPN
farmers complained that complicated record keeping and demand on the types of
quantities of chemicals to be used was a key deterrent in compliance, causing
exclusion from participating in GPNs (Interview: #1kngo, #2kngo), as one certified
trainer from an NGO explained:
“Standards are always normative. They cannot be best explained by words on
paper. They need to be explained face to face and through experience... Farmers
don’t always have the highest amount of literacy to keep such detailed records
for traceability ... so they just give up” (Trainer NGO: #2kngo).
Furthermore, while codifying documents for the standard, farmers and other local
actors are not consulted. Thus, it is not a participatory process, but rather a top-down
imposition of tasks. GPN farmers interviewed stated that they fail to comprehend

222
various demands of the standards and codes of conduct. A representative of a
business association explained:
“We [local actors, especially farmers] need to be more involved. We need to be
consulted to make sure that we can develop standards that can actually be
implemented... that will be beneficial to farmers’ growth and income earning”
(Business association: #1Kba).
Various horizontal actors (e.g. NGOs, county government extension officers, business
association, KARLO trainers) stressed the importance of a shared cooperative
approach to converting normative standards to more prescriptive ones, that should
also include farmer experiences, so that it can be easily understood and implemented.
Thus, as Gertler (2003) states, there is a need to ‘bring the local back’ so as to increase
efficiency of uptake of codified knowledge. The high attrition of GPN farmers (on an
average less than 5 years) from selling to Kenyan export firms suggests their inability
to secure certification is not only because it is expensive, but also because it is difficult
to understand. As one manager from a Kenyan export company stated:
“I have taught these farmers the same IPM [ integrated pest management] three
times... and they still make mistakes... I cannot afford to monitor every single
one of my farmers... I have over 500 in this region... They just do not want to
listen because they think that it is too hard and unnecessary” (Extension officer
Interview: #3kef)
Overall, this suggests that even though standards are expected to be ‘highly codified’
due to the vast availability of manuals, videos and other resources, i.e. as Kogut (1993)
puts it ‘making codes alienable’, it appears that the lack of adapting codes restricts the
accumulation and acquisition of knowledge by farmers, and does not propagate
‘alien-ability’. Improper or flawed codification appears to be a systemic issue within
the GPN, as it reproduces contestations and power asymmetries, impacting the type
of knowledge transfer and know-how. Inefficient codification constrains the efficacy

223
of de-codification, which can potentially exclude farmers from participating in export
markets.
De-codification and Capabilities of GPN, RPN and Local farmers
Considering farmer epistemologies, there is a need to nuance conventional
understandings of codification, by focusing on how farmers de-codify information
and knowledge, in order to continue participating in global or regional production
networks. The capabilities required to de-codify tasks is described in Chapter 2,
Section 2.3.3. Recapping briefly, it can be ‘internal’ (as passive experiences or trail by
error, which are broadly classified as tacit forms of knowledge, with no explicit
transfer) or ‘external’ (related to know-how diffusion between buyers and suppliers,
which are broadly involve explicit forms of knowledge).
This thesis goes further by delving deeper into the internal – external spectrum of
knowledge, nuancing the spectrum into 4 types of learning processes - encoded,
embodied, embrained and embedded at individual and collective levels. This section
will compare and contrast each of these components across diverse PNs and elucidate
the dynamic nature of de-codifiability of tasks and capabilities in this context. Its key
finding is that internal forms of knowledge are equally important to external forms of
knowledge across the board. Importantly, the accumulation and appropriation of
internal knowledge did not reduce the power asymmetry and exploitative nature of
the relationship between GPN farmers and their buyers. On the other hand, the
situation is much more positive for RPN farmers, as they are shown to have absorptive
capacity to internalize knowledge, better than GPN and LPN farmers.
GPN farmers
Despite the difficulties in performing and understanding high complexity tasks, my
research suggests there exists a high level of internal (tacit) knowledge. This was
especially so because about 95% of the respondents had historically been farmers or
involved in farming activity from a young age. This enabled them to garner

224
considerable know-how when it came to performing environmental tasks on their
farms, and were thus able to accumulate tacit knowledge, as Polanyi (1966) puts it
‘experiential knowledge’.
Accumulating tacit knowledge benefitted farmers as it made them ‘more marketable’
compared to farmers in other East African countries. A farmer group leader explained:
“They [ European lead firms] choose us over Uganda… even though we have
same soil and weather conditions... because we produce better quality products
and have the capability.... we are even chosen by Ugandans, who buy
expensive fruits and vegetables from us... so we are better than our neighbours”
(Farmer 1, in #3kf).
As I point out in Chapter 2, Ernst and Kim (2002) suggest that the accumulation of
tacit knowledge could prevent against exploitation of actors with less power and can
impact the distribution of power within a network. However, this was not the case for
a majority of the GPN farmers interviewed and surveyed. Despite having substantial
tacit knowledge and participating in GPNs, farmers were not able to significantly
change their ‘positionality’ in the network. This could be attributed to both low
switching cost of changing suppliers and to the low network stability (low ascribed
and earned trust) in relationships. In sum, revealing a conundrum that accumulating
tacit knowledge is critical to participating in GPN while at the same time it does not
necessarily make the participation less exploitative.
Table 5.10 below illustrates that less than 23% of overall tasks involved purely internal
sources or embodied knowledge, while 77% of the tasks occur with external
knowledge. Thus, most of the knowledge was a combination of encoded (through
manuals) as well as embedded and embrained, through direct transfer mechanisms
(such as face to face interactions in the field and in classrooms), replications (learning
from someone who has been taught face to face or from demonstration farms) and
imitating other farmers (Interview: #1Kba). In terms of know-who, re-embedding in
225
new markets and networks has gained GPN farmers strong network architecture and,
thus, substantial support from vertical and horizontal stakeholders. Both vertical and
horizontal stakeholders are increasingly investing in export promotion activities),
thereby cementing their commitment to specific regions from which they source
produce (i.e. firms territorially embed into regions).
Curiously, despite having high levels of tacit knowledge, especially in low complex
tasks, the data shows that many farmers had to re-learn low complex tasks through
external forms of knowledge in order to ensure that they performed them up to buyer
requirements. One GPN farmer expressed the process of re-learning:
“There are some things I know how to do better for my land... The officer
showed me to compost... but I know better what mix is best for my soil... I have
used for years... “(Farmer: #1kGPN).
This elucidates the contested nature of de-codification, which impacts the uptake of
knowledge. A few intermediaries (brokers) and horizontal stakeholders did not
completely thwart the use of tacit knowledge. Some stakeholders, especially in Meru
and Murang’a counties, affirmed the importance of tacit knowledge, especially
embedded and embodied. They suggested it reduced the overall costs and improved
the internalization of knowledge by farmers. One county agricultural officer
explained:
“For some tasks, I let the farmer decide what is best... They have been doing
this for many years... Sometimes my boss gets angry with me when I do that...
but these farmers are my friends and I know that they know what is good”
(County agricultural officer: #6kcgov).
This suggests that local actors deemed internal (tacit) knowledge as very relevant and
to be used along with codified knowledge, showing that all codified knowledge
cannot be implemented successfully without tacit inputs. This also highlights a way
to circumvent what I argue in Chapter 2 as the stickiness of knowledge (Johnson et al

226
2002) by adapting codes to suit local contexts. Furthermore, this also brings to light
the important role of intermediaries and horizontal actors in effectively codifying
transactions and providing greater insight into the agency of farmers. Similar results
on the importance of intermediaries were found by Kadarusman and Nadvi (2013) for
the Indonesian garment sector.
Table 5.10: Learning sources for GPN farmers
Capability
classification
Human
source of
learning
Learning
process
Learning
mechanism
% share of
learning
(low
complexity
tasks)
% share of
learning
(high
complexity
tasks)
Internal Self Embodied Personal
experience
22.76
(1.03)
3.64
(0.79)
External Community
-friends/
family
Embedded,
embodied
Imitation,
face to face,
spillover
4.49
(0.44)
2.98
(0.41)
External Vertical
-famer
group/co-
operative
-lead firms
-Kenyan
exporters
-brokers
and agents
Embedded,
encoded,
embrained
Face to
face,
replication,
pressure of
compliance
20.60
(1.34)
18.56
(0.98)
External Horizontal
actors
-NGOs
-county
agricultural
extension
officers
-business
associations
-education
institutes
Embedded,
encoded,
embrained
Direct
transfer:
face to face,
replication,
manuals
13.00
(1.04)
14.02
(0.75)
Source: Author’s construction from survey data

227
The accumulation and transfer of tacit as well as codified knowledge was most
commonly seen to occur within farmer groups. For instance, in many cases vertical
and horizontal stakeholders would only train representatives of farmer groups and
these representatives were told to teach other group members. Some well-functioning
farmer groups appeared to have benefitted from the accumulation of tacit knowledge
because cohesive ties enabled the passing of fine grained knowledge so that all group
members could learn new practices. In many top-down farmer groups, women were
often left out of the ‘loop’ in the sense that information and knowledge was not
transferred to them. Thus, they would have to depend on their embodied knowledge
or embedded knowledge through imitation and replication from friends or family
members. In sum, the functioning of a group was conditioned not only by top-down
or bottom-up relationships between groups and other actors in production networks,
but also by individual relationships of members within the group (Interview: #4kf).
Ultimately, the reception of external forms of knowledge depends significantly on the
cost of knowledge transfer. With most GlobalGAP training schemes being donor or
lead-firm funded, Kenyan exporters and associations are dependent on funds they
receive to carry out training. This means that the cost of transfer of knowledge needs
to be carefully monitored and automatically excludes many GPN farmers who are not
organized (Interview: #1Kba, #1Ndonor, #1kngo). This careful scrutiny of costs
automatically marginalizes farmers who have weaker network architecture and who
imbue low levels of earned trust in their buyers.
Overall, it appears that both internal and external forms of knowledge are important,
but GPN farmers seem to use and receive more external knowledge. Most high
complexity tasks, and a large share of even low complexity tasks, are driven by
external knowledge. The main learning processes include embedded, encoded and
embrained though direct transfer, replication and imitation. Due to participating in a
GPN, they appear to have considerable support from vertical and horizontal actors to
deliver external knowledge, thereby enabling them to de-codify complex transactions.

228
RPN farmers
The capabilities gained and de-codification of tasks for RPN farmers is different from
that of GPN farmers, primarily because RPN farmers can utilize internal knowledge
without it being contested by regional lead firms. Table 5.11 explicates that almost 40%
of low and high complexity tasks are accomplished using internal knowledge, or
embodied forms of learning process. This suggests that RPN farmers, despite having
to adhere to regional codes of conduct, have more freedom to perform tasks using the
knowledge that they already possess (thus they have higher levels of network stability
compared to GPN farmers). Consequently, many of the requirements of regional
supermarket private standards or national codes of conduct (HCD) were stripped
down versions of GlobalGAP and were less stringent than global ones.
But it was not just the lower levels of stringency that led to higher use of internal (tacit)
forms of knowledge. The most important factor relates to the fact that almost 40% of
RPN farmers in the sample chose to chain downgrade from selling to Northern
markets and begin selling into RPNs. Thereby, they ‘carried over’ good agricultural
practices into RPNs, and thus ‘spilt over’ what they learnt. Therefore, knowledge
leakage due to spillover from personal experience is identified as a learning
mechanism that leads to acquisition and accumulation of tacit knowledge. This made
the process of de-codification relatively easier and demanded less external
knowledge, as explained by one regional farmer:
“Now that I don’t sell to exporters, I feel it is easier to understand the HCD
code. I just use what I learnt there... I know my crop is good because I use good
practices” (Farmer: #12kRPN)
The quote explicates that RPN farmers have higher absorptive capacity, i.e. they can
absorb and internalize knowledge better and convert it into tacit forms more
efficiently. Thus, most of the knowledge they are able to use now is tacit or embodied
in nature, suggesting the benefits of conversion of explicit to tacit knowledge.

229
Table 5.11: Learning sources for RPN farmers
Capability
classification
Human source
of learning
Learning
process
Learning
mechanism
% share of
learning
(low
complexity
tasks)
% share of
learning
(high
complexity
tasks)
Internal Self Embodied Personal
experience
from
spillovers
21.25
(1.81)
17.90
(1.26)
External Community
-friends/
family
- GPN
farmers
Embedded,
embodied
Imitation,
face to
face,
spillover
7.84
(0.76)
1.69
(0.47)
External Vertical
-famer
group/co-
operative
- Kenyan
supermarkets
Embedded,
encoded,
embrained
Face to
face,
replication,
spillover
7.12
(0.98)
10.11
(0.88)
External Horizontal
actors
-NGOs
-county
agricultural
extension
officers
-business
associations
-education
institutes
Embedded,
encoded,
embrained
Face to
face,
replication,
spillover
19.06
(1.52)
15.02
(1.06)
Source: Author’s construction from survey data
The data also reveals that most RPN farmers surveyed reported that they would
‘proactively’ seek different sources of support. Many frequently visit agricultural
officers and try to maintain good relationships with agro-vets (Farmer interviews:
#29kRPN, #33kRPN), which are captured in the relatively strong network
architectures RPN farmers have. They have also maintained strong ties with
horizontal stakeholders, especially business associations, county agriculture officers

230
and education institutions (e.g. KARLO), thus almost 34% of training is provided to
them by horizontal stakeholders. This unearths another key characteristic of RPN
farmers, which is their ’entrepreneurial’ nature, because not only did they
opportunistically downgrade from participating in GPNs, but they also continued to
re-embed into networks with good quality ties and increased stability.
The combination of downgrading, opportunistic behaviour, spillovers and
entrepreneurial capacity enabled RPN farmers to de-codify tasks differently to GPN
farmers, and accrue better capabilities incurring lower overall costs. Overall Table 5.10
highlighted a 60:40 split in learning processes between internal and external forms of
knowledge, very different from the approximately 75:25 spilt for GPN farmers.
This is not to say that all RPN farmers shared similar levels of capabilities and de-
codifiability. About 40% of the farmers who entered regional production networks,
previously sold into local markets and thus had relatively low levels of internal
knowledge especially related to high complexity tasks. Thus, the risk of
marginalization from RPNs was increasingly prevalent if farmers could not conform
to buyer requirements or HCD Code of Conduct, as one farmer explains:
“I thought I would have a better life if I sold to Nakumatt, but it is difficult...
They want this and that … and, if I don’t give them what they want, they reject
my product and I am left with nothing” (Farmer: #38kRPN).
This implies that exclusion from selling into RPNs could also occur, especially keeping
in mind the burgeoning stringency of regional standards as the regional supermarket
share increases. Reardon et al. (2003) also observe similar issues relating to
marginalization and exclusion.
Overall, the results for RPN farmers suggest that there is an almost equal split between
internal and external forms of knowledge. Yet RPN farmers’ increased ability to
internalize and re-use knowledge (i.e. the absorptive capacity) enables many of them
to de-codify complex transactions efficiently.

231
Interestingly, absorptive capacity (theoretical details in chapter 2 section 2.2.3) varies
significantly for GPN, as compared to RPN, farmers. RPN farmers have higher
absorptive capacity because of their proactive nature, high intensity of effort and
better ability to acquire skills. Despite GPN farmers having more support from
horizontal and vertical actors and stronger ties, many have struggled with
internalizing knowledge. This has been aptly described by a member of a farmer
group:
“If the exporter leaves, .... would I continue to do what they taught me... no...
why should I? .... they will not buy from me.... I will not spend the extra money”
(Farmer 2, #3kf).
About 68% of GPN farmers surveyed mentioned that they would not continue to use
good practices that they were taught, suggesting that there are heterogeneous
differences between export and RPN farmers. Thus, even though the intrinsic link
between farmers and their environment provides them with a high tacit knowledge
base, the absorptive capacity and the implementation of knowledge differs across
farmer categories.
LPN farmers
LPN farmers have over 62% of their learning processes in embodied forms
(individual-tacit), which they learnt through experience over the course of being a
farmer, as depicted in table 5.12. This highlights an important fact that even though
tacit knowledge is critical, it clearly does not provide sufficient capabilities for farmers
to be able to participate in GPNs or RPNs. Local farmers have not had to perform high
complexity tasks before and, therefore, lacked know-how and know-what, as these
tasks were relatively exogenous to them.

232
Table 5.12: Learning sources for local farmers
Capability
classification
Human
source of
learning
Learning
process
Learning
mechanism
% share of
learning (low
complexity
tasks)
% share of
learning
(high
complexity
tasks)
Internal Self Embodied Personal
experience
42.09
(1.09)
19.88
(0.75)
External Community
-friends
-GPN
farmers
Embedded Imitation,
face to
face,
spillover
8.21
(0.52)
3.23
(0.41)
External Horizontal
actors
-NGOs
-county
agricultural
extension
officers
-business
associations
-education
institutes
Embedded,
encoded,
embrained
Direct
transfer:
face to face
16.72
(1.31)
9.96
(0.77)
Source: Author’s construction from survey data
LPN farmers also struggle with ‘know-who’, thus impairing their ability to acquire
capabilities especially those related to high complexity, as expressed by one farmer:
“I do not know who to ask for help… When I ask the agriculture officer they
tell me to go and form a group and then they will help me learn all the pest
management.... I don’t know how I can form a big group” (Farmer: #17kLPN).
About 12% of LPN farmers learn via knowledge leakage and imitation from GPN
farmers in close proximity, and from friends, thus learning collectively though
embedded processes. Only a small portion, 27%, of LPN farmers received support
from horizontal stakeholders, re-enforcing the poor network ties and relationships
(network architecture) these farmers have relative to export and RPN farmers. The
lack of horizontal stakeholder support, especially from the state, is of critical

233
importance. With much of the support and resources spent on export oriented
markets, this curtails the growth of domestic markets.
Interviews with LPN farmers shed light on the difficulty of entering into GPNs or
RPNs. LPN farmers cited that when they attempted to approach export farmer groups
to become members, they were usually not allowed to join because they did not
already have knowledge on the standards requirements. This implies that close-knit
groups prevent market entry and form additional market entry barriers for local
farmers (#1kf, #3kf, #5kf).
5.3.3 Summary of de-codification and capabilities
In sum, figure 5.5 illustrates the internal to external knowledge spectrum. GPN
farmers were closer to the external end, with support from horizontal and vertical
stakeholders. RPN farmers were somewhat in the middle of the spectrum, with about
40% of internal knowledge and 60% external. Local farmers were situated closer to the
internal end. Thus, farmers participating in different end markets draw on different
forms of knowledge and learning. The results indicate that, although tacit knowledge
is important, it is not a sufficient condition to be able to de-codify complex tasks.
Consequently, it suggests that use of internal (tacit) knowledge is less important than
external (explicit) knowledge when it comes to GPNs, compared to RPNs and LPNs.
This means that Northern lead firms discount local knowledge, considering it
inappropriate. This leads to questions about whether replacing tacit with codified
knowledge would be a sustainable process of, and what the implications would be
for, upgrading. I discuss this in the next chapter.
Overall, it appears that the process of de-codification of tasks and acquisition of
capabilities is dynamic and non–linear, changing with buyer requirements and
because of the different ways in which farmers re-environmentalize. But it is not only
dynamic across global, regional and local production networks, but heterogeneous
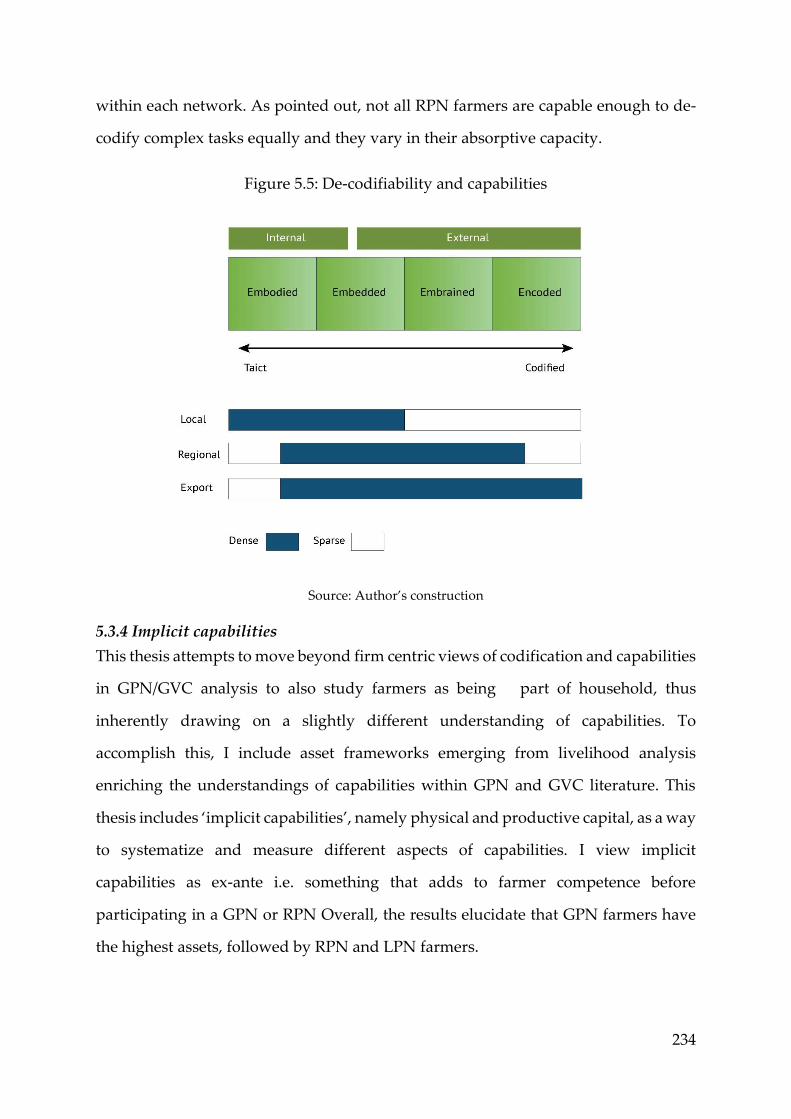
234
within each network. As pointed out, not all RPN farmers are capable enough to de-
codify complex tasks equally and they vary in their absorptive capacity.
Figure 5.5: De-codifiability and capabilities
Source: Author’s construction
5.3.4 Implicit capabilities
This thesis attempts to move beyond firm centric views of codification and capabilities
in GPN/GVC analysis to also study farmers as being part of household, thus
inherently drawing on a slightly different understanding of capabilities. To
accomplish this, I include asset frameworks emerging from livelihood analysis
enriching the understandings of capabilities within GPN and GVC literature. This
thesis includes ‘implicit capabilities’, namely physical and productive capital, as a way
to systematize and measure different aspects of capabilities. I view implicit
capabilities as ex-ante i.e. something that adds to farmer competence before
participating in a GPN or RPN Overall, the results elucidate that GPN farmers have
the highest assets, followed by RPN and LPN farmers.

235
In the survey, farmers were asked whether they possessed physical or productive
capital in terms of owning a house, TV, radio, computer, mobile, electricity, toilet, car,
motorbike and bicycle. I also include education as part of implicit capabilities, rather
than within codification. Lam (2000) contends that the education system is
characterised by abstraction and an academic orientation only generates a specific
perspective of knowledge. This can be narrow, highly specialised and may lack real
world problem-solving skills. This research indicates that almost all farmers had the
same level of education, with most achieving up to form 4 (secondary education) and
interviews stated that school education did not gear them up to learn skills, rather
they learnt much more on the job (similar to Polanyi’s idea of experiential learning).
Less than 1% of farmers reported to have gone to university where they specialized in
agricultural studies, which they claimed was useful but could not replace on-the job
experience (Farmer interview: #17kLPN, #25kLPN).
Table 5.13 shows that, in general, GPN and RPN farmers have very similar physical
and productive assets i.e. almost equal ex-ante capabilities and competence before
participating in GPNs or RPNs. Table 5.13 illustrates very similar levels of owning a
house, radio, mobile, car, motorbike and bicycle. The main assets on which they
diverge are electricity and internet accessibility, which were owned and used more by
GPN farmers. Various studies have shown that electrification and internet use enables
farmers to participate in global markets (e.g. Dannenberg and Lakes, 2013).
Table 5.13 Physical, productive and social capital
Farmer category LPN (% who
own or have
access to the
asset)
RPN (% who
own or have
access to the
asset)
GPN (% who own
or have access to
the asset)
Education (number)
None 2.30 1.39 2.85
Form 1 51.72 48.61 37.40
Form 2 21.84 33.33 28.46
Form 4 15.33 13.89 21.95
Diploma/
Graduate
8.43 2.78 9.35

236
Above
graduate
0.38 0.00 0.00
Own house 82.38 93.06 95.53
TV 10.34 9.72 28.46
Radio 36.02 56.94 67.48
Computer 0.77 0.00 4.07
Mobile 80.84 79.17 80.33
Internet 5.36 9.72 17.07
Electricity 18.77 34.72 47.56
Car 1.15 6.94 4.88
Motorbike 3.07 11.11 13.01
Bicycle 18.39 25.00 28.86
toilet private (if no
shared)
48.66 62.50 67.07
Implicit capabilities:
index
0.263
(0.011)
0.336
(0.023)
0.411
(0.014)
Source: Author’s construction from survey data
Similar to the index created in table 5.3 (using methodology found in Appendix 10),
the implicit assets are combined to form an implicit capabilities index (as shown in the
last row of table 5.13). The index ranges from 0 to 1, with again 0 = no assets, while 1=
highest number of assets with relation to the sample. This shows that GPN farmers
have more assets (0.411) compared to RPN (0.336) and LPN (0.263). These results are
at par with other Kenyan studies that have compared GPN to local farmers (e.g.
McColloch and Ota, 2002) and RPN with local farmers (e.g. Rao and Qaim, 2011),
suggesting farmers who have higher implicit (ex-ante) capabilities tend to have a
higher probability of being a GPN or RPN farmer. Capitalization via implicit
capabilities is seen as important as it encapsulates the lack of infrastructural facilities
and public good availabilities, balancing the dearth lumpy asset investment.
5.4. Concluding Remarks
To my knowledge, this thesis is one of the first to attempt to quantify and flesh out re-
environmentalization and governance across production networks. In this chapter, I
explore the concept of re-environmentalization and develop indicators that are
condensed into unit-less scores to compare across GPN, RPN and LPN farmers.
Furthermore, I use complexity, codifiability and capabilities as separate explanatory
237
variables to enable unpacking of the dynamic and heterogeneous nature of each across
farmers in global, regional and local production networks. The epistemological shift
provides agency to less powerful actors such as farmers, and explains how they
experience governance. This helps answer the ‘to what extent’ as well as the ‘how’
questions. The aim of this chapter is to answer the research sub-question of: How do
the environmental dimensions of embeddedness and governance vary across farmers
participating in global, regional and local production networks? Indeed, I find that these
environmental dimensions vary significantly.
In terms of embeddedness, clearly farmers re-environmentalize into GPNs and RPNs
dynamically and heterogeneously. I find that GPN farmers have mostly experience
type 2 re-environmentalization and to some extent show characteristics of type 1,
while RPN farmers are closer to type 1, meaning that the transition is smoother for
RPN farmers. This is mainly because strong de-environmentalizing forces prevail that
prevent de-localization of ascribed trust or the creation of earned trust between GPN
farmers and lead firms. Despite GPN farmers having strongest ties in terms of density,
intensity, and quality, they frequently have contentions with global buyers because of
the vastly different practices required within GlobalGAP and private standards (e.g.
Tesco Nature) as compared to the local practices and societal norms which they used
to follow. This has caused conflicting rationalities especially related to the trade-off
between income maximization and conservation of the environment. GPN farmers
unanimously echoed that climate variability and extremes worsened their social
relations, as it caused quality loss and hampered those meeting contractual
obligations. The social relations are weakened further due to the ‘precarious
positionality’ of GPN farmers, wherein they could not bargain for better terms of trade
or contest the high rejection rates of their crops or even demand fairer prices; whilst
at the same time, for the sake of livelihood sustenance, many would unwillingly
cooperate by attempting to develop a consensus culture. Thus, GPN farmers are very

238
‘precariously’ inserted into networks with relatively strong architecture but which are
highly contentious, with low trust and low flexibility.
RPN farmers seem to re-environmentalize smoother than GPN farmers, despite
having only intermediate ties. This suggests that the Granovetterian notion (1973,
2005) of the strength of weak ties is at play. Firstly, because of farmers downgrading
from GPNs and switching to regional markets, there occurred a ‘spillover’ of good
practices learnt and a re-appropriation of previous vertical and horizontal
relationships. Moreover, RPN farmers were seen as entrepreneurial as they manage
to look for new ties and consolidate previous ones. Unlike GPN farmers, RPN farmers
have higher levels of earned and ascribed trust, more ability to bargain for better terms
of trade and much more freedom from their buyers (regional supermarkets) to choose
the crops to grow and the quantity to produce. RPN farmers seem to have developed
socio-ecological relationships with their environment that are free from struggles with
regional buyers, which helps them conserve their environment. In terms of territorial
fluid embeddedness, RPN farmers claimed to be effected by bio-physical hazards, but
due to their relative ease of re-environmentalization into RPNs, they were not always
as adversely affected as GPN farmers.
In terms of governance factors, the results provide a prime example demonstrating
the importance of internal (tacit) knowledge and focusing on the need to use it
symbiotically to de-codify complex tasks. The results show that, despite all farmer
categories having a relatively high level of internal knowledge, there were
heterogeneous differences in the way each of these farmers de-codified high and low
complex tasks. Most knowledge used by GPN farmers was external (embrained and
embedded), which they learned through direct transfer (face to face interactions) from
vertical and horizontal stakeholders. For GPN farmers, less than 26% of overall tasks
involved purely internal learning or embodied knowledge, while 74% of the tasks
occurred with external learning. Thus, most of the knowledge was a combination of
encoded (through manuals) as well as embedded and embrained, through direct
239
transfer mechanisms (such as face to face interactions in the field and in classrooms),
replications (learning from someone who has been taught face to face or from
demonstration farms) and imitation of other farmers.
At the opposite end of the spectrum are LPN farmers, who mostly rely on internal
(embodied and embedded) forms of learning, and get minimal support from
horizontal stakeholders. They mostly rely on spillover knowledge leakages and
imitation to perform tasks of high complexity. RPN farmers seem to have an almost
equal combination of internal and external knowledge with about 40% of internal
learning and 60% external. Furthermore, the study reveals that RPN farmers have
greater absorptive capacity, displayed by a greater intensity of effort and
internalization ability compared to GPN or LPN farmers, because they carry forward
good environmental practices post downgrading. This suggests possible cognitive
differences between these farmers, which will be fleshed out further in the next
chapter.
Another important issue that surfaces is the lack of adaptation of codes to local
contexts, which can be viewed by farmers as ‘flawed’ forms of codification and
‘wrong’ kinds of knowledge. Thus, because global lead firms discount the sticky
nature of knowledge, several GPN farmers struggled to meet and perform tasks, and
several contestations arose between farmers and buyers, making de-codification more
difficult. The lack of addressing this issue in several cases increased overall transaction
costs, reducing overall efficiency. The inability to de-codify tasks has trickle down
effects, in terms of impacting upgrading opportunities. It also prompted Kenyan
export companies to leave specific regions to find other capable suppliers bases, in
sum causing marginalization from participating in the GPN.
Overall, de-codification of tasks and acquisition of capabilities emerges as a dynamic
process, that depends on the changing buyer requirements and the type of production
network (given these networks are buyer-driven). Another reason fuelling the

240
dynamic nature of de-codification is that it is effected by processes of re-
environmentalization, which varies across farmers. Changing market structures,
network, societal conditions and ecological relationships clearly impact the process of
farmer learning.
An important caution must be invoked while performing a comparative analysis. For
instance, strong and weak ties, re-environmentalization, and ability to de-codify tasks
are all endogenous factors that need to be studied in a relative sense. Thus, the results
are sector, network and actor specific. It is difficult to develop objective measures that
can be used across all sectors and actors, an issue that could be considered in future
research.
Taken together, the degree of re-environmentalization (network architecture, network
stability, territorial fixed, territorial fluid), complexity, codifiability and capabilities
are inherently dynamic and heterogonous across export, regional and local farmers. I
explore these dynamic factors as key determinants of environmental upgrading, and
study the ways in which they impact farmers’ ability to environmentally upgrade in
the next chapter While some literature (e.g. DeMarchi et al., 2013a, b), Khattar et al.,
2015, Poulsen et al., 2016) has attempted to unpack the determinants of a traditional
North-South type of environmental upgrading, this thesis seeks to build on that work
by providing a comparative analysis across all three types of production networks,
thereby moving beyond the North-South distinction. Additionally, it also attempts to
quantitatively measure the ‘the extent’ to which these variables impact the choices of
farmers to environmentally upgrade, thereby enabling a more lucid comparison.

241
6. Unpacking environmental upgrading and its links to embeddedness
and governance of Kenyan horticulture farmers in global, regional
and local production networks
6.1 Introduction
While research has focused on economic and social upgrading, environmental
upgrading and its trajectories have received much less attention, more so when trying
to fine tune what it means to farmers. Furthermore, even less mixed method analysis
has been carried out on the key determinants of re-environmentalization and
governance which shape environmental upgrading, and how it differs across global,
regional and local production networks. This chapter seeks to fill these gaps by
answering the fourth research sub-question of: Do Kenyan horticultural farmers
participating in global, regional and local production networks environmentally upgrade
heterogeneously and to what extent do embeddedness, codifiability and capabilities affect
environmental upgrading? I will draw primarily on literature from Chapter 3, that lays
the theoretical foundations of this empirical chapter.
This chapter is structured in three main sections. Within the first section, I answer the
first part of the research sub-question on whether farmers environmentally upgrade
heterogeneously in GPNs, RPNs and LPNs. I begin by unpacking the dynamic and
contested trajectory of low complexity product and process environmental upgrades
(LCEPP), high complexity product and process environmental upgrades (HCEPP) and
strategic environmental upgrading (SEU) across farmers in global, regional and local
PNs. Thereby debunking the assumption in GPN/GVC literature that upgrading is a
positive development I then proceed to reveal the conditions under which
environmental upgrading and downgrading occur and how they are linked to
economic and social upgrading/downgrading. I elucidate the benefits of economic
downgrading, especially for RPN farmers, ultimately suggesting that it is a ‘blessing’
rather than a ‘curse’ for environmental upgrading. In section 6.3 onwards, I answer
the latter part of the research question related to the links between environmental
upgrading, embeddedness (re-environmentalization) and governance. The trajectory
242
of environmental upgrading across GPN, RPN and LPN farmers is also dynamically
influenced by the factors of ease of re-environmentalization along with the differing
levels of de-codifiability, complexity and capabilities. I do this using a sequential
econometric model that aids in asserting the different extents to which re-
environmentalization, governance variables and other controls (including economic
and social upgrading) affect environmental upgrading across farmers in each PN.
Finally, section 6.4 provides a discussion and summary of the chapter.
6.2 Environmental upgrading across farmers in GPNs, RPNs and LPNs
This thesis defines environmental upgrading as: ‘a process by which actors modify or
alter production systems and practices that result in positive (or reduce negative)
environmental outcomes’, as explained in Chapter 3. This definition has two parts:
the tasks or upgrades to be performed and the environmental outcomes of doing the
upgrades. I discuss the former part of the definition in this chapter, before addressing
the environmental outcomes in chapter 7. I attempt to empirically elucidate the
varying types and levels of environmental upgrading in the next section.
6.2.1 Low and High complexity product and process environmental upgrading
In chapter 3, I identify three types of environmental upgrading. The first is
environmental process upgrading, which is defined as the reorganization of production
systems or use of superior technology that leads to greener processes or an increase in
efficiency of the production process. The second is environmental product upgrading,
which involves a move to sophisticated and environmentally-friendly product lines.
Environmental upgrades seem to be driven either through EU or Kenyan regional
supermarkets standards, which vary in their stringency, or are driven by mentoring
(when standards are less defined and/or visual), such as relationships between some
regional supermarkets and local buyers with RPN and LPN farmers respectively.
Since it is difficult to dis-entangle product and process upgrading, this thesis suggests
distinguishing environmental upgrading on the basis of complexity of upgrades (See
Chapter 3, section 3.1.2 for a more detailed discussion on the reasons for
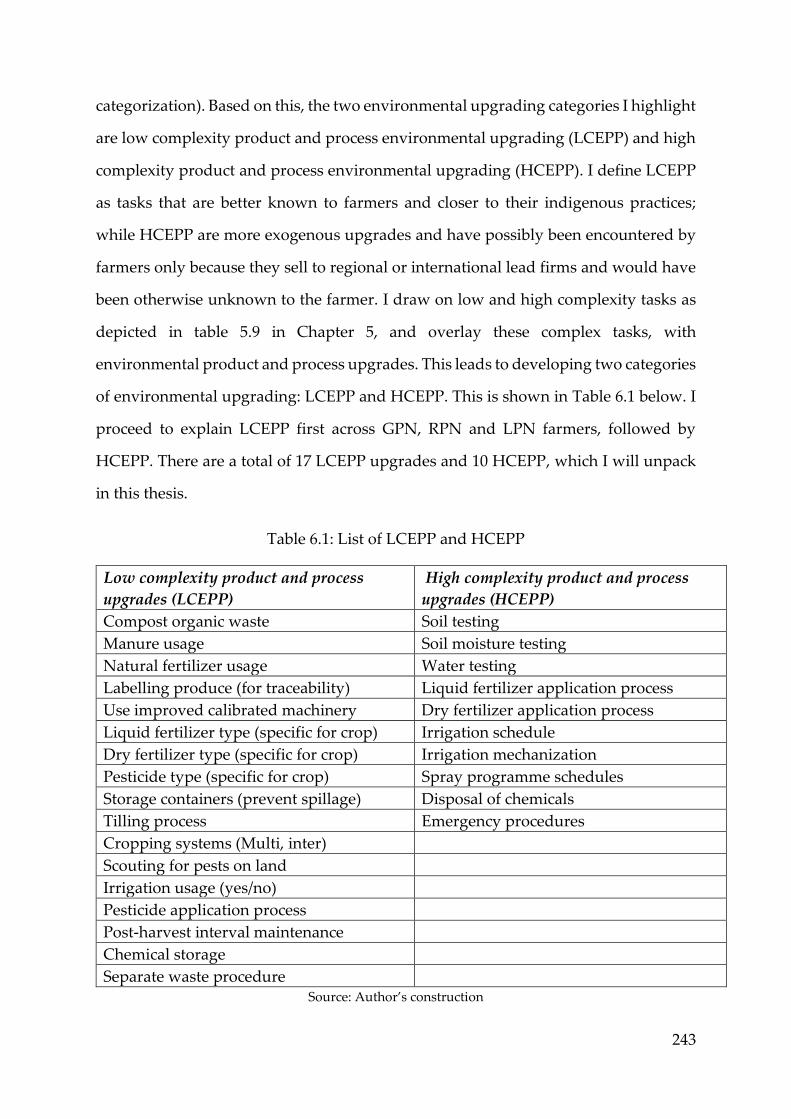
243
categorization). Based on this, the two environmental upgrading categories I highlight
are low complexity product and process environmental upgrading (LCEPP) and high
complexity product and process environmental upgrading (HCEPP). I define LCEPP
as tasks that are better known to farmers and closer to their indigenous practices;
while HCEPP are more exogenous upgrades and have possibly been encountered by
farmers only because they sell to regional or international lead firms and would have
been otherwise unknown to the farmer. I draw on low and high complexity tasks as
depicted in table 5.9 in Chapter 5, and overlay these complex tasks, with
environmental product and process upgrades. This leads to developing two categories
of environmental upgrading: LCEPP and HCEPP. This is shown in Table 6.1 below. I
proceed to explain LCEPP first across GPN, RPN and LPN farmers, followed by
HCEPP. There are a total of 17 LCEPP upgrades and 10 HCEPP, which I will unpack
in this thesis.
Table 6.1: List of LCEPP and HCEPP
Low complexity product and process
upgrades (LCEPP)
High complexity product and process
upgrades (HCEPP)
Compost organic waste Soil testing
Manure usage Soil moisture testing
Natural fertilizer usage Water testing
Labelling produce (for traceability) Liquid fertilizer application process
Use improved calibrated machinery Dry fertilizer application process
Liquid fertilizer type (specific for crop) Irrigation schedule
Dry fertilizer type (specific for crop) Irrigation mechanization
Pesticide type (specific for crop) Spray programme schedules
Storage containers (prevent spillage) Disposal of chemicals
Tilling process Emergency procedures
Cropping systems (Multi, inter)
Scouting for pests on land
Irrigation usage (yes/no)
Pesticide application process
Post-harvest interval maintenance
Chemical storage
Separate waste procedure Source: Author’s construction

244
LCEPP upgrades across GPN, RPN and LPN farmers
Survey data shows (Table 6.1) that, in absolute values, farmers in GPNs, RPNs and
LPNs perform very similar levels of LCEPP. These tasks were part of familiar local
agricultural practices, which they had been following for many years (Interviews: #1-
5kf). Much of the LCEPP performed was due to the high degree of internal
knowledge (over 20%) possessed by farmers across all PNs. For instance, GPN, RPN
and local farmers reported that using organic compost and manure on their farms
enriched the soil. It was considered an indigenous good agricultural practice, for it
improved yield and provided natural resilience against pests. As explained by one
local farmer:
“We have always done it... It is in our blood as a farmer... My parents did it, my
friends and siblings do it... It is good for the soil...” (Farmer: #27kLPN).
Other LCEPPs such as maintaining a post-harvest interval and using appropriate
pesticides were seen by all farmers as inherently important to crop growth and
environment conservation. Therefore, farmers by their own initiative would attempt
to ensure they were following these. For instance, the increase in incidence of pests,
insects and diseases compelled farmers to rethink the types of pesticides they used, so
that they could reduce crop loss. Many farmers who previously used banned
pesticides switched to other alternatives that were more efficient, as explained by one
RPN farmer:
“I go to the agro-vet and ask about new pesticides that are good for my garden
peas... I want to have a good crop and not let it get destroyed by the new pests...
Uchumi [Kenyan supermarket] don’t want spots or mildew [garden pea
diseases]” (farmer: #21kRPN)
However, even though LCEPPs are performed by all farmers, the mechanisms of
executing them differ.

245
Table 6.2: Performance of LCEPP across farmers in GPNs, RPNs and LPNs.
LCEPP Local
farmers
(% of
local)
RPN
farmers
(% of
regional)
GPN farmers (%
of export)
Average
(% performing
LCEPP)
Compost organic waste 83.91 91.67** 95.12** 89.64
Manure usage 82.76 94.44** 86.59** 85.84
Natural fertilizer usage 58.62 68.89*** 49.84*** 59.11
Local labelling of produce 70.88 80.56*** 81.71*** 76.68
Use of improved
calibrated machinery
56.74 70.83** 70.33** 59.76
Tilling process 67.05 68.06 72.36 69.43
Cropping systems (Multi,
inter)
79.31 95.83*** 90.24*** 86.01
Liquid fertilizer use
(recommended)
37.16 62.50*** 63.01*** 51.30
Irrigation usage (yes/no) 51.34 79.17*** 81.30*** 67.53
Scouting for pests 74.71 90.28** 94.31** 84.97
Pesticide application
process
78.93 84.72** 86.18** 82.73
Dry fertilizer type
(recommended)
52.87 69.44*** 79.67*** 66.32
Pesticide type
(recommended)
47.89 68.06*** 71.95*** 60.62
Chemical storage 72.80 86.11** 90.65** 82.04
Storage containers
(prevent spillage)
66.05 73.33** 77.64** 70.63
Separating waste
procedure
54.41 69.44*** 80.49*** 67.36
Post-harvest interval
maintenance
82.38 95.83** 95.53** 89.64
Source: Author’s construction. *** significant at 1%, ** at 5% for Kruskal Wallis test (compared to local)
The results from Table 6.2 suggest that it was complicated for GPN farmers to perform
LECPP upgrades, as many had to ‘re-learn’ how to perform them, so as to meet the
prescriptive measures set by their buyers (Farmer: #1kGPN). Re-learning several
LCEPPs caused significant contestation between farmers and their buyers. For
instance, GPN farmers complained of changes in the cropping systems. Farmers in
regions of Nyanradua, Machakos, Murang’a and Meru would multi-crop or intercrop
their produce, as it would enhance soil Ph, and act as a natural pesticide (e.g. if onion
was grown as an intercrop) (Interview: #2kf, #3kf, #5kf). However, since participating

246
in a GPN, farmers were asked to grow crops in blocks instead which was an
inappropriate practice that would impinge on soil quality:
“By growing in blocks, I have no natural protection against pests. They
[Kenyan export companies] ask me to put yellow tape all around my block as
pests apparently do not like the colour... but I think it is their new favourite
colour... They come in dozens.... growing in blocks is just not good for my soil...
I do not understand why it is necessary” (Farmer: #23kGPN).
Interviews with GPN farmers demonstrated that the de-codification of LCEPP’s was
a source of struggle because buyer requirements prevented the use of local
interpretations of good environmental practices. The lack of cooperation between
network actors because of their varied rationalities, caused network instability by
lowering earned trust. Overall, this suggests that, performing LECPP’s was not a
straightforward task for GPN farmers.
RPN farmers seem to be performing almost similar levels of LECPP to GPN farmers,
striving to maintain quality of their products. Even though regional public and private
standards are currently evolving, they are yet to reach stringency or rigour of auditing
as Northern standards like GlobalGAP. For instance, Uchumi and Nakumatt
supermarkets standards are only partially written, while Chandarana’s is partially
visual or conveyed by mentoring through word of mouth (Interview: #kgov, #2kgov,
#3kgov, #6kcgov, #7kcgov, #4kf). Due to strong-intermediate ties, many RPN farmers
have inspired high earned trust in buyers, and are given the freedom to perform
LECPP’s the way they perceive to be optimum. This has led to a co-operative
relationship with little contestation (Interviews: #1kba, #1krs, #2krs, #3krs).
Finally, in absolute terms LPN farmers perform LCEPPs quite similarly to RPN and
GPN farmers. Yet, the low trust they have in brokers to give them better prices, and
the weak ties they possess, and the low level of support they receive from horizontal
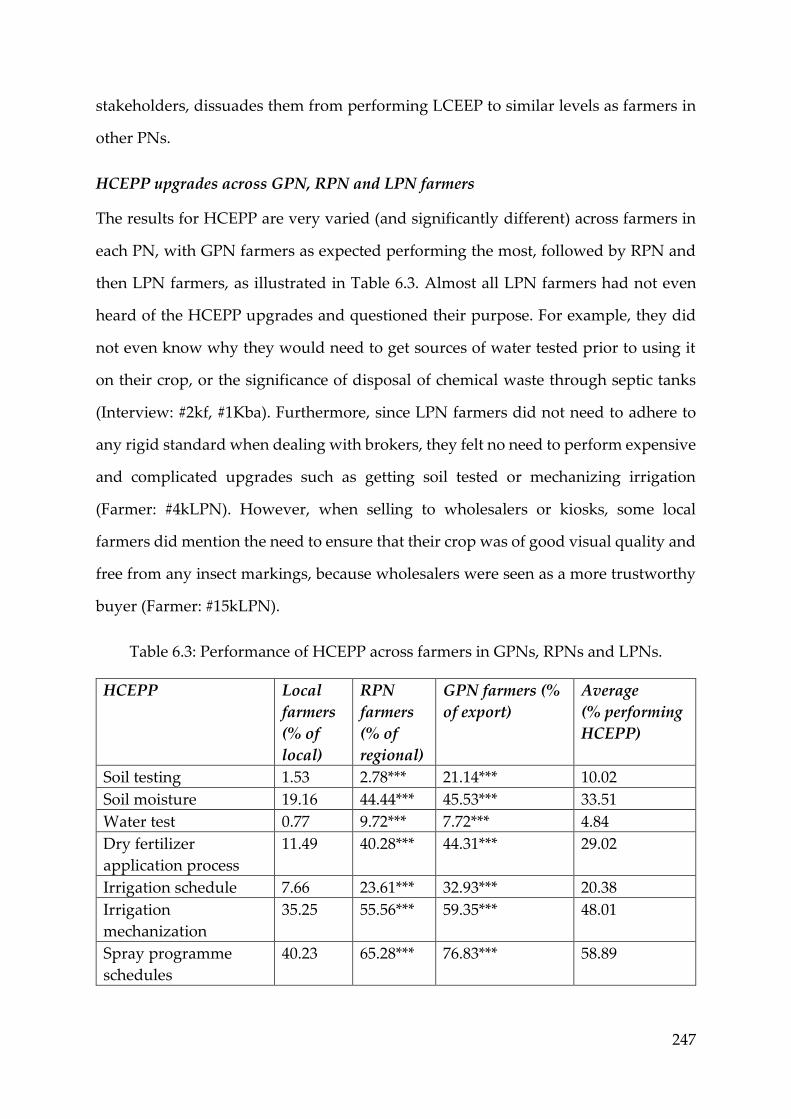
247
stakeholders, dissuades them from performing LCEEP to similar levels as farmers in
other PNs.
HCEPP upgrades across GPN, RPN and LPN farmers
The results for HCEPP are very varied (and significantly different) across farmers in
each PN, with GPN farmers as expected performing the most, followed by RPN and
then LPN farmers, as illustrated in Table 6.3. Almost all LPN farmers had not even
heard of the HCEPP upgrades and questioned their purpose. For example, they did
not even know why they would need to get sources of water tested prior to using it
on their crop, or the significance of disposal of chemical waste through septic tanks
(Interview: #2kf, #1Kba). Furthermore, since LPN farmers did not need to adhere to
any rigid standard when dealing with brokers, they felt no need to perform expensive
and complicated upgrades such as getting soil tested or mechanizing irrigation
(Farmer: #4kLPN). However, when selling to wholesalers or kiosks, some local
farmers did mention the need to ensure that their crop was of good visual quality and
free from any insect markings, because wholesalers were seen as a more trustworthy
buyer (Farmer: #15kLPN).
Table 6.3: Performance of HCEPP across farmers in GPNs, RPNs and LPNs.
HCEPP Local
farmers
(% of
local)
RPN
farmers
(% of
regional)
GPN farmers (%
of export)
Average
(% performing
HCEPP)
Soil testing 1.53 2.78*** 21.14*** 10.02
Soil moisture 19.16 44.44*** 45.53*** 33.51
Water test 0.77 9.72*** 7.72*** 4.84
Dry fertilizer
application process
11.49 40.28*** 44.31*** 29.02
Irrigation schedule 7.66 23.61*** 32.93*** 20.38
Irrigation
mechanization
35.25 55.56*** 59.35*** 48.01
Spray programme
schedules
40.23 65.28*** 76.83*** 58.89
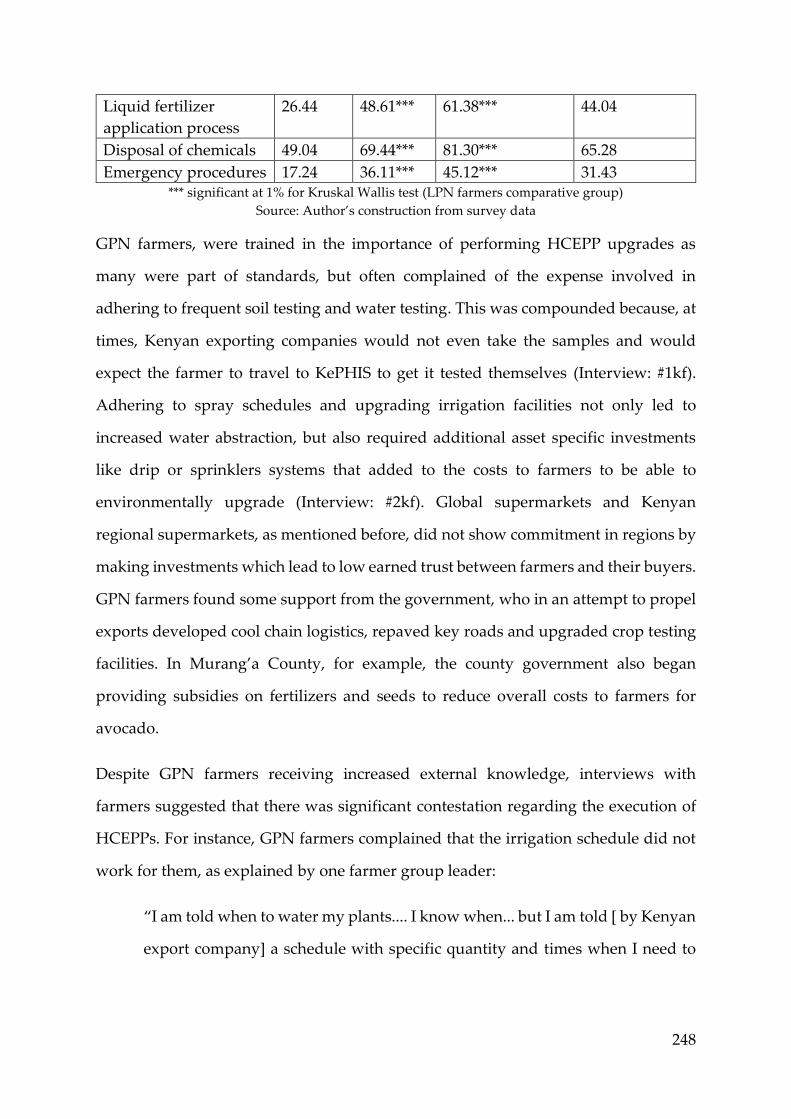
248
Liquid fertilizer
application process
26.44 48.61*** 61.38*** 44.04
Disposal of chemicals 49.04 69.44*** 81.30*** 65.28
Emergency procedures 17.24 36.11*** 45.12*** 31.43 *** significant at 1% for Kruskal Wallis test (LPN farmers comparative group)
Source: Author’s construction from survey data
GPN farmers, were trained in the importance of performing HCEPP upgrades as
many were part of standards, but often complained of the expense involved in
adhering to frequent soil testing and water testing. This was compounded because, at
times, Kenyan exporting companies would not even take the samples and would
expect the farmer to travel to KePHIS to get it tested themselves (Interview: #1kf).
Adhering to spray schedules and upgrading irrigation facilities not only led to
increased water abstraction, but also required additional asset specific investments
like drip or sprinklers systems that added to the costs to farmers to be able to
environmentally upgrade (Interview: #2kf). Global supermarkets and Kenyan
regional supermarkets, as mentioned before, did not show commitment in regions by
making investments which lead to low earned trust between farmers and their buyers.
GPN farmers found some support from the government, who in an attempt to propel
exports developed cool chain logistics, repaved key roads and upgraded crop testing
facilities. In Murang’a County, for example, the county government also began
providing subsidies on fertilizers and seeds to reduce overall costs to farmers for
avocado.
Despite GPN farmers receiving increased external knowledge, interviews with
farmers suggested that there was significant contestation regarding the execution of
HCEPPs. For instance, GPN farmers complained that the irrigation schedule did not
work for them, as explained by one farmer group leader:
“I am told when to water my plants.... I know when... but I am told [ by Kenyan
export company] a schedule with specific quantity and times when I need to
249
water... They don’t let me water it when it is dry....so I water them anyway. I
do not want them to die...” (Farmer: #24kGPN)
Thus, GPN farmers use some internal(tacit) knowledge, along with external
knowledge, which often causes struggles, as farmers claim to feel threatened that they
would be struck off the preferred supplier lists (Interview: #35kGPN). This sheds light
on a very important finding that, even in the face of struggles, low trust, network
instability and high-power asymmetry, HCEPP upgrades continue to take place.
Struggles are also seen when adopting GlobalGAP or global supermarket prescribed
pesticide spray and fertilizer application schedules. Most GPN farmers echoed that
spray schedules did not reduce pest and diseases attacks, and excess application of
fertilizers acidified the soil. This caused degradation, both in crop quality as well as in
quality of natural endowments, which strained ecological relationships farmers had
with their land. The difficulty to environmentalize into GPNs was a source of
contestation, and affected farmers’ ability and desire to perform HCEPP upgrades.
This means that executing HCEPP is a dynamic process, as it depends on farmers’
ability to negotiate for environmental priorities that abet developing co-operation in
a network and thus ease the process of re-environmentalization.
RPN famers appear to be performing almost similar levels of HCEPP to GPN farmers
(barring soil testing), even with lower support from horizontal (e.g. HCD, FPEAK)
and vertical stakeholders (regional supermarkets). This was because farmers who
opportunistically downgraded from GPNs to sell into RPNs, ‘spilt over’ knowledge
from GAPs, learnt during their time as GPN farmers, into regional markets. This
spillover process also helped to improve crop quality. They also maintained strong
ties with horizontal actors (e.g. county agricultural officers, KARLO experts) to ensure
they could be supported while selling to regional buyers. Furthermore, as discussed
in the previous chapter, their proactive, opportunistic and entrepreneurial ability
inculcates a higher intensity of effort and thus more effective internalization of

250
knowledge. This higher absorptive capacity enables them to perform HCEPP so close
to GPN farmers. In section 6.3.5 of this chapter, I quantitatively demonstrate
(simulate) an RPN farmers’ absorptive capacity levels vis-a-vis other farmers to
triangulate my findings.
In sum, Table 6.4 shows that, out of a total of 17 different LCEPP upgrades, GPN and
RPN farmers performed an average of 13 to 14, compared to only 11 performed by
local farmers. Similarly, in terms of HCEPP, GPN and RPN farmers performed 4-5
upgrades, while local farmers did less (2-3 upgrades from a possible 10). On the whole,
GPN farmers performed the highest number of total (LCEPP+HCEPP) upgrades -
18.42, compared to 17.43 for RPN and 13.16 for local.
Table 6.4: Comparing LCEPP and HCEPP environmental upgrades
Type of environmental
upgrading
Environmental
upgrades
(total number)
Local
(avg.
no.)
RPN
(avg. no.)
GPN (avg.
no.)
LCEPP 17 10.68
(0.160)
13.29***
(0.291)
13.57***
(0.144)
HCEPP 10 2.48
(0.102)
4.14***
(0.248)
4.85***
(0.140)
LCEPP + HCEPP 27 13.16
(0.234)
17.43***
(0.496)
18.42***
(0.257)
*** significant at 1% for Kruskal Wallis test Source: Author’s construction from survey data
This discussion has answered the research sub-question of: Do Kenyan horticultural
farmers participating in global, regional and local production networks environmentally
upgrade heterogeneously? It is demonstrated qualitatively that this is the case. Also,
triangulating the results quantitatively by performing the Kruskal Wallis test in Table
6.4 above reveals there are significant differences across mean LCEPP, HCEPP and
LCEPP+HCEPP upgrades. Clearly the trajectories of environmental upgrading are a
contested process for GPN farmers, while they are much smoother for RPN farmers.
As for LPN farmers, weak ties along with low trust, alludes to low performance.
Section 6.3 of this thesis will quantitatively asses how re-environmentalization and
governance (de-codifiability and capabilities) impact both LCEPP and HCEPP. By

251
doing so, I will not only triangulate my findings, but add more depth and nuancing
to the results, to gauge ‘the extent’ to which these factors impact environmental
upgrading by delving into which of the reasons are most significant (statistical and
qualitatively). Moving beyond LCEPP and HCEPP, a third form of environmental
upgrading -strategic environmental upgrading (SEU), which includes the bio-physical
aspect, has also been proposed by this thesis in Chapter 3, section 3.1.4. By accounting
for uncertain climate variability and shocks, farmers need to cope by ‘adapting’ to
climate stresses, so as to continue to participate in PNs and conserve their natural
environment. This thesis argues that the process of coping and adapting varies across
farmers in different PN’s. I explore this is greater depth in the following section.
6.2.2 Environmental upgrading: Strategic
This thesis defines strategic environmental upgrading as adaptations performed to
reduce or avoid damage i.e. going beyond compliance and showing environmental
cost leadership through stewardship, be it by improving biodiversity or increasing
use of renewables. I identify 12 strategic environmental upgrades, depicted in column
1 of Table 6.5. Each of these upgrades have various adaptation measures (for example,
water conservation strategic upgrade may entail either or all the following
adaptations - making ditches/water pads, roof top water collection, water tank
storage, underground pipes). Details about each strategic environmental upgrade and
its respective adaptation measure are present in the questionnaire (see Appendix 5).
These upgrades were selected based on consultation with agricultural experts and
focus group discussions with farmers (as set out in Chapter 4). These adaptations are
usually autonomous (controlled by the farmer), and differ in their spontaneity (can be
done in reaction, anticipation or concurrently with the hazard) or magnitude (can be
incremental which involves a small improvement, or disruptive (major mitigative
adaption) to avoid the hazard from causing environmental damage)
In this section, I explicate each of the adaptations, drawing on Chapter 3 (section 3.1.4),
table 3.1 for Kenyan farmers. The results in Table 6.5 demonstrate that farmers across

252
GPNs, RPNs and LPNs perform similar levels of SEU (last row of table 6.5), and the
Kruskal-Wallis test suggests there are mean differences in the process of performing
SEU’s across farmers in each PN.
Table 6.5: Level of strategic environmental upgrades

253
Strategic upgrades Characterization Type of characterization Local
(% of
local
farmers)
RPN
(% of
RPN
farmers)
GPN
(% of GPN
farmers)
Tree planting Spontaneity Anticipatory, reactive 85.82 88.89 90.24 Water conservation measure
(<2)
Magnitude Incremental 78.16 90.28 90.24
Water conservation measures
(>2)
Magnitude
Spontaneity
Incremental,
Anticipatory, concurrent 37.16 50.00 40.24
Water recycle Spontaneity: timing Anticipatory, reactive 8.43 18.06 13.01 Unseasonal rain measures (<2) Magnitude Incremental 57.09 61.11 67.07 Unseasonal rain measures (>2) Magnitude:
Spontaneity
Incremental
Anticipatory, concurrent,
reactive
18.77 23.61 34.55
Drought measures (<2) Magnitude Incremental 84.67 88.89 85.37 Drought measures (>2) Magnitude
Spontaneity
Incremental
Anticipatory, concurrent,
reactive
51.34 69.44 63.41
Delayed rains measures (<2) Magnitude Incremental 67.82 77.78 76.02 Delayed rains measures (>2) Magnitude
Spontaneity
Incremental
Anticipatory/ concurrent/
reactive
33.72 34.72 36.59
Biogas plant Magnitude Disruptive 2.68 2.78 2.85 Solar panels Magnitude Incremental 26.82 31.94 36.18 Strategic - Average number
Total :12
5.52 (0.142)
6.38*** (0.271)
6.36*** (0.143)
Source: Author’s construction from survey data

254
The findings show that about 35% of GPN farmers perform over two adaptations to
protect against unseasonal and delayed rains, compared to only 12% of RPN farmers.
This is because over 90% of GPN farmers claimed that climate variability and extremes
caused increase in pest and diseases incidences, forcing them to use more chemicals,
to maintain quality and crop yields, which in turn caused MRL difficulties, leading to
rejection and blacklisting. Interviews with GPN farmers also explicated that Kenyan
export companies would just ‘not source’ from regions that would perennially be
affected by floods or droughts and to a large extent they hold the farmer responsible
for not taking enough action on their land to minimize loss (Interview: #1kef, #3kef).
Thus, GPN farmers claimed they wanted to be ‘extra cautious’ because they did not
want their crop yield or quality to cause increased rejections or contract default, and
this provided them greater incentive to environmentally upgrade (Farmer Interviews:
#2kGPN, #3kGPN). This suggests that GPN farmers tend to perform many
adaptations in anticipation or concurrently, and not as many in reaction or post the
hazard.
The table also suggests that RPN farmers, seem to be performing almost similar
numbers of water conservation and drought measures to GPN and local farmers.
Water conservation includes water recycling by re-using water or chemical cleaning,
while drought measures include water harvesting, rooftop catchments, tank collection
and building trenches. Over 85% of the farmers sampled across each category did at
least one water conservation measure, and over 67% at least one drought measure.
But when it came to performing at least two or more, it seems that RPN farmers
performed equal or higher than both other sets of farmers. Interviews with RPN
farmers reinforced their desire to maintain good quality, and many also said it was a
matter of respect, given their growing importance in their community. They went on
to say that they had to ensure their farms ‘looked good’ even after a drought or flood,
so that community members would continue to regard them as important figures
(Farmer interview: #13kRPN, #16kGPN). This suggested that RPN farmers, like to
255
GPN farmers, also performed adaptations in anticipation or concurrently to the
hazard. The case for LPN farmers differed from GPN and RPN farmers, for two
reasons. First, in absolute magnitude, local farmers performed less SEUs across the
board compared to RPN and GPN farmers. The second reason was they would react
or concurrently perform adaptations, rather than in anticipation. Thus, they would
seek to reduce damage rather than avoid it.
The last column of Table 6.5 shows the average number of SEU’s performed, from a
possible 12. Farmers across LPNs, RPNs and GPNs performed between 5-7. This
shows that, at least in absolute value, the numbers performed are very close. This
similarity arose primarily because adaptations were usually incremental i.e. of lower
cost. The lack of support from vertical and horizontal actors and the rational limits of
SEUs were cited as a critical factor that caused this (Interview: #30kLPN, #4kcgov,
#2kcgov). In contrast, the differences between GPN, RPN and LPN was much starker
across LCEPP and HCEPP upgrades
Strategic environmental upgrades are unique because they elucidate some of the
rational limits of GPN farmers. For instance, GPN farmers were wary to perform
extensification of their farmland by cutting down trees, even if to increase commercial
area under SP or GP. This was because they claimed that trees act as natural wind
protectors, cool the overall temperature, provide natural shade and prevent flooding
from affecting crops. Therefore, they would want to continue to grow trees across their
plot boundaries and in areas where they feel it would be most beneficial (Interviews:
#2kf, #3kf). Thus, GPN farmers had an ‘implicit rational threshold’ of the volume of
trees they were willing to cut down for commercialization. Many also claimed they
did not receive adequate support to perform sustainable intensification (increase in
yield per unit of inputs) and were therefore unsure of how best to conserve the natural
environment and increase income simultaneously. In effect, these thresholds are
shaped by the process of environmentalizing into GPNs and the amount of internal
and external learning they appropriate.

256
Learning in Strategic environmental upgrading
SEUs involve a high degree of internal knowledge in embodied forms by virtue of
‘living in specific regions and understanding its peculiarities’ and ‘being a farmer’
(Farmer interview: #16kGPN, #18kGPN). The results in Table 6.6 suggest that, across
farmers in all PNs, between 70-85% of learning was obtained through individual
experiences. All farmers also discussed the importance of embedded knowledge from
the community they lived in, who would help each other in times of hazards.
About 15% of the learning for GPN farmers came from training conducted by
horizontal actors (mostly HCD county officers, NGOs like technoserve, CARE,
business associations –FPEAK and local educational institutions), compared to 13% of
RPN and 5% of local. As discussed in Chapter 1, despite National Environment
Management Authority (horizontal actor) having a climate change plan (Vision 2030),
it has yet to provide any tangible facilities such as training services or investing in the
regions with hazards (Interview: #4kcgov, #2kcgov). Even vertical actors did not
attempt to train or educate farmers on climate change planning or disaster
management, as it was not a mandatory requirement under private standards.

257
Table 6.6: Learning mechanisms for strategic environmental upgrading
Capability
classification
Human source of
learning
Learning
process
Learning mechanism LPN farmers
(% share of
learning)
RPN farmers
(% share of
learning)
GPN farmers
(% share of
learning)
Internal Self Embodied Personal experience 83.06 (2.76)
74.52 (1.64)
71.81 (0.96)
External Community
-friends/ family
Embedded,
embodied
Imitation, face to face,
spillover
11.63 (0.36)
12.78 (0.83)
13.32 (0.45)
External Vertical and
horizontal
-famer group/co-
operative
-exporters
-brokers and agents
-NGOs
-business
associations
Embedded,
embrained
face to face, replication,
pressure of compliance
5.43 (0.42)
12.71 (1.44)
14.81 (0.82)
Source: Author’s construction from survey data

258
The importance of SEUs should not be underplayed. SEUs are not completely
independent of codes of conduct or standards. For instance, within its code of conduct,
the HCD added a clause related to Force majeure or natural calamities, in an attempt to
ensure protection to the farmer i.e. to prevent them from being penalized because of
the losses from climate variability and extremes. Nevertheless, farmers across all PNs
raised a similar complaint that there was no financial support in terms of weather or
crop insurance, or infrastructure to reduce the devastation caused by extreme weather
(Farmer interviews: #24kGPN, #35kGPN, #1kf), causing economic downgrading in
terms of lower income generated.
This has ripple effects on socio-environmental outcomes. For instance, parts of
Murang’a and Machakos counties are frequently hit by droughts causing shortages in
drinking water. To be compliant with GlobalGAP, however, clean water has to be used
in crop production to prevent contamination. Thus, participating in GPNs reduced
availability of drinking water and thus the entitlements of basic needs (Farmer
interviews: #35kGPN, #37kGPN, #10kGPN). This demonstrates how a lack of
performing SEUs can cause social downgrading, supporting the argument that the
trajectories of upgrading across farmers in GPNs, RPNs and LPNs are not
straightforward. In sum, SEUs are important because they have trickle down effects on
economic and social upgrading.
Overall, it appears that SEU’s are driven by the process of re-environmentalization
and need to be executed complementarily with LCEPP and HCEPP in order to
optimally environmentally upgrade. However, SEUs are certainly different from
LCEPP and HCEPP as they rely more on indigenous, and internal knowledge, rather
than external. I further explore how re-environmentalization and capabilities impact
SEU in section 6.3.4, through an in-depth quantitative analysis.
Looking across all environmental upgrades, it appears that GPN farmers generally
perform the most overall environmental upgrades, followed by RPN and local

259
farmers, but the process of executing environmental upgrades is dynamic and non-
linear and is affected by multiple factors, which in some cases have also caused
economic and social downgrading. In the next section, I deepen understandings of
environmental upgrading/ downgrading and the links with economic and social.
6.2.3 Economic and social upgrading/downgrading and the relationship with
environmental upgrading/downgrading
Environmental upgrading is intrinsically linked to economic upgrading and social
upgrading, and cannot be studied in isolation. In this section, I plan to flesh out the
interdependent links and see where environmental upgrading is ‘positioned’ with
respect to economic and social upgrading - does it lead or follow or occur
simultaneously? Do economic and social upgrading act as enablers to environmental
upgrading? The trajectories of upgrading are not linear. For instance, I find that
farmers can economically downgrade while socially and environmentally upgrading.
Alternatively, they can they can economically and socially upgrade while
environmentally downgrading. In this section, I plan to first briefly explain key
economic and social upgrades/downgrades and elucidate the links to environmental
upgrading. I explicate the relationships between the three qualitatively and
quantitatively in depth in Section 6.3 of this chapter.
In this thesis, I examine economic upgrading through three ways: process standards
such as GlobalGAP, HCD or other private global/regional standards; product,
depicted through unit prices and value addition attained through product
sophistication; and finally, functional upgrading proxied by strategic diversification
involving simultaneously participation in multiple PNs.
Economic process upgrading: standards
The key global standards (primarily GlobalGAP, but Tesco Nature and M&S Farm to
Fork, Organic) were adhered to by about 62% of all GPN farmers, while about 15%
followed the HCD Code of Conduct (as depicted in Table 6.7). In the case of RPN

260
farmers, approximately 74% of all farmers took up the HCD Code of Conduct or
followed regional private standards
Table 6.7: Economic process upgrading - Standards and certifications
Farmer
category
Standards (and certifications) (% of each farmer category)
None Visual HCD/ Regional
private
Global
standards
HCD and global
Local 48.16 34.21 17.62 0.00 0.00
RPN 13.89 11.11 73.61 1.39 0.00
GPN 5.28 8.70 15.77 62.11 8.13
Total 39.21 11.23 32.30 13.82 3.45 Source: Author’s construction from survey data
While the HCD Code of Conduct increased formalization of regional markets, farmers
often commented that a code of conduct was not ‘sufficient’ to develop regional
markets, as it only focused on quality, production technique and traceability rather
than there being any Kenyan business associations to provide infrastructural support
(Interview: #1kf, #3kf). Many regional supermarkets also echoed this thought saying
that the HCD primarily made investments in export counties that benefited GPN
farmers, and has not been instrumental in developing the regional market. This
expansion of regional markets has been attributed to the Kenyan private sector
(Interview #1krs)48. In Table 6.7, the visual category refers to farmers who adhere to
only visual requirements, such as size, colour and shape. Over a third of local farmers
fall into this category, followed by about 11% and 8% of RPN and GPN respectively.
Taking into account network architecture and stability, the process of re-
environmentalization and the ability to de-codify upgrades, suggests that adhering to
a standard is not always an ‘upgrade’. This clearly becomes visible in the GPN farmer
case, where adhering to a code of conduct or global standards that enforces using
specific types of pesticides, growing in blocks, excessive use of fertilizers and
48 There is one exception in Murang’a where the county government (Maragua constituency), has tied
up with Alcando group from the Netherlands to set up an avocado processing plant for oil that goes
into soaps, shampoos and other cosmetics, which require low quality avocados. It thereby provides
an opportunity for regional and local farmers to sell to alternate buyers.

261
ineffective spray schedules, which has caused environmental downgrading.
Therefore, economic upgrading can indeed lead to environmental downgrading in
GPNs.
Economic product upgrading: Product sophistication
Economic product upgrading is explained through product sophistication achieved
by value addition, and changes in unit prices. There are several ways in which farmers
can improve their product, including cleaning, sorting and grading. Over 80% of GPN
and RPN farmers perform some type of value addition, as illustrated in table 6.8. The
majority of local farmers performed nothing in this regard, because they believed it
would not translate into better prices (Farmer interview: #5kLPN), whilst almost 44%
of GPN farmers performed cleaning as well as grading49.
Table 6.8: Value addition- Economic product upgrading
Economic
upgrading/
downgrading
Economic upgrading and
downgrading
LPN
(%)
RPN
(%)
GPN
(%)
Total
(%)
Value addition
None 68.97 19.44 16.26 40.41
Cleaning and sorting 14.56 41.67 23.17 21.59
Grading 7.28 18.06 17.07 12.78
All value additions 9.20 20.84 43.49 22.45
Source: Author’s construction from survey data
Despite performing these value additions to the product, GPN farmers claimed the
absolute value of value addition is quite low. GPN farmers gained 3% of total base
price when performing all value additions in snow peas, and about 2-2.5% in mangoes
and avocados (Interview: #1kf, #3kf). RPN farmers gain 2% of base price on snow peas,
mangoes and avocados, when performing at least two or more value additions.
Interviews with regional supermarkets suggest that a 2% increase in price is more like
49 Grading is the highest form of VA performed by farmers (in very rare cases large farmers also
package their products before selling to the exporter) in this study, because it requires asset specific
investments, in terms of setting up grading sheds and stores, as well as training farmers to discern
subtle differences in quality (Interview: #2Kao, #4Kao).
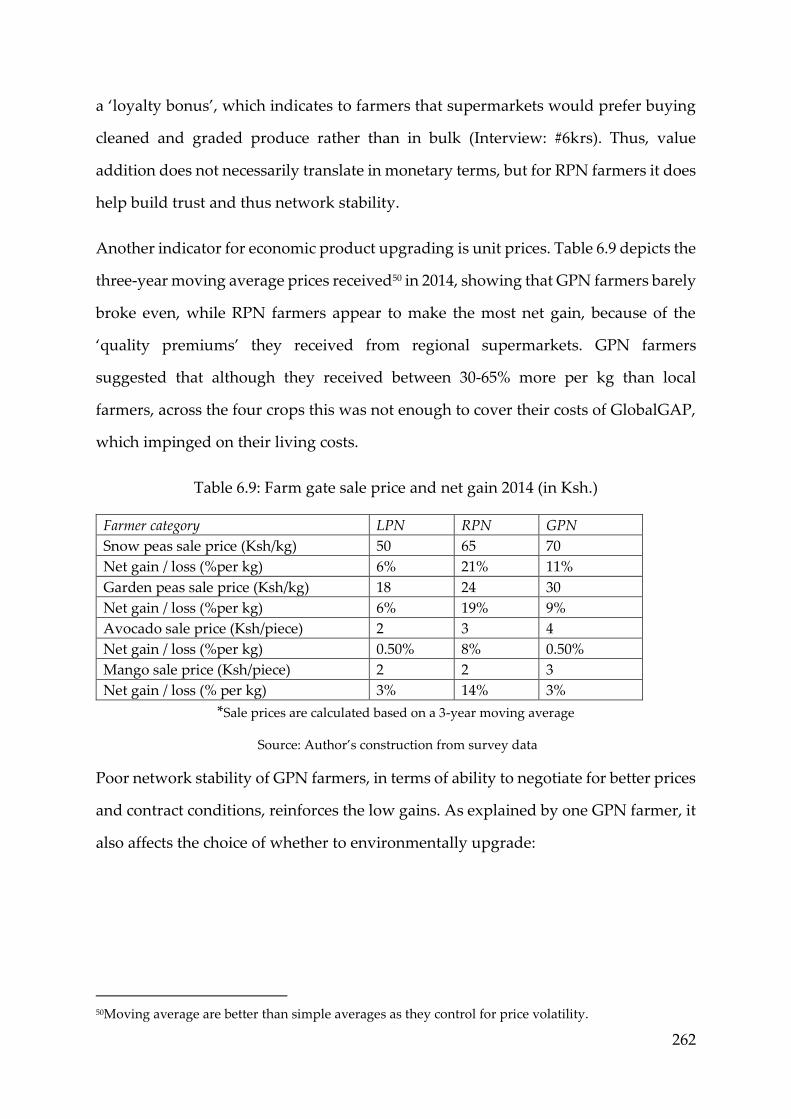
262
a ‘loyalty bonus’, which indicates to farmers that supermarkets would prefer buying
cleaned and graded produce rather than in bulk (Interview: #6krs). Thus, value
addition does not necessarily translate in monetary terms, but for RPN farmers it does
help build trust and thus network stability.
Another indicator for economic product upgrading is unit prices. Table 6.9 depicts the
three-year moving average prices received50 in 2014, showing that GPN farmers barely
broke even, while RPN farmers appear to make the most net gain, because of the
‘quality premiums’ they received from regional supermarkets. GPN farmers
suggested that although they received between 30-65% more per kg than local
farmers, across the four crops this was not enough to cover their costs of GlobalGAP,
which impinged on their living costs.
Table 6.9: Farm gate sale price and net gain 2014 (in Ksh.)
Farmer category LPN RPN GPN
Snow peas sale price (Ksh/kg) 50 65 70
Net gain / loss (%per kg) 6% 21% 11%
Garden peas sale price (Ksh/kg) 18 24 30
Net gain / loss (%per kg) 6% 19% 9%
Avocado sale price (Ksh/piece) 2 3 4
Net gain / loss (%per kg) 0.50% 8% 0.50%
Mango sale price (Ksh/piece) 2 2 3
Net gain / loss (% per kg) 3% 14% 3%
*Sale prices are calculated based on a 3-year moving average
Source: Author’s construction from survey data
Poor network stability of GPN farmers, in terms of ability to negotiate for better prices
and contract conditions, reinforces the low gains. As explained by one GPN farmer, it
also affects the choice of whether to environmentally upgrade:
50Moving average are better than simple averages as they control for price volatility.

263
“Now I no longer care about my trees [avocado trees] as much... only 1-2 Ksh...
even after spraying and cleaning ... why should I do all this if it gets me peanuts
[low prices]? “(Farmer: #5kLPN).
Many GPN farmers echoed similar sentiments, suggesting that they stopped applying
expensive buyer recommended fertilizers and pesticides, effected by environmentally
downgrading. This suggests that economic upgrading is intrinsically linked to
environmental upgrading and can cause environmental downgrading.
Economic upgrading: Strategic diversification
Strategic diversification involves selling opportunistically to multiple end markets.
About 36% of the GPN farmers surveyed claimed to be simultaneously selling to both
global and regional supermarkets (as illustrated in Table 6.10). Interviews with GPN
farmers suggested that they sold opportunistically due to high rejection levels, low
trust in Kenyan export firms and poor unit prices. By selling produce to other buyers
such as local brokers and regional supermarkets, they were able to recoup their costs
of production and make profits (Farmer interviews: #1kf, #1kGPN, #2kGPN).
Table 6.10: Strategic diversification and simultaneous selling
Economic
upgrading/
downgrading
Strategic diversification and
simultaneous selling
Local
(%)
RPN
(%)
GPN
(%)
Total
(%)
Strategic
diversification
Only 1 seller (no
diversification)
74.33 59.72 30.89 54.06
Diversified to brokers 24.90 20.83 35.77 29.02
Diversified to another final
buyer*
0.77 19.44 28.05 14.68
More than 2 buyers 0.00 0.00 5.28 2.25
*regional supermarket or specific wholesaler or green grocer
Source: Author’s construction from survey data
Opportunistic selling to multiple end markets impinged on the earned trust between
GPN farmers’ and Kenyan export firms. Many Kenyan export companies to just ‘left’

264
regions, because of increased malfeasance created by GPN farmers due to contractual
default. One export company extension officer explains:
“without tight controls, farmers use our seeds and pesticides and then sell to
our rivals... even if they have signed a contract with us... this makes us unhappy
and of course we will not trust them again” (Kenyan firm sourcing officer:
#3krs)
Kenyan export companies ‘leaving’ regions caused several issues within communities.
For instance, some farmers feel ‘cheated’, as they have been wrongfully penalized for
the mistakes of others. Consequently, increased outbreaks of violent behaviour have
been reported within communities especially in Nyandarua (Kinangop, Kipipiri) and
Machakos (Mwala and Kagundo) due to loss of access to Northern markets (Farmer
interviews: #21kRPN, #33kRPN). Clearly, opportunistic selling has negative effects on
communities, which in turn effects processes of societal and network embeddedness.
RPN farmers are also diversified, with Table 6.10 showing that 40% sell to specific
green grocers as well as others brokers. Multiple N farmers asserted that it was only
after they strategically diversified from GPNs did they feel they could downgrade and
start supplying only to regional supermarkets. The exorbitant costs of production for
Northern markets, high entry barriers and low bargaining power forced several
farmers to downgrade. However, many farmers spilt over the GAPs they learnt, and
thus continued to perform environmental upgrades as evidenced by the very similar
number of environmental upgrades performed by RPN and GPN farmers.
The results suggest that different combinations of economic and environmental
upgrading and downgrading occur simultaneously, alluding to the fact that
upgrading is a dynamic process that requires careful negotiation across an array of
variables to achieve common goals. In section 6.3, I will further nuance the link
between economic and environmental upgrading across farmers in each PN, stating

265
to what extent they differ and which economic upgrades most significantly impact
environmental upgrading.
Social upgrading
In this thesis, I use the proxy social upgrading by membership in farmer groups, and
health and safety activities. I have attempted to study the less measurable aspects of
social upgrading, namely empowerment which is proxied through increased respect
within farmer communities.
Farmer groups
In this thesis, I have already described two types of farmer groups. The first is bottom-
up, which are formed by locals to pursue common goals for the benefit of the group.
In chapter 5, section 5.2, I show that bottom-up groups generally promote performing
environmental upgrades because they are cohesive groups with strong ties and high
earned and ascribed trust. The second type of farmer group is top-down, which are
formed by Kenyan export firms or village leaders exclusively for the purpose of
inserting into GPNs. However, these groups are not cohesive, lack bargaining power
and usually do not last if the Kenyan export company stops sourcing from them.
Therefore, performing environmental upgrading is contingent on GPN participation.
Farmers in top-down groups stated that they did not feel they could bargain for better
terms within contracts or prices due to low collective power. This suggests
membership in a farmer group may or may not always be a social upgrade or lead to
environmental upgrading.
Health and safety
The two key requirements essential to health and hygiene are washing hands and
wearing protective clothing, which prevents contamination of the plant material,
improves personal cleanliness and reduces chances of sickness due to chemicals
(Interview: #1Kba). Several training sessions were held for GPN farmers related to
personal hygiene and safety, by FPEAK, NGOs (Care, Technoserve) and extension

266
officers. Despite this however, only 62% of GPN farmers adhered to it, compared to
51% of RPN and 37% local farmers. There appear clear links to environmental
upgrading, especially because farmers are protected against allergies and respiratory
issues caused by potent dry and liquid chemicals (farmer: #12kRPN).
Enabling rights (entitlements)
In terms of providing enabling rights, GPN farmers received leadership training from
Northern lead firms, with an aim to empower them (Interview: #3kNGO). Some
farmers reported that, since participating in a GPN, community members and village
leaders (who were not part of the GPN) not only respected them more, but were also
more supportive to them (Interview: #2kf). Thus, the changing structure of society,
after embedding into GPNs, actually created positive social upgrading intangibles.
Some of these GPN farmers also believed themselves to be ‘environmental stewards’
and would try and teach other farmers ways to improve productivity and care for
their farm (Interviews: #4kf).
Farmers also elucidated that performing better environmental practices (upgrading)
could help them improve the quality of their life (health –) as a GPN farmer explained:
“My children get sick often...so if I do good practices... the crop is better so I
feed them home grown clean food.... now I save money as I don’t need to take
children [to the] hospital in Nairobi” (Farmer: #35kGPN).
In sum, there are several trajectories of economic and social upgrading/downgrading
which effect environmental upgrading/downgrading, which reinforces the dynamic
nature of upgrading trajectories. The next section, will both quantitatively and
qualitatively unpack ‘how’ and the extent to which re-environmentalization,
governance and economic and social upgrading, impact the LCEPP, HCEPP and SEU
types of environmental upgrading. This enables not only triangulating the qualitative
results described thus far, but also nuances the analysis across farmers in global,
regional and local PNs.

267
6.3 Quantitative analysis of determinants of environmental upgrading
This section aims to explicate the links between environmental upgrading, re-
environmentalization and governance as depicted in the framework described in
Chapter 2, Figure 3.2. The main question this chapter seeks to answer is: To what extent
do embeddedness and governance affect environmental upgrading? I begin by providing a
brief recap of the descriptive statistics of all the key variables discussed so far,
followed by an intuitive explanation of the econometric model before discussing the
results of the model. Overall, I find that re-environmentalization and governance
factors have a significant effect on environmental upgrading but the magnitude and
sign of the impact differs considerably across farmers in global, regional and local
production networks.
Table 6.11 provides descriptives (mean values) of all the variables I have discussed in
chapters 5 and 6. In a nutshell, GPN farmers experience the highest territorial fixed
index values (natural endowments) of 0.578. However, ecological relationships that
develop when embedding into GPNs are contested, while RPN and local farmers do
not experience similar struggles. Embedding into GPNs and RPNs also brings with it
bio-physical hazards, which are measured through territorial fluid index. Since
farmers were sampled from similar regions, all farmers experience very similar index
vales of hazards, however their process of coping differs significantly.
In terms of network embeddedness, the index values suggest that GPN farmers have
better network architecture (0.557) than RPN (0.396) and local farmers (0.337) as they
have more support due to strong ties with input providers and buyers. However,
despite having strong ties (density, intensity, quality) there is considerable
contestation within the ties due to the lower power of farmers. RPN farmers generally
appear to have strong-intermediate ties and are seen as entrepreneurial as they
manage to maintain their ties, whilst local farmers have weak ties with their main
buyers. The case is reversed when it comes to network stability, with GPN farmers
having the lowest (0.47), followed by regional (0.89) and local (0.76). This is because

268
most GPN farmers have low levels of earned trust in their buyers, in contrast to RPN
and local farmers. Re-iterating, farmers re-environmentalize into GPNs, RPNs and
LPNs very differently.
In terms of de-codification and capabilities, over 73% of the share of knowledge
utilized by GPN farmers and 61% of that of RPN farmers is by external learning for
LECPP+ HCEPP upgrades, compared to only 38% for local. Local farmers
predominately depend on internal sources of learning due to lack of extension
services. Strategic environmental upgrades across famers in all PNs are mostly
performed with internal knowledge, with very minimal support financially from
horizontal or vertical actors in the network.
Looking at social upgrading variables, approximately 73% of GPN farmers were
organized in top down or bottom up farmer groups, compared to 61% regional and
31% local. In relation to economic upgrading, GPN farmers adhered to stringent
standards, did more value addition and more diversified than RPN and LPN farmers.
Table 6.11: Descriptives of key variables
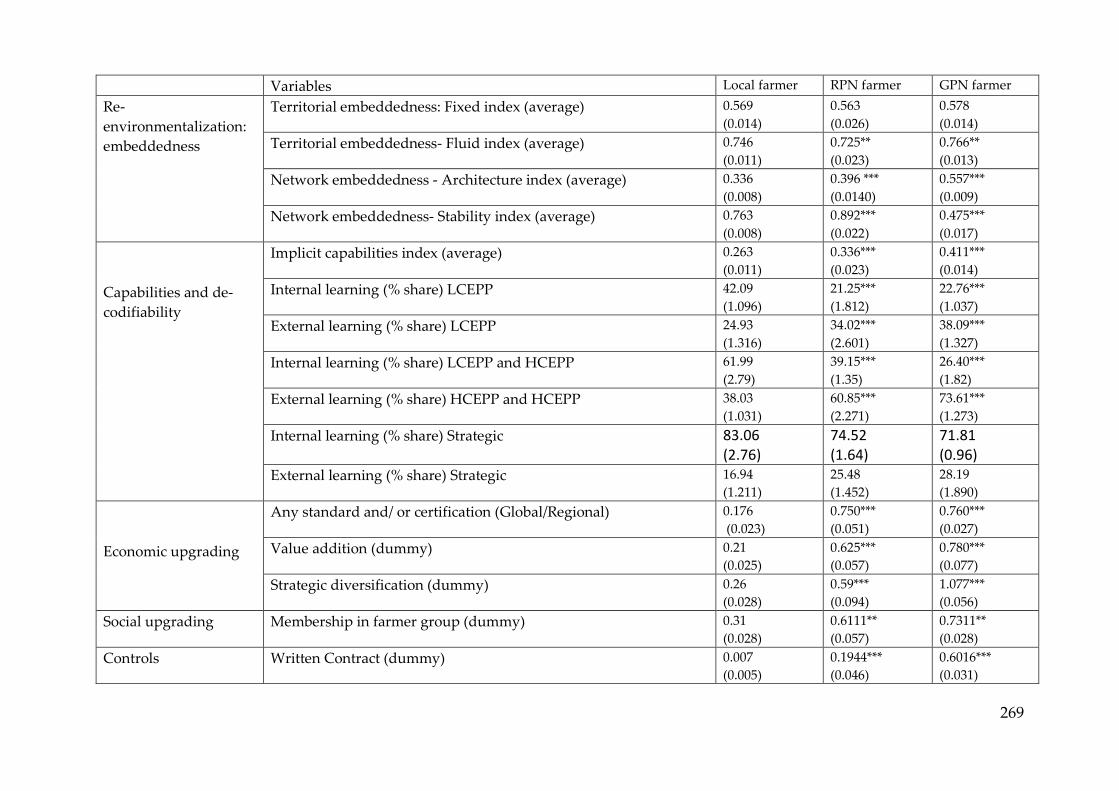
269
Variables Local farmer RPN farmer GPN farmer
Re-
environmentalization:
embeddedness
Territorial embeddedness: Fixed index (average) 0.569
(0.014)
0.563
(0.026)
0.578
(0.014)
Territorial embeddedness- Fluid index (average) 0.746
(0.011)
0.725**
(0.023)
0.766**
(0.013)
Network embeddedness - Architecture index (average) 0.336
(0.008)
0.396 ***
(0.0140)
0.557***
(0.009)
Network embeddedness- Stability index (average) 0.763
(0.008)
0.892***
(0.022)
0.475***
(0.017)
Capabilities and de-
codifiability
Implicit capabilities index (average) 0.263
(0.011)
0.336***
(0.023)
0.411***
(0.014)
Internal learning (% share) LCEPP 42.09
(1.096)
21.25***
(1.812)
22.76***
(1.037)
External learning (% share) LCEPP 24.93
(1.316)
34.02***
(2.601)
38.09***
(1.327)
Internal learning (% share) LCEPP and HCEPP 61.99
(2.79)
39.15***
(1.35)
26.40***
(1.82)
External learning (% share) HCEPP and HCEPP 38.03
(1.031)
60.85***
(2.271)
73.61***
(1.273)
Internal learning (% share) Strategic 83.06 (2.76)
74.52 (1.64)
71.81 (0.96)
External learning (% share) Strategic 16.94
(1.211)
25.48
(1.452)
28.19
(1.890)
Economic upgrading
Any standard and/ or certification (Global/Regional) 0.176
(0.023)
0.750***
(0.051)
0.760***
(0.027)
Value addition (dummy) 0.21
(0.025)
0.625***
(0.057)
0.780***
(0.077)
Strategic diversification (dummy) 0.26
(0.028)
0.59***
(0.094)
1.077***
(0.056)
Social upgrading Membership in farmer group (dummy) 0.31
(0.028)
0.6111**
(0.057)
0.7311**
(0.028)
Controls Written Contract (dummy) 0.007
(0.005)
0.1944***
(0.046)
0.6016***
(0.031)

270
*** Significant at 1% of KW test, ** Significant at 5% of KW test; Figures in brackets are standard errors.
Source: Author’s construction from survey data
Crop type (1= tree crop) (dummy) 0.44
(0.038)
0.527
(0.059)
0.495
(0.031)
Duration of specific market participation (average years) 8.76
(0.367)
7.15
(0.549)
5.20
(0.198)

271
6.3.1 Intuition of econometric model used
The process of environmental upgrading is a sequential one. Gereffi (1999) posits that
upgrading can occur only post participation in a particular VC/PN. Farmers make
decisions to self-select into participating in a GPN, RPN or LPNs and then choose to
upgrade in order to continue to participate. With this in mind, I use a sequential
decision-making model called the double hurdle model51 (ordered probit selection
model with endogenous switching and selection correction52) by Chiburis and
Lokshin (2007). The first hurdle here is participation in a GPN/RPN/LPN, while the
second is upgrading, conditional on participation. This helps me unpack the results
for farmers in GPNs, RPNs and LPNs separately. Most econometric analysis thus far
usually assumes simultaneity in the decision to participate and upgrade and therefore
have not accounted for the endogenous decision processes that effect both
participation and upgrading. Furthermore, studies thus far have not tconsidered
differences that arise across GPN, RPN and LPNs either. The two-step ordered probit
selection model takes into account both the sequential differences, as well as the
differences across farmers, in each PN. This model seeks to maximize a latent variable
that is bounded/reserved because I account for the varieties of rationality (within re-
environmentalization). Thus, the model is robust and ascertains the different extent to
which key variables affect each type of environmental upgrading across each PN. The
theoretical approach (equations) of the econometric model is discussed in Appendix
12.
51 Several studies exist, which uses two step methods that focus on the sequential decisions for market
participation. The earliest were double hurdle rate models. For instance, Goetz (1992) first separated farmers into
buyers /sellers and autarkic using a probit regression, followed by a switching regression in the second stage for
the quantity traded. Bellmare and Barrett (2006) went a step further, where in the first stage they used an ordered
probit regression, to separate net buyers, net sellers and autarkic in stage one; and in stage two used truncated
normal regressions for quantities traded. 52 Another benefit of this approach is that it takes into account endogenous self-selection of farmers to participate
in production networks, i.e. decisions which may be influenced by unobservable characteristics (e.g. motivation,
entrepreneurial skills) that may be correlated with outcomes of interest – environmental upgrading (Teklewold
et al., 2013). In this way, a double hurdle model accounts for heterogeneous differences that may exist between
farmers, which impact how they upgrade.

272
The figure 6.1 below pictorially depicts the three key regressions that this thesis will
run. Stage 1, is the first stage, which is an ordered probit regression, suggesting that
the study expects GPN farmers to upgrade the most, followed by RPN and local
farmers, thus creating a hierarchical ordering. In stage 2, the sample is truncated (i.e.
imposing a conditional regression) using a normalized linear regression. Conditional
on being a GPN farmer, this explores the extent to which re-environmentalization,
capabilities and de-codifiability affect environmental upgrading.
The first regression uses LCEPP as a dependent variable. The second regression uses
a combination of LCEPP and HCEPP as a dependent variable, which helps study if
the impacts on low complexity environmental upgrades are different from those of
high complexity. The third regression uses SEU as a dependent variable.
Each of these regressions are interpreted as a sequential decision. That is, conditional
on being a GPN, RPN or local farmer, to what extent does re-environmentalization
(embeddedness), capabilities and codifiability affect LCEPP in the first regression;
similar for LCEPP and + HCEPP combined (LCEPP+HCEPP hereafter) and SEU
regressions. By doing this, I can compare the effects across each farmer category,
enabling me to perform a comparative analysis. I shall only be discussing the stage 2
results in the thesis, as the aim is to comprehend the effects on environmental
upgrading. Stage 1 results are presented and interpreted in the Appendix 13.

273
Figure 6.1: Stages in two sequential double hurdle econometric model
Source: Author’s construction
The next three sections are as follows. The first will discuss the effects on LCEPP,
followed by the combination of LCEPP+HCEPP and then finally SEU.
6.3.2 Results for Low complexity product and process environmental upgrading
(Regression 1)
The results53 from Table 6.12 reveal that the territorial fixed parameter is highly
significant across GPN, RPN and local farmers. However, compared to RPN or GPN
farmers, local farmers appear to have a higher magnitude of effect for performing
LCEPP upgrades. This means that for every unit increase in how farmers experience
territorial fixed embeddedness (increase in natural endowments), more LCEPP
upgrades will be performed by local farmers, compared to RPN or GPN farmers. This
could occur because most local farmers are dependent on their environmental assets,
as they have limited network support, due to weak ties.
53 The selection equation (ordered probit model -first part of the regression) is given in the appendix
(13) along with endogeneity checks for robustness (15), tests for model identification and functional
form (14), post-estimation model validity discussion and exclusion restrictions (16) and robustness
tests (17, 18).
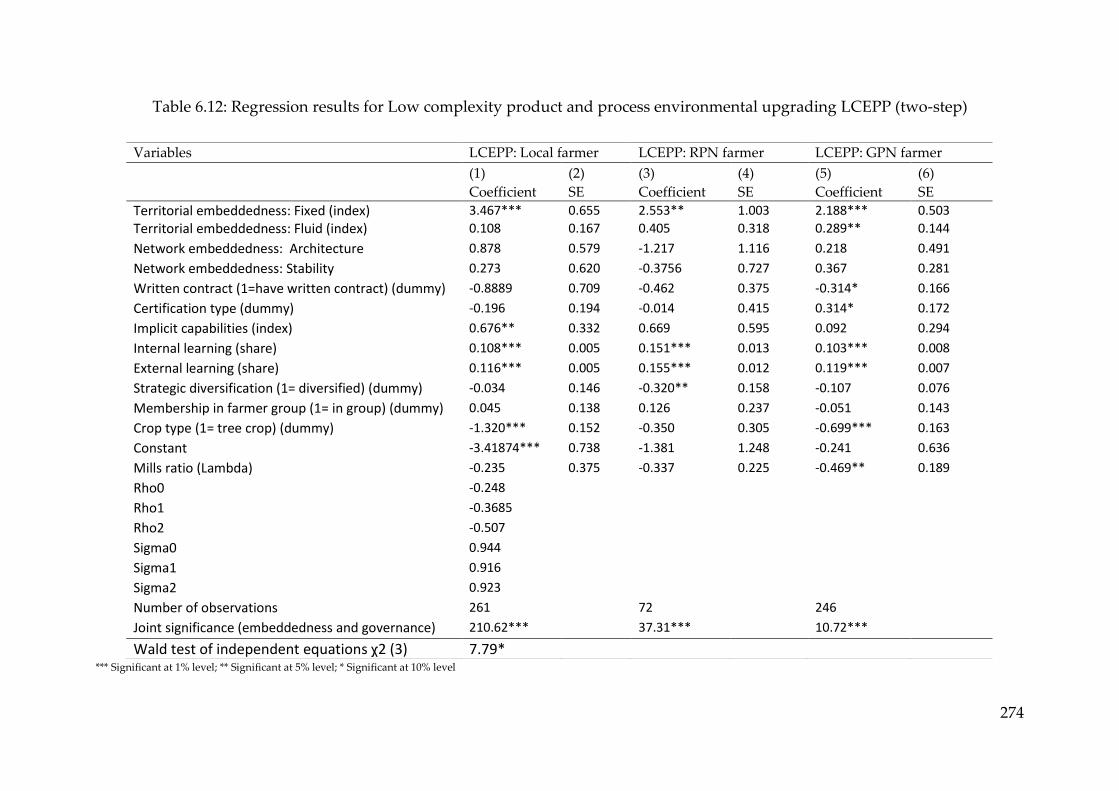
274
Table 6.12: Regression results for Low complexity product and process environmental upgrading LCEPP (two-step)
*** Significant at 1% level; ** Significant at 5% level; * Significant at 10% level
Variables LCEPP: Local farmer LCEPP: RPN farmer LCEPP: GPN farmer (1)
Coefficient
(2)
SE
(3)
Coefficient
(4)
SE
(5)
Coefficient
(6)
SE
Territorial embeddedness: Fixed (index) 3.467*** 0.655 2.553** 1.003 2.188*** 0.503
Territorial embeddedness: Fluid (index) 0.108 0.167 0.405 0.318 0.289** 0.144
Network embeddedness: Architecture 0.878 0.579 -1.217 1.116 0.218 0.491
Network embeddedness: Stability 0.273 0.620 -0.3756 0.727 0.367 0.281
Written contract (1=have written contract) (dummy) -0.8889 0.709 -0.462 0.375 -0.314* 0.166
Certification type (dummy) -0.196 0.194 -0.014 0.415 0.314* 0.172
Implicit capabilities (index) 0.676** 0.332 0.669 0.595 0.092 0.294
Internal learning (share) 0.108*** 0.005 0.151*** 0.013 0.103*** 0.008
External learning (share) 0.116*** 0.005 0.155*** 0.012 0.119*** 0.007
Strategic diversification (1= diversified) (dummy) -0.034 0.146 -0.320** 0.158 -0.107 0.076
Membership in farmer group (1= in group) (dummy) 0.045 0.138 0.126 0.237 -0.051 0.143
Crop type (1= tree crop) (dummy) -1.320*** 0.152 -0.350 0.305 -0.699*** 0.163
Constant -3.41874*** 0.738 -1.381 1.248 -0.241 0.636
Mills ratio (Lambda) -0.235 0.375 -0.337 0.225 -0.469** 0.189
Rho0 -0.248
Rho1 -0.3685
Rho2 -0.507
Sigma0 0.944
Sigma1 0.916
Sigma2 0.923
Number of observations 261 72 246
Joint significance (embeddedness and governance) 210.62*** 37.31*** 10.72***
Wald test of independent equations ꭕ2 (3) 7.79*

275
Both network architecture and stability appear to have a generally positive but
insignificant effect on performing LCEPP upgrades across GPN, RPN and LPN
farmers. This means that stronger ties, relational proximity and high earned and
ascribed trust do not statistically significantly help performing LCEPP environmental
upgrades. This is an important finding because GPN farmers have very low trust in
their buyers, yet because they wish to continue to participate, they perform
environmental upgrades. This alludes to the fact that having trust rich ties do not
automatically lead to performing more environmental upgrades. The data also
suggests that GPN farmers who possess written contracts have a statistically
significant and negative effect on LCEPP upgrades i.e. they actually perform less. This
means that contracts are viewed merely as written pieces of paper, which do not help
build network stability or trust or cooperation between ties, or even allow farmers the
ability to bargain for better terms, thus actually leading to environmental
downgrading. These results are interesting, because they depict the multi-layer nature
of earned and ascribed trust, which at one level suggests that it abets environmental
upgrading, while at the other dissuades it.
Overall, the process of farmers re-environmentalizing into GPNs and RPNs has led to
farmers performing more environmental upgrades, albeit only the territorial variables
(ecological relations) were significant, while network variables were not.
Interestingly, internal and external learning have a statistically significant and positive
relationship with LCEPP upgrading across GPN, RPN and LPN farmers, suggesting
that a unit increase in knowledge will increase performing LCEPP upgrades. The
magnitude of effect of external and internal (tacit) is quite close, which implies that
tacit knowledge is almost as important as explicit forms of knowledge when
performing environmental upgrades. Thus, its significance should not be discounted.
Furthermore, it clearly seems that GPN farmers seem to prefer tangible expert
trainings and learning’s over having stronger network ties when it comes to
performing environmental upgrades. Even RPN farmers, who have strong-
276
intermediate ties, seem to prefer tangible explicit learning they receive over the
network architecture or stability when they embed themselves in RPNs.
Implicit capabilities also have a positive association with LCEPPs across GPN, RPN
and local farmers, but are significant only for local famers. Local farmers elucidated
that they try to compensate for their lack of strong network ties and low ability to de-
codify tasks with higher implicit capabilities. This is verified when comparing the high
value of the co-efficient, which is much higher for local (0.67) compared to export
(0.09) farmers. Thus, capitalization does enable increasing performance of LCEPP.
The economic process upgrade of certification seems to have a positive and significant
association with LCEPP for GPN farmers, while a negative association for RPN
farmers. This indicates that having only a global certification leads to higher
performance of LCEPP, but adhering to a regional standard such as the HCD does not
seem to incentivise performing LCEPP environment upgrades. This questions the
efficacy of regional standards, and the need to explore why regional standards have
not supported environmental development in future research. Thus, in this case,
economic upgrading leads to environmental downgrading for RPN farmers, yet again
highlighting the complex trajectories of environmental upgrading.
Another economic upgrade, strategic diversification, seems to have a negative
relationship with LCEPP upgrades across GPN, RPN and local farmers, intimating
that opportunistic selling to multiple buyers leads to environmental downgrading.
Thus, strategic diversification seems to be closely linked to rent seeking and
improving bargaining potential instead of simultaneously promoting environmental
upgrading.
Somewhat surprisingly, for social upgrading, farmer groups seem to have a negative
association (but not statistically significant) with LCEPP of GPN farmers, which
means that even if they are part of a farmer group it may not lead to environmental
upgrades, whilst the association is positive for local and RPN farmers. This implies

277
that local and regional farmer groups seem to provide training that helps enhance
LCEPP, whilst farmer groups formed by Kenyan export firms do not. Interviews with
GPN farmers elucidated that top-down farmer groups were mostly useful for tasks of
higher complexity, and did not bother to focus as much on less complex upgrades.
In sum, for RPN farmers, these results suggest that performing economic and social
upgrades usually leads to LCEPP environmental downgrading. Yet, for GPN farmers,
the case is a bit more complicated as it leads to both environmental upgrading and
downgrading.
The crop type seems critical. It appears that there is a negative and statistically
significant association with LCEPP across all farmer categories. This suggests that if a
farmer grows a tree crop (mango/avocado), then they are less likely to perform LCEPP
upgrades compared to if they grew snow peas and garden peas.
6.3.3 Results for combined Low and High complexity product and process
environmental upgrading (Regression 2)
In this regression, the dependent variable is LCEPP+HCEPP upgrades. I aim to gauge
whether re-environmentalizing into GPNs/RPNs, governance factors and economic-
social upgrading affect the performance of the combined environmental upgrades, If
there are significant changes in the results it will imply that these are due to
performing HCEPP upgrades (as the dependent variable is LCEPP+HCEPP).
The results54, in Table 6.13, show that when the process of territorial fixed and
territorial fluidly embedding into GPNs is easier, when farmers perform more
HCEPP+LCEPP environmental upgrades, and the results are statistically significant.
This indicates that the higher the environmental assets, and the greater the uncertainty
in terms of climate variability and extremes, will induce GPN farmers to perform more
LCEPP+HCEPP environmental upgrades. There is also a positive association with
54 Stage 1 of regression 2 results, endogeneiyy tests, box-coxrobustness checks are presented in
Appendix 19, 20, 21, 22.

278
local farmers, which suggests that during times of increased climate variability risk
and when there is degradation of the natural environment of the farmer, they will tend
to perform more complex environmental upgrades. The association is positive for
RPN farmers too, but not statistically significant.
Similar to the results in regression 1, both network architecture and stability variables
are not significant, which means that when farmers in GPNs and RPNs re-embed into
new relationships, the strength of their ties, strong positionality, and level of trust do
not seem to be significantly effecting their decisions to LCEPP+HCEPP
environmentally upgrade. This means that, especially in the case of GPN farmers,
environmental upgrading can occur in the absence of trust. However, this raises the
question of whether such a situation can last over the long term. Further research is
warranted to delve deeper into the different contestations, struggles that impact
earned and ascribed trust, and whether providing farmers a stronger positionality
within the network can be a sustainable solution to environmentally upgrading. The
longer-term implications can significantly impact re-environmentalization and
participation in GPNs. I discuss some of these implications in Chapter 8.
Consequently, similar to the LCEPP case, contracts here also have a negative effect on
environmental upgrading for similar reasons.
Overall, the easier the re-environmentalizing process into GPNs and RPNs is, there is
a positive association with LCEPP+HCEPP upgrading.
Internal and external learning seem to be positive and statistically significant across
all farmers and more important than network architecture and stability for
LCEPP+HCEPP environmental upgrades. This seems to reinforce the importance of
learning over network strength and stability for farmers. Many farmers reported that
knowledge dissemination, especially codified knowledge, felt ‘tangible’ i.e. more
prescriptive and practical compared to having good ties, which may or may not evolve
into tangible support (Interviews: #3kf, #4kf). One GPN famer commented:

279
“What is the point of just being good friends with agricultural officers or other
important people if they do not support me with practical knowledge and skills
to do the job? ... I would much rather befriend someone who teaches me what
to do... That is much more useful for my future” (Farmer 2 in #3kf).
It is worth noting one reason in particular in the case of GPN farmers. The lack of
including local interpretations into learning processes is a key reason for low levels of
trust, increased contestations and poor network stability. This questions how
knowledge can be classified in terms of ‘right’ or ‘wrong’. For instance, farmers
perceive knowledge disseminated to be ‘wrong’ as it depends on the priorities of
powerful global lead firms whilst they have no agency to change it. Thus, in a sense
‘wrong’ knowledge permeates within GPN farming communities, throwing up
doubts of whether this new, ‘wrong’ knowledge could possibly become tacit over
time. To engender trust, increase network stability including local interpretations
could provide farmers more agency and therefore increase buy in and help bring in
the ‘right’ kind of knowledge that leads to long term cooperation.

280
Table 6.13: Results for Low complexity + High complexity product and process environmental upgrading (two-step)
*** Significant at 1% level; ** Significant at 5% level; * Significant at 10% level
Variables LCEPP+HCEPP: Local LCEPP+HCEPP: RPN LCEPP+HCEPP: GPN (1)
Coefficient
(2)
SE
(3)
Coefficient
(4)
SE
(5)
Coefficient
(6)
SE
Territorial embeddedness: Fixed (index) 1.387*** 0.122 3.133 2.090 2.662*** 0.948 Territorial embeddedness: Fluid (index) 0.285* 0.169 0.070 0.344 0.468*** 0.153 Network embeddedness: Architecture 0.111 0.069 -0.128 0.122 0.074 0.072 Network embeddedness: Stability 1.008* 0.581 0.162 0.828 0.316 0.307 Written Contract (1=have written contract) (dummy) -1.125* 0.668 -0.336 0.431 -0.029 0.195 Certification type (dummy) -0.290 0.188 -0.403 0.480 0.173 0.186 Implicit capabilities (index) 0.934*** 0.177 0.872* 0.454 0.800*** 0.190 Tacit knowledge (share) 0.118*** 0.009 0.181*** 0.023 0.152*** 0.011 Explicit knowledge (share) 0.137*** 0.009 0.191*** 0.022 0.187*** 0.010 Strategic diversification (1= diversified) (dummy) -0.042 0.143 -0.135 0.173 -0.236*** 0.084 Membership in farmer group (1= in group) (dummy) 0.471*** 0.079 0.355* 0.183 0.136*** 0.049 Crop type (1= tree crop) (dummy) -1.473*** 0.161 -0.133 0.380 -1.004*** 0.216 Constant -1.910 0.844 1.114 1.568 -1.162 0.730 Mills ratio (Lambda) -0.572* 0.334 -0.249 0.214 -0.373* 0.197 Rho0 -0.577 Rho1 -0.250 Rho2 -0.383 Sigma0 0.990 Sigma1 0.997 Sigma2 0.972 Number of observations 261 72 246 Joint significance (embeddedness and governance) 45.12*** 13.31*** 127.77***
Wald test of independent equations ꭕ2 (3) 8.07**

281
Another important point to note is that when HCEPP is added to LCEPP
environmental upgrades, implicit capabilities become significant and positive across
all farmers’ categories (compared to it being statistically significant only for local
farmers when performing LCEPP). Thus, even RPN and GPN farmers can be expected
to perform a higher number HCEPP+LCEPP environmental upgrades with more
implicit capabilities. This highlights that HCEPP upgrades require higher initial
capital investment (more assets) than performing LCEPP upgrades55, as explained by
one export farmer:
“I need a car or a bike to go to KePhis for soil testing.... They [exporters] don’t
take me there.... I need a mobile for them to call me.... I need a store house away
from my house to store all my chemicals.... For all this I need to already have
money” (Farmers: 24k).
The results indicate economic upgrading - certification does notlead to increasing
LCEPP+HCEPP environmental upgrades for farmers, questioning the efficacy of
standards in incentivizing environmental upgrading. Global and regional standards
appear to have a statistically insignificant relationship with LCEPP+HCEPP
environmental upgrading across GPN, RPN and LPN farmers. The association
appears to be negative (and statically insignificant) for LCEPP+HCEPP of RPN and
local farmers, while positive (and statically insignificant) for LCEPP+HCEPP of GPN
farmers. It cannot be clearly said whether economic upgrading actually causes
environmental upgrading or downgrading. The insignificance of the variable also
questions whether global sustainability standards such as GlobalGAP or global
supermarket standards Tesco Nature, Farm to Fork; and regional standards like the
HCD, actually help promote sustainable practices. Does this call for a need to look at
alternate governance structures to replace standards? Or how can standards be
55Hernandez et al. (2007), Dannenberg and Lakes (2013) provide evidence that farmers who are more
capitalized tend to perform better GAPs.

282
amended to incentivise environmental upgrading? I discuss some of these
implications further in Chapter 8.
Similar to regression 1, strategic diversification has a negative association with
LCEPP+HCEPP environmental upgrading across GPN, RPN and LPN farmers
(negative and statistically significant association with LCEPP+HCEPP for GPN
farmers). This signifies that opportunistic behaviour does not lead to performing more
environmental upgrades for GPN and RPN farmers. Thus, diversification lead to
environmental downgrading. Many RPN farmers (who had economically
downgraded from GPNs) explicated that their prime motive was to ensure steady
income, as they had taken a big risk by selling into less developed regional markets.
Therefore, at least in the short term, some may be ready to reduce performing
environmental upgrades, and divert the investments into more commercial ventures
(Interview: #11kRPN).
Unlike the results for LCEPP, membership in farmer groups has a positive and
significant effect on LCEPP+HCEPP. This implies that being part of a farmer group
seems to particularly increase the ability to perform high complexity environmental
upgrades. This denotes that GPN farmers benefit whether they are part of top-down
or bottom-up groups. However, this also reveals that most high complexity tasks are
also referred to as ‘visible’ tasks by farmers. This is because some tasks such as MRLs,
spray schedules, soil and water testing, are scrutinized and monitored by Kenyan
firms and the HCD more than other tasks and are thus given an unevenly high level
of support by farmer groups compared. This means that GPN farmers only benefit
from being part of a farmer group when they perform high complex upgrades, and
not when they do less complex upgrades. GPN farmers claimed that they were ‘over
taught’ (had several training sessions) specific upgrades, whilst they were not helped
as much with other upgrades such as tilling or clean storage of chemicals or good
cropping systems, as those upgrades would not be ‘visible’ to international sampling
bodies in the EU. As one GPN group member explained:

283
“I ask for help to redo my terraces and help build furrows.... They are good for
my plot... They [ export company] say they have no time for that” (#Farmer2,
#2kf)
The results also reveal that RPN and local farmers continue to get support from being
part of bottom-up groups, even for high complexity tasks. Albeit interviews with RPN
and local farmers highlighted that most of these groups were not well financed. Yet,
the aim of the group was to work for collective betterment, unlike top-down exporter
driven farmer group which focused only on volume and quality of product sold. In
sum, in this case, social upgrading, also helped propel environmental upgrading.
6.3.4 Results strategic environmental upgrading (Regression 3)
In this regression, I unearth the impacts of re-environmentalization, governance,
economic and social upgrading on the dependent variable SEU. The results56,
presented in Table 6.14, show that territorial fixed and fluid embedding into GPNs
and RPNs have a positive and statistically significant association with SEU (also
positive and significant for local farmers). This suggests that farmers, regardless of
participating in a GPN, RPN or LPN, fear ‘critical thresholds’ being reached because
of their reserved rational mindset. Therefore, in the regions where the probability of
bio-physical hazards is higher, farmers tend to perform more SEUs.
Network embeddedness appears to have a negative relationship, although not
statistically significant, with strategic environmental upgrading across farmer
categories. This suggests that having strong network architecture or higher levels of
trust or relational proximity does not help in increasing SEU. Thus, unlike in LCEPP
and LCEPP+HCEPP, where network embeddedness at least played a positive (albeit
statistically insignificant) role in increasing environmental upgrades, it appears to
56 Stage 1 of regression 3 results., endogeneity tests, Box-cox and robustness checks are presented in
Appendix 23,24,25,26.

284
play the reverse here, where it may reduce strategic environmental upgrades. These
results are in line with the qualitative discussion that suggests farmers perform SEU
regardless of whether they have good relationships with other actors in the PNs, as
strategic upgrades are linked to livelihood sustenance. Farmers claimed that having
good relations with input suppliers or buyers would not prevent a flood or drought,
and furthermore most of the vertical and horizontal network actors did not provide
any assistance to farmers during such hazards. Therefore, having better networks
does not lead to any improvement in carrying out environmental upgrades
(Interviews: 1kf).
This also calls to attention the selective information and the trust transferred through
strong ties does not seem to foster statistically significant environmental upgrading.
This queries whether ties may be redundant. There is a need to further unpack the
implications of poor network architecture and stability on environmental upgrading.
I take this discussion up a bit more in the concluding remarks of this chapter, and then
again in Chapter 8. Having a written contract has a negative and insignificant effect
on SEUs for GPN and RPN, therefore indicating that, as with the case of
LCEPP+HCEPP, short term contracts do not seem to help improve the natural
environment. This is an interesting predicament, with much of the story boiling down
to the low levels of earned trust, especially for GPN farmers in relation to global lead
firms.

285
Table 6.14: Regression for strategic environmental upgrading (two step)
*** Significant at 1% level; ** Significant at 5% level; * Significant at 10% level
Variables SEU: Local farmer SEU: RPN farmer SEU: GPN farmer (1)
Coefficient
(2)
SE
(3)
Coefficient
(4)
SE
(5)
Coefficient
(6)
SE
Territorial embeddedness: Fixed (index) 2.988*** 0.542 4.015*** 0.826 2.214*** 0.483 Territorial embeddedness: Fluid (index) 1.329*** 0.292 -0.249 0.480 0.764*** 0.280 Network embeddedness: Architecture -0.306 0.484 1.316 0.942 0.278 0.467 Network embeddedness: Stability 0.759 0.531 -1.773*** 0.616 0.012 0.266 Written Contract (1=have written contract) (dummy) -0.278 0.620 0.178 0.316 -0.015 0.150 Certification type (dummy) 0.142 0.172 0.961*** 0.343 0.313* 0.164 Implicit capabilities (index) -0.250 0.290 -1.892*** 0.506 0.113 0.278 Internal learning (share) 0.107*** 0.005 0.073*** 0.008 0.088*** 0.005 External learning (share) 0.086*** 0.007 0.073*** 0.010 0.092*** 0.006 Strategic diversification (1= diversified) (dummy) 0.108 0.122 -0.012 0.130 0.027 0.076 Crop type (1= tree crop) (dummy) 1.509*** 0.130 1.101*** 0.242 1.227*** 0.156 Membership in farmer group (1= in group) (dummy) -0.018 0.120 0.221 0.191 -0.204 0.136 Constant -3.888*** 0.589 -0.496 0.939 -2.226*** 0.505 Mills ratio (Lambda) -0.222 0.310 0.318* 0.188 0.327* 0.183 Rho0 -0.267 Rho1 0.413 Rho2 0.374 Sigma0 0.830 Sigma1 0.770 Sigma2 0.873 Number of observations 261 72 246 Joint significance (embeddedness and governance) 111.16*** 37.77*** 80.15*** Wald test of independent equations ꭕ2 (3) 7.30*
286
Similar to LCEPP and LCEPP+HCEPP, de-codifiability and capabilities appear to be
very important variables. Both internal and external learning have positive and
statistically significant associations with SEUs across GPN, RPN and local farmers.
Even the magnitudes (similar co-efficient values) are comparable, which intimates
almost equal importance of both to GPN, RPN and LPN farmers. Thus, increased
vertical and horizontal actor support could significantly also improve the probability
to performing SEUs.
However, the results for implicit capabilities were quite the contrary to the LCEPP
and HCEPP findings. The regression results indicate that the higher the implicit
capabilities of farmers (especially regional), the less the SEUs they would perform.
One RPN farmer explained:
“just because we [ the farmer and his friends] have more things, does not mean
we need to do more.... We can do less… because we have more things...”
(Interview: #21kLPN).
Effectively the quote suggests that some farmers appear to feel ‘safer’ and ‘hedged’
against weather vagaries because they possess a higher implicit capability. Thus,
somewhat counter intuitively, they appear to have less incentive to perform strategic
environmental upgrades. In most of the qualitative interviews conducted, farmers
stated that they would be keen to perform more strategic upgrades if they had high
implicit capabilities.
The results for obtaining a global or regional certification are very interesting. On one
hand certifications and regional codes of conduct do not seem to statistically
significantly drive performance of LCEPP and HCEPP. Contrarily, having a global or
regional standard, in the case of GPN and RPN farmers, has a positive and significant
association with performing more SEUs. GPN farmers commented on the need to
complement having a certification with performing more SEUs. This was because
farmers believed that complementing a standard with SEUs would reduce overall

287
rejections and increase crop quality. Thus, performing strategic environmental
upgrades was not only driven by the need to conserve and protect the environment,
but also because they wanted to prevent marginalization or exclusion from
participation in a VC/PN. These results are akin to those discussed qualitatively earlier
in this chapter. This queries the importance of certifications, questioning whether
environmental upgrading is just a positive externality of complying with certifications
rather than forming a core part of the certification itself. In this case, economic
upgrading did lead to environmental upgrading. It is worth noting that strategic
diversification seems to have a statistically insignificant and positive association with
SEU performance for GPN farmers. This means that farmers seem more concerned
with protecting their environment to bio-physical hazards and adapting when they
strategically diversify, rather than performing low and high complexity
environmental upgrades.
Membership in a farmer group appears to be statistically insignificant and have mixed
effects. The result reveals that being part of a farmer group has a negative association
with SEUs for GPN farmers, mostly because top-down groups do not usually help
with strategic upgrades and are more fixated on visual HCEPP tasks. Thus, these
groups do not have cohesive ties that enable sharing information outside the specific
tasks. In contrast, RPN farmers appear to be part of groups that provide support when
it comes to performing SUEs, as well as LCEPP and HCEPPs, indicating that bottom-
up groups seem to be more cohesive. In this sense, social upgrading for GPN farmers,
has again led to environmental downgrading.
The results relating to crop type suggest that farmers perform more strategic
environmental upgrades for tree crops than non-tree crops. One of the reasons for this
is because the farmers growing tree crops were usually located in regions (Murang’a,
Machakos) that were prone to more drought than those where short-term crops are
grown.

288
In sum, it appears that re-environmentalization and governance are critical factors
that impact the process of different forms of environmental upgrading across RPN,
GPN and LPN farmers, albeit in different ways. This answers the sub-question
pertaining to what extent embeddedness, codifiability and capabilities affect
environmental upgrading.
Throughout this thesis, the situation of RPN farmers is interesting. In terms of network
stability, they engender dyadic trust in their relationships with buyers compared to
GPN and LPN farmers. Even when it comes to different forms of learning, they are in
a unique position, wherein they proactively seek and receive horizontal actors
support, and have better internalization and absorptive capacities than GPN farmers.
Together, this translates into performing a similar of environmental upgrades. to GPN
farmers. The next section further unpacks some mechanisms on how and why this
happens.
6.3.5 Simulating the heterogeneous differences between farmers in GPNs, RPNs and
LPNs
I explicated how the proactive and entrepreneurial characterises of RPN farmers
enable improving their absorptive capacity. It is these characteristics that effect their
cognitive mechanisms which is an important reason suggesting why RPN farmers
perform an almost similar number of environmental upgrades to GPN farmers.
To bring out these heterogeneous differences across GPN, RPN and LPN farmers, I
aim to simulate the environmental upgrades for a farmeras if he or she were in each
of the other two farmers’ production networks i.e. by creating a what-if situation. For
example, if all GPN farmers were to switch to RPNs or LPNs would they continue
environmentally upgrading to the same level? These results are averaged across the
actual farmer group and are displayed in the figures below (Appendix 27 has the
detailed simulated results).

289
I begin with discussing the results for GPN, RPN and local farmers in terms of LCEPP
+ HCEPP upgrades. As depicted in figure 6.2, if local farmers were inserted into RPNs
(i.e. if all local farmers were to switch to participating in RPNs), then they would
perform 3.10 fewer HCEPP+LCEPP than what RPN farmers are currently performing
in the RPN, and would perform 3.34 less HCEPP+LCEPP than what GPN farmers are
currently performing, if local farmers inserted into the GPN. This means that local
farmers, even if they were to re-environmentalize more easily into GPNs/RPNs and
receive more external learning, would still not be able to perform as many
environmental upgrades as GPN and RPN farmers are currently performing.
Whilst, if RPN farmers were inserted into LPNs, they would perform 3.31 more
HCEPP+LCEPP than what local farmers are currently doing, and only 0.98 (<than 1
task) less than what GPN farmers are currently doing if inserted into the GPN. This
suggests that RPN farmers, regardless of external learning and stronger ties, would
perform more environmental upgrades than LPN farmers and almost the same as
GPN farmers.
If GPN farmers were inserted into an RPN, they would only do 1.08 tasks more than
what a RPN farmer is currently doing, and almost 4.5 tasks more than what a local
farmer is current doing if inserted into the LPN.
Overall, this suggests that RPN farmers have some intangible characteristics that
enable them to uptake and execute environmental upgrading, despite having less
codified knowledge and support than GPN farmers do.

290
Figure 6.2: Simulations for environmental upgrading- LCEPP+HCEPP
Source: Author’s calculation
Next, I discuss, the simulated results for SEU. The results, as depicted in Figure 6.3,
suggest that the differences across farmers categories is not very high (ranging
between -2 to 2 tasks). For instance, when GPN farmers if inserted into LPNs and
RPNs, perform 1.34 and 0.75 more upgrades than their counterparts have in their
respective PNs. While RPN farmers, if inserted into LPNs and GPNs, would perform
0.79 tasks more than local farmers are currently doing and 0.59 tasks less than GPN
farmers. This demonstrates that all farmer categories, whichever PN they were in,
would perform more or less similar levels of SEU.
Figure 6.3: Simulations for strategic environmental upgrading
Local Regional Export
Difference for local Vs -3.31 -4.5
Differnce for regional Vs 3.1 -1.08
Differnce for export Vs 3.34 0.98
-5-4-3-2-101234
Local Regional Export
Difference for local Vs -1.75 -1.58
Differnce for regional Vs 0.79 -0.59
Differnce for export Vs 1.34 0.75
-2
-1.5
-1
-0.5
0
0.5
1
1.5

291
The simulation results show that there are clear differences in the absorptive capacity
for GPN, local and RPN farmers, specifically in the way knowledge is used, the
intensity of effort associated with it, and the way it is internalized to be able to perform
an upgrade. RPN farmers appear to process information better than local and similar
to GPN farmers, because they seem to be highly motivated to maximize their rents, to
sell opportunistically as well as to conserve their natural environment. While GPN
farmers do show high absorptive capacity, their motivations differ from RPN farmers.
Many GPN farmers display higher intensity of effort and uptake of tasks, because of
fear of marginalization, rather than viewing knowledge to perform upgrades as an
asset that could be used to improve their livelihoods. Interviews with them suggested
they had not internalized the importance of performing environmental upgrades to
the same extent as RPN farmers, as one GPN and RPN farmer explained:
“Yes... I do good environmental practices. Some I believe in, others because of
the exporter... I won’t do it if the exporter stops buying...There is no money in
that... “(farmer: 24kGPN)
In comparison, a RPN farmer commented:
“I continue to follow good practices... I put this in my stomach, why should I
not? I want to have good food and my children deserve good food... Why only
Europeans? “(farmer: #13kRPN)
Local farmers appear to perform the least environmental upgrades, suggesting that
they lack the absorptive capacity to be able to perform more upgrades, even if given
more support (as seen by the simulations if they were inserted into RPNs or GPNs).
This is an interesting result that needs further investigation, to try to understand if
there exist further cognitive differences across the farmer categories relating to their
status in the current society (as a local farmer), or whether the lack of entrepreneurial
ability may account for this difference.

292
This thesis does not aim to deeply explore the cognitive differences across farmers or
discuss absorptive capacity in great detail, but rather to highlight the fact that such
differences, along with distinct ways in which farmers are embedded and acquire
capabilities, are factors that cause heterogeneity in farmers performing environmental
upgrades.
6.4 Concluding remarks
Overall this chapter, reinforces four key facts. First, it points to the importance of
territorial fixed and fluid embeddedness, thereby validating its addition to PN
analysis. Second, it sheds light on the process of re-environmentalization, capabilities
and de-codification as key drivers for environmental upgrading and downgrading.
Thirdly, it explicates that economic and social upgrading do not always lead to
environmental upgrading, thereby re-enforcing the complexity of upgrading
trajectories. Finally, it qualitatively and quantitatively shows not only the different
types of environmental upgrading trajectories but also discusses the extent to which
they are effected by key variables across farmers in GPNs, RPNs and LPNs
The results find that, even though GPN farmers perform the highest number of LCEPP
and HCEPP upgrades (18.42) and strategic (6.36) environmental upgrades, RPN
farmers perform very similar levels 17.43 (LCEPP+HCEPP) and 6.34 (SEU), followed
by local farmers 13.16 (LCEPP+HCEPP) and 5.52 (SEU) respectively. RPN farmers are
able to perform a similar number of environmental upgrades as GPN farmers partly
due to a spillover effect. Farmers who chain downgraded (i.e. left GPNs to participate
in RPNs), ‘carried or spilt over’ good practices they learnt whilst in GPNs ‘which lead
to a mainstreaming of production of non-traditional high value FFV for regional
markets. However, spillovers alone do not automatically lead to the development of
the regional market, local competencies and absorptive capacity are critical to the
success of spillovers (e.g. Cantwell, 1989; Zanfei, 1994; Kokko et al., 1996). Since RPN
farmers are able to internalize external knowledge and convert it into tacit forms they
can perform environmental upgrades withless resources than GPN farmers. It is the

293
intensity of effort which RPN farmers put into being entrepreneurial and proactively
seeking out networks that increases their competitiveness vis-a vis LPN farmers.
In this thesis, I simulated internalization and absorptive capacity of farmers to show
that RPN farmers, if inserted into GPNs, would perform the same number of
environmental upgrades as GPN farmers, and on an average about 2 upgrades more
than local farmers. Thus, their comparative advantage is linked to their cognition. A
caveat must be highlighted though. In visible and shorter chains, it is far easier to
benefit from spillovers, than in longer chains which are less visible. Spillover
knowledge, and learning by doing, are very powerful in terms of enabling an increase
in absorptive capacity. For instance, Hatani (2009) discusses a case of longer, less
visible automotive chains and finds that the spillover of intermediate technology is
inhibited due to the poor network architecture and less interactions in China.
Table 6.15 below summarizes the results with a positive (+) or negative (-) sign along
with the significance of the variable (*).
Territorially embedding (fixed and fluid) in GPNs, RPNs, LPNs plays a positive and
statically significant role in all forms of environmental upgrading. In the case of local
farmers, the limited support from the external network support and weak ties causes
an over-dependence on environmental assets for livelihood sustenance. In case of
GPN and RPN farmers, it appears they will both environmentally upgrade more when
they have better natural endowments and when uncertainty in terms of climate
variability and extremes occur. This reiterates the importance of expanding ‘territorial
embeddedness’ to include the natural environment, consisting of both natural
endowments and bio-physical elements. These are critical to gauging the ecological
reciprocal relationships that exist between farmers and their environment, that go
beyond, but are not exclusive of social relationships. It is ecological reciprocal
relationships and the varieties of rationality (reserved) of farmers that define their
294
rational limits, and form the root cause of farmer and buyer contestation and
struggles, which in turn hamper the ease of re-environmentalization.
Network architecture and stability for GPN farmers has a positive effect on
environmental upgrading, albeit statistically insignificant. This suggests that
environmental upgrading occurs despite network instability caused due to low levels
of ascribed and earned trust, lack of cooperation and weak positionality of GPN
farmers vis-a-vis their buyers. Effectively, in the GPN context, farmers have not been
able to de-localize trust in a meaningful way. This calls to question the usefulness of
strong and cohesive ties. Over time it appears that trust breeds complacency and
increases opportunism rather than loyalty and leads to a condition that Burt (1987)
and Granovetter (1973,1985) call ‘redundant ties’. Clearly, this can be seen to be
happening with GPN farmers who have made many attempts to hedge their losses by
strategically diversifying and side selling. The longer-term implications can
significantly impact re-environmentalization and participation in GPNs. This calls to
attention the importance of how the process of dis-embedding from previous
networks and indigenous markets occurs, how difficult or easy the ‘detachment’
process is, and if trust has been adequately de-localized. In this case, would there be a
trade-off between gaining earned trust whilst loosing ascribed trust due to embedding
in a new network? With minimal local interpretations, GPN farmers have contested
the reliance on expert systems, but at the same time, to be able to continue to
participate in the GPN, they are forced to build co-operation with lead firms and other
network actors.
Contracts are especially relevant to understand how farmers embed into new
networks in GPNs or RPNs. However, the levels of earned trust between GPN farmers
and buyers are so low, that even having written contracts does not actually help
environmental upgrading. In fact, a written contract seems to have a negative effect
on environmental upgrading. Contracts are viewed merely as written pieces of paper,
and do not help build network stability or trust or cooperation between ties, or even
295
allow farmers the ability to bargain for better terms. Thus, contracts may lead to
environmental downgrading. This is an important finding. While previous research
has shown the benefits of contracts include increased market participation (e.g.
Henson and Mitulah, 2004), receiving timely input supplies (e.g. Minten and Barrett,
2008), and improving crop productivity (e.g. Govereh and Jayne, 2003), there is no
research that links contracts to environmental upgrading.
Overall, the study elucidates that the process of re-environmentalizing into GPNs
impacts the way farmers choose to environmentally upgrade, but that the the
territorial factors outweigh network effects, as depicted by the +* in table 6.15. The
case for RPN farmers also echoes the importance of territorial aspects over network
aspects, as territorial fixed and fluid embeddedness has a positive and significant
effect on all forms of environmental upgrading. For RPN farmers, high network
stability i.e. trust does cause environmental upgrading, but it is not a key driver as it
is statistically insignificant. Rather than studying territorial and network aspects
separately, when they are examined in conjunction, they allude to the fact that, for
RPN farmers, re-environmentalization in RPNs is smoothly and they can choose the
extent to which they want to environmentally upgrade or downgrade.
External (embedded, encoded, embrained) learning has a positive and statistically
significant effect across all farmers and is more important than network architecture
and stability in relation to environmental upgrading. This reinforces the importance
of learning, which is seen as ‘tangible and prescriptive’ by farmers compared to
network architecture and stability which do not necessarily translate into tangible
support. Thus, trust rich ties, as Nadvi (1999a) puts it, may not necessarily be
information rich. Furthermore Granovetter (1973) claims that dense ties may not carry
the ‘right’ or ‘meaningful’ kind of knowledge and that weak ties may be conduits to
novel information. This is seen clearly in the case of GPN farmers, where strong and
dense ties do not necessarily lead to improved outcomes. Once farmer rational

296
threshold levels are reached, their ability to learn and internalize stagnates or
decreases.
This raises questions about the sustainability of long-term relationships. If the
perceived ‘right’ knowledge is not achieved, then struggles may continue which
impinge on social relations between farmers and buyers and thereby impact the
ecologically reciprocal relationships which farmers have with their natural
environment. This could create conditions for environmentally downgrading.
However, learning is not a bounded subject. There is a continuous conversion of
external to internal knowledge, as well as acquisition and appropriation of external
knowledge. I try to explore and flesh out some of these implications more in Chapter
8.
Internal knowledge has a positive and statistically significant association with
environmental upgrading (shown as a +* in table 6.15), with a very similar magnitude
to external learning, and is thus critical for farmers across all PNs. RPN farmers appear
to harness tacit knowledge and use it as complementary to explicit knowledge, by
seeking help in high complexity environmental upgrades, whilst performing SEU and
LCEPP using tacit forms of knowledge. GPN farmers cannot use tacit knowledge to
the same extent, but, because of the prescriptive requirements within standards and
global lead firm codes of conduct, they end up having to rely on expert systems
minimizing local interpretations of knowledge. If expert systems would incorporate
rather than discount such knowledge, it may have more meaningful impact on
environmental upgrading and its related outcomes.
The trajectories of learning are also not monotonic. Rather they are dynamic and
continuous, especially with GPN farmers who ‘contest’ learning and de-learn where
possible. There is a continuous conversion of external forms of knowledge to internal
forms of knowledge, and if the ‘right’ kind of knowledge is not transmitted, it could
completely replace or force out existing internal forms of knowledge. For instance,

297
interviews with GPN farmers suggested that, to a large extent, they now synonymise
consistent quality with the use of chemicals. In many cases, they tend to overuse
chemicals which lead firms tell them are optimal to use, and reduce using natural
fertilizer. This has caused environmental degradation, leading to farmer exclusion
from participating in GPNs. Such an occurrence in Kenya is not isolated, as similar
results have been found by Thrupp (1995) and Hernández et al (2007) in Latin America
FFV.
Therefore, unmistakeably dynamic learning, shapes and is reshaped by socio-
ecological relationships farmers have with their environment and networks, i.e.
making the process of re-environmentalization complex and iterative.
Implicit capabilities, in general, appear to have a positive and significant association
with environmental upgrading across GPN, RPN and LPN farmers, but is most
important to LPN farmers. This is because, in the absence of external knowledge, local
farmers substitute implicit capabilities to make up the knowledge ‘gap’. RPN and
GPN farmers both echoed that implicit capabilities to some extent compensate
infrastructural bottlenecks (poor roads, electricity shortages, lack of sophisticated
information-communication technology, transportation constraints)57 in Kenya,
especially in the case of GPN farmers. Thus, increased capitalization was seen as a
competitive tool by GPN and RPN farmers and was used to environmentally upgrade
more. Implicit assets are critical (positive and significant) to income generation,
suggesting that farmers who are more capitalized environmentally upgrade more and
earn higher income. Such ex-ante capabilities are critical to livelihoods of farmers,
suggesting that their access and possession, may help building the adaptability of
farmers against sudden shocks in both climate variability as well as price.
57 For instance, Pingali, Meijer, and Khwaja (2005) provide compelling evidence that high transaction costs, due
to the lack of public infrastructure, are the main deterrents for farmer entry into international and regional
markets.

298
Thus overall, across LCEPP, HCEPP and SEU, the ability to de-codify upgrades and
internal, external capabilities are the most significant factors facilitating
environmental upgrading across GPN, RPN and LPN farmers, as indicated by the +*
sign in Table 6.15.
Farmers groups are a proxy for social upgrading. The results suggest that being part of
a farmer group has a negative association with LCEPP and SEUs for GPN farmers,
mostly because top-down groups do not usually help with low complex upgrades and
are fixated on ‘visible to global lead firm’ HCEPP upgrades. Thus, these groups do not
have cohesive ties that enable sharing information outside the specified tasks.
However, RPN and local farmers appear to be part of groups that provide support
when it comes to performing all types of environmental upgrading, indicating that
bottom-up groups seem to be more cohesive. It is important to understand how group
cohesiveness can be enhanced, be it through leadership training, restricting modes of
service delivery, or better partnerships with horizontal actors, so that bottom-up
groups may become more efficient, and so that top-down groups continue to exist,
even after global lead firms ‘leave’ those regions.
Global private standards are not key drivers of environmental upgrading. For GPN
farmers, adhering to a global standard (e.g. GlobalGAP, Tesco Nature) has a positive
and significant association with LCEPP and SEUs upgrades, while a positive but
insignificant relationship with HCEPP. Adhering to global standards does not drive
more complex forms of environmental upgrading. Thus, economic upgrading does
not always lead to environmental upgrading, suggesting the trajectories of
environmental upgrading are complex.

299
Table: 6.15: Comparing environmental upgrading, re-environmentalization and governance across farmers in GPNs, RPNs and
LPNs
Drivers LCEPP LCEPP+HCEPP SEU
Local RPN GPN Local RPN GPN Local RPN GPN Territorial embeddedness: fixed (index) +* +* +* +* + +* +* +* +* Territorial embeddedness: Fluid (index) + + +* +* + +* +* - +* Network embeddedness: Architecture + - + + + + - + + Network embeddedness: Stability + - + +* + + + -* + Written Contract (1=have written contract)
(dummy) - - -* -* - - - + -
Certification type (dummy) - - +* - - + + +* +* Implicit capabilities (index) +* + + +* +* +* - -* + Internal capabilities (share) +* +* +* +* +* +* +* +* +* External capabilities (share) +* +* +* +* +* +* +* +* +* Strategic diversification (1= diversified) (dummy) - -* - - - -* + - + Membership in farmer group (1= in group)
(dummy) + + - +* +* +* - + -
Crop type (1= tree crop) (dummy) +* - -* -* - -* +* +* +* Source: Author’s construction from results
Legend
+ Positive
+* Positive and significant
- Negative
-* Negative and significant
300
In the case of RPN farmers, the HCD Code of Conduct and regional supermarket
standards have an insignificant but negative association with LCEPP and HCEPP,
suggesting that it is causes environmental downgrading to occur. However, it seems
that regional standards do lead to SEU upgrading but, as I argue in this thesis, farmers
across all PNs would perform SEUs regardless of PN participation as a way to
conserve their natural environment in the face of climate variability and extremes.
Hence, regional standards are not drivers of LCEPP, HCEPP or SEU upgrading for
RPN farmers. Overall, these findings suggest that economic upgrading leads to
environmental upgrading in some cases (e.g. GPN farmers’ low complex upgrades),
but mostly environmental downgrading, for RPN farmers. This begs the question on
the efficacy of standards and what makes them sustainable? I discuss this in depth in
Chapter 8.
Strategic diversification, an opportunistic move to participate in different governance
regimes simultaneously, involves approximately 70% of GPN and 41% of RPN
farmers, who sell to more than just one end market. The findings elucidate that
strategic diversification has a negative and statistically significant association with all
forms of environmental upgrading for GPN farmers, while a negative but statistically
insignificant relationship with environmental upgrading for RPN and LPN farmers.
This signifies that opportunistic behaviour leads to environmental downgrading for
GPN, RPN or LPN farmers, but increases income.
Intuitively that suggests that un-diversified farmers (those selling only to one chain)
tend to perform more environmental upgrades, especially so in the case of GPN
farmers. On one hand, it cements the importance of strategic diversification in creating
positive economic outcomes, but on the other it insinuates that this occurs at the cost
of the environment. Drawing from the varieties of rationality discussion, it appears
that the rationality to participate and earn a living, outweighs the conservation
rationality. This creates long term adverse impacts on the farmers’ environment –

301
causing irreversible environmental impacts and thereby threatening the sustainability
of their livelihoods.
It is hard to imagine if environmental downgrading will be anything but detrimental
to the farmer, especially when considering the intrinsic links farmers have to their
farmland as a source of income and sustenance. Environmental downgrading thus
impinges on their ability to continue being a farmer. This implies that the condition of
environmental downgrading, unlike economic downgrading, cannot be a strategic
choice, but is rather an externality. The ‘positionality’ of environmental
upgrading/downgrading vis-à-vis economic and social upgrading is depicted in Table
6.16 below. It indicates that when GPN farmers economically upgrade by adhering to
GlobalGAP and global private standards, it significantly (statistically) leads to LCEPP
and strategic environmental upgrading, but not HCEPP. Yet when they strategically
diversify, it only leads to environmental downgrading. Socially upgrading by being
a member of farmer group, usually leads to environmental downgrading. So,
pursuing economic upgrading with an income maximization rationale seems to cause
environmental downgrading.
The position of environmental upgrading is further questionable, when unpacking the
rent maximizing rationale of lead films. Environmental upgrading is pre-defined by
the goals of the firm and not driven by local needs. Thus, when environmental
downgrading occurs it is seen as an externality by the firm. GPN farmers are often
unable to prevent environmental downgrading because of lack of support from lead
firms. This adversely impacts crop quality and yield, which fuels further contestation,
eventually causing network instability and marginalization of farmers from GPNs.

302
Table 6.16: Linking economic, social and environmental upgrading and
downgrading
Economic
and social
upgrades
Environmental
upgrades-
LCEPP
LCEPP+HCEPP
Strategic
RPN GPN RPN GPN RPN GPN
Economic
Certification - +* - + +* +*
Strategic
diversification
-* - - -* - +
Social Farmer group + - + + + - Source: Author’s construction
Analytically, even in the case of RPN farmers, the process of economic downgrading
is a toss-up between what Blazek (2016) refers to as adaptive downgrading, when
farmers recognize they cannot sustain the competitive pressure in a GPN; and
strategic downgrading, which occurs when an active decision is made to leave the
GPN. However, despite making a conscious decision to economically downgrade,
they continue to perform environmental upgrading to almost the same levels as GPN
farmers. This suggests that chain downgrading (be it adaptive or strategic) did not
deter environmental upgrading. However, economical upgrading, be it following the
HCD code of conduct or strategic diversification, did not induce environmental
upgrading. Hence in a RPN context, economic upgrades do not lead to environmental
upgrades, but multi-scalar downgrading across production networks did fuel environmental
upgrading.
In sum, it appears that economic and social upgrading is a necessary condition for
environmental upgrading, but definitely not a sufficient condition. The path
dependency of environmental upgrading links back to the dynamics of re-
environmentalization and governance structures. This begs the question _- whether
environmental upgrading leads or follows economic and social upgrading. This is a
difficult one to answer. Econometrically, I aim to try and explore this in the next
chapter (chapter 7).

303
This chapter has primarily focused on the three types of environmental upgrades and
downgrades, but not on the actual outcomes created by the same. The main definition
of environmental upgrading is “a process by which actors modify or alter production
systems and practices that result in positive (or reduces negative) environmental
outcomes” [section 3.1.2]. So far, I have focused on the various actors who modify or
alter production systems and practices, but have not yet ascertained whether
performing these creates positive environmental outcomes, I will focus on the
environmental outcomes in the next chapter.
304
7. Exploring the environmental outcomes of environmental upgrading
7.1 Introduction
This chapter seeks to explore whether performing environmental upgrading creates a
positive environmental outcome or not. So far, I have elucidated the key tenants of
PN/VC analysis, embeddedness (and re-environmentalization) and governance, and
how they differ across farmers in global, regional and local networks. Subsequently, I
delved into rethinking and defining environmental upgrading. I developed three
main types of LCEPP, HCEPP and SEU. I then proceeded to unpack the dynamic and
heterogeneous nature of environmental upgrading across farmers in GPNs, RPNs and
LPNs, and the extent to which re-environmentalization, governance and economic
and social upgrading influence and shape it. In this chapter, I attempt to unravel the
outcomes of environmental upgrading, by answering the fifth research sub-question
of: Does environmental upgrading create positive environmental outcomes for farmers in
global, regional and local production networks?
Value chain/production network research has focused on the routines of economic
upgrading, linked to income (or rent generation for firms), and social upgrading
linked to living wages and entitlements. However, when studying environmental
upgrading, there has been an insufficient analysis of what the environmental
outcomes are. By fleshing out the outcomes of environmental upgrading, I will be able
to unpack if performing environmental upgrading is sustainable and promotes
network durability (resilience to price and climate shocks). The results indicate that
environmental upgrading does create positive environmental outcomes, however, in
the cases of GPN farmers, the long-term implications may cause environmental
degradation rather than promote conservation. Overall, the less contested process of
achieving environmental upgrading enabled RPN farmers to reap the most positive
environmental outcomes.

305
This chapter is structured as follows. In the first section, I begin by identifying and
quantifying environmental outcomes into two main categories: improved resource
efficiency/pollution management (IREPM) and pre-emptive conservation (PC). I then
proceed to quantitatively examine to what extent does carrying out more
environmental upgrades create positive environmental outcomes for farmers in
global, regional and local production networks. The third section briefly discusses the
long-term implications of environmental upgrading, before the last section concludes
the chapter.
7.2 Identifying environmental outcomes
Environmental outcome can be direct (visible and easily measurable, and which can
be attributed an economic value) or indirect (less visible and more difficult to measure,
not always observable or valued by market forces). Some outcomes have longer term
impacts that only become visible over time, while others relate to avoiding damage
(pre-emptive measures to protect against climate shocks) which are tougher to
measure because of the social costs involved, as explained in Chapter 3, section 3.1.2.
This thesis identifies two main types of environmental outcomes. The first is improved
resource efficiency and pollution management (IREPM), which relates to a reduction
in the direct and indirect environmental outcomes arising due to eco-inefficiency. The
second is related to pre-emptive conservation (PC), which includes reduction in losses
of yield and assets due to performing tasks to avoid damage58.
58The two selected categories - IREPM and BC - are frequently used in studies at both micro and macro levels. For
instance, Rigby et al. (2001) developed indicators for a farm level study relating to resource efficiency - minimizing
off farm inputs, inputs from non-renewable; and beyond compliance - maximizing knowledge of biological
processes and promoting biodiversity and environmental quality. The Yale Center for Environmental Law and
Policy (YCELP), Center for International Earth Science Information Network (CIESIN) and Economic Forum and
the Joint Research Centre of the European Commission developed sustainability indexes at country levels, using
indicators that hinged on environmental systems and reducing environmental stresses. This included improving
efficiency of resource use and adaption mechanisms. Thus, the two environmental outcome categories outlined in
the thesis, improving resource efficiency, pollution management, as well as conservation (beyond compliance),
appear to be commonly used and important environmental outcomes.
306
I develop indicators for IREPM and PC using a combination of objective measures and
perceptions, as done by Adamowicz et al. (1997). Objective measures include agro-
ecological effects that have been simulated and validated by experts (Rigby et al.,
2001), while the perceptions of farmers reveal their expectations of the critical
outcomes expected (Van der Werf and Petit, 2002). Farber et al. (2002) argue that
perceptions are affected by psycho-cultural aspects, which help capture the reserved
rationality of farmers. Hence, I develop objective indicators and triangulate these
objective measures with famer perceptions to add robustness to the selection of the
environmental outcomes (e.g. Adamowicz et al., 1997)59.
Various indicators of environmental outcomes (IREPM and PC) are developed that
could be linked to different environmental upgrades. For this, I draw on
environmental impact assessments from Murang’a, Meru, Machakos and Nyandarua
to create a list of 12 different indicators. Since these indicators are objective measures,
they could easily be judged by experts. I discussed these indicators with various
experts: 3 KARLO experts, 2 county officers and 1 farmer FGD. I verified if these were
the 12 most critical indicators. I then included these 12 within the questionnaire,
allowing for binary i.e. yes/no questions. This suffices to answer the research question
relating to whether environmental upgrading leads to positive environmental
outcomes or not. Farmers surveyed were asked whether they had experienced any of
these 12 environmental outcomes after performing various environmental upgrades.
59Measuring environmental outcomes is becoming an increasingly important, yet difficult, task (Ferraro, 2009).
This thesis identifies four common measurement techniques. The first, life cycle analysis, is a common process of
measuring environmental impact in a GVC context (Sarkis, 2003). The second, cost-benefit analysis, is frequently
used by environmental economists to value ecosystem services (Garrod and Willis, 1999; Bennett and Blamey, 2001;
Champ et al., 2012) at various scales from the individual to a country. The third is environmental impact
assessments, which endeavour to measure environmental impacts on a project by project basis scoping a range of
impacts (Glasson et al., 2013, Canter, 1997). The fourth are means and effect indicator based measures, which are
proxies of environmental impacts that can capture complex processes (Rigby et al., 2001). The thesis will utilize the
objective indicators as they provide specific scores for each environmental outcome that can be linked back to the
type of environmental upgrade performed.

307
By triangulating the results of the farmers with the expectations from the expert panel,
I was able to ensure that the stated answers of the environmental outcomes were
robust.
7.2.1 Environmental outcome: Improved resource efficiency and pollution
management
The first category, IREPM, consists of 7 objective indicators, which range from
increasing energy efficiency to improving natural resource management as well as
pollution management indicators linked to reducing chemicals used and waste
generation as depicted in Table 7.1. Most IREPM outcomes are primarily direct i.e.
they have components that can be measured by economic values and expert
judgement. The results indicate that GPN and RPN farmers benefit most from
reducing the direct impacts of pollution management outcomes, while local farmers
especially find it difficult to achieve resource efficiency linked outcomes. Over 80% of
GPN and RPN farmers claimed that by performing different environmental upgrades
they were able to achieve a decrease in inorganic waste generation, reduction in
leaching, increase in crop yield, and diminishing effects due to wind erosion. In the
same vein, over 65% of local farmers also said that following environmental upgrades
abetted decreasing waste generation and increasing crop yields.
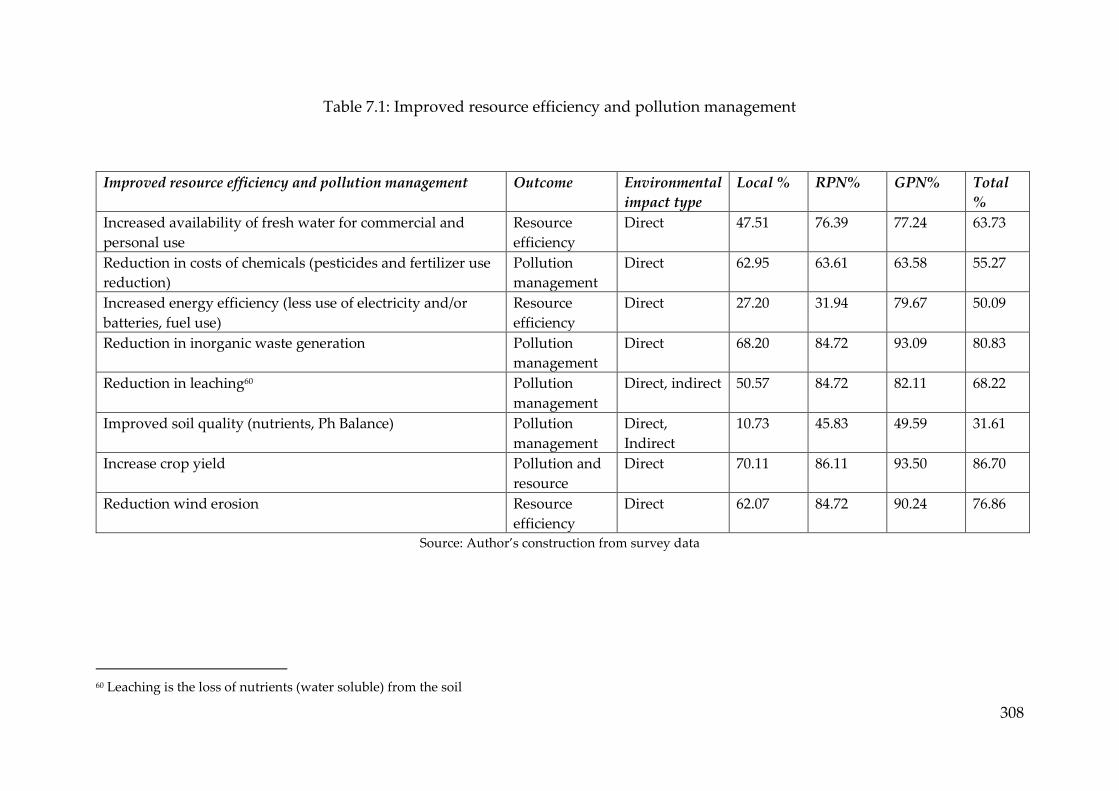
308
Table 7.1: Improved resource efficiency and pollution management
Improved resource efficiency and pollution management Outcome Environmental
impact type
Local % RPN% GPN% Total
%
Increased availability of fresh water for commercial and
personal use
Resource
efficiency
Direct 47.51 76.39 77.24 63.73
Reduction in costs of chemicals (pesticides and fertilizer use
reduction)
Pollution
management
Direct 62.95 63.61 63.58 55.27
Increased energy efficiency (less use of electricity and/or
batteries, fuel use)
Resource
efficiency
Direct 27.20 31.94 79.67 50.09
Reduction in inorganic waste generation Pollution
management
Direct 68.20 84.72 93.09 80.83
Reduction in leaching60 Pollution
management
Direct, indirect 50.57 84.72 82.11 68.22
Improved soil quality (nutrients, Ph Balance) Pollution
management
Direct,
Indirect
10.73 45.83 49.59 31.61
Increase crop yield Pollution and
resource
Direct 70.11 86.11 93.50 86.70
Reduction wind erosion Resource
efficiency
Direct 62.07 84.72 90.24 76.86
Source: Author’s construction from survey data
60 Leaching is the loss of nutrients (water soluble) from the soil

309
According to Table 7.1, the improvement in soil quality (high acidification, low
nutrients) was clearly expressed by all farmers as an area where positive outcomes
were not easily visible. Only 31% of all farmers reported to have improved soil quality
by performing environmental upgrading. Agricultural experts reported that most soil
quality issues are indirect and can have repercussions that are invisible now but
increase in severity over time. Some that arise are temporary, yet others such as
continuous acidification and lack of maintaining PHI intervals could cause permanent
damage (Interviews: #1kedu, #2kedu).
The outcome ‘reduction in cost of chemicals’ appears to have been experienced almost
equally by GPN, local and RPN farmers. However, energy efficiency, a key outcome
of resource management, was claimed to be experienced mostly by GPN farmers and
rarely by RPN or local farmers. GPN farmers interviewed reported that using
calibrated spray equipment would reduce excess wastage of chemicals, and the need
to frequently check irrigation equipment. Also using more solar energy for electricity,
reduced overall costs of operation, which also led to reduction in rejection rates
(Interviews: #2kf, #4kf).
Overall, the data suggests that local farmers experience less improvement in
environmental outcomes as they perform fewer environmental upgrades. For
instance, many local farmers complained that poor soil quality occurred because of an
inability to perform certain LCEPP and HCEPP environmental upgrades due to
limited resources and lack of external learning support. This led to worsening soil
quality and eschewed a vicious cycle.
7.2.2. Environmental outcome: Pre-emptive conservation
This thesis identifies four indicators for PC. The first two are related to reduction in
losses accrued in assets or yields due to floods, drought or climate variability
(unseasonal rains, frequent fluctuations in temperature), while the others are linked
to conservation of natural resources. Most of these outcomes are related to avoiding
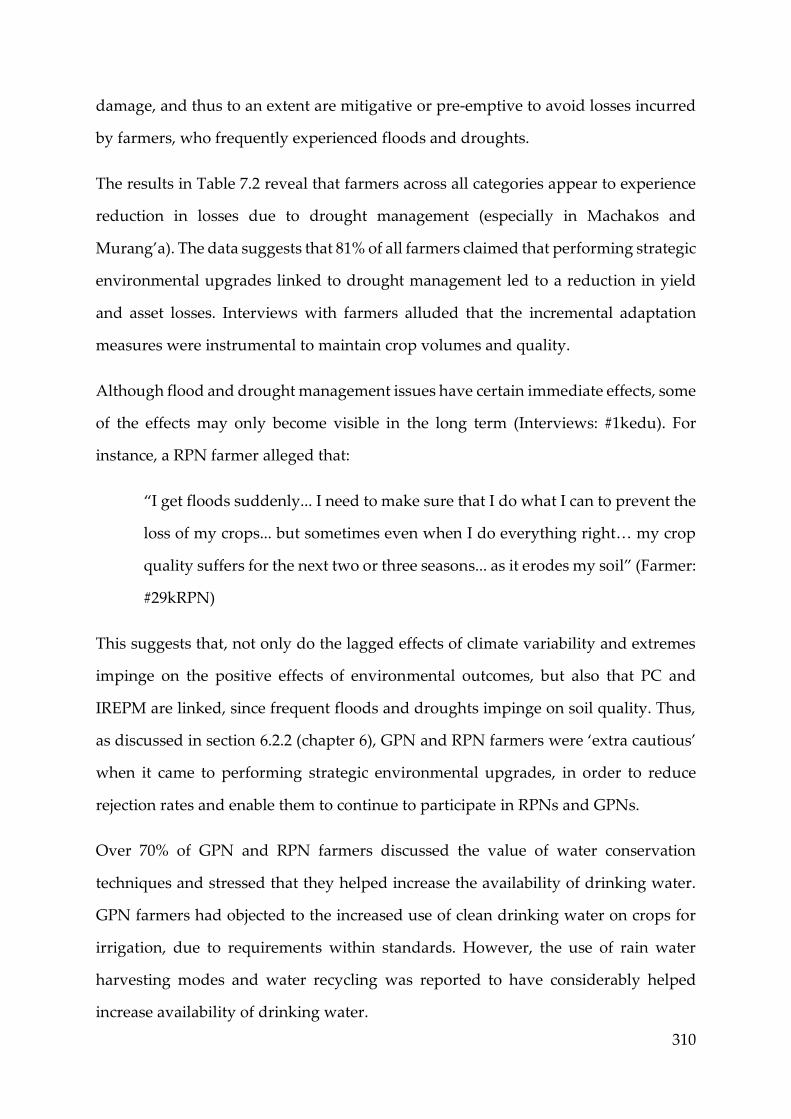
310
damage, and thus to an extent are mitigative or pre-emptive to avoid losses incurred
by farmers, who frequently experienced floods and droughts.
The results in Table 7.2 reveal that farmers across all categories appear to experience
reduction in losses due to drought management (especially in Machakos and
Murang’a). The data suggests that 81% of all farmers claimed that performing strategic
environmental upgrades linked to drought management led to a reduction in yield
and asset losses. Interviews with farmers alluded that the incremental adaptation
measures were instrumental to maintain crop volumes and quality.
Although flood and drought management issues have certain immediate effects, some
of the effects may only become visible in the long term (Interviews: #1kedu). For
instance, a RPN farmer alleged that:
“I get floods suddenly... I need to make sure that I do what I can to prevent the
loss of my crops... but sometimes even when I do everything right… my crop
quality suffers for the next two or three seasons... as it erodes my soil” (Farmer:
#29kRPN)
This suggests that, not only do the lagged effects of climate variability and extremes
impinge on the positive effects of environmental outcomes, but also that PC and
IREPM are linked, since frequent floods and droughts impinge on soil quality. Thus,
as discussed in section 6.2.2 (chapter 6), GPN and RPN farmers were ‘extra cautious’
when it came to performing strategic environmental upgrades, in order to reduce
rejection rates and enable them to continue to participate in RPNs and GPNs.
Over 70% of GPN and RPN farmers discussed the value of water conservation
techniques and stressed that they helped increase the availability of drinking water.
GPN farmers had objected to the increased use of clean drinking water on crops for
irrigation, due to requirements within standards. However, the use of rain water
harvesting modes and water recycling was reported to have considerably helped
increase availability of drinking water.
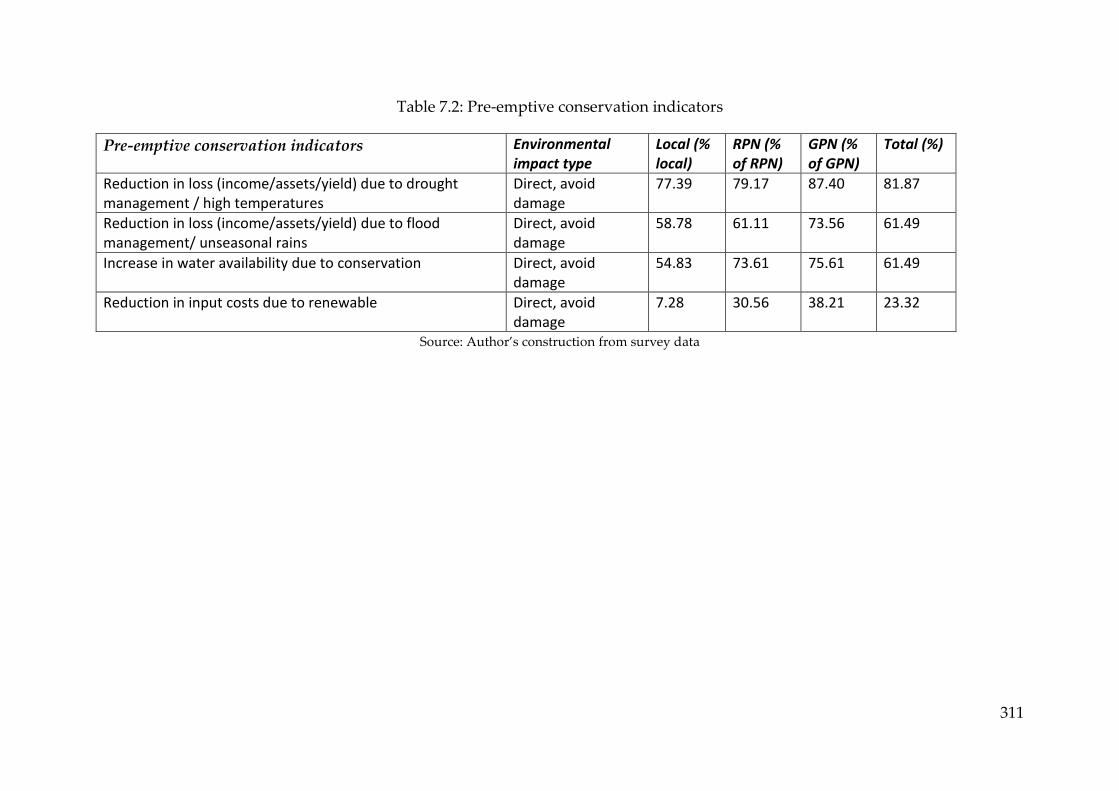
311
Table 7.2: Pre-emptive conservation indicators
Pre-emptive conservation indicators Environmental impact type
Local (% local)
RPN (% of RPN)
GPN (% of GPN)
Total (%)
Reduction in loss (income/assets/yield) due to drought management / high temperatures
Direct, avoid damage
77.39 79.17 87.40 81.87
Reduction in loss (income/assets/yield) due to flood management/ unseasonal rains
Direct, avoid damage
58.78 61.11 73.56 61.49
Increase in water availability due to conservation Direct, avoid damage
54.83 73.61 75.61 61.49
Reduction in input costs due to renewable Direct, avoid damage
7.28 30.56 38.21 23.32
Source: Author’s construction from survey data

312
Farmers from all PNs claimed the importance and usefulness of using renewable
energy sources (small bio-gas plant, solar panels and chargers) for electricity and
supporting the use of productive capital. However, only 7% of local farmers claimed
it reduced input costs (especially non-renewable like fuel), compared to 38% of GPN
farmers. These low numbers can be attributed to the low efficiency (low storage
potential) of energy equipment for renewables sold to farmers, which did not help
reducing energy needs (Interviews: #4kcgov, #5kcgov, #7kcgov, #8kcgov).
7.2.3 Environmental indexes
Principal component analysis, similar to the method used for calculating indexes61 in
Chapter 5 and 6, are employed to capture a single measure that takes into account the
multi-dimensional aspects of different environmental outcomes.
Table 7.3 depicts the average values for IREPM and PC. IREPM was calculated using
the 7 outcomes from table 7.1, while PC was calculated using the 4 outcomes for Table
7.2. The results are scores that range from 0 to 1, where 0 represents no positive
environmental outcome, while 1 represents the best possible environmental outcome.
Table 7.3: Environmental index of environmental outcomes
Environmental Index LPN RPN GPN
Improved resource efficiency and
pollution management Index (IREPM)
0.406
(0.009)
0.573
(0.023)
0.613
(0.013)
Pre-emptive conservation index (PC)
0.382
(0.012)
0.578
(0.027)
0.621
(0.015) *values in brackets are std. errors Source: Author’s construction from survey data
Overall, the results indicate that GPN farmers experience the most positive environmental
outcomes, both in terms of IREPM and PC, followed by RPN and local farmers, suggesting a
61 Indices such as the environmental sustainability index consist of 21 indicators that are equally weighted. Such
equal weighting is used across multiple indicators including the human development index and well-being
indexes (Böhringer and Jochem, 2007). However, the method has its limitations. For example, Bockstaller et al.
(1997) explain that, when creating an index, equal weights are given to all outcomes, thus overcompensating or
possibly under compensating the true effects. Further issues such as long-term versus short-term effects,
reversible or irreversible effects, whether they cause additive or multiplicative problems, may further cause
complications in aggregation (Levitan et al., 1995). Esty et al. (2005) claim that when multiple stakeholders are
involved, it is almost impossible to get a united picture of which factors are most important, especially because of
the different priorities and motivations which each of the actors have.

313
high correlation to all types of environmental upgrades. In the next section, I further nuance
this correlation by discussing the links between LCEPP, HCEPP and SEU
environmental upgrades and environmental outcomes, as well as the links to
economic and social upgrading/downgrading.
7.3 Environmental upgrading, environmental outcomes and its links to
economic and social upgrading
By answering the research sub-question of whether performing environmental
upgrading leads to positive environmental outcomes, I endeavour to address three
critical points. The first reinforces the importance of environmental upgrading in
PNs/VCs. Secondly, I want to reveal if environmental outcomes vary when
performing LCEPP, HCEPP or SEUs. The third is whether performing, environmental
upgrading in conjunction with economic and social upgrading leads to better
environmental outcomes.
The results in Table 7.4 indicate, as I have already stated, that the more complex
environmental upgrades performed, the better the environmental outcomes
experienced. For instance, local farmers predominantly perform LCEPP, which
appears to correlate to lower IREPM and PC outcomes, while both GPN and RPN
farmers perform more HCEPP, which seems to lead to better IREPM and PC
outcomes. This would suggest that higher complexity environmental upgrades,
despite being relatively unknown to most farmers, potentially produce a higher
magnitude of effect on both IREPM and PC environmental outcomes than LCEPP.
314
Table 7.4: Environmental upgrading, environmental outcomes and income
Farmer
categories
LCEPP
(avg no.)
LCEPP+HCEPP
(avg no.)
Strategic
(avg no.)
IREPM
(avg
value)
PC
(avg
value)
Income
(Gross
USD/year)
LPN 10.68 (0.16)
13.16 (0.23)
5.52 (0.14)
0.40 (0.01)
0.38 (0.01)
945.33 (49.58)
RPN 13.29 (0.29)
17.43 (0.49)
6.34 (0.27)
0.57 (0.02)
0.57 (0.02)
1170.21 (118.89)
GPN 13.57 (0.14)
18.42 (0.25)
6.35 (0.14)
0.61 (0.01)
0.62 (0.01)
1661.18 (101.16)
*values in brackets are std. errors Source: Author’s construction from survey data
As I show in Chapter 6, environmental upgrading does not occur in isolation and is
affected by economic and social upgrading. It is therefore important to unpack
whether economic and social upgrading affect environmental outcomes as well. This
means that it is also necessary to account for whether environmental upgrading
impacts income levels which are key outcomes of economic and social upgrading.
From Table 7.4, it appears that GPN farmers perform the most environmental
upgrades, have the best environmental outcomes relative to RPN and local farmers
and also earn the highest income. I now intend to econometrically explore whether
environmental upgrading does indeed have a statistically significant effect on
environmental outcomes and incomes, as well as to delve deeper into the nexus of
economic, social and environmental upgrading.
7.3.1 Regression results: implications of environmental upgrading
To uncover these relationships, I employ a method called iterated seemingly unrelated
regressions (ISUR). Since IREPM, PC and income are related to each other, they can
be considered a group of dependent variables. The regressors (independent variables)
for each differ slightly. While it is possible to estimate each regression (one for IREPM,
the other PC and third income) separately (i.e. running linear regressions for each
individually), it would impose a condition that there is no relationship between the
equations. However, because IREPM, PC and income are inter-related, the error terms
of these equations may be correlated. If the error terms are correlated, then there is a
gain in the efficiency of the estimator by jointly estimating the system of equations
315
(Zellner, 1962). The SUR is a special case of the generalized regression model.
Intuitively, the results are quite similar to single equations, with an introduction of
serial correlation, which adds information and thereby suggests that drawing
statistical inferences collectively would enhance the estimators (Cameron and Trivedi,
2009). To further improve the model62, I use an iterated process over the estimated
disturbance covariance matrix and parameter estimates until the parameter estimates
converge. Under seemingly unrelated regressions, this iteration converges to the
maximum likelihood results. Performing a conditional mixed process estimator (non-
recursive) and a structural equation model with observed exogenous variables for
robustness shows that the results are almost identical (Roodman, 2009). The
econometric model of the iterated SUR (ISUR) model is reviewed in Appendix 28.
Results
Overall, the results indicate that LCEPP, HCEPP and SEU have a positive and
statistically significant effect on environmental outcomes, which is confirmed through
the qualitative discussion (presented in Table 7.5). The results also indicate that a unit
increase in LCEPP, HCEPP and strategic environmental upgrading leads to an
increase of between 0.022-0.033 in IREPM and PC. Thus, environmental upgrading is
indeed a significant factor that creates positive environmental outcomes, confirming
the qualitative results in section 7.3. It is critical to note that the results in Table 7.5
also elucidate that it is more likely that a RPN farmer has significantly better
environmental outcomes than local or GPN farmers. The mean difference when local
farmers move from local to regional chains/networks (0.024) is higher than the move
from local to GPN (0.020) for IREPM, suggesting RPN farmers experience better
environmental outcomes than GPN or local farmers. The results are similar for PC.
This means that RPN farmers, in general due to their higher absorptive capacity and
internalization of knowledge, tend to experience better environmental outcomes.
62I also bootstrap for 500 replications.

316
The fact that a unit increase in SEU is actually more beneficial than a unit increase in
LCEPP reinforces the need to include strategic elements into environmental
upgrading to ensure significant improvement in environmental outcomes. The lack of
performing SEUs could lead to environmental downgrading, which could affect crop
yield and quality, leading to contract default and ultimately exclusion of GPN or RPN
farmers from selling to global and regional supermarkets.
It appears that HCEPP has the most positive effect on IRPM and PC. As I explain in
Chapter 5 and 6, HCEPP involves complex tasks, such as spray schedules and water
testing, that are often unknown to farmers and are usually specific requirements that
emerge when participating in GPNs, and to some extent RPNs. HCEPP upgrades are
points of most contention between GPN farmers and their buyers, but the regression
results suggest that performing them yields positive environmental outcomes. This
would also imply that regardless of poor network stability and lack of cooperation, it
is still possible to attain positive environmental outcomes. However, the long-term
sustainability of such a relationship is questionable. A limitation of this thesis is that
it cannot unpack the long-term effects due to the lack of panel data. . The results are
valid only for the cross section (at a specific point of time) of data collected.
The results pose interesting nuances for understanding the interplay between
economic, social and environmental upgrading as well. Both, social upgrading
(farmer groups, hygiene) and economic upgrading (global and regional standards,
strategic diversification) have negligible impact on improving environmental
outcomes. In terms of social upgrading, membership in a farmer group seems to have
almost no impact on IREPM or PC environmental outcomes, but adhering to hygiene
requirements does seem to have a positive and significant effect on improving IREPM.
Performing economic upgrades, such as having GlobalGAP or following the regional
HCD Code of Conduct, has a positive but insignificant effect on IREPM and PC. Thus,
it reiterates that even though both these standards market themselves as food safety
and sustainability standards, they do not seem to create positive environmental
317
outcomes. Thus, as I mentioned in chapter 6, it mandates a need to rethink the
importance and relevance of these certifications, especially those related to the
environment.
The results also verify that farmers who are strategically diversified earn higher
incomes, but such a process does not lead to positive environmental outcomes. Thus,
strategic diversification is set up for commercial gain rather than environmental
benefit. Therefore, the probability of increasing both IREPM and PC is higher when
farmers across GPNs, RPNs and LPNs chose to environmentally upgrade by
performing LCEPP, HCEPP and SEU as well as when they socially upgrade by
following hygiene practices.
Does environmental upgrading lead to increasing income? Overall, the results bring
to light that performing more complex environmental upgrades lead to increase in
income. The results in Table 7.5 indicate that performing more LCEPP upgrades has a
statistically significant, but negative, effect on income, suggesting that it is not
sufficient to perform LCEPP to earn higher incomes. However, performing HCEPP
upgrades has a positive and significant effect on income. This bolsters the fact that
‘visible’ aspects of environmental upgrading (such as spraying for MRLs and crop
quality) are required to be carried out by GPN farmers in order to receive higher
incomes. The inability to perform HCEPPs leads to high rejection rates and possible
marginalization or exclusion from participating in a GPN. In the case of strategic
environmental upgrading, results indicate a positive (though not statistically
significant) relationship with income. This suggests that it is mostly GPN or RPN farmers
who are able to secure higher income as they perform HCEPP upgrades, and that global and
regional lead firms only seem to reward farmers if they perform HCEPP and not LCEPP or
strategic environmental upgrading.
Therefore, these results allude to a very important fact that participating in GPNs or
RPNs increases income but performing environmental upgrades are not usually

318
rewarded. The implications could potentially cause long term problems to the quality
of natural endowments, and the sustainability of livelihoods. Poor quality of natural
resources effects the process of environmentalizing into GPNs and RPNs by damaging
the socio-environmental relations between dyads. This is turn has significant effects
on being able to perform environmental upgrades. In sum, this can lead to a vicious
cycle which eventually leads to the marginalization of farmers from participation in
GPNs and RPNs.

319
Table 7.5: Results for environmental upgrading types (iterated SUR)
Variables IREPM PC Log Income
Coefficient SE Coefficient SE Coefficient SE
Environmental upgrading LCEPP 0.0225** 0.0013 0.0269*** 0.0016 -0.03123***
0.0093
Environmental upgrading HCEPP 0.0232*** 0.0019 0.03245*** 0.0023 0.0233* 0.0140
Environmental upgrading SEU 0.0229*** 0.0017 0.0223*** 0.0023 0.0114 0.0121 Implicit capabilities -0.0020 0.0004 0.0004 0.0004 0.0057** 0.0022 Territorial: Natural endowments 0.1646*** 0.0230 0.3545*** 0.0367 1.1786*** 0.1960 Territorial: Fluid -0.0168*** 0.0063 -0.0025 0.0072 -0.1748*** 0.0301 Value chain participation:
- Regional production network 0.0234*** 0.0059 0.0254*** 0.0081 0.0197 0.0536 - Global production network 0.0201*** 0.0055 0.0001 0.0065 0.0675 0.0446 Type of crop 0.0556*** 0.0070 0.0245*** 0.0072 -0.2701*** 0.0434
Economic: Value addition 0.0023** 0.0013
-0.0204 0.0206 Economic: Certification type 0.0022 0.0064 0.0064 0.0066 0.0711 0.0467 Economic: Strategic diversification 0.0817* 0.0438 Social: Hygiene 0.0076*** 0.0027
Social: Farmer group 0.0003 0.0003 -0.0005 0.0004 0.0034 0.0021 Distance from main buyer
-0.004 0.0398
Constant -0.1349*** 0.0165 -0.3398*** 0.0195 2.6988*** 0.1018
R-sq 0.7331*** 0.7428*** 0.2921*** *** significant at 1% level, ** significant at 5%, * significant at 10%
Note: Performed robustness test in Appendix 31, 32 with conditional mixed recursive processes(CMP): non-recursive simultaneous
equations. Most of the coefficients have similar magnitudes. However, the standard errors of the Iterated SUR are lower and, thus,
this is the preferred model.

320
The type of crop has a statistically significant bearing on both environmental
outcomes as well as income. It appears that tree crops generally create positive
environmental outcomes, as trees provide various ecosystem services that short-term
crops cannot. If farmers grow short term crops, then their income increases by 0.27
units. Thus, short term crops seem to be commercially more viable than tree crops, but
then do not create positive environmental outcomes to the same extent as tree crops.
In sum, environmental upgrading does lead to positive environmental outcomes, but
does not necessarily increase income significantly (except when performing HCEPP
upgrades). Furthermore, performing economic and social upgrading, along with
environmental upgrading, does not always create positive environmental outcomes.
7.4 Long term effects of environmental upgrading and downgrading
Interviews with agricultural extension officers, academics, members of business
associations and NGOs suggested that the long-term impacts of performing
environmental upgrades were questionable. For instance, they pointed out that rising
crop yields, with increased soil acidification and nutrients was unsustainable and that
it would cause significant soil degradation in the future (Interviews: #1kba, #3kcgov,
#6kcgov, #1kedu, #3kedu). In that case, IREPM environmental outcomes may no
longer stay positive, even if more LCEPP or strategic environmental upgrades were
performed. Rather investment will need to be made in expensive HCEPP upgrades,
such as soil rejuvenation measures, if farmers are to continue to grow healthy and
quality crops (Interviews: #1kba, #3kcgov).
Experts also claimed that growing crops in blocks was a poor practice, because it leads
to increased mono-cropping that reduces soil quality and increases water usage
(Interview: #2kedu, #1kNGO). GPN farmers reported that Kenyan export firms would
expect them to grow in blocks, because it would be cheaper to apply for GlobalGAP
certification (Option 1)63. However, if farmers grew non-certified crops on the same
63Ceritifcaiton for an individual producer (eg: the Kenyan export firm)
321
site then there would be a requirement to apply for parallel production, which would
entail extra costs. Thus, growing in blocks enabled export firms to keep costs of
compliance down. Interviews with farmers who were excluded from GPNs echoed
that this increased block intensification was not executed sustainably. Thus, rather
than increasing crop yields, it depleted soil nutrients and reduced crop quality
(Interviews: #1kf).
Thus, although environmental upgrades create positive environmental and economic
outcomes, the long-term effects are questionable. There is a need to re-look at the types
of environmental upgrades carried out. Interviews highlighted that bottom-up
participation from farmers (local knowledge inclusion) when performing
environmental upgrades would enable bringing the ‘local back’, and thus enhance the
natural environment and efficacy of environmental upgrades. Overall, this thesis
unequivocally points out that environmental upgrading, re-environmentalization and
governance are three interrelated and dynamic factors that over time shape and re-
shape each other and have significant implications for farmer marginalization and
long-term sustainability of the network.
7.5 Concluding remarks
This chapter develops novel environmental outcome indicators of improved resource
efficiency-pollution management and pre-emptive conservation; and shows that
environmental upgrading leads to positive environmental outcomes. I statistically
prove that each type of environmental upgrading is of equal importance i.e. the
magnitude of effect on environmental outcomes by performing SEUs is comparable
to LCEPP and HCEPP, cementing its necessity when thinking about environmental
upgrading, and thus performing only HCEPP or LCEPP or SEU alone is not good
enough.
The results suggest that GPN and RPN farmers are more likely to achieve better
environmental outcomes and income than LPN farmers. However, RPN farmers
because of their higher absorptive capacity (internalization capabilities) seem to be

322
reaping a greatest benefit (of the three) by experiencing a higher magnitude of positive
environmental outcomes than GPN and LPN farmers.
It is also significant to point out that HCEPP to be the only form of environmental
upgrading that GPN and RPN farmers get a significantly higher income from.
Performing LCEPPs is associated with negative effects on income while SEUs have an
insignificant impact on income levels. This reveals that global and regional lead firms
do not ‘pay’ or reward farmers who do environmental upgrades to better their natural
environment, but are only focused on product quality. This raises questions as to
whether HCEPP or LCEPP upgrades engender sustainable development? Do we need
new models for achieving and understanding what is truly ‘sustainable’ in a PN/VC
context? I flesh out these thoughts further in Chapter 8.
Mutually related is the fact that this chapter statistically shows the inefficacy of both
global and regional private standards in relation to environmental outcomes, by
showing that there is an insignificant relationship with both IREPM and PC
environmental outcomes. This reinforces the findings in Chapter 6, suggesting that
certifications are not key drivers to environmental upgrading. Clearly even though
these standards claim to be ‘driven by sustainability’ (GlobalGAP, 2016), they do not
appear to be driving positive environmental outcomes. That begs the question: is it
worth converging regional standards to global standards? This is especially a
challenge if there is no long-term beneficial impact on the environment, but increased
cost associated with complying to more stringent specifications.
Global standards such as GlobalGAP seem to be acting as just market barriers that
enable or dis-enable market participation instead of instruments that promote
sustainable development. This throws up a crucial question on the efficacy and
usefulness of agro-standards and certifications in addressing issues beyond market
participation to sustainable livelihoods.

323
The other critical finding questions if performing is environmental upgrading in
conjunction with economic and social upgrading, leads to positive environmental
outcomes. The results appear to be mixed, which again throws up doubts on whether
upgrading at all really does lead to any sustainable outcomes. Some social upgrades
such as hygiene and economic upgrades such as value addition of crops, performed
alongside environmental upgrades seem to bolster environmental outcomes. But
being part of a farmer group and certifications, does not seem to improve
environmental outcomes of IREPM or PC.
Unlike economic downgrading, which can be beneficial, it is hard to imagine if
environmental downgrading will be anything but detrimental to the farmer,
especially when considering the intrinsic links farmers have to their farmland as a
source of income and sustenance. Environmental downgrading causes environmental
damages, by negatively effecting IREPM and PC, and thus impinges on farmers’
ability to continue being a farmer. Viewed in this way, the condition of environmental
downgrading, unlike economic downgrading, cannot be a strategic choice, but is rather
an externality. For instance, it is possible that continuous environmental downgrading
can cause long-term damage to ‘territories’ of farmers, both in terms of the fixed and
fluid aspects, which then hamper their ecologically reciprocal relationship with
nature, and that can filter into social relations with the network. This affects the ease
of environmentalizing into GPNs, and their capabilities, which in turn impacts
farmers’ ability to perform environmental upgrades. Thereby, this creates a vicious
circle that ultimately leads to exclusion or marginalization from participating in a
GPN or RPN.

324
8. Conclusion: Analytical observations and contributions
This thesis addresses three different gaps in production networks and value chain
research through the case of Kenyan horticulture. The first involves interrogating how
and why inserting the ‘natural environment’ into GPN/GVCs is critical, by unpacking
how it affects embeddedness, governance and upgrading. The second involves
breaking away from an (over) emphasis on the lead firm in GPN/GVC research to
place a central focus on farmers, capturing multiple production networks from the
‘bottom up’. The third contribution involves moving beyond the “global”, as the
tendency of production networks is to focus on linkages between Northern lead firms
and their Southern suppliers, to consider the growing importance of regional and local
production networks and how they interact with the global. It is within this changing
context that I comprehend both the altered epistemology and account for the role of
the environment. This has substantial implications for how to ‘understand’ key
conceptual categories: governance, as something that ‘is experienced’ rather than
‘being governed’; embeddedness as a ‘process of embedding into new socio-
environmental relationships in GPNs, RPNs or LPNs (what I call re-
environmentalization) rather than just focus on how firms embed into territories or
change networks’; and rethinking the linearity of upgrading, studying what it means
to a farmer, instead of assuming that all upgrades are beneficial to farmers
The overarching question this thesis seeks to address is: What are the dynamics of
environmental upgrading, embeddedness and governance for farmers in global, regional and
local production networks? I find clear evidence to challenge the long standing implicit
assumption of the linearity of environmental upgrading, suggesting that it is a
dynamic, non-linear and complex process that varies significantly across farmers in
global, regional and local PNs. There are two main reasons. Firstly, there are
significant differences in the ease through which farmers re-environmentalize into
GPNs, RPNs and LPNs. The reliance on standards ‘forced’ GPN farmers to perform
environmental upgrades that are not necessarily beneficial for the long-term

325
sustainability of their environment. Thus, GPN farmers have contested socio-
ecological relationships with their buyers. In several cases, GPN farmers have
experienced downgrading, both in terms of environmental degradation and
economically due to marginalization from the network. Re-environmentalizing into
RPNs (and to an extent LPNs) is smoother, engendering stability and trust in their
networks. Furthermore, regional and local buyers are yet to enforce stringent
environmental standards, and have much less control on the environmental upgrades
performed by farmers, facilitating the ease of farmers to re-environmentalize into
RPNs and LPN. I demonstrated that re-environmentalization is dynamic and
generates reciprocal feedback effects, both on the network architecture and stability,
and the natural environment.
Secondly, when considering governance through farmer epistemologies, I found that
there are significant differences in the capabilities of GPN, RPN and LPN farmers and
in their ability to de-codify complex transactions. GPN farmers are more dependent
on external forms of knowledge than RPN or local farmers, as they have to perform
high complexity environmental upgrades, which have been introduced by the buyer
and are thus relatively exogenous or unknown to them. However, accruing such
knowledge is a challenging process for some GPN farmers because of their poor
network stability and the lack of trust in their networks. RPN farmers proactively
stimulate longer lasting relationships with regional buyers and have higher ability
than GPN farmers to bargain for better terms of the contract. Thus, governance and
processes of re-environmentalization are interrelated and co-constituted and have
statistically significant implications for the trajectories of environmental upgrading
and downgrading. This indicates the importance of conceptually enriching PN/VC
studies by considering the ‘environment’ and giving agency to actors other than lead
firms to obtain a nuanced understanding of the varied implications for different
actors. Thus, this thesis fleshes out the complexities arising between environmental

326
upgrading, (re-)environmentalization and governance, by highlighting how they vary
across multiple production networks.
In the following sub-sections, I highlight my main results, contributions and discuss
further implications of environmental upgrading, re-environmentalization and
governance. I then proceed to discuss my methodological contributions and the
possibility of extending my framework across sectors and actors. The penultimate
section draws out implications for broader debates around sustainable development
and the formalization of regional and local markets. The last section delves into areas
of further research, outlining important questions that can enhance and enrich GPN
and GVC analysis.
8.1 Thesis contributions
Under each of the headings of environmental upgrading, re-environmentalization and
governance, I explicate conceptual, empirical and methodological contributions and
flesh out further implications. Within conceptual contributions, I extend the production
networks framework by adding new theories to enhance how we define and interpret
upgrading, embeddedness and governance; while empirical contributions, aim to
explicate which seek to compare re-environmentalization, governance and upgrading
across farmers in GPNs, RPNs and LPNs ; and the third type of contribution is
methodological which relates to novel methods of measurement and quantification of
embeddedness, governance and upgrading. I explain the methodological
contributions in section 8.2
8.1.1 Environmental upgrading and environmental outcomes
The definition of environmental upgrading has been labelled fuzzy because certain
unstated assumptions are widely made in defining these terms. The first issue is an
epistemological one, as there is often no specific recognition of upgrading ‘for whom’
and ‘what it means to different actors’. Another implicit assumption is the unit of
analysis, as to whether it is at the level of specific ties/actors within a chain (e.g.
Barrientos et al., 2011), or transaction flows (e.g. Dallas, 2015). Both these issues are

327
addressed in this thesis by re-orienting the refence point and re-mapping the
production network from the entry point of the farmer. This provided a refined
agency to understand upgrading from a farmer perspective. Thus, this thesis adds to
the GPN/GVC literature by systematizing the definition of upgrading
epistemologically, and unravelling the implications for specific actors, which enables
developing targeted policies.
I further conceptual understandings of environmental upgrading by rethinking the
conventional focus on the lead firm and large suppliers and the disproportionate
emphasis on economic upgrading (e.g. DeMarchi et al. 2013a, b). As I alluded to in my
discussion in Chapter 6 and 7, economic and social upgrades are relatively exogenous
to the farmer i.e. many of the requirements such as producing value added, adhering
to certifications or performing hygiene requirements were unknown to the farmer
before supplying into specific global or regional PNs. However, by virtue of their
livelihood, many farmers are already performing certain environmental upgrades
regardless of participation in Northern markets. This suggests that, when it comes to
the environment, farmers may act irrationally or act with what this thesis posits as
reserved rationality, which means maximizing income but not at the expense of
damaging their natural environment (farmers seek to conserve and protect their
environment/land for purposes of care, attachment, bequest). This indicates how
important it is to rethink environmental upgrading from not only a farmer
perspective, but also when studying from the perspective of any local actor, especially
if they have ‘irrational’ links to their territory.
A critical empirical contribution of this thesis is that it debunked the assumed linearity
in upgrading, showing that it is dynamic and heterogenous across farmers in GPNs,
RPNs and LPNs. But for doing so, there was a need to move beyond a ‘product’ and
‘process’ distinction, which are often difficult to distinguish from each other as they
are deeply interconnected (e.g. Gibbon and Ponte, 2005; Ponte and Ewert, 2009).
However, farmers in GNPs, RPNs and LPNs struggle not because of whether an

328
upgrade is ‘product’ or ‘process’ related, but rather because some environmental
upgrades are more complex than others. So rather than distinguishing terms that are
intertwined, I differentiated environmental upgrading by complexity (low complexity
and high complexity). The results indicated that GPN farmers performed the highest
number of LCEPP and HCEPP upgrades, but this occurred under contested situations
which reduced network stability. At the opposite end of the spectrum, LPN farmers
performed the least number of environmental upgrades, especially HCEPP, as many
were unware of its existence and others did not get support from networks to carry
out complex upgrades.
Understanding environmental upgrading this way becomes even more important
when considering that farmers participating in global, regional and local PNs co-exist
in similar territories. This suggest that upgrading can occur due to ‘place’ and due to
‘learning from chains’. I am able to illustrate this through the RPN farmer case. RPN
farmers performed almost similar levels of upgrades to GPN farmers despite having
lower strength of tie with vertical or horizontal actors than their counterparts. This
was partly because a spillover effect occurred, wherein farmers who chain
downgraded from GPNs, ‘spilt over good practices’ they had learnt explicitly from
vertical and horizontal actors, when participating Northern markets. It is critical to
note that spillovers on their own are insufficient to propagate environmental
upgrading, without adequate absorptive capacity. The results from my simulation in
Chapter 6 indicating that RPN farmers are able to internalize external knowledge and
convert it into tacit forms so that they can perform environmental upgrades optimally.
Another significant dimension to upgrading is that it is not just a top-down vertically
governed process, but a horizontal and bottom-up one too. I can examine this finding
by including the bio-physical aspect of climate variability and climate extremes within
strategic environmental upgrading. There is a need to perform indigenous
‘adaptations’ to such hazards in order to prevent decline of crop quality and
marginalization from participating in the GPN/RPN/LPN.

329
Drawing on the literature on adaptation (e.g. Adger et al., 2005, 2007, 2012; Eriksen et
al., 2005), I integrated key dimensions of coping into GPN/GVC analysis. As this thesis
shows, GPN, RPN and local farmers all perform strategic environmental upgrades
(SEU) to a very similar extent, suggesting that all farmers find it critical to perform
these irrespective of the final buyer. I find that lack of doing strategic environmental
upgrades led to environmental degradation and even exclusion from participating in
global and regional markets. This demonstrated the inelasticity of doing such
upgrades. Strategic upgrades also bring to light the reserved rationality of farmers,
which dictates the thresholds or limits of a farmer’s rationality. Even with the lucrative
chance of earning more by ‘extensification’ (e.g. cutting tress to increase area for
planting crops), many GPN farmers preferred to sustainably intensify or perform
more strategic environmental upgrades. A dearth of support for SEU’s leads to a
trickledown effect on HCEPP and LCEPP’s.
In this thesis, I have shown that horizontal and vertical actors focus on maximizing
rents, and look at environmental concerns merely as ‘externalities’, rather than
embedding such aspects into sustainable intensification. The lack of providing
assistance for indigenous strategic environmental upgrades, and the prevention of
including local interpretations into LCEPP and HCEPP upgrades caused
environmental downgrading for GPN farmers.
I have developed and quantified two main categories of environmental outcomes -
improved resource efficiency pollution management (IREPM) and pre-emptive
conservation (PC). I found (in chapter 7) that performing LCEPP, HCEPP and SEU
environmental upgrades has statistically significant positive implications for both
environmental outcomes. What is most important to note is that all three types of
upgrades have very similar magnitude of effect on environmental outcomes.
Consequently, the results in chapter 7 reinforce the low importance both Northern
and regional supermarkets attribute to environmental upgrading. It appears that only
330
if farmers perform HCEPP upgrades does it have a statistically significant positive
effect on income, whilst both LCEPP and SEU upgrades do not. This means that
performing environmentally friendly and sustainable practices are not rewarded
monetarily. This has a longer-term effect that forces farmers to cut corners and
perform less environmentally-friendly practices, just so that they earn more income
i.e. forcing them to develop a consensus culture by relying on expert systems that are
‘alien’ to them. This offers a higher monetary return and short run positive welfare
effect for farmers but, as this thesis suggests, leads to environmental downgrading.
So, under what conditions does environmental upgrading and downgrading occur?
While my research, similar to Barrientos et al. (2016), has alluded to the positive
benefits of strategically choosing to economically downgrade for RPN farmers, the
same cannot be said for environmental downgrading. An increase in the levels of
pollution, lower resource efficiency and lack of biodiversity conservation has short
and long-term effects on economic outcomes and social welfare across GPN, RPN and
LPN farmers. Thus, environmental downgrading can never be ‘beneficial’. An
important empirical finding that illustrates the complex trajectories of environmental
upgrading and downgrading are the sustainability of standards. This thesis shows
that environmental downgrading occurs in conjunction with economic process
upgrades (standards) in chapter 6 and 7. Both the HCD and GlobalGAP have
insignificant effects on environmental upgrading as well as environmental outcomes,
which contradicts the key aims of such standards to be ‘sustainable’. However,
Kenyan FFV is not an isolated case, with Brandi (2017) having found rampant
extensification within Indonesia’s oil palm farmers due to increased economic
attractiveness of selling to Northern markets where the use of sustainability standards
is required.
That begs the question, is it worth converging or harmonizing regional standards to
Northern standards? Considering the increased costs associated with complying to
more stringent specifications with no environmental benefit, there is a need to look
331
for alternate governance structures that can abet sustainable development. For now,
it seems that Northern standards such as GlobalGAP only act as governance
instruments for lead firms that enable or dis-enable market participation and are not
tools to promote sustainable development. How can certifications address issues
beyond market participation such as advancing sustainable livelihoods?
Some alternative standard structures could attain better socio-environmental
outcomes. Nelson and Tallontire (2014) and UNFSS (2016) lay out a pragmatic
development narrative, suggesting that standards can be modified to include greater
local civil society voice to increase the legitimacy of the standard. They also examine
a potentially transformative narrative connecting standards with regulatory processes
(social protection, job creation) to enhance accountability (ibid). Others (e.g. Poulton
et al., 2004) suggest discarding standards altogether in favour of state sponsored
support, where the state acts as a cooperative, intermediary and a marketing agent.
Further research can delve deeper into the various alternative structures that could
co-exist with or replace standards.
The economic upgrade of strategic diversification consistently causes environmental
downgrading, which suggests that farmers’ diversification is motivated to maximize
incomes and not to conserving their environment. Strategic diversification can take
three forms. The first is ‘simultaneously strategic’ i.e. GPN/RPN farmers hedging their
losses by participating in multiple markets simultaneously. The second is
‘downgraded strategic’, wherein farmers made a strategic choice to chain downgrade
and switch from GPNs to RPNs. The third is what Blazek (2016) calls adaptive
downgrading64, i.e. when farmers recognise they cannot meet competitive pressures
and leave the GPN. All three circumstances of strategic diversification are an
64 This provokes another important question linked to terminology. Is downgrading the right word to
be used for a positive development? Downgrading is framed in a North-South GVC/GPN context and
does not account for regional market development or give agency to actors other than Northern
supermarkets. New terminologies need to be developed that account for the potentially beneficial
trajectory of downgrading.
332
opportunistic choice (and economic upgrade) for ensuring livelihood continuance,
rather than performing environmental upgrades or stimulating positive
environmental outcomes.
But how does environmental upgrading link in with social upgrading? The work by
DeMarchi et al. (2013 a,b) ignores this facet. This thesis showed that social upgrading
does to an extent enable environmental upgrading to occur, but only marginally.
Social upgrades, are proxied through membership in farmer groups and health and
safety. Farmer groups have a positive but statistically insignificant effect on
environmental upgrading due to poor collective action, while hygiene (protective
clothing, washing hands) leads to positive environmental outcomes, but only has a
small magnitude of effect.
The trajectories of environmental upgrading and downgrading occur heterogeneously
across farmers in GPNs, RPNs and LPNs and it is difficult to ‘position’ environmental
upgrading as leading, occurring simultaneously or following economic or social
upgrading and downgrading. But why do both economic and social upgrades have
such a negative effect on environmental upgrading? This thesis demonstrated that
environmental upgrades are not core components of lead firms’ strategy. For instance,
lead firms focused merely on ‘visible’ HCEPP upgrades that could be verified and
seen by third party auditors or end consumers who buy the product, and not on
environmental upgrades such as SEUs that I have proven are as important as HCEPPs.
Thus, environmental upgrades are viewed as externalities that need to be ‘added in’
to ensure auditor or consumer demands are met.
This reflects that Northern or regional lead firms do not aim to improve sustainability
of farmer livelihoods. This means not just producing crops to specific standards and
making a living, but allowing for fruitful and meaningful living that leads to
satisfaction, happiness and decent work (Bebbington, 1999; Sen, 2000, 2008; Ghai,
2003). Having a sustainable fulfilling livelihood influences what I have called the

333
varieties of rationality of farmers, which in turn influences environmental upgrading
and their outcomes. For instance, evidence from CSR initiatives suggests that
Northern and regional lead firms have failed to achieve the intended goals (e.g.
Blowfield and Dolan, 2008) and, in some cases, have worsened social and
environmental conditions (e.g. Barrientos, 2008; Lund-Thomsen, 2008) for grassroots
actors. Thus, comprehending what livelihoods mean in a PN/VC context can
contribute to enhancing and propelling ideas of decent work. Thus, developing goals
linked to sustainable livelihoods are key to improving lead firm commitment to socio-
environmental outcomes.
Playing devil’s advocate, does this mean environmental upgrades are always
‘beneficial’ for farmers? Interviews with some RPN farmers indicated the contrary.
An implication of performing ‘too many’ environmental upgrades is slowly becoming
visible in RPN farmers. To compete for supplying more crop volumes to regional
supermarkets, RPN farmers have begun to mono-crop, using more chemicals and
heavy-duty irrigation systems (that increase abstraction of water from rivers), which
have formidable environmental costs (Farmer interview: #3kGPN). Performing
environmental upgrades in ‘excess’ alters biotic interactions, causing permanent
ecosystem damage, reducing water tables, causing soil erosion and a reduction in
biodiversity, and thus changes the ecologically reciprocal relationships farmers have
with the environment (e.g. Matson et al., 1997; Pingali et al., 1998; Dixon et al., 2001;
Lipper et al., 2006). So ‘doing more’ is not necessarily as beneficial as ‘doing
environmental upgrades correctly’. Although this thesis does not have panel data to
measure the long-term implications, performing ‘excess environmental upgrades’ can
cause marginalization and exclusion from participating in PNs or, even more
drastically, force a change in farmer’s livelihood prospects due to degradation. Thus,
performing ‘excess’ environmental upgrades may be long-term environmental
downgrades.
334
8.1.2. Implications of re-environmentalization for GPN, RPN and LPN farmers
Embeddedness is one of the pillars of PN and VC analysis, and a key contribution here
is integrating the natural environment within conceptualizations of embeddedness. In
the thesis, I began by pushing the conceptual boundaries of societal, network and
territorial embeddedness within GPN literature, drawing on a range of disciplines,
including economic sociology, economic geography and ecological economics.
Ultimately by developing key indicators, I use a novel approach to quantify each form
of embeddedness. I then posit a new form of embeddedness which accounts for the
environment, called re-environmentalization, which occurs at the nexus of societal,
network and territorial. Finally, I compared the processes through which farmers
‘environmentalize’ into GPNs, RPNs and LPNs, and pinpointed the ease through
which this occurs.
Societal embeddedness captures how cultural and cognitive mechanisms of farmers
change as they dis-embed from previous networks to re-embed in GPNs, RPNs and
evolving LPNs. I find that GPN and RPN farmers, when re-embedding had to develop
almost completely new relationships which altered the ‘normal; functioning of
society, while LPN farmers underwent only minimal changes.
I divided network embeddedness into two categories. The first, network architecture
and structure, consists of strength of ties, positionality of the actor vis-a-vis the
network and relational proximity (power struggles within ties). The other category is
network stability and durability, which is portrayed by evolving earned and ascribed
trust between farmers and GPN/RPN/LPN network actors. Unpacking network
embeddedness debunked yet another assumption in GVC/GPN literature regarding
the importance of trust in relationships. I illustrated that Granovetter’s (1973, 1983)
notion of the strength of weak ties played out most starkly in the RPN case and that
trust was not a motivator for performing environmental upgrades in the GPN case.
GPN farmers continued to perform the most upgrades despite having low levels of
network stability (low earned trust) with their buyers in spite of having strong ties. In

335
contrast, RPN farmers have been able to easily de-localize (shift) trust to regional
supermarkets, despite having only intermediate ties, and were able to bargain for
better terms. This increased their power within the RPN, suggesting that emerging
RPNs are indeed multi-polar (keeping with the definition within Ponte and Sturgeon,
2014), wherein the locus of realist power is not only with regional lead
firms/supermarkets. Thus, power and trust are not necessarily correlated when it
comes to participating and upgrading in production networks.
I contribute to the GPN literature by extending understandings of territorial
embeddedness to include the natural environment because nature is entangled and
enmeshed in economic action i.e. just like social relationships are dynamic and
ongoing, ecological relationships are also ongoing. I draw on literature on AAFNs to
develop a category of territorial fixed embeddedness in order to consider ecologically
reciprocal relationships (give and take) that exist between farmers and their
environment. Another category I developed is territorial fluid embeddedness that
encompasses climate variability and extremes that occur in places, which farmers
need to cope with, to prevent crop damage and to continue to participate in markets.
With this is mind, I posit the concept of re-environmentalization, wherein farmers
detach from previous social (societal and network) and ecological (territorial) relations
by de-environmentalizing to re-appropriate or recast the de-environmentalized socio-
ecological relations to global or regional production networks. I develop two extreme
types related to ease of re-environmentalization - type 1 (relative ease) and type 2
(contested).
The ease with which this process of re-environmentalization occurs was found to
differ significantly across farmers. I find RPN farmers are closer to type 1, because
they are able to transition from a set of social relationships from previous markets, to
new networks engendering trustworthiness. Furthermore, they are not forced to
perform environment practices by regional supermarkets and therefore have much

336
more freedom to ‘choose’ the environmental upgrades they want to perform. This is
contrary to GPN farmers who fall into type 2, because they experience distrust and
contestation and face several environmental struggles because of lead firms through
the process of re-embedding. Thus, GPN research needs to incorporate such
environmental dimensions to generate a holistic understanding of how
embeddedness occurs and the implications. This is turn impacts processes of learning
and environmental upgrading.
I emphasise the importance of integrating the environment quantitatively in the thesis.
Results in chapter 6, indicate that GPN, RPN and LPN farmers experienced territorial
fixed and fluid embeddedness to a much higher magnitude than network
embeddedness. This intimated that living in territorial ‘precarious’ areas i.e. lower
levels of natural endowments and with higher climate variability, spawned
performing more environmental upgrades as not performing it could cause significant
environmental downgrading. While network architecture and stability, on the other
hand, seem to have an insignificant effect on environmental upgrading across global,
regional and local PNs.
So why is territorial fixed and fluid embeddedness so much more important to
farmers than network embeddedness? The process of dis-embedding and re-
embedding varies dramatically across PNs. For instance, GPN farmers may not be
able to re-appropriate any previous ties into the new network as many of the actors
were new and hence trust was not efficiently de-localized. While RPN farmers recast
their relationships more easily because of increased familiarity (did not involve a
complete change in actors), ascribed trust as well as earned trust was easier to gain
(trust was easily de-localized). This means dis-embedding from a particular social
relation is a ‘choice’ that farmers make. However, the same cannot be said for de-
environmentalizing, because a farmer does not have resources to leave their ‘place’
i.e. relocate their ‘farmland’ and have to remain fixed.

337
This is not to say social relationships are not critical. When thinking about the concept
of re-environmentalization, it is important to bear in mind that social relations shape
and reshape the ecological relations farmers have, which translate into environmental
damage or positive environmental outcomes on the natural environment. This means
that inherently there is a time lag between emerging social relations and the
manifestation of the ecological relationship. Thus, it is possible for farmers to dis-
embed partially or completely from social relations without changing their ecological
relationships with their environment. For ecologically reciprocal relationships to take
shape, there is a need for this circular relationship between social relations and
environmental relations to take place until a physical manifestation is recognized.
This leaves questions relating to the durability of the network because of re-
environmentalizing. Does the process of re-environmentalization impact the
adaptability and flexibility of farmers to respond to shocks (price or climate shocks)
arising from the changes in the network? For instance, even though GPN farmers
attempt to strategically diversify to hedge against price shocks, it clearly impinges on
their performance of environmental upgrading, which in turn leads to environmental
damage. Hence, the long-term resilience of the network remains questionable. Thus,
weak positionality of GPN farmers reduces their ability to efficiently respond to
shocks. In contrast, RPN and LPN farmers have better positionality vis-à-vis their
network and are able to bargain for better terms, which improves their network
durability.
8.1.3 Rethinking understanding of governance across value chains and production
networks
The second pillar of PN/VC analysis is governance, which I have attempted to
conceptually unpack by accounting for farmer epistemologies, moving away from a
central focus on the lead firms. So, rather than using the conventional understanding
of how lead firms govern the chain and their suppliers, this thesis looks at how farmers
experience governance. Understandings of governance are further nuanced when

338
considering the growth of polycentric trade (Horner and Nadvi, 2017), which
highlights the increasing trade flows away from the North to Southern and domestic
markets. By comparing across global, regional and local PNs, this thesis showed
structural differences in how each chain is governed and the impact on upgrading
thereafter.
I re-interpreted complexity, codifiability and capabilities. Complexity was divided
into low complexity and high complexity tasks. A total of 17 low complexity tasks were
identified, such as composting manure, using organic waste, intercropping, tilling
procedures, post-harvest maintenance, and 10 high complexity tasks, such as water
testing, soil moisture testing and developing irrigation schedules (See Table 5.9,
Chapter 5).
Instead of studying how lead firms codify tasks, I unpack the ability of farmers to de-
codify and the capabilities they require, which are studied as internal (tacit forms of
knowledge) to external learning (different degrees of explicit knowledge) (detailed in
chapter 2). Results show that internal knowledge was prevalent with LPN farmers as
they experience weak network architecture and stability, while it was relatively lower
for RPN and GPN farmers as they have much more support. External learning was
highest with GPN farmers as they had to rely on extension services to complete many
high complex tasks.
While much of GVC/GPN research discusses the importance of external knowledge
required to upgrade, my findings demonstrate that the magnitude of effect of internal
knowledge was similar to external knowledge and thus global lead firms should
embrace internal (tacit) knowledge. In reality though, the opposite occurred, where
lead firms discounted local internal knowledge (invalidating the sticky nature of
knowledge). This instigated contestation between GPN farmers and their buyers,
especially because farmers are made to ‘de-learn’ certain upgrades and ‘re-learn’ them
to conform to what buyers thought was ‘right’. So, this could mean that the ‘wrong’
339
information is circulated through farmer networks, and the fear is that overtime these
could slowly become internal (tacit) within societies.
Having said that, external knowledge is also critical. My results indicate that
knowledge appear to be far more important to farmers than having strong network
architecture or stability, thus suggesting that whatever the levels of earned or ascribed
trust or strength of ties, tangible knowledge transfer seems to outweigh network
relations.
What is particularly interesting, especially in relation to environmental upgrading, is
the need to move away from the VC/PN emphasis ‘on transfer of explicit knowledge’.
I find that, in spite of receiving far less external knowledge, RPN farmers
environmentally upgrade to almost similar levels as GPN farmers. This suggests that
internalization, absorptive capacity, and the speed of converting the ‘right’ kind of
knowledge, from external to ‘internal’, pays dividends.
I include a third category within capabilities and de-codification, called implicit
capabilities, which goes beyond the GVC focus on dynamic and resource capabilities
to include asset based livelihood linked aspects (e.g. Scoones, 1998; Cater and Barett,
2006). The results in chapters 5 and 6 indicate that farmers with more assets are clearly
able to environmentally upgrade more. However, implicit capabilities are most sought
after by LPN farmers, as they substitute increased assets for weak network
architecture and stability. A deeper analysis is required. For example, can implicit
capabilities be linked to entrepreneurial capabilities, like trying to understand the
cognitive factors that engender ‘entrepreneurship’ in RPN farmers more than other
farmers?
Using the 3C’s of complexity, codifiability and capabilities as independent variables
captures more than the five types of governance structures developed by Gereffi et al
(2005). This is because, as stated in chapter 2, pure arms-length market, hierarchical,
modular, captive and relational forms of transactions do not account for polycentric

340
trade. Furthermore, the 3C’s in Gereffi et al. (2005) seminal work are defined and
understood epistemologically from a lead firm perspective. Some studies (Pietrobelli
and Saliola, 2008)65 have attempted to quantify the five types of governance structures.
Again, this quantification and definition of governance fails to cater to conditions of
how governance is experienced by actors with low agency or whether actors exhibit
any form of multi-polarity due to strategic diversification or strategic downgrading.
My data can be used to attempt to classify complexity, capabilities and codifiability
into high-low distinctions, as done by Gereffi et al. (2005) to develop the five categories
of governance. Doing this, I find that almost 50% of GPN and 40% of RPN farmers
have modular linkages, followed by 20% of GPN and 25% RPN farmers have captive
linkages. These findings contrast with conventional GVC analysis of horticulture in
Kenya which is usually classified as captive or hierarchical (Gereffi et al., 2005; Gereffi
and Fernandez-Stark, 2016). Thus, when I re-centre the GVC to study how governance
is experienced by farmers, these typologies no longer hold the same meaning.
Therefore, there is a need to rethink what these governance forms mean when
accounting for epistemologies of actors with lower agencies.
Governance, as it is understood currently, must be broadened to add ‘scope’ with
respect to epistemologies which can also aid developing targeted policies.
Furthermore, governance also needs to be broadened by ‘breath’ to account for
growing polycentric trade and multi-polarity in GPNs, RPNs and LPNs. Is there a
need to move beyond the continuum of hierarchy and markets when inserting a new
‘scope’ and ‘breadth’ to governance typologies? For instance, Glin et al. (2012) claim
that “governance might overlook…, in particular, the ethics, ideology, identity,
symbolic and environmental values” (pg: 336). Overall, this thesis empirically
65 They use the following indicators: percentage of sales made by suppliers exclusively to suit buyers’
specification as a proxy for complexity i.e. less than 20% is low complexity, while more than 20% is
high, if the buyer provided information on design/quality (i.e. product characteristics) and imposed
product quality standards as a proxy for codifiability, and if the buyer engaged the supplier in
process or product R&D activities as a measure for capabilities

341
demonstrates several difficulties that arise with using governance from a GVC
perspective and calls for a need to rethink and make each of the terms more inclusive
to capture a wider gamut of actors.
8.2 Methodological contributions and limitations
This thesis made two key methodological contributions to the PN/VC literature. The
first relates to developing nuanced indicators that can measure re-
environmentalization, governance and upgrading systematically. While substantial
quantification has been applied with GVC analysis, there has been much less within
GPNs (Coe et al, 2014). One of the key reasons is the difficulty to quantify concepts
such as embeddedness, which are dynamic and iterative. While this causes several
issues linked to endogeneity in the dataset and self-selection in GPNs, RPNs and
LPNs, it still provides an important explanatory source for triangulating qualitative
data. Furthermore, quantitative analysis elicits variables that are most significant,
which adds weight to the qualitative discussion. Most importantly though, by
accounting for both epistemology and the environment, targeted policy measures can
be developed that improve social, industrial and environmental policy.
The second is developing a robust sampling methodology that enables aggregating
findings up to regional or national scales. For instance, Bair (2006) states caution needs
to be applied when attempting to generalize firm level findings across scale, thus
questioning if understanding firm level upgrading is enough to understand regional
or national level upgrading (Khattak et al., 2015). Thus, this thesis, through selecting
robust indicators at farm level as well as undertaking a novel sampling process,
creates internally valid data and thereby ensures that the findings for famers can be
aggregated and scaled up to regional or national levels.
A benefit of quantification and developing indicators is that it can be applied across
crops in value chain and production network analysis by tweaking the indicators. This
will enable a systematic cross comparison across agricultural crops and related
sectors. Furthermore, it is possible to also use similar kinds of analysis for

342
interrogating the different actors, by re-centring or changing the epistemology of the
central actor and re-mapping the PN to measure the implications on the new reference
point.
An important limitation to note is that the data are of cross sectional nature and thus
only illustrate contemporaneous effects, rather than changes over time and across
time. Many of the results that I discussed in the thesis can change over time. For
instance, network architecture and stability may become more important over time.
Long-term data helps gauge the mechanisms and causal relationships that drive
environmental upgrading and downgrading. For example, it can be used tostudy the
causal effects between re-environmentalization, governance and upgrading and even
whether economic and social upgrading lead or follow environmental upgrading.
8.3 Contribution to the debate on sustainable development in value chains
and production networks
Throughout this thesis, I have made two very critical empirical claims. The first is that
environmental upgrading is seen as an externality within production networks and
value chains, and is not systematically integrated within the functioning of the
network. The second is that sustainability standards (Northern or regional),
specifically the ones I have studied, do not engender environmental upgrading or
create statistically significant positive environmental outcomes. So, what are the
implications of environmental upgrading for sustainability? How is sustainability
understood in a PN/VC context? In this sub-section, I attempt to unpack whether
upgrading and governance are useful tools to comprehend sustainability in VCs/PNs.
Defining sustainability is an ongoing debate. While the Brundtland Commission
Report focuses on economic growth, environmental protection and social equality
with intergeneration equity at its core, many have struggled to define it operationally,
claiming that it is just a heuristic idea (Norgaard, 1994). This is even more so when
considering a PN/VC context. Since the lead firm usually is central to PN/VC analysis,
sustainability is seen in terms of a business case or improving the triple bottom line

343
(Bush et al., 2015). This suggests that sustainability remains quite vague or undefined,
with a profit maximization motive in PNs/VCs. This profit maximizing behaviour is
epitomized in the double externality problem put forth by Rennings (2000), which
states that while firms are willing to invest in R&D for environmental technologies in
the design phase, they are unwilling to internalize costs they accrue if positive
spillovers occur at the diffusion phase that benefit other companies. This leads to a
situation where firms feel inhibited to invest in further R&D, thereby dis-incentivizing
investment in instruments for sustainable development. This is indeed clearly visible
with lead firms in Kenya who only invest in small-scale incremental technological
improvements rather than making lumpy investments for sustainable growth.
Bush et al. (2015) envisage governance of sustainability in VCs as ‘in’ and ‘of’ chains.
Sustainability ‘in’ chains fleshes out how firms aim to improve greening practices by
using environmental and social standards within the chain. Here, firms align their
CSR activities to the triple bottom line and attain legitimacy through promoting social
and environmental interests. Similarly, sustainability ‘of chains’ also looks at how lead
firms can instil sustainable upgrading by mandating suppliers to fulfil stringent
standard requirements (ibid). This typology has been proven to be incorrect in this
thesis, especially around environmental upgrading, wherein relying on expert
systems leads to contestation and marginalization from chains for suppliers, such as
farmers, rather than inclusion and building resilience.
Furthermore, governance instruments like sustainability standards implicitly assume
environmental sustainability to be based on technical efficiency, agricultural
specialization and division of labour in such a way as to maximize production (Nelson
and Tallontire, 2014). This perpetuates the idea that agricultural intensification
reduces ecological pressures. While sustainability is viewed socially, through a list of
measurable social criteria that lead firms from the Global North determine as well-
being indicators, as I show, many of these criteria have problems of moral hazard due

344
to the lack of adaptation to local norms. For instance, Cheyns et al. (2017) also find
such issues prevalent in the palm oil industry in Indonesia.
Upgrading implicitly assumes that moving to higher value-added activities creates
products or services that are better economically, socially and environmentally, which
presupposes that downstream actors will demand these ‘sustainable’ products
(Orsato, 2009; De Marchi et al., 2013a, b). This has two important implications. The
first is that there needs to be buy-in or a convergence of priorities across all network
actors so that more sustainable goods are purchased, and secondly that lead and
supplier firms need to see developing sustainable products as more than just ‘value-
added’ or comparative advantage.
Overall, the core argument for attaining sustainable development goals relies on the
fact that insertion into GPNs/GVCs leads to upgrading propelling economic growth,
which in turn enables suppliers to comply with stringent standards; and if they do not
it leads to a race to the bottom (Kaplinsky, 2016). This cyclical relationship
undoubtedly re-produces a North-South growth model which narrows the definition
of sustainability. In this thesis I find that, in order to continue selling to Northern
markets, farmers are forced to develop new normals and consensus cultures, to
maintain relationships, even though this leads to a trade off on the quality of natural
endowments over time. Similar results have even been found by Klooster (2016) who
shows that, in order to stay competitive in the furniture industry, firms in Mexico
externalized forest management costs and allowed degradation to occur, reducing
environmental quality.
So how do we make economic-social-environmental upgrading/downgrading fit it
with a stronger version of sustainability? Many forms of economic and environmental
upgrading are linked to technology, which creates a ‘technological bias’ for attempting
to achieve sustainable development (Rennings, 2000). However, Norgaard (1994)
points out that when technology outpaces social organization, it leads to

345
unsustainable development and thus co-evolution of the two is essential. This co-
evolution should reflect the ‘needs’ of local societies and farmers, rather than the lead
firms, which allows for more equitable value distribution through the network.
For this to occur, there has to be a shift away from the centricity on lead firms and
developing new institutional configurations, with constellations of actors that
systemically weave sustainability into their core output models i.e. where there is a
convergence of ecological, social and economic rationalities (Klooster, 2016; Ponte and
Cheyns, 2013; Werner, 2012). This advocates a central role for horizontal actors such
as CSOs, national and sub-national governments and market based collective action
need to play to generate credibility (e.g. Bitzer et al., 2012; Glin et al., 2012). This
involves developing partnerships that influence normative and regulatory structures
through a chain/network as a conduit, consequently this should cause trickle down
effects and change production and consumption patterns
8.4 Contribution to the debate on globalization and regional development
in value chains and production networks
Globalisation has long been considered in terms of North-South dynamics. African
farmers, and the broader continent, have struggled to secure positive development
outcomes in an economic globalization dominated by the global North (Gibbon and
Ponte, 2005). In the case of Kenya, as I delineate in this thesis, both state and even CSO
interventions (be it in terms of infrastructure, subsidies or extension services) are
geared to support exports to the North rather than abetting a broader group of local
farmers. Yet now, globalization Kenyan farmers experience is much more variegated,
especially with the emergence of regional production networks (Horner and Nadvi,
2017). The expansion and prominence of Southern lead firms, i.e. Kenyan-owned
supermarkets, has led to the emergence of new regional suppliers and the
development of a new network. On the back of rising polycentric trade, Kenyan
supermarkets have been able to not only capture markets regionally within East
Africa, but also through LPNs.
346
My research has highlighted the positive benefits of the expansion of RPNs for
farmers. Farmers selling to regional supermarkets have been able to re-
environmentalize smoothly without contestation. They appear to have better
absorptive capacity and a higher ability to internalize knowledge, giving them useful
entrepreneurial capabilities. They are also able to perform complex environmental
upgrades and enjoy similar levels of net income to GPN farmers. I showed that RPN
farmers gross earnings exceed LPN farmers’ earnings by approximately 23%. A
plethora of research on other countries suggests similar results. For instance, both
Hernández et al. (2007) and Rao and Qaim (2011) find that farmers producing
horticulture crops for regional supermarkets in Guatemala and Kenya, respectively,
earn 20-30% more than LPN farmers. Overall, these findings allude to the advantages
of growing formal retail. Does this then suggest that formalization of regional markets
is the solution to wider regional development?
With Kenyan supermarkets rapidly expanding and aiming to increase profits by
economizing on transaction costs along with ensuring consumer demands (both social
and environmental) are met in terms of ensuring quality and just in time supply, two
powerful marginalization forces emerge. The first is linked to evolving regional
standards and the second is linked to preferred supplier lists. In the Kenyan case, there
is a slow move towards convergence of regional standards with Northern standards
such as GlobalGAP, which increases costs involved in adhering to standards.
Secondly, even entering these preferred supplier programmes is becoming
increasingly difficult, and RPNfarmers have to ensure they proactively maintain
‘good’ relations and build earned trust with regional supermarkets to continue to
participate. For instance, within their preferred supplier programmes, regional
supermarkets in Thailand single out some farmers as ‘pioneer suppliers’ causing
internal competition and potential exclusion (Boselie et al., 2003). Gutham (2007) also
finds sustainability standards that market themselves as carrying virtues of ecological,
social and place based values, yet instead create new forms of competition and

347
marginalization. This potentially creates similar conditions of exclusion to those
experienced by farmers who have been excluded from supplying into GPNs.
The increase in dependence on regional markets (supermarkets particularly) can thus
change how farmers environmentally upgrade in the context of increasingly
coordinated regional regimes, and the consequential environmental outcomes they
experience. Regional standards, as they currently stand, clearly cause environmental
downgrading (Chapter 6). Thus, it seems that while formalization of regional markets
increases income, it causes new waves of marginalization as well as environmental
downgrading.
Of course, the growth of Kenyan regional markets did not occur in a vacuum, but
through processes of marketization. The collusion of different PN actors led to the
creation of regional markets (Ouma, 2013- provides an example of how marketization
occurs in Ghanaian horticulture). Especially over the last five years, retail FDI has
flown into Kenya from lead firms in the Global North (through companies such as
Massmart/Walmart and Carrefour). These firms are proving to be more competitive
than established Kenyan retailers such as Nakumatt and Uchumi. To compete with
the influx of inward FDI, Kenyan regional retailers have begun selling equity to
international venture capitalists. For instance, Nakumatt has recently sold 25% of its
stake and is restructuring organizationally, including procurement processes and
initiating new private standards (Reuters 2017). This clearly indicates the changing
structure of regional markets. For instance, an increased reliance on in-house
procurement (from hierarchical or captive producers) could increase the exclusion of
farmers wanting to enter regional production networks (e.g. Louw et al., 2007
performed a study linked to in-house procurement for South Africa). However, at the
same time, an increase in the number of regional lead firms may provide farmers more
opportunities.

348
In sum, it is questionable whether the formalization of regional retail is a sound
solution for sustainable growth or whether it will create a new generation of winners
and losers that re-produce the older ideas of North-South dominated economic
globalisation.
8.5 Further research
This thesis alludes to four key areas of further research: sustainable development,
regional marketization, rethinking governance typologies and unpacking the
endogenous nature of embeddedness, governance and upgrading.
Throughout this thesis, I allude to the requirement for new models of sustainable
development in PNs and VCs to abet changing production and consumption patterns
and focusing less on the lead firm and more on new institutional configurations. This
involves searching for a model that allows for convergence of network actor priorities
and, where it is possible, to partially de-couple economic growth from socio-
environmental issues, in effect internalizing socio-environmental costs. However,
Georgescu-Roegen (1993) emphatically pronounced that sustainable development
makes sense only in no growth economies. This gives rise to more radical ideas of how
sustainable development needs to be operationalized. Some proponents (e.g.
Schneider et al., 2013) posit the concept of de-growth, a movement of re-examining
social ideals and replacing dominant economic values of societies. Other authors (e.g.
Martinez-Alier, 2009; Martinez-Alier et al., 2010), however, are not quite as radical in
their way of thinking about de-growth, suggesting that some sectors within an
economy can grow while others decline in a steady state, claiming ‘some de-growth’
is acceptable. Further research can unpack new models for sustainable development
that can work in VCs and PNs, taking into account multi-polarity and polycentric
trade.
Further research can delve further into the implications of globalization for regional
development, looking in further detail at the role of the state. In Kenya, it seems to be
playing a reactive role to the growth of regional markets, which are dependent on

349
internal private funds and more recently foreign direct investment from private equity
groups. Can a state-centric approach work, with better horizontal networks that aid
in enriching legal and institutional capacity (Bell and Hindamoor, 2009)?
Another strand of research that can be furthered, is advancing understandings of
governance in PNs/VCs, first in terms of ‘depth’, i.e. characteristics, and the other in
terms of the ‘breadth’, i.e. the unit of analysis. Research can build on the characteristics
of governance, especially in the context of the environment, by engaging with a
plethora of literature, such as environmental governance (e.g. Lemos et al., 2006),
political ecology (e.g. Peet, 1985; Robbins, 2011), or complex adaptive systems (e.g.
Choi et al., 2001). This can add depth to better integrating the environment with PN
and VC analysis. The other aspect of further research can look into is accounting for
different epistemologies of actors in a context of shifting end markets and strategic
diversification. Together such studies can broaden the depth and breadth of
understandings of governance in PNs and VCs.
Another area for future research to look at is the long-term interactions of
environmental embeddedness, upgrading and governance. This study has primarily
focused on one-way effects of the re-environmentalization and governance on
environmental upgrading, but these are obviously endogenous. For instance, factors
that seem less important now, such as network architecture and stability, may become
more important over the long run. External learning may have negative effects on
upgrading because it is not adapted to local norms. Upgrading may also lead to lower
internalization and increase contestation. Panel data can help to study the causal
effects between re-environmentalization, governance and upgrading. Further
research is also required to elicit whether economic and social upgrading lead or
follow environmental upgrading and if they are sufficient or necessary conditions.
More mixed methods studies can provide validated, triangulated and robust results.

350
In sum, overarchingly I integrated the environment into PN/VC analysis. I did so,
conceptually, by developing the dynamic concept of re-environmentalization and
empirically showed how it differs significantly across farmers in global, regional and
local production networks. Second, I re-thought the concept of environmental
upgrading from a farmer perspective, and indicated that GPN, RPN and LPN farmers
had heterogenous and non-linear trajectories of environmental upgrading. Moreover,
environmental downgrading was found to be a common reality for farmers who had
difficulty to re-environmentalize into GPNs. I also proved that re-orienting PN
analysis to represent different epistemologies changes the overall ‘meaning’ of the
results and thus it is essential to clarify the key unit of analysis before embarking on
any PN/VC linked study. I used farmers and their relationships to network actors as
a unit of analysis to de-construct governance from a farmer outlook, and found that
RPN farmers are able to absorb and internalize knowledge better than GPN and LPN
farmers, even though GPN farmers get far more external forms of learning.
Importantly, I am able to prove that environmental downgrading can co-exist with
economic and social upgrading especially for GPN farmers, thus alluding to an un-
sustainable situation. This impacts long term durability and sustainability of the
relationship, which in turn affects farmers’ ability to re-environmentalize, to learn
within networks and to environmentally upgrade, thus creating a vicious cycle.
Ultimately the environment is a crucial factor for farmers in production networks, and
must be taken seriously when considering development strategy within a changing
local, regional and global economy.

351
References
Abell, P. (2000). Sociological theory and rational choice theory. The Blackwell Companion to
Social Theory, 2, 223–244.
Adamowicz, W., Swait, J., Boxall, P., Louviere, J., & Williams, M. (1997). Perceptions versus
objective measures of environmental quality in combined revealed and stated
preference models of environmental valuation. Journal of Environmental Economics and
Management, 32(1), 65–84.
Adger, W. N. (1999). Social vulnerability to climate change and extremes in coastal Vietnam.
World Development, 27(2), 249–269.
Adger, W. N., Arnell, N. W., & Tompkins, E. L. (2005). Successful adaptation to climate
change across scales. Global Environmental Change, 15(2), 77–86.
Adger, W. N. (2006). Vulnerability. Global Environmental Change, 16(3), 268–281
Adger, W. N., Agrawala, S., Mirza, M. M. Q., Conde, C., O’Brien, K., Pulhin, J., … Takahashi,
K. (2007). Assessment of adaptation practices, options, constraints and capacity. Climate
Change, 717–743.
Adger, W. N. (2010). Social capital, collective action, and adaptation to climate change. In
Der klimawandel (pp. 327–345). Springer.
Adger, W. N., Kelly, P. M., & Ninh, N. H. (2012). Living with environmental change: social
vulnerability, adaptation and resilience in Vietnam. Routledge.
Ahnström, J., Höckert, J., Bergeå, H. L., Francis, C. A., Skelton, P., & Hallgren, L. (2009).
Farmers and nature conservation: What is known about attitudes, context factors and
actions affecting conservation? Renewable Agriculture and Food Systems, 24(1), 38–47.
Alford, M., Barrientos, S., & Visser, M. (n.d.). Multi‐scalar Labour Agency in Global
Production Networks: Contestation and Crisis in the South African Fruit Sector.
Development and Change.
Alier, J. M. (2009). Socially sustainable economic de‐growth. Development and Change, 40(6),
1099–1119.
Altvater, E., & Mahnkopf, B. (1997). The world market unbound. Review of International
Political Economy, 4(3), 448–471.
Amin, A. (1999). An institutionalist perspective on regional economic development.
International Journal of Urban and Regional Research, 23(2), 365–378.
Amin, A., & Cohendet, P. (2004). Architectures of knowledge: Firms, capabilities, and
communities. Oxford University Press on Demand.

352
Amin, A., & Thrift, N. (1995). Globalisation, institutional thickness and the local economy.
Managing Cities: The New Urban Context, 12, 91–108.
Ancori, B., Bureth, A., & Cohendet, P. (2000). The economics of knowledge: the debate about
codification and tacit knowledge. Industrial and Corporate Change, 9(2), 255–287.
Arnell, N. W. (1999). Climate change and global water resources. Global Environmental
Change, 9, S31–S49.
Arrow, K. (1962). Economic welfare and the allocation of resources for invention. In The rate
and direction of inventive activity: Economic and social factors (pp. 609–626). Princeton
University Press.
Assche, A. Van, & Gangnes, B. (2010). Electronics production upgrading: Is China
exceptional? Applied Economics Letters, 17(5), 477–482.
Bair, J. (2005). Global capitalism and commodity chains: looking back, going forward.
Competition & Change, 9(2), 153–180.
Bair, J., & Peters, E. D. (2006). Global commodity chains and endogenous growth: Export
dynamism and development in Mexico and Honduras. World Development, 34(2), 203–
221.
Baldwin, C. Y., & Clark, K. B. (2000). Design rules: The power of modularity (Vol. 1). MIT press.
Bankier, M. D. (1986). Estimators based on several stratified samples with applications to
multiple frame surveys. Journal of the American Statistical Association, 81(396), 1074–1079.
Barley, S. R. (1996). Technicians in the workplace: Ethnographic evidence for bringing work
into organizational studies. Administrative Science Quarterly, 404–441.
Barrientos, S. (2002). Mapping codes through the value chain: from researcher to detective.
Corporate Responsibility and Labour Rights. Codes of Conduct in the Global Economy. London,
Earthscan Publications, 61–76.
Barrientos, S., Dolan, C., & Tallontire, A. (2003). A gendered value chain approach to codes
of conduct in African horticulture. World Development, 31(9), 1511–1526.
Barrientos, S., & Smith, S. (2007). Do workers benefit from ethical trade? Assessing codes of
labour practice in global production systems. Third World Quarterly, 28(4), 713–729.
Barrientos, S. (2008). Contract labour: The “Achilles heel”of corporate codes in commercial
value chains. Development and Change, 39(6), 977–990.
Barrientos, S., Gereffi, G., & Rossi, A. (2011). Economic and social upgrading in global
production networks: A new paradigm for a changing world. International Labour
Review, 150(3‐4), 319–340.

353
Barrientos, S. (2013). Corporate purchasing practices in global production networks: A
socially contested terrain. Geoforum, 44, 44–51.
Barrientos, S., & Visser, M. (2013). South African horticulture: opportunities and challenges
for economic and social upgrading in value chains.
Barrientos, S., Knorringa, P., Evers, B., Visser, M., & Opondo, M. (2016a). Shifting regional
dynamics of global value chains: Implications for economic and social upgrading in
African horticulture. Environment and Planning A, 48(7), 1266–1283.
Barrientos, S., Gereffi, G., & Pickles, J. (2016b). New dynamics of upgrading in global value
chains: Shifting terrain for suppliers and workers in the global south. SAGE
Publications Sage UK: London, England.
Bathelt, H., & Glückler, J. (2003). Toward a relational economic geography. Journal of
Economic Geography, 3(2), 117–144.
Bathelt, H., Malmberg, A., & Maskell, P. (2004). Clusters and knowledge: local buzz, global
pipelines and the process of knowledge creation. Progress in Human Geography, 28(1),
31–56.
Bathelt, H., & Taylor, M. (2002). Clusters, power and place: inequality and local growth in
time–space. Geografiska Annaler: Series B, Human Geography, 84(2), 93–109.
Bazan, L., & Navas-Alemán, L. (2003). Upgrading in Global and National Value Chains:
recent challenges and opportunities for the Sinos Valley footwear cluster, Brazil. In
EADI’s Workshop “Clusters and Global Value Chains in the North and the Third World”
Novara (pp. 30–31).
Bebbington, A. (1999). Capitals and capabilities: a framework for analyzing peasant viability,
rural livelihoods and poverty. World Development, 27(12), 2021–2044.
Becker, G. S. (1976). Altruism, egoism, and genetic fitness: Economics and sociobiology.
Journal of Economic Literature, 14(3), 817–826.
Beedell, J. D. C., & Rehman, T. (1999). Explaining farmers’ conservation behaviour: Why do
farmers behave the way they do? Journal of Environmental Management, 57(3), 165–176.
Beedell, J., & Rehman, T. (2000). Using social-psychology models to understand farmers’
conservation behaviour. Journal of Rural Studies, 16(1), 117–127.
Bell, M., & Albu, M. (1999). Knowledge systems and technological dynamism in industrial
clusters in developing countries. World Development, 27(9), 1715–1734.
Bell, S., & Hindmoor, A. (2009). Rethinking governance: the centrality of the state in modern
society. Cambridge University Press.

354
Bellemare, M. F., & Barrett, C. B. (2006). An ordered Tobit model of market participation:
Evidence from Kenya and Ethiopia. American Journal of Agricultural Economics, 88(2),
324–337.
Bennett, J., & Blamey, R. (2001). The choice modelling approach to environmental valuation.
Edward Elgar Publishing.
Bernstein, L., Bosch, P., Canziani, O., Chen, Z., Christ, R., & Riahi, K. (2008). IPCC, 2007:
climate change 2007: synthesis report. IPCC.
Bettiol, M., De Marchi, V., Di Maria, E., & Micelli, S. (2011). Rising Powers and Global
Standards.
Bhagwati, J. (1958). Immiserizing growth: a geometrical note. The Review of Economic Studies,
25(3), 201–205.
Blažek, J. (2016). Towards a typology of repositioning strategies of GVC/GPN suppliers: the
case of functional upgrading and downgrading. Journal of Economic Geography, 16(4),
849–869.
Bloor, M. (2001). Focus groups in social research. Sage.
Blowfield, M. E., & Dolan, C. S. (2008). Stewards of virtue? The ethical dilemma of CSR in
African agriculture. Development and Change, 39(1), 1–23.
Bockstaller, C., Girardin, P. H., & Van der Werf, H. M. G. (1997). Use of agro-ecological
indicators for the evaluation of farming systems. Developments in Crop Science, 25, 329–
338.
Böhringer, C., & Jochem, P. E. P. (2007). Measuring the immeasurable—A survey of
sustainability indices. Ecological Economics, 63(1), 1–8.
Bolwig, S., Ponte, S., Du Toit, A., Riisgaard, L., & Halberg, N. (2010). Integrating poverty and
environmental concerns into value‐chain analysis: a conceptual framework.
Development Policy Review, 28(2), 173–194.
Booysen, F., Van Der Berg, S., Burger, R., Von Maltitz, M., & Du Rand, G. (2008). Using an
asset index to assess trends in poverty in seven Sub-Saharan African countries. World
Development, 36(6), 1113–1130.
Boselie, D., Henson, S., & Weatherspoon, D. (2003). Supermarket procurement practices in
developing countries: Redefining the roles of the public and private sectors. American
Journal of Agricultural Economics, 85(5), 1155–1161.
Boxall, P. C., Adamowicz, W. L., Swait, J., Williams, M., & Louviere, J. (1996). A comparison
of stated preference methods for environmental valuation. Ecological Economics, 18(3),
243–253.

355
Brace, I. (2008). Questionnaire design: How to plan, structure and write survey material for effective
market research. Kogan Page Publishers.
Brancati, E., Brancati, R., & Maresca, A. (2016). Global Value Chains, Innovation, and
Performance: Firm-Level Evidence from the Great Recession.
Brandi, C. A. (2017). Sustainability Standards and Sustainable Development–Synergies and
Trade‐Offs of Transnational Governance. Sustainable Development, 25(1), 25–34.
Branisa, B., Klasen, S., & Ziegler, M. (2013). Gender inequality in social institutions and
gendered development outcomes. World Development, 45, 252–268.
Bridge, G. (2008). Global production networks and the extractive sector: governing resource-
based development. Journal of Economic Geography, 8(3), 389–419.
Brooks, N. (2003). Vulnerability, risk and adaptation: A conceptual framework. Tyndall
Centre for Climate Change Research Working Paper, 38, 1–16.
Brown, J. S., & Duguid, P. (2001). Knowledge and organization: A social-practice
perspective. Organization Science, 12(2), 198–213.
Bryan, E., Ringler, C., Okoba, B., Roncoli, C., Silvestri, S., & Herrero, M. (2013). Adapting
agriculture to climate change in Kenya: Household strategies and determinants. Journal
of Environmental Management, 114, 26–35.
Bryman, A. (2006). Integrating quantitative and qualitative research: how is it done?
Qualitative Research, 6(1), 97–113.
Bulte, E. H., Lipper, L., Stringer, R., & Zilberman, D. (2008). Payments for ecosystem services
and poverty reduction: concepts, issues, and empirical perspectives. Environment and
Development Economics, 13(3), 245–254.
Burt, R. S. (1987). Social contagion and innovation: Cohesion versus structural equivalence.
American Journal of Sociology, 92(6), 1287–1335.
Burton, R. J. F. (2004). Reconceptualising the “behavioural approach”in agricultural studies:
a socio-psychological perspective. Journal of Rural Studies, 20(3), 359–371.
Bush, S. R., Oosterveer, P., Bailey, M., & Mol, A. P. J. (2015). Sustainability governance of
chains and networks: a review and future outlook. Journal of Cleaner Production, 107, 8–
19.
Calder, B. J., Phillips, L. W., & Tybout, A. M. (1982). The concept of external validity. Journal
of Consumer Research, 9(3), 240–244.
Cameron, A. C., & Trivedi, P. K. (2009). Microeconometrics using stata (Vol. 5). Stata press
College Station, TX.

356
Cammell, M. E., & Knight, J. D. (1992). Effects of climatic change on the population
dynamics of crop pests. Advances in Ecological Research, 22, 117–162.
Cannon, R. J. C. (1998). The implications of predicted climate change for insect pests in the
UK, with emphasis on non‐indigenous species. Global Change Biology, 4(7), 785–796.
Canter, L. W (1977). Environmental impact assessment. McGraw-Hill New York.
Cantwell, J. (1989). Technological innovation and multinational corporations. B. Blackwell
Cambridge, MA.
Carter, M. R., & Barrett, C. B. (2006). The economics of poverty traps and persistent poverty:
An asset-based approach. The Journal of Development Studies, 42(2), 178–199.
Cary, J. W., & Wilkinson, R. L. (1997). Perceived profitability and farmers ‘conservation
behaviour. Journal of Agricultural Economics, 48(1‐3), 13–21.
Challinor, A., Wheeler, T., Garforth, C., Craufurd, P., & Kassam, A. (2007). Assessing the
vulnerability of food crop systems in Africa to climate change. Climatic Change, 83(3),
381–399.
Chambers, R., & Conway, G. (1992). Sustainable rural livelihoods: practical concepts for the 21st
century. Institute of Development Studies (UK).
Champ, M. A., & Seligman, P. F. (2012). Organotin: environmental fate and effects. Springer
Science & Business Media.
Cheyns, E., Daviron, B., Djama, M., Fouilleux, È., & Guéneau, S. (2017). The Standardization
of Sustainable Development Through the Insertion of Agricultural Global Value Chains
into International Markets BT - Sustainable Development and Tropical Agri-chains. In
E. Biénabe, A. Rival, & D. Loeillet (Eds.) (pp. 283–303). Dordrecht: Springer
Netherlands. https://doi.org/10.1007/978-94-024-1016-7_23
Chiburis, R., & Lokshin, M. (2007). Maximum likelihood and two-step estimation of an
ordered-probit selection model. Stata Journal, 7(2), 167–182.
Choi, T. Y., Dooley, K. J., & Rungtusanatham, M. (2001). Supply networks and complex
adaptive systems: control versus emergence. Journal of Operations Management, 19(3),
351–366.
Chouinard, H. H., Paterson, T., Wandschneider, P. R., & Ohler, A. M. (2008). Will farmers
trade profits for stewardship? Heterogeneous motivations for farm practice selection.
Land Economics, 84(1), 66–82.
Coakley, S. M., Scherm, H., & Chakraborty, S. (1999). Climate change and plant disease
management. Annual Review of Phytopathology, 37(1), 399–426.

357
Coe, N., & Hess, M. (2011). Local and regional development: a global production network
approach. In Handbook of Local and Regional Development (pp. 128–138). Routledge
London.
Coe, N. M. (2012). Geographies of production II: A global production network A–Z. Progress
in Human Geography, 36(3), 389–402.
Coe, N. M., Dicken, P., & Hess, M. (2008). Global production networks: realizing the
potential. Journal of Economic Geography, 8(3), 271–295.
Coe, N. M., Hess, M., Yeung, H. W., Dicken, P., & Henderson, J. (2004). “Globalizing”
regional development: a global production networks perspective. Transactions of the
Institute of British Geographers, 29(4), 468–484.
Coe, N. M., & Lee, Y. (2006). The Strategic Localization of Transnational Retailers: The Case
of Samsung‐Tesco in South Korea. Economic Geography, 82(1), 61–88.
Coe, N. M., & Wrigley, N. (2007). Host economy impacts of transnational retail: the research
agenda. Journal of Economic Geography.
Cohen, W. M., & Levinthal, D. A. (1990). Absorptive capacity: A new perspective on learning
and innovation. Administrative Science Quarterly, 128–152.
Coleman, J. S. (1988). Social capital in the creation of human capital. American Journal of
Sociology, 94, S95–S120.
Coppola, E., & Giorgi, F. (2005). Climate change in tropical regions from high‐resolution
time‐slice AGCM experiments. Quarterly Journal of the Royal Meteorological Society,
131(612), 3123–3145.
Costanza, R. (2000). Social goals and the valuation of ecosystem services. Ecosystems, 3(1), 4–
10.
Costanza, R., d’Arge, R., De Groot, R., Farber, S., Grasso, M., Hannon, B., … Paruelo, J.
(1997). The value of the world’s ecosystem services and natural capital. Nature,
387(6630), 253–260.
Cowan, R., David, P. A., & Foray, D. (2000). The explicit economics of knowledge
codification and tacitness. Industrial and Corporate Change, 9(2), 211–253.
Creswell, J. W. (2009). Editorial: Mapping the field of mixed methods research. SAGE
Publications Sage CA: Los Angeles, CA.
Creswell, J. W. (2007). Qualitative enquiry and research design: Choosing among five
approaches. US: Sage Publications Ltd.
Creswell, J. W., & Clark, V. L. P. (2007). Designing and conducting mixed methods research.

358
Creswell, J. W., & Poth, C. N. (2017). Qualitative inquiry and research design: Choosing among
five approaches. Sage publications.
Crone, M., & Roper, S. (2001). Local learning from multinational plants: knowledge transfers
in the supply chain. Regional Studies, 35(6), 535–548.
Cumbers, A., Nativel, C., & Routledge, P. (2008). Labour agency and union positionalities in
global production networks. Journal of Economic Geography, 8(3), 369–387.
Dalgaard, R., Schmidt, J., Halberg, N., Christensen, P., Thrane, M., & Pengue, W. A. (2008).
LCA of soybean meal. The International Journal of Life Cycle Assessment, 13(3), 240.
Dallas, M. P. (2015). “Governed” trade: global value chains, firms, and the heterogeneity of
trade in an era of fragmented production. Review of International Political Economy, 22(5),
875–909.
Dangelico, R. M., & Pujari, D. (2010). Mainstreaming Green Product Innovation: Why and
How Companies Integrate Environmental Sustainability. Journal of Business Ethics,
95(3), 471–486. https://doi.org/10.1007/s10551-010-0434-0
Dannenberg, P., & Nduru, G. M. (2013). Practices in international value chains: The case of
the Kenyan fruit and vegetable chain beyond the exclusion debate. Tijdschrift Voor
Economische En Sociale Geografie, 104(1), 41–56.
Dannenberg, P., & Lakes, T. (2013). The use of mobile phones by Kenyan export-orientated
small-scale farmers: insights from fruit and vegetable farming in the Mt. Kenya region.
Economia Agro-Alimentare.
De Marchi, V. (2012). Environmental innovation and R&D cooperation: Empirical evidence
from Spanish manufacturing firms. Research Policy, 41(3), 614–623.
De Marchi, V., Di Maria, E., & Ponte, S. (2013a). The greening of global value chains: Insights
from the furniture industry. Competition & Change, 17(4), 299–318.
De Marchi, V., Maria, E. Di, & Micelli, S. (2013b). Environmental strategies, upgrading and
competitive advantage in global value chains. Business Strategy and the Environment,
22(1), 62–72.
Deaton, A. (1997). The analysis of household surveys: a microeconometric approach to development
policy. World Bank Publications.
Demaria, F., Schneider, F., Sekulova, F., & Martinez-Alier, J. (2013). What is degrowth? From
an activist slogan to a social movement. Environmental Values, 22(2), 191–215.
Dicken, P. (2003). Global shift: Reshaping the global economic map in the 21st century. Sage.
Dicken, P., Kelly, P. F., Olds, K., & Wai‐Chung Yeung, H. (2001). Chains and networks,
territories and scales: towards a relational framework for analysing the global economy.
Global Networks, 1(2), 89–112.

359
Dicken, P., & Thrift, N. (1992). The organization of production and the production of
organization: why business enterprises matter in the study of geographical
industrialization. Transactions of the Institute of British Geographers, 279–291.
Dijkstra, T. (1997). Trading the fruits of the land: horticultural marketing channels in Kenya.
Ashgate.
DiMaggio, P., & Louch, H. (1998). Socially embedded consumer transactions: For what kinds
of purchases do people most often use networks? American Sociological Review, 619–637.
Djama, M., Fouilleux, E., & Vagneron, I. (2011). Standard-setting, certifying and
benchmarking: A governmentality approach to sustainability standards in the agro-
food sector.
Dolan, C., & Humphrey, J. (2004). Changing governance patterns in the trade in fresh
vegetables between Africa and the United Kingdom. Environment and Planning A, 36(3),
491–509.
Dolan, C., & Humphrey, J. (2000). Governance and trade in fresh vegetables: the impact of
UK supermarkets on the African horticulture industry. Journal of Development Studies,
37(2), 147–176.
Dolan, C., Humphrey, J., & Harris-Pascal, C. (1999). Horticulture commodity chains: the impact
of the UK market on the African fresh vegetable industry. Institute of Development Studies
Brighton, Sussex.
Dyer, J. H., & Singh, H. (1998). The relational view: Cooperative strategy and sources of
interorganizational competitive advantage. Academy of Management Review, 23(4), 660–
679.
Edith, T. (1959). Penrose, The theory of the growth of the firm. New York and Oxford, 53.
Elliott, K. A., & Freeman, R. B. (2003). Can labor standards improve under globalization?
Peterson Institute Press: All Books.
Emirbayer, M., & Goodwin, J. (1994). Network analysis, culture, and the problem of agency.
American Journal of Sociology, 99(6), 1411–1454.
English, P., Jaffee, S., & Okello, J. (2004). Exporting out of Africa: the Kenya horticulture
success story. In Scaling Up Poverty Reduction: A Global Learning Process Conference.
Shanghai. May (Vol. 25).
Eriksen, S. H., Brown, K., & Kelly, P. M. (2005). The dynamics of vulnerability: locating
coping strategies in Kenya and Tanzania. The Geographical Journal, 171(4), 287–305.
Ernst, D., & Kim, L. (2002). Global production networks, knowledge diffusion, and local
capability formation. Research Policy, 31(8), 1417–1429.
360
Esty, D. C., Levy, M., Srebotnjak, T., & De Sherbinin, A. (2005). Environmental sustainability
index: benchmarking national environmental stewardship. New Haven: Yale Center for
Environmental Law & Policy, 47–60.
Ettlinger, N. (2003). Cultural economic geography and a relational and microspace approach
to trusts, rationalities, networks, and change in collaborative workplaces. Journal of
Economic Geography, 3(2), 145–171.
Euromonitor (2015) ‘Grocery retailers in Kenya’, online report, available at:
www.euromonitor.com/grocery-retailers-in-kenya/report
Evers, B. J., Amoding, F., & Krishnan, A. (2014). Social and economic upgrading in
floriculture global value chains: flowers and cuttings GVCs in Uganda.
Fafchamps, M. (2001). Networks, Communities and Markets in Sub‐Saharan Africa:
Implications for Firm Growth and Investment. Journal of African Economies, 10(suppl_2),
109–142.
Fankhauser, S., Smith, J. B., & Tol, R. S. J. (1999). Weathering climate change: some simple
rules to guide adaptation decisions. Ecological Economics, 30(1), 67–78.
Farber, S. C., Costanza, R., & Wilson, M. A. (2002). Economic and ecological concepts for
valuing ecosystem services. Ecological Economics, 41(3), 375–392.
Feenstra, R. C. (1998). Integration of trade and disintegration of production in the global
economy. The Journal of Economic Perspectives, 12(4), 31–50.
Filmer, D., & Pritchett, L. H. (2001). Estimating wealth effects without expenditure data—or
tears: an application to educational enrollments in states of India. Demography, 38(1),
115–132.
Fink, A. (2002). How to ask survey questions (Vol. 4). Sage.
Fish, R., Seymour, S., & Watkins, C. (2003). Conserving English landscapes: land managers
and agri-environmental policy. Environment and Planning A, 35(1), 19–41.
Fold, N. (2014). Value chain dynamics, settlement trajectories and regional development.
Regional Studies, 48(5), 778–790.
Foray, D., & Lundvall, B. (1998). The knowledge-based economy: from the economics of
knowledge to the learning economy. The Economic Impact of Knowledge, 115–121.
Foster, J. (2002). Valuing Nature?: Economics, ethics and environment. Routledge.
Fowler, F. J. (1995). Improving survey questions: Design and evaluation (Vol. 38). Sage.
Fraenkel, J. R., Wallen, N. E., & Hyun, H. H. (1993). How to design and evaluate research in
education (Vol. 7). McGraw-Hill New York.

361
Frederick, S. (2014). Combining the Global Value Chain and global IO approaches. In
International conference on the measurement of international trade and economic globalization.
Füssel, H.-M. (2007). Vulnerability: a generally applicable conceptual framework for climate
change research. Global Environmental Change, 17(2), 155–167.
Füssel, H.-M., & Klein, R. J. T. (2006). Climate change vulnerability assessments: an
evolution of conceptual thinking. Climatic Change, 75(3), 301–329.
Garbutt, N. (2005). An Introduction to EurepGAP: Facilitating Trade through Safe and
Sustainable Agriculture. Accessible, 15, 2010.
Garrod, G., & Willis, K. G. (1999). Economic valuation of the environment. Books.
Georgescu-Roegen, N. (1993). The entropy law and the economic problem. Valuing the Earth:
Economics, Ecology, Ethics, 75–88.
Gereffi, G. (1994). The organization of buyer-driven global commodity chains: How US
retailers shape overseas production networks. Commodity Chains and Global Capitalism.
Gereffi, G. (1999). International trade and industrial upgrading in the apparel commodity
chain. Journal of International Economics, 48(1), 37–70.
Gereffi, G., & Fernandez-Stark, K. (2016). Global value chain analysis: a primer.
Gereffi, G., Humphrey, J., & Sturgeon, T. (2005). The governance of global value chains.
Review of International Political Economy, 12(1), 78–104.
Gereffi, G., & Korzeniewicz, M. (1994). Commodity chains and global capitalism. ABC-CLIO.
Gereffi, G., & Lee, J. (2016). Economic and social upgrading in global value chains and
industrial clusters: Why governance matters. Journal of Business Ethics, 133(1), 25–38.
Gertler, M. S. (2003). Tacit knowledge and the economic geography of context, or the
undefinable tacitness of being (there). Journal of Economic Geography, 3(1), 75–99.
Ghai, D. (2003). Decent work: Concept and indicators. International Labour Review, 142(2),
113–145.
Ghezzi, S., & Mingione, E. (2007). Embeddedness, path dependency and social institutions:
An economic sociology approach. Current Sociology, 55(1), 11–23.
Gibbon, P., & Ponte, S. (2005). Trading down: Africa, value chains, and the global economy.
Temple University Press.
Gibbons, M., Limoges, C., Nowotny, H., Schwartzman, S., Scott, P., & Trow, M. (1994). The
new production of knowledge: The dynamics of science and research in contemporary societies.
Sage.
Giddens, A. (1990). The consequences of modernity.

362
Giddens, A. (1991). Modernity and self-identity: Self and society in the late modern age. Stanford
University Press.
Giuliani, E., Pietrobelli, C., & Rabellotti, R. (2005). Upgrading in global value chains: lessons
from Latin American clusters. World Development, 33(4), 549–573.
Glasson, J., Therivel, R., & Chadwick, A. (2013). Introduction to environmental impact
assessment. Routledge.
Glin, L. C., Mol, A. P. J., Oosterveer, P., & Vodouhe, S. D. (2012). Governing the
transnational organic cotton network from Benin. Global Networks, 12(3), 333–354.
GlobalGAP( 2014). GlobalGAP Crops. Available at: http://www.globalgap.org/uk_en/for-
producers/crops/ [Accessed February 23, 2014].
Glückler, J. (2001). Zur Bedeutung von Embeddedness in der Wirtschaftsgeographie.
Geographische Zeitschrift, 211–226. ( In English)
Glückler, J. (2005). Making embeddedness work: social practice institutions in foreign
consulting markets. Environment and Planning A, 37(10), 1727–1750.
Goetz, S. J. (1992). A selectivity model of household food marketing behavior in sub-Saharan
Africa. American Journal of Agricultural Economics, 74(2), 444–452.
Goger, A. (2013). The making of a “business case” for environmental upgrading: Sri Lanka’s
eco-factories. Geoforum, 47, 73–83.
González Villalobos, A., & Wallace, M. A. (1998). Multiple frame agricultural
surveysagricultural survey programmes based on area frame or dual frame (area and
list) sample designs, Vol. II. FAO, Statistical Development Series, 10.
Govereh, J., & Jayne, T. S. (2003). Cash cropping and food crop productivity: synergies or
trade‐offs? Agricultural Economics, 28(1), 39–50.
Government of Kenya. (2013). Kenyan National Climate Change Action 2013 report. Nairobi.
Retrieved from https://cdkn.org/wp-content/uploads/2013/03/Kenya-National-Climate-
Change-Action-Plan.pdf
Grabher, G. (2006). Trading routes, bypasses, and risky intersections: mapping the travels
ofnetworks’ between economic sociology and economic geography. Progress in Human
Geography, 30(2), 163–189.
Granovetter, M. S. (1973). The strength of weak ties. American Journal of Sociology, 78(6),
1360–1380.
Granovetter, M. (1983). The strength of weak ties: A network theory revisited. Sociological
Theory, 201–233.

363
Granovetter, M. (1985). Economic action and social structure: The problem of
embeddedness. American Journal of Sociology, 91(3), 481–510.
Granovetter, M. (1992). Economic institutions as social constructions: a framework for
analysis. Acta Sociologica, 35(1), 3–11
Granovetter, M. (2005). The impact of social structure on economic outcomes. The Journal of
Economic Perspectives, 19(1), 33–50.
Gritti, E. S., Smith, B., & Sykes, M. T. (2006). Vulnerability of Mediterranean Basin
ecosystems to climate change and invasion by exotic plant species. Journal of
Biogeography, 33(1), 145–157.
Guarin, A., & Knorringa, P. (2014). New middle-class consumers in rising powers:
Responsible consumption and private standards. Oxford Development Studies, 42(2), 151–
171.
Gulati, R. (1995a). Does familiarity breed trust? The implications of repeated ties for
contractual choice in alliances. Academy of Management Journal, 38(1), 85–112.
Gulati, R. (1995b). Social structure and alliance formation patterns: A longitudinal analysis.
Administrative Science Quarterly, 619–652.
Gulati, R. (1998). Alliances and networks. Strategic Management Journal, 19(4), 293–317.
Gulati, R., & Gargiulo, M. (1999). Where do interorganizational networks come from? 1.
American Journal of Sociology, 104(5), 1439–1493.
Hagedoorn, J. (1993). Understanding the rationale of strategic technology partnering:
Nterorganizational modes of cooperation and sectoral differences. Strategic Management
Journal, 14(5), 371–385.
Hagedoorn, J., & Frankort, H. T. W. (2008). The gloomy side of embeddedness: The effects of
overembeddedness on inter-firm partnership formation. In Network strategy (pp. 503–
530). Emerald Group Publishing Limited.
Hagedoorn, J., Letterie, W., & Palm, F. (2007). Information Value of (un) embedded R&D
Alliances. Working paper, Maastricht University.
Halinen, A., & Törnroos, J.-Å. (1998). The role of embeddedness in the evolution of business
networks. Scandinavian Journal of Management, 14(3), 187–205.
Hall, A. E., & Allen, L. H. (1993). Designing cultivars for the climatic conditions of the next
century. International Crop Science I, (internationalcr), 291–297.
Hansen, M. T. (1999). The search-transfer problem: The role of weak ties in sharing
knowledge across organization subunits. Administrative Science Quarterly, 44(1), 82–111.
364
Hatani, F. (2009). The logic of spillover interception: The impact of global supply chains in
China. Journal of World Business, 44(2), 158–166.
Hausmann, R., Hwang, J., & Rodrik, D. (2007). What you export matters. Journal of Economic
Growth, 12(1), 1–25.
HCDA (Horticultural Crops Development Authority) (2012) ‘Strategic plan: 2009–2013’,
online document, available at: https://goo.gl/gpwqj7. (Retrieved August, 18 2016)
HCDA. (2016). Horticulture Validated Report 2015. Nairobi. Retrieved from
http://www.agricultureauthority.go.ke/wp-content/uploads/2016/05/Horticulture-
Validated-Report-2014-Final-copy.pdf
Hellström, T. (2007). Dimensions of environmentally sustainable innovation: the structure of
eco‐innovation concepts. Sustainable Development, 15(3), 148–159.
Helmsing, B. (2001). Externalities, learning and governance: new perspectives on local
economic development. Development and Change, 32(2), 277–308.
Henderson, J., Dicken, P., Hess, M., Coe, N., & Yeung, H. W.-C. (2002). Global production
networks and the analysis of economic development. Review of International Political
Economy, 9(3), 436–464.
Henson, S. (2008). The role of public and private standards in regulating international food
markets. Journal of International Agricultural Trade and Development, 4(1), 63–81.
Henson, S., & Humphrey, J. (2009). The impacts of private food safety standards on the food
chain and on public standard-setting processes. Joint FAO/WHO Food Standards
Programme, Codex Alimentarius Commission, Thirty-Second Session, FAO Headquarters,
Rome, 29.
Henson, S., & Humphrey, J. (2010). Understanding the complexities of private standards in
global agri-food chains as they impact developing countries. The Journal of Development
Studies, 46(9), 1628–1646.
Henson, S., & Jaffee, S. (2008). Understanding developing country strategic responses to the
enhancement of food safety standards. The World Economy, 31(4), 548–568.
Henson, S., & Mitullah, W. (2004). Kenyan exports of Nile perch: impact of food safety
standards on an export-oriented supply chain.
Hernández, R., Reardon, T., & Berdegué, J. (2007). Supermarkets, wholesalers, and tomato
growers in Guatemala. Agricultural Economics, 36(3), 281–290.
Herrero, M., Ringler, C., van de Steeg, J. A., Thornton, P. K., Zhu, T., Bryan, E., …
Notenbaert, A. M. O. (2010). Climate variability and climate change and their impacts
on Kenya’s agricultural sector.

365
Hess, M. (2004). “Spatial” relationships? Towards a reconceptualization of embedded ness.
Progress in Human Geography, 28(2), 165–186.
Hess, M., & Coe, N. M. (2006). Making connections: global production networks, standards,
and embeddedness in the mobile-telecommunications industry. Environment and
Planning A, 38(7), 1205–1227.
Hess, M., & Yeung, H. W. (2006). Whither global production networks in economic
geography? Past, present, and future. Environment and Planning A, 38(7), 1193–1204.
Higgins, V., Dibden, J., & Cocklin, C. (2008). Building alternative agri-food networks:
Certification, embeddedness and agri-environmental governance. Journal of Rural
Studies, 24(1), 15–27.
Hinrichs, C. C. (2000). Embeddedness and local food systems: notes on two types of direct
agricultural market. Journal of Rural Studies, 16(3), 295–303.
Hodgson, G. M. (2012). On the limits of rational choice theory. Economic Thought, 1(1), 94–
108.
Honlonkou, A. N. (2004). Modelling adoption of natural resources management
technologies: the case of fallow systems. Environment and Development Economics, 9(3),
289–314.
Horner, R. (2014). Strategic decoupling, recoupling and global production networks: India’s
pharmaceutical industry. Journal of Economic Geography, 14(6), 1117–1140.
Horner, R. (2016). A new economic geography of trade and development? Governing south–
south trade, value chains and production networks. Territory, Politics, Governance, 4(4),
400–420.
Horner, R., & Nadvi, K. (2017). Global value chains and the rise of the Global South:
unpacking twenty‐first century polycentric trade. Global Networks.
https://doi.org/10.1111/glob.12180
Hudson, R., & Hudson, R. (2001). Producing places. JSTOR.
Hughes, A. (2000). Retailers, knowledges and changing commodity networks: the case of the
cut flower trade. Geoforum, 31(2), 175–190.
Hughes, A., Wrigley, N., & Buttle, M. (2008). Global production networks, ethical
campaigning, and the embeddedness of responsible governance. Journal of Economic
Geography, 8(3), 345–367.
Humphrey, J., & Schmitz, H. (2002). How does insertion in global value chains affect
upgrading in industrial clusters? Regional Studies, 36(9), 1017–1027.
366
Huq, S., Reid, H., Konate, M., Rahman, A., Sokona, Y., & Crick, F. (2004). Mainstreaming
adaptation to climate change in least developed countries (LDCs). Climate Policy, 4(1),
25–43.
Independent. (2015). The environmental impact of our hunger for valentine roses. Retrieved
July 24, 2017, from http://www.independent.co.uk/news/world/africa/the-
environmental-impact-of-our-hunger-for-valentines-roses-10045176.html
IPCC (2007) . Climate change 2007: impacts, adaptation and vulnerability. Contribution of
working group II to the fourth assessment report of the intergovernmental panel on
climate change. Cambridge University Press, Cambridge.
ITC, (2011). The Impact of private standards on global value chains: Literature Review Series
on the Impacts of Private standards - Part 1, Geneva.
ITC (International Trade Centre) (2014) ‘Trade map’, online trade statistics, available at:
www.trademap.org (Retrieved September, 21 2014)
ITC (International Trade Centre) (2016) ‘Trade map’, online trade statistics, available at:
www.trademap.org(Retrieved January 11 2016)
Jaffee, S. (2003). From Challenge to Opportunity: Transforming Kenya’s Fresh Vegetable
Trade in the Context of Emerging Food Safety and Other Standards in Europe,
Washington D.C.: World Bank
Jaffee, S., Henson, S., & Diaz Rios, L. (2011). Making the Grade: Smallholder Farmers, Emerging
Standards, and Development Assistance Programs in Africa-A Research Program Synthesis.
Washinton: World Bank.
Jensen, M. C., & Heckling, W. H. (1995). Specific And General Knowledge, And
Organizational Structure. Journal of Applied Corporate Finance, 8(2), 4–18.
Jeppesen, S., & Hansen, M. W. (2004). Environmental upgrading of third world enterprises
through linkages to transnational corporations. Theoretical perspectives and
preliminary evidence. Business Strategy and the Environment, 13(4), 261–274.
Jick, T. D. (1979). Mixing qualitative and quantitative methods: Triangulation in action.
Administrative Science Quarterly, 24(4), 602–611.
Johnson, B., Lorenz, E., & Lundvall, B. (2002). Why all this fuss about codified and tacit
knowledge? Industrial and Corporate Change, 11(2), 245–262.
Jonell, M., Phillips, M., Rönnbäck, P., & Troell, M. (2013). Eco-certification of farmed
seafood: will it make a difference? Ambio, 42(6), 659–674.
Kabubo-Mariara, J., & Karanja, F. K. (2007). The economic impact of climate change on
Kenyan crop agriculture: A Ricardian approach. Global and Planetary Change, 57(3), 319–
330.
367
Kadarusman, Y., & Nadvi, K. (2013). Competitiveness and technological upgrading in global
value chains: evidence from the Indonesian electronics and garment Sectors. European
Planning Studies, 21(7), 1007–1028.
Kahneman, D., & Tversky, A. (1979). On the interpretation of intuitive probability: A reply
to Jonathan Cohen. Cognition, 7(4), 409–411.
Kallis, G. (2011). In defence of degrowth. Ecological Economics, 70(5), 873–880.
Kalton, G., & Anderson, D. W. (1986). Sampling rare populations. Journal of the Royal
Statistical Society. Series A (General), 65–82.
Kaplinsky, R. (2016). Inclusive and Sustainable Growth: The SDG Value Chains Nexus. by
International Centre for Trade and Sustainable Development (ICTSD), Geneva,
Switzerland
Kaplinsky, R. (1998). Globalisation, industrialisation and sustainable growth: the pursuit of the nth
rent. Institute of Development Studies, University of Sussex.
Kaplinsky, R., & Morris, M. (2016). Thinning and thickening: Productive sector policies in
the era of global value chains. The European Journal of Development Research, 28(4), 625–
645.
Kaplinsky, R., & Morris, M. (2001). A handbook for value chain research (Vol. 113). IDRC
Ottawa.
Kaplinsky, R., & Wamae, W. (2010). The determinants of upgrading and value added in the
African clothing sector: the contrasting experiences of Kenya and Madagascar.
Unpublished Draft.
Kasperson, R. E., & Kasperson, J. X. (2001). Climate change, vulnerability, and social justice.
Stockholm Environment Institute Stockholm.
Kates, R. W., Travis, W. R., & Wilbanks, T. J. (2012). Transformational adaptation when
incremental adaptations to climate change are insufficient. Proceedings of the National
Academy of Sciences, 109(19), 7156–7161.
Katz, R. W., & Brown, B. G. (1992). Extreme events in a changing climate: variability is more
important than averages. Climatic Change, 21(3), 289–302.
Kelly, P. M., & Adger, W. N. (2000). Theory and practice in assessing vulnerability to climate
change andFacilitating adaptation. Climatic Change, 47(4), 325–352.
Keppel, G. (1991). Design and analysis: A researcher’s handbook. Prentice-Hall, Inc.
Kenya Horticulture council. (2012.). An overview of the Kenyan horticulture industry. Available
at: http://www.fpeak.org/khc.html. (Retrieved September, 18 2013)

368
Khattak, A., Stringer, C., Benson-Rea, M., & Haworth, N. (2015). Environmental upgrading
of apparel firms in global value chains: Evidence from Sri Lanka. Competition & Change,
19(4), 317–335.
KHCP. (2014). USAID Kenya horticultue competitiveness project, Annual report 2013-14. Nairobi.
Retrieved from http://pdf.usaid.gov/pdf_docs/PA00KC7V.pdf
Kim, L. (1998). Crisis construction and organizational learning: Capability building in
catching-up at Hyundai Motor. Organization Science, 9(4), 506–521.
Kirwan, J. (2004). Alternative strategies in the UK agro‐food system: interrogating the
alterity of farmers’ markets. Sociologia Ruralis, 44(4), 395–415.
Kittinger, J., Finkbeiner, E., Glazier, E., & Crowder, L. (2012). Human dimensions of coral
reef social-ecological systems. Ecology and Society, 17(4).
Klink, R. R., & Smith, D. C. (2001). Threats to the external validity of brand extension
research. Journal of Marketing Research, 38(3), 326–335.
Klintman, M. (2012). Issues of scale in the global accreditation of sustainable tourism:
schemes toward harmonized re-embeddedness? Sustainability: Science, Practice, & Policy,
8(1).
Klooster, D. (2005). Environmental certification of forests: The evolution of environmental
governance in a commodity network. Journal of Rural Studies, 21(4), 403–417.
Klooster, D., & Mercado-Celis, A. (2016). Sustainable Production Networks: Capturing Value
for Labour and Nature in a Furniture Production Network in Oaxaca, Mexico. Regional
Studies, 50(11), 1889–1902.
Kogut, B. (1993). Designing global strategies: Profiting from operational flexibility. Readings
in International Business, The MIT Press, Cambridge, MA, 195–213.
Kogut, B., & Zander, U. (1993). Knowledge of the firm and the evolutionary theory of the
multinational corporation. Journal of International Business Studies, 24(4), 625–645.
Kogut, B., & Zander, U. (1992). Knowledge of the firm, combinative capabilities, and the
replication of technology. Organization Science, 3(3), 383–397.
Kokko, A., Tansini, R., & Zejan, M. C. (1996). Local technological capability and productivity
spillovers from FDI in the Uruguayan manufacturing sector. The Journal of Development
Studies, 32(4), 602–611.
Kolenikov, S., & Angeles, G. (2004). The use of discrete data in PCA: theory, simulations,
and applications to socioeconomic indices. Chapel Hill: Carolina Population Center,
University of North Carolina, 1–59.

369
Kolenikov, S., & Angeles, G. (2009). Socioeconomic status measurement with discrete proxy
variables: Is principal component analysis a reliable answer? Review of Income and
Wealth, 55(1), 128–165.
Kolstad, C. (2011). Intermediate Environmental Economics: International Edition. OUP
Catalogue.
Krauss, J. (Global D. I., & Krishnan, A. (2016). Global decisions and local realities: priorities and
producers’ upgrading opportunities in agricultural global production networks (UNFSS
discussion paper No. 7). Geneva. Retrieved from
https://unfss.files.wordpress.com/2013/02/discussion-
paper_unfss_krausskrishnan_dec2016.pdf
Krippner, G. R. (2002). The elusive market: Embeddedness and the paradigm of economic
sociology. Theory and Society, 30(6), 775–810.
Krishnan, A. (2017). The Origin and Expansion of Regional Value Chains: The Case of
Kenyan Horticulture. Global Networks. https://doi.org/10.1111/glob.12162
Kuran, T. (1988). The tenacious past: Theories of personal and collective conservatism.
Journal of Economic Behavior & Organization, 10(2), 143–171.
Laderach, P., Lundy, M., Jarvis, A., Ramirez, J., Portilla, E. P., Schepp, K., & Eitzinger, A.
(2011). Predicted impact of climate change on coffee supply chains. Springer.
Lall, S. (1993). Transnational corporations and economic development (Vol. 3). Taylor & Francis
US.
Lall, S., Weiss, J., & Zhang, J. (2006). The “sophistication” of exports: a new trade measure.
World Development, 34(2), 222–237.
Lam, A. (2000). Tacit knowledge, organizational learning and societal institutions: An
integrated framework. Organization Studies, 21(3), 487–513.
Larson, A. (1992). Network dyads in entrepreneurial settings: A study of the governance of
exchange relationships. Administrative Science Quarterly, 76–104.
Lee, J., & Gereffi, G. (2015). Global value chains, rising power firms and economic and social
upgrading. Critical Perspectives on International Business, 11(3/4), 319–339.
Leichenko, R., & O’Brien, K. (2008). Environmental change and globalization: Double exposures.
Oxford University Press.
Lemos, M. C., & Agrawal, A. (2006). Environmental governance. Annual Review of
Environment and Resources, 31.
Levin, D. Z., & Cross, R. (2004). The strength of weak ties you can trust: The mediating role
of trust in effective knowledge transfer. Management Science, 50(11), 1477–1490.

370
Levin, J., & Milgrom, P. (2004). Introduction to choice theory. Available from Internet:
Http://web. Stanford. Edu/~ jdlevin/Econ, 20202.
Levitan, L., Merwin, I., & Kovach, J. (1995). Assessing the relative environmental impacts of
agricultural pesticides: the quest for a holistic method. Agriculture, Ecosystems &
Environment, 55(3), 153–168.
Lichtenberg, E. (2004). Some hard truths about agriculture and the environment.
AGRICULTURAL AND RESOURCE ECONOMICS REVIEW., 33, 24–33.
Liffmann, R. H., Huntsinger, L., & Forero, L. C. (2000). To ranch or not to ranch: home on the
urban range? Journal of Range Management, 362–370.
Liu, W., & Dicken, P. (2006). Transnational corporations and “obligated embeddedness”:
foreign direct investment in China’s automobile industry. Environment and Planning A,
38(7), 1229–1247.
Lobell, D. B., & Burke, M. B. (2010). On the use of statistical models to predict crop yield
responses to climate change. Agricultural and Forest Meteorology, 150(11), 1443–1452.
Lobell, D. B., & Burke, M. B. (2010). On the use of statistical models to predict crop yield
responses to climate change. Agricultural and Forest Meteorology, 150(11), 1443–1452.
Lobell, D. B., & Field, C. B. (2007). Global scale climate–crop yield relationships and the
impacts of recent warming. Environmental Research Letters, 2(1), 14002.
Louw, A., Vermeulen, H., Kirsten, J., & Madevu 1, H. (2007). Securing small farmer
participation in supermarket supply chains in South Africa. Development Southern
Africa, 24(4), 539–551.
Lund‐Thomsen, P. (2008). The global sourcing and codes of conduct debate: five myths and
five recommendations. Development and Change, 39(6), 1005–1018.
Lundvall, B.-Ä., & Johnson, B. (1994). The learning economy. Journal of Industry Studies, 1(2),
23–42.
Mackinnon, D., Chapman, K., & Cumbers, A. (2004). Networking, trust and embeddedness
amongst SMEs in the Aberdeen oil complex. Entrepreneurship & Regional Development,
16(2), 87–106.
Maertens, M., & Swinnen, J. F. M. (2009). Trade, standards, and poverty: Evidence from
Senegal. World Development, 37(1), 161–178.
Martínez-Alier, J., Pascual, U., Vivien, F.-D., & Zaccai, E. (2010). Sustainable de-growth:
Mapping the context, criticisms and future prospects of an emergent paradigm.
Ecological Economics, 69(9), 1741–1747.
Maskell, P., & Malmberg, A. (1999). Localised learning and industrial competitiveness.
Cambridge Journal of Economics, 167–185.

371
Matson, P. A., Parton, W. J., Power, A. G., & Swift, M. J. (1997). Agricultural intensification
and ecosystem properties. Science, 277(5325), 504–509.
Mays, N., & Pope, C. (1995). Rigour and qualitative research. BMJ: British Medical Journal,
311(6997), 109.
McCann, E., Sullivan, S., Erickson, D., & De Young, R. (1997). Environmental awareness,
economic orientation, and farming practices: a comparison of organic and conventional
farmers. Environmental Management, 21(5), 747–758.
McCulloch, N., & Ota, M. (2002). IDS Working Paper 174.
McEwan, C., Hughes, A., & Bek, D. (2015). Theorising middle class consumption from the
global South: A study of everyday ethics in South Africa’s Western Cape. Geoforum, 67,
233–243.
McKinsey & Co. (2015) ‘The rise of the African consumer’, online report, available at:
www.mckinsey.com/global_locations/africa/south_africa/en/rise_of_the_african_consu
mer.
McMichael, P. (1996). Globalization: Myths and Realities1. Rural Sociology, 61(1), 25–55.
Mecatti, F., & Singh, A. C. (2014). Estimation in Multiple Frame Surveys: A Simplified and
Unified Review using the Multiplicity Approach. Journal de La Société Française de
Statistique, 155(4), 51–69.
Messner, D., & Meyer-Stamer, J. (2000). Governance and networks. Tools to study the
dynamics of clusters and global value chains. IDS/INEF Project" The Impact of Global and
Local Governance on Industrial Upgrading, 320.
Mikkelsen, B. (2005). Methods for development work and research: a new guide for practitioners.
Sage.
Milberg, W., & Winkler, D. (2011). Economic and social upgrading in global production
networks: Problems of theory and measurement. International Labour Review, 150(3‐4),
341–365.
Minot, N., & Ngigi, M. (2004). Are horticultural exports a replicable success story?: evidence from
Kenya and Côte d’Ivoire. Intl Food Policy Res Inst.
Minten, B., & Barrett, C. B. (2008). Agricultural technology, productivity, and poverty in
Madagascar. World Development, 36(5), 797–822.
Morgan, K., & Cooke, P. (1998). The associational economy: firms, regions, and innovation.
Morris, C., & Kirwan, J. (2011). Ecological embeddedness: An interrogation and refinement
of the concept within the context of alternative food networks in the UK. Journal of Rural
Studies, 27(3), 322–330.

372
Morton, J. F. (2007). The impact of climate change on smallholder and subsistence
agriculture. Proceedings of the National Academy of Sciences, 104(50), 19680–19685.
Moser, C., & Felton, A. (2007). The construction of an asset index measuring asset
accumulation in Ecuador.
Muendo, K. M., Tschirley, D., & Weber, M. T. (2004). Improving Kenya’s domestic
horticultural production and marketing system: Current competitiveness, forces of
change, and challenges for the future. Tegemeo Institute of Agricultural Policy and
Development, Egerton University, Kenya.
Murdoch, J. (2000). Networks—a new paradigm of rural development? Journal of Rural
Studies, 16(4), 407–419.
Murphy, J. T. (2012). Global production networks, relational proximity, and the sociospatial
dynamics of market internationalization in Bolivia’s wood products sector. Annals of the
Association of American Geographers, 102(1), 208–233.
Murphy, J. T. (2006). Building trust in economic space. Progress in Human Geography, 30(4),
427–450.
Murphy, J. T., & Schindler, S. (2011). Globalizing development in Bolivia? Alternative
networks and value-capture challenges in the wood products industry. Journal of
Economic Geography, 11(1), 61–85.
Nadvi, K. (1999a). Shifting ties: social networks in the surgical instrument cluster of Sialkot,
Pakistan. Development and Change, 30(1), 141–175.
Nadvi, K. (1999b). Collective efficiency and collective failure: the response of the Sialkot
surgical instrument cluster to global quality pressures. World Development, 27(9), 1605–
1626.
Nadvi, K. (2008). Global standards, global governance and the organization of global value
chains. Journal of Economic Geography, 8(3), 323–343.
Nadvi, K. (2011). Labour standards and technological upgrading: Competitive challenges in
the global football industry. International Journal of Technological Learning, Innovation and
Development, 4(1–3), 235–257.
Navas-Alemán, L. (2011). The impact of operating in multiple value chains for upgrading:
the case of the Brazilian furniture and footwear industries. World Development, 39(8),
1386–1397.
Neill, S. P., & Lee, D. R. (2001). Explaining the adoption and disadoption of sustainable
agriculture: the case of cover crops in northern Honduras. Economic Development and
Cultural Change, 49(4), 793–820.
Neilson, J., & Pritchard, B. (2011). Value chain struggles: Institutions and governance in the
plantation districts of South India (Vol. 93). John Wiley & Sons.

373
Neilson, J., Pritchard, B., & Yeung, H. W. (2014). Global value chains and global production
networks in the changing international political economy: An introduction. Review of
International Political Economy, 21(1), 1–8.
Nelson, R. R., & Sidney, G. (2005). Winter. 1982. An evolutionary theory of economic change.
Cambridge, MA: Harvard University Press.
Nelson, R. R., & Winter, S. G. (1982). The Schumpeterian tradeoff revisited. The American
Economic Review, 72(1), 114–132.
Nelson, V., & Tallontire, A. (2014). Battlefields of ideas: Changing narratives and power
dynamics in private standards in global agricultural value chains. Agriculture and
Human Values, 31(3), 481–497.
Neven, D., Odera, M. M., Reardon, T., & Wang, H. (2009). Kenyan supermarkets, emerging
middle-class horticultural farmers, and employment impacts on the rural poor. World
Development, 37(11), 1802–1811.
Neven, D., & Reardon, T. (2004). The rise of Kenyan supermarkets and the evolution of their
horticulture product procurement systems. Development Policy Review, 22(6), 669–699.
Nonaka, I. (1991). Models of knowledge management in the West and Japan.
Nooteboom, B., Berger, H., & Noorderhaven, N. G. (1997). Effects of trust and governance on
relational risk. Academy of Management Journal, 40(2), 308–338.
Norgaard, R. B. (1994). Development betrayed. The End of Progress and a Coevolutionary
Revisioning of the Future. London.
O’Brien, K., Leichenko, R., Kelkar, U., Venema, H., Aandahl, G., Tompkins, H., … Nygaard,
L. (2004). Mapping vulnerability to multiple stressors: climate change and globalization
in India. Global Environmental Change, 14(4), 303–313.
O’Brien, K. L., & Leichenko, R. M. (2000). Double exposure: assessing the impacts of climate
change within the context of economic globalization. Global Environmental Change, 10(3),
221–232.
O’hara, S. U., & Stagl, S. (2001). Global food markets and their local alternatives: A socio-
ecological economic perspective. Population & Environment, 22(6), 533–554.
Okello, J. J., Kirui, O., Njiraini, G. W., & Gitonga, Z. (2011). Drivers of use of information and
communication technologies by farm households: The case of smallholder farmers in
Kenya. Journal of Agricultural Science, 4(2), 111.
Okello, J. J., Narrod, C., & Roy, D. (2007). Food safety requirements in African green bean exports
and their impact on small farmers. Intl Food Policy Res Inst.
Olesen, J. E., & Bindi, M. (2002). Consequences of climate change for European agricultural
productivity, land use and policy. European Journal of Agronomy, 16(4), 239–262.

374
Orsato, R. J. (2009). What are Sustainability Strategies? In Sustainability Strategies (pp. 23–42).
Springer.
Ouma, S. (2010). Global standards, local realities: private agrifood governance and the
restructuring of the Kenyan horticulture industry. Economic Geography, 86(2), 197–222.
Parry, M. L., Rosenzweig, C., Iglesias, A., Livermore, M., & Fischer, G. (2004). Effects of
climate change on global food production under SRES emissions and socio-economic
scenarios. Global Environmental Change, 14(1), 53–67.
Parsons, T. (1937). 1968. The Structure of Social Action, 2, 34–49.
Pavitt, K. (1998). Technologies, products and organization in the innovating firm: what
Adam Smith tells us and Joseph Schumpeter doesn’t. Industrial and Corporate Change,
7(3), 433–452.
Peet, R. K. (1985). Introduction. In Plant community ecology: Papers in honor of Robert H.
Whittaker (pp. 1–4). Springer
Penker, M. (2006). Mapping and measuring the ecological embeddedness of food supply
chains. Geoforum, 37(3), 368–379.
Penrose, E. T. (1959). The theory of the growth ofthe firm. New York: Sharpe.
Perrings, C. (1991). Reserved rationality and the precautionary principle: Technological
change, time and uncertainty in environmental decision making. Ecological Economics–
The Science and Management of Sustainablity, New York, 153–166.
Pickles, J., Barrientos, S., & Knorringa, P. (2016). New end markets, supermarket expansion
and shifting social standards. Environment and Planning A, 48(7), 1284–1301.
Pielke, R. A. (1998). Rethinking the role of adaptation in climate policy. Global Environmental
Change, 8(2), 159–170.
Pietrobelli, C., & Rabellotti, R. (2011). Global value chains meet innovation systems: are there
learning opportunities for developing countries? World Development, 39(7), 1261–1269.
Pietrobelli, C., & Saliola, F. (2008). Power relationships along the value chain: multinational
firms, global buyers and performance of local suppliers. Cambridge Journal of Economics,
32(6), 947–962.
Pingali, P. L., Hossain, M., Pandey, S., & Price, L. L. (1998). Economics of nutrient
management in Asian rice systems: towards increasing knowledge intensity. Field Crops
Research, 56(1–2), 157–176.
Polanyi, K. (1944). The great transformation: Economic and political origins of our time.
Rinehart, New York.

375
Polanyi, K. (1957). The economy as instituted process. Trade and Market in the Early Empires,
243.
Polanyi, M. (1966). The logic of tacit inference. Philosophy, 41(155), 1–18.
Polanyi, M. (1997). The tacit dimension. Knowledge in Organizations, 135–146.
Polanyi, M. (1958). Personal knowledge, towards a post critical epistemology. Chicago, IL:
University of.
Ponte, S. (2002). Thelatte revolution’? Regulation, markets and consumption in the global
coffee chain. World Development, 30(7), 1099–1122.
Ponte, S. (2008). Greener than thou: The political economy of fish ecolabeling and its local
manifestations in South Africa. World Development, 36(1), 159–175.
Ponte, S., & Ewert, J. (2009). Which way is “up” in upgrading? Trajectories of change in the
value chain for South African wine. World Development, 37(10), 1637–1650.
Ponte, S., Gibbon, P., & Vestergaard, J. (2011). Governing through standards: an
introduction. Governing Through Standards: Origins, Drivers and Limitations, 1–24.
Ponte, S., & Cheyns, E. (2013). Voluntary standards, expert knowledge and the governance
of sustainability networks. Global Networks, 13(4), 459–477.
Ponte, S., & Sturgeon, T. (2014). Explaining governance in global value chains: A modular
theory-building effort. Review of International Political Economy, 21(1), 195–223.
Popper, K. R. (1972). Objective knowledge: An evolutionary approach.
Porter, J. R., & Semenov, M. A. (2005). Crop responses to climatic variation. Philosophical
Transactions of the Royal Society B: Biological Sciences, 360(1463), 2021–2035.
Potter, J., Moore, B., & Spires, R. (2003). Foreign manufacturing investment in the United
Kingdom and the upgrading of supplier practices. Regional Studies, 37(1), 41–60.
Poulsen, R. T., Ponte, S., & Lister, J. (2016). Buyer-driven greening? Cargo-owners and
environmental upgrading in maritime shipping. Geoforum, 68, 57–68.
Poulton, C., Dorward, A., & Kydd, J. (2010). The future of small farms: New directions for
services, institutions, and intermediation. World Development, 38(10), 1413–1428.
Poulton, C., Gibbon, P., Hanyani-Mlambo, B., Kydd, J., Maro, W., Larsen, M. N., … Zulu, B.
(2004). Competition and coordination in liberalized African cotton market systems.
World Development, 32(3), 519–536.
Powell, W. (2003). Neither market nor hierarchy. The Sociology of Organizations: Classic,
Contemporary, and Critical Readings, 315, 104–117.

376
Pretty, J. (2008). Agricultural sustainability: concepts, principles and evidence. Philosophical
Transactions of the Royal Society B: Biological Sciences, 363(1491), 447–465.
Prospect magazine. (2009). How green are your green beans? Retrieved July 24, 2017, from
https://www.prospectmagazine.co.uk/magazine/how-green-are-your-beans
Rainnie, A., Herod, A., & McGrath-Champ, S. (2011). Review and positions: Global
production networks and labour. Competition & Change, 15(2), 155–169.
Rainforest Alliance. (2017). Our work on climate change. Retrieved June 10, 2017, from
http://www.rainforest-alliance.org/issues/climate
Rao, E. J. O., & Qaim, M. (2013). Supermarkets and agricultural labor demand in Kenya: A
gendered perspective. Food Policy, 38, 165–176.
Rao, E. J. O., & Qaim, M. (2011). Supermarkets, farm household income, and poverty:
insights from Kenya. World Development, 39(5), 784–796.
Rao, K. P. C., Ndegwa, W. G., Kizito, K., & Oyoo, A. (2011). Climate variability and change:
Farmer perceptions and understanding of intra-seasonal variability in rainfall and
associated risk in semi-arid Kenya. Experimental Agriculture, 47(2), 267–291.
Raynolds, L. T., Murray, D., & Wilkinson, J. (2007). Fair trade: The challenges of transforming
globalization. Routledge.
Rea, L. M., & Parker, R. A. (2014). Designing and conducting survey research: A comprehensive
guide. John Wiley & Sons.
Reardon, T., & Vosti, S. A. (1995). Links between rural poverty and the environment in
developing countries: asset categories and investment poverty. World Development,
23(9), 1495–1506.
Reardon, T., & Berdegue, J. A. (2002). The rapid rise of supermarkets in Latin America:
challenges and opportunities for development. Development Policy Review, 20(4), 371–
388.
Reardon, T., Timmer, C. P., Barrett, C. B., & Berdegué, J. (2003). The rise of supermarkets in
Africa, Asia, and Latin America. American Journal of Agricultural Economics, 85(5), 1140–
1146.
Reardon, T., Henson, S., & Berdegué, J. (2007). “Proactive fast-tracking”diffusion of
supermarkets in developing countries: implications for market institutions and trade.
Journal of Economic Geography, 7(4), 399–431.
Reardon, T., & Timmer, C. P. (2007). Transformation of markets for agricultural output in
developing countries since 1950: How has thinking changed? Handbook of Agricultural
Economics, 3, 2807–2855.

377
Reardon, T., Barrett, C. B., Berdegué, J. A., & Swinnen, J. F. M. (2009). Agrifood industry
transformation and small farmers in developing countries. World Development, 37(11),
1717–1727.
Rennings, K. (2000). Redefining innovation—eco-innovation research and the contribution
from ecological economics. Ecological Economics, 32(2), 319–332.
Renting, H., Marsden, T. K., & Banks, J. (2003). Understanding alternative food networks:
exploring the role of short food supply chains in rural development. Environment and
Planning A, 35(3), 393–411.
Reuters (2017). Kenyan Supermarket Chain Nakumatt agrees stake sale to fund $75 million
available at: http://af.reuters.com/article/investingNews/idAFKBN1521WU [Accessed
7th March 2017]
Rigby, D., Woodhouse, P., Young, T., & Burton, M. (2001). Constructing a farm level
indicator of sustainable agricultural practice. Ecological Economics, 39(3), 463–478.
Riisgaard, L., Bolwig, S., Ponte, S., Du Toit, A., Halberg, N., & Matose, F. (2010). Integrating
poverty and environmental concerns into value‐chain analysis: a strategic framework
and practical guide. Development Policy Review, 28(2), 195–216.
Robbins, P. (2011). Political ecology: A critical introduction (Vol. 16). John Wiley & Sons
Roodman, D. (2009). Estimating fully observed recursive mixed-process models with cmp.
Rosenzweig, C., & Hillel, D. (1998). Climate change and the global harvest.
Rötter, R., & Van de Geijn, S. C. (1999). Climate change effects on plant growth, crop yield
and livestock. Climatic Change, 43(4), 651–681.
Rounsevell, M. D. A., Evans, S. P., & Bullock, P. (1999). Climate change and agricultural
soils: impacts and adaptation. Climatic Change, 43(4), 683–709.
Rowley, T., Behrens, D., & Krackhardt, D. (2000). Redundant governance structures: An
analysis of structural and relational embeddedness in the steel and semiconductor
industries. Strategic Management Journal, 369–386.
Rowley, T. J. (1997). Moving beyond dyadic ties: A network theory of stakeholder
influences. Academy of Management Review, 22(4), 887–910.
Ryan, R. L., Erickson, D. L., & De Young, R. (2003). Farmers’ motivations for adopting
conservation practices along riparian zones in a mid-western agricultural watershed.
Journal of Environmental Planning and Management, 46(1), 19–37.
Saliola, F., & Zanfei, A. (2009). Multinational firms, global value chains and the organization
of knowledge transfer. Research Policy, 38(2), 369–381.
378
Sarkis, J. (2003). A strategic decision framework for green supply chain management. Journal
of Cleaner Production, 11(4), 397–409.
Saxenian, A. (2002). Transnational communities and the evolution of global production
networks: the cases of Taiwan, China and India. Industry and Innovation, 9(3), 183–202.
Scherr, S. J. (2000). A downward spiral? Research evidence on the relationship between
poverty and natural resource degradation. Food Policy, 25(4), 479–498.
Schmitz, H. (1999). From ascribed to earned trust in exporting clusters. Journal of International
Economics, 48(1), 139–150.
Schmitz, H. (1995). Collective efficiency: Growth path for small‐scale industry. The Journal of
Development Studies, 31(4), 529–566.
Schmitz, H., & Knorringa, P. (2000). Learning from global buyers. Journal of Development
Studies, 37(2), 177–205.
Schneider, F., Kallis, G., & Martinez-Alier, J. (2010). Crisis or opportunity? Economic
degrowth for social equity and ecological sustainability. Introduction to this special
issue. Journal of Cleaner Production, 18(6), 511–518.
Scialabba, N. E.-H., & Müller-Lindenlauf, M. (2010). Organic agriculture and climate change.
Renewable Agriculture and Food Systems, 25(2), 158–169.
Scoones, I. (1998). Sustainable rural livelihoods: a framework for analysis.
Selten, R. (1998). Features of experimentally observed bounded rationality. European
Economic Review, 42(3), 413–436.
Selten, R., & Stoecker, R. (1986). End behavior in sequences of finite Prisoner’s Dilemma
supergames A learning theory approach. Journal of Economic Behavior & Organization,
7(1), 47–70.
Semenov, M. A., & Porter, J. R. (1995). Climatic variability and the modelling of crop yields.
Agricultural and Forest Meteorology, 73(3), 265–283.
Sen, A. (2000). Social exclusion: Concept, application, and scrutiny.
Sen, A. (2008). The economics of happiness and capability. Capabilities and happiness, 27.
Sexsmith, K., & McMichael, P. (2015). Formulating the SDGs: Reproducing or reimagining
state-centered development? Globalizations, 12(4), 581–596.
Sheppard, E. (2002). The spaces and times of globalization: place, scale, networks, and
positionality. Economic Geography, 78(3), 307–330.

379
Shiferaw, B. A., Okello, J., & Reddy, R. V. (2009). Adoption and adaptation of natural
resource management innovations in smallholder agriculture: reflections on key lessons
and best practices. Environment, Development and Sustainability, 11(3), 601–619.
Simon, H. A. (1972). Theories of bounded rationality. Decision and Organization, 1(1), 161–176.
Simon, H. A. (1982). Models of bounded rationality: Empirically grounded economic reason (Vol.
3). MIT press.
Simon, H. A. (1987). Bounded rationality. The New Palgrave: Utility and Probability, 15–18.
Simon, H. A. (1995). Rationality in political behavior. Political Psychology, 45–61.
Singh, A. and Mecatti, F. (2011). Generalized Multiplicity-adjusted Horvitz-Thompson type
Estimation as a Unified Approach to Multiple Frame Surveys. Journal of Official
Statistics, 27:633–650
Sit, V. F. S., & Liu, W. (2000). Restructuring and spatial change of China’s auto industry
under institutional reform and globalization. Annals of the Association of American
Geographers, 90(4), 653–673.
Smit, B., Burton, I., Klein, R. J. T., & Wandel, J. (2000). An anatomy of adaptation to climate
change and variability. Climatic Change, 45(1), 223–251.
Smit, B., & Wandel, J. (2006). Adaptation, adaptive capacity and vulnerability. Global
Environmental Change, 16(3), 282–292.
Smith, V. L. (2003). Constructivist and ecological rationality in economics. The American
Economic Review, 93(3), 465–508.
SNV. (2012). The Beans Value Chain in Kenya. Netherlands. Retrieved from
http://www.snvworld.org/en/countries/kenya/publications/the-beans-value-chain-in-
kenya
Solomon, S. (2007). Climate change 2007-the physical science basis: Working group I contribution
to the fourth assessment report of the IPCC (Vol. 4). Cambridge University Press.
Sonnino, R., & Marsden, T. (2006). Beyond the divide: rethinking relationships between
alternative and conventional food networks in Europe. Journal of Economic Geography,
6(2), 181–199.
Spradley, J. P. (2016). Participant observation. Waveland Press.
Spruyt, H. (2002). The origins, development, and possible decline of the modern state.
Annual Review of Political Science, 5(1), 127–149.
Srivastava, S. K. (2007). Green supply‐chain management: a state‐of‐the‐art literature review.
International Journal of Management Reviews, 9(1), 53–80.
Stake, R. E. (1995). The art of case study research. Sage.

380
Starosta, G. (2010). Global commodity chains and the Marxian law of value. Antipode, 42(2),
433–465.
Sturgeon, T. J. (2003). What really goes on in Silicon Valley? Spatial clustering and dispersal
in modular production networks. Journal of Economic Geography, 3(2), 199–225.
Sturgeon, T. J. (2002). Modular production networks: a new American model of industrial
organization. Industrial and Corporate Change, 11(3), 451–496.
Sturgeon, T., Van Biesebroeck, J., & Gereffi, G. (2008). Value chains, networks and clusters:
reframing the global automotive industry. Journal of Economic Geography, lbn007.
Swinnen, J. F. M., & Maertens, M. (2007). Globalization, privatization, and vertical
coordination in food value chains in developing and transition countries. Agricultural
Economics, 37(s1), 89–102.
Tallontire, A., Dolan, C., Smith, S., & Barrientos, S. (2005). Reaching the marginalised?
Gender value chains and ethical trade in African horticulture. Development in Practice,
15(3–4), 559–571.
Tallontire, A., Opondo, M., Nelson, V., & Martin, A. (2011). Beyond the vertical? Using value
chains and governance as a framework to analyse private standards initiatives in agri-
food chains. Agriculture and Human Values, 28(3), 427–441.
Teece, D. J., Pisano, G., & Shuen, A. (1997). Dynamic capabilities and strategic management.
Strategic Management Journal, 509–533.
Teklewold, H., Kassie, M., & Shiferaw, B. (2013). Adoption of multiple sustainable
agricultural practices in rural Ethiopia. Journal of Agricultural Economics, 64(3), 597–623.
Thrupp, L. A. (1995). Bittersweet harvests for global supermarkets: challenges in Latin America’s
agricultural export boom. World Resources Institute.
Tigges, L. M., Ziebarth, A., & Farnham, J. (1998). Social relationships in locality and
livelihood: The embeddedness of rural economic restructuring. Journal of Rural Studies,
14(2), 203–219.
Tokatli, N. (2013). Toward a better understanding of the apparel industry: a critique of the
upgrading literature. Journal of Economic Geography, 13(6), 993–1011.
Tonneau, J.-P., Guéneau, S., Piketty, M.-G., Drigo, I., & Poccard-Chapuis, R. (2017). Agro-
industrial Strategies and Voluntary Mechanisms for the Sustainability of Tropical
Global Value Chains: The Place of Territories BT - Sustainable Development and
Tropical Agri-chains. In E. Biénabe, A. Rival, & D. Loeillet (Eds.) (pp. 271–282).
Dordrecht: Springer Netherlands.
Turner, B. L., Kasperson, R. E., Meyer, W. B., Dow, K. M., Golding, D., Kasperson, J. X.,
Ratick, S. J. (1990). Two types of global environmental change: Definitional and spatial-
scale issues in their human dimensions. Global Environmental Change, 1(1), 14–22.

381
Turner, B. L., Kasperson, R. E., Matson, P. A., McCarthy, J. J., Corell, R. W., Christensen, L.,
… Martello, M. L. (2003). A framework for vulnerability analysis in sustainability
science. Proceedings of the National Academy of Sciences, 100(14), 8074–8079.
Turner, R. K., Pearce, D., & Bateman, I. (1994). Environmental economics: an elementary
introduction. Harvester Wheatsheaf.
Tversky, A., & Kahneman, D. (1992). Advances in prospect theory: Cumulative
representation of uncertainty. Journal of Risk and Uncertainty, 5(4), 297–323.
Uzzi, B. (1996). The sources and consequences of embeddedness for the economic
performance of organizations: The network effect. American Sociological Review, 674–698.
Uzzi, B. (1997). Social structure and competition in interfirm networks: The paradox of
embeddedness. Administrative Science Quarterly, 35–67.
Vachon, S., & Klassen, R. D. (2008). Environmental management and manufacturing
performance: The role of collaboration in the supply chain. International Journal of
Production Economics, 111(2), 299–315.
Van der Werf, H. M. G., & Petit, J. (2002). Evaluation of the environmental impact of
agriculture at the farm level: a comparison and analysis of 12 indicator-based methods.
Agriculture, Ecosystems & Environment, 93(1), 131–145.
Von Hippel, E. (1994). “Sticky information” and the locus of problem solving: implications
for innovation. Management Science, 40(4), 429–439.
Waarts, Y., & Meijerink, G. (2010). The HCDA Code of Conduct in Kenya.
Wahl, A., & Bull, G. Q. (2014). Mapping research topics and theories in private regulation for
sustainability in global value chains. Journal of Business Ethics, 124(4), 585–608.
Wainwright, H., Jordan, C., & Day, H. (2014). Environmental impact of production
horticulture. In Horticulture: Plants for People and Places, Volume 1 (pp. 503–522).
Springer.
Wallace, B., & Clearfield, F. (1997). Stewardship, spirituality, and natural resources
conservation: a short history. USDA-NRCS Social Sciences Institute Technical Report
Release, 2.
Ward, K. (2010). Towards a relational comparative approach to the study of cities. Progress in
Human Geography, 34(4), 471–487.
WBCSD - World Business Council on Sustainable Development (1999). Corporate Social
Responsibility: Meeting changing expectations. Geneva: WBCSD
Werner, M. (2012). Beyond upgrading: gendered labor and the restructuring of firms in the
Dominican Republic. Economic Geography, 88(4), 403–422.

382
Whatmore, S., & Thorne, L. (1997). Alternative geographies of food. Globalising Food:
Agrarian Questions and Global Restructuring. D. Goodman and MJ Watts. London, Routledge.
Whiteman, G., & Cooper, W. H. (2000). Ecological embeddedness. Academy of Management
Journal, 43(6), 1265–1282.
Whitley, R. (1992). Business systems in East Asia: Firms, markets and societies. Sage.
Wilbanks, T. J., & Kates, R. W. (1999). Global change in local places: how scale matters.
Climatic Change, 43(3), 601–628.
Wilkinson, J. (1997). A new paradigm for economic analysis? Recent convergences in French
social science and an exploration of the convention theory approach with a
consideration of its application to the analysis of the agrofood system. International
Journal of Human Resource Management, 26(3), 335–339.
Williamson, O. E. (1975). Markets and hierarchies. New York, 26–30.
Williamson, O. E. (1989). Transaction cost economics. Handbook of Industrial Organization, 1,
135–182.
Williamson, O. E. (1998). Transartion Cost Eronomirs and Organization Thiory. Technology,
Organization, and Competitiveness: Perspectives on Industrial and Corporate Change, 17.
Williamson, O. E. (2000). The new institutional economics: taking stock, looking ahead.
Journal of Economic Literature, 38(3), 595–613.
Winter, M. (2003). Embeddedness, the new food economy and defensive localism. Journal of
Rural Studies, 19(1), 23–32.
World Bank (2015) DataBank, website, available at: http://databank.worldbank.org/data/
home.aspx.
Worldbank. (2016). Types of environmental impacts. Retrieved June 16, 2016, from
http://siteresources.worldbank.org/INTTRANSPORT/Resources/336291-
1107880869673/chap_6.pdf
Wrong, D. H. (1961). The oversocialized conception of man in modern sociology. American
Sociological Review, 183–193.
Wynberg, R., & van Niekerk, J. (2014). Global ambitions and local realities: achieving equity
and sustainability in two high-value natural product trade chains. Forests, Trees and
Livelihoods, 23(1–2), 19–35.
Yeung, H. W. (1998). The political economy of transnational corporations: a study of the
regionalization of Singaporean firms. Political Geography, 17(4), 389–416.
Yeung, H. W. (2005). Rethinking relational economic geography. Transactions of the Institute
of British Geographers, 30(1), 37–51.

383
Yeung, H. W., Liu, W., & Dicken, P. (2006). Transnational corporations and network effects
of a local manufacturing cluster in mobile telecommunications equipment in China.
World Development, 34(3), 520–540.
Yeung, H. W., & Coe, N. (2015). Toward a dynamic theory of global production networks.
Economic Geography, 91(1), 29–58.
Yin, R. K. (2009). Case study research: design and methods. essential guide to qualitative
methods in organizational research. fourth. SAGE: Thousand Oaks, CA.
Zanfei, A. (1994). Surviving competition through cooperation: the case of the Italian
telecommunications industry. Journal of Industry Studies, 1(2), 65–76.
Zellner, A. (1962). An efficient method of estimating seemingly unrelated regressions and
tests for aggregation bias. Journal of the American Statistical Association, 57(298), 348–368.
Zhou, G., Minakawa, N., Githeko, A. K., & Yan, G. (2004). Association between climate
variability and malaria epidemics in the East African highlands. Proceedings of the
National Academy of Sciences of the United States of America, 101(8), 2375–2380.
Zhu, S., & Fu, X. (2013). Drivers of export upgrading. World Development, 51, 221–233.
Zucchella, A. (2006). Local cluster dynamics: trajectories of mature industrial districts
between decline and multiple embeddedness. Journal of Institutional Economics, 2(1), 21–
44.
Zucker, L. G. (1986). Production of trust: Institutional sources of economic structure, 1840–
1920. Research in Organizational Behavior.
Zukin, S., & DiMaggio, P. (1990). Structures of capital: The social organization of the economy.
CUP Archive.

384
Appendices
Appendix 1: List of key in-depth interviews
Coding
#1: Interview number;
k=Kenya;
Letter following ‘k’ specific actor
List of interviews
In depth interview with farmers
Number Interlocutor’s
affiliation
Production
network
Date of interview Place of interview
#1kGPN Kenyan farmers Global 29-10-2014 Gatanga, Murang’a
#2kGPN Kenyan farmers Global 29-10-2014 Gatanga, Murang’a
#3kGPN Kenyan farmers Global 29-10-2014 Gatanga, Murang’a
#4kLPN Kenyan farmers Local 11-05-2014 Kandara, Murang'a
#5kLPN Kenyan farmers Local 11-05-2014 Kandara, Murang'a
#6kLPN Kenyan farmers Local 11-09-2014 Kandara, Murang'a
#7kRPN Kenyan farmers Regional 11-12-2014 Kandara, Murang'a
#8kRPN Kenyan farmers Regional 20-11-2014 Kandara, Murang'a
#9kGPN Kenyan farmers Global 20-11-2014 Kandara, Murang'a
#10kGPN Kenyan farmers Global 12-04-2014 Kandara, Murang'a
#11kRPN Kenyan farmers Regional 02-05-2015 Kandara, Murang'a
#12kRPN Kenyan farmers Regional 02-10-2015 Gatanga, Murang'a
#13kRPN Kenyan farmers Regional 02-10-2015 Gatanga, Murang'a
#14kLPN Kenyan farmers Local 02-12-2015 Gatanga, Murang'a
#15kLPN Kenyan farmers Local 14-02-2015 Kinangop, Nyandarua
#16kGPN Kenyan farmers Global 14-02-2015 Kinangop, Nyandarua
#17kLPN Kenyan farmers Local 17-02-2015 Kinangop, Nyandarua
#18kGPN Kenyan farmers Global 17-02-2015 Kinangop, Nyandarua
#19kLPN Kenyan farmers Local 19-02-2015 Kipipiri, Nyandarua
#20kLPN Kenyan farmers Local 20-02-2015 Kipipiri, Nyandarua
#21kRPN Kenyan farmers Regional 20-02-2015 Kipipiri, Nyandarua
#22kGPN Kenyan farmers Global 20-02-2015 Kipipiri, Nyandarua
#23kGPN Kenyan farmers Global 23-02-2015 Buuri, Meru
#24kGPN Kenyan farmers Global 24-02-2015 Buuri, Meru
#25kLPN Kenyan farmers Local 24-02-2015 Buuri, Meru
#26kLPN Kenyan farmers Local 25-02-2015 Central Imenti, Meru
#27kLPN Kenyan farmers Local 25-02-2015 Central Imenti, Meru

385
#28kGPN Kenyan farmers Global 26-02-2015 Central Imenti, Meru
#29kRPN Kenyan farmers Regional 26-02-2015 Central Imenti, Meru
#30kLPN Kenyan farmers Local 27-02-2015 South Imenti, Meru
#31kLPN Kenyan farmers Local 28-02-2015 South Imenti, Meru
#32kGPN Kenyan farmers Global 03-02-2015 Mwala, Machakos
#33kRPN Kenyan farmers Regional 03-03-2015 Mwala, Machakos
#34kLPN Kenyan farmers Local 03-04-2015 Yatta, Machakos
#35kGPN Kenyan farmers Global 03-04-2015 Yatta, Machakos
#36kRPN Kenyan farmers Regional 03-06-2015 Yatta, Machakos
#37kGPN Kenyan farmers Global 03-05-2015 Kagundo, Machakos
#38kRPN Kenyan farmers Regional 03-06-2015 Kagundo, Machakos
Average length of interviews: 8 minutes Time Range of interviews: 5-12
minutes
In depth interviews with horizontal stakeholders
Number Interlocutor’s affiliation Date of
interview
Place of interview
#1kgov National government: HCD 11-11-2014 Nairobi
17-05-2016 Nairobi
#2kgov National government: HCD 15-01-2015 Nairobi
17-05-2016 Nairobi
#4kgov National government: HCD 21-03-2015 Nairobi
#5kgov National government: HCD 21-03-2015 Nairobi
#1kcgov County Government 02-05-2015 Gatanga, Murang’a
#2kcgov County Government 02-09-2015 Kandara, Murang’a
#3kcgov County Government 13-02-2015 Kinangop,
Nyandarua
#4kcgov County Government 18-02-2015 Kipipiri, Nyandarua
#5kcgov County Government 25-02-2015 Central Imenti,
Meru
#6kcgov County Government 26-02-2015 South Imenti, Meru
#7kcgov County Government 03-02-2015 Mwala, Machakos
#8kcgov County Government 03-04-2015 Yatta, Machakos
#1kao Area officer 02-05-2015 Gatanga, Murang’a
#2kao Area officer 13-02-2015 Kinangop,
Nyandarua
#3kao Area officer 21-02-2015 Buuri, Meru
#4kao Area officer 03-04-2015 Yatta, Machakos
#1kba 31-10-2014 Murang’a
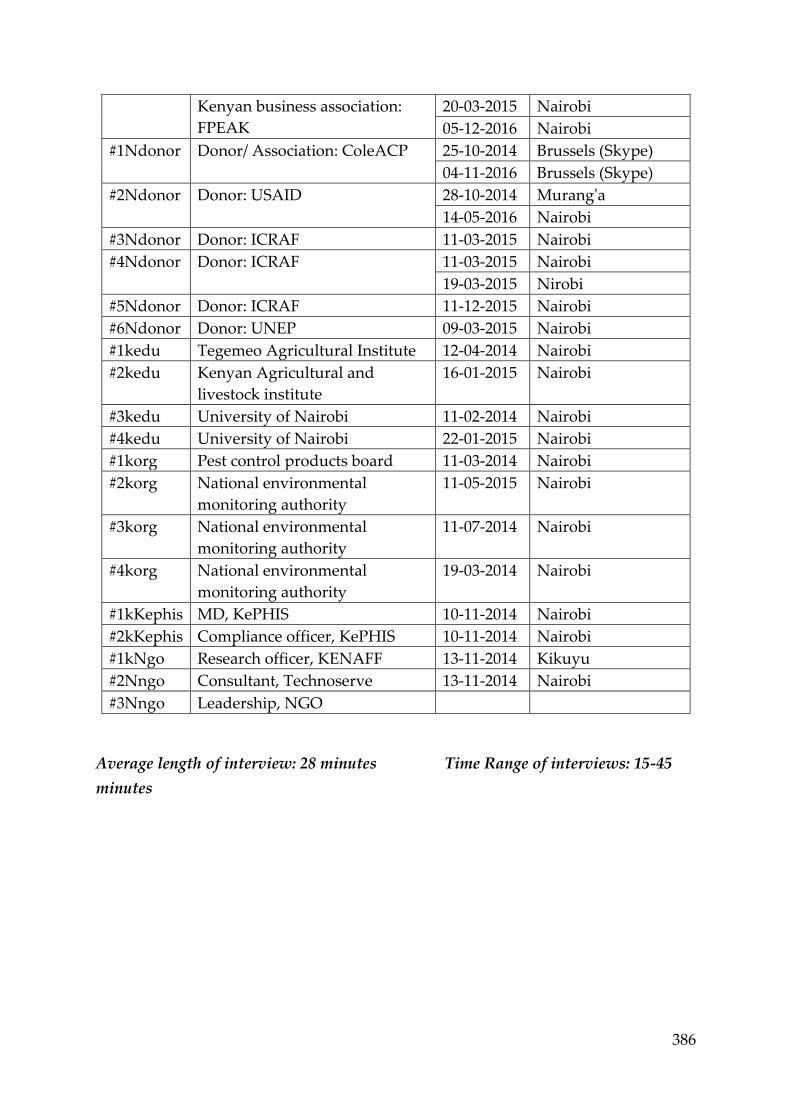
386
Kenyan business association:
FPEAK
20-03-2015 Nairobi
05-12-2016 Nairobi
#1Ndonor Donor/ Association: ColeACP 25-10-2014 Brussels (Skype)
04-11-2016 Brussels (Skype)
#2Ndonor Donor: USAID 28-10-2014 Murang'a
14-05-2016 Nairobi
#3Ndonor Donor: ICRAF 11-03-2015 Nairobi
#4Ndonor Donor: ICRAF 11-03-2015 Nairobi
19-03-2015 Nirobi
#5Ndonor Donor: ICRAF 11-12-2015 Nairobi
#6Ndonor Donor: UNEP 09-03-2015 Nairobi
#1kedu Tegemeo Agricultural Institute 12-04-2014 Nairobi
#2kedu Kenyan Agricultural and
livestock institute
16-01-2015 Nairobi
#3kedu University of Nairobi 11-02-2014 Nairobi
#4kedu University of Nairobi 22-01-2015 Nairobi
#1korg Pest control products board 11-03-2014 Nairobi
#2korg National environmental
monitoring authority
11-05-2015 Nairobi
#3korg National environmental
monitoring authority
11-07-2014 Nairobi
#4korg National environmental
monitoring authority
19-03-2014 Nairobi
#1kKephis MD, KePHIS 10-11-2014 Nairobi
#2kKephis Compliance officer, KePHIS 10-11-2014 Nairobi
#1kNgo Research officer, KENAFF 13-11-2014 Kikuyu
#2Nngo Consultant, Technoserve 13-11-2014 Nairobi
#3Nngo Leadership, NGO
Average length of interview: 28 minutes Time Range of interviews: 15-45
minutes

387
In depth interviews with Vertical Stakeholders
Number Interlocutor’s affiliation Date of
interview
Place of interview
#1kagrovet Agro-vets/ Dealers* 14-02-2015 Kinangop, Nyandarua
#2kagrovet Agro-vets/ Dealers* 24-02-2015 Buuri, Meru
#3kagrovet Agro-vets/ Dealers* 03-05-2015 Yatta, Machakos
#1kbroker Broker 02-12-2015 Kandara, Murang’a
#2kbroker Broker 12-03-2014 Nairobi
#3kbroker Broker 21-02-2015 Kinangop, Nyandarua
#1krs Regional supermarket 11-10-2014 Nairobi
12-05-2014 Nairobi
20-03-2015 Nairobi
05-03-2016 Nairobi
#2krs Regional supermarket 17-11-2014 Nairobi
#3krs Regional supermarket 22-11-2014 Nairobi
#4krs Regional supermarket 29-11-2014 Nairobi
#5krs Regional supermarket 30-11-2014 Nairobi
#6krs Regional supermarket 05-10-2016 Nairobi
#1kef Kenyan export firm 23-02-2015 Thika, Murang'a
#2kef Kenyan export firm 23-02-2015 Thika, Murang'a
#3kef Kenyan export firm 17-03-2015 Embakassi, Nairobi
#1kaudit Kenyan third party audit
firm
10-03-2016 Telephonic
#1Ngs Northern retailer, CSR
manager
12-10-2014 London
#2Ngs Northern retailer, CSR
manager
12-10-2014 London
*Dealers- Monsanto, Syngenta, Amiran
Average length of interviews: 30 minutes Time Range of interviews: 22-45
minutes
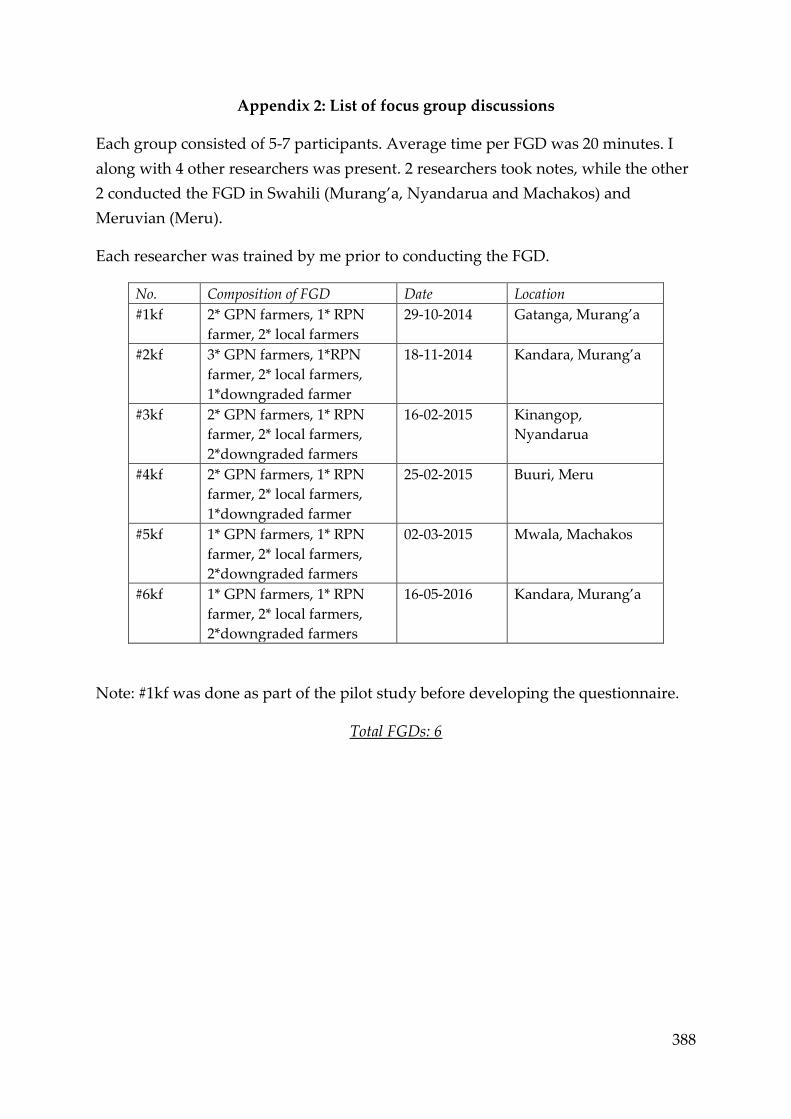
388
Appendix 2: List of focus group discussions
Each group consisted of 5-7 participants. Average time per FGD was 20 minutes. I
along with 4 other researchers was present. 2 researchers took notes, while the other
2 conducted the FGD in Swahili (Murang’a, Nyandarua and Machakos) and
Meruvian (Meru).
Each researcher was trained by me prior to conducting the FGD.
No. Composition of FGD Date Location
#1kf 2* GPN farmers, 1* RPN
farmer, 2* local farmers
29-10-2014 Gatanga, Murang’a
#2kf 3* GPN farmers, 1*RPN
farmer, 2* local farmers,
1*downgraded farmer
18-11-2014 Kandara, Murang’a
#3kf 2* GPN farmers, 1* RPN
farmer, 2* local farmers,
2*downgraded farmers
16-02-2015 Kinangop,
Nyandarua
#4kf 2* GPN farmers, 1* RPN
farmer, 2* local farmers,
1*downgraded farmer
25-02-2015 Buuri, Meru
#5kf 1* GPN farmers, 1* RPN
farmer, 2* local farmers,
2*downgraded farmers
02-03-2015 Mwala, Machakos
#6kf 1* GPN farmers, 1* RPN
farmer, 2* local farmers,
2*downgraded farmers
16-05-2016 Kandara, Murang’a
Note: #1kf was done as part of the pilot study before developing the questionnaire.
Total FGDs: 6
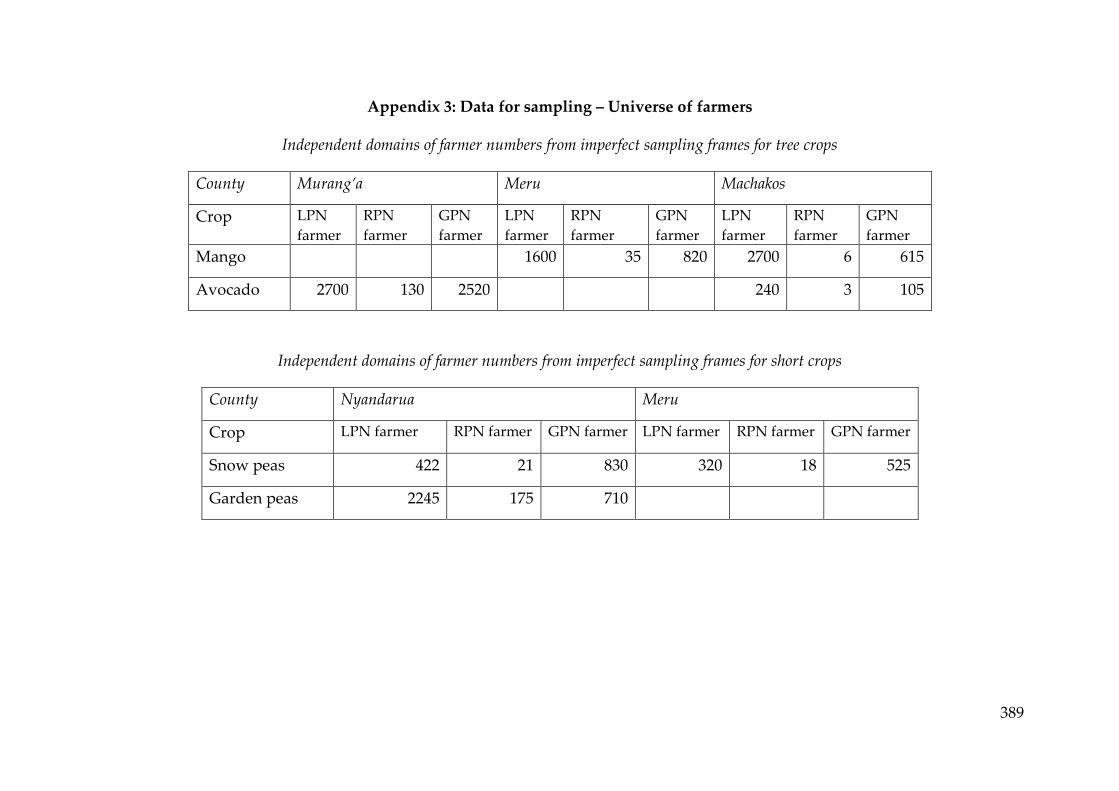
389
Appendix 3: Data for sampling – Universe of farmers
Independent domains of farmer numbers from imperfect sampling frames for tree crops
County Murang’a Meru Machakos
Crop LPN
farmer
RPN
farmer
GPN
farmer
LPN
farmer
RPN
farmer
GPN
farmer
LPN
farmer
RPN
farmer
GPN
farmer
Mango 1600 35 820 2700 6 615
Avocado 2700 130 2520 240 3 105
Independent domains of farmer numbers from imperfect sampling frames for short crops
County Nyandarua Meru
Crop LPN farmer RPN farmer GPN farmer LPN farmer RPN farmer GPN farmer
Snow peas 422 21 830 320 18 525
Garden peas 2245 175 710

390
Appendix 4: Multiple frames sampling methodology
I. Assigning inverse probability weights: selection probability
The process of computing a base weight (selection probability) depends on post
stratification method, the figure below explains that sampling first takes place
based on production figures at county level (c=4), which is stratified to sub-
county levels (n=8) and finally a conditional probability is assigned if the
farmer is an GPN, regional or local farmer from the specific sub-county.
Figure 1: Stratification strategy
Weight 1 (1
Np )= proportion of normalized country level production across selected
crops
1 NN
N
N
Hp
H
.............................................................................................................................(1)
Where, NH = production proportion in Nth county, and th sub-county
Weight 2 (2
N jp )= Conditional probability ( given sub-county selected) of a farmer to
be on the “GPN”, “regional” or “local” list
2 N j
N j
N j
Ep
M
.......................................................................................................................(2)
Farmer category
E/R/L=75
Sub-county
N=8
County
C=4
C
N
GPN
RPNl
LPN
N
GPN
RPN
LPN

391
Where, the jth participant can be an GPN, regional or local farmer, such that
N j N j N j N jM E R L
Here, N jM = frame population of j-th farmer in N-th sub-county, th sub-county ,
N jE / N jR / N jL = number of selected farmers who are exporter, regional and local
farmers from the list respectively
Base weight, i.e. the unconditional probability of selecting a GPN, regional or local
farmer (the N j th farmer) is 1 2.N j N N jp p
And the inverse probability is, 1
1 2
1
.N j
N N jp p
...................................................(3)
II. Non-response bias
[11]( )
[11] [12] [14] [15] [16] [17]jnon response A
..................................(4)
Which basically states that there is a need to estimate individual level propensities a
single weighting approach is used (Similar to GATS) for the jth person. here,
11=completed individual questionnaire, 12=incomplete interview, 14=selected
respondent not home, 15= selected respondent refusal, 16= selected respondent did
misinterpreted/ did not understand or deliberately misinterpreted, 17=other
individual non-response
This weight was then multiplied by the base weight to get a new non-response
adjusted weight ( jW ).
*j N j jW A ...............................................................................................(5)
III. 3 frame sampling and multiplicity adjusted estimator for overall de-
duplication
Let 1... ...q QU U U denote a collection of frames, where Q>=2 frames available (they vary
depending table 4.3 in Chapter 4).
Since frame membership is corrected collected data from each frame QU is classified
into different disjoint domains qD such that 1( ) ( )... ...qq d q DU U U

392
At this stage, this thesis de-duplicates the domains, to create dis-joint domains
through matching the lists, however, when such matching is not possible due to non-
comparable data in the lists it impossible to ascribe a multiplicity adjusted estimator
to prevent overestimating and double counting of farmers.
Once the independent domains are found, the second issue arises is for further
multiplicity as farmers sell into multiple value chains simultaneously or perhaps
other farmer household members can be listed to sell into other chains, this thesis
followed Bankier (1986) and screened out farmers who were double counted at the
point of interview. However, this may not be possible with large datasets and we
would also loose data points (Meccati and Singh 2011).
Suppose, we were to not de-duplicate at point of interview through screening. Then
the following robust unbiased multiplicity estimator can be calculated using Mecatti
and Sigh (2014) and Kalton and Anderson 1986):
A linkage rule needs to be assigned, for instance from the selected households all
occupants may be interviewed and asked to report other individuals related to the,
under a linkage rule, which for instance could be SP/GP/ Mango or Avocados sold
into other markets. In this way linkage patterns may emerge, of one to one or one-to-
many. Thus, each selected unit is linked to a target unit, that are eligible for data
collection and included in final sample.
Multiplicity is defined for every target unit the number of selection units to which it
is linked, which can be used to define the multiplicity adjusted indicator. To begin
with, they define a linkage matrix of NxM, where N= target population U of size N
and M = selection population from list of size M. The entries of the matrix are non-
random indicators 1k j
Where (1.... )k N and (1... )j M .
It takes the value 1 is population unit k is linked to selection unit j and 0 otherwise.
Thus, multiplicity can be defined as the sum over the rows of the linkage matrix, so
1
1M
k k j
j
m
.
In a network sampling frame: 1km for atleast one unit in k U and 1k j ( this is the
multiplicity counting rule)

393
The frame specific linkage rule, in MF survey is the frame membership indicator,
,1 1...qk U q Q
, it takes values 1 if population unit k is included in frame QU and 0 otherwise.
Thus the general formula for sum over each row is the number of frames in which every unit
belongs to: (if there are 3 frames)
,
3
1
1k Uq
Q
k
q
m
And the sum of the columns gives the frame size:1
1N
q k j
k
N
.
From this disjoint domain are formed by counting only once all identical rows (those who
share same array from frame membership). All units in same domain share the same
multiplicity.
Mecatti and Singh (2009, 2011, 2014) then proceed to explain a generalized
multiplicity adjusted Horvitz-Thompson (HT) estimator. While this thesis will not
dwell on the specifics of generalization of the estimator, it will briefly explain the
intuition behind how the multiplicity adjustment is used.
In a conventional survey, estimating the population total kk UY y
, the HT
estimator using a single sample s is :
^1
HT k k
k s
Y y
.....................................................................................................(6)
where1
k
is the inverse of inclusion probability
However, when multiple frames are involved, the unbiased inverse multiplicity adjustment
can be used to adjust the base weight to avoid bias due to the inclusion from more than one
frame and possible duplication.
Thus, the simple altered HT estimator is building on equation 6 is:
^
1 1
1q
Q
SM k k kq k s
Y y m
...........................................................................................(7)
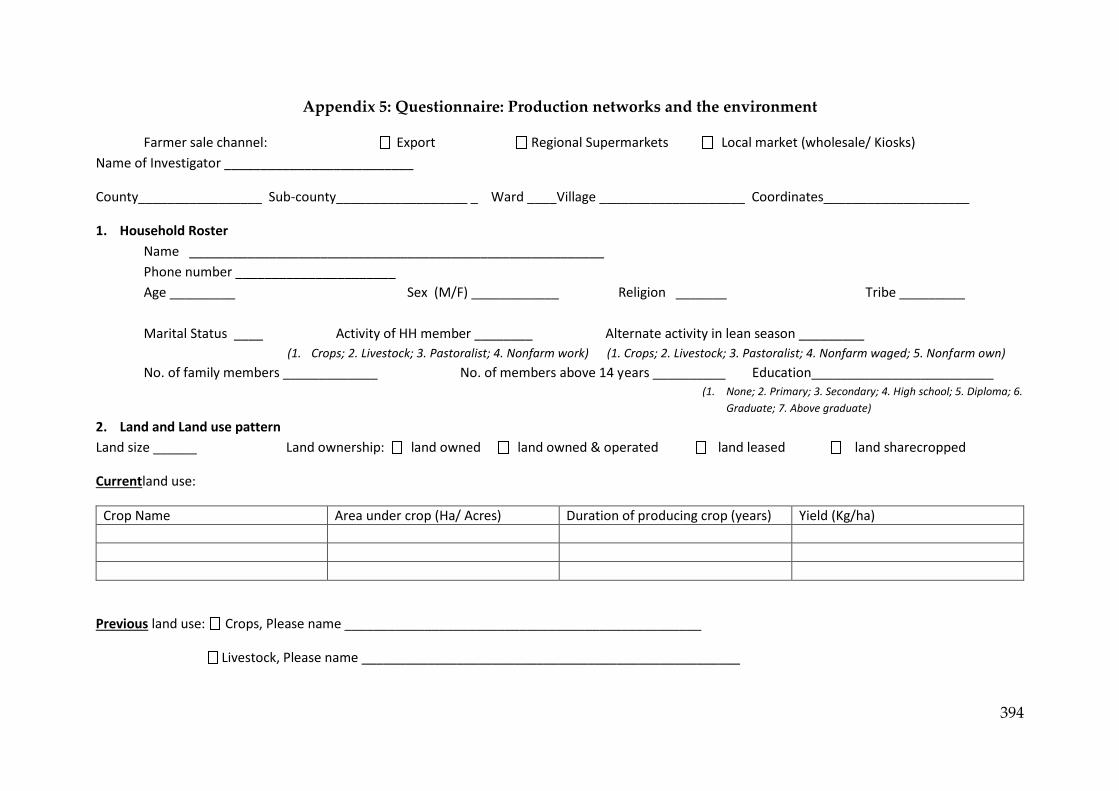
394
Appendix 5: Questionnaire: Production networks and the environment
Farmer sale channel: Export Regional Supermarkets Local market (wholesale/ Kiosks)
Name of Investigator __________________________
County_________________ Sub-county__________________ _ Ward ____Village ____________________ Coordinates____________________
1. Household Roster
Name _________________________________________________________
Phone number ______________________
Age _________ Sex (M/F) ____________ Religion _______ Tribe _________
Marital Status ____ Activity of HH member ________ Alternate activity in lean season _________
(1. Crops; 2. Livestock; 3. Pastoralist; 4. Nonfarm work) (1. Crops; 2. Livestock; 3. Pastoralist; 4. Nonfarm waged; 5. Nonfarm own)
No. of family members _____________ No. of members above 14 years __________ Education_________________________ (1. None; 2. Primary; 3. Secondary; 4. High school; 5. Diploma; 6.
Graduate; 7. Above graduate)
2. Land and Land use pattern
Land size ______ Land ownership: land owned land owned & operated land leased land sharecropped
Currentland use:
Crop Name Area under crop (Ha/ Acres) Duration of producing crop (years) Yield (Kg/ha)
Previous land use: Crops, Please name _________________________________________________
Livestock, Please name ____________________________________________________

395
Other uses, please specify _________________________________________________________________
3. Sale, certification and value addition
3.1. Who are your buyers?
What proportion of the produce ( %) Duration of sale to main buyer? Years ( only enter details for main buyer)
Exporter
Brokers from Nairobi
Local brokers
Supermarket
Local market
Subsistence (own consumption)
3.2 How frequently do you change your main buyer? Never every 5 years or more every 2-3 years every year other _______
3.3. Are you given a contract for your produce? Y/N _____
3.4 What is the contract type? Written (>= 1 year) Oral (>= 1 year) Oral ( < 1 year) none other______________________
3.5 Have you defaulted on your contractual obligations? (Y/N)___ , How? Selling to another buyer less produce other________________
3.6 Who were your buyers before you started selling to your current buyers? Different exporter different broker local market subsistence
other_
3.7 Are you doing any value addition on your fresh crops?(Y/N)___, if yes, what? Cleaning sorting grading cutting packing processing
other___
3.8 Have you got any certification? (Y/N)___, If yes which? GlobalGAP Tesco/M&S Local supermarket HCD KEBS other____
3.9 Do you mark your products before sale? (Y/N) ____

396
3.10 How much of your produce is rejected? 0
0-5% 5-10% 10-20% >20%
4.Geology and Topography
4.1 Is your land flat or sloping? __________ Altitude range _____m
4.2 Drainage Ditches/ trenches pipe drains tile drains wells Terraces Other ___________________________
4.3 Do you have a drainage system on land? (Y/N) ___ Do you have a drainage system on below ground? (Y/N) ____
4.4 Do you get frequent heavy winds? (Y/N) ________
5.Soil
5.1 Soil structure: sandy loamy clay silty peaty saline other _____________
5.2 Is your soil prone to erosion? (Y/N) ________
5.3 Soil texture: Does your soil have sufficient organic matter?( Y/N) ________ Main types : biomass decomposed residues
Humus(compost)
5.4 Reasons for soil damage: wind erosion water logging increased tillage soil compaction organic matter decline salinization
Fertilizer overuse land slides erosion due to droughts erosion die to flooding other____________
Interaction ( Y/N) ( Ask this Column 1 question on interaction first,
• if the farmer answers YES move to Column 2- observable outcome; then move to column 3- what support do you get and finally column 4- who supports you)
• if the farmer answers NO- go to column 5- why do you not do this. )
If Yes, What kind of support do you get? 1. None 2. Specialized trainings 3. Demonstrations 4. Extension services 5. Subsidies 6. Infrastructure 7. Other
Who provides you with the support? 1. No one(yourself) 2. Agricultural officer 3. exporter provide 4. Agrovets/ seed 5. extension officer 6. others
If no, Why not? 1. Not required 2. Too costly 3. Not interested 4. Don’t know what/ how to
do? 5. other

397
Do you compost organic waste and use on your soil? ______
Have you been shown how to do this?
Who shows/ helps you how to do this
Why don’t you do this?
Do you perform mulching/ manuring?__ How have you been shown how best to do these activities?
Who shows/ helps you how to do this
Why don’t you do this?
How frequently do you till your land?
0-2 per year/ season
3-5 per year/ season
>6 per year/ season
How have you been shown how best to till you land?
Who shows/ helps you how to do this
Why don’t you do this?
Are you growing indigenous tree planting for windbreaks and enhancing soil fertility? _____ What type of trees? Please name: __________________________________
----
Who told you which type of tress to grow?
----
Do you perform the following:
Strip cropping
Contour cropping
Terracing
Bunding
Crop covers
Other___________________
How have you been shown how best to do these activities?
Who shows/ helps you how to do this
Why don’t you do this?
Do you suffer from soil compaction?___
Digging soil manually to remove top layer
Double digging manually
Double digging mechanically
Other____________
Are you explained how to manage soil compaction?
Who shows/ helps you how to do this
Why don’t you do this?
Do you get your soil tested? (Y/N) ____
Who does this for you? Cost? Why don’t you do this activity?
Do you check soil moisture? ____
hand feel- moist circles
gauge and meters
How have you been shown how to do this?
Who shows/ helps you how to do this
Why don’t you do this activity?

398
other ______________
What type of fertilizers do you use?
Dry
Liquid
Organic
None
Other ________________
How do you select fertilizers?
Traditionally used
Calculate nutrient deficiency(sensors, meters)
Tissue analysis
Told by others
----
Who shows/ helps you how to do this
----
Methods of application
• Dry:
Bear hands – basal application
Hands with gloves
Spreaders
Other _______ Liquid:
Sprayers (knapsack)
Fertigation systems
Foliar sprays
Other ______________________________
Are you shown how best to apply fertilizers?
Who shows/ helps you how to do this
Why don’t you do this activity?
6. Water
6.1 What are your main water sources? (Please rank 1 most common and 6 least common choice )
River ___ Lakes/streams ___ Rainfall____ groundwater ____ Government/county supply ______ other____________
6.2 What are the main methods you get your water? (Please rank 1 most common and 7 least common choice)
Dams_____ Pipes _____ Borehole_____ Furrow______ Well_______ Tap________ other_________________

399
6.3 What are your water quantity challenges? (Please rank 1 most common and 7 least common choice)
Erratic rainfall_____ decrease in rainfall_______ Reduction in water table______ difficult to abstract water from river/lakes ______
Poor government water supply scheme_______ poor infrastructure (dams, wells) _____ other_______________________
Interaction ( Y/N)
If Yes, What kind of support do you get?
Who provides you with the support?
If no, Why not?
What water conservation methods used?
Water pits/ pads/ holes (small)
Water pads ( large)
Ditches/ trenches
Water tanks
Roof top catchments
Other _______________
How are you helped or explained about water conservation?
Who shows/ helps you how to do this
Why don’t you do this activity?
Water use: Do you have an irrigation schedule?___
-----
Who explained Need of schedule and who makes schedule?
-----
What do you use to irrigate crops?
Bucket
Furrow
Borehole
Drip /Sprinkler
Rainfall
Other ________________
How have you been shown the the best way to irrigate crops?
Who shows/ helps you how to do this
Why don’t you do this activity?
Do you get water tested? ____ if Yes, What are your water quality challenges?
Bacteria
Heavy metals
Siltation
Other
--- Who does this for you? ---

400
Do you recycle waste water? ____ ; How?
Treatment plant
Alternate uses for waste water from other operations_
Other _____________
How have you been shown to recycle water?
Who shows/ helps you how to do this
Why don’t you do this activity?
What measures do you do during floods/unseasonal rain?
Dig larger makeshift pads
Bigger terraces
Dams
Can’t do anything
Other___________________
How have you been trained in emergency flood procedures? Does the govt help? ( warnings, Subsidy)
Who shows/ helps you how to do this
Why don’t you do this activity?
What measures do you do during drought?
grow drought resistant crops
diversify to other livelihoods
increase water recycling
Can’t do anything
How have you been trained in emergency drought procedures? Does govt help?
Who shows/ helps you how to do this
Why don’t you do this activity?
Measures you take during delayed rains?
Delay planting time
Change crop variety
Can’t do anything
How have you been shown what to do?
Who shows/ helps you how to do this
Why don’t you do this activity?
7.Pests and Diseases
7.1 Has the frequency of attacks by pests increased in recent years? ( Y/N) ___ 7.2 Main Pests, please name______________
7.3 Has the frequency of infection by diseases increased in recent years ? (Y/N)______ 7.4 Main diseases, please name_____________
7.5 What are the main reasons for increase? Change in weather change in chemicals used change in farming practices other______

401
Interaction ( Y/N)
If Yes, What kind of support do you get?
Who provides you with the support?
If no, Why not?
How you reduce pest/disease attacks?
Trapping
Biological means
Yellow colour tapes
Chemical control
Other ___________
Have you been shown how to reduce pest attacks/ diseases?
Who shows/ helps you how to do this
Why don’t you do this activity?
Do you perform scouting? ___
Are you shown how to do this? Who shows/ helps you how to do this?
Why don’t you do this activity?
What pesticides do you use? Please name: 1. _____________________ 2. ____________________ 3. ___________________ 4. _____________________
----
Who selects pesticides for you?
------
Do you read the product labels? ____
Method of application of pesticides
Knapsack spraying- manual
Tractor boom spraying - mechanical
Foliar spray methods- mechanical
Other ___________
Are you told the best methods to use?
Who shows/ helps you how to do this
Why don’t you do this activity?
How do you decide spray programs?
Traditional/history
Labels
Exporter
Broker
Agri officer
Other
Are you explained about spray programs?
Who shows/ helps you how to do this
Why don’t you do this activity?

402
Are you aware of Maximum residue Limit (MRL)testing?_
Do you wear protective clothing while spraying and applications? ____
Clothes
Gloves
Shoes
Other ________________
Are you explained why to wear? Who shows/ helps you how to do this
Why don’t you do this activity?
Do you wash hand for activities? __
Before and after every activity
Only before or only after the activity___
Other ______________
Are you explained why this is important?
Who shows/ helps you how to do this
Why don’t you do this activity?
How do you store chemicals?
In dry store houses separate from house
In the homestead in a corner
In inert containers
Other _________________
Are you shown how to do this?
Who shows/ helps you how to do this
Why don’t you do this activity?
How do you store produce?
Don’t store- sell as soon as harvested
In charcoal coolers ( 1 day)
In the house/ outside
In cold stores
Others __________
Are you shown how to do this?
Who shows/ helps you how to do this
Why don’t you do this activity?
8. Climatic conditions
8.1. Have you experienced changes in the rainfall pattern? (Y/N) _________
8.2 If yes, what are the changes? Delays in rainfall, frequency in last 3 years____________ Unseasonal rainfall, frequency in last 3 years _________

403
8.3 Have you experienced a sudden increase in temperature during season? (Y/N) _____________ Frequency in 3 years_________
8.4 Have you experienced a sudden drop in temperature during season? (Y/N) _____________ Frequency in 3 years_________
8.5 Have you experienced drought in the last 3 years? (Y/N) _________ Frequency in 3 years_________ ( every year, twice a year, once in 2 years etc..)
8.6 Have you experienced flood in the last 3 years? (Y/N) _________ Frequency in 3 years_________
9. Networks and relationships
9.1 Who are your main networks and what type of relationship do you have with them? (Relationship: 1 – formal; 2. Informal/ friendly; 3. Poor; 4. other)
(Problems with them: 1. No t organized; 2. Cannot trust; 3. Provide no help; 4. Other)Please enter 1- 4 below
Actor Seed seller Agrovet Credit givers Extension officer Manager/ supervisor Exporter Broker
Relationship
Problems with them
9.2 Input procurement (enter 1-6 below)
Inputs Who do you buy from currently? 1. Company ( name) 2. Provided by exporter 3. Provided by agricultural officer 4. Village leaders 5. Society’s/ groups 6. Others
Who did you purchase from before you started selling to your current buyers?
1. Company ; 2. Provided by exporter 3. Provided by agricultural officer 4. Village leaders 5. Society/ groups 6. Others
Are your items certified ( Y/N)?
Seeds
Saplings
Pesticides
Fertilizers
9.3 Do you trust your buyer to give you the best price? (Y/N) ________

404
9.5 Do you think you can alter terms of your contract through negotiations with buyer? (Y/N) _______
9.6 Are your exporters/ managers and brokers “telling you what farming practices to use”? (Y/N) ____
9.7 Do your buyers tell you ‘which crop’ to grow? ( Y/N) _____
9.8 if YES to 4.7, then do your buyers buy other products from you besides the ones they have told you to grow? ( Y/N) ______
9.10 if YES to 4.7, Would you have preferred to grow other crops on your land?( Y/N) _____
9.11 Do your buyers specify the volume (quantity) of production per season? ( Y/N) ___
9.12 Do you think since you have been selling to your current buyer your: ( please tick)
• NO Difference
• Water usage Increase Decrease
• Ground water level increase Decrease
• Soil erosion increase Decrease
• Cost of inputs increase Decrease
• Do you use better equipment since you started selling to your current buyer? (Y/N) __________
ONLY LOCAL FARMERS
9.13 If you are not exporting produce, then do you want to export? (Y/N) ____
9.13.1 If YES, main reasons? Longer contracts better quality of produce better extension services better yield increase income other
_________
9.13.2 if NO, main reasons? Flexible commodities less costs increased income better yield better quality other __________________
9.14 Are you part of a farmer farmer group Co-operative None other________________________________
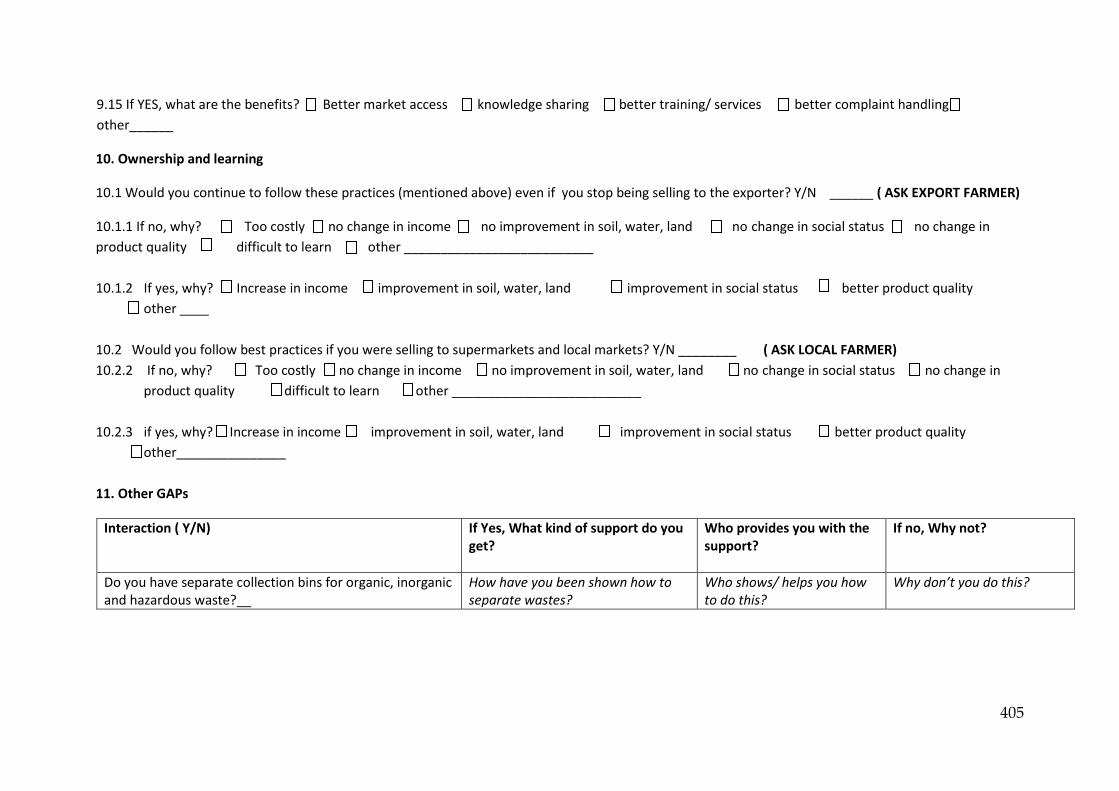
405
9.15 If YES, what are the benefits? Better market access knowledge sharing better training/ services better complaint handling
other______
10. Ownership and learning
10.1 Would you continue to follow these practices (mentioned above) even if you stop being selling to the exporter? Y/N ______ ( ASK EXPORT FARMER)
10.1.1 If no, why? Too costly no change in income no improvement in soil, water, land no change in social status no change in
product quality difficult to learn other __________________________
10.1.2 If yes, why? Increase in income improvement in soil, water, land improvement in social status better product quality
other ____
10.2 Would you follow best practices if you were selling to supermarkets and local markets? Y/N ________ ( ASK LOCAL FARMER)
10.2.2 If no, why? Too costly no change in income no improvement in soil, water, land no change in social status no change in
product quality difficult to learn other __________________________
10.2.3 if yes, why? Increase in income improvement in soil, water, land improvement in social status better product quality
other_______________
11. Other GAPs
Interaction ( Y/N)
If Yes, What kind of support do you get?
Who provides you with the support?
If no, Why not?
Do you have separate collection bins for organic, inorganic and hazardous waste?__
How have you been shown how to separate wastes?
Who shows/ helps you how to do this?
Why don’t you do this?

406
Do you have separate drainage for sewage wastes, chemical residues? ___. If yes:
Pits Away from crops
Treatment plant
Separate pipes
Septic tanks
Other __________________
Have you been shown how to do this?
Who shows/ helps you how to do this
Why don’t you do this?
RENEWABLE: Do you have the following on your farm?
Bio gas plant ( Small) ____
Anything Solar _____ , If yes, name items__________________________
Other renewable_________________
• Do you have a high level of mechanization on your farm? ___
• Please name machines used, __________________ _______________________________________
• Do you get your machines checked regularly? ___
Who helps you check them? Why don’t you do this activity?
Do you maintain a post harvest interval?___
0-5 hours
6 hours – 1 day
>1 day
----
Who tells you to do this? -----
Do you have emergency procedures in place for spills? __
Sawdust
Dry soil
Sand
Natural bacteria
Other
How are you shown what to do in an emergency?
Who shows/ helps you how to do this
Why don’t you do this activity?

407
12. Assets and income
Do you own the following ( please tick what they own) Have you procured it in the last 3 years ( Y/N)
Have you procured it in the last 1 year ( Y/N)
House ( Brick) House( non brick)
Television
Radio
Computer
Mobile
Internet
Newspaper
Toilet pit shared private
Water private source water from government
Electricity
Car Motorbike three wheeler Bicycle other

408
Appendix 6: Research assistant contract and confidentiality agreement
Contract and Terms of Reference for Short Term Assignment
Project Title: Environmental upgrading in Global production networks: The case of
small-scale horticultural farmers in Kenya
Name:
Job Title: Researcher on project
Contact email:
Contract period: 12th October – 24th October (tentative)
Contract Duration: 12 days
All the roles identified in this contract are for the researcher ( ___) alone and no one
else.
Role and responsibilities:
1. Focus group discussions
1.1. The researcher will help facilitate and take notes in the focus group
discussions in the county.
1.2. The researcher will complete questionnaires from farmer respondents.
1.3. The number of questionnaires per day will be determined by the principal
investigator along with the other researchers.
1.4. The questionnaires will be completed sincerely with only information that is
given by the farmer respondents.
1.5. All co-ordinates and phone number of respondents will be written down so
that cross checking is possible at any later date.
1.6. Payment mode
1.6.1. The research will be paid a total of Ksh 17400 for the completion of the
project.
1.6.2. The researcher will be paid Ksh 5000 in advance and the remaining on
completion of the project.
1.6.3. All payments will be given in Cash
2. Miscellaneous costs
2.1. The researchers stay will be paid for separately, with a maximum amount of
Ksh 700 per day.

409
2.2. The fuel costs of the car will be borne by the principal investigator.
3. Main requirements of researcher prior to research
3.1. Sign contract of confidentiality of researcher
3.2. Clearly understand the roles and responsibilities required of him
3.3. Clearly understand the main objectives of the principal investigators project
3.4. Stay in continuous contact with the principal investigator during fieldwork.
Please see next page for consent signatures
I agree to the contract and terms of reference for short term assignment
______________ _________________
Researcher Signature Researcher Print Name
______________ ________________________
Witness Signature Witness print name
______________ ____________________________
Principal investigator signature Principal investigator print name

410
Confidentiality agreement for research assistants
Confidentiality Agreement for survey
Aarti Krishnan, PhD Development Policy & Management, Student ID 7729526,
School of Education, Environment and Development, Institute for Development
Policy and Management
I have read and retained the Project Overview concerning the research Rethinking the
environmental dimensions of upgrading and embeddedness in production networks: The case
of Kenyan horticulture farmers being conducted by Aarti Krishnan.
In my role as research assistant for the researcher, I understand the nature of the
study and requirements for confidentiality. I have had all of my questions
concerning the nature of the study and my role as research assistant answered to my
satisfaction.
A. Maintaining Confidentiality
I agree not to reveal in any way to any person other than the researcher any
data gathered for the study by means of my services as research assistant.
B. Acknowledgement of My Services as Research Assistant
I understand that the researcher will acknowledge the use of my services in any
reporting on the research. I have indicated below whether I wish that
acknowledgement to be anonymous or whether it may recognize me by name.
07.02.2015

411
___ I do not wish my name to be associated with the acknowledgement of the use
of an research assistant in data gathering for the research.
OR
___ I agree that the researcher may associate my name with the
acknowledgement of the use of a research assistant in data gathering for the
research.
C. Identification and Signature Indicating Agreement
Name: _______________________________________________
Email: ______________________________________________
Telephone: ___________________________________________
Mailing Address: _____________________________________________________
Signature: __________________________________________________________
Date: _____________________________________
Should you require further information please feel free to contact me Aarti Krishnan
at [email protected] or Project Mobile. For questions, concerns or
complaints about the research ethics of this study, contact the Head of the Research
Office, Christie Building, University of Manchester, Oxford Road, Manchester, M13
9PL, United Kingdom.

412
Appendix 7: Invitation letter
The School of Environment, Education and Development
The University of Manchester
DATE
Dear Sir or Madam,
This letter is an invitation to participate in a research study ‘Rethinking the
environmental dimensions of embeddedness and upgrading in production
networks: the case of Kenyan horticulture farmers’. The aim of this study is to
identify various environmental challenges faced by farmers that come from
following private standards. Further, the study also attempts to understand the
implications of environmental stresses that are caused by climate extremes and
climate variability on the same set of small-scale farmers. The research will explore
how farmers cope with different environmental challenges. You will be expected to
participate in either an interview/ focus group or survey that will focus on the
above-mentioned issues. More information can be found in the attached Participant
Information Form.
This research will be used to in my PhD and in academic publications. Any
information you provide will be kept confidential and publications based on the
findings will not include your name.
If you are interested in participating, you can contact Aarti Krishnan, the principal
researcher, at: Project MobileNumber or [email protected]
Thank you for taking the time to read this invitation. If I have not heard from you in
a week, I will make a follow up contact. I would be very grateful for your
participation
Faithfully,
Aarti Krishnan
PhD Researcher
Global Development Institue
School of Environment, Education and Development, University of Manchester
For all participants

413
Appendix 8: Consent form interviews, focus groups and surveys
Consent Form for interviews and focus groups
CONSENT FORM
Please
Initial
Box
1. I confirm that I have read the attached information sheet on the above project and have had the opportunity to consider the information and ask questions and had these answered satisfactorily.
2. I understand that my participation in the study is voluntary and that I am free to withdraw between 3 days-1 week from the date of interview/focus group meeting, without giving a reason
3. I agree to be interviewed/ be part of a focus group in the study
4. I agree to be audio recorded and my recording transcribed
5. I agree that my identity will be kept confidential and safeguards put in place to maintain confidentiality. I agree to the use of anonymous data
6. I agree to being contacted again by the principal researcher in the future to be asked follow-up questions.
I agree to take part in the above project
____________________________ __________________ _______________________
Name of participant Date Signature
______________________________ __________________ _______________________
Name of person taking consent Date Signature

414
Consent form Surveys
CONSENT FORM
Please
Initial
Box
1. I confirm that I have read the attached information sheet on the above project and have had the opportunity to consider the information and ask questions and had these answered satisfactorily.
2. I understand that my participation in the study is voluntary and that I am free to withdraw at any time during the survey.
3. I agree to answer questions in the survey as honestly as possible and understand that I do not need to answer all questions
4. I agree that my identity will be kept confidential and safeguards put in place to maintain confidentiality. I agree to the use of anonymous data
5. I agree to being contacted again by the principal researcher in the future to be asked follow-up questions.
I agree to take part in the above project
_______________________________ __________________ _______________________
Name of participant Date Signature
______________________________ __________________ _______________________
Name of person taking consent Date Signature
415
Appendix 9: Farmer appreciation certificate
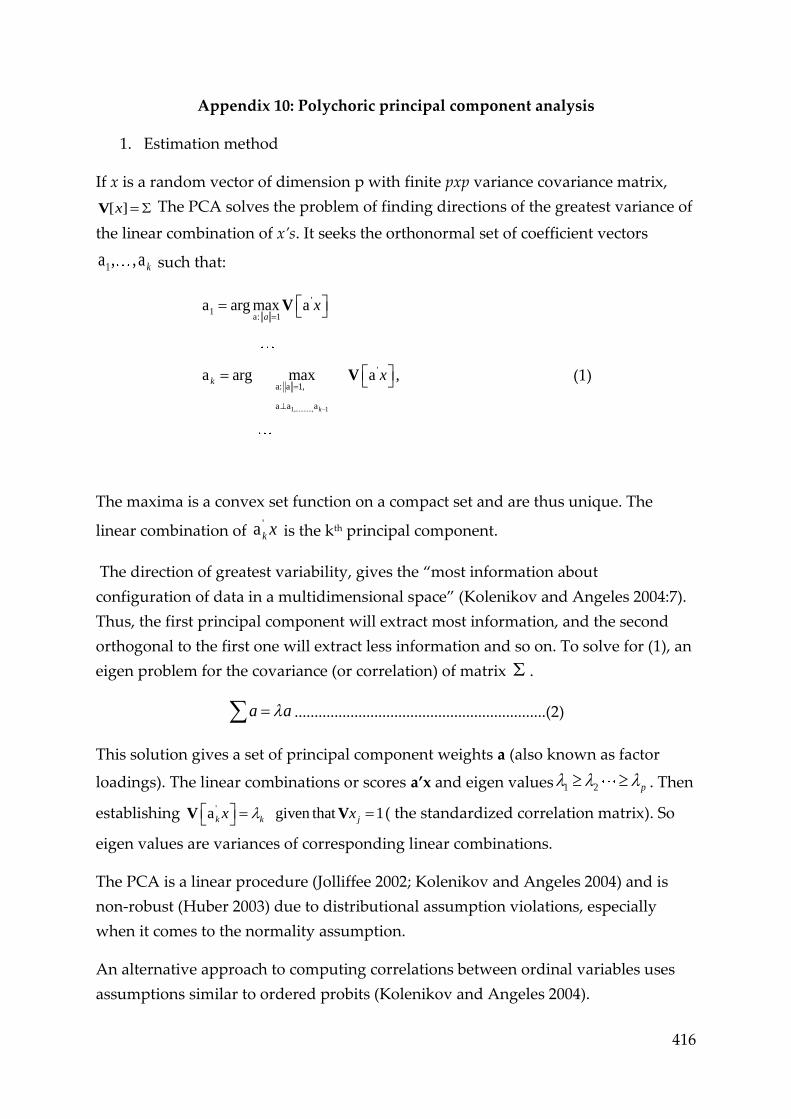
416
Appendix 10: Polychoric principal component analysis
1. Estimation method
If x is a random vector of dimension p with finite pxp variance covariance matrix,
[ ]x V The PCA solves the problem of finding directions of the greatest variance of
the linear combination of x’s. It seeks the orthonormal set of coefficient vectors
1a , ,a k such that:
1,.........., 1
'
1a: 1
'
a: a 1,
a a a
a arg max a
a arg max a ,
k
a
k
x
x
V
V (1)
The maxima is a convex set function on a compact set and are thus unique. The
linear combination of 'a k x is the kth principal component.
The direction of greatest variability, gives the “most information about
configuration of data in a multidimensional space” (Kolenikov and Angeles 2004:7).
Thus, the first principal component will extract most information, and the second
orthogonal to the first one will extract less information and so on. To solve for (1), an
eigen problem for the covariance (or correlation) of matrix .
a a ...............................................................(2)
This solution gives a set of principal component weights a (also known as factor
loadings). The linear combinations or scores a’x and eigen values 1 2 p . Then
establishing 'a given that 1k k jx x V V ( the standardized correlation matrix). So
eigen values are variances of corresponding linear combinations.
The PCA is a linear procedure (Jolliffee 2002; Kolenikov and Angeles 2004) and is
non-robust (Huber 2003) due to distributional assumption violations, especially
when it comes to the normality assumption.
An alternative approach to computing correlations between ordinal variables uses
assumptions similar to ordered probits (Kolenikov and Angeles 2004).
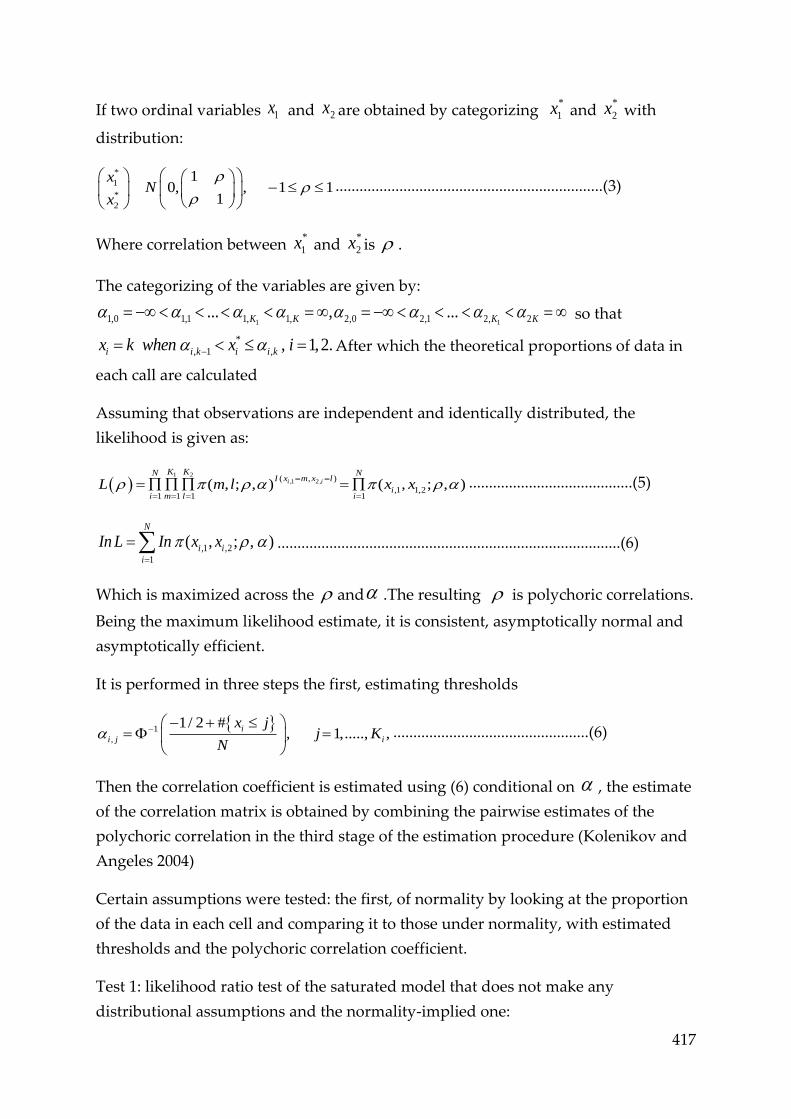
417
If two ordinal variables 1x and 2x are obtained by categorizing *
1x and *
2x with
distribution:
*
1
*
2
10, , 1 1
1
xN
x
...................................................................(3)
Where correlation between *
1x and *
2x is .
The categorizing of the variables are given by:
11,0 1,1 1, 1, 2,0 2,1... , ...K K 12, 2K K so that
*
, 1 , , 1,2.i i k i i kx k when x i After which the theoretical proportions of data in
each call are calculated
Assuming that observations are independent and identically distributed, the
likelihood is given as:
1 2
,1 2,( , )
,1 1,21 1 1 1
( , ; , ) ( , ; , )i i
K KN NI x m x l
ii m l i
L m l x x
.........................................(5)
,1 ,2
1
( , ; , )N
i i
i
In L In x x
......................................................................................(6)
Which is maximized across the and .The resulting is polychoric correlations.
Being the maximum likelihood estimate, it is consistent, asymptotically normal and
asymptotically efficient.
It is performed in three steps the first, estimating thresholds
1
,
1/ 2 #, 1,....., ,
i
i j i
x jj K
N
.................................................(6)
Then the correlation coefficient is estimated using (6) conditional on , the estimate
of the correlation matrix is obtained by combining the pairwise estimates of the
polychoric correlation in the third stage of the estimation procedure (Kolenikov and
Angeles 2004)
Certain assumptions were tested: the first, of normality by looking at the proportion
of the data in each cell and comparing it to those under normality, with estimated
thresholds and the polychoric correlation coefficient.
Test 1: likelihood ratio test of the saturated model that does not make any
distributional assumptions and the normality-implied one:

418
1 2
1 1
( , ; ,2
K K
mlm l ml
n m lLR n In
n
(7)
Where ,1 ,2|{ : , }|ml i in i x m x l is the number of observations identified by ,m l th
categories of variables 1x and 2x .
Test 2: Pearson goodness of fit test for distributions
1 22
2
1 1
( / ( , ; , ))
( , ; , )
K Kml
mm l
n n m lX n l
m l
(8)
Both of those statistics would have an asymptotic2 distribution with 1 2 1 2K K K K .
Calculating polyserial correlations: According to Kolenikov and Angeles (2004), a
few it is the correlation between a discrete and a continuous variable. The likelihood
for the discrete variable 1x with underlying standard normal*
1x is made discrete
according to thresholds ( similar to ordered probit cut offs)
1,0 1,1 1 1 1, ,K K with continuous variable 2x ( assumed to have
standard normal distribution) is as follows:
*
1 2 1 2 1, 1 1, 1 1 1, 2 2
1, 2 1, 1 2 2
( , ; , ) ( , ; , ) Pr [ | ] ( )
( )
k k k
k k
L x k x f x k x ob x x x
x x x
(9)
As long as *
1 2 2|x x x Ε . Assuming independence of observations to sum up the
log-likelihood, the resulting expression can be maximized with respect to and
to find the polyserial correlation.

419
Appendix 11: Robustness of polychroic PCA using Principal component analysis
Territorial Fixed and Fluid embeddedness: Average index values across farmer categories
Farmer
Category
Territorial: Fixed Territorial: Fluid
Mean Std Error Mean Std Error
LPN 0.167 0.015 0.664 0.011
RPN 0.157 0.027 0.690 0.020
GPN 0.173 0.015 0.709 0.012
Territorial fluid results are quite similar, while territorial Fixed results are hugely
underestimated in the PCA with slightly higher standard errors, suggesting that the
tetrachoric and polychroic methods used provide more efficient scores.
Network architecture and stability embeddedness: Average index values across farmer
categories
Network: architecture Network: Stability
Mean Std Error Mean Std Error
LPN 0.379 0.008 0.813 0.008
RPN 0.445 0.016 0.743 0.022
GPN 0.721 0.012 0.576 0.017
The PCA follow a similar trend to the polychoric PCA, suggesting that the results are
robust.
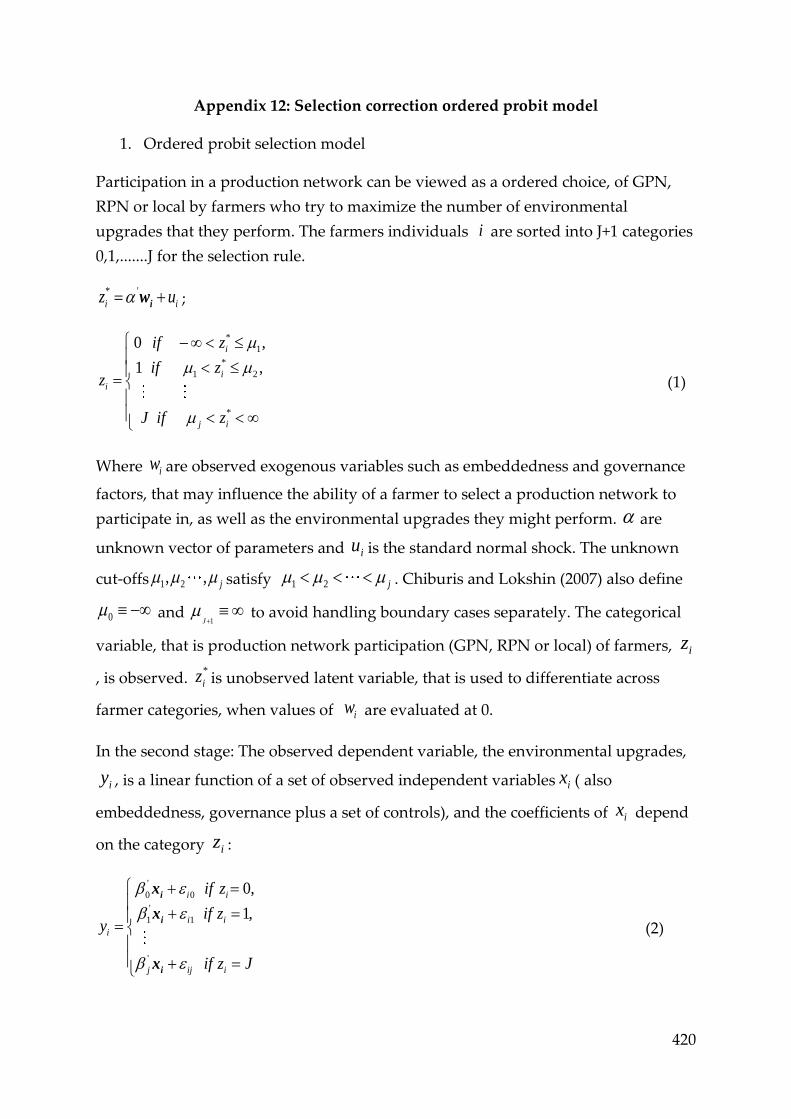
420
Appendix 12: Selection correction ordered probit model
1. Ordered probit selection model
Participation in a production network can be viewed as a ordered choice, of GPN,
RPN or local by farmers who try to maximize the number of environmental
upgrades that they perform. The farmers individuals i are sorted into J+1 categories
0,1,.......J for the selection rule.
* '
i iz u i
w ;
*
1
*
1 2
*
0 ,
1 ,
i
i
i
j i
if z
if zz
J if z
(1)
Where iw are observed exogenous variables such as embeddedness and governance
factors, that may influence the ability of a farmer to select a production network to
participate in, as well as the environmental upgrades they might perform. are
unknown vector of parameters and iu is the standard normal shock. The unknown
cut-offs 1 2, , j satisfy 1 2 j . Chiburis and Lokshin (2007) also define
0 and 1J
to avoid handling boundary cases separately. The categorical
variable, that is production network participation (GPN, RPN or local) of farmers, iz
, is observed. *
iz is unobserved latent variable, that is used to differentiate across
farmer categories, when values of iw are evaluated at 0.
In the second stage: The observed dependent variable, the environmental upgrades,
iy , is a linear function of a set of observed independent variables ix ( also
embeddedness, governance plus a set of controls), and the coefficients of ix depend
on the category iz :
'
0 0
'
1 1
'
0,
1,
i i
i i
i
j ij i
if z
if zy
if z J
i
i
i
x
x
x
(2)

421
Where, for each 0, ,j J , ij are the unobserved characteristics (shocks) has a
mean 0, variance 2
j . It is a bivariate normal with iu normal shock and correlation j
. Chiburis and Lokshin (2007) assume that the shocks ij and iu are iid (independent
and identically distributed) across observations. The objective is to estimate the
parameter vectors of 0 1, , j .
Chiburis and Lokshin (2007), also state that only one category j is observed for
each individual and that the observations are independent, thus the correlation
between ij and ik for j k cannot be identified. Furthermore, when
counterfactually predicting iy in category k for a farmer who chose category j ,
the correlation between the shocks is not important.
Heckman (1979) showed that in binary cases, estimating equations in (2) through
ordinary last squares (OLS) gives biased results. Chiburis and Lokshin (2007), define:
1
1
* ' * ' *
' '
1
' * ' *
' '
1
' '
1
' '
1
( ) ( )[ | , ]
( )
( )
( ) ( )
( )
( ) ( )
j
j
j
j
i i i
i i i
j j
i i
j j
j j
j j
z z dzE u z
z dz
i i
i
i i
i
i i
i i
i i
w ww
w w
w
w w
w w
w w
(3)
Where ij z . Then,
'
'
[ | , , ] [ | , ]i i j ij i
j j j i
E y z E z j
i i i i
i
w x x w
x (4)
Where, i is Heckman’s mills ratio. By performing an OLS of y on x over a sub-
sample of : ii z j , and adding an extra regressor of , the OLS results would be
consistent i.e. j
would be consistent. However, not including the mills would lead
to omitted variable bias if 0j .
Chiburis and Lokshin (2007) then proceed to lay out two consistent estimators one a
two-step procedure, while the other a FIML. This chapter will use a two-step
estimation procedure and for robustness a FIML. The two-step estimator is

422
consistent for small samples as well as for handling non-normality in shocks, in
simulations it has performed better than the FIML and is more robust, thus used in
this chapter the next section explains the two-stage estimation. The FIML has been
run only for a robustness check and this thesis finds that the results of both are
similar, however the two-stage results are preferred slightly over the FIML as it
provides more robust results.
2. Two stage estimation
This procedure is a follow on from Greene (2002) and generalizes Heckman (1979)
estimator for a binary case.
First, equation (1) is estimated, through an ordered probit of z on w , giving
consistent estimations for 1 2, , ,..... ,j
With * '
i iz
w . Then using (3) a consistent
estimator for is:
* *
1
* *
1
jj i i
i
j i j i
z z
z z
(5)
Where ij z
With (4) j will be estimated with an OLS regression of y on x and
by using
observations ,ii for which z j
If jC
be the coefficient for
in the regression, and the RSS jbe the residual sum of
squares of the regression. Let nj be the number of observations in which equation j is
observed. Then j is estimated as:
2
*:
1 ij j j
i j jji
RSS Cn
z
* * * *
1 12
2
:* *
jj i i j i j i
j j
ii j j
j j
j i i j i
z z z zRSS C
n nz z
And then, jC
is a consistent estimator of j j ,

423
j
j
j
C
is a consistent estimator for j
3. Robustness check: FIML estimation
FIML consists of finding the parameter values that maximizes likelihood of the data,
The parameters to be estimated are:
0 1 1 1 2 0 1 1 0 1 1; , ,..., ; , ,...., ; , ,...., ; , ,....,j j j j
But j , j and j do not exist for categories j when y is missing. With these
parameters, the likelihood of an observation i in which the category is j and iy is
observed is:
1
1
' '
1 1
2 2
[ , | , , , , , , , ]
[ | , , ] Pr [ | , , , , , , , , ]
1( )
1 1
y
ij i j j j j j
i j j i j j j j j
j i j j j
i
j j j
L L y j
L y j y
t tt
i i
i i i
i i
x w
x x w
w w
(6)
Where '
i j i
ij
y xt
, is the standard normal density function, and is the
standard normal cumulative density function. If and u are standards bivariate
normal with correlation , then the conditional distribution of u given is
normal with mean and variance 21 .
If j is a category for which y is unspecified thenthe likelihood is
' '
1( ) ( )ij i j i jL w w (7)
Where ijL is likelihood for thi farmers in j category.
Taking the log of (6) and (7), enables getting the log-likelihood for observation i , and
can add the log-likelihoods across observations to get log-likelihood for the whole
sample as the observations are independent
.
1
log , ;
log ,
i
i
y
iz in
iz i
i
L if y is observed
L if y is missing
L (8)

424
4. Identification
An identification problem in j will arise if all variables in w are also in x . In an
ordered probit model identification problem for selection categories 1 1j J in
the interior range of z , for which both lower and upper level cut-offs are finite.
Chiburis and Lokshin (2007) show that *( )z
is nearly linear when cut-offs are finite.
For categories where the cut-offs are closer together, this is even stronger and thus
there must be atleast a variable in w that is not in x .

425
Appendix 13: Robustness check for Low Complexity Product and Process
Environmental Upgrades- stage 1, regression 1
First stage regression for conventional Product and process environmental upgrades
column 1,2 are selection equations which is jointly estimated for LCEPP. While Column 3,4 are independent probit models – for
robustness for LCEPP
*** Significant at 1% level; ** Significant at 5% level; * Significant at 10% level
Results suggest that network embeddedness, in terms of strong ties, as well as
having a written contact and having certification are critical to participating in a
GPN or RPN value chain. Farmers who have better social upgrades (hygiene
requirements) and perform more value addition (economic upgrades) are more
likely to participate in a network. However, network stability(trust) is not seen as an
important variable for participating. As farmers need to participate to earn an
income as farming is their main livelihood, and they have limited diversification
opportunities.
Variables Jointly estimated oprobit Independent oprobit (1)
Coefficient
(2)
SE
(3)
Coefficient
(4)
SE
Territorial embeddedness: Fixed (index) 0.734095 0.627501 0.599257 0.750081 Territorial embeddedness: Fluid (index) -0.22077 0.190689 -0.28695 0.180089 Network embeddedness: Architecture (index)
2.200924*** 0.590452 2.136472*** 0.591645
Network embeddedness: Stability (index) -2.23243*** 0.369987 -2.24899*** 0.397073 Written Contract (dummy) 1.032025*** 0.204495 1.03245*** 0.240509 Certification type (dummy) 0.522421*** 0.184529 0.522955*** 0.189302 Implicit capabilities (index) -0.24774 0.46583 -0.32951 0.469362 Internal knowledge (share) 0.00229 0.00806 0.00144 0.009345 External knowledge (share) 0.00191** 0.007566 0.001775 0.008687 Strategic diversification (dummy) 0.210052 0.105376 0.219777** 0.107243 Membership in farmer group (dummy) 0.063093 0.144323 0.052883 0.159217 Crop type (1= tree crop) (dummy) -0.36889* 0.1931 -0.31964 0.206626 Hygiene (dummy) 0.620369** 0.258436 0.577546** 0.244088 Value addition (dummy) 1.208795*** 0.168503 1.242928*** 0.167056 Duration of specific market participation(year)
-0.45278*** 0.176441 -0.50148*** 0.184726
/cut 1 0.719847 0.811459 0.446961 0.811838 / cut2 1.649695 0.815629 1.38005 0.807424 Wald chi2(15) 277.78***

426
Appendix 14: Box Cox test for specification and identification test
The Box-Cox test for goodness of fit the whole model of stage 2 regressions was run. In all the regression equations, the estimated
values of Chi-square exceed the critical value suggesting that all modes, log-log, linear-linear and inverse dependents and
independents are rejected. However, the log-likelihood of linear appears to be the best and thus the linear model is selected in the
second.
H0 test Stage 2, Regression 1
Stage 2, Regression 2
Stage 2, Regression 3
log likelihood chi2 Prob> chi2 log likelihood chi2 Prob> chi2 log likelihood chi2 Prob> chi2
Theta =-1 -1241.73 878.85 0.000 -1389.36 1122.48 0.000 -518.334 4.51 0.034
Theta =0 -948.687 292.75 0.000 -1007.82 359.4 0.000 -513.006 15.17 0.000
Theta =1 -816.663 28.7 0.000 -829.614 2.99 0.084 -472.32 96.54 0.000
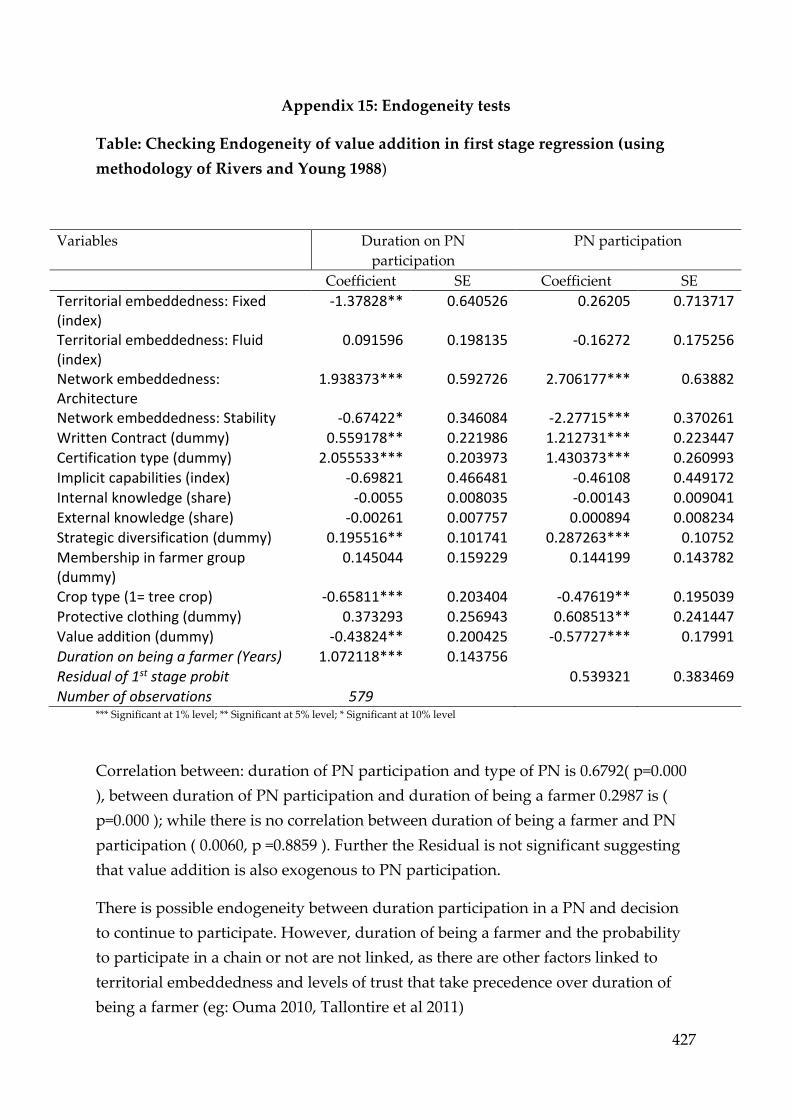
427
Appendix 15: Endogeneity tests
Table: Checking Endogeneity of value addition in first stage regression (using
methodology of Rivers and Young 1988)
*** Significant at 1% level; ** Significant at 5% level; * Significant at 10% level
Correlation between: duration of PN participation and type of PN is 0.6792( p=0.000
), between duration of PN participation and duration of being a farmer 0.2987 is (
p=0.000 ); while there is no correlation between duration of being a farmer and PN
participation ( 0.0060, p =0.8859 ). Further the Residual is not significant suggesting
that value addition is also exogenous to PN participation.
There is possible endogeneity between duration participation in a PN and decision
to continue to participate. However, duration of being a farmer and the probability
to participate in a chain or not are not linked, as there are other factors linked to
territorial embeddedness and levels of trust that take precedence over duration of
being a farmer (eg: Ouma 2010, Tallontire et al 2011)
Variables Duration on PN
participation
PN participation
Coefficient SE Coefficient SE
Territorial embeddedness: Fixed (index)
-1.37828** 0.640526 0.26205 0.713717
Territorial embeddedness: Fluid (index)
0.091596 0.198135 -0.16272 0.175256
Network embeddedness: Architecture
1.938373*** 0.592726 2.706177*** 0.63882
Network embeddedness: Stability -0.67422* 0.346084 -2.27715*** 0.370261 Written Contract (dummy) 0.559178** 0.221986 1.212731*** 0.223447 Certification type (dummy) 2.055533*** 0.203973 1.430373*** 0.260993 Implicit capabilities (index) -0.69821 0.466481 -0.46108 0.449172 Internal knowledge (share) -0.0055 0.008035 -0.00143 0.009041 External knowledge (share) -0.00261 0.007757 0.000894 0.008234 Strategic diversification (dummy) 0.195516** 0.101741 0.287263*** 0.10752 Membership in farmer group (dummy)
0.145044 0.159229 0.144199 0.143782
Crop type (1= tree crop) -0.65811*** 0.203404 -0.47619** 0.195039 Protective clothing (dummy) 0.373293 0.256943 0.608513** 0.241447 Value addition (dummy) -0.43824** 0.200425 -0.57727*** 0.17991 Duration on being a farmer (Years) 1.072118*** 0.143756
Residual of 1st stage probit
0.539321 0.383469 Number of observations 579

428
Appendix 16: Model validity and falsification (across all regressions)
Exclusion restrictions: for second stage regression (Falsification)
In the first stage regression: very significant
Equations F value Prob>F
PN choice: LCEPP 23.22 0.000
PN choice: LCEPP+HCEPP 31.13 0.000
PN Choice: SEU 26.49 0.000
Exclusions in second stage: Not significant
Equations F value Prob>F
LCEPP 1.53 0.2053
LCEPP+HCEPP 1.74 0.1578
SEU 1.77 0.1526
The fact that the exclusions are not significant in the Stage 2 regression, suggest that
they are valid exclusion restrictions.
Model validity (across all regressions)
Results for combined conventional product and process environmental upgrading- Stage 2,
Regression 1
Model validity: The mills ratio it is significant and has a downward bias for exporter
farmer which suggests that the error terms in the selection and outcome equations
are negatively correlated. So (unobserved) factors that make participation more
likely tend to be associated with lower CPP. Furthermore, the Wald test, is
significant at 10% (7.79) indicating that the null hypothesis of independence of
equation can be rejected and that joint estimation was necessary.
Results for combined conventional and network specific product and process environmental
upgrading- Stage 2, Regression 2
In testing for model validity, the fact that the mills ratio is significant and downward
biased for both exporters and local farmers suggests the need to use a selection
model. Furthermore, the Wald test (8.07) is significant justifying the non-
independence of the equations

429
Results for combined strategic environmental upgrading- Stage 2, Regression 3
In terms of model validity, the fact that the Mills Ratio is significant and upward
biased for both GPN and RPN farmers suggests the need to use a selection model.
Furthermore, the Wald test (7.30) is significant justifying the non-independence of
the equations.
Appendix 17: Robustness with linear regressions (for second stage)
Results indicate that the results vary in some cases and that the joint model offers
improved estimators, because of lower standard errors as well as taking into account
selection bias.

430
Robustness with linear regressions for LCEPP: Regression 2
*** Significant at 1% level; ** Significant at 5% level; * Significant at 10% level
Variables EPP(c): Local EPP(c): RPN EPP(c): GPN (1)
Coefficient
(2)
SE
(3)
Coefficient
(4)
SE
(5)
Coefficient
(6)
SE
Territorial embeddedness: Fixed (index) 7.513737*** 0.667583 2.923396*** 1.069235 4.148295*** 0.515733 Territorial embeddedness: Fluid (index) 0.084919 0.166557 0.352407 0.349683 0.276018* 0.147686 Network embeddedness: Architecture 1.034962* 0.534662 -0.36897 1.060291 0.491187 0.489106 Network embeddedness: Stability 0.01379 0.474391 -0.82366 0.729522 0.075597 0.259341 Written Contract (dummy) -0.75605 0.701281 -0.08212 0.302475 -0.15293 0.156712 Certification type (dummy) -0.12742 0.163628 0.374137 0.360002 0.465899*** 0.165465 Implicit capabilities (index) 0.707785** 0.336173 0.763312 0.651248 0.141099 0.301115 Internal knowledge (share) 0.108453*** 0.005746 0.148647*** 0.015301 0.102557*** 0.008536
External knowledge (share) 0.116187*** 0.005988 0.153796*** 0.013298 0.119819*** 0.007725 Strategic diversification (dummy) 0.002075 0.138205 -0.28412 0.171868 -0.08204 0.077508 Membership in farmer group (dummy) 0.049783 0.141359 0.183007 0.257388 -0.01173 0.14833 Crop type (1= tree crop) -1.31882*** 0.155957 -0.50507 0.316767 -0.78927*** 0.163863 Constant -3.18198*** 0.649887 -1.76815 1.346707 -0.60672 0.635208 Number of observations 261 72 246 F statistic 139.66*** 34.14*** 102.86***

431
Appendix 18: Robustness with FIML for LCEPP
Second stage regression results for LCEPP (FIML estimates)
*** Significant at 1% level; ** Significant at 5% level; * Significant at 10% level
Variables EPP(c): Local EPP(c): RPN EPP(c): GPN (1)
Coefficient
(2)
SE
(3)
Coefficient
(4)
SE
(5)
Coefficient
(6)
SE
Territorial embeddedness: Fixed (index) 7.445522*** 0.613611 2.596217** 1.214441 4.170477*** 0.533573 Territorial embeddedness: Fluid (index) 0.122404 0.165118 0.419244 0.346034 0.277482** 0.137333 Network embeddedness: Architecture 0.831874 0.588238 -1.1941 1.136725 0.288732 0.47388 Network embeddedness: Stability 0.353401 0.564906 -0.38939 0.736224 0.278832 0.278844 Written Contract (dummy) -0.92341*** 0.265503 -0.45732 0.436205 -0.26105 0.162739 Certification type (dummy) -0.22345 0.183019 -0.01972 0.402591 0.362219** 0.18315 Implicit capabilities (index) 0.657604** 0.298529 0.665743 0.630997 0.11816 0.263586 Internal knowledge (share) 0.10899*** 0.005705 0.151539*** 0.01346 0.103328*** 0.009701
External knowledge (share) 0.116706*** 0.005676 0.155318*** 0.013829 0.11987*** 0.00951 Strategic diversification (dummy) -0.0489 0.143525 -0.32214** 0.13551 -0.09967 0.076053 Membership in farmer group (dummy) 0.03739 0.142309 0.130056 0.246771 -0.03296 0.14125 Crop type (1= tree crop) -1.31741*** 0.150229 -0.35872 0.267106 -0.72898 0.171657 Constant -3.48719*** 0.696362 -1.42169 1.313155 -0.36568*** 0.708433 lnσl -0.047654 0.054889 ρlv -0.3510576 0.345577 lnσr -0.0892964 0.094715
ρrv -0.3651962 0.222422 lnσe -0.0934166* 0.048299 ρev -0.3464971 0.153898 Wald test of independent equations ꭕ2 (3) 7.79* Number of observations 261 72 246 Log-likelihood -1022.455
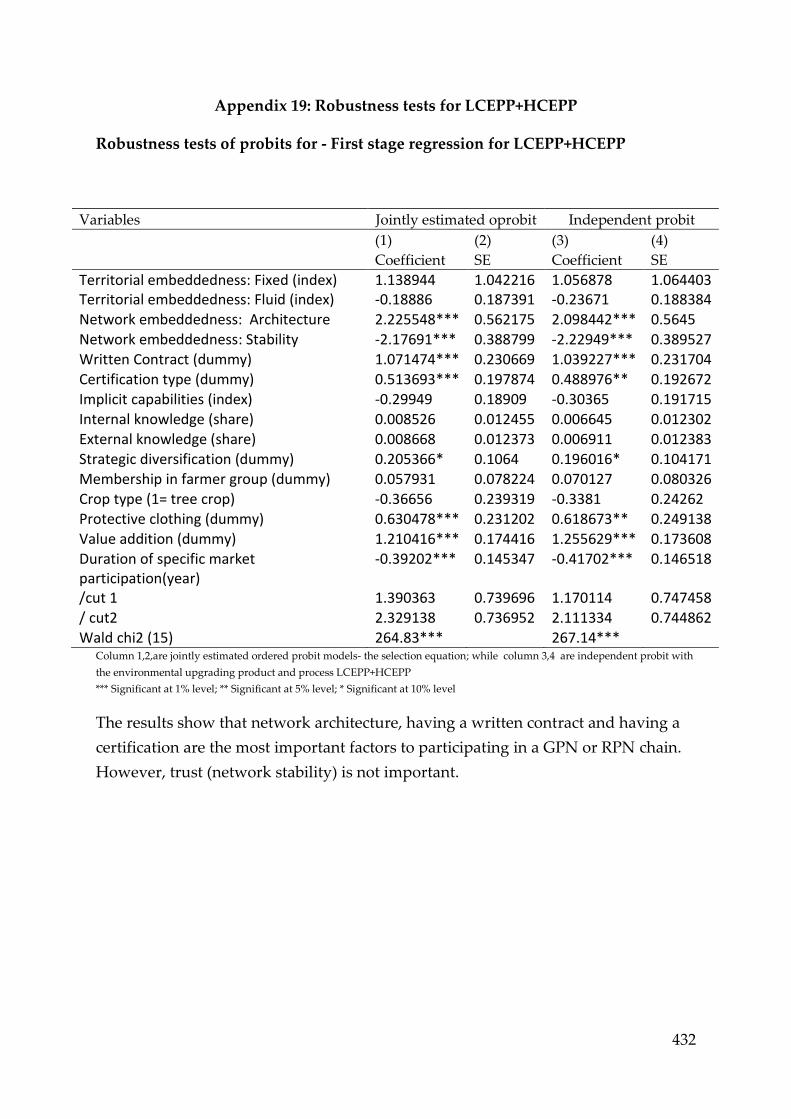
432
Appendix 19: Robustness tests for LCEPP+HCEPP
Robustness tests of probits for - First stage regression for LCEPP+HCEPP
Column 1,2,are jointly estimated ordered probit models- the selection equation; while column 3,4 are independent probit with
the environmental upgrading product and process LCEPP+HCEPP
*** Significant at 1% level; ** Significant at 5% level; * Significant at 10% level
The results show that network architecture, having a written contract and having a
certification are the most important factors to participating in a GPN or RPN chain.
However, trust (network stability) is not important.
Variables Jointly estimated oprobit Independent probit (1)
Coefficient
(2)
SE
(3)
Coefficient
(4)
SE
Territorial embeddedness: Fixed (index) 1.138944 1.042216 1.056878 1.064403 Territorial embeddedness: Fluid (index) -0.18886 0.187391 -0.23671 0.188384 Network embeddedness: Architecture 2.225548*** 0.562175 2.098442*** 0.5645
Network embeddedness: Stability -2.17691*** 0.388799 -2.22949*** 0.389527 Written Contract (dummy) 1.071474*** 0.230669 1.039227*** 0.231704 Certification type (dummy) 0.513693*** 0.197874 0.488976** 0.192672 Implicit capabilities (index) -0.29949 0.18909 -0.30365 0.191715 Internal knowledge (share) 0.008526 0.012455 0.006645 0.012302
External knowledge (share) 0.008668 0.012373 0.006911 0.012383 Strategic diversification (dummy) 0.205366* 0.1064 0.196016* 0.104171 Membership in farmer group (dummy) 0.057931 0.078224 0.070127 0.080326 Crop type (1= tree crop) -0.36656 0.239319 -0.3381 0.24262 Protective clothing (dummy) 0.630478*** 0.231202 0.618673** 0.249138 Value addition (dummy) 1.210416*** 0.174416 1.255629*** 0.173608 Duration of specific market participation(year)
-0.39202*** 0.145347 -0.41702*** 0.146518
/cut 1 1.390363 0.739696 1.170114 0.747458 / cut2 2.329138 0.736952 2.111334 0.744862 Wald chi2 (15) 264.83*** 267.14***

433
Appendix 20: Endogeneity tests for LCEPP+HCEPP
Checking Endogeneity: First stage regression for LCEPP+HCEPP
*** Significant at 1% level; ** Significant at 5% level; * Significant at 10% level
Variables Duration on PN
participation
PN participation
Coefficient SE Coefficient SE
Territorial embeddedness: Fixed (index)
-1.96267** 0.871802 -0.7866 0.845253
Territorial embeddedness: Fluid (index)
0.099634 0.201621 -0.10933 0.183471
Network embeddedness: Architecture
1.951496*** 0.581181 2.797063*** 0.616644
Network embeddedness: Stability -0.70412** 0.343661 -2.26806*** 0.365403 Written Contract (dummy) 0.594723*** 0.215955 1.249903*** 0.225782 Certification type (dummy) 2.025888*** 0.200822 1.418308*** 0.255128 Implicit capabilities (index) -0.72959 0.46485 -0.47598 0.445966 Internal knowledge (share) 0.011046 0.011835 0.004467 0.012306 External knowledge (share) 0.015233 0.010974 0.007607 0.011436 Strategic diversification (dummy) 0.172386* 0.101577 0.268599** 0.107638 Membership in farmer group (dummy)
-0.02214 0.058762 0.056304 0.068837
Crop type (1= tree crop) -0.62949*** 0.214085 -0.56908** 0.226927 Protective clothing (dummy) 0.481478* 0.254628 0.686604*** 0.235342 Value addition (dummy) -0.44742** 0.200357 -0.58719*** 0.18039 Duration of being a farmer (years) 1.083678*** 0.146406
Residual of 1st stage probit
0.611228 0.382492 Number of observations 579

434
Appendix 21: Robustness tests for LCEPP+HCEPP Stage 2
Robustness with linear regressions for LCEPP+HCEPP, Stage 2
*** Significant at 1% level; ** Significant at 5% level; * Significant at 10% level
Variables EPP(c): Local EPP(c): RPN EPP(c): GPN (1)
Coefficient
(2)
SE
(3)
Coefficient
(4)
SE
(5)
Coefficient
(6)
SE
Territorial embeddedness: Fixed (index) 1.58513 1.139854 2.773853 2.292163 2.751562*** 0.975729 Territorial embeddedness: Fluid (index) 0.237746 0.168498 -0.104 0.38016 0.461869*** 0.157814 Network embeddedness: Architecture 0.093113 0.070829 -0.11729 0.135959 0.072418 0.075258 Network embeddedness: Stability 0.405697 0.475649 -0.19473 0.851521 0.054823 0.280839 Written Contract (dummy) -0.76699 0.692108 -0.00969 0.361227 0.126625 0.182034 Certification type (dummy) -0.13084 0.164713 -0.06687 0.426126 0.304491* 0.178064 Implicit capabilities (index) 0.879892*** 0.176058 0.810609 0.500259 0.75387*** 0.193895 Internal knowledge (share) 0.119118*** 0.009726 0.180417*** 0.025088 0.15185*** 0.011854
External knowledge (share) 0.139306*** 0.009901 0.193912*** 0.024387 0.187968*** 0.010923 Strategic diversification (dummy) 0.045459 0.13721 -0.102 0.188319 -0.2108** 0.085283 Membership in farmer group (dummy) 0.481405*** 0.08023 0.365068* 0.203329 0.144784*** 0.050112 Crop type (1= tree crop) -1.46343*** 0.161829 -0.26121 0.403631 -1.06953*** 0.218782 Constant -1.32002* 0.786995 0.872773 1.723625 -1.417* 0.737803 Number of observations 261 72 246 F statistic 311.20*** 85.11*** 322.85***

435
Appendix 22: Robustness test for LCEPP+HCEPP selection correction model with FIML
Second stage regression results for LCEPP+HCEPP
*** Significant at 1% level; ** Significant at 5% level; * Significant at 10% level
Variables EPP(c): Local EPP(c): RPN EPP(c): GPN (1)
Coefficient
(2)
SE
(3)
Coefficient
(4)
SE
(5)
Coefficient
(6)
SE
Territorial embeddedness: Fixed (index) 1.493616 1.112682 3.12157 1.983601 2.646456*** 1.00897 Territorial embeddedness: Fluid (index) 0.265197 0.167514 -0.06107 0.411618 0.462804*** 0.150637 Network embeddedness: Architecture 0.103** 0.048801 -0.1285 0.120403 0.077217 0.080425 Network embeddedness: Stability 0.714112 0.465817 0.172532 0.986 0.285377 0.296231 Written Contract (dummy) -0.94264*** 0.285459 -0.33321 0.503738 -0.01265 0.211693 Certification type (dummy) -0.21337 0.163401 -0.41049 0.498863 0.184679 0.197701 Implicit capabilities (index) 0.905595*** 0.170658 0.87009** 0.427248 0.803612*** 0.18525
Internal knowledge (share) 0.119082*** 0.008474 0.18134*** 0.024007 0.15164*** 0.01129 External knowledge (share) 0.138589*** 0.008536 0.192071*** 0.022509 0.186804*** 0.010408 Strategic diversification (dummy) -0.00348 0.142967 -0.13352 0.170881 -0.23651*** 0.083288 Membership in farmer group (dummy) 0.475183*** 0.072901 0.355208** 0.159645 0.13931*** 0.051087 Crop type (1= tree crop) -1.46117*** 0.170768 -0.13524 0.384016 -1.02533*** 0.206468 Constant -1.62964** 0.733583 1.089295 1.375275 -1.17683** 0.52773 lnσl -0.04484 0.049936 ρlv -0.31943 0.168436
lnσr -0.00261 0.095856 ρrv -0.2545 0.233904 lnσe -0.03061 0.044837 ρev -0.34589 0.173533 Wald test of independent equations ꭕ2 (3) 8.07** Number of observations 261 72 246

436
Appendix 23: Robustness test for Strategic environmental upgrading Stage 1
Environmental strategic upgrades: First stage regression for strategic environmental
upgrades with probits
Column 1,2,are jointly estimated ordered probit models – selection equation; while column 3,4 are selection equations which
is independent probit with the environmental upgrading strategic
*** Significant at 1% level; ** Significant at 5% level; * Significant at 10% level
The results indicate that network architecture, having a written contract, having a
certification, the level of internal and external knowledge, as well as economic and
social upgrades are critical to participating in markets.
Variables Jointly estimated oprobit Independent probit (1)
Coefficient
(2)
SE
(3)
Coefficient
(4)
SE
Territorial embeddedness: Fixed (index) 1.579196** 0.634209 1.546388** 0.631979 Territorial embeddedness: Fluid (index) 0.310745 0.350136 0.436484 0.357572
Network embeddedness: Architecture 2.252327**** 0.579322 2.308618**** 0.559922 Network embeddedness: Stability -2.28881**** 0.390507 -2.2265**** 0.40079 Written Contract (dummy) 1.048979**** 0.23825 1.035441**** 0.236576 Certification type (dummy) 0.590876**** 0.192305 0.581919**** 0.193567 Implicit capabilities (index) -0.33873 0.481028 -0.44289 0.501928 Internal knowledge (share) 0.01382** 0.006378 0.01399** 0.006425 External knowledge (share) 0.018** 0.008097 0.01795** 0.007938 Strategic diversification (dummy) 0.220415** 0.106953 0.185665** 0.11158 Membership in farmer group (dummy) 0.066062 0.159675 0.07477 0.159433 Crop type (1= tree crop) -0.33332** 0.184167 -0.35062** 0.184623 Protective clothing (dummy) 0.651913*** 0.219439 0.612544*** 0.219116 Value addition (dummy) 1.186574*** 0.174741 1.211842*** 0.181846
Duration of specific market participation(year)
-0.46731** 0.188635 -0.59678*** 0.196116
/cut 1 0.863855 0.617856 0.85818 0.63408 / cut2 1.801046 0.618151 1.791639 0.630108 Wald chi2 (15) 299.74*** 304.00***
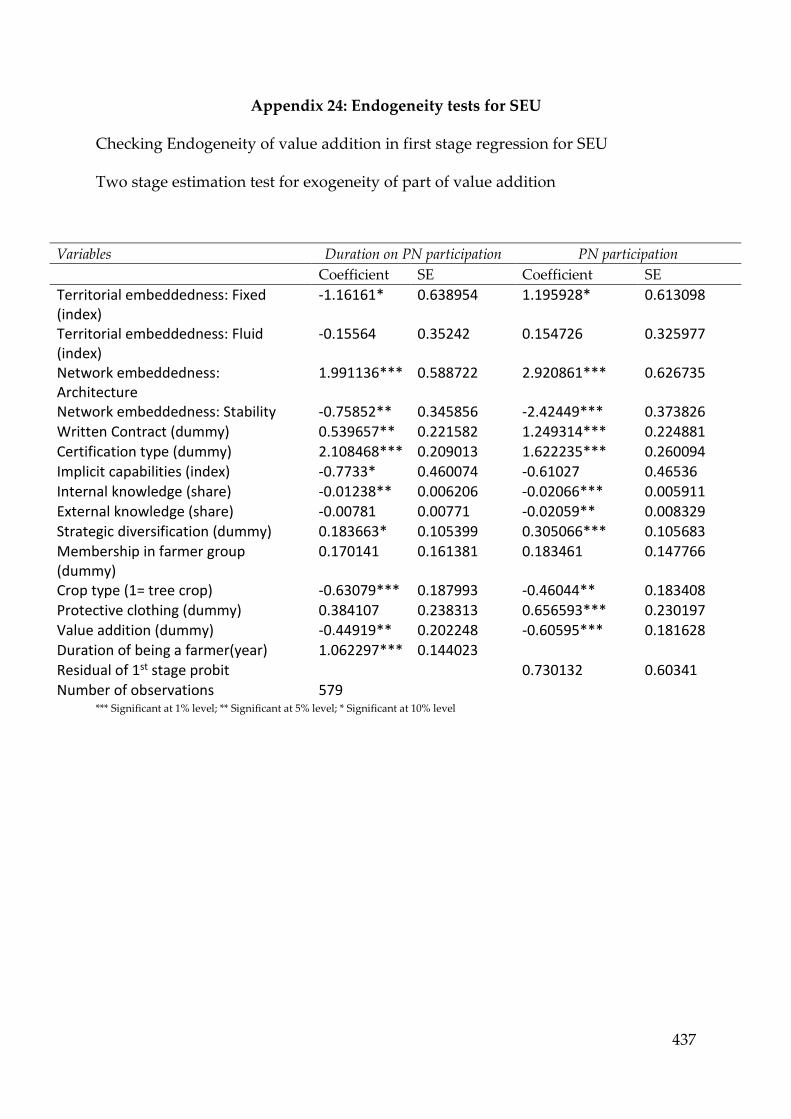
437
Appendix 24: Endogeneity tests for SEU
Checking Endogeneity of value addition in first stage regression for SEU
Two stage estimation test for exogeneity of part of value addition
*** Significant at 1% level; ** Significant at 5% level; * Significant at 10% level
Variables Duration on PN participation PN participation Coefficient SE Coefficient SE
Territorial embeddedness: Fixed (index)
-1.16161* 0.638954 1.195928* 0.613098
Territorial embeddedness: Fluid (index)
-0.15564 0.35242 0.154726 0.325977
Network embeddedness: Architecture
1.991136*** 0.588722 2.920861*** 0.626735
Network embeddedness: Stability -0.75852** 0.345856 -2.42449*** 0.373826 Written Contract (dummy) 0.539657** 0.221582 1.249314*** 0.224881 Certification type (dummy) 2.108468*** 0.209013 1.622235*** 0.260094 Implicit capabilities (index) -0.7733* 0.460074 -0.61027 0.46536 Internal knowledge (share) -0.01238** 0.006206 -0.02066*** 0.005911 External knowledge (share) -0.00781 0.00771 -0.02059** 0.008329 Strategic diversification (dummy) 0.183663* 0.105399 0.305066*** 0.105683 Membership in farmer group (dummy)
0.170141 0.161381 0.183461 0.147766
Crop type (1= tree crop) -0.63079*** 0.187993 -0.46044** 0.183408 Protective clothing (dummy) 0.384107 0.238313 0.656593*** 0.230197 Value addition (dummy) -0.44919** 0.202248 -0.60595*** 0.181628 Duration of being a farmer(year) 1.062297*** 0.144023
Residual of 1st stage probit
0.730132 0.60341 Number of observations 579
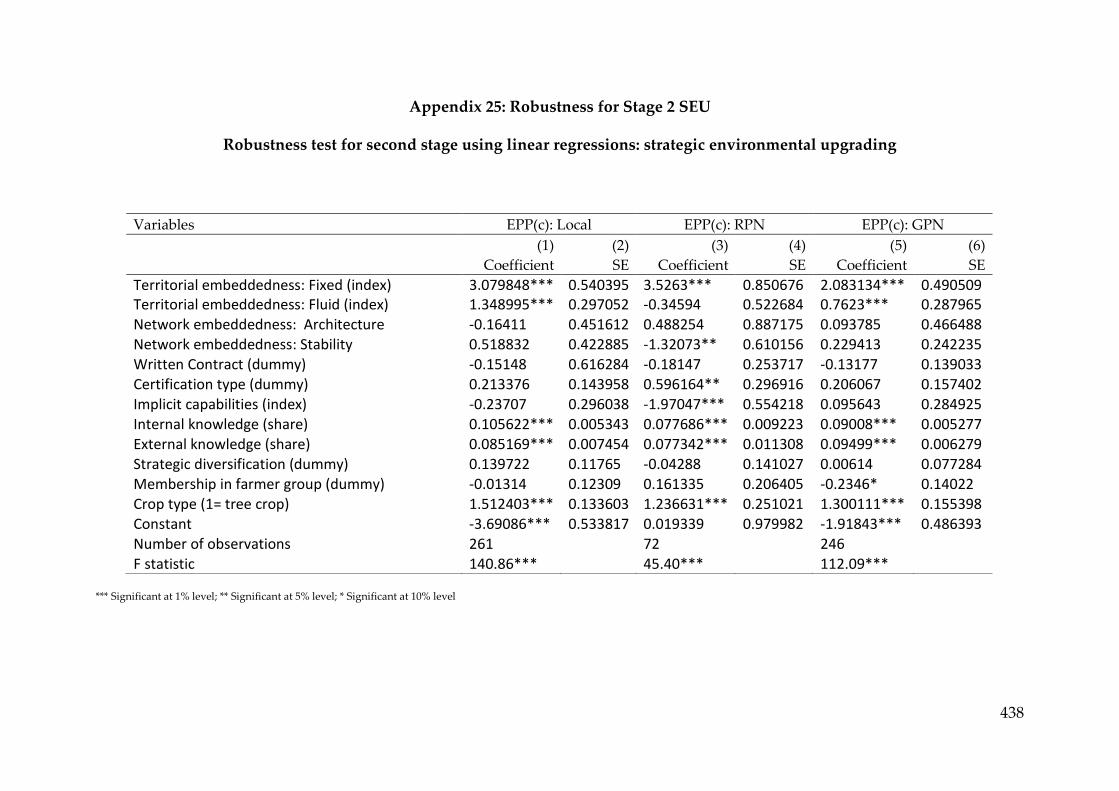
438
Appendix 25: Robustness for Stage 2 SEU
Robustness test for second stage using linear regressions: strategic environmental upgrading
*** Significant at 1% level; ** Significant at 5% level; * Significant at 10% level
Variables EPP(c): Local EPP(c): RPN EPP(c): GPN (1)
Coefficient
(2)
SE
(3)
Coefficient
(4)
SE
(5)
Coefficient
(6)
SE
Territorial embeddedness: Fixed (index) 3.079848*** 0.540395 3.5263*** 0.850676 2.083134*** 0.490509 Territorial embeddedness: Fluid (index) 1.348995*** 0.297052 -0.34594 0.522684 0.7623*** 0.287965 Network embeddedness: Architecture -0.16411 0.451612 0.488254 0.887175 0.093785 0.466488 Network embeddedness: Stability 0.518832 0.422885 -1.32073** 0.610156 0.229413 0.242235 Written Contract (dummy) -0.15148 0.616284 -0.18147 0.253717 -0.13177 0.139033 Certification type (dummy) 0.213376 0.143958 0.596164** 0.296916 0.206067 0.157402
Implicit capabilities (index) -0.23707 0.296038 -1.97047*** 0.554218 0.095643 0.284925 Internal knowledge (share) 0.105622*** 0.005343 0.077686*** 0.009223 0.09008*** 0.005277 External knowledge (share) 0.085169*** 0.007454 0.077342*** 0.011308 0.09499*** 0.006279 Strategic diversification (dummy) 0.139722 0.11765 -0.04288 0.141027 0.00614 0.077284 Membership in farmer group (dummy) -0.01314 0.12309 0.161335 0.206405 -0.2346* 0.14022 Crop type (1= tree crop) 1.512403*** 0.133603 1.236631*** 0.251021 1.300111*** 0.155398 Constant -3.69086*** 0.533817 0.019339 0.979982 -1.91843*** 0.486393 Number of observations 261 72 246
F statistic 140.86*** 45.40*** 112.09***

439
Appendix 26: Robustness test with FIML for SEU
Second stage regression results for strategic environmental upgrading: FIML estimates
*** Significant at 1% level; ** Significant at 5% level; * Significant at 10% level
Variables EPP(c): Local EPP(c): RPN EPP(c): GPN (1)
Coefficient
(2)
SE
(3)
Coefficient
(4)
SE
(5)
Coefficient
(6)
SE
Territorial embeddedness: Fixed (index) 2.94997*** 0.481235 4.056113*** 0.79455 2.200999*** 0.509171 Territorial embeddedness: Fluid (index) 1.324064*** 0.324624 -0.21174 0.436246 0.762689*** 0.257318 Network embeddedness: Architecture -0.38786 0.488528 1.41005 1.00228 0.260675 0.44103 Network embeddedness: Stability 0.866931 0.616309 -1.7558*** 0.558437 -0.00191 0.262292 Written Contract (dummy) -0.33434 0.482332 0.204248 0.294506 -0.00912 0.156234 Certification type (dummy) 0.111533 0.175572 0.992251*** 0.357563 0.3236* 0.188468 Implicit capabilities (index) -0.26075 0.264204 -1.84849*** 0.489467 0.101055 0.323365 Internal knowledge (share) 0.107757*** 0.006077 0.073172*** 0.009791 0.088758*** 0.005525
External knowledge (share) 0.087129*** 0.00789 0.073061*** 0.010403 0.092497*** 0.006413 Strategic diversification (dummy) 0.093537 0.138034 -0.02205 0.118875 0.031743 0.088761 Membership in farmer group (dummy) -0.01957 0.125624 0.233314 0.175194 -0.20358 0.131117 Crop type (1= tree crop) 1.514961*** 0.129543 1.074353*** 0.250252 1.237687*** 0.160158 Constant -3.9733*** 0.666114 -0.61572 0.914714 -2.21549*** 0.46659 lnσl -0.17442*** 0.066238 ρlv -0.38473 0.401082 lnσr -0.25277** 0.114848
ρrv 0.440835 0.217722 lnσe -0.13366*** 0.048611 ρev 0.385227 0.191798 Wald test of independent equations ꭕ2 (3) 7.30* Number of observations 261 72 246

440
Appendix 27: Complete results for simulation of environmental upgrades
Prediction for local farmers (average number of upgrades)
Environmental upgrading Local Std
Error
RPN Std
Error
GPN Std Err
Low complexity product and
process environmental
upgrading
Actual no. (A) 10.68 0.162 13.290 0.291 13.570 0.144
Simulated no. (B) 11.913 2.580 11.730 2.206
Difference no. (B-A) -1.377 -1.840
Low + High Complexity product
and process environmental
upgrading
Actual no. (A) 13.16 0.234 17.430 0.496 18.420 0.257
Simulated no. (B)
14.122 3.757 13.920 3.639
Difference no. (B-A) -3.308 -4.500
Strategic environmental
upgrading
Actual no. (A) 5.52 0.142 6.380 0.273 6.360 0.143
Simulated no. (B) 4.631 2.035 4.777 1.841
Difference no. (B-A) -1.749 -1.583

441
Prediction for RPN farmers (average number of upgrades)
Environmental upgrading Local Std Err RPN Std Err GPN Std Err
Low complexity product and process
environmental upgrading
Actual no. (A) 10.680 0.162 13.290 0.291 13.570 0.144
Simulated no. (B) 12.090 2.540 13.228 2.332
Difference no. (B-A) 1.410 -0.342
Low + High Complexity product and process
environmental upgrading
Actual no. (A) 13.160 0.234 17.430 0.496 18.420 0.257
Simulated no. (B) 16.264 4.433 17.339 4.183
Difference no. (B-A) 3.104 -1.081
Strategic environmental upgrading
Actual no. (A) 5.520 0.142 6.380 0.273 6.360 0.143
Simulated no. (B) 6.316 2.335 5.774 2.003
Difference no. ( B-A) 0.796 -0.586

442
Prediction for GPN farmers (average number of upgrades)
Environmental upgrading Local Std err RPN Std
Err
GPN Std err
Low complexity product and process environmental
upgrading
Actual no. (A) 10.680 0.162 13.290 0.291 13.570 0.144
Simulated no. (B) 12.855 2.493 13.342 2.075
Difference no. (B-
A)
2.175 0.052
Low + High Complexity product and process
environmental upgrading
Actual no. (A) 13.160 0.234 17.430 0.496 18.420 0.257
Simulated no. (B) 16.498 3.905 18.419 3.920
Difference no. (B-
A)
3.338 0.989
Strategic environmental upgrading
Actual no. (A) 5.520 0.142 6.380 0.273 6.360 0.143
Simulated no. (B) 6.266 2.289 7.727 2.386
Difference no. (B-
A)
0.746 1.347

443
Appendix 28: ISURE econometric model
1. The estimation method: iterated seemingly unrelated regressions
The model consists of M linear regression equations for N individuals. The thj
equation for individual i is '
ij ij j ijy x
Here, M linear equations relate to the equations for the environmental outcomes,
and yi is a Tx1 column vector of observations on the ith dependent variable
(environmental outcomes); Xi is a TxK matrix of observations for the K-1 explanatory
variables and a column vector of 1’s for the ith equation. The main explanatory
variables in my case are the environmental upgrades.
Following Cameron and Trivedi (2009), then stacking all observations, the model for
the thj equation is as follows: j jy j jX . The m equations are stacked in order to
give the SURE model, which is explained in the following matrix format:
1 1 1 1
2 2 2 2
0 0
0
0
0 0m m m m
y X
y X
y X
(1)
Which boils down to y X u .
(2)
Where y is the vector of observations on the dependent variables for the M-equations,
X is a matrix of observations on the explanatory variables, vector of parameters
for the M-equations is the vector of disturbances for the M-equations. There are a
few assumptions, that must be taken into account, the first is that the error term is
assumed to have zero mean, independent across individuals and homeoskedastic.
However, it is very much likely that for an individual the error terms are correlated
across equations with ' '( | )ij ij jjE X and '
' 0 whenjj j j .
It follows that the 1N error vectors , 1,......., ,j j m need to satisfy the
assumptions:
1). ( | ) 0jE X
2). '( | )j j jj NE X , where N is the identity matrix

444
3). ''
'( | ) ,j j jj NE X j j
For the whole system the vvariance-covaiance3 matrix of errors is :'( ) NE ,
Where the sigma matrix is an M x M matrix of variances and covariances for the M
individual equations ,
11 1
M1 MM
m
Where 11 is the variance of the errors in equation 1, 1m is the covariance of the
errors in equation 1 and equation m, etc
'( ) NE , where 'jj is an m m positive-definite matrix and
denotes the Kronecker product of the two matrices
There are four main estimators that can be applied to the same: OLS, GLS, FGLS,
iterated FGLS. This thesis will use the iterated FGLS which is explained below.
Using, 1 1
N
, because N , then the GLS is
1
' 1 ' 1( ) ( )GLS N NX X X y
(3)
With the VCE given by, 1
' 1Var( ) ( )NX X
The GLS is better than an OLS for this model, as GLS estimator is unbiased, efficient,
and the maximum likelihood estimator. GLS estimator is more precise than the OLS
estimator is that it uses the information about the non-spherical disturbances
contained in to obtain estimates of the parameters.
To make the GLS estimator a feasible estimator, you can use the sample of data to
obtain an estimate of the FGLS SUR estimator was developed by Zellner (1962,
1963). Estimation and inversion of the m x m matrix . The first step, the equations
are estimated using OLS, and the residuals m equations are used to estimate ,
using j j j jy X
and '
jj' ' /j j N
. After which the second step is
is
substituted for in equation (3) to obtain FGLS estimator, FGLS
.

445
Iterated SUR: this is referred to as Zellner’s iterated SUR (ISUR). The two FGLS
estimator steps are iterated until convergence is achieved, and there are benefits to
this process in finite samples (Cameron and Trivedi, 2009).
1.1 Use robust standard errors: bootstrap
Since standard errors reported in an iterated SUR are homoskedastic, this may not
always be reasonable even though logarithms have been taken (like I did for income)
and thus I use bootstrapping. The process of bootstrapping re-samples individuals
providing standard errors that are valid under ' , , '( | )ij ij i j jE u u X , and keeps the
assumption of independence over individuals (Cameron and Tridevi, 2009). This
improves the regression.
The Breusch-Pagan langrarge multiplier test
I also carry out the Breusch-Pagan test for error independence, which is computed
using a 2 (3) distribution. Here for instance 12 , which is the correlation of
equation 1 and 2, 12 11 2212 /
. If there is a statistical correlation between errors
in the equations, it means there is a possibility of endogeneity because there are
similar factors that affect all dependents. However, the strength of the correlation
matters, if the correlation is not strong then there are no particular efficiency gains
using the SUR, compared to linear regressions.
References
Cameron, A. C., & Trivedi, P. K. (2009). Microeconometrics using stata (Vol. 5). College
Station, TX: Stata press.
Roodman, D. (2015). CMP: Stata module to implement conditional (recursive) mixed
process estimator. Statistical software components.
Zellner A. (1962): An Efficient Method of Estimating Seemingly Unrelated
Regression Equations and Tests of Aggregation Bias, Journal of the American
Statistical Association, 57, 500-509.
Zellner A. (1963): Estimators for Seemingly Unrelated Regression Equations: Some
Finite Sample Results, Journal of the American Statistical Association, 58, 977-992
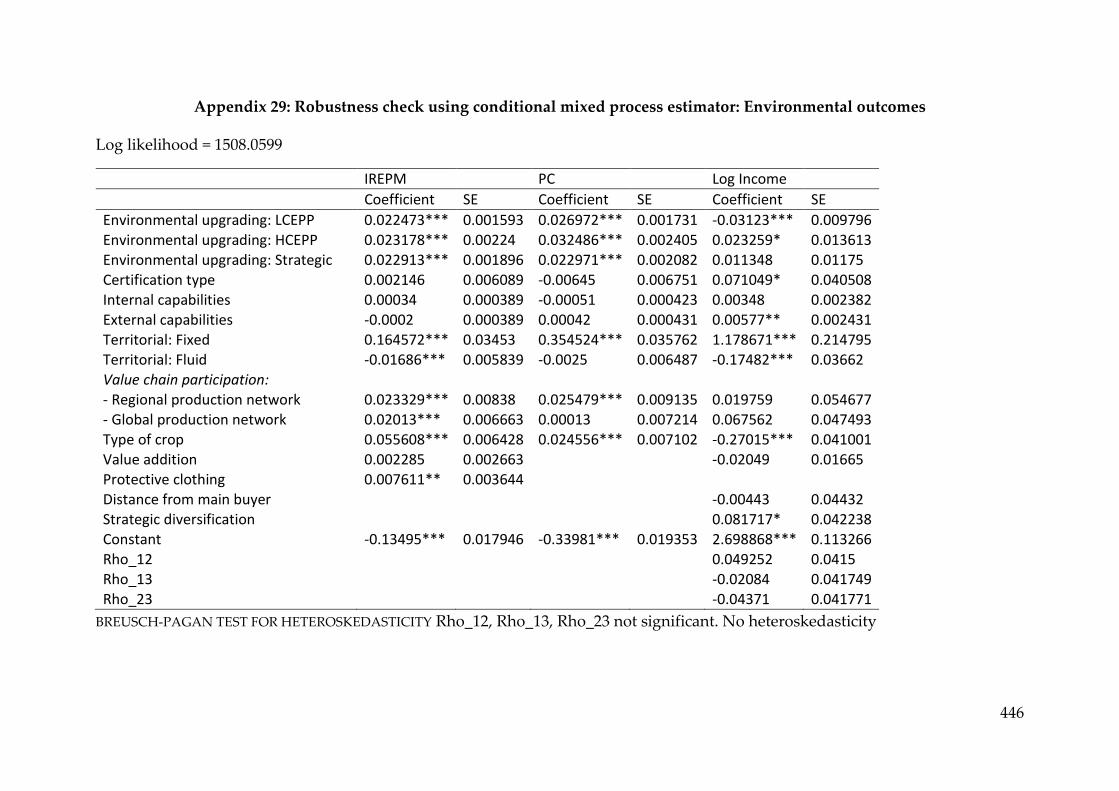
446
Appendix 29: Robustness check using conditional mixed process estimator: Environmental outcomes
Log likelihood = 1508.0599
IREPM PC Log Income
Coefficient SE Coefficient SE Coefficient SE
Environmental upgrading: LCEPP 0.022473*** 0.001593 0.026972*** 0.001731 -0.03123*** 0.009796
Environmental upgrading: HCEPP 0.023178*** 0.00224 0.032486*** 0.002405 0.023259* 0.013613 Environmental upgrading: Strategic 0.022913*** 0.001896 0.022971*** 0.002082 0.011348 0.01175 Certification type 0.002146 0.006089 -0.00645 0.006751 0.071049* 0.040508 Internal capabilities 0.00034 0.000389 -0.00051 0.000423 0.00348 0.002382 External capabilities -0.0002 0.000389 0.00042 0.000431 0.00577** 0.002431 Territorial: Fixed 0.164572*** 0.03453 0.354524*** 0.035762 1.178671*** 0.214795 Territorial: Fluid -0.01686*** 0.005839 -0.0025 0.006487 -0.17482*** 0.03662 Value chain participation:
- Regional production network 0.023329*** 0.00838 0.025479*** 0.009135 0.019759 0.054677 - Global production network 0.02013*** 0.006663 0.00013 0.007214 0.067562 0.047493 Type of crop 0.055608*** 0.006428 0.024556*** 0.007102 -0.27015*** 0.041001 Value addition 0.002285 0.002663
-0.02049 0.01665
Protective clothing 0.007611** 0.003644
Distance from main buyer
-0.00443 0.04432 Strategic diversification
0.081717* 0.042238
Constant -0.13495*** 0.017946 -0.33981*** 0.019353 2.698868*** 0.113266
Rho_12
0.049252 0.0415 Rho_13 -0.02084 0.041749 Rho_23 -0.04371 0.041771
BREUSCH-PAGAN TEST FOR HETEROSKEDASTICITY Rho_12, Rho_13, Rho_23 not significant. No heteroskedasticity

447
Appendix 30: Falsification tests for exclusion restrictions
Equation F test Prob>F
Beyond compliance 1.54 0.2028
log Income 2.23 0.1082
Appendix 31: Robustness test with normalized crop yields: Linear regression
Normalized Yield
Coefficient SE
Environmental upgrading
- LCEPP 0.017907*** 0.002164
- HCEPP 0.02675*** 0.002431
- Strategic 0.024998*** 0.002107
Certification type 0.002217 0.008384
Internal capabilities -0.00091* 0.000506
External capabilities 0.000637 0.000515
Territorial: Fixed 0.015998* 0.009298
Territorial: Fluid -0.01976*** 0.007185
Value chain participation:
- Regional production network 0.06304*** 0.010866
- Global production network 0.00081 0.009985
Type of crop 0.023512*** 0.00799
Value addition 0.02447*** 0.003463
Protective clothing 0.016477*** 0.004488
Strategic diversification -0.01831** 0.008134
Constant 0.289764*** 0.020982
R-sq 0.7203***
*** significant at 1%, ** significant at 5%, * significant at 10%
Yield is commonly used as an indicator for measuring improved environmental
outcomes. Thus, this thesis uses it as a robustness check. The co-efficient of CPP,
NPP and Strategic environmental upgrading w.r.t Normalized yield are quite close,
to the co-efficient of CPP, NPP and strategic w.r.t IRE and BC. Thus, IRE and BC are
valid and robust tools to measure environmental outcomes.
Appendix 32: Thresholds of environmental upgrading

448
*** significant at 1%, ** significant at 5%, * significant at 10% BREUSCH-PAGAN TEST FOR HETEROSKEDASTICITY: Rho_12 is significant. This suggests that heteroskedasticity
exists. The wald test shows that endogeneity also exists, between the covariates of the equation of IREPM and PC.
Environmental outcomes IREPM PC Log Income
Coefficient SE Coefficient SE Coefficient SE
Environmental upgrading LCEPP+HCEPP
25-50% 0.064694*** 0.011918 0.133207*** 0.013306 0.063301 0.066528
50-75% 0.125893*** 0.01343 0.194255*** 0.014996 -0.04392 0.075122
>75% 0.135231*** 0.019033 0.23424*** 0.021175 0.13298* 0.105903
Environmental upgrading Strategic
25-50% 0.044266*** 0.008446 0.036859*** 0.009454 0.014394 0.047373
50-75% 0.055543*** 0.010981 0.051782*** 0.012195 0.014587 0.061276
>75% 0.086406*** 0.01415 0.075859*** 0.015656 0.146559* 0.078924 Certification type 0.011132* 0.006732 0.00255 0.007508 0.057095 0.040098 Internal capabilities 0.00126*** 0.000412 0.000943** 0.000455 -0.00361 0.002279 External capabilities 0.001628*** 0.000399 0.001616*** 0.000446 -0.00571** 0.002241 Territorial: Fixed 0.459882*** 0.038201 0.709511*** 0.039728 0.828443*** 0.208186
Territorial: Fluid -0.02178*** 0.006505 -0.00934 0.007277 -0.19647*** 0.036509 - Regional production network 0.044927*** 0.009367 0.053296*** 0.010297 -0.03363 0.054818 - Global production network 0.020153*** 0.007397 0.001227 0.00809 0.064705 0.047214 Type of crop 0.068939*** 0.006766 0.037595*** 0.007565 -0.22293*** 0.038571 Value addition 0.002359 0.002855
-0.02109 0.016478
Protective clothing 0.011822*** 0.003925
Distance from main buyer
-0.01378 0.044463 Strategic diversification
0.095542** 0.041893
Constant -0.13444*** 0.023275 -0.35735*** 0.025544 2.693438*** 0.130757 Rho_12
0.246615*** 0.039239
Rho_13 -0.01209 0.041604 Rho_23 -0.05209 0.041859

449


