
RACIAL AND ETHNIC DISPARITIES IN SPECIAL EDUCATION A MULTI-YEAR DISPROPORTIONALITY ANALYSIS BY
STATE, ANALYSIS CATEGORY, AND
RACE/ETHNICITY
OFFICE OF SPECIAL EDUCATION AND REHABILITATIVE SERVICES
U. S. DEPARTMENT OF EDUCATION
FEBRUARY 2016

RACIAL AND ETHNIC DISPARITIES IN SPECIAL EDUCATION 1
CONTENTS
List of Tables ............................................................................................................................................................................... 2
Purpose......................................................................................................................................................................................... 4
Data and Methodology ........................................................................................................................................................... 5
Data......................................................................................................................................................................................... 5
Calculating and Intepreting Risk Ratios .................................................................................................................. 5
Calculating the Number and Percent of LEAs Exceeding ED’s Example Risk Ratio Thresholds ...... 7
Limitations .................................................................................................................................................................................. 8
How to Read the Tables ......................................................................................................................................................... 9
Tables ......................................................................................................................................................................................... 11

RACIAL AND ETHNIC DISPARITIES IN SPECIAL EDUCATION 2
LIST OF TABLES
Table 1. Percent and number of districts with a risk ratio that exceeds two median
absolute deviations (MADS) above the national median with a minimum cell size
of 10 for three years (2011–12, 2012–13, and 2013–14), by state and
race/ethnicity: All disabilities .................................................................................................................. 11
Table 3. Percent and number of districts with a risk ratio that exceeds two median
absolute deviations (MADS) above the national median with a minimum cell size
of 10 for three years (2011–12, 2012–13, and 2013–14), by state and
race/ethnicity: Speech or language impairment .............................................................................. 15
Table 5. Percent and number of districts with a risk ratio that exceeds two median
absolute deviations (MADs) above the national median with a minimum cell size
of 10 for three years (2011–12, 2012–13, and 2013–14), by state and
race/ethnicity: Intellectual disability .................................................................................................... 19
Table 6. Percent and number of districts with a risk ratio that exceeds two median
absolute deviations (MADs) above the national median with a minimum cell size
of 10 for three years (2011–12, 2012–13, and 2013–14), by state and
race/ethnicity: Other health impairment ............................................................................................ 21
Table 7. Percent and number of districts with a risk ratio that exceeds two median
absolute deviations (MADs) above the national median with a minimum cell size
of 10 for three years (2011–12, 2012–13, and 2013–14), by state and
race/ethnicity: Autism ................................................................................................................................. 23
Table 8. Percent and number of districts with a risk ratio that exceeds two median
absolute deviations (MADs) above the national median with a minimum cell size
of 10 for three years (2011–12, 2012–13, and 2013–14), by state and
race/ethnicity: Inside regular classroom 40 through 79 percent of the day ........................ 25
Table 9. Percent and number of districts with a risk ratio that exceeds two median
absolute deviations (MADs) above the national median with a minimum cell size
of 10 for three years (2011–12, 2012–13, and 2013–14), by state and
race/ethnicity: Inside regular classroom less than 40 percent of the day ............................. 27
Table 10. Percent and number of districts with a risk ratio that exceeds two median
absolute deviations (MADs) above the national median with a minimum cell size
of 10 for three years (2011–12, 2012–13, and 2013–14), by state and
race/ethnicity: Separate settings ............................................................................................................ 29
RACIAL AND ETHNIC DISPARITIES IN SPECIAL EDUCATION 3
Table 11. Percent and number of districts with a risk ratio that exceeds two median
absolute deviations (MADs) above the national median with a minimum cell size
of 10 for three years (2011–12, 2012–13, and 2013–14), by state and
race/ethnicity: In school suspensions: 10 days or less .................................................................. 31
Table 12. Percent and number of districts with a risk ratio that exceeds two median
absolute deviations (MADs) above the national median with a minimum cell size
of 10 for three years (2011–12, 2012–13, and 2013–14), by state and
race/ethnicity: In school suspensions: More than 10 days .......................................................... 33
Table 13. Percent and number of districts with a risk ratio that exceeds two median
absolute deviations (MADs) above the national median with a minimum cell size
of 10 for three years (2011–12, 2012–13, and 2013–14), by state and
race/ethnicity: Out-of-school suspensions/expulsions: 10 days or less ................................ 35
Table 14. Percent and number of districts with a risk ratio that exceeds two median
absolute deviations (MADs) above the national median with a minimum cell size
of 10 for three years (2011–12, 2012–13, and 2013–14), by state and
race/ethnicity: Out-of-school suspensions/expulsions: More than 10 days ........................ 37
Table 15. Percent and number of districts with a risk ratio that exceeds two median
absolute deviations (MADs) above the national median with a minimum cell size
of 10 for three years (2011–12, 2012–13, and 2013–14), by state and
race/ethnicity: Total removals ................................................................................................................. 39

RACIAL AND ETHNIC DISPARITIES IN SPECIAL EDUCATION 4
PURPOSE
Under Part B of the Individuals with Disabilities Education Act (IDEA), states must collect and
examine data to determine whether significant disproportionality on the basis of race and ethnicity
is occurring in the state, or its school districts, with respect to the identification, placement, and
discipline of students with disabilities. To ensure compliance with this provision of IDEA, the
U.S. Department of Education (ED) has proposed rules—for public comment—that would require all
states to use a standard methodology to identify significant disproportionality. Under this standard
approach, states would analyze racial and ethnic disparities using a risk ratio, and select a
reasonable risk ratio threshold to determine when racial and ethnic disparities have become
significant. ED published in its Notice of Proposed Rulemaking a set of example risk ratio
thresholds, based on two median absolute deviations (MADs) above the national median of local
educational agencies (LEA) risk ratios.
The purpose of this document is to provide the public with a set of tables showing the number and
percentage of school districts that would be identified with significant disproportionality if ED’s
example risk ratio thresholds were adopted by all 50 states and the District of Columbia. The tables
detail the number and percent of LEAs in each state with a risk ratio that exceeds two MADs above
the national median, with a minimum cell size of 10 students for three consecutive years (2011–12,
2012–13, and 2013–14), within each race/ethnicity and specific category (i.e., identification of
students with specific learning disabilities, total number of disciplinary removals, separate settings,
etc.). In addition to providing information on the methodology and limitations of the data, this
document will also assist the reader in understanding how to read the tables.

RACIAL AND ETHNIC DISPARITIES IN SPECIAL EDUCATION 5
DATA AND METHODOLOGY
DATA
For the purposes of these tables, LEA-level data from the 50 states were extracted from the EdFacts
Data Warehouse from June 25–26, 2015.1 The data encompassed school years 2011–12, 2012–13,
and 2013–14 and included counts of children receiving special education services by disability
category and race/ethnicity, counts of children in specific educational environments by
race/ethnicity, counts of total disciplinary removals by race/ethnicity, counts of children who were
subject to in-school or out of school suspensions and expulsions by race/ethnicity, and enrollments
of public school students by race/ethnicity. Unlike the state-level data files, these LEA-level data
files do not undergo data quality procedures. Problems stemming from this issue are discussed
more fully in the “Limitations” section.
CALCULATING AND INTERPRETING RISK RATIOS
The risk ratio tells us how the risk for one racial/ethnic group compares to the risk for a
comparison group. The risk ratio calculation varies slightly depending upon the type of data being
analyzed, but in all cases the risk of the racial/ethnic group in questions is divided by the risk of the
comparison group. For this analysis, risk ratios were calculated for each race/ethnicity and category
combination with a minimum cell size of 10 (meaning there were at least 10 students for a
race/ethnicity and category combination).
Risk for the racial/ethnic group is calculated by:
(a) dividing the number of children from a racial/ethnic group in a category (i.e., identification,
educational environments or discipline) by the number of enrolled public school children
from that racial/ethnic group (for identification) or the number of children with disabilities
from that racial/ethnic group (for educational environments and discipline), then
(b) multiplying by 100.
Risk for the comparison group is calculated by:
(a) dividing the number of children from all other racial/ethnic groups in a category
(i.e., identification, educational environments or discipline) by the number of enrolled children
from all other racial/ethnic groups (for identification) or the number of children with disabilities
from all other racial/ethnic groups (for educational environments and discipline), then
(b) multiplying by 100.
1 Please see file specifications C002, C089, C006 and C052 at http://www2.ed.gov/about/inits/ed/edfacts/file-specifications.html for additional information.

RACIAL AND ETHNIC DISPARITIES IN SPECIAL EDUCATION 6
In this calculation, ‘all other children,’ means those who are not in the racial/ethnic group of interest
(e.g., if analyzing data for Black or African American children, ‘all other children’ would be those
children who are not Black or African American).
A risk ratio greater than 1.0 or a racial/ethnic group indicates overrepresentation, while a risk ratio
less than 1.0 indicates underrepresentation.
The following is an example of how to read a risk ratio:
A risk ratio of 3.0 for the identification of Black students with emotional disturbance
indicates that Black students are 3.0 times as likely as their non-Black peers to be
identified with emotional disturbance.
The following is an example of how to read ED’s example risk ratio thresholds:
Based on ED example risk ratio thresholds, a district may be identified with significant
disproportionality if any racial or ethnic group is placed in separate settings at a rate
2.126 times that of their peers not in that racial or ethnic group.
RACIAL AND ETHNIC DISPARITIES IN SPECIAL EDUCATION 7
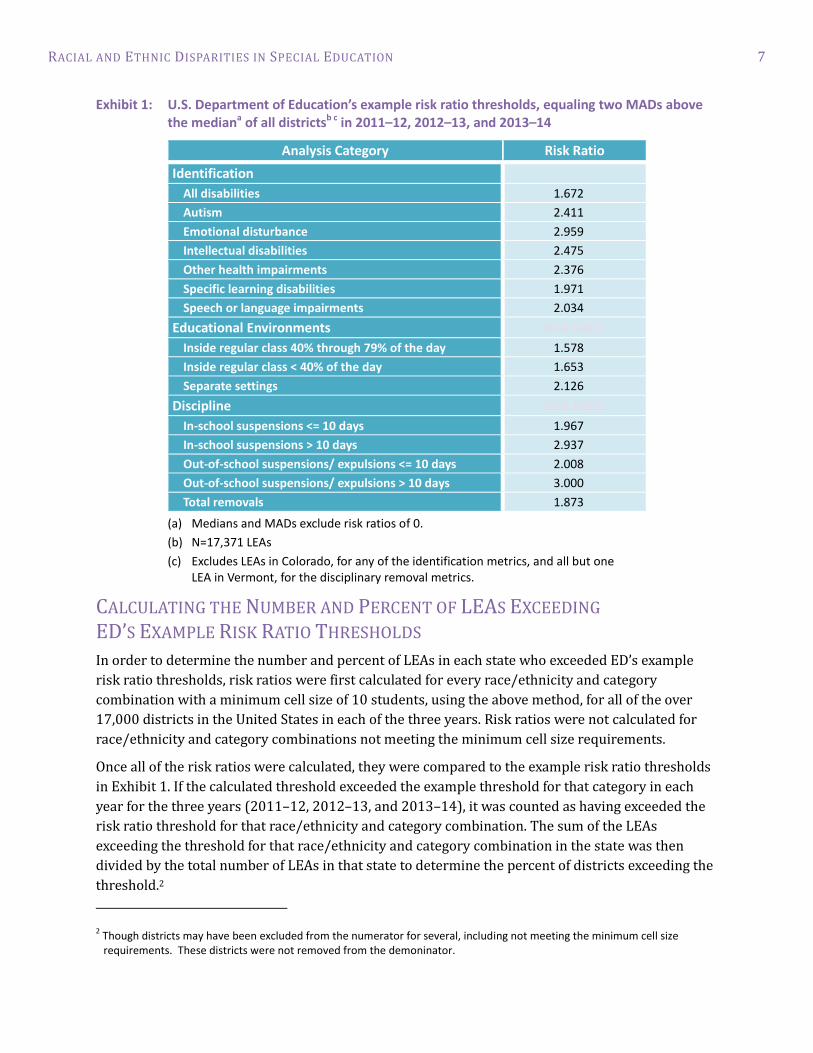
Exhibit 1: U.S. Department of Education’s example risk ratio thresholds, equaling two MADs above the mediana of all districtsb c in 2011–12, 2012–13, and 2013–14
Analysis Category Risk Ratio
Identification
All disabilities 1.672
Autism 2.411
Emotional disturbance 2.959
Intellectual disabilities 2.475
Other health impairments 2.376
Specific learning disabilities 1.971
Speech or language impairments 2.034
Educational Environments Risk Ratio
Inside regular class 40% through 79% of the day 1.578
Inside regular class < 40% of the day 1.653
Separate settings 2.126
Discipline Risk Ratio
In-school suspensions <= 10 days 1.967
In-school suspensions > 10 days 2.937
Out-of-school suspensions/ expulsions <= 10 days 2.008
Out-of-school suspensions/ expulsions > 10 days 3.000
Total removals 1.873
(a) Medians and MADs exclude risk ratios of 0.
(b) N=17,371 LEAs
(c) Excludes LEAs in Colorado, for any of the identification metrics, and all but one LEA in Vermont, for the disciplinary removal metrics.
CALCULATING THE NUMBER AND PERCENT OF LEAS EXCEEDING ED’S EXAMPLE RISK RATIO THRESHOLDS
In order to determine the number and percent of LEAs in each state who exceeded ED’s example
risk ratio thresholds, risk ratios were first calculated for every race/ethnicity and category
combination with a minimum cell size of 10 students, using the above method, for all of the over
17,000 districts in the United States in each of the three years. Risk ratios were not calculated for
race/ethnicity and category combinations not meeting the minimum cell size requirements.
Once all of the risk ratios were calculated, they were compared to the example risk ratio thresholds
in Exhibit 1. If the calculated threshold exceeded the example threshold for that category in each
year for the three years (2011–12, 2012–13, and 2013–14), it was counted as having exceeded the
risk ratio threshold for that race/ethnicity and category combination. The sum of the LEAs
exceeding the threshold for that race/ethnicity and category combination in the state was then
divided by the total number of LEAs in that state to determine the percent of districts exceeding the
threshold.2
2 Though districts may have been excluded from the numerator for several, including not meeting the minimum cell size requirements. These districts were not removed from the demoninator.

RACIAL AND ETHNIC DISPARITIES IN SPECIAL EDUCATION 8
LIMITATIONS
As is often the case with large scale data analyses, there are limitations pertaining to certain aspects
of the data and caution in interpreting the results should therefore be exercised. First and foremost,
these LEA-level data used in this analysis did not undergo data quality procedures and therefore are
not subjected to the same level of scrutiny (i.e., edit checks, analysis of and accounting for year to
year changes, etc.) as the state-level data. As such, the overall quality and accuracy of these data is
unknown.
Another limitation to interpreting these data is the large number of LEAs excluded from at least one
analysis for methodological reasons. For nearly all states, there are districts not included in an
analysis because they were included in one data file used to calculate the risk ratios but were not
included in the other data file (e.g., for the identification analysis a district was included in the child
count file used for the numerators of the risk calculations, but not in the enrollment file used for the
denominators of the risk calculations). For two states this was an extensive issue, leading to several
categories in which risk ratios could not be calculated for any LEAs. Overall, 6,303 LEAs (36.3%)
were not included in at least one analysis category because they were included in one data file used
to calculate the risk ratios but were not included in the other data file.
In addition to exclusions due to missing data, there are districts not included in an least one analysis
because the number of children in the numerator for the risk calculation was greater than the
number of children in the denominator (e.g., 10 White children enrolled in the district and 12 White
children with disabilities in the district). This issue impacted 2,593 LEAs (14.9%).
Finally, though not necessarily a limitation, a majority of LEAs have risk ratios for some category
and race/ethnicity combination of 0.00. Specifically, 13,846 LEAs (79.71%) of LEAs had a risk ratio
of 0.00 in at least one race/ethnicity in at least one disability, educational environment, or discipline
category in any of the three years (2011–12, 2012–13, and 2013–14). This is particularly prevalent
in the discipline analysis categories because of the small numbers of children experiencing those
disciplinary actions.
RACIAL AND ETHNIC DISPARITIES IN SPECIAL EDUCATION 9
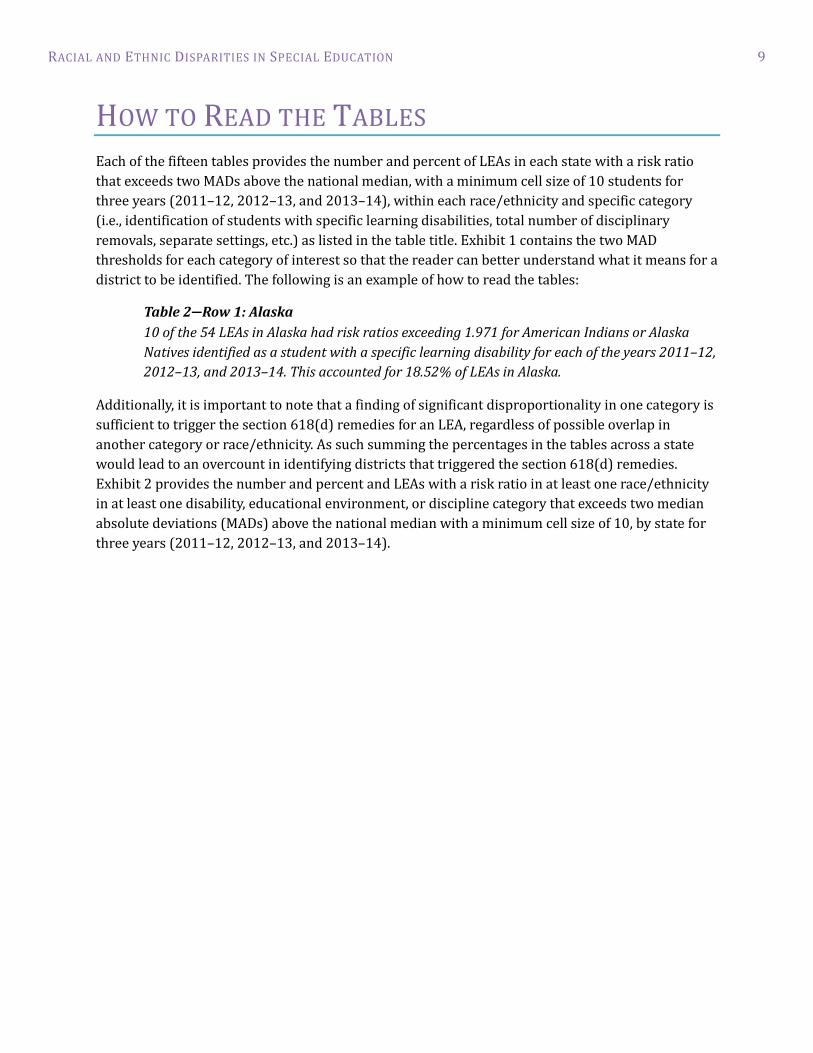
HOW TO READ THE TABLES
Each of the fifteen tables provides the number and percent of LEAs in each state with a risk ratio
that exceeds two MADs above the national median, with a minimum cell size of 10 students for
three years (2011–12, 2012–13, and 2013–14), within each race/ethnicity and specific category
(i.e., identification of students with specific learning disabilities, total number of disciplinary
removals, separate settings, etc.) as listed in the table title. Exhibit 1 contains the two MAD
thresholds for each category of interest so that the reader can better understand what it means for a
district to be identified. The following is an example of how to read the tables:
Table 2—Row 1: Alaska
10 of the 54 LEAs in Alaska had risk ratios exceeding 1.971 for American Indians or Alaska
Natives identified as a student with a specific learning disability for each of the years 2011–12,
2012–13, and 2013–14. This accounted for 18.52% of LEAs in Alaska.
Additionally, it is important to note that a finding of significant disproportionality in one category is
sufficient to trigger the section 618(d) remedies for an LEA, regardless of possible overlap in
another category or race/ethnicity. As such summing the percentages in the tables across a state
would lead to an overcount in identifying districts that triggered the section 618(d) remedies.
Exhibit 2 provides the number and percent and LEAs with a risk ratio in at least one race/ethnicity
in at least one disability, educational environment, or discipline category that exceeds two median
absolute deviations (MADs) above the national median with a minimum cell size of 10, by state for
three years (2011–12, 2012–13, and 2013–14).

RACIAL AND ETHNIC DISPARITIES IN SPECIAL EDUCATION 10
Exhibit 2: Percent and Number of Districts with a Risk Ratio in At Least One Race/Ethnicity in at Least One Disability, Educational Environment, or Discipline Category that Exceeds Two Median Absolute Deviations (MADs) Above the National Median with a Minimum Cell Size of 10, by State for Three Years (2011–12, 2012–13, and 2013–14)1
State
Percent and number of districts meeting the example thresholds for three years
Total number of districts in state
AK 51.9% (28) 54
AL 58.5% (103) 176
AR 57.3% (160) 279
AZ 30.5% (209) 685
CA 60.6% (638) 1,052
CO 6.1% (15) 245
CT 61.9% (122) 197
DC 14.3% (9) 63
DE 44.2% (19) 43
FL 81.3% (61) 75
GA 67.0% (136) 203
HI 100.0% (1) 1
IA 24.4% (87) 357
ID 41.2% (63) 153
IL 55% (483) 878
IN 55.0% (216) 393
KS 47.4% (139) 293
KY 65.3% (115) 176
LA 52.8% (76) 144
MA 61.5% (257) 418
MD 84.0% (21) 25
ME 22.8% (59) 259
MI 45.2% (420) 930
MN 43.0% (231) 537
MO 34.7% (199) 573
MS 69.3% (113) 163
State
Percent and number of districts meeting the example thresholds for three years
Total number of districts in state
MT 14.9% (63) 422
NC 52.0% (130) 250
ND 15.8% (29) 184
NE 28.9% (81) 280
NH 34.8% (62) 178
NJ 59.3% (410) 691
NM 38.7% (58) 150
NV 78.9% (15) 19
NY 48.7% (491) 1,008
OH 40.6% (447) 1,100
OK 48.5% (267) 550
OR 47.1% (98) 208
PA 45.8% (338) 738
RI 57.9% (33) 57
SC 63.3% (69) 109
SD 34.0% (53) 156
TN 65.5% (93) 142
TX 8.2% (731) 1,256
UT 39.4% (52) 132
VA 72.8% (110) 151
VT 8.6% (29) 339
WA 60% (183) 305
WI 61% (278) 456
WV 49.1% (28) 57
WY 32.8% (20) 61
National 46.9% (8,148) 17,371 1Medians and MADs exclude risk ratios of 0.

RACIAL AND ETHNIC DISPARITIES IN SPECIAL EDUCATION 11
TABLES Table 1. Percent and number of districts with a risk ratio that exceeds two median absolute deviations (MADS) above the national median with a
minimum cell size of 10 for three years (2011–12, 2012–13, and 2013–14), by state and race/ethnicity: All disabilities1
State
Total number of districts
American Indian or Alaska Native: Number
American Indian or Alaska Native: Percent
Asian: Number
Asian: Percent
Black or African American: Number
Black or African American: Percent
Hispanic/Latino: Number
Hispanic/Latino: Percent
Native Hawaiian or Other Pacific Islander: Number
Native Hawaiian or Other Pacific Islander: Percent
Two or more races: Number
Two or more races: Percent
White: Number
White: Percent
AK 54 14 25.93 0 0.00 2 3.70 0 0.00 0 0.00 0 0.00 1 1.85
AL 176 4 2.27 0 0.00 17 9.66 1 0.57 0 0.00 0 0.00 5 2.84
AR 279 8 2.87 0 0.00 25 8.96 1 0.36 0 0.00 5 1.79 11 3.94
AZ 685 28 4.09 2 0.29 13 1.90 9 1.31 1 0.15 2 0.29 23 3.36
CA 1,052 47 4.47 3 0.29 149 14.16 43 4.09 8 0.76 47 4.47 66 6.27
CO 245 0 0.00 0 0.00 0 0.00 0 0.00 0 0.00 0 0.00 0 0.00
CT 197 6 3.05 1 0.51 36 18.27 12 6.09 0 0.00 1 0.51 1 0.51
DC 63 0 0.00 0 0.00 4 6.35 0 0.00 0 0.00 0 0.00 0 0.00
DE 43 1 2.33 0 0.00 5 11.63 0 0.00 0 0.00 0 0.00 1 2.33
FL 75 2 2.67 0 0.00 2 2.67 0 0.00 0 0.00 0 0.00 1 1.33
GA 203 6 2.96 0 0.00 17 8.37 1 0.49 1 0.49 3 1.48 1 0.49
HI 1 0 0.00 0 0.00 0 0.00 0 0.00 0 0.00 0 0.00 0 0.00
IA 357 5 1.40 3 0.84 27 7.56 28 7.84 0 0.00 13 3.64 7 1.96
ID 153 6 3.92 1 0.65 6 3.92 5 3.27 0 0.00 1 0.65 6 3.92
IL 878 9 1.03 1 0.11 134 15.26 8 0.91 2 0.23 33 3.76 47 5.35
IN 393 12 3.05 0 0.00 11 2.80 2 0.51 0 0.00 5 1.27 10 2.54
KS 293 6 2.05 4 1.37 19 6.48 8 2.73 0 0.00 14 4.78 5 1.71
KY 176 2 1.14 1 0.57 11 6.25 2 1.14 0 0.00 4 2.27 7 3.98
LA 144 2 1.39 1 0.69 4 2.78 1 0.69 0 0.00 0 0.00 1 0.69
MA 418 4 0.96 2 0.48 46 11.00 26 6.22 0 0.00 7 1.67 13 3.11
MD 25 1 4.00 0 0.00 5 20.00 0 0.00 0 0.00 0 0.00 0 0.00
ME 259 4 1.54 0 0.00 8 3.09 7 2.70 0 0.00 1 0.39 0 0.00
MI 930 34 3.66 4 0.43 65 6.99 19 2.04 0 0.00 20 2.15 20 2.15
MN 537 36 6.70 5 0.93 31 5.77 24 4.47 0 0.00 11 2.05 11 2.05
MO 573 12 2.09 2 0.35 22 3.84 7 1.22 0 0.00 4 0.70 13 2.27

RACIAL AND ETHNIC DISPARITIES IN SPECIAL EDUCATION 12
State
Total number of districts
American Indian or Alaska Native: Number
American Indian or Alaska Native: Percent
Asian: Number
Asian: Percent
Black or African American: Number
Black or African American: Percent
Hispanic/Latino: Number
Hispanic/Latino: Percent
Native Hawaiian or Other Pacific Islander: Number
Native Hawaiian or Other Pacific Islander: Percent
Two or more races: Number
Two or more races: Percent
White: Number
White: Percent
MS 163 4 2.45 1 0.61 0 0.00 2 1.23 0 0.00 1 0.61 22 13.50
MT 422 21 4.98 0 0.00 4 0.95 5 1.18 0 0.00 3 0.71 0 0.00
NC 250 3 1.20 0 0.00 21 8.40 3 1.20 1 0.40 2 0.80 6 2.40
ND 184 9 4.89 0 0.00 2 1.09 2 1.09 0 0.00 1 0.54 2 1.09
NE 280 4 1.43 3 1.07 3 1.07 6 2.14 0 0.00 1 0.36 8 2.86
NH 178 0 0.00 0 0.00 8 4.49 4 2.25 0 0.00 0 0.00 23 12.92
NJ 691 3 0.43 1 0.14 67 9.70 26 3.76 0 0.00 5 0.72 38 5.50
NM 150 2 1.33 1 0.67 3 2.00 7 4.67 0 0.00 1 0.67 4 2.67
NV 19 4 21.05 0 0.00 2 10.53 0 0.00 0 0.00 0 0.00 0 0.00
NY 1,008 14 1.39 3 0.30 135 13.39 34 3.37 0 0.00 7 0.69 20 1.98
OH 1,100 3 0.27 3 0.27 66 6.00 13 1.18 1 0.09 23 2.09 24 2.18
OK 550 15 2.73 0 0.00 41 7.45 7 1.27 1 0.18 4 0.73 58 10.55
OR 208 13 6.25 0 0.00 8 3.85 2 0.96 0 0.00 1 0.48 4 1.92
PA 738 6 0.81 1 0.14 79 10.70 8 1.08 0 0.00 3 0.41 15 2.03
RI 57 7 12.28 0 0.00 12 21.05 1 1.75 0 0.00 1 1.75 3 5.26
SC 109 2 1.83 1 0.92 1 0.92 0 0.00 0 0.00 0 0.00 3 2.75
SD 156 31 19.87 2 1.28 1 0.64 0 0.00 0 0.00 1 0.64 0 0.00
TN 142 7 4.93 0 0.00 9 6.34 1 0.70 0 0.00 1 0.70 0 0.00
TX 1,256 23 1.83 2 0.16 171 13.61 35 2.79 3 0.24 24 1.91 37 2.95
UT 132 9 6.82 0 0.00 9 6.82 1 0.76 0 0.00 0 0.00 1 0.76
VA 151 6 3.97 0 0.00 18 11.92 1 0.66 1 0.66 1 0.66 2 1.32
VT 339 0 0.00 0 0.00 7 2.06 2 0.59 0 0.00 0 0.00 12 3.54
WA 305 56 18.36 3 0.98 20 6.56 8 2.62 3 0.98 2 0.66 5 1.64
WI 456 29 6.36 5 1.10 75 16.45 22 4.82 0 0.00 7 1.54 5 1.10
WV 57 0 0.00 0 0.00 4 7.02 1 1.75 0 0.00 0 0.00 1 1.75
WY 61 3 4.92 0 0.00 1 1.64 1 1.64 0 0.00 0 0.00 0 0.00
Total 17,371 523 3.01 56 0.32 1426 8.21 396 2.28 22 0.13 260 1.50 543 3.13 1Medians and MADs exclude risk ratios of 0.

RACIAL AND ETHNIC DISPARITIES IN SPECIAL EDUCATION 13
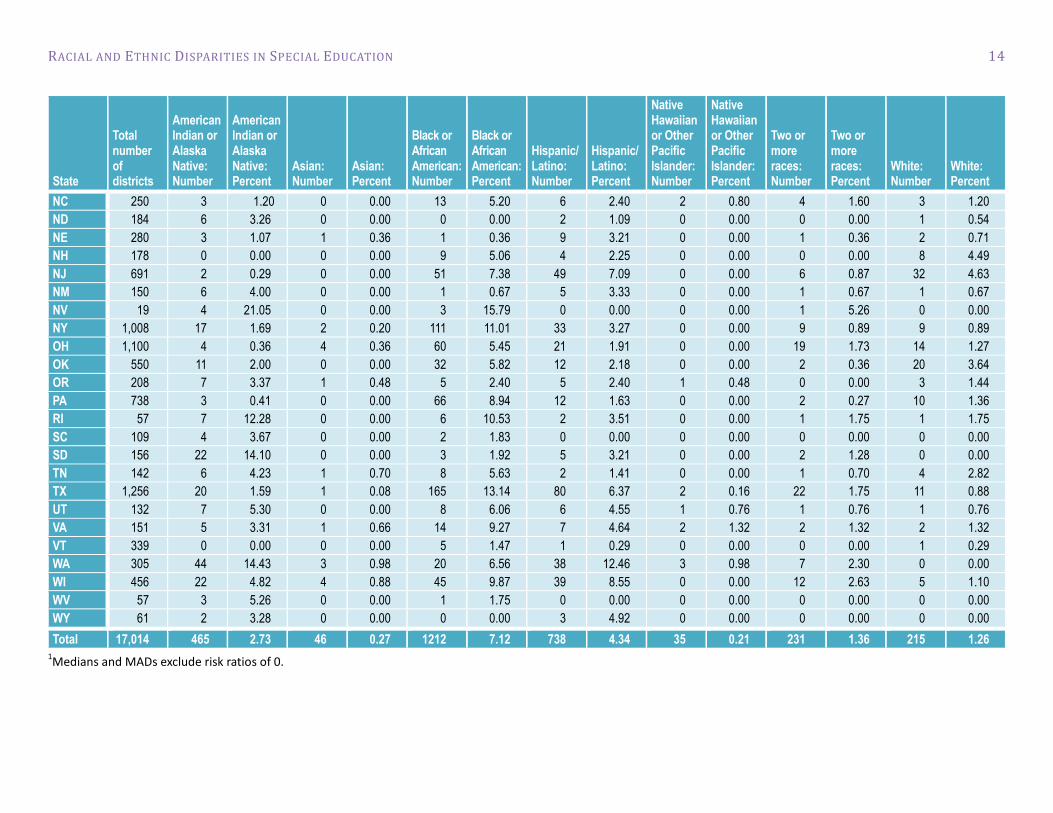
Table 2. Percent and number of districts with a risk ratio that exceeds two median absolute deviations (MADS) above the national median with a minimum cell size of 10 for three years (2011–12, 2012–13, and 2013–14), by state and race/ethnicity: Specific learning disabilities1
State
Total number of districts
American Indian or Alaska Native: Number
American Indian or Alaska Native: Percent
Asian: Number
Asian: Percent
Black or African American: Number
Black or African American: Percent
Hispanic/Latino: Number
Hispanic/Latino: Percent
Native Hawaiian or Other Pacific Islander: Number
Native Hawaiian or Other Pacific Islander: Percent
Two or more races: Number
Two or more races: Percent
White: Number
White: Percent
AK 54 10 18.52 0 0.00 2 3.70 0 0.00 0 0.00 1 1.85 1 1.85
AL 176 2 1.14 0 0.00 35 19.89 5 2.84 1 0.57 2 1.14 0 0.00
AR 279 8 2.87 2 0.72 22 7.89 10 3.58 1 0.36 6 2.15 3 1.08
AZ 685 24 3.50 1 0.15 10 1.46 16 2.34 0 0.00 3 0.44 4 0.58
CA 1,052 48 4.56 1 0.10 124 11.79 113 10.74 13 1.24 26 2.47 21 2.00
CO 245 0 0.00 0 0.00 0 0.00 0 0.00 0 0.00 0 0.00 0 0.00
CT 197 10 5.08 0 0.00 30 15.23 11 5.58 0 0.00 4 2.03 1 0.51
DC 63 0 0.00 0 0.00 2 3.17 0 0.00 0 0.00 0 0.00 0 0.00
DE 43 2 4.65 0 0.00 5 11.63 0 0.00 0 0.00 0 0.00 0 0.00
FL 75 5 6.67 0 0.00 1 1.33 0 0.00 0 0.00 0 0.00 1 1.33
GA 203 7 3.45 2 0.99 12 5.91 3 1.48 3 1.48 5 2.46 6 2.96
HI 1 0 0.00 0 0.00 0 0.00 0 0.00 1 100.00 0 0.00 0 0.00
ID 153 6 3.92 1 0.65 3 1.96 12 7.84 0 0.00 2 1.31 0 0.00
IL 878 12 1.37 3 0.34 106 12.07 44 5.01 2 0.23 24 2.73 14 1.59
IN 393 13 3.31 2 0.51 10 2.54 10 2.54 0 0.00 3 0.76 4 1.02
KS 293 7 2.39 2 0.68 17 5.80 13 4.44 0 0.00 10 3.41 1 0.34
KY 176 2 1.14 1 0.57 14 7.95 7 3.98 0 0.00 9 5.11 2 1.14
LA 144 2 1.39 0 0.00 22 15.28 3 2.08 0 0.00 0 0.00 0 0.00
MA 418 8 1.91 4 0.96 31 7.42 18 4.31 0 0.00 5 1.20 9 2.15
MD 25 2 8.00 0 0.00 2 8.00 0 0.00 0 0.00 0 0.00 0 0.00
ME 259 5 1.93 0 0.00 9 3.47 3 1.16 0 0.00 2 0.77 1 0.39
MI 930 29 3.12 2 0.22 73 7.85 29 3.12 1 0.11 22 2.37 6 0.65
MN 537 18 3.35 5 0.93 26 4.84 70 13.04 1 0.19 9 1.68 1 0.19
MO 573 10 1.75 1 0.17 22 3.84 11 1.92 0 0.00 1 0.17 6 1.05
MS 163 5 3.07 1 0.61 4 2.45 8 4.91 0 0.00 0 0.00 6 3.68
MT 422 22 5.21 0 0.00 1 0.24 11 2.61 1 0.24 4 0.95 0 0.00
RACIAL AND ETHNIC DISPARITIES IN SPECIAL EDUCATION 14
State
Total number of districts
American Indian or Alaska Native: Number
American Indian or Alaska Native: Percent
Asian: Number
Asian: Percent
Black or African American: Number
Black or African American: Percent
Hispanic/Latino: Number
Hispanic/Latino: Percent
Native Hawaiian or Other Pacific Islander: Number
Native Hawaiian or Other Pacific Islander: Percent
Two or more races: Number
Two or more races: Percent
White: Number
White: Percent
NC 250 3 1.20 0 0.00 13 5.20 6 2.40 2 0.80 4 1.60 3 1.20
ND 184 6 3.26 0 0.00 0 0.00 2 1.09 0 0.00 0 0.00 1 0.54
NE 280 3 1.07 1 0.36 1 0.36 9 3.21 0 0.00 1 0.36 2 0.71
NH 178 0 0.00 0 0.00 9 5.06 4 2.25 0 0.00 0 0.00 8 4.49
NJ 691 2 0.29 0 0.00 51 7.38 49 7.09 0 0.00 6 0.87 32 4.63
NM 150 6 4.00 0 0.00 1 0.67 5 3.33 0 0.00 1 0.67 1 0.67
NV 19 4 21.05 0 0.00 3 15.79 0 0.00 0 0.00 1 5.26 0 0.00
NY 1,008 17 1.69 2 0.20 111 11.01 33 3.27 0 0.00 9 0.89 9 0.89
OH 1,100 4 0.36 4 0.36 60 5.45 21 1.91 0 0.00 19 1.73 14 1.27
OK 550 11 2.00 0 0.00 32 5.82 12 2.18 0 0.00 2 0.36 20 3.64
OR 208 7 3.37 1 0.48 5 2.40 5 2.40 1 0.48 0 0.00 3 1.44
PA 738 3 0.41 0 0.00 66 8.94 12 1.63 0 0.00 2 0.27 10 1.36
RI 57 7 12.28 0 0.00 6 10.53 2 3.51 0 0.00 1 1.75 1 1.75
SC 109 4 3.67 0 0.00 2 1.83 0 0.00 0 0.00 0 0.00 0 0.00
SD 156 22 14.10 0 0.00 3 1.92 5 3.21 0 0.00 2 1.28 0 0.00
TN 142 6 4.23 1 0.70 8 5.63 2 1.41 0 0.00 1 0.70 4 2.82
TX 1,256 20 1.59 1 0.08 165 13.14 80 6.37 2 0.16 22 1.75 11 0.88
UT 132 7 5.30 0 0.00 8 6.06 6 4.55 1 0.76 1 0.76 1 0.76
VA 151 5 3.31 1 0.66 14 9.27 7 4.64 2 1.32 2 1.32 2 1.32
VT 339 0 0.00 0 0.00 5 1.47 1 0.29 0 0.00 0 0.00 1 0.29
WA 305 44 14.43 3 0.98 20 6.56 38 12.46 3 0.98 7 2.30 0 0.00
WI 456 22 4.82 4 0.88 45 9.87 39 8.55 0 0.00 12 2.63 5 1.10
WV 57 3 5.26 0 0.00 1 1.75 0 0.00 0 0.00 0 0.00 0 0.00
WY 61 2 3.28 0 0.00 0 0.00 3 4.92 0 0.00 0 0.00 0 0.00
Total 17,014 465 2.73 46 0.27 1212 7.12 738 4.34 35 0.21 231 1.36 215 1.26 1Medians and MADs exclude risk ratios of 0.

RACIAL AND ETHNIC DISPARITIES IN SPECIAL EDUCATION 15
Table 3. Percent and number of districts with a risk ratio that exceeds two median absolute deviations (MADS) above the national median with a minimum cell size of 10 for three years (2011–12, 2012–13, and 2013–14), by state and race/ethnicity: Speech or language impairment1
State
Total number of districts
American Indian or Alaska Native: Number
American Indian or Alaska Native: Percent
Asian: Number
Asian: Percent
Black or African American: Number
Black or African American: Percent
Hispanic/Latino: Number
Hispanic/Latino: Percent
Native Hawaiian or Other Pacific Islander: Number
Native Hawaiian or Other Pacific Islander: Percent
Two or more races: Number
Two or more races: Percent
White: Number
White: Percent
AK 54 5 9.26 0 0.00 0 0.00 1 1.85 0 0.00 1 1.85 1 1.85
AL 176 3 1.70 4 2.27 1 0.57 2 1.14 0 0.00 4 2.27 12 6.82
AR 279 4 1.43 3 1.08 4 1.43 7 2.51 0 0.00 6 2.15 5 1.79
AZ 685 9 1.31 6 0.88 9 1.31 8 1.17 2 0.29 2 0.29 7 1.02
CA 1,052 23 2.19 10 0.95 20 1.90 25 2.38 18 1.71 28 2.66 23 2.19
CO 245 0 0.00 0 0.00 0 0.00 0 0.00 0 0.00 0 0.00 0 0.00
CT 197 4 2.03 14 7.11 21 10.66 25 12.69 1 0.51 4 2.03 0 0.00
DC 63 0 0.00 0 0.00 0 0.00 2 3.17 0 0.00 0 0.00 0 0.00
DE 43 2 4.65 0 0.00 0 0.00 0 0.00 0 0.00 1 2.33 1 2.33
FL 75 2 2.67 0 0.00 0 0.00 2 2.67 0 0.00 0 0.00 2 2.67
GA 203 2 0.99 4 1.97 2 0.99 1 0.49 2 0.99 8 3.94 14 6.90
HI 1 0 0.00 0 0.00 0 0.00 0 0.00 0 0.00 0 0.00 1 100.00
ID 153 6 3.92 3 1.96 3 1.96 3 1.96 0 0.00 1 0.65 2 1.31
IL 878 7 0.80 14 1.59 12 1.37 16 1.82 2 0.23 27 3.08 22 2.51
IN 393 5 1.27 4 1.02 4 1.02 8 2.04 1 0.25 12 3.05 4 1.02
KS 293 3 1.02 7 2.39 1 0.34 8 2.73 0 0.00 7 2.39 6 2.05
KY 176 1 0.57 5 2.84 0 0.00 3 1.70 1 0.57 3 1.70 4 2.27
LA 144 4 2.78 3 2.08 1 0.69 1 0.69 0 0.00 0 0.00 5 3.47
MA 418 4 0.96 16 3.83 45 10.77 49 11.72 2 0.48 17 4.07 2 0.48
MD 25 1 4.00 2 8.00 0 0.00 0 0.00 0 0.00 0 0.00 0 0.00
ME 259 2 0.77 4 1.54 7 2.70 6 2.32 0 0.00 6 2.32 0 0.00
MI 930 17 1.83 19 2.04 17 1.83 25 2.69 0 0.00 17 1.83 5 0.54
MN 537 8 1.49 16 2.98 8 1.49 7 1.30 2 0.37 7 1.30 2 0.37
MO 573 11 1.92 3 0.52 6 1.05 15 2.62 1 0.17 5 0.87 10 1.75
MS 163 2 1.23 0 0.00 0 0.00 1 0.61 0 0.00 3 1.84 33 20.25
MT 422 8 1.90 1 0.24 1 0.24 2 0.47 0 0.00 2 0.47 0 0.00

RACIAL AND ETHNIC DISPARITIES IN SPECIAL EDUCATION 16
State
Total number of districts
American Indian or Alaska Native: Number
American Indian or Alaska Native: Percent
Asian: Number
Asian: Percent
Black or African American: Number
Black or African American: Percent
Hispanic/Latino: Number
Hispanic/Latino: Percent
Native Hawaiian or Other Pacific Islander: Number
Native Hawaiian or Other Pacific Islander: Percent
Two or more races: Number
Two or more races: Percent
White: Number
White: Percent
NC 250 7 2.80 4 1.60 1 0.40 1 0.40 1 0.40 3 1.20 2 0.80
ND 184 8 4.35 0 0.00 0 0.00 1 0.54 0 0.00 0 0.00 1 0.54
NE 280 1 0.36 6 2.14 1 0.36 8 2.86 0 0.00 4 1.43 0 0.00
NH 178 1 0.56 5 2.81 3 1.69 6 3.37 0 0.00 0 0.00 2 1.12
NJ 691 3 0.43 16 2.32 28 4.05 39 5.64 3 0.43 9 1.30 10 1.45
NM 150 1 0.67 3 2.00 1 0.67 3 2.00 0 0.00 1 0.67 1 0.67
NV 19 0 0.00 0 0.00 1 5.26 0 0.00 0 0.00 0 0.00 1 5.26
NY 1,008 10 0.99 15 1.49 76 7.54 83 8.23 0 0.00 23 2.28 5 0.50
OH 1,100 3 0.27 13 1.18 17 1.55 20 1.82 3 0.27 18 1.64 18 1.64
OK 550 16 2.91 5 0.91 6 1.09 10 1.82 1 0.18 3 0.55 28 5.09
OR 208 6 2.88 1 0.48 2 0.96 3 1.44 3 1.44 1 0.48 1 0.48
PA 738 5 0.68 12 1.63 7 0.95 13 1.76 1 0.14 10 1.36 14 1.90
RI 57 2 3.51 3 5.26 0 0.00 1 1.75 0 0.00 2 3.51 0 0.00
SC 109 1 0.92 2 1.83 0 0.00 2 1.83 1 0.92 3 2.75 6 5.50
SD 156 2 1.28 2 1.28 1 0.64 0 0.00 0 0.00 0 0.00 0 0.00
TN 142 8 5.63 4 2.82 4 2.82 1 0.70 0 0.00 3 2.11 1 0.70
TX 1,256 16 1.27 11 0.88 21 1.67 27 2.15 3 0.24 32 2.55 31 2.47
UT 132 3 2.27 2 1.52 0 0.00 2 1.52 0 0.00 2 1.52 3 2.27
VA 151 5 3.31 2 1.32 2 1.32 3 1.99 0 0.00 7 4.64 3 1.99
VT 339 0 0.00 3 0.88 4 1.18 0 0.00 0 0.00 0 0.00 0 0.00
WA 305 10 3.28 5 1.64 7 2.30 3 0.98 5 1.64 10 3.28 1 0.33
WI 456 19 4.17 12 2.63 7 1.54 23 5.04 0 0.00 8 1.75 5 1.10
WV 57 0 0.00 0 0.00 2 3.51 0 0.00 0 0.00 4 7.02 3 5.26
WY 61 4 6.56 0 0.00 0 0.00 0 0.00 0 0.00 1 1.64 0 0.00
Total 17,014 264 1.55 264 1.55 353 2.07 466 2.74 53 0.31 305 1.79 297 1.75 1Medians and MADs exclude risk ratios of 0.

RACIAL AND ETHNIC DISPARITIES IN SPECIAL EDUCATION 17
Table 4. Percent and number of districts with a risk ratio that exceeds two median absolute deviations (MADs) above the national median with a minimum cell size of 10 for three years (2011–12, 2012–13, and 2013–14), by state and race/ethnicity: Emotional disturbance1
State
Total number of districts
American Indian or Alaska Native: Number
American Indian or Alaska Native: Percent
Asian: Number
Asian: Percent
Black or African American: Number
Black or African American: Percent
Hispanic/Latino: Number
Hispanic/Latino: Percent
Native Hawaiian or Other Pacific Islander: Number
Native Hawaiian or Other Pacific Islander: Percent
Two or more races: Number
Two or more races: Percent
White: Number
White: Percent
AK 54 2 3.70 0 0.00 1 1.85 1 1.85 0 0.00 1 1.85 1 1.85
AL 176 1 0.57 0 0.00 3 1.70 0 0.00 0 0.00 2 1.14 3 1.70
AR 279 0 0.00 0 0.00 2 0.72 2 0.72 0 0.00 1 0.36 1 0.36
AZ 685 8 1.17 0 0.00 22 3.21 2 0.29 1 0.15 3 0.44 19 2.77
CA 1,052 27 2.57 2 0.19 81 7.70 2 0.19 8 0.76 23 2.19 83 7.89
CO 245 0 0.00 0 0.00 0 0.00 0 0.00 0 0.00 0 0.00 0 0.00
CT 197 4 2.03 2 1.02 13 6.60 4 2.03 0 0.00 6 3.05 0 0.00
DC 63 0 0.00 0 0.00 1 1.59 0 0.00 0 0.00 1 1.59 0 0.00
DE 43 1 2.33 0 0.00 0 0.00 0 0.00 0 0.00 0 0.00 0 0.00
FL 75 0 0.00 0 0.00 20 26.67 0 0.00 1 1.33 1 1.33 0 0.00
GA 203 1 0.49 0 0.00 10 4.93 1 0.49 2 0.99 4 1.97 2 0.99
HI 1 0 0.00 0 0.00 0 0.00 0 0.00 0 0.00 0 0.00 0 0.00
ID 153 1 0.65 0 0.00 4 2.61 0 0.00 0 0.00 2 1.31 1 0.65
IL 878 7 0.80 1 0.11 84 9.57 7 0.80 1 0.11 35 3.99 8 0.91
IN 393 12 3.05 0 0.00 17 4.33 3 0.76 0 0.00 16 4.07 6 1.53
KS 293 4 1.37 0 0.00 7 2.39 5 1.71 0 0.00 0 0.00 1 0.34
KY 176 1 0.57 0 0.00 17 9.66 0 0.00 0 0.00 8 4.55 1 0.57
LA 144 0 0.00 1 0.69 3 2.08 2 1.39 0 0.00 0 0.00 1 0.69
MA 418 3 0.72 3 0.72 15 3.59 11 2.63 1 0.24 10 2.39 3 0.72
MD 25 1 4.00 0 0.00 1 4.00 0 0.00 0 0.00 0 0.00 0 0.00
ME 259 3 1.16 0 0.00 3 1.16 7 2.70 0 0.00 0 0.00 0 0.00
MI 930 14 1.51 1 0.11 23 2.47 11 1.18 0 0.00 26 2.80 5 0.54
MN 537 21 3.91 3 0.56 28 5.21 7 1.30 0 0.00 15 2.79 1 0.19
MO 573 6 1.05 1 0.17 12 2.09 7 1.22 0 0.00 9 1.57 1 0.17
MS 163 0 0.00 0 0.00 4 2.45 3 1.84 0 0.00 1 0.61 3 1.84

RACIAL AND ETHNIC DISPARITIES IN SPECIAL EDUCATION 18
State
Total number of districts
American Indian or Alaska Native: Number
American Indian or Alaska Native: Percent
Asian: Number
Asian: Percent
Black or African American: Number
Black or African American: Percent
Hispanic/Latino: Number
Hispanic/Latino: Percent
Native Hawaiian or Other Pacific Islander: Number
Native Hawaiian or Other Pacific Islander: Percent
Two or more races: Number
Two or more races: Percent
White: Number
White: Percent
MT 422 2 0.47 0 0.00 1 0.24 0 0.00 0 0.00 2 0.47 0 0.00
NC 250 3 1.20 0 0.00 17 6.80 0 0.00 0 0.00 2 0.80 0 0.00
ND 184 2 1.09 0 0.00 1 0.54 0 0.00 0 0.00 0 0.00 0 0.00
NE 280 0 0.00 0 0.00 4 1.43 1 0.36 1 0.36 1 0.36 0 0.00
NH 178 1 0.56 0 0.00 5 2.81 3 1.69 0 0.00 0 0.00 0 0.00
NJ 691 3 0.43 1 0.14 54 7.81 10 1.45 1 0.14 9 1.30 8 1.16
NM 150 0 0.00 0 0.00 4 2.67 0 0.00 0 0.00 0 0.00 6 4.00
NV 19 0 0.00 0 0.00 2 10.53 0 0.00 0 0.00 0 0.00 0 0.00
NY 1,008 4 0.40 2 0.20 73 7.24 24 2.38 0 0.00 12 1.19 0 0.00
OH 1,100 0 0.00 0 0.00 32 2.91 11 1.00 1 0.09 36 3.27 4 0.36
OK 550 2 0.36 0 0.00 16 2.91 1 0.18 0 0.00 3 0.55 5 0.91
OR 208 4 1.92 1 0.48 4 1.92 0 0.00 0 0.00 1 0.48 2 0.96
PA 738 3 0.41 2 0.27 56 7.59 11 1.49 0 0.00 9 1.22 4 0.54
RI 57 1 1.75 0 0.00 7 12.28 0 0.00 0 0.00 1 1.75 0 0.00
SC 109 2 1.83 0 0.00 4 3.67 0 0.00 0 0.00 3 2.75 0 0.00
SD 156 2 1.28 0 0.00 2 1.28 0 0.00 0 0.00 0 0.00 0 0.00
TN 142 4 2.82 1 0.70 2 1.41 4 2.82 0 0.00 2 1.41 0 0.00
TX 1,256 15 1.19 1 0.08 55 4.38 1 0.08 2 0.16 27 2.15 52 4.14
UT 132 0 0.00 0 0.00 4 3.03 0 0.00 0 0.00 0 0.00 0 0.00
VA 151 2 1.32 1 0.66 2 1.32 3 1.99 0 0.00 1 0.66 0 0.00
VT 339 0 0.00 0 0.00 1 0.29 2 0.59 0 0.00 0 0.00 3 0.88
WA 305 22 7.21 1 0.33 14 4.59 1 0.33 2 0.66 6 1.97 3 0.98
WI 456 21 4.61 3 0.66 52 11.40 14 3.07 0 0.00 21 4.61 2 0.44
WV 57 0 0.00 0 0.00 3 5.26 1 1.75 0 0.00 0 0.00 0 0.00
WY 61 1 1.64 0 0.00 0 0.00 2 3.28 0 0.00 0 0.00 1 1.64
Total 17,014 211 1.24 27 0.16 786 4.62 164 0.96 21 0.12 300 1.76 230 1.35 1Medians and MADs exclude risk ratios of 0.

RACIAL AND ETHNIC DISPARITIES IN SPECIAL EDUCATION 19
Table 5. Percent and number of districts with a risk ratio that exceeds two median absolute deviations (MADs) above the national median with a minimum cell size of 10 for three years (2011–12, 2012–13, and 2013–14), by state and race/ethnicity: Intellectual disability1
State
Total number of districts
American Indian or Alaska Native: Number
American Indian or Alaska Native: Percent
Asian: Number
Asian: Percent
Black or African American: Number
Black or African American: Percent
Hispanic/Latino: Number
Hispanic/Latino: Percent
Native Hawaiian or Other Pacific Islander: Number
Native Hawaiian or Other Pacific Islander: Percent
Two or more races: Number
Two or more races: Percent
White: Number
White: Percent
AK 54 1 1.85 0 0.00 1 1.85 1 1.85 0 0.00 0 0.00 0 0.00
AL 176 3 1.70 3 1.70 19 10.80 0 0.00 0 0.00 2 1.14 2 1.14
AR 279 5 1.79 1 0.36 44 15.77 7 2.51 0 0.00 4 1.43 3 1.08
AZ 685 12 1.75 1 0.15 8 1.17 1 0.15 4 0.58 1 0.15 4 0.58
CA 1,052 26 2.47 20 1.90 45 4.28 30 2.85 16 1.52 20 1.90 21 2.00
CO 245 0 0.00 0 0.00 0 0.00 0 0.00 0 0.00 0 0.00 0 0.00
CT 197 5 2.54 7 3.55 15 7.61 11 5.58 0 0.00 5 2.54 0 0.00
DC 63 0 0.00 0 0.00 1 1.59 0 0.00 0 0.00 0 0.00 0 0.00
DE 43 0 0.00 1 2.33 4 9.30 0 0.00 0 0.00 0 0.00 0 0.00
FL 75 2 2.67 1 1.33 15 20.00 0 0.00 1 1.33 0 0.00 0 0.00
GA 203 5 2.46 6 2.96 41 20.20 1 0.49 2 0.99 5 2.46 0 0.00
HI 1 0 0.00 0 0.00 0 0.00 0 0.00 0 0.00 0 0.00 0 0.00
ID 153 4 2.61 1 0.65 5 3.27 2 1.31 1 0.65 2 1.31 1 0.65
IL 878 7 0.80 12 1.37 76 8.66 21 2.39 2 0.23 21 2.39 4 0.46
IN 393 10 2.54 4 1.02 27 6.87 14 3.56 1 0.25 22 5.60 3 0.76
KS 293 1 0.34 2 0.68 11 3.75 9 3.07 0 0.00 9 3.07 1 0.34
KY 176 0 0.00 3 1.70 19 10.80 2 1.14 0 0.00 3 1.70 2 1.14
LA 144 5 3.47 1 0.69 21 14.58 1 0.69 0 0.00 0 0.00 1 0.69
MA 418 1 0.24 12 2.87 37 8.85 24 5.74 1 0.24 12 2.87 3 0.72
MD 25 1 4.00 1 4.00 4 16.00 0 0.00 0 0.00 1 4.00 0 0.00
ME 259 0 0.00 1 0.39 2 0.77 2 0.77 0 0.00 2 0.77 0 0.00
MI 930 20 2.15 9 0.97 57 6.13 28 3.01 1 0.11 14 1.51 3 0.32
MN 537 14 2.61 8 1.49 23 4.28 16 2.98 1 0.19 6 1.12 2 0.37
MO 573 6 1.05 4 0.70 43 7.50 12 2.09 1 0.17 9 1.57 0 0.00
MS 163 1 0.61 1 0.61 24 14.72 4 2.45 0 0.00 0 0.00 1 0.61
MT 422 4 0.95 2 0.47 1 0.24 0 0.00 0 0.00 2 0.47 1 0.24

RACIAL AND ETHNIC DISPARITIES IN SPECIAL EDUCATION 20
State
Total number of districts
American Indian or Alaska Native: Number
American Indian or Alaska Native: Percent
Asian: Number
Asian: Percent
Black or African American: Number
Black or African American: Percent
Hispanic/Latino: Number
Hispanic/Latino: Percent
Native Hawaiian or Other Pacific Islander: Number
Native Hawaiian or Other Pacific Islander: Percent
Two or more races: Number
Two or more races: Percent
White: Number
White: Percent
NC 250 4 1.60 4 1.60 51 20.40 1 0.40 2 0.80 2 0.80 0 0.00
ND 184 3 1.63 1 0.54 1 0.54 2 1.09 0 0.00 0 0.00 1 0.54
NE 280 2 0.71 1 0.36 5 1.79 10 3.57 0 0.00 4 1.43 1 0.36
NH 178 0 0.00 2 1.12 4 2.25 1 0.56 0 0.00 0 0.00 0 0.00
NJ 691 0 0.00 16 2.32 49 7.09 29 4.20 1 0.14 5 0.72 4 0.58
NM 150 1 0.67 1 0.67 2 1.33 1 0.67 0 0.00 0 0.00 0 0.00
NV 19 3 15.79 0 0.00 1 5.26 0 0.00 1 5.26 1 5.26 0 0.00
NY 1,008 11 1.09 23 2.28 39 3.87 30 2.98 0 0.00 8 0.79 2 0.20
OH 1,100 6 0.55 3 0.27 77 7.00 26 2.36 1 0.09 35 3.18 6 0.55
OK 550 9 1.64 2 0.36 35 6.36 12 2.18 2 0.36 4 0.73 12 2.18
OR 208 9 4.33 3 1.44 7 3.37 4 1.92 2 0.96 3 1.44 1 0.48
PA 738 3 0.41 12 1.63 50 6.78 12 1.63 0 0.00 3 0.41 5 0.68
RI 57 2 3.51 3 5.26 7 12.28 1 1.75 1 1.75 3 5.26 0 0.00
SC 109 1 0.92 7 6.42 23 21.10 2 1.83 1 0.92 2 1.83 1 0.92
SD 156 8 5.13 0 0.00 0 0.00 1 0.64 0 0.00 3 1.92 0 0.00
TN 142 2 1.41 0 0.00 13 9.15 5 3.52 0 0.00 1 0.70 2 1.41
TX 1,256 20 1.59 11 0.88 118 9.39 29 2.31 9 0.72 21 1.67 12 0.96
UT 132 4 3.03 0 0.00 6 4.55 4 3.03 1 0.76 2 1.52 0 0.00
VA 151 5 3.31 0 0.00 39 25.83 3 1.99 1 0.66 2 1.32 0 0.00
VT 339 0 0.00 1 0.29 3 0.88 0 0.00 0 0.00 0 0.00 1 0.29
WA 305 23 7.54 5 1.64 17 5.57 10 3.28 1 0.33 7 2.30 1 0.33
WI 456 13 2.85 8 1.75 44 9.65 24 5.26 0 0.00 10 2.19 2 0.44
WV 57 1 1.75 1 1.75 3 5.26 2 3.51 0 0.00 0 0.00 0 0.00
WY 61 4 6.56 0 0.00 0 0.00 0 0.00 0 0.00 1 1.64 0 0.00
Total 17,014 267 1.57 205 1.20 1137 6.68 395 2.32 54 0.32 257 1.51 103 0.61 1Medians and MADs exclude risk ratios of 0.

RACIAL AND ETHNIC DISPARITIES IN SPECIAL EDUCATION 21
Table 6. Percent and number of districts with a risk ratio that exceeds two median absolute deviations (MADs) above the national median with a minimum cell size of 10 for three years (2011–12, 2012–13, and 2013–14), by state and race/ethnicity: Other health impairment1
State
Total number of districts
American Indian or Alaska Native: Number
American Indian or Alaska Native: Percent
Asian: Number
Asian: Percent
Black or African American: Number
Black or African American: Percent
Hispanic/Latino: Number
Hispanic/Latino: Percent
Native Hawaiian or Other Pacific Islander: Number
Native Hawaiian or Other Pacific Islander: Percent
Two or more races: Number
Two or more races: Percent
White: Number
White: Percent
AK 54 2 3.70 0 0.00 2 3.70 1 1.85 0 0.00 2 3.70 1 1.85
AL 176 3 1.70 1 0.57 4 2.27 0 0.00 0 0.00 2 1.14 10 5.68
AR 279 4 1.43 1 0.36 7 2.51 2 0.72 0 0.00 7 2.51 10 3.58
AZ 685 6 0.88 1 0.15 14 2.04 7 1.02 0 0.00 5 0.73 25 3.65
CA 1,052 28 2.66 8 0.76 107 10.17 6 0.57 14 1.33 29 2.76 114 10.84
CO 245 0 0.00 0 0.00 0 0.00 0 0.00 0 0.00 0 0.00 0 0.00
CT 197 2 1.02 1 0.51 13 6.60 8 4.06 0 0.00 5 2.54 1 0.51
DC 63 0 0.00 0 0.00 1 1.59 0 0.00 0 0.00 0 0.00 0 0.00
DE 43 2 4.65 0 0.00 0 0.00 1 2.33 0 0.00 0 0.00 2 4.65
FL 75 1 1.33 0 0.00 2 2.67 0 0.00 2 2.67 2 2.67 1 1.33
GA 203 4 1.97 2 0.99 3 1.48 1 0.49 3 1.48 4 1.97 6 2.96
HI 1 0 0.00 0 0.00 0 0.00 0 0.00 0 0.00 0 0.00 0 0.00
ID 153 3 1.96 0 0.00 3 1.96 1 0.65 1 0.65 3 1.96 1 0.65
IL 878 10 1.14 5 0.57 41 4.67 4 0.46 2 0.23 31 3.53 45 5.13
IN 393 9 2.29 4 1.02 18 4.58 8 2.04 1 0.25 16 4.07 7 1.78
KS 293 9 3.07 2 0.68 6 2.05 7 2.39 0 0.00 16 5.46 5 1.71
KY 176 2 1.14 0 0.00 4 2.27 1 0.57 0 0.00 6 3.41 2 1.14
LA 144 3 2.08 2 1.39 0 0.00 3 2.08 1 0.69 0 0.00 2 1.39
MA 418 8 1.91 2 0.48 11 2.63 17 4.07 0 0.00 9 2.15 12 2.87
MD 25 1 4.00 0 0.00 0 0.00 0 0.00 0 0.00 1 4.00 0 0.00
ME 259 3 1.16 0 0.00 4 1.54 8 3.09 0 0.00 2 0.77 1 0.39
MI 930 30 3.23 10 1.08 40 4.30 17 1.83 2 0.22 30 3.23 12 1.29
MN 537 24 4.47 5 0.93 23 4.28 8 1.49 1 0.19 9 1.68 5 0.93
MO 573 11 1.92 1 0.17 18 3.14 4 0.70 0 0.00 3 0.52 6 1.05
MS 163 1 0.61 0 0.00 8 4.91 0 0.00 0 0.00 0 0.00 6 3.68

RACIAL AND ETHNIC DISPARITIES IN SPECIAL EDUCATION 22
State
Total number of districts
American Indian or Alaska Native: Number
American Indian or Alaska Native: Percent
Asian: Number
Asian: Percent
Black or African American: Number
Black or African American: Percent
Hispanic/Latino: Number
Hispanic/Latino: Percent
Native Hawaiian or Other Pacific Islander: Number
Native Hawaiian or Other Pacific Islander: Percent
Two or more races: Number
Two or more races: Percent
White: Number
White: Percent
MT 422 5 1.18 0 0.00 2 0.47 3 0.71 0 0.00 0 0.00 1 0.24
NC 250 4 1.60 1 0.40 6 2.40 4 1.60 0 0.00 3 1.20 8 3.20
ND 184 4 2.17 0 0.00 1 0.54 2 1.09 0 0.00 0 0.00 1 0.54
NE 280 3 1.07 1 0.36 2 0.71 3 1.07 0 0.00 3 1.07 4 1.43
NH 178 0 0.00 0 0.00 4 2.25 1 0.56 0 0.00 0 0.00 6 3.37
NJ 691 2 0.29 0 0.00 42 6.08 4 0.58 0 0.00 4 0.58 44 6.37
NM 150 0 0.00 2 1.33 4 2.67 1 0.67 0 0.00 1 0.67 9 6.00
NV 19 0 0.00 0 0.00 1 5.26 0 0.00 0 0.00 0 0.00 1 5.26
NY 1,008 11 1.09 6 0.60 36 3.57 14 1.39 0 0.00 16 1.59 38 3.77
OH 1,100 2 0.18 6 0.55 28 2.55 24 2.18 0 0.00 25 2.27 15 1.36
OK 550 4 0.73 1 0.18 15 2.73 7 1.27 2 0.36 6 1.09 30 5.45
OR 208 14 6.73 2 0.96 9 4.33 1 0.48 1 0.48 4 1.92 8 3.85
PA 738 4 0.54 6 0.81 44 5.96 10 1.36 0 0.00 4 0.54 8 1.08
RI 57 4 7.02 1 1.75 1 1.75 0 0.00 0 0.00 0 0.00 3 5.26
SC 109 1 0.92 1 0.92 0 0.00 2 1.83 0 0.00 0 0.00 6 5.50
SD 156 6 3.85 0 0.00 2 1.28 4 2.56 0 0.00 1 0.64 1 0.64
TN 142 6 4.23 1 0.70 7 4.93 3 2.11 0 0.00 2 1.41 2 1.41
TX 1,256 19 1.51 3 0.24 62 4.94 12 0.96 2 0.16 27 2.15 50 3.98
UT 132 1 0.76 0 0.00 4 3.03 3 2.27 0 0.00 3 2.27 2 1.52
VA 151 6 3.97 0 0.00 7 4.64 2 1.32 1 0.66 1 0.66 1 0.66
VT 339 0 0.00 0 0.00 3 0.88 1 0.29 0 0.00 0 0.00 1 0.29
WA 305 11 3.61 2 0.66 13 4.26 6 1.97 1 0.33 9 2.95 10 3.28
WI 456 17 3.73 5 1.10 46 10.09 20 4.39 0 0.00 10 2.19 4 0.88
WV 57 0 0.00 0 0.00 3 5.26 2 3.51 0 0.00 0 0.00 0 0.00
WY 61 2 3.28 0 0.00 1 1.64 1 1.64 0 0.00 1 1.64 0 0.00
Total 17,014 292 1.72 83 0.49 672 3.95 234 1.38 34 0.20 302 1.78 527 3.10 1Medians and MADs exclude risk ratios of 0.
RACIAL AND ETHNIC DISPARITIES IN SPECIAL EDUCATION 23
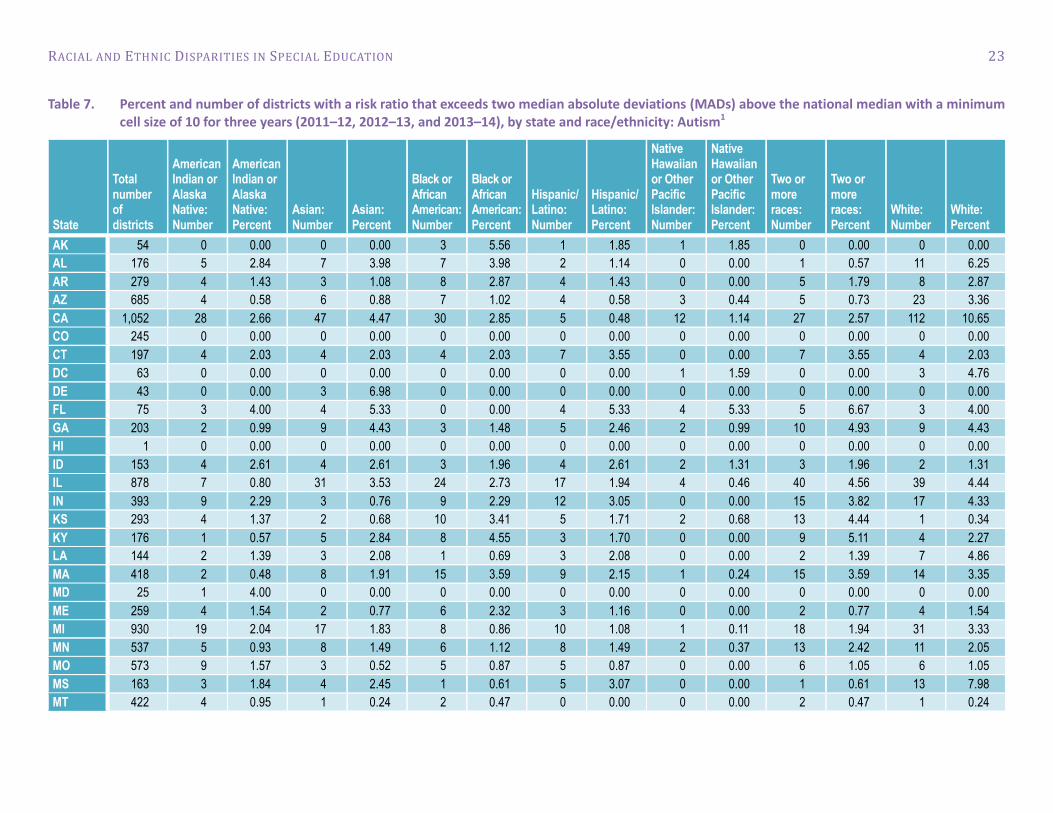
Table 7. Percent and number of districts with a risk ratio that exceeds two median absolute deviations (MADs) above the national median with a minimum cell size of 10 for three years (2011–12, 2012–13, and 2013–14), by state and race/ethnicity: Autism1
State
Total number of districts
American Indian or Alaska Native: Number
American Indian or Alaska Native: Percent
Asian: Number
Asian: Percent
Black or African American: Number
Black or African American: Percent
Hispanic/Latino: Number
Hispanic/Latino: Percent
Native Hawaiian or Other Pacific Islander: Number
Native Hawaiian or Other Pacific Islander: Percent
Two or more races: Number
Two or more races: Percent
White: Number
White: Percent
AK 54 0 0.00 0 0.00 3 5.56 1 1.85 1 1.85 0 0.00 0 0.00
AL 176 5 2.84 7 3.98 7 3.98 2 1.14 0 0.00 1 0.57 11 6.25
AR 279 4 1.43 3 1.08 8 2.87 4 1.43 0 0.00 5 1.79 8 2.87
AZ 685 4 0.58 6 0.88 7 1.02 4 0.58 3 0.44 5 0.73 23 3.36
CA 1,052 28 2.66 47 4.47 30 2.85 5 0.48 12 1.14 27 2.57 112 10.65
CO 245 0 0.00 0 0.00 0 0.00 0 0.00 0 0.00 0 0.00 0 0.00
CT 197 4 2.03 4 2.03 4 2.03 7 3.55 0 0.00 7 3.55 4 2.03
DC 63 0 0.00 0 0.00 0 0.00 0 0.00 1 1.59 0 0.00 3 4.76
DE 43 0 0.00 3 6.98 0 0.00 0 0.00 0 0.00 0 0.00 0 0.00
FL 75 3 4.00 4 5.33 0 0.00 4 5.33 4 5.33 5 6.67 3 4.00
GA 203 2 0.99 9 4.43 3 1.48 5 2.46 2 0.99 10 4.93 9 4.43
HI 1 0 0.00 0 0.00 0 0.00 0 0.00 0 0.00 0 0.00 0 0.00
ID 153 4 2.61 4 2.61 3 1.96 4 2.61 2 1.31 3 1.96 2 1.31
IL 878 7 0.80 31 3.53 24 2.73 17 1.94 4 0.46 40 4.56 39 4.44
IN 393 9 2.29 3 0.76 9 2.29 12 3.05 0 0.00 15 3.82 17 4.33
KS 293 4 1.37 2 0.68 10 3.41 5 1.71 2 0.68 13 4.44 1 0.34
KY 176 1 0.57 5 2.84 8 4.55 3 1.70 0 0.00 9 5.11 4 2.27
LA 144 2 1.39 3 2.08 1 0.69 3 2.08 0 0.00 2 1.39 7 4.86
MA 418 2 0.48 8 1.91 15 3.59 9 2.15 1 0.24 15 3.59 14 3.35
MD 25 1 4.00 0 0.00 0 0.00 0 0.00 0 0.00 0 0.00 0 0.00
ME 259 4 1.54 2 0.77 6 2.32 3 1.16 0 0.00 2 0.77 4 1.54
MI 930 19 2.04 17 1.83 8 0.86 10 1.08 1 0.11 18 1.94 31 3.33
MN 537 5 0.93 8 1.49 6 1.12 8 1.49 2 0.37 13 2.42 11 2.05
MO 573 9 1.57 3 0.52 5 0.87 5 0.87 0 0.00 6 1.05 6 1.05
MS 163 3 1.84 4 2.45 1 0.61 5 3.07 0 0.00 1 0.61 13 7.98
MT 422 4 0.95 1 0.24 2 0.47 0 0.00 0 0.00 2 0.47 1 0.24

RACIAL AND ETHNIC DISPARITIES IN SPECIAL EDUCATION 24
State
Total number of districts
American Indian or Alaska Native: Number
American Indian or Alaska Native: Percent
Asian: Number
Asian: Percent
Black or African American: Number
Black or African American: Percent
Hispanic/Latino: Number
Hispanic/Latino: Percent
Native Hawaiian or Other Pacific Islander: Number
Native Hawaiian or Other Pacific Islander: Percent
Two or more races: Number
Two or more races: Percent
White: Number
White: Percent
NC 250 5 2.00 5 2.00 6 2.40 3 1.20 2 0.80 1 0.40 12 4.80
ND 184 1 0.54 0 0.00 1 0.54 1 0.54 0 0.00 0 0.00 0 0.00
NE 280 2 0.71 2 0.71 2 0.71 5 1.79 1 0.36 3 1.07 5 1.79
NH 178 0 0.00 2 1.12 4 2.25 3 1.69 0 0.00 1 0.56 3 1.69
NJ 691 4 0.58 26 3.76 26 3.76 17 2.46 7 1.01 11 1.59 37 5.35
NM 150 1 0.67 4 2.67 5 3.33 0 0.00 0 0.00 2 1.33 14 9.33
NV 19 1 5.26 0 0.00 2 10.53 0 0.00 0 0.00 0 0.00 1 5.26
NY 1,008 13 1.29 21 2.08 26 2.58 25 2.48 0 0.00 25 2.48 46 4.56
OH 1,100 6 0.55 9 0.82 13 1.18 15 1.36 0 0.00 29 2.64 21 1.91
OK 550 10 1.82 5 0.91 15 2.73 9 1.64 0 0.00 3 0.55 26 4.73
OR 208 8 3.85 2 0.96 2 0.96 4 1.92 2 0.96 5 2.40 11 5.29
PA 738 5 0.68 17 2.30 12 1.63 14 1.90 0 0.00 9 1.22 16 2.17
RI 57 1 1.75 1 1.75 3 5.26 0 0.00 0 0.00 2 3.51 5 8.77
SC 109 0 0.00 3 2.75 4 3.67 2 1.83 0 0.00 3 2.75 6 5.50
SD 156 1 0.64 4 2.56 1 0.64 3 1.92 0 0.00 1 0.64 2 1.28
TN 142 1 0.70 7 4.93 4 2.82 4 2.82 0 0.00 5 3.52 6 4.23
TX 1,256 15 1.19 24 1.91 43 3.42 11 0.88 4 0.32 38 3.03 78 6.21
UT 132 2 1.52 2 1.52 0 0.00 2 1.52 0 0.00 0 0.00 2 1.52
VA 151 6 3.97 8 5.30 4 2.65 5 3.31 2 1.32 8 5.30 2 1.32
VT 339 0 0.00 0 0.00 2 0.59 2 0.59 0 0.00 0 0.00 1 0.29
WA 305 14 4.59 7 2.30 6 1.97 4 1.31 2 0.66 5 1.64 16 5.25
WI 456 10 2.19 10 2.19 11 2.41 17 3.73 2 0.44 11 2.41 5 1.10
WV 57 0 0.00 1 1.75 3 5.26 2 3.51 0 0.00 1 1.75 1 1.75
WY 61 0 0.00 0 0.00 0 0.00 1 1.64 0 0.00 1 1.64 0 0.00
Total 17,014 230 1.35 334 1.96 355 2.09 265 1.56 57 0.34 363 2.13 639 3.76 1Medians and MADs exclude risk ratios of 0.

RACIAL AND ETHNIC DISPARITIES IN SPECIAL EDUCATION 25
Table 8. Percent and number of districts with a risk ratio that exceeds two median absolute deviations (MADs) above the national median with a minimum cell size of 10 for three years (2011–12, 2012–13, and 2013–14), by state and race/ethnicity: Inside regular classroom 40 through 79 percent of the day1
State
Total number of districts
American Indian or Alaska Native: Number
American Indian or Alaska Native: Percent
Asian: Number
Asian: Percent
Black or African American: Number
Black or African American: Percent
Hispanic/Latino: Number
Hispanic/Latino: Percent
Native Hawaiian or Other Pacific Islander: Number
Native Hawaiian or Other Pacific Islander: Percent
Two or more races: Number
Two or more races: Percent
White: Number
White: Percent
AK 54 0 0.00 0 0.00 0 0.00 0 0.00 0 0.00 0 0.00 0 0.00
AL 176 0 0.00 1 0.57 14 7.95 4 2.27 0 0.00 1 0.57 4 2.27
AR 279 0 0.00 0 0.00 7 2.51 0 0.00 0 0.00 1 0.36 2 0.72
AZ 685 1 0.15 0 0.00 2 0.29 7 1.02 0 0.00 0 0.00 2 0.29
CA 1,052 4 0.38 2 0.19 11 1.05 46 4.37 2 0.19 3 0.29 3 0.29
CO 245 1 0.41 0 0.00 1 0.41 4 1.63 0 0.00 0 0.00 0 0.00
CT 197 0 0.00 6 3.05 4 2.03 3 1.52 0 0.00 0 0.00 1 0.51
DC 63 0 0.00 0 0.00 1 1.59 0 0.00 0 0.00 0 0.00 0 0.00
DE 43 1 2.33 0 0.00 2 4.65 0 0.00 0 0.00 0 0.00 0 0.00
FL 75 5 6.67 1 1.33 3 4.00 1 1.33 0 0.00 0 0.00 0 0.00
GA 203 1 0.49 1 0.49 7 3.45 5 2.46 0 0.00 1 0.49 1 0.49
HI 1 0 0.00 0 0.00 0 0.00 0 0.00 0 0.00 0 0.00 0 0.00
IA 357 0 0.00 0 0.00 0 0.00 1 0.28 1 0.28 0 0.00 0 0.00
ID 153 1 0.65 0 0.00 0 0.00 0 0.00 0 0.00 0 0.00 1 0.65
IL 878 0 0.00 1 0.11 21 2.39 24 2.73 0 0.00 1 0.11 1 0.11
IN 393 0 0.00 0 0.00 6 1.53 6 1.53 0 0.00 4 1.02 5 1.27
KS 293 1 0.34 1 0.34 0 0.00 3 1.02 0 0.00 0 0.00 2 0.68
KY 176 0 0.00 0 0.00 3 1.70 0 0.00 0 0.00 0 0.00 1 0.57
LA 144 0 0.00 0 0.00 7 4.86 0 0.00 0 0.00 0 0.00 0 0.00
MA 418 0 0.00 2 0.48 18 4.31 24 5.74 0 0.00 2 0.48 1 0.24
MD 25 0 0.00 0 0.00 0 0.00 0 0.00 0 0.00 0 0.00 0 0.00
ME 259 0 0.00 0 0.00 0 0.00 0 0.00 0 0.00 0 0.00 3 1.16
MI 930 0 0.00 2 0.22 17 1.83 6 0.65 0 0.00 0 0.00 2 0.22
MN 537 1 0.19 0 0.00 7 1.30 10 1.86 0 0.00 1 0.19 1 0.19
MO 573 0 0.00 0 0.00 15 2.62 1 0.17 0 0.00 0 0.00 1 0.17

RACIAL AND ETHNIC DISPARITIES IN SPECIAL EDUCATION 26
State
Total number of districts
American Indian or Alaska Native: Number
American Indian or Alaska Native: Percent
Asian: Number
Asian: Percent
Black or African American: Number
Black or African American: Percent
Hispanic/Latino: Number
Hispanic/Latino: Percent
Native Hawaiian or Other Pacific Islander: Number
Native Hawaiian or Other Pacific Islander: Percent
Two or more races: Number
Two or more races: Percent
White: Number
White: Percent
MS 163 0 0.00 0 0.00 22 13.50 1 0.61 0 0.00 0 0.00 0 0.00
MT 422 0 0.00 0 0.00 0 0.00 0 0.00 0 0.00 0 0.00 0 0.00
NC 250 0 0.00 0 0.00 5 2.00 2 0.80 0 0.00 1 0.40 1 0.40
ND 184 0 0.00 0 0.00 0 0.00 1 0.54 0 0.00 0 0.00 0 0.00
NE 280 3 1.07 0 0.00 0 0.00 1 0.36 0 0.00 0 0.00 2 0.71
NH 178 0 0.00 0 0.00 1 0.56 0 0.00 0 0.00 0 0.00 0 0.00
NJ 691 0 0.00 0 0.00 27 3.91 31 4.49 0 0.00 1 0.14 1 0.14
NM 150 1 0.67 0 0.00 0 0.00 2 1.33 0 0.00 0 0.00 1 0.67
NV 19 1 5.26 0 0.00 0 0.00 0 0.00 0 0.00 0 0.00 0 0.00
NY 1,008 5 0.50 4 0.40 27 2.68 22 2.18 0 0.00 0 0.00 3 0.30
OH 1,100 0 0.00 1 0.09 10 0.91 1 0.09 0 0.00 3 0.27 2 0.18
OK 550 5 0.91 0 0.00 2 0.36 5 0.91 0 0.00 1 0.18 5 0.91
OR 208 1 0.48 0 0.00 1 0.48 2 0.96 0 0.00 2 0.96 0 0.00
PA 738 0 0.00 0 0.00 18 2.44 14 1.90 0 0.00 5 0.68 0 0.00
RI 57 2 3.51 0 0.00 2 3.51 1 1.75 0 0.00 1 1.75 0 0.00
SC 109 0 0.00 0 0.00 4 3.67 1 0.92 0 0.00 1 0.92 1 0.92
SD 156 2 1.28 0 0.00 1 0.64 0 0.00 0 0.00 0 0.00 0 0.00
TN 142 0 0.00 0 0.00 2 1.41 3 2.11 0 0.00 1 0.70 0 0.00
TX 1,256 0 0.00 2 0.16 17 1.35 26 2.07 1 0.08 2 0.16 5 0.40
UT 132 0 0.00 0 0.00 1 0.76 1 0.76 0 0.00 0 0.00 1 0.76
VA 151 0 0.00 0 0.00 7 4.64 1 0.66 0 0.00 2 1.32 0 0.00
VT 339 0 0.00 0 0.00 0 0.00 0 0.00 0 0.00 0 0.00 0 0.00
WA 305 0 0.00 0 0.00 0 0.00 3 0.98 0 0.00 0 0.00 2 0.66
WI 456 0 0.00 4 0.88 5 1.10 7 1.54 0 0.00 3 0.66 1 0.22
WV 57 0 0.00 0 0.00 0 0.00 0 0.00 0 0.00 0 0.00 0 0.00
WY 61 0 0.00 0 0.00 0 0.00 1 1.64 0 0.00 0 0.00 0 0.00
Total 17,371 36 0.21 28 0.16 298 1.72 271 1.56 4 0.02 37 0.21 56 0.32 1Medians and MADs exclude risk ratios of 0.

RACIAL AND ETHNIC DISPARITIES IN SPECIAL EDUCATION 27
Table 9. Percent and number of districts with a risk ratio that exceeds two median absolute deviations (MADs) above the national median with a minimum cell size of 10 for three years (2011–12, 2012–13, and 2013–14), by state and race/ethnicity: Inside regular classroom less than 40 percent of the day1
State
Total number of districts
American Indian or Alaska Native: Number
American Indian or Alaska Native: Percent
Asian: Number
Asian: Percent
Black or African American: Number
Black or African American: Percent
Hispanic/Latino: Number
Hispanic/Latino: Percent
Native Hawaiian or Other Pacific Islander: Number
Native Hawaiian or Other Pacific Islander: Percent
Two or more races: Number
Two or more races: Percent
White: Number
White: Percent
AK 54 1 1.85 0 0.00 0 0.00 0 0.00 0 0.00 0 0.00 0 0.00
AL 176 2 1.14 3 1.70 12 6.82 5 2.84 0 0.00 0 0.00 5 2.84
AR 279 0 0.00 0 0.00 10 3.58 4 1.43 1 0.36 0 0.00 4 1.43
AZ 685 2 0.29 2 0.29 2 0.29 1 0.15 0 0.00 0 0.00 0 0.00
CA 1,052 4 0.38 23 2.19 4 0.38 13 1.24 0 0.00 2 0.19 6 0.57
CO 245 1 0.41 1 0.41 1 0.41 0 0.00 0 0.00 0 0.00 1 0.41
CT 197 0 0.00 9 4.57 2 1.02 6 3.05 0 0.00 3 1.52 1 0.51
DC 63 0 0.00 0 0.00 2 3.17 0 0.00 0 0.00 0 0.00 0 0.00
DE 43 0 0.00 1 2.33 2 4.65 1 2.33 0 0.00 0 0.00 0 0.00
FL 75 1 1.33 4 5.33 1 1.33 1 1.33 0 0.00 0 0.00 0 0.00
GA 203 0 0.00 7 3.45 10 4.93 6 2.96 0 0.00 2 0.99 2 0.99
HI 1 0 0.00 0 0.00 0 0.00 0 0.00 0 0.00 0 0.00 0 0.00
IA 357 1 0.28 1 0.28 3 0.84 0 0.00 0 0.00 0 0.00 2 0.56
ID 153 0 0.00 1 0.65 0 0.00 1 0.65 0 0.00 1 0.65 2 1.31
IL 878 2 0.23 19 2.16 20 2.28 17 1.94 0 0.00 9 1.03 4 0.46
IN 393 0 0.00 4 1.02 3 0.76 2 0.51 0 0.00 4 1.02 3 0.76
KS 293 0 0.00 0 0.00 4 1.37 3 1.02 0 0.00 0 0.00 0 0.00
KY 176 0 0.00 0 0.00 5 2.84 2 1.14 0 0.00 3 1.70 0 0.00
LA 144 1 0.69 0 0.00 4 2.78 0 0.00 0 0.00 0 0.00 0 0.00
MA 418 0 0.00 14 3.35 11 2.63 8 1.91 0 0.00 4 0.96 3 0.72
MD 25 0 0.00 4 16.00 1 4.00 2 8.00 0 0.00 0 0.00 0 0.00
ME 259 1 0.39 0 0.00 0 0.00 0 0.00 0 0.00 0 0.00 1 0.39
MI 930 1 0.11 6 0.65 16 1.72 7 0.75 0 0.00 1 0.11 5 0.54
MN 537 5 0.93 4 0.74 10 1.86 7 1.30 0 0.00 2 0.37 2 0.37
MO 573 0 0.00 5 0.87 10 1.75 0 0.00 0 0.00 0 0.00 0 0.00

RACIAL AND ETHNIC DISPARITIES IN SPECIAL EDUCATION 28
State
Total number of districts
American Indian or Alaska Native: Number
American Indian or Alaska Native: Percent
Asian: Number
Asian: Percent
Black or African American: Number
Black or African American: Percent
Hispanic/Latino: Number
Hispanic/Latino: Percent
Native Hawaiian or Other Pacific Islander: Number
Native Hawaiian or Other Pacific Islander: Percent
Two or more races: Number
Two or more races: Percent
White: Number
White: Percent
MS 163 0 0.00 1 0.61 20 12.27 1 0.61 0 0.00 0 0.00 2 1.23
MT 422 0 0.00 0 0.00 0 0.00 0 0.00 0 0.00 0 0.00 0 0.00
NC 250 0 0.00 6 2.40 4 1.60 2 0.80 0 0.00 0 0.00 2 0.80
ND 184 0 0.00 1 0.54 0 0.00 0 0.00 0 0.00 0 0.00 1 0.54
NE 280 0 0.00 0 0.00 3 1.07 2 0.71 0 0.00 0 0.00 0 0.00
NH 178 0 0.00 1 0.56 1 0.56 0 0.00 0 0.00 0 0.00 0 0.00
NJ 691 0 0.00 29 4.20 30 4.34 35 5.07 1 0.14 2 0.29 2 0.29
NM 150 1 0.67 0 0.00 0 0.00 2 1.33 0 0.00 0 0.00 1 0.67
NV 19 1 5.26 0 0.00 2 10.53 0 0.00 0 0.00 0 0.00 0 0.00
NY 1,008 3 0.30 11 1.09 12 1.19 11 1.09 2 0.20 3 0.30 3 0.30
OH 1,100 0 0.00 7 0.64 11 1.00 9 0.82 0 0.00 7 0.64 7 0.64
OK 550 6 1.09 3 0.55 7 1.27 0 0.00 0 0.00 2 0.36 8 1.45
OR 208 1 0.48 3 1.44 2 0.96 1 0.48 0 0.00 0 0.00 7 3.37
PA 738 0 0.00 19 2.57 15 2.03 5 0.68 0 0.00 1 0.14 3 0.41
RI 57 0 0.00 0 0.00 2 3.51 0 0.00 0 0.00 1 1.75 0 0.00
SC 109 0 0.00 0 0.00 3 2.75 2 1.83 0 0.00 0 0.00 0 0.00
SD 156 2 1.28 1 0.64 0 0.00 0 0.00 0 0.00 0 0.00 1 0.64
TN 142 0 0.00 1 0.70 5 3.52 1 0.70 1 0.70 0 0.00 2 1.41
TX 1,256 3 0.24 28 2.23 6 0.48 16 1.27 2 0.16 2 0.16 30 2.39
UT 132 0 0.00 1 0.76 1 0.76 1 0.76 0 0.00 1 0.76 0 0.00
VA 151 0 0.00 7 4.64 6 3.97 2 1.32 0 0.00 1 0.66 2 1.32
VT 339 0 0.00 0 0.00 0 0.00 0 0.00 0 0.00 0 0.00 0 0.00
WA 305 5 1.64 12 3.93 0 0.00 1 0.33 0 0.00 2 0.66 5 1.64
WI 456 1 0.22 3 0.66 7 1.54 2 0.44 0 0.00 3 0.66 2 0.44
WV 57 0 0.00 1 1.75 0 0.00 0 0.00 0 0.00 0 0.00 0 0.00
WY 61 0 0.00 0 0.00 0 0.00 1 1.64 0 0.00 0 0.00 0 0.00
Total 17,371 45 0.26 243 1.40 270 1.55 180 1.04 7 0.04 56 0.32 119 0.69 1Medians and MADs exclude risk ratios of 0.

RACIAL AND ETHNIC DISPARITIES IN SPECIAL EDUCATION 29
Table 10. Percent and number of districts with a risk ratio that exceeds two median absolute deviations (MADs) above the national median with a minimum cell size of 10 for three years (2011–12, 2012–13, and 2013–14), by state and race/ethnicity: Separate settings1
State
Total number of districts
American Indian or Alaska Native: Number
American Indian or Alaska Native: Percent
Asian: Number
Asian: Percent
Black or African American: Number
Black or African American: Percent
Hispanic/Latino: Number
Hispanic/Latino: Percent
Native Hawaiian or Other Pacific Islander: Number
Native Hawaiian or Other Pacific Islander: Percent
Two or more races: Number
Two or more races: Percent
White: Number
White: Percent
AK 54 0 0.00 0 0.00 0 0.00 0 0.00 0 0.00 0 0.00 0 0.00
AL 176 0 0.00 0 0.00 0 0.00 2 1.14 0 0.00 1 0.57 2 1.14
AR 279 0 0.00 0 0.00 1 0.36 0 0.00 0 0.00 0 0.00 4 1.43
AZ 685 3 0.44 0 0.00 10 1.46 0 0.00 0 0.00 1 0.15 5 0.73
CA 1,052 7 0.67 12 1.14 38 3.61 2 0.19 4 0.38 8 0.76 57 5.42
CO 245 0 0.00 1 0.41 5 2.04 0 0.00 0 0.00 1 0.41 2 0.82
CT 197 1 0.51 2 1.02 0 0.00 3 1.52 0 0.00 0 0.00 4 2.03
DC 63 0 0.00 0 0.00 0 0.00 0 0.00 0 0.00 0 0.00 0 0.00
DE 43 0 0.00 0 0.00 1 2.33 0 0.00 0 0.00 0 0.00 0 0.00
FL 75 2 2.67 1 1.33 1 1.33 0 0.00 1 1.33 0 0.00 1 1.33
GA 203 0 0.00 0 0.00 6 2.96 0 0.00 0 0.00 2 0.99 5 2.46
HI 1 0 0.00 0 0.00 0 0.00 0 0.00 0 0.00 0 0.00 0 0.00
IA 357 0 0.00 1 0.28 1 0.28 0 0.00 0 0.00 0 0.00 0 0.00
ID 153 0 0.00 0 0.00 0 0.00 0 0.00 0 0.00 0 0.00 2 1.31
IL 878 0 0.00 4 0.46 25 2.85 3 0.34 0 0.00 7 0.80 9 1.03
IN 393 0 0.00 0 0.00 4 1.02 2 0.51 0 0.00 7 1.78 0 0.00
KS 293 0 0.00 0 0.00 2 0.68 0 0.00 0 0.00 2 0.68 1 0.34
KY 176 0 0.00 0 0.00 2 1.14 0 0.00 0 0.00 0 0.00 0 0.00
LA 144 0 0.00 0 0.00 0 0.00 1 0.69 0 0.00 0 0.00 2 1.39
MA 418 0 0.00 1 0.24 0 0.00 4 0.96 1 0.24 3 0.72 8 1.91
MD 25 0 0.00 1 4.00 0 0.00 0 0.00 0 0.00 0 0.00 0 0.00
ME 259 0 0.00 0 0.00 0 0.00 0 0.00 0 0.00 0 0.00 0 0.00
MI 930 0 0.00 1 0.11 3 0.32 0 0.00 0 0.00 1 0.11 3 0.32
MN 537 2 0.37 1 0.19 6 1.12 0 0.00 0 0.00 6 1.12 0 0.00
MO 573 0 0.00 1 0.17 5 0.87 0 0.00 0 0.00 1 0.17 2 0.35
MS 163 0 0.00 1 0.61 1 0.61 0 0.00 0 0.00 0 0.00 2 1.23

RACIAL AND ETHNIC DISPARITIES IN SPECIAL EDUCATION 30
State
Total number of districts
American Indian or Alaska Native: Number
American Indian or Alaska Native: Percent
Asian: Number
Asian: Percent
Black or African American: Number
Black or African American: Percent
Hispanic/Latino: Number
Hispanic/Latino: Percent
Native Hawaiian or Other Pacific Islander: Number
Native Hawaiian or Other Pacific Islander: Percent
Two or more races: Number
Two or more races: Percent
White: Number
White: Percent
MT 422 0 0.00 0 0.00 0 0.00 0 0.00 0 0.00 0 0.00 0 0.00
NC 250 0 0.00 0 0.00 2 0.80 0 0.00 0 0.00 0 0.00 0 0.00
ND 184 0 0.00 0 0.00 1 0.54 0 0.00 0 0.00 0 0.00 0 0.00
NE 280 1 0.36 0 0.00 2 0.71 0 0.00 0 0.00 0 0.00 0 0.00
NH 178 0 0.00 0 0.00 0 0.00 0 0.00 0 0.00 0 0.00 0 0.00
NJ 691 0 0.00 15 2.17 10 1.45 3 0.43 0 0.00 2 0.29 11 1.59
NM 150 0 0.00 0 0.00 0 0.00 0 0.00 0 0.00 0 0.00 3 2.00
NV 19 0 0.00 0 0.00 0 0.00 0 0.00 0 0.00 0 0.00 0 0.00
NY 1,008 6 0.60 13 1.29 12 1.19 7 0.69 1 0.10 2 0.20 16 1.59
OH 1,100 0 0.00 4 0.36 11 1.00 4 0.36 0 0.00 8 0.73 5 0.45
OK 550 1 0.18 0 0.00 2 0.36 1 0.18 0 0.00 0 0.00 3 0.55
OR 208 2 0.96 3 1.44 1 0.48 1 0.48 1 0.48 0 0.00 1 0.48
PA 738 1 0.14 2 0.27 11 1.49 3 0.41 0 0.00 1 0.14 1 0.14
RI 57 1 1.75 0 0.00 3 5.26 1 1.75 0 0.00 1 1.75 0 0.00
SC 109 0 0.00 0 0.00 0 0.00 0 0.00 0 0.00 0 0.00 2 1.83
SD 156 1 0.64 0 0.00 0 0.00 0 0.00 0 0.00 0 0.00 0 0.00
TN 142 1 0.70 0 0.00 1 0.70 0 0.00 0 0.00 0 0.00 0 0.00
TX 1,256 0 0.00 3 0.24 7 0.56 3 0.24 1 0.08 2 0.16 8 0.64
UT 132 1 0.76 0 0.00 1 0.76 0 0.00 0 0.00 0 0.00 0 0.00
VA 151 0 0.00 2 1.32 1 0.66 1 0.66 0 0.00 2 1.32 2 1.32
VT 339 0 0.00 0 0.00 0 0.00 0 0.00 0 0.00 0 0.00 0 0.00
WA 305 5 1.64 1 0.33 1 0.33 1 0.33 0 0.00 0 0.00 1 0.33
WI 456 3 0.66 0 0.00 4 0.88 1 0.22 0 0.00 1 0.22 0 0.00
WV 57 0 0.00 1 1.75 0 0.00 0 0.00 0 0.00 0 0.00 0 0.00
WY 61 0 0.00 0 0.00 0 0.00 1 1.64 0 0.00 0 0.00 0 0.00
Total 17,371 38 0.22 71 0.41 181 1.04 44 0.25 9 0.05 59 0.34 162 0.93 1Medians and MADs exclude risk ratios of 0.

RACIAL AND ETHNIC DISPARITIES IN SPECIAL EDUCATION 31
Table 11. Percent and number of districts with a risk ratio that exceeds two median absolute deviations (MADs) above the national median with a minimum cell size of 10 for three years (2011–12, 2012–13, and 2013–14), by state and race/ethnicity: In school suspensions: 10 days or less1
State Total number of districts
American Indian or Alaska Native: Number
American Indian or Alaska Native: Percent
Asian: Number
Asian: Percent
Black or African American: Number
Black or African American: Percent
Hispanic/Latino: Number
Hispanic/Latino: Percent
Native Hawaiian or Other Pacific Islander: Number
Native Hawaiian or Other Pacific Islander: Percent
Two or more races: Number
Two or more races: Percent
White: Number
White: Percent
AK 54 1 1.85 0 0.00 0 0.00 0 0.00 0 0.00 0 0.00 0 0.00
AL 176 0 0.00 0 0.00 14 7.95 0 0.00 0 0.00 0 0.00 0 0.00
AR 279 0 0.00 0 0.00 7 2.51 0 0.00 0 0.00 0 0.00 0 0.00
AZ 685 1 0.15 0 0.00 10 1.46 0 0.00 0 0.00 0 0.00 0 0.00
CA 1,052 1 0.10 0 0.00 14 1.33 1 0.10 0 0.00 0 0.00 1 0.10
CO 245 0 0.00 0 0.00 2 0.82 0 0.00 0 0.00 0 0.00 0 0.00
CT 197 0 0.00 0 0.00 12 6.09 3 1.52 0 0.00 0 0.00 0 0.00
DC 63 0 0.00 0 0.00 1 1.59 0 0.00 0 0.00 0 0.00 0 0.00
DE 43 0 0.00 0 0.00 2 4.65 0 0.00 0 0.00 0 0.00 0 0.00
FL 75 0 0.00 0 0.00 15 20.00 0 0.00 0 0.00 0 0.00 0 0.00
GA 203 0 0.00 0 0.00 16 7.88 0 0.00 0 0.00 0 0.00 0 0.00
HI 1 0 0.00 0 0.00 0 0.00 0 0.00 0 0.00 0 0.00 0 0.00
IA 357 1 0.28 0 0.00 12 3.36 0 0.00 0 0.00 0 0.00 0 0.00
ID 153 0 0.00 0 0.00 1 0.65 1 0.65 0 0.00 0 0.00 0 0.00
IL 878 1 0.11 0 0.00 33 3.76 6 0.68 0 0.00 5 0.57 1 0.11
IN 393 0 0.00 0 0.00 12 3.05 1 0.25 0 0.00 0 0.00 0 0.00
KS 293 0 0.00 0 0.00 1 0.34 1 0.34 0 0.00 0 0.00 0 0.00
KY 176 0 0.00 0 0.00 9 5.11 0 0.00 0 0.00 0 0.00 2 1.14
LA 144 0 0.00 0 0.00 26 18.06 0 0.00 0 0.00 0 0.00 0 0.00
MA 418 0 0.00 0 0.00 15 3.59 4 0.96 0 0.00 0 0.00 0 0.00
MD 25 1 4.00 0 0.00 6 24.00 0 0.00 0 0.00 0 0.00 0 0.00
ME 259 0 0.00 0 0.00 0 0.00 0 0.00 0 0.00 0 0.00 0 0.00
MI 930 0 0.00 0 0.00 13 1.40 5 0.54 0 0.00 2 0.22 0 0.00
MN 537 6 1.12 0 0.00 23 4.28 2 0.37 0 0.00 1 0.19 0 0.00
MO 573 0 0.00 0 0.00 18 3.14 0 0.00 0 0.00 1 0.17 0 0.00

RACIAL AND ETHNIC DISPARITIES IN SPECIAL EDUCATION 32
State Total number of districts
American Indian or Alaska Native: Number
American Indian or Alaska Native: Percent
Asian: Number
Asian: Percent
Black or African American: Number
Black or African American: Percent
Hispanic/Latino: Number
Hispanic/Latino: Percent
Native Hawaiian or Other Pacific Islander: Number
Native Hawaiian or Other Pacific Islander: Percent
Two or more races: Number
Two or more races: Percent
White: Number
White: Percent
MS 163 0 0.00 0 0.00 17 10.43 0 0.00 0 0.00 0 0.00 0 0.00
MT 422 0 0.00 0 0.00 1 0.24 0 0.00 0 0.00 0 0.00 0 0.00
NC 250 0 0.00 0 0.00 16 6.40 0 0.00 0 0.00 0 0.00 0 0.00
ND 184 0 0.00 0 0.00 0 0.00 0 0.00 0 0.00 0 0.00 0 0.00
NE 280 1 0.36 0 0.00 3 1.07 2 0.71 0 0.00 0 0.00 1 0.36
NH 178 0 0.00 0 0.00 1 0.56 0 0.00 0 0.00 0 0.00 0 0.00
NJ 691 0 0.00 0 0.00 24 3.47 1 0.14 0 0.00 0 0.00 0 0.00
NM 150 1 0.67 0 0.00 1 0.67 0 0.00 0 0.00 0 0.00 1 0.67
NV 19 0 0.00 0 0.00 1 5.26 0 0.00 0 0.00 0 0.00 0 0.00
NY 1,008 2 0.20 0 0.00 45 4.46 5 0.50 0 0.00 0 0.00 1 0.10
OH 1,100 0 0.00 0 0.00 24 2.18 1 0.09 0 0.00 5 0.45 0 0.00
OK 550 1 0.18 0 0.00 1 0.18 0 0.00 0 0.00 0 0.00 1 0.18
OR 208 0 0.00 0 0.00 4 1.92 0 0.00 0 0.00 1 0.48 0 0.00
PA 738 0 0.00 0 0.00 34 4.61 2 0.27 0 0.00 1 0.14 1 0.14
RI 57 1 1.75 0 0.00 3 5.26 1 1.75 0 0.00 0 0.00 0 0.00
SC 109 0 0.00 0 0.00 9 8.26 0 0.00 0 0.00 0 0.00 0 0.00
SD 156 1 0.64 0 0.00 0 0.00 1 0.64 0 0.00 0 0.00 0 0.00
TN 142 0 0.00 0 0.00 4 2.82 0 0.00 0 0.00 0 0.00 0 0.00
TX 1,256 1 0.08 0 0.00 26 2.07 2 0.16 0 0.00 0 0.00 1 0.08
UT 132 0 0.00 0 0.00 0 0.00 1 0.76 0 0.00 0 0.00 0 0.00
VA 151 0 0.00 0 0.00 10 6.62 0 0.00 0 0.00 2 1.32 0 0.00
VT 339 0 0.00 0 0.00 0 0.00 0 0.00 0 0.00 0 0.00 0 0.00
WA 305 0 0.00 0 0.00 8 2.62 3 0.98 0 0.00 0 0.00 0 0.00
WI 456 2 0.44 0 0.00 23 5.04 2 0.44 0 0.00 0 0.00 0 0.00
WV 57 0 0.00 0 0.00 4 7.02 0 0.00 0 0.00 0 0.00 0 0.00
WY 61 0 0.00 0 0.00 0 0.00 0 0.00 0 0.00 0 0.00 0 0.00
Total 17,371 22 0.13 0 0.00 521 3.00 45 0.26 0 0.00 18 0.10 10 0.06 1Medians and MADs exclude risk ratios of 0.
RACIAL AND ETHNIC DISPARITIES IN SPECIAL EDUCATION 33
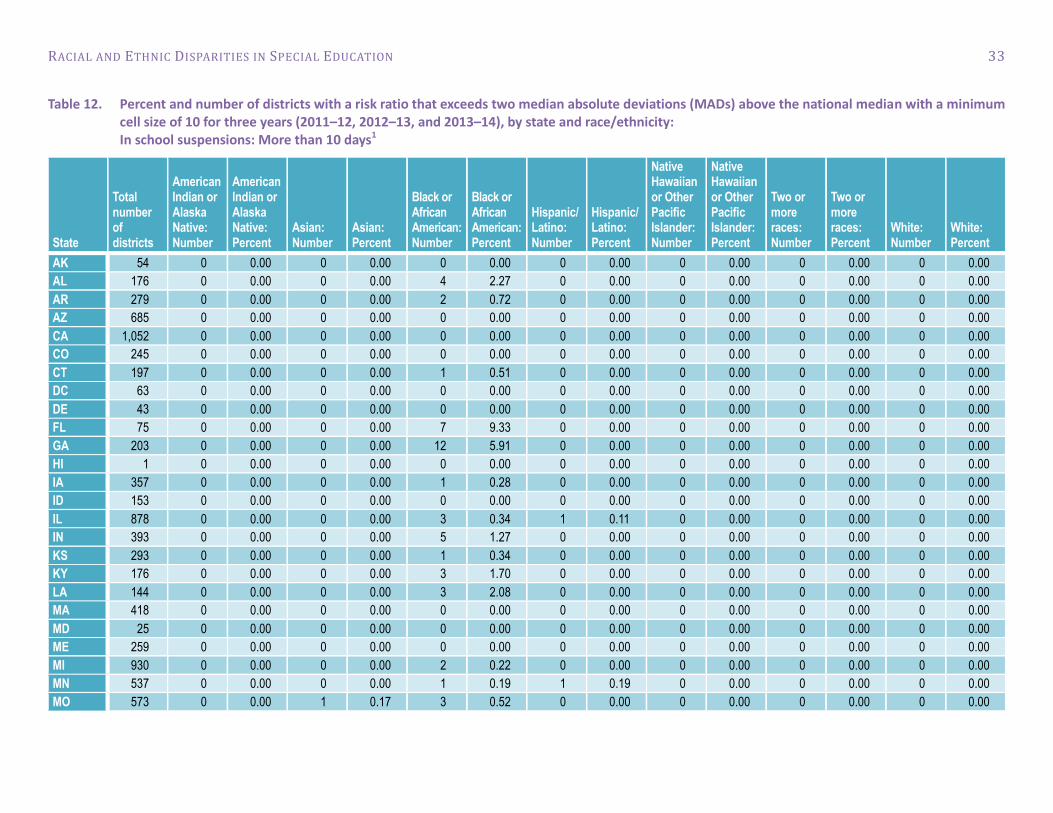
Table 12. Percent and number of districts with a risk ratio that exceeds two median absolute deviations (MADs) above the national median with a minimum cell size of 10 for three years (2011–12, 2012–13, and 2013–14), by state and race/ethnicity: In school suspensions: More than 10 days1
State
Total number of districts
American Indian or Alaska Native: Number
American Indian or Alaska Native: Percent
Asian: Number
Asian: Percent
Black or African American: Number
Black or African American: Percent
Hispanic/Latino: Number
Hispanic/Latino: Percent
Native Hawaiian or Other Pacific Islander: Number
Native Hawaiian or Other Pacific Islander: Percent
Two or more races: Number
Two or more races: Percent
White: Number
White: Percent
AK 54 0 0.00 0 0.00 0 0.00 0 0.00 0 0.00 0 0.00 0 0.00
AL 176 0 0.00 0 0.00 4 2.27 0 0.00 0 0.00 0 0.00 0 0.00
AR 279 0 0.00 0 0.00 2 0.72 0 0.00 0 0.00 0 0.00 0 0.00
AZ 685 0 0.00 0 0.00 0 0.00 0 0.00 0 0.00 0 0.00 0 0.00
CA 1,052 0 0.00 0 0.00 0 0.00 0 0.00 0 0.00 0 0.00 0 0.00
CO 245 0 0.00 0 0.00 0 0.00 0 0.00 0 0.00 0 0.00 0 0.00
CT 197 0 0.00 0 0.00 1 0.51 0 0.00 0 0.00 0 0.00 0 0.00
DC 63 0 0.00 0 0.00 0 0.00 0 0.00 0 0.00 0 0.00 0 0.00
DE 43 0 0.00 0 0.00 0 0.00 0 0.00 0 0.00 0 0.00 0 0.00
FL 75 0 0.00 0 0.00 7 9.33 0 0.00 0 0.00 0 0.00 0 0.00
GA 203 0 0.00 0 0.00 12 5.91 0 0.00 0 0.00 0 0.00 0 0.00
HI 1 0 0.00 0 0.00 0 0.00 0 0.00 0 0.00 0 0.00 0 0.00
IA 357 0 0.00 0 0.00 1 0.28 0 0.00 0 0.00 0 0.00 0 0.00
ID 153 0 0.00 0 0.00 0 0.00 0 0.00 0 0.00 0 0.00 0 0.00
IL 878 0 0.00 0 0.00 3 0.34 1 0.11 0 0.00 0 0.00 0 0.00
IN 393 0 0.00 0 0.00 5 1.27 0 0.00 0 0.00 0 0.00 0 0.00
KS 293 0 0.00 0 0.00 1 0.34 0 0.00 0 0.00 0 0.00 0 0.00
KY 176 0 0.00 0 0.00 3 1.70 0 0.00 0 0.00 0 0.00 0 0.00
LA 144 0 0.00 0 0.00 3 2.08 0 0.00 0 0.00 0 0.00 0 0.00
MA 418 0 0.00 0 0.00 0 0.00 0 0.00 0 0.00 0 0.00 0 0.00
MD 25 0 0.00 0 0.00 0 0.00 0 0.00 0 0.00 0 0.00 0 0.00
ME 259 0 0.00 0 0.00 0 0.00 0 0.00 0 0.00 0 0.00 0 0.00
MI 930 0 0.00 0 0.00 2 0.22 0 0.00 0 0.00 0 0.00 0 0.00
MN 537 0 0.00 0 0.00 1 0.19 1 0.19 0 0.00 0 0.00 0 0.00
MO 573 0 0.00 1 0.17 3 0.52 0 0.00 0 0.00 0 0.00 0 0.00

RACIAL AND ETHNIC DISPARITIES IN SPECIAL EDUCATION 34
State
Total number of districts
American Indian or Alaska Native: Number
American Indian or Alaska Native: Percent
Asian: Number
Asian: Percent
Black or African American: Number
Black or African American: Percent
Hispanic/Latino: Number
Hispanic/Latino: Percent
Native Hawaiian or Other Pacific Islander: Number
Native Hawaiian or Other Pacific Islander: Percent
Two or more races: Number
Two or more races: Percent
White: Number
White: Percent
MS 163 0 0.00 0 0.00 6 3.68 0 0.00 0 0.00 0 0.00 0 0.00
MT 422 0 0.00 0 0.00 0 0.00 0 0.00 0 0.00 0 0.00 0 0.00
NC 250 0 0.00 0 0.00 5 2.00 0 0.00 0 0.00 0 0.00 0 0.00
ND 184 0 0.00 0 0.00 0 0.00 0 0.00 0 0.00 0 0.00 0 0.00
NE 280 0 0.00 0 0.00 0 0.00 0 0.00 0 0.00 0 0.00 0 0.00
NH 178 0 0.00 0 0.00 0 0.00 0 0.00 0 0.00 0 0.00 0 0.00
NJ 691 0 0.00 0 0.00 1 0.14 0 0.00 0 0.00 0 0.00 0 0.00
NM 150 0 0.00 0 0.00 0 0.00 0 0.00 0 0.00 0 0.00 0 0.00
NV 19 1 5.26 0 0.00 0 0.00 0 0.00 0 0.00 0 0.00 0 0.00
NY 1,008 0 0.00 0 0.00 4 0.40 2 0.20 0 0.00 0 0.00 0 0.00
OH 1,100 0 0.00 0 0.00 3 0.27 0 0.00 0 0.00 0 0.00 0 0.00
OK 550 0 0.00 0 0.00 0 0.00 0 0.00 0 0.00 0 0.00 0 0.00
OR 208 0 0.00 0 0.00 0 0.00 0 0.00 0 0.00 0 0.00 0 0.00
PA 738 0 0.00 0 0.00 1 0.14 1 0.14 0 0.00 0 0.00 0 0.00
RI 57 0 0.00 0 0.00 0 0.00 0 0.00 0 0.00 0 0.00 0 0.00
SC 109 0 0.00 0 0.00 3 2.75 0 0.00 0 0.00 1 0.92 0 0.00
SD 156 0 0.00 0 0.00 0 0.00 0 0.00 0 0.00 0 0.00 0 0.00
TN 142 0 0.00 0 0.00 0 0.00 0 0.00 0 0.00 0 0.00 0 0.00
TX 1,256 0 0.00 0 0.00 2 0.16 0 0.00 0 0.00 0 0.00 0 0.00
UT 132 0 0.00 0 0.00 0 0.00 0 0.00 0 0.00 0 0.00 0 0.00
VA 151 0 0.00 0 0.00 3 1.99 0 0.00 0 0.00 0 0.00 0 0.00
VT 339 0 0.00 0 0.00 0 0.00 0 0.00 0 0.00 0 0.00 0 0.00
WA 305 0 0.00 0 0.00 0 0.00 0 0.00 0 0.00 0 0.00 0 0.00
WI 456 0 0.00 0 0.00 0 0.00 0 0.00 0 0.00 0 0.00 0 0.00
WV 57 0 0.00 0 0.00 0 0.00 0 0.00 0 0.00 0 0.00 0 0.00
WY 61 0 0.00 0 0.00 0 0.00 0 0.00 0 0.00 0 0.00 0 0.00
Total 17,371 1 0.01 1 0.01 76 0.44 5 0.03 0 0.00 1 0.01 0 0.00 1Medians and MADs exclude risk ratios of 0.

RACIAL AND ETHNIC DISPARITIES IN SPECIAL EDUCATION 35
Table 13. Percent and number of districts with a risk ratio that exceeds two median absolute deviations (MADs) above the national median with a minimum cell size of 10 for three years (2011–12, 2012–13, and 2013–14), by state and race/ethnicity: Out-of-school suspensions/expulsions: 10 days or less1
State
Total number of districts
American Indian or Alaska Native: Number
American Indian or Alaska Native: Percent
Asian: Number
Asian: Percent
Black or African American: Number
Black or African American: Percent
Hispanic/Latino: Number
Hispanic/Latino: Percent
Native Hawaiian or Other Pacific Islander: Number
Native Hawaiian or Other Pacific Islander: Percent
Two or more races: Number
Two or more races: Percent
White: Number
White: Percent
AK 54 0 0.00 0 0.00 1 1.85 0 0.00 0 0.00 0 0.00 0 0.00
AL 176 0 0.00 0 0.00 23 13.07 0 0.00 0 0.00 0 0.00 0 0.00
AR 279 0 0.00 0 0.00 10 3.58 0 0.00 0 0.00 0 0.00 1 0.36
AZ 685 2 0.29 1 0.15 11 1.61 0 0.00 0 0.00 1 0.15 0 0.00
CA 1,052 1 0.10 0 0.00 51 4.85 2 0.19 0 0.00 0 0.00 5 0.48
CO 245 1 0.41 0 0.00 1 0.41 0 0.00 0 0.00 0 0.00 0 0.00
CT 197 0 0.00 1 0.51 8 4.06 6 3.05 0 0.00 0 0.00 0 0.00
DC 63 0 0.00 0 0.00 1 1.59 0 0.00 0 0.00 0 0.00 0 0.00
DE 43 0 0.00 0 0.00 4 9.30 0 0.00 0 0.00 0 0.00 0 0.00
FL 75 1 1.33 0 0.00 23 30.67 0 0.00 0 0.00 0 0.00 0 0.00
GA 203 0 0.00 0 0.00 31 15.27 0 0.00 0 0.00 0 0.00 1 0.49
HI 1 0 0.00 0 0.00 0 0.00 0 0.00 0 0.00 0 0.00 0 0.00
IA 357 0 0.00 0 0.00 11 3.08 0 0.00 0 0.00 2 0.56 0 0.00
ID 153 0 0.00 0 0.00 1 0.65 0 0.00 0 0.00 0 0.00 0 0.00
IL 878 0 0.00 0 0.00 61 6.95 6 0.68 0 0.00 7 0.80 0 0.00
IN 393 0 0.00 0 0.00 22 5.60 0 0.00 0 0.00 0 0.00 0 0.00
KS 293 0 0.00 0 0.00 2 0.68 0 0.00 0 0.00 0 0.00 0 0.00
KY 176 0 0.00 0 0.00 14 7.95 0 0.00 0 0.00 1 0.57 0 0.00
LA 144 0 0.00 0 0.00 38 26.39 0 0.00 0 0.00 0 0.00 0 0.00
MA 418 0 0.00 1 0.24 17 4.07 3 0.72 0 0.00 0 0.00 1 0.24
MD 25 0 0.00 0 0.00 10 40.00 0 0.00 0 0.00 0 0.00 0 0.00
ME 259 0 0.00 0 0.00 2 0.77 0 0.00 0 0.00 0 0.00 0 0.00
MI 930 3 0.32 0 0.00 30 3.23 0 0.00 0 0.00 1 0.11 1 0.11
MN 537 11 2.05 0 0.00 32 5.96 1 0.19 0 0.00 1 0.19 0 0.00
MO 573 0 0.00 0 0.00 16 2.79 0 0.00 0 0.00 2 0.35 0 0.00
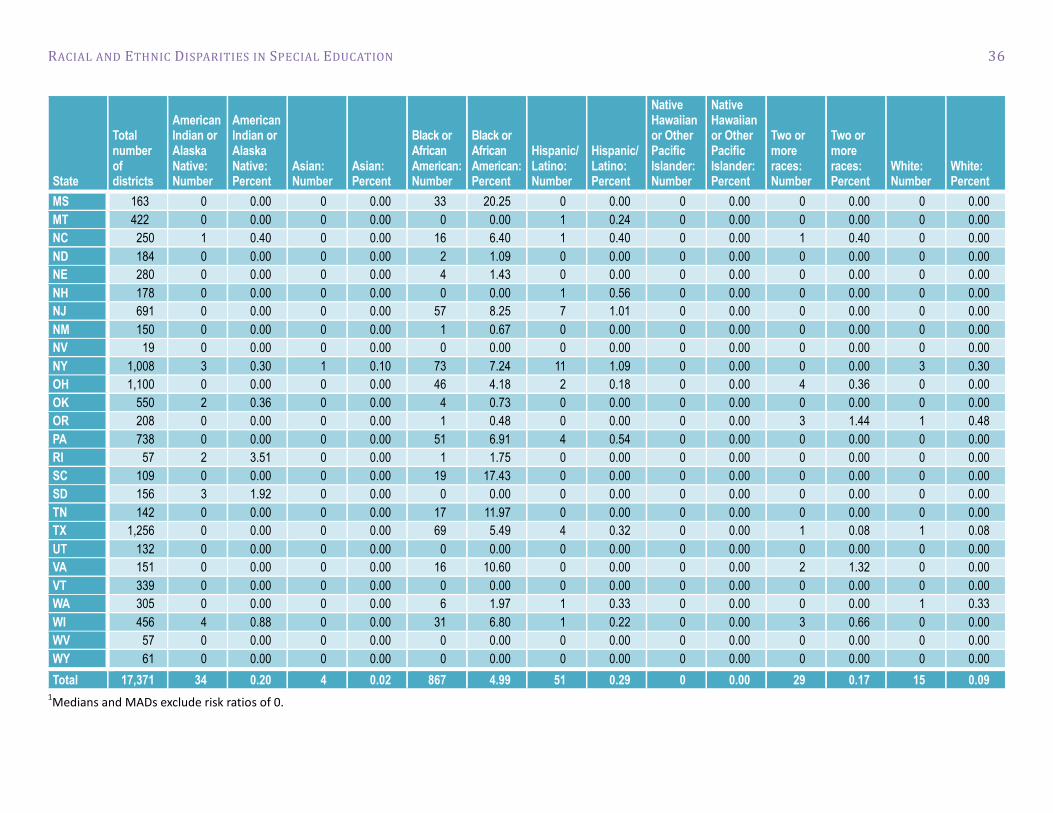
RACIAL AND ETHNIC DISPARITIES IN SPECIAL EDUCATION 36
State
Total number of districts
American Indian or Alaska Native: Number
American Indian or Alaska Native: Percent
Asian: Number
Asian: Percent
Black or African American: Number
Black or African American: Percent
Hispanic/Latino: Number
Hispanic/Latino: Percent
Native Hawaiian or Other Pacific Islander: Number
Native Hawaiian or Other Pacific Islander: Percent
Two or more races: Number
Two or more races: Percent
White: Number
White: Percent
MS 163 0 0.00 0 0.00 33 20.25 0 0.00 0 0.00 0 0.00 0 0.00
MT 422 0 0.00 0 0.00 0 0.00 1 0.24 0 0.00 0 0.00 0 0.00
NC 250 1 0.40 0 0.00 16 6.40 1 0.40 0 0.00 1 0.40 0 0.00
ND 184 0 0.00 0 0.00 2 1.09 0 0.00 0 0.00 0 0.00 0 0.00
NE 280 0 0.00 0 0.00 4 1.43 0 0.00 0 0.00 0 0.00 0 0.00
NH 178 0 0.00 0 0.00 0 0.00 1 0.56 0 0.00 0 0.00 0 0.00
NJ 691 0 0.00 0 0.00 57 8.25 7 1.01 0 0.00 0 0.00 0 0.00
NM 150 0 0.00 0 0.00 1 0.67 0 0.00 0 0.00 0 0.00 0 0.00
NV 19 0 0.00 0 0.00 0 0.00 0 0.00 0 0.00 0 0.00 0 0.00
NY 1,008 3 0.30 1 0.10 73 7.24 11 1.09 0 0.00 0 0.00 3 0.30
OH 1,100 0 0.00 0 0.00 46 4.18 2 0.18 0 0.00 4 0.36 0 0.00
OK 550 2 0.36 0 0.00 4 0.73 0 0.00 0 0.00 0 0.00 0 0.00
OR 208 0 0.00 0 0.00 1 0.48 0 0.00 0 0.00 3 1.44 1 0.48
PA 738 0 0.00 0 0.00 51 6.91 4 0.54 0 0.00 0 0.00 0 0.00
RI 57 2 3.51 0 0.00 1 1.75 0 0.00 0 0.00 0 0.00 0 0.00
SC 109 0 0.00 0 0.00 19 17.43 0 0.00 0 0.00 0 0.00 0 0.00
SD 156 3 1.92 0 0.00 0 0.00 0 0.00 0 0.00 0 0.00 0 0.00
TN 142 0 0.00 0 0.00 17 11.97 0 0.00 0 0.00 0 0.00 0 0.00
TX 1,256 0 0.00 0 0.00 69 5.49 4 0.32 0 0.00 1 0.08 1 0.08
UT 132 0 0.00 0 0.00 0 0.00 0 0.00 0 0.00 0 0.00 0 0.00
VA 151 0 0.00 0 0.00 16 10.60 0 0.00 0 0.00 2 1.32 0 0.00
VT 339 0 0.00 0 0.00 0 0.00 0 0.00 0 0.00 0 0.00 0 0.00
WA 305 0 0.00 0 0.00 6 1.97 1 0.33 0 0.00 0 0.00 1 0.33
WI 456 4 0.88 0 0.00 31 6.80 1 0.22 0 0.00 3 0.66 0 0.00
WV 57 0 0.00 0 0.00 0 0.00 0 0.00 0 0.00 0 0.00 0 0.00
WY 61 0 0.00 0 0.00 0 0.00 0 0.00 0 0.00 0 0.00 0 0.00
Total 17,371 34 0.20 4 0.02 867 4.99 51 0.29 0 0.00 29 0.17 15 0.09 1Medians and MADs exclude risk ratios of 0.

RACIAL AND ETHNIC DISPARITIES IN SPECIAL EDUCATION 37
Table 14. Percent and number of districts with a risk ratio that exceeds two median absolute deviations (MADs) above the national median with a minimum cell size of 10 for three years (2011–12, 2012–13, and 2013–14), by state and race/ethnicity: Out-of-school suspensions/expulsions: More than 10 days1
State
Total number of districts
American Indian or Alaska Native: Number
American Indian or Alaska Native: Percent
Asian: Number
Asian: Percent
Black or African American: Number
Black or African American: Percent
Hispanic/Latino: Number
Hispanic/Latino: Percent
Native Hawaiian or Other Pacific Islander: Number
Native Hawaiian or Other Pacific Islander: Percent
Two or more races: Number
Two or more races: Percent
White: Number
White: Percent
AK 54 0 0.00 0 0.00 0 0.00 0 0.00 0 0.00 0 0.00 0 0.00
AL 176 0 0.00 0 0.00 5 2.84 0 0.00 0 0.00 0 0.00 0 0.00
AR 279 0 0.00 0 0.00 1 0.36 0 0.00 0 0.00 0 0.00 0 0.00
AZ 685 0 0.00 0 0.00 0 0.00 0 0.00 0 0.00 0 0.00 0 0.00
CA 1,052 2 0.19 0 0.00 13 1.24 0 0.00 0 0.00 2 0.19 0 0.00
CO 245 0 0.00 0 0.00 0 0.00 0 0.00 0 0.00 0 0.00 0 0.00
CT 197 1 0.51 0 0.00 1 0.51 1 0.51 0 0.00 0 0.00 0 0.00
DC 63 0 0.00 0 0.00 0 0.00 0 0.00 0 0.00 0 0.00 0 0.00
DE 43 0 0.00 0 0.00 0 0.00 0 0.00 0 0.00 0 0.00 0 0.00
FL 75 0 0.00 0 0.00 17 22.67 0 0.00 0 0.00 0 0.00 0 0.00
GA 203 0 0.00 0 0.00 4 1.97 0 0.00 0 0.00 0 0.00 0 0.00
HI 1 0 0.00 0 0.00 0 0.00 0 0.00 0 0.00 0 0.00 0 0.00
IA 357 0 0.00 0 0.00 1 0.28 0 0.00 0 0.00 0 0.00 0 0.00
ID 153 0 0.00 0 0.00 0 0.00 0 0.00 0 0.00 0 0.00 0 0.00
IL 878 0 0.00 0 0.00 14 1.59 0 0.00 0 0.00 0 0.00 0 0.00
IN 393 0 0.00 0 0.00 9 2.29 0 0.00 0 0.00 1 0.25 0 0.00
KS 293 0 0.00 0 0.00 1 0.34 0 0.00 0 0.00 0 0.00 0 0.00
KY 176 0 0.00 0 0.00 1 0.57 0 0.00 0 0.00 0 0.00 0 0.00
LA 144 0 0.00 0 0.00 7 4.86 0 0.00 0 0.00 0 0.00 0 0.00
MA 418 0 0.00 0 0.00 3 0.72 2 0.48 0 0.00 0 0.00 0 0.00
MD 25 0 0.00 0 0.00 7 28.00 0 0.00 0 0.00 0 0.00 0 0.00
ME 259 0 0.00 0 0.00 0 0.00 0 0.00 0 0.00 0 0.00 0 0.00
MI 930 1 0.11 0 0.00 7 0.75 1 0.11 0 0.00 0 0.00 0 0.00
MN 537 0 0.00 0 0.00 10 1.86 0 0.00 0 0.00 0 0.00 0 0.00
MO 573 0 0.00 0 0.00 6 1.05 1 0.17 0 0.00 1 0.17 0 0.00

RACIAL AND ETHNIC DISPARITIES IN SPECIAL EDUCATION 38
State
Total number of districts
American Indian or Alaska Native: Number
American Indian or Alaska Native: Percent
Asian: Number
Asian: Percent
Black or African American: Number
Black or African American: Percent
Hispanic/Latino: Number
Hispanic/Latino: Percent
Native Hawaiian or Other Pacific Islander: Number
Native Hawaiian or Other Pacific Islander: Percent
Two or more races: Number
Two or more races: Percent
White: Number
White: Percent
MS 163 0 0.00 0 0.00 3 1.84 1 0.61 0 0.00 0 0.00 0 0.00
MT 422 0 0.00 0 0.00 0 0.00 0 0.00 0 0.00 0 0.00 0 0.00
NC 250 1 0.40 0 0.00 19 7.60 0 0.00 0 0.00 0 0.00 0 0.00
ND 184 0 0.00 0 0.00 0 0.00 0 0.00 0 0.00 0 0.00 0 0.00
NE 280 0 0.00 0 0.00 2 0.71 0 0.00 0 0.00 0 0.00 0 0.00
NH 178 0 0.00 0 0.00 1 0.56 0 0.00 0 0.00 0 0.00 0 0.00
NJ 691 0 0.00 0 0.00 1 0.14 0 0.00 0 0.00 0 0.00 0 0.00
NM 150 0 0.00 0 0.00 0 0.00 0 0.00 0 0.00 0 0.00 0 0.00
NV 19 0 0.00 0 0.00 0 0.00 0 0.00 0 0.00 0 0.00 0 0.00
NY 1,008 1 0.10 0 0.00 21 2.08 4 0.40 0 0.00 0 0.00 0 0.00
OH 1,100 0 0.00 0 0.00 12 1.09 1 0.09 0 0.00 1 0.09 0 0.00
OK 550 0 0.00 0 0.00 2 0.36 1 0.18 0 0.00 0 0.00 0 0.00
OR 208 0 0.00 0 0.00 1 0.48 1 0.48 0 0.00 1 0.48 0 0.00
PA 738 0 0.00 0 0.00 9 1.22 1 0.14 0 0.00 0 0.00 0 0.00
RI 57 0 0.00 0 0.00 0 0.00 0 0.00 0 0.00 0 0.00 0 0.00
SC 109 0 0.00 0 0.00 4 3.67 0 0.00 0 0.00 0 0.00 0 0.00
SD 156 0 0.00 0 0.00 0 0.00 0 0.00 0 0.00 0 0.00 0 0.00
TN 142 0 0.00 0 0.00 3 2.11 0 0.00 0 0.00 0 0.00 0 0.00
TX 1,256 0 0.00 0 0.00 4 0.32 0 0.00 0 0.00 0 0.00 0 0.00
UT 132 0 0.00 0 0.00 0 0.00 0 0.00 0 0.00 0 0.00 0 0.00
VA 151 0 0.00 0 0.00 7 4.64 0 0.00 0 0.00 0 0.00 0 0.00
VT 339 0 0.00 0 0.00 0 0.00 0 0.00 0 0.00 0 0.00 0 0.00
WA 305 2 0.66 0 0.00 4 1.31 0 0.00 0 0.00 0 0.00 0 0.00
WI 456 0 0.00 0 0.00 7 1.54 0 0.00 0 0.00 0 0.00 0 0.00
WV 57 0 0.00 0 0.00 1 1.75 0 0.00 0 0.00 0 0.00 0 0.00
WY 61 0 0.00 0 0.00 0 0.00 0 0.00 0 0.00 0 0.00 0 0.00
Total 17,371 8 0.05 0 0.00 208 1.20 14 0.08 0 0.00 6 0.03 0 0.00 1Medians and MADs exclude risk ratios of 0.
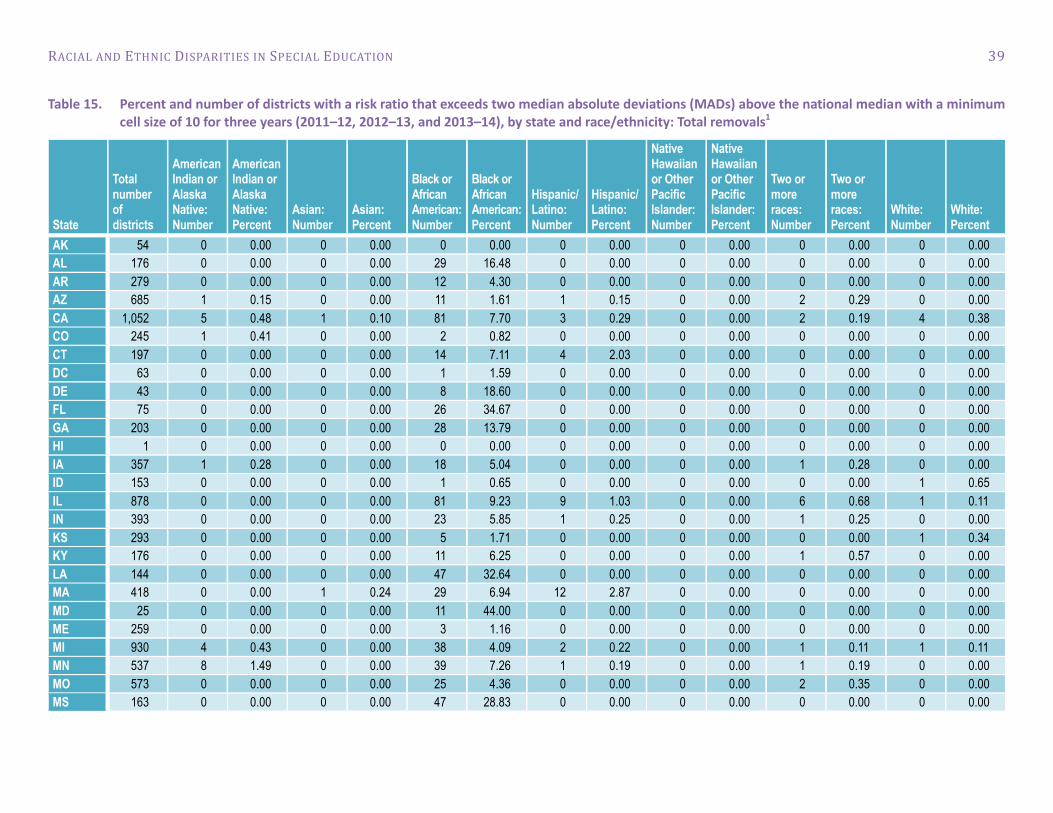
RACIAL AND ETHNIC DISPARITIES IN SPECIAL EDUCATION 39
Table 15. Percent and number of districts with a risk ratio that exceeds two median absolute deviations (MADs) above the national median with a minimum cell size of 10 for three years (2011–12, 2012–13, and 2013–14), by state and race/ethnicity: Total removals1
State
Total number of districts
American Indian or Alaska Native: Number
American Indian or Alaska Native: Percent
Asian: Number
Asian: Percent
Black or African American: Number
Black or African American: Percent
Hispanic/Latino: Number
Hispanic/Latino: Percent
Native Hawaiian or Other Pacific Islander: Number
Native Hawaiian or Other Pacific Islander: Percent
Two or more races: Number
Two or more races: Percent
White: Number
White: Percent
AK 54 0 0.00 0 0.00 0 0.00 0 0.00 0 0.00 0 0.00 0 0.00
AL 176 0 0.00 0 0.00 29 16.48 0 0.00 0 0.00 0 0.00 0 0.00
AR 279 0 0.00 0 0.00 12 4.30 0 0.00 0 0.00 0 0.00 0 0.00
AZ 685 1 0.15 0 0.00 11 1.61 1 0.15 0 0.00 2 0.29 0 0.00
CA 1,052 5 0.48 1 0.10 81 7.70 3 0.29 0 0.00 2 0.19 4 0.38
CO 245 1 0.41 0 0.00 2 0.82 0 0.00 0 0.00 0 0.00 0 0.00
CT 197 0 0.00 0 0.00 14 7.11 4 2.03 0 0.00 0 0.00 0 0.00
DC 63 0 0.00 0 0.00 1 1.59 0 0.00 0 0.00 0 0.00 0 0.00
DE 43 0 0.00 0 0.00 8 18.60 0 0.00 0 0.00 0 0.00 0 0.00
FL 75 0 0.00 0 0.00 26 34.67 0 0.00 0 0.00 0 0.00 0 0.00
GA 203 0 0.00 0 0.00 28 13.79 0 0.00 0 0.00 0 0.00 0 0.00
HI 1 0 0.00 0 0.00 0 0.00 0 0.00 0 0.00 0 0.00 0 0.00
IA 357 1 0.28 0 0.00 18 5.04 0 0.00 0 0.00 1 0.28 0 0.00
ID 153 0 0.00 0 0.00 1 0.65 0 0.00 0 0.00 0 0.00 1 0.65
IL 878 0 0.00 0 0.00 81 9.23 9 1.03 0 0.00 6 0.68 1 0.11
IN 393 0 0.00 0 0.00 23 5.85 1 0.25 0 0.00 1 0.25 0 0.00
KS 293 0 0.00 0 0.00 5 1.71 0 0.00 0 0.00 0 0.00 1 0.34
KY 176 0 0.00 0 0.00 11 6.25 0 0.00 0 0.00 1 0.57 0 0.00
LA 144 0 0.00 0 0.00 47 32.64 0 0.00 0 0.00 0 0.00 0 0.00
MA 418 0 0.00 1 0.24 29 6.94 12 2.87 0 0.00 0 0.00 0 0.00
MD 25 0 0.00 0 0.00 11 44.00 0 0.00 0 0.00 0 0.00 0 0.00
ME 259 0 0.00 0 0.00 3 1.16 0 0.00 0 0.00 0 0.00 0 0.00
MI 930 4 0.43 0 0.00 38 4.09 2 0.22 0 0.00 1 0.11 1 0.11
MN 537 8 1.49 0 0.00 39 7.26 1 0.19 0 0.00 1 0.19 0 0.00
MO 573 0 0.00 0 0.00 25 4.36 0 0.00 0 0.00 2 0.35 0 0.00
MS 163 0 0.00 0 0.00 47 28.83 0 0.00 0 0.00 0 0.00 0 0.00

RACIAL AND ETHNIC DISPARITIES IN SPECIAL EDUCATION 40
State
Total number of districts
American Indian or Alaska Native: Number
American Indian or Alaska Native: Percent
Asian: Number
Asian: Percent
Black or African American: Number
Black or African American: Percent
Hispanic/Latino: Number
Hispanic/Latino: Percent
Native Hawaiian or Other Pacific Islander: Number
Native Hawaiian or Other Pacific Islander: Percent
Two or more races: Number
Two or more races: Percent
White: Number
White: Percent
MT 422 1 0.24 0 0.00 1 0.24 1 0.24 0 0.00 0 0.00 0 0.00
NC 250 0 0.00 0 0.00 26 10.40 0 0.00 0 0.00 0 0.00 0 0.00
ND 184 0 0.00 0 0.00 2 1.09 1 0.54 0 0.00 0 0.00 0 0.00
NE 280 0 0.00 0 0.00 5 1.79 0 0.00 0 0.00 0 0.00 1 0.36
NH 178 0 0.00 0 0.00 1 0.56 1 0.56 0 0.00 0 0.00 0 0.00
NJ 691 0 0.00 0 0.00 62 8.97 7 1.01 0 0.00 0 0.00 1 0.14
NM 150 0 0.00 0 0.00 1 0.67 2 1.33 0 0.00 0 0.00 0 0.00
NV 19 0 0.00 0 0.00 1 5.26 0 0.00 0 0.00 0 0.00 1 5.26
NY 1,008 2 0.20 0 0.00 65 6.45 4 0.40 0 0.00 1 0.10 2 0.20
OH 1,100 0 0.00 0 0.00 70 6.36 4 0.36 0 0.00 3 0.27 0 0.00
OK 550 1 0.18 0 0.00 6 1.09 0 0.00 0 0.00 0 0.00 0 0.00
OR 208 0 0.00 0 0.00 3 1.44 0 0.00 0 0.00 2 0.96 1 0.48
PA 738 0 0.00 0 0.00 65 8.81 4 0.54 0 0.00 1 0.14 0 0.00
RI 57 3 5.26 0 0.00 2 3.51 3 5.26 0 0.00 0 0.00 0 0.00
SC 109 0 0.00 0 0.00 19 17.43 0 0.00 0 0.00 0 0.00 0 0.00
SD 156 2 1.28 0 0.00 0 0.00 1 0.64 0 0.00 0 0.00 0 0.00
TN 142 0 0.00 0 0.00 21 14.79 0 0.00 0 0.00 0 0.00 0 0.00
TX 1,256 0 0.00 0 0.00 58 4.62 3 0.24 0 0.00 1 0.08 0 0.00
UT 132 0 0.00 0 0.00 1 0.76 0 0.00 0 0.00 0 0.00 0 0.00
VA 151 0 0.00 0 0.00 22 14.57 0 0.00 0 0.00 1 0.66 0 0.00
VT 339 0 0.00 0 0.00 0 0.00 0 0.00 0 0.00 0 0.00 0 0.00
WA 305 0 0.00 0 0.00 9 2.95 1 0.33 0 0.00 0 0.00 1 0.33
WI 456 5 1.10 0 0.00 36 7.89 0 0.00 0 0.00 5 1.10 0 0.00
WV 57 0 0.00 0 0.00 2 3.51 0 0.00 0 0.00 0 0.00 0 0.00
WY 61 0 0.00 0 0.00 0 0.00 0 0.00 0 0.00 0 0.00 0 0.00
Total 17,371 34 0.20 2 0.01 1,068 6.15 65 0.37 0 0.00 31 0.18 15 0.09 1Medians and MADs exclude risk ratios of 0.


