
R in the statistical office: The UNIDO
experience
V. Todorov1
1United Nations Industrial Development Organization, Vienna
New Challenges for Statistical Software: The 5th International
Conference
Bucharest, Romania 6-7 November, 2017
Todorov (UNIDO) R in UNIDO uRos’2017 1 / 135

Outline
1 About UNIDO, UNIDO Statistics and R
2 R for Data Exchange
3 R as a graphical engine: package yearbook
4 Imputation of Key Indicators: package unidoCIP2
5 REST APIs
6 Industrial statistics for business structure: package indstat
7 Competitive Industrial Performance (CIP) index: package CItools
8 Maintenance of UNIDO databases with R
9 Technical assistance
10 Other topics
11 Summary and conclusions
Todorov (UNIDO) R in UNIDO uRos’2017 2 / 135

About UNIDO, UNIDO Statistics and R
Outline
1 About UNIDO, UNIDO Statistics and R
2 R for Data Exchange
3 R as a graphical engine: package yearbook
4 Imputation of Key Indicators: package unidoCIP2
5 REST APIs
6 Industrial statistics for business structure: package indstat
7 Competitive Industrial Performance (CIP) index: package CItools
8 Maintenance of UNIDO databases with R
9 Technical assistance
10 Other topics
11 Summary and conclusions
Todorov (UNIDO) R in UNIDO uRos’2017 3 / 135

About UNIDO, UNIDO Statistics and R
About UNIDO
• UNIDO was set up in 1966
• Became a specialized agency of the UN in 1985
• Promote industrialization throughout the developing world
• 168 Member States (as of January 2017)
• Headquarters in Vienna
• Represented in 35 developing countries
Todorov (UNIDO) R in UNIDO uRos’2017 4 / 135

About UNIDO, UNIDO Statistics and R
About UNIDO Statistics
• Service Module ”Industrial Governance and Statistics”:
I monitor, benchmark and analyse the industrial performance and
capabilitiesI formulate, implement and monitor strategies, policies and
programmes to improve the contribution of industry to
productivity growth and the achievement of the Sustainable
Development Goals (SDG)I UNIDO is a custodian agency for six SDG indicators in Goal 9.
• Building capabilities in industrial statistics - providing technicalassistance to:
I Introduce best practice methodologies and software systemsI Enhance the quality and consistency of the industrial statistics
databases
Todorov (UNIDO) R in UNIDO uRos’2017 5 / 135

About UNIDO, UNIDO Statistics and R
About UNIDO Statistics
Todorov (UNIDO) R in UNIDO uRos’2017 6 / 135

R for Data Exchange
Outline
1 About UNIDO, UNIDO Statistics and R
2 R for Data Exchange
3 R as a graphical engine: package yearbook
4 Imputation of Key Indicators: package unidoCIP2
5 REST APIs
6 Industrial statistics for business structure: package indstat
7 Competitive Industrial Performance (CIP) index: package CItools
8 Maintenance of UNIDO databases with R
9 Technical assistance
10 Other topics
11 Summary and conclusions
Todorov (UNIDO) R in UNIDO uRos’2017 7 / 135

R for Data Exchange
R for Data Exchange (R interfaces)
• Using a statistical system is not done in isolation
• Import data for analysis
• Export data for further processing ⇒ use the right tool for the
right work
• Export results for report writing
• Even in a small research department (UNIDO):
I SAS, Stata, Eviews, Octave, SPSS and R user
Todorov (UNIDO) R in UNIDO uRos’2017 8 / 135

R for Data Exchange
R for Data Exchange (R interfaces)
• Accessing data from other statistical packages: packages
foreign and haven
• Accessing data on the Internet
• Reading and writing Excel files: readxl and XLConnect
• JSON processing: packages rjson and jsonlite
• XML processing: package XML
• SDMX interface: packages sdmxer and rsdmx
• Communication with RDBMS
• Accessing native code written in C, C++, Java, Fortran
• Using Matlab functionality, particularly dynamic graphics for
robust statistics and outlier detection: package fsdaR
Todorov (UNIDO) R in UNIDO uRos’2017 9 / 135

R as a graphical engine: package yearbook
Outline
1 About UNIDO, UNIDO Statistics and R
2 R for Data Exchange
3 R as a graphical engine: package yearbook
4 Imputation of Key Indicators: package unidoCIP2
5 REST APIs
6 Industrial statistics for business structure: package indstat
7 Competitive Industrial Performance (CIP) index: package CItools
8 Maintenance of UNIDO databases with R
9 Technical assistance
10 Other topics
11 Summary and conclusions
Todorov (UNIDO) R in UNIDO uRos’2017 10 / 135
R as a graphical engine: package yearbook
R as a graphical engine: package yearbook
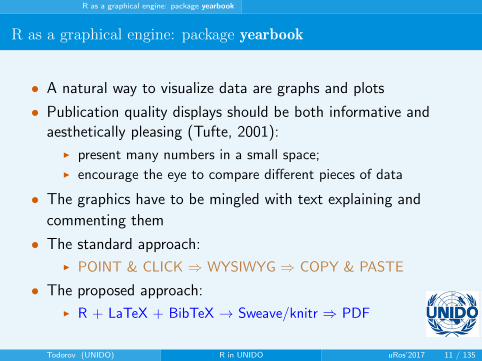
• A natural way to visualize data are graphs and plots
• Publication quality displays should be both informative andaesthetically pleasing (Tufte, 2001):
I present many numbers in a small space;I encourage the eye to compare different pieces of data
• The graphics have to be mingled with text explaining and
commenting them
• The standard approach:
I POINT & CLICK ⇒ WYSIWYG ⇒ COPY & PASTE
• The proposed approach:
I R + LaTeX + BibTeX → Sweave/knitr ⇒ PDF
Todorov (UNIDO) R in UNIDO uRos’2017 11 / 135

R as a graphical engine: package yearbook
Example 1: International Yearbook of Industrial Statistics
• A unique and comprehensive source of information, the only
international publication providing worldwide statistics on
performance and trends in the manufacturing sector.
• Designed to facilitate international comparisons relating to
manufacturing activity, industrial development and performance.
• Data which can be used to analyze patterns of growth and
related long term trends, structural change and industrial
performance in individual industries.
• A graphical section presenting the major trends of growth and
distribution of manufacturing in the world.
Todorov (UNIDO) R in UNIDO uRos’2017 12 / 135

R as a graphical engine: package yearbook
Example 1: International Yearbook of Industrial Statistics
Todorov (UNIDO) R in UNIDO uRos’2017 13 / 135

R as a graphical engine: package yearbook
Example 1: International Yearbook of Industrial Statistics
Todorov (UNIDO) R in UNIDO uRos’2017 14 / 135

R as a graphical engine: package yearbook
Yearbook graphics: requirements
• The software tool we are looking for should fulfil as a minimumthe following requirements
I Create publication quality graphicsI Interface easily with the other components of the production
line (SAS , Sybase, .Net)I Comply with the submission guidelines of the publisher - e.g.
the final document must contain only embedded fonts.I Provide means for easy text and image placement. Whenever
the data are changed the document should be (preferably
automatically) regenerated.I Use the same fonts in figure labels as in the main documentI Easy to maintain and extend
Todorov (UNIDO) R in UNIDO uRos’2017 15 / 135

R as a graphical engine: package yearbook
The components: Graphics
• One of the most important strengths of R: simple exploratory
graphics as well as well-designed publication quality plots
• The graphics can include mathematical symbols and formulae
where needed
• Can produce graphics in many formats:
I On screenI PS and PDF for including in LaTex and pdfLaTeX or for
distributionI PNG or JPEG for the WebI On Windows, metafiles for Word, PowerPoint, etc
Todorov (UNIDO) R in UNIDO uRos’2017 16 / 135

R as a graphical engine: package yearbook
The components: TeX and LaTeX
• TeX: a typesetting system (computer program) for producing
nicely printed, publication quality output, freely available:
Donald E. Knuth, 1974
• LaTeX: a component designed to shield the author from thedetails of TeX; Lamport (1994)
I Available for free from http://www.latex-project.org/ftp.html
for Linux, MacOs and Windows.
• BibTeX: A simple tool to create a bibliography in a LaTeX
document a uniform style is achieved, which easily can be
replaced by another a unified library of references shared among
publications and authors
Todorov (UNIDO) R in UNIDO uRos’2017 17 / 135

R as a graphical engine: package yearbook
The components: Sweave
• A suitable tool that allows to embed the code for complete data
analysis in documents (see Leisch, 2002)
• Create dynamic reports, which can be updated automatically if
data or analysis change
• The master document (.Rnw) contains:
I the necessary programming code for obtaining of the graphs,
tables, etc. written in RI the text written in LaTeX
• The document is run through R
I all the data analysis is performed on the flyI the generated output - tables, graphs, etc. is inserted into the
final LaTeX document.
Todorov (UNIDO) R in UNIDO uRos’2017 18 / 135

R as a graphical engine: package yearbook
Example 2: Annual Industrial Survey: Oman
Todorov (UNIDO) R in UNIDO uRos’2017 19 / 135

R as a graphical engine: package yearbook
Example 3: Competitive Industrial performance (CIP) Index
Todorov (UNIDO) R in UNIDO uRos’2017 20 / 135

Imputation of Key Indicators: package unidoCIP2
Outline
1 About UNIDO, UNIDO Statistics and R
2 R for Data Exchange
3 R as a graphical engine: package yearbook
4 Imputation of Key Indicators: package unidoCIP2
5 REST APIs
6 Industrial statistics for business structure: package indstat
7 Competitive Industrial Performance (CIP) index: package CItools
8 Maintenance of UNIDO databases with R
9 Technical assistance
10 Other topics
11 Summary and conclusions
Todorov (UNIDO) R in UNIDO uRos’2017 21 / 135

Imputation of Key Indicators: package unidoCIP2
Manufacturing and industrial statistics
• Industrial development is a driver of structural change which is
key in the process of economic development.
• Industrial statistics allow to identify and rank the key production
sectors, major economic zones in the country, major size classes• Specialized and structural statistics on industry (as well as on
other economic sectors) are demanded more than ever byresearchers and analysts to assess implications of the process ofthe globalization to individual countries:
I Synthesized data on world development trends.I Internationally comparable data to assess the growth and
structure of one region in the world vis-a-vis others.I A complete set of data on their field of interest to avoid
measurement discrepancies.I Regular data production to update/correct policy measures.
Todorov (UNIDO) R in UNIDO uRos’2017 22 / 135

Imputation of Key Indicators: package unidoCIP2
Structural statistics for industry: UNIDO databases
UNIDO databases
• Cover the manufacturing sector
• Refer to economic statistics, mainly production and trade
related, not technological or environmental data
• Include statistical data from the annual observation within the
quality assurance framework (no experimental or one-time study
data)
• Official data supplied by NSOs (abided by the resolution of UN
Statistics Commission)
• Further details:
http://www.unido.org/index.php?id=1002103
• Follow the UNIDO Quality Framework (Upadhyaya and Todorov,
2008, 2012)Todorov (UNIDO) R in UNIDO uRos’2017 23 / 135

Imputation of Key Indicators: package unidoCIP2
UNIDO databases: summary
• INDSTAT DB
• by ISIC and by country
• Number of establishments
• Number of employees
• Number of female
employees
• Wages and salaries
• Gross output
• Value added
• Gross fixed capital
formation
• Index numbers of
industrial production
• MVA DB
• by country
• GDP at current prices
• GDP at constant
prices
• MVA at current prices
• MVA at constant
prices
• Population
• IDSB
• by ISIC and by country
• Output = Y
• Import= M
• Export = X
• Apparent consumption
= C
C = Y + M − X
Todorov (UNIDO) R in UNIDO uRos’2017 24 / 135

Imputation of Key Indicators: package unidoCIP2
UNIDO Statistics online portal
http://stat.unido.org/
Todorov (UNIDO) R in UNIDO uRos’2017 25 / 135

Imputation of Key Indicators: package unidoCIP2
Imputation and nowcasting in international statistics
Survey data (micro)
• Multiple variables observed for a sample of observation units
from a population at one point in time
• Gaps in the data are classified as:
I Item non-responseI Unit non-responseI Variables not included in the survey
Time series data (macro)
• Contain data for multiple time periods
• Contain data for aggregate (or macro) units (sections)
• Sections are usually countries
• Variables are usually statistical indicators (like GDP, MVA, etc.)Todorov (UNIDO) R in UNIDO uRos’2017 26 / 135

Imputation of Key Indicators: package unidoCIP2
A. Imputation INDSTAT: Cross-sectional time series data
• Four different types of time series data structures (Denk andWeber, 2011):
1. Single univariate time series
2. Single multivariate time series
3. Cross-sectional univariate time series
4. Cross-sectional multivariate time series
• Missingness patterns The relevance and applicability of missingdata techniques depends on:
1. missing items;
2. missing periods,
3. missing variables, and
4. missing sections (countries).
Todorov (UNIDO) R in UNIDO uRos’2017 27 / 135

Imputation of Key Indicators: package unidoCIP2
A. Imputation INDSTAT: Description of the data set
Variables of interest
1. GO - Gross output
2. VA - Value added
3. WS - Wages and salaries
4. EMP - Number of employees
Auxiliary variables
1. IIP - Index of Industrial Production
2. MVA - Manufacturing Value Added (from SNA)
3. IMVA - Index of MVA
4. CPI - Consumer price index
Todorov (UNIDO) R in UNIDO uRos’2017 28 / 135

Imputation of Key Indicators: package unidoCIP2
A. Imputation INDSTAT: Description of the data set
The following variables will not be considered:
• GFCF - Gross fixed capital formation—the economic relation to
GO and VA is too weak
• EST - Number of establishments—too heterogeneous due to
difference in definitions
Todorov (UNIDO) R in UNIDO uRos’2017 29 / 135

Imputation of Key Indicators: package unidoCIP2
A. Imputation INDSTAT: Analysis of the missingness
Package VIM
• VIM—”Visualization and Imputation of Missing Values“
• An R package (Temple et al., 2010)
• Tools for visualization of missing values, useful for exploring the
data and the structure of the missing values
• May help to identify the mechanism generating the missings
What to analyze
• Time series evolution of missingness
• The multivariate dependence in the missingness across the
variables
Todorov (UNIDO) R in UNIDO uRos’2017 30 / 135

Imputation of Key Indicators: package unidoCIP2
A. INDSTAT: Time series evolution of missingness (main)
0.0
0.2
0.4
0.6
0.8
1.0
Employment
1991
1992
1993
1994
1995
1996
1997
1998
1999
2000
2001
2002
2003
2004
2005
2006
2007
2008
2009
2010
mis
sing
0.0
0.2
0.4
0.6
0.8
1.0
Wages and Salaries
1991
1992
1993
1994
1995
1996
1997
1998
1999
2000
2001
2002
2003
2004
2005
2006
2007
2008
2009
2010
mis
sing
0.0
0.2
0.4
0.6
0.8
1.0
Gross Output
1991
1992
1993
1994
1995
1996
1997
1998
1999
2000
2001
2002
2003
2004
2005
2006
2007
2008
2009
2010
mis
sing
0.0
0.2
0.4
0.6
0.8
1.0
Value Added
1991
1992
1993
1994
1995
1996
1997
1998
1999
2000
2001
2002
2003
2004
2005
2006
2007
2008
2009
2010
mis
sing
Todorov (UNIDO) R in UNIDO uRos’2017 31 / 135

Imputation of Key Indicators: package unidoCIP2
A. INDSTAT: Time series evolution of missingness (auxiliary)
0.0
0.2
0.4
0.6
0.8
1.0
IIP
1991
1992
1993
1994
1995
1996
1997
1998
1999
2000
2001
2002
2003
2004
2005
2006
2007
2008
2009
2010
mis
sing
0.0
0.2
0.4
0.6
0.8
1.0
CPI
1991
1992
1993
1994
1995
1996
1997
1998
1999
2000
2001
2002
2003
2004
2005
2006
2007
2008
2009
2010
mis
sing
0.0
0.2
0.4
0.6
0.8
1.0
IMVA
1991
1992
1993
1994
1995
1996
1997
1998
1999
2000
2001
2002
2003
2004
2005
2006
2007
2008
2009
2010
mis
sing
Todorov (UNIDO) R in UNIDO uRos’2017 32 / 135

Imputation of Key Indicators: package unidoCIP2
A. INDSTAT: Multivariate dependence of missingness across
variablesP
ropo
rtio
n of
mis
sing
s
0.00
0.05
0.10
0.15
0.20
0.25
Out
put
IIP CP
I
Com
bina
tions
Out
put
IIP CP
I
1352
301
258
207
97
89
89
67
Pro
port
ion
of m
issi
ngs
0.00
0.05
0.10
0.15
0.20
0.25
Out
put
IMV
A
CP
I
Com
bina
tions
Out
put
IMV
A
CP
I
1592
507
163
118
38
23
18
1
Todorov (UNIDO) R in UNIDO uRos’2017 33 / 135

Imputation of Key Indicators: package unidoCIP2
A. Imputation INDSTAT: Deterministic approach based on
economic relations
• Impute the four variables of interest using economic relationships
between the variables.
• Start with estimation of the missing observations for Gross
output based on available production indexes or Value added.
• Estimate Value added, Wages and salaries and Employment on
the basis of past trends in the relationships between output and
these three variables.
• At total manufacturing level.
Todorov (UNIDO) R in UNIDO uRos’2017 34 / 135

Imputation of Key Indicators: package unidoCIP2
A. Imputation INDSTAT: Deterministic approach: algorithm
STEP 1
Imputation of GO using IIP and CPI:
• EGOt = GOt−1(1 + IIPt:0CPIt:0−IIPt−1:0CPIt−1:0
IIPt−1:0CPIt−1:0)
STEP 2
Imputation of GO using VA and lagged ratio GO/VA
• EGOt = VAtGOt−1
VAt−1)
STEP 3
Imputation of GO using IMVA and CPI
• EGOt = GOt−1(1 + IMVAt:0CPIt:0−IMVAt−1:0CPIt−1:0
IMVAt−1:0CPIt−1:0)
Todorov (UNIDO) R in UNIDO uRos’2017 35 / 135

Imputation of Key Indicators: package unidoCIP2
A. Imputation INDSTAT: Deterministic approach: algorithm II
STEP 4
Imputation of VA using GO and lagged ratio VA/GO
• EVAt = GOtVAt−1
GOt−1)
STEP 5
Imputation of WS using VA and lagged ratio WS/VA
• EWSt = VAtWSt−1
VAt−1)
STEP 6
Imputation of EMP using real VA and lagged ratio EMP/real VA
• EEMPt = VAt/CPItEMPt−1
VAt−1/CPIt−1
Todorov (UNIDO) R in UNIDO uRos’2017 36 / 135

Imputation of Key Indicators: package unidoCIP2
A. Imputation INDSTAT: Deterministic approach: algorithm III
STEP 7
Imputation at industry level: will be based on the observed share of the industry
in the manufacturing total. There are three ways to compute these shares:
• Historical average share. This method is based on the average share
observed over the full history of the series and does not take into account
time-variation in the industrial structure of the country. It is also sensitive
to outliers.
• Historical median share. The share is estimated by taking the median of the
whole history of the series. It is less sensitive to outliers than the average,
but also does not take into account time-variation in the industrial structure
of the country.
• Lagged share. This method takes the (imputed) share of the preceding year.
It takes the time-varying structure of the economy into account, but is a
less efficient estimate since it is based on only one observation and sensitive
to outliers in that one observation.Todorov (UNIDO) R in UNIDO uRos’2017 37 / 135

Imputation of Key Indicators: package unidoCIP2
A. Imputation INDSTAT: Deterministic approach: Example 1:
Egypt
Imputation of all missing values using IIP and CPI
Todorov (UNIDO) R in UNIDO uRos’2017 38 / 135

Imputation of Key Indicators: package unidoCIP2
A. Imputation INDSTAT: Deterministic approach: Example 2:
imputation by industry
Todorov (UNIDO) R in UNIDO uRos’2017 39 / 135

Imputation of Key Indicators: package unidoCIP2
B. Nowcasting MVA for cross-country comparison
• UNIDO maintains a unique industrial statistics database
(INDSTAT)— updated regularly with data collected from NSOs
• A separate database—compilation of statistics related to
MVA—growth rate and share in GDP
• Published in the International Yearbook of Industrial Statistics
and on the statistical pages of the UNIDO web site
• For current economic analysis it is crucial that the Yearbook
presents data for the most recent years
• The database consists of annual values of MVA and GDP at
constant 2010 prices for around 200 countries
Todorov (UNIDO) R in UNIDO uRos’2017 40 / 135

Imputation of Key Indicators: package unidoCIP2
B. Nowcasting MVA (II)
• GDP data are available up to the current year:
I For earlier years the actual GDP values are usedI For the most recent one or two years the GDP values are
derived from the nowcasts of GDP growth rates reported in the
World Economic Outlook of IMF (see Artis, 1996)
• MVA—a time-gap of at least one year: nowcasting
• MVA is strongly connected to the GDP
• ⇒ this suggests to nowcast MVA on the basis of the estimated
relationship between contemporaneous values of MVA and GDP
Todorov (UNIDO) R in UNIDO uRos’2017 41 / 135
Imputation of Key Indicators: package unidoCIP2
B. Nowcasting MVA—the model
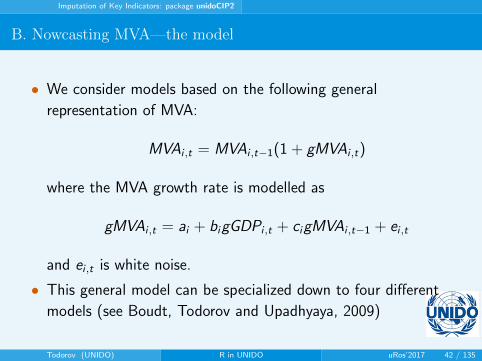
• We consider models based on the following general
representation of MVA:
MVAi ,t = MVAi ,t−1(1 + gMVAi ,t)
where the MVA growth rate is modelled as
gMVAi ,t = ai + bigGDPi ,t + cigMVAi ,t−1 + ei ,t
and ei ,t is white noise.
• This general model can be specialized down to four different
models (see Boudt, Todorov and Upadhyaya, 2009)
Todorov (UNIDO) R in UNIDO uRos’2017 42 / 135

Imputation of Key Indicators: package unidoCIP2
B. Nowcasting MVA—Outliers (example)
Todorov (UNIDO) R in UNIDO uRos’2017 43 / 135

Imputation of Key Indicators: package unidoCIP2
B. Nowcasting MVA—estimation
• The standard OLS estimator may be biased because of
I violation of the assumption of exogeneity of the regressors with
respect to the error termI presence of outliers in the data
• What are outliers?
I atypical observations which are inconsistent with the rest of the
data or deviate from the postulated modelI may arise through contamination, errors in data gathering, or
misspecification of the modelI classical statistical methods are very sensitive to such data
• For this reason we also consider a robust alternative to the OLS
estimator, namely the MM-estimator
Todorov (UNIDO) R in UNIDO uRos’2017 44 / 135

Imputation of Key Indicators: package unidoCIP2
B. Nowcasting MVA
Todorov (UNIDO) R in UNIDO uRos’2017 45 / 135

Imputation of Key Indicators: package unidoCIP2
B. Nowcasting MVA—MM-estimator
• Robust methods: produce reasonable results even when one or
more outliers may appear in the data
• The MM-regression estimator is a two step estimator:I First step—S-estimator—estimates the parameter vector that
minimizes the sum of the 50% smallest square residualsI This estimate is used as a starting value for M-estimation where
a loss function is minimized that downweights outliers
• Has a high efficiency under the linear regression model with
normally distributed errors
• Because of the initialization with an S-estimates it is highly
robust
• For details see Maronna et al. (2006)
• R code available in package robustbase
Todorov (UNIDO) R in UNIDO uRos’2017 46 / 135

REST APIs
Outline
1 About UNIDO, UNIDO Statistics and R
2 R for Data Exchange
3 R as a graphical engine: package yearbook
4 Imputation of Key Indicators: package unidoCIP2
5 REST APIs
6 Industrial statistics for business structure: package indstat
7 Competitive Industrial Performance (CIP) index: package CItools
8 Maintenance of UNIDO databases with R
9 Technical assistance
10 Other topics
11 Summary and conclusions
Todorov (UNIDO) R in UNIDO uRos’2017 47 / 135

REST APIs
Accessing international statistical databases with R
• Economics studies (e.g. competitiveness analysis or
benchmarking) - necessary to access different sources of data.
• Many international organizations maintain statistical databaseswhich cover certain types of data:
I COMTRDAE, UNCTAD and WTO for international trade data,I World development indicators (WDI) from the World bank,I World Economic Outlook (WEO) and International Financial
statistics (IFS) from the International Monetary Fund (IMF),I OECD and EUROSTAT: any data for their member states,I Industrial statistics databases (INDSTAT) by UNIDO.
• Some of these organizations already provide application program
interface (API) for accessing the data.
• How to use these APIs in R?
Todorov (UNIDO) R in UNIDO uRos’2017 48 / 135

REST APIs
World Development Indicators (WDI)
• A comprehensive collection of cross-country comparable
development indicators
• Compiled from officially-recognized international sources.
• Contains more than 1300 time series for more than 200
economies, for more than 50 years.
• The R package WDI makes it easy to search and download data
from the WDI.
• The package is available from CRAN.
Todorov (UNIDO) R in UNIDO uRos’2017 49 / 135

REST APIs
World Development Indicators (WDI)
• WDIsearch()—for searching for data and
• WDI()—for downloading the selected data into a data frame.
• Example:library("WDI")
co2list <- WDIsearch("CO2 emissions")
head(co2list)
indicator name
[1,] "EN.ATM.CO2E.CP.KT" "CO2 emissions from cement production (thousand metric tons)"
[2,] "EN.ATM.CO2E.FF.KT" "CO2 emissions from fossil-fuels, total (thousand metric tons)"
[3,] "EN.ATM.CO2E.FF.ZS" "CO2 emissions from fossil-fuels (% of total)"
[4,] "EN.ATM.CO2E.GF.KT" "CO2 emissions from gaseous fuel consumption (kt) "
[5,] "EN.ATM.CO2E.GF.ZS" "CO2 emissions from gaseous fuel consumption (% of total) "
[6,] "EN.ATM.CO2E.GL.KT" "CO2 emissions from gas flaring (thousand metric tons)"\end{Sinput}
• in WDIsearch() regular expressions can be used:WDIsearch("manufacturing.*value.*constant")
indicator name
[1,] "NV.IND.MANF.KD" "Manufacturing, value added (constant 2005 US$)"
[2,] "NV.IND.MANF.KN" "Manufacturing, value added (constant LCU)"
Todorov (UNIDO) R in UNIDO uRos’2017 50 / 135

REST APIs
World Development Indicators (WDI)
• Having identified the indicators, we can download the data for one or morecountries:
df.mva <- WDI("NV.IND.MANF.KD", country=c("IN","MY","ID"), start=1970, end=2013)
df.pop <- WDI("SP.POP.TOTL", country=c("IN","MY","ID"), start=1970, end=2013)
df <- merge(df.pop, df.mva)
names(df)[4:5] <- c("POP", "MVA")
df$MVACAP <- round(df$MVA/df$POP)
head(df)
iso2c country year POP MVA MVACAP
1 ID Indonesia 1970 114066887 2750076402 24
2 ID Indonesia 1971 116996006 2836927088 24
3 ID Indonesia 1972 119974444 3265345458 27
4 ID Indonesia 1973 123002081 3763262762 31
5 ID Indonesia 1974 126080548 4371172606 35
6 ID Indonesia 1975 129210098 4909605912 38
Todorov (UNIDO) R in UNIDO uRos’2017 51 / 135

REST APIs
World Development Indicators (WDI)
0
500
1000
1500
1970 1980 1990 2000 2010Year
MV
A p
er c
apita country
India
Indonesia
Malaysia
Figure: Manufacturing value added (MVA) per capita in India, Indonesia
and Malaysia, using data from World Development Indicators.Todorov (UNIDO) R in UNIDO uRos’2017 52 / 135

REST APIs
Eurostat tools for open data
• A CRAN package eurostat
• Finding data with the function get_eurostat_toc()
• Downloading data: bulk method (very fast) or JSON API,
function get_eurostat()
• Handling codes and labels: function label_eurostat()
• Visualization
Todorov (UNIDO) R in UNIDO uRos’2017 53 / 135

REST APIs
Example: Visualization of Eurostat data
• Example: Visualization of data downloaded from the Eurostat
database with the package eurostat
• Display the primary production of renewable energy by type (in
three groups) in the EU countries as a triangle plot
• Example from the vignette of the eurostat package, available at
https://cran.r-project.org/web/packages/eurostat/
vignettes/eurostat_tutorial.pdf
• Data set ”ten00081”
Todorov (UNIDO) R in UNIDO uRos’2017 54 / 135

REST APIs
Example: Visualization of Eurostat data
> ## Load some necessary packages
> library(eurostat)
> library(tidyr); library(plotrix)
> library(dplyr); library(tidyr)
> ## All sources of renewable energy are to be grouped into three sets
> dict <- c("Solid biofuels (excluding charcoal)" = "Biofuels",
+ "Biogasoline" = "Biofuels",
+ "Other liquid biofuels" = "Biofuels",
+ "Biodiesels" = "Biofuels",
+ "Biogas" = "Biofuels",
+ "Hydro power" = "Hydro power",
+ "Tide, Wave and Ocean" = "Hydro power",
+ "Solar thermal" = "Wind, solar, waste and Other",
+ "Geothermal Energy" = "Wind, solar, waste and Other",
+ "Solar photovoltaic" = "Wind, solar, waste and Other",
+ "Municipal waste (renewable)" = "Wind, solar, waste and Other",
+ "Wind power" = "Wind, solar, waste and Other",
+ "Bio jet kerosene" = "Wind, solar, waste and Other")
Todorov (UNIDO) R in UNIDO uRos’2017 55 / 135

REST APIs
Example: Visualization of Eurostat data
> ## Some cleaning of the data is required
> energy3 <- get_eurostat("ten00081") %>%
+ label_eurostat(dat) %>%
+ filter(time == "2013-01-01",
+ product != "Renewable energies") %>%
+ mutate(nproduct = dict[as.character(product)], # just three categories
+ geo = gsub(geo, pattern=" \\(.*", replacement="")) %>%
+ select(nproduct, geo, values) %>%
+ group_by(nproduct, geo) %>%
+ summarise(svalue = sum(values)) %>%
+ group_by(geo) %>%
+ mutate(tvalue = sum(svalue),
+ svalue = svalue/sum(svalue)) %>%
+ filter(tvalue > 1000) %>% # only large countries
+ spread(nproduct, svalue)
Todorov (UNIDO) R in UNIDO uRos’2017 56 / 135

REST APIs
Example: Visualization of Eurostat data
> ## Build the triangle plot
> par(cex=0.75, mar=c(0,0,0,0))
> positions <- plotrix::triax.plot(as.matrix(energy3[, c(3,5,4)]),
+ show.grid = TRUE, label.points= FALSE, point.labels = energy3$geo,
+ col.axis="gray50", col.grid="gray90",
+ pch = 19, cex.axis=0.8, cex.ticks=0.7, col="grey50")
> ## Larger labels
> ind <- which(energy3$geo %in% c("Norway", "Iceland","Denmark",
+ "Estonia", "Turkey", "Italy", "Finland"))
> df <- data.frame(positions$xypos, geo = energy3$geo)
> points(df$x[ind], df$y[ind], cex=2, col="red", pch=19)
> text(df$x[ind], df$y[ind], df$geo[ind], adj = c(0.5,-1), cex=1.5)
Todorov (UNIDO) R in UNIDO uRos’2017 57 / 135

REST APIs
Example: Visualization of Eurostat data
Hyd
ro p
ower
0.1
0.2
0.3
0.4
0.5
0.6
0.7
0.8
0.9
Wind, solar, w
aste and Other
0.1
0.2
0.3
0.4
0.5
0.6
0.7
0.8
0.9
0.9
0.8
0.7
0.6
0.5
0.4
0.3
0.2
0.1
Biofuels
●
●
●
●
●
●●
●●
●
●
●
●
●
●●
●
●
●
●
●
●●
●
●
●
●
●
●
●
●
●●
●
●●
●
●
DenmarkEstonia
Finland
IcelandItaly
Norway
Turkey
Todorov (UNIDO) R in UNIDO uRos’2017 58 / 135

REST APIs
UNIDO REST API
• dbList()—Returns the list of all available data sets (currently 9)
• dbInfo(db)—Returns the info about the content of a data set: countries,
variables, years, ISIC
• dbData(db, ...)—Retrieves data from data set ’db’.
• Example:
> for(db in dblist) ## print the names of all data sets
+ print(dbInfo(db=db)$dbname)
[1] "INDSTAT 2 2016, ISIC Revision 3"
[1] "INDSTAT 4 2016, ISIC Revision 3"
[1] "INDSTAT 4 2016, ISIC Revision 4"
[1] "IDSB 2016, ISIC Revision 3"
[1] "IDSB 2016, ISIC Revision 4"
[1] "MINSTAT 2016 ISIC Revision 3"
[1] "MINSTAT 2016 ISIC Revision 4"
[1] "MVA 2016"
[1] "CIP 2016"
Todorov (UNIDO) R in UNIDO uRos’2017 59 / 135

REST APIs
UNIDO REST API
• Retrieve data:
dbData(db=dblist[1], ct=100, variable=20, from=2000,
to=2006, isic=15)
country variable isic isicComb year value
1 100 20 15 NULL 2000 233600844
2 100 20 15 NULL 2001 232982867
3 100 20 15 NULL 2002 236882397
4 100 20 15 NULL 2003 350320309
5 100 20 15 NULL 2004 452031922
6 100 20 15 NULL 2005 547604073
7 100 20 15 NULL 2006 642608400
Todorov (UNIDO) R in UNIDO uRos’2017 60 / 135

Industrial statistics for business structure: package indstat
Outline
1 About UNIDO, UNIDO Statistics and R
2 R for Data Exchange
3 R as a graphical engine: package yearbook
4 Imputation of Key Indicators: package unidoCIP2
5 REST APIs
6 Industrial statistics for business structure: package indstat
7 Competitive Industrial Performance (CIP) index: package CItools
8 Maintenance of UNIDO databases with R
9 Technical assistance
10 Other topics
11 Summary and conclusions
Todorov (UNIDO) R in UNIDO uRos’2017 61 / 135

Industrial statistics for business structure: package indstat
Industrial statistics for business structure: package indstat
• National accounts to show the overall economic growth; business
structure data to reveal the growth potentials
• Industrial statistics allow to identify and rank the key production
sectors, major economic zones in the country, major size classes
• Employment and wage rate; share of compensation of employees
in VA
• Productivity, capacity utilization and other indicators of
economic performance
• Environment; use of cleaner energy; waste disposal system and
water treatment
Todorov (UNIDO) R in UNIDO uRos’2017 62 / 135

Industrial statistics for business structure: package indstat
Measuring the industrial performance
• Industrial performance is an outcome of various social, economicand technological factors. The three most important dimensionsof industrial performance are:
I Productivity,I Structural change andI Competitiveness
• Performance indicators
I Performance indicators make it possible to evaluate performance
(like, profitability, productivity and efficiency) of producers units.I In principle, a performance indicator is a policy relevant
statistics that provides an indication about the conditions and
functioning of any segment of the economy.
Todorov (UNIDO) R in UNIDO uRos’2017 63 / 135

Industrial statistics for business structure: package indstat
Types of performance indicators
• The performance indicators can broadly be distinguished underthree types, namely:
1. growth rates,
2. ratio indicators, and
3. share indicators.
• These indicators may be calculated at the 3-digit (group) level
for annual and at 2-digit (division) level of ISIC, Rev.4 for
quarterly periodicity.
Todorov (UNIDO) R in UNIDO uRos’2017 64 / 135

Industrial statistics for business structure: package indstat
The package indstat
Package: indstat
Date: 2015-07-08
Title: Statistical indicators of Industrial performance
Version: 0.2-01
Author: Valentin Todorov <[email protected]>
Description: Utilities, examples, data sets and other materials
for illustration of the computation of Industrial Performance
Indicators in R
Maintainer: Valentin Todorov <[email protected]>
Depends: laeken
Imports:
LazyLoad: yes
LazyData: yes
License: GPL (>= 2)
...
Todorov (UNIDO) R in UNIDO uRos’2017 65 / 135

Industrial statistics for business structure: package indstat
Industrial productivity
• Measures of productivity growth constitute core indicators forthe analysis of economic growth. The indicators of productivityare highly demanded by policy makers. Construction of theseindicators is based on the relation of different output and inputcomponents at the national, industrial sector, and enterpriselevels:
1. MVA per capita
2. Value added per employee
3. Value added per hour worked
4. Value added per unit of capital
5. Capital per employee
6. Multifactor productivity index
7. Value added output ratio
Todorov (UNIDO) R in UNIDO uRos’2017 66 / 135

Industrial statistics for business structure: package indstat
MVA per capita in the UN ESCWA member countries
Iraq
Syrian Arab Republic
Yemen
Sudan
State of Palestine
Egypt
Morocco
Jordan
Libya
Lebanon
Tunisia
Oman
Saudi Arabia
Kuwait
United Arab Emirates
Qatar
100 1000MVA per capita (log scale)
• Values in USD (log
scale)
• Data refer to year
2012 except Palestine
(2011) and Syria
(2010)
• Data source: UNIDO
Statistics
Todorov (UNIDO) R in UNIDO uRos’2017 67 / 135

Industrial statistics for business structure: package indstat
MVA per capita in the UN ESCWA member countries
Iraq
Syrian Arab Republic
Yemen
Sudan
State of Palestine
Egypt
Morocco
Jordan
Libya
Lebanon
Tunisia
Oman
Saudi Arabia
Kuwait
United Arab Emirates
Qatar
100 1000MVA per capita (log scale)
20122001
• Values in USD (log
scale)
• Data refer to years
2001 and 2012 except
Palestine (2011) and
Syria (2010)
• Data source: UNIDO
Statistics
Todorov (UNIDO) R in UNIDO uRos’2017 68 / 135

Industrial statistics for business structure: package indstat
MVA per capita on the map (UN ESCWA member countries)
Todorov (UNIDO) R in UNIDO uRos’2017 69 / 135

Industrial statistics for business structure: package indstat
Structural change
• Structural change
I Structures of MVA as well as international trade reflect the
country’s comparative advantages which depends mainly on the
country’s endowments of production capitals, low-wage labor
and natural resources as industrial materials.I The principal indicators are measured as the shift of sector
shares over a considerable interval of time.
• Shares and growth
I Structural change is closely connected with industrial growth.
On the one hand, structural change may accelerate growth
while, on the other hand, any growth may result in significant
structural change.I Both shares and growth indicators have to be considered
Todorov (UNIDO) R in UNIDO uRos’2017 70 / 135

Industrial statistics for business structure: package indstat
Measures of Industrial structure
1. Change in sector share
2. Coefficient of absolute structural change
3. Coefficient of relative structural change
4. Integral coefficient of structural change
5. Rank correlation
6. Coefficient of diversification
7. Regional disparity index
8. Position of manufacturing in economy (share of MVA in GDP)
• Indicators 1-5 consider shift in the shares in a certain period.
• Indicators 1-7 provide statistics for analysis of structural change
within the manufacturing industry.
• Details about the computation of the indicators can be found in
Industrial Statistics—Guidelines and MethodologyTodorov (UNIDO) R in UNIDO uRos’2017 71 / 135

Industrial statistics for business structure: package indstat
Measures of Industrial structure:Coefficient of diversification
The coefficient of diversification shows the extent to which the
production is spread across different manufacturing branches and is
based on the share of manufacturing branches in total output.
1990 1995 2000 2005
0.4
0.5
0.6
0.7
0.8
Diversification index
Year
Div
ersi
ficat
ion
inde
x
●
●
KuwaitOmanQatar
Todorov (UNIDO) R in UNIDO uRos’2017 72 / 135

Industrial statistics for business structure: package indstat
Structural change
• UNIDO Database is mainly the collection of business structure
statistics and provides detail information for structural change
analysis
• A number of classifications derived from ISIC are used toindicate the structural composition and its change over time
I Agro-based sectorsI Resource based-sectorsI Sectors by technological intensityI Sectors by energy intensity
Todorov (UNIDO) R in UNIDO uRos’2017 73 / 135

Competitive Industrial Performance (CIP) index: package CItools
Outline
1 About UNIDO, UNIDO Statistics and R
2 R for Data Exchange
3 R as a graphical engine: package yearbook
4 Imputation of Key Indicators: package unidoCIP2
5 REST APIs
6 Industrial statistics for business structure: package indstat
7 Competitive Industrial Performance (CIP) index: package CItools
8 Maintenance of UNIDO databases with R
9 Technical assistance
10 Other topics
11 Summary and conclusions
Todorov (UNIDO) R in UNIDO uRos’2017 74 / 135

Competitive Industrial Performance (CIP) index: package CItools
Competitive Industrial Performance (CIP) index
• The Competitive Industrial Performance (CIP) Index developed by UNIDO
aims at benchmarking industrial performance at the country level.
• In contrast to other competitiveness indices currently available, the CIP
index provides a unique crosscountry industrial performance benchmarking
and ranking based on quantitative indicators and a selected number of
industrial performance indicators.
• Rankings are provided at the global and regional levels, as well as by
adopting different country groupings for 148 countries in the 2017 edition.
• This offers governments the possibility to compare their country’s
competitive industrial performance with relevant comparators, that is, not
only with countries from the same region but also with countries at the
same stage of economic or industrial development across the globe.
• More at stat.unido.org
Todorov (UNIDO) R in UNIDO uRos’2017 75 / 135

Competitive Industrial Performance (CIP) index: package CItools
Competitive Industrial Performance (CIP) index (2)
• The CIP index combines 3 dimensions (comprising 8 indicators)of industrial performance into a single measure:
1. Capacity to produce and export manufactures (2)
2. Structural change towards manufactures and technology
intensive sectors (4)
3. Impact in world MVA and in world manufactures (2)
• Only quantitative indicators are considered.
Todorov (UNIDO) R in UNIDO uRos’2017 76 / 135

Competitive Industrial Performance (CIP) index: package CItools
Competitive Industrial Performance (CIP) index (2)
Todorov (UNIDO) R in UNIDO uRos’2017 77 / 135

Competitive Industrial Performance (CIP) index: package CItools
CIP Ranking
Ranking Country or territory CIP Index
2015 2010 2015 2010
1 37 1 37 Saudi Arabia 0.1001 0.1001
2 43 4 54 United Arab Emirates 0.0736 0.0644
3 48 5 56 Qatar 0.0700 0.0634
4 52 3 49 Kuwait 0.0614 0.0717
5 54 2 45 Bahrain 0.0594 0.0767
6 66 6 68 Oman 0.0416 0.0444
Todorov (UNIDO) R in UNIDO uRos’2017 78 / 135

Competitive Industrial Performance (CIP) index: package CItools
CIP Ranking
Todorov (UNIDO) R in UNIDO uRos’2017 79 / 135

Competitive Industrial Performance (CIP) index: package CItools
CIP presentation
MVApc
MXpc
MHVAsh
MVAsh
MHXsh
MXsh
ImWMVA
ImWMT
0 0.2 0.4 0.6 0.8 1
IndiaJapanUnited Kingdom
Todorov (UNIDO) R in UNIDO uRos’2017 80 / 135

Competitive Industrial Performance (CIP) index: package CItools
CIP profile I
Todorov (UNIDO) R in UNIDO uRos’2017 81 / 135

Competitive Industrial Performance (CIP) index: package CItools
CIP profile II
Todorov (UNIDO) R in UNIDO uRos’2017 82 / 135

Maintenance of UNIDO databases with R
Outline
1 About UNIDO, UNIDO Statistics and R
2 R for Data Exchange
3 R as a graphical engine: package yearbook
4 Imputation of Key Indicators: package unidoCIP2
5 REST APIs
6 Industrial statistics for business structure: package indstat
7 Competitive Industrial Performance (CIP) index: package CItools
8 Maintenance of UNIDO databases with R
9 Technical assistance
10 Other topics
11 Summary and conclusions
Todorov (UNIDO) R in UNIDO uRos’2017 83 / 135

Maintenance of UNIDO databases with R
Data screening
Todorov (UNIDO) R in UNIDO uRos’2017 84 / 135

Maintenance of UNIDO databases with R
Data screening
Todorov (UNIDO) R in UNIDO uRos’2017 85 / 135

Maintenance of UNIDO databases with R
Data screening
●
●
●
●
●●
● ● ●
●
2004 2006 2008 2010 2012
2628
3032
Time t
Indi
cato
r va
lue
x t
start value: xS*
relevant change: xS* ± δ
significant change: xS* ± (δ + 2 sx
2 + sxS*
2 )
●
●
●
●
●●
● ● ●
●●
●
●
●
●●
● ● ●
●
●
●
●
●
●●
●● ●
●
xS*
Todorov (UNIDO) R in UNIDO uRos’2017 86 / 135

Maintenance of UNIDO databases with R
Other databases
• Energy efficiency in manufacturing
• Database of intermediate consumption
• Database of Energy producing industries
Todorov (UNIDO) R in UNIDO uRos’2017 87 / 135

Technical assistance
Outline
1 About UNIDO, UNIDO Statistics and R
2 R for Data Exchange
3 R as a graphical engine: package yearbook
4 Imputation of Key Indicators: package unidoCIP2
5 REST APIs
6 Industrial statistics for business structure: package indstat
7 Competitive Industrial Performance (CIP) index: package CItools
8 Maintenance of UNIDO databases with R
9 Technical assistance
10 Other topics
11 Summary and conclusions
Todorov (UNIDO) R in UNIDO uRos’2017 88 / 135

Technical assistance
Technical assistance
• Motivation
1. Requests from policy makers from countries: Laos PDR,
Mozambique, Ethiopia
2. Requests from National Statistical Office (NSO) on problem
solving: Mongolia, Thailand.
3. Data coverage of the UNIDO Database: stat.unido.org
• Countries of developing and transitional economies
1. Countries with the least developed statistical system: Out of 50
LDCs 35 countries cannot report industrial data
2. Countries with developing statistical system: Need to improve
industrial statistics to meet growing demand
3. Countries in transition: Established statistical system, but data
are not internationally comparable
Todorov (UNIDO) R in UNIDO uRos’2017 89 / 135

Technical assistance
Main components of technical assistance
• Main components of technical assistance
I Business registerI Industrial censuses and surveysI Short-term indicators of industrial statisticsI Data processing system, management and disseminationI Data analysisI Training programs
• Approach
I Rapid responseI Integrated programI TC project in statisticsI Training program
Todorov (UNIDO) R in UNIDO uRos’2017 90 / 135

Technical assistance
Training courses in R
• Example program (Amman, May 2015; Yerevan 2017)
1. Introduction to R and RStudio; getting help and documentation
2. Data types and data structures; data management
3. Data import and export; accessing databases
4. R variables and operators; R flow control; functions
5. Tables
6. Using R packages
7. Exploring and visualizing data: overview, boxplots, histograms,
plots of tabular data;
8. Generating dynamical reports
9. Official Statistics: overview of some useful packages
10. Basic statistics
11. R learning resources
Todorov (UNIDO) R in UNIDO uRos’2017 91 / 135

Other topics
Outline
1 About UNIDO, UNIDO Statistics and R
2 R for Data Exchange
3 R as a graphical engine: package yearbook
4 Imputation of Key Indicators: package unidoCIP2
5 REST APIs
6 Industrial statistics for business structure: package indstat
7 Competitive Industrial Performance (CIP) index: package CItools
8 Maintenance of UNIDO databases with R
9 Technical assistance
10 Other topics
11 Summary and conclusions
Todorov (UNIDO) R in UNIDO uRos’2017 92 / 135

Other topics
Other topics
1. Outlier detection in business surveys and the package rrcovNA
2. Porting MATLAB software to R: the FSDA toolbox and the
package fsdaR
3. Machine learning for official statistics
4. IO Analysis, WIOD and the package rwiot
Todorov (UNIDO) R in UNIDO uRos’2017 93 / 135

Other topics Outlier detection in business surveys the package rrcovNA
Motivation example: Annual Industrial Survey in Oman: 2012
• Data collected in 2013-2014 with
reference year 2012
• Statistical unit: establishment
• Scope: covered all large
manufacturing establishments
licensed with the Ministry of
Commerce and Industry and
operating in the Sultanate of
Oman.
• Large=employing 10 or more
persons engaged
Todorov (UNIDO) R in UNIDO uRos’2017 94 / 135

Other topics Outlier detection in business surveys the package rrcovNA
• Initial frame: around 900 establishments
• Response - nearly 95% in terms of employment (701
establishments)
• The questionnaire:
I Following the “International Recommendations for Industrial
Statistics” of the United NationsI Activity classification: ISIC Revision 4I Product classification: CPC 2.0I 8 pages, more that 300 fieldsI Data entry: at MOCI, by trained staffI Strict formal validation
Todorov (UNIDO) R in UNIDO uRos’2017 95 / 135

Other topics Outlier detection in business surveys the package rrcovNA
• Collected data still had some inconsistencies
I Stem from insufficient understanding of the terms and concepts
appliedI There is a belief that information supplied would be transmitted
to the income tax authorities:hiding information related to
output and over-report on inputs.I A number of establishments are engaged in several equally
important but dissimilar activitiesI Difficulties providing data on consumption of electricity, water
and fuels separately; purchase of raw materials and sales from
own production by main product
Todorov (UNIDO) R in UNIDO uRos’2017 96 / 135

Other topics Outlier detection in business surveys the package rrcovNA
80 20 120
80 20 12080 20
Todorov (UNIDO) R in UNIDO uRos’2017 97 / 135

Other topics Outlier detection in business surveys the package rrcovNA
The data set selected for the example:
• One 2-digit ISIC Revision 4 division: 109 establishments
• 7 variables
PER Average number of persons engaged
EMP Number of employees
FEM Number of female employees
GWS Gross wages and salaries paid to the employees
ECV Electricity consumption (value)
WCV Water consumption (value)
FUEL Fuel purchased
• For 23 establishments all variables are missing
Todorov (UNIDO) R in UNIDO uRos’2017 98 / 135

Other topics Outlier detection in business surveys the package rrcovNA
Outliers in Sample Surveys
• ”Rule based” approach - identification by data specific edit rules
developed by subject matter experts followed by deletion and
imputation ← strictly deterministic, ignore the probabilistic
component, extremely labor intensive
• Univariate methods - favored for their simplicity. These are
informal graphical methods like histograms, box plots, dot plots;
quartile methods to create allowable range for the data; robust
methods like medians, Winsorized means, etc.
• Multivariate methods - rarely used although most of the business
surveys collect multivariate qualitative data
Todorov (UNIDO) R in UNIDO uRos’2017 99 / 135

Other topics Outlier detection in business surveys the package rrcovNA
The Challenges
• The methods must be able to work with moderate to large data
sets (hundreds of variables and tens of thousands of
observations) - therefore we consider computational speed a very
important criterion
• Survey data often contain missing values, therefore the methods
must be able to work with incomplete data
• The survey data are often skewed - use appropriate
transformations or special robust methods for skewed data
(Hubert et al., 2008)
• The methods must be able to cope with the complex sample
design of a survey using sampling weights
Difficult set-up: Large multivariate incomplete sample survey data
Todorov (UNIDO) R in UNIDO uRos’2017 100 / 135

Other topics Outlier detection in business surveys the package rrcovNA
Outliers and Robustness
Outlier detection and Robust estimation are closely related
1. Robust estimation: find an estimate which is not influenced by
the presence of outliers in the sample
2. Outlier detection: find all outliers, which could distort the
estimate
• If we have a solution to the first problem we can identify the
outliers using robust residuals or distances
• If we know the outliers we can remove or downweight them and
use classical estimation methods
• For the purposes of official statistics the second approach is
more appropriate
Todorov (UNIDO) R in UNIDO uRos’2017 101 / 135

Other topics Outlier detection in business surveys the package rrcovNA
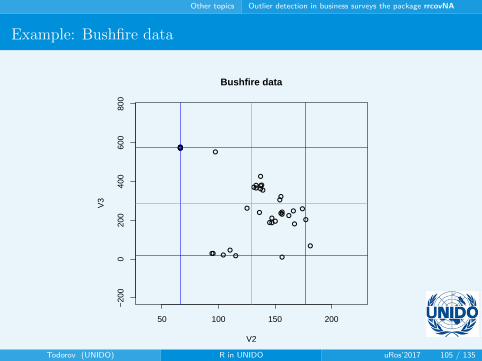
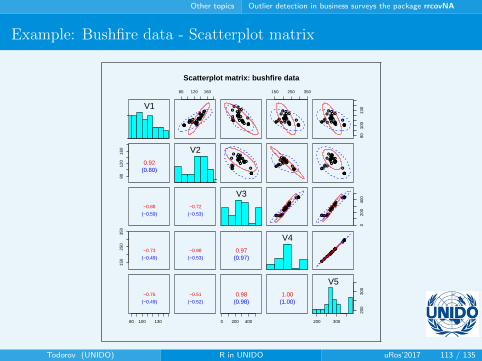
Example: Bushfire data
• A data set with 38 observations in 5 variables - Campbell (1989)
• Contains satellite measurements on five frequency bands,
corresponding to each of 38 pixels
• Used to locate bushfire scars
• Very well studied (Maronna and Yohai, 1995; Maronna and
Zamar, 2002)
• 12 clear outliers: 33-38, 32, 7-11; 12 and 13 are suspect
• Available in the R package robustbase
Todorov (UNIDO) R in UNIDO uRos’2017 102 / 135

Other topics Outlier detection in business surveys the package rrcovNA
Example: Bushfire data
●●●●
●●
●●● ● ● ●
●
●
●
●●●●●●●
●
●
●● ●● ●
●
●
●●●●●●●
50 100 150 200
−20
00
200
400
600
800
Bushfire data
V2
V3
Todorov (UNIDO) R in UNIDO uRos’2017 103 / 135

Other topics Outlier detection in business surveys the package rrcovNA
Example: Bushfire data
●●●●
●●
●●● ● ● ●
●
●
●
●●●●●●●
●
●
●● ●● ●
●
●
●●●●●●●
50 100 150 200
−20
00
200
400
600
800
Bushfire data
V2
V3
Todorov (UNIDO) R in UNIDO uRos’2017 104 / 135
Other topics Outlier detection in business surveys the package rrcovNA
Example: Bushfire data
●●●●
●●
●●● ● ● ●
●
●
●
●●●●●●●
●
●
●● ●● ●
●
●
●●●●●●●
50 100 150 200
−20
00
200
400
600
800
Bushfire data
V2
V3
Todorov (UNIDO) R in UNIDO uRos’2017 105 / 135

Other topics Outlier detection in business surveys the package rrcovNA
Example: Bushfire data
●●●●
●●
●●● ● ● ●
●
●
●
●●●●●●●
●
●
●● ●● ●
●
●
●●●●●●●
50 100 150 200
−20
00
200
400
600
800
Bushfire data
V2
V3
Todorov (UNIDO) R in UNIDO uRos’2017 106 / 135

Other topics Outlier detection in business surveys the package rrcovNA
Example: Bushfire data
●●●●
●●
●●● ● ● ●
●
●
●
●●●●●●●
●
●
●● ●● ●
●
●
●●●●●●●
50 100 150 200
−20
00
200
400
600
800
Bushfire data
V2
V3
Todorov (UNIDO) R in UNIDO uRos’2017 107 / 135

Other topics Outlier detection in business surveys the package rrcovNA
Example: Bushfire data
●●●●
●●
●●● ● ● ●
●
●
●
●●●●●●●
●
●
●● ●● ●
●
●
●●●●●●●
50 100 150 200
−20
00
200
400
600
800
Bushfire data
V2
V3
Todorov (UNIDO) R in UNIDO uRos’2017 108 / 135

Other topics Outlier detection in business surveys the package rrcovNA
Example: Bushfire data
●●●●
●●
●●● ● ● ●
●
●
●
●●●●●●●
●
●
●● ●● ●
●
●
●●●●●●●
50 100 150 200
−20
00
200
400
600
800
V2
V3
Bushfire data: robust tolerance ellipse
Todorov (UNIDO) R in UNIDO uRos’2017 109 / 135

Other topics Outlier detection in business surveys the package rrcovNA
Example: Bushfire data
●●●●
●●
●●● ● ● ●
●
●
●
●●●●●●●
●
●
●● ●● ●
●
●
●●●●●●●
50 100 150 200
−20
00
200
400
600
800
V2
V3
Bushfire data: robust tolerance ellipse
Todorov (UNIDO) R in UNIDO uRos’2017 110 / 135

Other topics Outlier detection in business surveys the package rrcovNA
Example: Bushfire data
●●●●
●●
●●● ● ● ●
●
●
●
●●●●●●●
●
●
●● ●● ●
●
●
●●●●●●●
50 100 150 200
−20
00
200
400
600
800
V2
V3
Bushfire data: robust tolerance ellipse
33−38
710 118−9
Todorov (UNIDO) R in UNIDO uRos’2017 111 / 135

Other topics Outlier detection in business surveys the package rrcovNA
Example: Bushfire data - Boxplots
●
●●●●●●
●●
●●●●●●●
V1 V2 V3 V4 V5
010
020
030
040
050
0
bushfire data
Todorov (UNIDO) R in UNIDO uRos’2017 112 / 135
Other topics Outlier detection in business surveys the package rrcovNA
Example: Bushfire data - Scatterplot matrix
V1
80 120 160
●●●●●
●●●●●●
●●
●
●●●●●●●●
●●
●●●●
●●
●
●
●●●●●●
●●●●●●●●●
●●
●
●
●
●●●●●●●●
●
●
●●●●●
●●
●
●●●●●●
150 250 350
●●●●●●●●●●
●
●●
●
●●●●●●●●
●●●●●●●●
●
●
●●●●●●
8010
013
0
●●●●●●●●●●
●
●●
●
●●●●●●●●
●●●●●●●●
●
●
●●●●●●
8012
016
0
(0.80)0.92
V2●●●●
●●
●●●●●
●
●
●●●●●●●●
●●
●●●●●●●
●
●
●●●●●●
●●●●●●●
●●●●
●●
●●●●●●●●●
●●●●●●●●
●
●●●●●●●
●●●●●●
●●●
●●
●
●
●●●●●●●●
●●
●●●●●●●
●
●
●●●●●●
(−0.59)
−0.88
(−0.53)
−0.72
V3
●●●●●●
●●●●●●●
●
●●●●●●●●
●●●●●●●●
●
●●●●●●●
020
040
0
●●●●●●
●●●●●●●
●
●●●●●●●●
●●●●●●●●
●
●●●●●●●
150
250
350
(−0.49)
−0.73
(−0.53)
−0.98
(0.97)0.97
V4
●●●●●●
●
●●●●
●●
●●●●●●●●●
●●●●●●
●●●
●●●●●●●
80 100 130
(−0.49)
−0.76
(−0.52)
−0.51
0 200 400
(0.98)0.98
(1.00)1.00
200 300
200
300
V5
Scatterplot matrix: bushfire data
Todorov (UNIDO) R in UNIDO uRos’2017 113 / 135

Other topics Outlier detection in business surveys the package rrcovNA
General Framework for Multivariate Outliers
Two phases (Rocke and Woodruff, 1996)
1. Calculate Robust Distances
I Obtain robust estimates of location T and scatter CI Calculate robust Mahalanobis-type distance
RDi =√
((xi − T)tC−1(xi − T))
2. Cutoff point: Determine separation boundary Q.
Declare points with RDi > Q, i.e. points which are sufficiently far from the
robust center as outliers.
Usually Q = χ2p(0.975) but see also Hardin and Rocke (2005), Filzmoser,
Garrett, and Reimann (2005), Cerioli, Riani, and Atkinson (2008).
Todorov (UNIDO) R in UNIDO uRos’2017 114 / 135

Other topics Outlier detection in business surveys the package rrcovNA
Outliers in Sample Surveys: Multivariate methods
• Statistics Canada (Franklin et al., 2000) - Annual Wholesale and
Retail Trade Survey (AWRTS)
• The EUREDIT project of the EU (Charlton 2004)
• Todorov et al. (2011): R package rrcovNA
• Bill and Hulliger (2015): R package modi
Todorov (UNIDO) R in UNIDO uRos’2017 115 / 135

Other topics Outlier detection in business surveys the package rrcovNA
The modi package
• Bill and Hulliger (2015)
• Available from R-Forge: https://r-forge.r-project.org/
I TRC - Transformed Rank Correlations - Beguin and Hulliger
(2004)I EA - Epidemic Algorithm - Beguin and Hulliger (2004)I BEM - Beguin and Hulliger (2008) - a combination of BACON
algorithm (Billor, Hadi and Vellemann 2000) and EM
• Data set sepe: anonymized sample of a pilot survey on
environment protection expenditures of the Swiss private
economy (1993).
All three algorithms can handle sampling weights
Todorov (UNIDO) R in UNIDO uRos’2017 116 / 135

Other topics Outlier detection in business surveys the package rrcovNA
> library(modi)
> library(car)
> data(sepe)
> vlist <- c(3:5, 8:11, 14)
> colnames(sepe)[vlist]
[1] "totinvwp" "totinvwm" "totinvap" "totinvto"
[5] "totexpwp" "totexpwm" "totexpap" "totexpto"
> sepex <- recode(as.matrix(sepe), "0=NA")
> logsepe <- log(sepex[, vlist] + 1)
## decrease the cutoff quantile for good observations
p <- nrow(logsepe)
> res <- BEM(logsepe, sepe$weight, c0=5, alpha=0.01/p)
BEM has detected 89 outlier(s) in 3.12 0 3.2 NA NA seconds.
> res$output$cutpoint
[1] 37.14862
Todorov (UNIDO) R in UNIDO uRos’2017 117 / 135

Other topics Outlier detection in business surveys the package rrcovNA
> plotMD(res$dist, p, alpha=0.95)
●●●●●●●●●●●●●●●●●●●●●●●●●●●●●●●●●●●●●●●●●●●●●●●●●●●●●●●●●●●●●●●●●●●●●●●●●●●●●●●●●●●●●●●●●●●●●●●●●●●●●●●●●●●●●●●●●●●●●●●●●●●●●●●●●●●●●●●●●●●●●●●●●●●●●●●●●●●●●●●●●●●●●●●●●●●●●●●●●●●●●●●●●
●●●●●●●●●●●●●●●●●●●●●●●●●●●●●●●●●●●●●●●●●●●●●●●●●●●●●●●●●●●●●●●●●●●●●●●●●●●●●●●●●●●●●●●●●●●●●●●●●●●●●●●●●●●●●●
●●●●●●●●●●●●●●●●●●●●●●●●●●●●●●●●●●●●●●●●●●●●●●●●●●●●●●●●●●●●●●●●●●●●●●●●●
●●●●●●●●●●●●●●●●●●●●●●●●●●●●●●●●●●●●●●●●●●
●●●●●●●●●●●●●●●●●●●●●●●●●●●●●●●●●
●●●●●●●●●●●●●●●●
●●●●●●●●●●●●●●●●●●●
●●●●●●●●●●●●●
●●●●●●●●
●●
●●
●
●●●●
●●●●
●
●
●
●
●
10 20 30 40
050
100
150
200
250
F−quantiles
MD
−qu
antil
es
QQ−Plot of Mahalanobis distances vs. F−distribution
alpha= 0.95 , hmed= 24.943 , halpha= 81.843 n.miss.dist= 0Todorov (UNIDO) R in UNIDO uRos’2017 118 / 135

Other topics Outlier detection in business surveys the package rrcovNA
0 2 4 6 8 10
02
46
810
data$totinvto
data
$tot
expt
o
●
●
●
●●
●
●
●●
●
●●
●
●
●
●
●
●
●●
●
●
●
●
●
●
●
●
●
●
●
●
●
●
●
●●● ●
●
●
●
●
●
●
● ●
●
●
●
●
●
●
●
●
●
●
●
●
●
●
●
●
● ●
●
●
●
●
●
●●●●●● ●
●
●
●
●
●
●
●
●
●●
●
●
●
●
●
●
●
●
●
●
●
●●
●
●
●
●
●
●
●●
●
●
●
●
●●
●
●
●
●
●●
●
●
●
●●
●●
●
●
●
●●
●
●
●●●
●
●
●
●●●
●
●●
●
●
●
●
●
●
●
●
●
●
●
●
●
●
●●
●
●
●
●
●
●
●
●
●●
●
●
●
●●●
●
●
●
●●● ●●●
●
●●●●
●
●
●
●
●
●
●
● ●
●
●
●
●
●
●
●
●
●
●
●
●
●
●
●
●●
●
●
●
●●●●●
●
●
●
●
●●
●
●
● ●
●
●●
●
●
●
●
●
●●
●
●●
●
●
●
●
●
● ●
●
●
● ●
●
●
●
●
●●
●
●
●
●
●
●
●
●
●
●
●
●
●● ●
●
●
●●
●
●●
●
●
●
●
●
●
●
●
●
●
●
●●●
●
●
●
● ●●
● ●
●
●
●
●
●
●
●●●●●●
●
●
●
●
●
●
●
●
●
● ●●●●●●
●●
●
●
●●
●
●●
●
●
●
●
●
●●
●
●
●●
●
●
●
●
●
●
●
●
●
●
●
●
●
●
●
●●
●
●
●
●
●
●
●
●
●
●●●
●
●
●
●
●●
●
●
●
●
●
●
●
●
●
●
●● ●
●●●
●
●●
●
●●
●●
●●
●
●●
Todorov (UNIDO) R in UNIDO uRos’2017 119 / 135

Other topics Outlier detection in business surveys the package rrcovNA
Handling of the detected outliers
> imp <- winsimp(data, res$output$center, res$output$scatter, outind)
> sum(imp$imputed.data < 0)
[1] 99
original.mean mean.norm mean.before mean.after
totinvwp 0.71 0.73 0.79 0.87
totinvwm 0.47 0.56 0.72 0.71
totinvap 0.88 1.00 1.05 1.14
totinvto 1.51 1.81 1.69 1.92
totexpwp 0.99 1.05 1.07 1.09
totexpwm 1.53 1.62 1.46 1.70
totexpap 0.48 0.47 0.48 0.55
totexpto 2.01 2.12 1.98 2.21
Determinant 4.86 16.01 4.32 11.05
Table: Means and determinant of the covariance matrix for original,
normally imputed and robustly imputed after re-introduction of zeros in
different steps
Todorov (UNIDO) R in UNIDO uRos’2017 120 / 135

Other topics Outlier detection in business surveys the package rrcovNA
The rrcovNA package
• Similar structure to rrcov: S4 classes with a number of
diagnostic and visualization functions
• Available at CRAN: https://cran.r-project.org/
• MCD, OGK, S - following an MVN imputation with an EM
algorithm
• Classical and robust PCA for incomplete data
• NEWI Deterministic MCD DETMCD and deterministic S DETS:
Hubert et al. (2012)I Generalized S estimates GSE: Danilov et al. (2012)I MCD with sampling weights: Ruckdeschel and TodorovI Cell-wise outlier detection: Rousseeuw and Van den Bossche
(2016)
Todorov (UNIDO) R in UNIDO uRos’2017 121 / 135

Other topics Examples
The example: AIS Oman 2012
> library(rrcov)
> cv <- CovMcd(oman); plot(cv, which="pairs")
PER
0 300 600
●
●
●
●
●●●●●
●●
●
●●●
●●
●●●
●
●
●●●●
●
●●
●
●
●
●●
●
●●●
●●●●●●●●●●●●●●●●●●●●●●●●●●
●●
●●●
●●●●●●●● ●
●
●
●
●●●●●●●
●
●●●
●●
●●●
●
●
●●●●
●
●●●
●
●
●●
●
●●●
●●●●●●●●●●●●●●●●●●●●●●●●●●
●●
●●●
●●● ●●●●●
0 2000000
●
●
●
●
●●●●●
●●
●
●●●
●●
●●●
●
●
●●●●
●
●●
●
●
●
●●
●
●●●
●●●●●●●●●●●●●●●●●●●●●●●●●●
●●
●●●
●●●●●●●● ●
●
●
●
● ●●●●●●
●
●●●
●●
●●●
●
●
●●●●
●
●●
●
●
●
●●
●
●●●
●●●●●●●●●●●●●●●●●●●●●●●●● ●
●●
●●●
●●●●●●●●
0e+00 5e+05
●
●
●
●
●●●●●●●
●
●●●
●●
●●●●
●
●●●●
●
●●●
●
●
●●
●
●●●●●●●●●●●●●●●●●●●●●●●●●●●●●
●●
●●●
●●●●●●●●
030
0
●
●
●
●
● ●●●●
●●
●
●●●
●●
●●●●
●
●●●●
●
●●●
●
●
●●
●
●●●
●●●●●●●●●●●●●●●●●●●●●●●●●●
● ●
●●●
●●●●●●●●
030
060
0
(0.99)
0.99
EMP●
●
●
●
●●●●●●●
●
●●●
●
●
●●●
●
●
●●●●
●
●
●●
●
●
●●
●
●●●
●●●●●●●●●●●●●●●●●●●●●●●●●●
●●
●●●
●●● ●
●●●● ●
●
●
●
●●●●●
●●
●
●●●
●
●
●●●
●
●
●●●●
●
●
●●
●
●
●●
●
●●●
●●●●●●●●●●●●●●●●●●●●●●●●●●
●●
●●●
●●●●
●●●● ●
●
●
●
● ●●●●●●
●
●●●
●
●
●●●
●
●
●●●●
●
●
●●
●
●
●●
●
●●●
●●●●●●●●●●●●●●●●●●●●●●●●● ●
●●
●●●
●●●●
●●●● ●
●
●
●
●●●●●●●
●
●●●
●
●
●●●●
●
●●●●
●
●
●●
●
●
●●
●
●●●●●●●●●●●●●●●●●●●●●●●●●●●●●
●●
●●●
●●●●●●●● ●
●
●
●
● ●●●●
●●
●
●●●
●
●
●●●●
●
●●●●
●
●
●●
●
●
●●
●
●●●
●●●●●●●●●●●●●●●●●●●●●●●●●●
● ●
●●●
●●●●●●●●
(0.58)
0.45
(0.59)
0.46
FEM●
●●
●●●●●●●●
●
●●●●
●
●●●
● ●●●●●
●
● ●●●
●
●●
●
●●●●●●●●●●●●●●●●●●●●●●●●●●●●● ●●●●● ●●●
●
●●●● ●●●
●● ●●●●●●
●
●●●●
●
●●●
● ●●●●●
●
●●●●
●
●●
●
●●●●●●●●●●●●●●●●●●●●●●●●●●●● ● ●●●●● ●●●
●
●●●● ●●●
●●●●●●●●
●
●●●●
●
●●●●●●●●●
●
●●●●
●
●●
●
●●●●●●●●●●●●●●●●●●●●●●●●●●●●●●● ●●●●●●
●
●●●●
040
100
●●●
●● ●
●●●●●
●
●●●●
●
●●●● ●●●●●
●
●●●●
●
●●
●
●●●●●●●●●●●●●●●●●●●●●●●●●●●●● ● ●●●●●●●
●
●●●●
020
0000
0
(0.90)
0.78
(0.91)
0.79
(0.41)
0.45
GWS●
●
●
●
● ●●●●●●
●
●●●
● ●
●●●●
●
●●●●
●
●
●●●
●●
●●
●●●
●●●●●●●●●●●●●●●●●●●●●●●●●
●
●●
●●●
●
●●●●●●● ●
●
●
●
●●●●●●●
●
●●●
●●
●●●●
●
●●●●
●
●
●●●
●●
●●
●●●●●●●●●●●●●●●●●●●●●●●●●●●●●
●●
●●●
●
●●●●●●● ●
●
●
●
● ●●●●●●
●
●●●
●●
●●●●
●
●●●●
●
●
●●●
●●
●●
●●●
●●●●●●●●●●●●●●●●●●●●●●●●●●
●●
●●●
●
●●●●●●●
(0.62)
0.53
(0.62)
0.54
(0.34)
0.49
(0.77)
0.78
ECV●
●
●
●
●
●
●●●●●●●●●●●
●●●●
●
●●●●
●
●●●●
●●●●
●●●●●●●●●●●●●●●●●●●●●●●●●●●●
●
●
● ●●●
●
●●●●●●●
0e+
003e
+05
●
●
●
●
●
●
●●●●● ●●●●●●
●●●●
●
●●●●
●
●●●●
●●●●
●●●
●●●●●●●●●●●●●●●●●●●●●●●●●
●
●
●●●●
●
●●●●●●●
0e+
005e
+05
(0.11)
0.28
(0.11)
0.25(0.041)
−0.025
(0.11)
0.07(0.049)
0.27
WCV●●● ●● ●●●●●● ●●●●●●●●●● ●●●●● ●●●●● ●●●●●●●●●●●●●●●●●●●●●●●●●●●●●●●●● ● ●
●
●●●●●●●●●●
0 300 600
(0.74)
0.38
(0.74)
0.37
0 40 80
(0.33)
0.37
(0.67)
0.13
0e+00 3e+05
(0.43)
0.14
(0.09)
0.016
0e+00 4e+05
0e+
004e
+05FUEL
Todorov (UNIDO) R in UNIDO uRos’2017 122 / 135

Other topics Examples
The example: AIS Oman 2012
> library(rrcov)
> lcv <- CovMcd(log(oman)); plot(lcv, which="pairs")
PER
2 4 6
●
●
●
●
●●●
●
●●
●
●
●●●
●●
●●
●
●
●
●●
●●
●
●
●●
●
●
●●
●
●●
●●
●●●
●●●●●●●●●●●
●●●●●●
●●
●●●
●●
●
●
●
●●●●
●
●●
●●
●
●
●
●●●
●
●●
●
●
●●●
●●
●●
●
●
●
● ●
●●
●
●
●●
●
●
●●
●
●●●
●●
●●●●●
●●●●●●●●●●●●●●
●●
●●●
●●
●
●
●
●● ●●
●
●●
●
9 11 13 15
●
●
●
●
●●●
●
●●
●
●
●●●
●●
●●
●
●
●
●●
●●
●
●
●●
●
●
●●
●
●●
●●
●● ●
●●●●●●●●●●●●●●●●●
●●
●●●
●●
●
●
●
●●●●
●
●●●
●
●
●
●
● ●●
●
●●
●
●
●●●
●●
●●
●
●
●
●●
●●
●
●
●●
●
●
●●
●
●●
●●
●● ●
●●●
●● ●● ●●●●
●●●●●●
●●
●●●
●●
●
●
●
●●●●
●
●●
●
−5 5
●
●
●
●
●●●
●
●●●
●
●●●
●●
●●
●
●
●
●●
●●
●
●
●●
●
●
●●
●
●●
●●
●●●●●●
●●●●●●●●
●●●●●●
●●
●●●
● ●
●
●
●
●●●●
●
●●
●
24
6
●
●
●
●
● ●●●
●●●
●
● ●●
●●
●●
●
●
●
●●
●●
●
●
●●
●
●
●●
●
●●
●●
●● ●
● ●●
● ●●●●●●●
●●●●●●
●●
●● ●
●●
●
●
●
●●● ●
●
●●
●
24
6
(1.00)
1.00
EMP●
●
●
●●●
●●
●●
●
●
●●●
●●
●●
●
●
●
● ●
●●
●
●
●●
●
●
●●
●
●●●
●●●●
●●●
●●●●●●●●●●●●●●
●●
●●●
●●
●
●
●
●● ●●
●
●●
●●
●
●
●●●
●●
●●
●
●
●●●
●●
●●
●
●
●
●●
●●
●
●
●●
●
●
●●
●
●●
●●
●● ●●●●
●●●●●●●●●●●●●●
●●
●●●
●●
●
●
●
●●●●
●
●●●
●
●
●
●● ●
●●
●●
●
●
●●●
●●
●●
●
●
●
●●
●●
●
●
●●
●
●
●●
●
●●
●●
●● ●●●●
●● ●● ●●●●
●●●●●●
●●
●●●
●●
●
●
●
●●●●
●
●●
●●
●
●
●●●
●●
●●●
●
●●●
●●
●●
●
●
●
●●
●●
●
●
●●
●
●
●●
●
●●
●●
●●●●●●
●●●●●●●●
●●●●●●
●●
●●●
● ●
●
●
●
●●●●
●
●●
●●
●
●
●● ●
●●
●●●
●
● ●●
●●
●●
●
●
●
●●
●●
●
●
●●
●
●
●●
●
●●
●●
●● ●● ●
●● ●●●●●●●
●●●●●●
●●
●● ●
●●
●
●
●
●●● ●
●
●●
●
(0.73)
0.74
(0.74)
0.74
FEM●
●●●●●
●
●
●●●●
●●
●●●●
●
●●
●
●
●
●
●●
● ●●●●●●
●
●
● ●
●
●
● ●●●●
●
●●●●●●● ●●●●●●●●
●●● ●●●
●●
●
●
●●
●●
●●
●
●●●● ●
●
●
●●●●
●●
●●●
●
●
●●
●
●
●
●
●●
● ●●●●●●●
●
● ●
●
●
● ●●●●
●
● ●● ●●●● ●●●●●● ●●
●● ●●●●
●●
●
●
●●
●●
●●
●
●●●●●
●
●
●●●●
●●
●●●●
●
●●
●
●
●
●
●●
● ●●●●●●●
●
●●
●
●
●●●●●
●
●●●●●●● ●●●●●●●●
●●●● ●●
● ●
●
●
●●
●●
●●
−4
04
●
●●●● ●
●
●
●●●●
● ●
●●●●
●
●●
●
●
●
●
●●
● ●●●●
●●●
●
●●
●
●
● ●● ●●
●
●●●●●●● ●●● ●●●●●
●● ● ●●●
●●
●
●
●●
●●
●●
911
14
(0.95)
0.95
(0.95)
0.96
(0.74)
0.80
GWS●
●
●
●
● ●●
●
●●
●
●
●●
●
●●●● ●
●
●
●●
●
●
●
●
●●
●
●●●
●
●●
●
● ●●
●●●●
●● ●● ●
●●●
●●●●●
●●●
●●●●●
●●
●
●●●●
●●●●
●
●
●
●
●●●
●
●●●
●
●●
●
●●●●●
●
●
●●
●
●
●
●
●●
●
●●●●
●●
●
● ●●●●●●
●●●●●●●●
●●●●●
●●●
●●●
● ●●
●
●
●●●●
●●●●
●
●
●
●
● ●●
●
●●●
●
●●
●
●●●●●
●
●
●●
●
●
●
●
●●
●
●●●
●
●●
●
●●●
●● ●●
●●●●●
●●●
●●●
●●●
●●
●● ●●●
●●
●
●●● ●
●● ●●
(0.83)
0.89
(0.83)
0.90
(0.67)
0.74
(0.89)
0.95
ECV●●
●
●●
●
●●
●●● ●●
●
●●●
●●●
●
●
●●
●
●
●
●
●●
●
●●●●
●
●●
●●
●●●●●
●●
●●●
●●●
●●●●●
●
●●
●●●
●
● ●●
●
●
●●●●
●●●
610●
●
●
●●
●
●●
●●● ●
●
●
●●●●
●●
●
●
●●
●
●
●
●
●●●
●●●
●
●
●●
●●
●●●
●●●
●●●
●●●●
●●●
●●
●
●●
●●●
●
●●●
●
●
●● ●●
● ●●
−5
5
(0.31)
0.82
(0.32)
0.82
(0.35)
0.58
(0.32)
0.81
(0.34)
0.79
WCV●●
●●● ●
●●●
●●
●●
●●●●●●
●●
●
●●
●
● ●
●
●●●
●●● ●
●●
●
●
●● ●● ●●●
●●●●●●●
●●
●●●
●●● ●● ●
●
●
●
●
●
●●
●●
●●
●●
2 4 6
(0.74)
0.75
(0.75)
0.76
−4 0 4
(0.54)
0.58
(0.70)
0.69
6 8 12
(0.66)
0.66
(0.28)
0.54
6 10
610
FUEL
Todorov (UNIDO) R in UNIDO uRos’2017 123 / 135

Other topics Examples
The example: AIS Oman 2012
> (cv <- CovNASest(oman, method="GSE"))
Call:
CovNASest(x = oman, method = "GSE")
-> Method: Generalized S-Estimator
Robust Estimate of Location:
[1] 3.6633 3.6335 -0.7825 11.5271 9.0910 7.6720 9.1587
Robust Estimate of Covariance:
PER EMP FEM GWS ECV WCV FUEL
PER 2.019 2.070 4.242 2.539 2.570 2.281 1.836
EMP 2.070 2.128 4.398 2.621 2.655 2.337 1.895
FEM 4.242 4.398 16.871 5.870 5.800 4.583 3.909
GWS 2.539 2.621 5.870 3.558 3.655 3.048 2.291
ECV 2.570 2.655 5.800 3.655 4.195 3.237 2.449
WCV 2.281 2.337 4.583 3.048 3.237 3.878 1.945
FUEL 1.836 1.895 3.909 2.291 2.449 1.945 3.301
Todorov (UNIDO) R in UNIDO uRos’2017 124 / 135

Other topics Examples
The example: AIS Oman 2012
> plot(cv, which="dd")
2 4 6 8
05
1015
20
Mahalanobis distance
Rob
ust d
ista
nce
●
●
●
●●
●
●●
●
●
●
●
●
●
●
●●● ●
●
●
●●
●
●
●
●
●
●
●
●
● ●
●●
●
●●
●●
●
●
●●
●
●
●
●
●
●●
●●
●●
●●●
●
●●
●
●
●
●
●●
●●
●●●
●
●
●
●
●
●
●●
●
● ●
●●
●
2776 378 75
78
15
333259457729
74
47
Distance−Distance Plot
Todorov (UNIDO) R in UNIDO uRos’2017 125 / 135
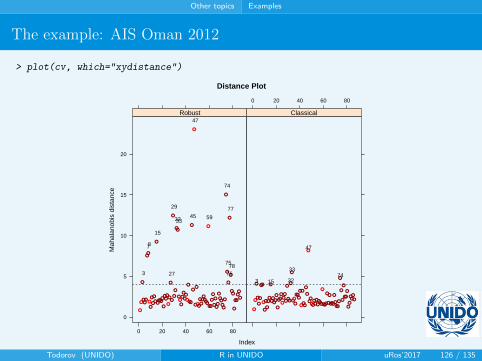
Other topics Examples
The example: AIS Oman 2012
> plot(cv, which="xydistance")
Distance Plot
Index
Mah
alan
obis
dis
tanc
e
0
5
10
15
20
0 20 40 60 80
●
●
●
●●●
●●
●
●
●
●
●
●
●
●●●●
●
●
●●●
●
●
●
●
●
●
●
●●
●●●
●●
●●
●
●
●●
●
●
●
●
●
●●
●●●●●●●
●
●●
●
●
●
●
●●
●
●●
●●
●
●
●
●
●
●
●●
●
●●
●●
●
27 76378
75
78
15
3332 59457729
74
47Robust
0 20 40 60 80
●
●
●
●
●
●
●●
●
●
●
●
●●
●
●●●●
●
●
●●●
●
●●
●
●
●●
●
●
●●
●
●●●
●
●
●
●●
●
●
●
●●
●●●●●
●●●●
●
●●●
●
●
●
●●●
●
●●●
●
●
●
●
●
●●
●
●●
●●●●
153 3274
33
47
Classical
Todorov (UNIDO) R in UNIDO uRos’2017 126 / 135

Other topics Examples
AIS Oman 2012: the influence of the variables
• Observation 47: one of the largest ratios GWS/EMP and at the
same time one of the largest water consumer and at the same
time with very low number of employees
• Observation 33: one of the largest ratios EMP/PER (very high
number of unpaid workers?)
• Observations 29, 32, 45, 74 and 77: zero water consumption and
high fuel consumption
• . . .
Todorov (UNIDO) R in UNIDO uRos’2017 127 / 135

Other topics Examples
The example: AIS Oman 2012
> plot(cv, which="Fdist")
● ●●●●●●●●●●●●●●●●●●●●●●●●●●●●●●●●●●●●●●●●●●●●●●●●
●●●●●●●●●●●●●●●●●
●●
●●
●
●●
●
●
●
●
5 10 15
050
100
150
200
F−quantiles
MD
−qu
antil
es
QQ−Plot of Mahalanobis distances vs. F−distribution
alpha= 0.975 , hmed= 14.171 , halpha= 148.654 n.miss.dist= 9Todorov (UNIDO) R in UNIDO uRos’2017 128 / 135

Other topics Examples
AIS Oman 2012: imputation
> imp <- impWins(oman, getCenter(cv), getCov(cv), outind=which(!getFlag(cv)))
> head(imp)
PER EMP FEM GWS ECV WCV FUEL
1 3.663818 3.637849 1.1019401 11.61658 8.904496 7.935233 7.828891
2 4.688939 4.659820 1.2082700 12.78871 10.493631 9.057977 10.777359
3 3.541363 3.517867 -1.5978116 11.65465 9.585116 8.151554 9.604142
4 4.373192 4.362313 0.5781556 12.77063 10.639051 8.598126 9.917244
5 3.814778 3.765013 0.3222153 11.46081 8.541698 7.693251 9.129343
6 4.696499 4.666610 1.0888779 12.67752 10.226217 8.674911 10.528237
Todorov (UNIDO) R in UNIDO uRos’2017 129 / 135

Other topics Examples
Example 2: Bushfire data
Simple experiment with the Bushfire data
• 12 outliers: 33-38, 32, 7-11; 12 and 13 are suspect
• Missing values added with an MCAR mechanism
• Created 4 data sets: with 10%, 20%, 30% and 40% missing data
• For each method and data set the known outliers are indicated
as detected or not
• Non-outliers that were classified as outliers, or swamped
non-outliers are given too (FP=false positives)
Todorov (UNIDO) R in UNIDO uRos’2017 130 / 135

Other topics Examples
• Repeat m = 100 times for each method and missingness rate
• Average the number of non-identified outliers and the number of
regular observations declared outliers
Todorov (UNIDO) R in UNIDO uRos’2017 131 / 135

Other topics Examples
Average percentage of outliers that were not identified
0 10 20 30 40
MCD 0.00 3.46 9.46 18.15 28.69
DETMCD 0.00 1.62 5.85 12.85 24.62
S 0.00 36.46 54.38 64.77 77.77
DETS 0.00 15.46 31.77 52.15 68.23
GSE 0.00 4.00 10.85 15.46 31.46
BEM 7.69 10.08 11.31 11.92 13.92
Todorov (UNIDO) R in UNIDO uRos’2017 132 / 135

Other topics Examples
Average percentage of non-outliers that were classified as outliers
0 10 20 30 40
MCD 12.00 4.28 2.84 2.44 2.08
DETMCD 12.00 3.92 1.92 1.60 1.16
S 0.00 2.48 2.80 2.12 1.44
DETS 0.00 0.16 0.56 1.44 1.08
GSE 0.00 2.00 3.40 2.12 2.92
BEM 4.00 4.76 4.24 6.12 6.88
Todorov (UNIDO) R in UNIDO uRos’2017 133 / 135

Summary and conclusions
Outline
1 About UNIDO, UNIDO Statistics and R
2 R for Data Exchange
3 R as a graphical engine: package yearbook
4 Imputation of Key Indicators: package unidoCIP2
5 REST APIs
6 Industrial statistics for business structure: package indstat
7 Competitive Industrial Performance (CIP) index: package CItools
8 Maintenance of UNIDO databases with R
9 Technical assistance
10 Other topics
11 Summary and conclusions
Todorov (UNIDO) R in UNIDO uRos’2017 134 / 135

Summary and conclusions
Challenges
• The awareness of importance of computation in official statistics
• Staff - limited resources
• Rapid release cycle of R
• Package dependence
• Regular support
• Training and training materials
• IT infrastructure and support
Todorov (UNIDO) R in UNIDO uRos’2017 135 / 135


