
Quant Toolbox > 35. Signals > Microstructure signals
Microstructure signals
Microstructure signals are used in adaptive execution algorithms (10.46).
In the high-frequency framework time is defined by events (trades, newquotes, cancellations).
⇓
Microstructure signals are defined in terms of tick-time Kt (1.104).
Tick time vs. clock time
ARPM - Advanced Risk and Portfolio Management - arpm.co This update: Mar-28-2017 - Last update

Quant Toolbox > 35. Signals > Microstructure signalsTrade autocorrelation
Trade autocorrelation
Observation: trade signs ∆Sgnκ (1.98) are autocorrelated with long memory(2.81).
The trade autocorrelation signal is defined as
Strade_signκ ≡ ewmaτHL
w (κ,∆Sgn ·) (35.12)
Exponentially Weighted MovingAverage (EWMA)
ewmaτHLw (t, x·) ≡ 1
γw
∑w−1i=0 e
− ln(2)τHL
ixt−i (3a.185)
trade sign series∆Sgn· ≡ {. . . ,∆Sgnκ−1,∆Sgnκ,∆Sgnκ+1, . . .}
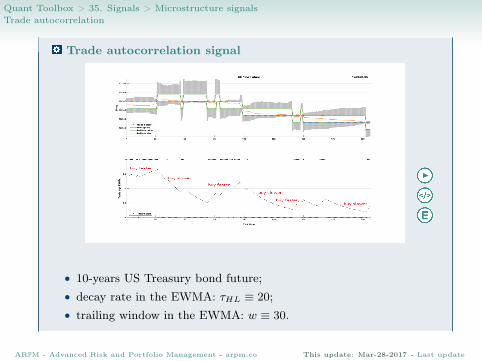
• signal downward sloping ⇒ the price drops ⇒ buy slower• signal upward sloping ⇒ the price raises ⇒ buy faster
ARPM - Advanced Risk and Portfolio Management - arpm.co This update: Mar-28-2017 - Last update
Quant Toolbox > 35. Signals > Microstructure signalsTrade autocorrelation
Trade autocorrelation signal
• 10-years US Treasury bond future;• decay rate in the EWMA: τHL ≡ 20;• trailing window in the EWMA: w ≡ 30.
ARPM - Advanced Risk and Portfolio Management - arpm.co This update: Mar-28-2017 - Last update

Quant Toolbox > 35. Signals > Microstructure signalsOrder imbalance
Order imbalance
Observation: the microprice Pmicκ (1.95) is a predictor of where the price will
move.
The order imbalance signal is defined as
microprice (1.95) mid-price (1.93)
Sord_imbκ ≡ Pmic
κ − Pmidκ
P askκ − P bid
κ
(35.13)
bid-ask spread (10.7)
Sord_imbκ > s̄ (s̄ = given threshold) ⇒ the spread should be crossed
ARPM - Advanced Risk and Portfolio Management - arpm.co This update: Mar-28-2017 - Last update

Quant Toolbox > 35. Signals > Microstructure signalsOrder imbalance
Order imbalance signal
• 10-years US Treasury bond future;• threshold: s̄ ≡ 0.3.
ARPM - Advanced Risk and Portfolio Management - arpm.co This update: Mar-28-2017 - Last update

Quant Toolbox > 35. Signals > Microstructure signalsPrice prediction
Price prediction
Observation: a predictor of the future mark-to-market price is the ratio
P̄T =
∑tk∈T
Ptk∆Qtk∑tk∈T
∆Qtk(35.14)
total dollar-volumetransacted
total volume transactedtime period
EWMA (3a.185)
⇓ T ≡ {κ− w, κ− (w − 1), . . . , κ− 1}
The price prediction signal is defined as
Sprice_predκ ≡ ewmaτHL
w (κ, P· ×∆Q·)
ewmaτHLw (κ,∆Q·)
(35.15)
• P· ≡ {. . . , Pκ−1, Pκ, Pκ+1, . . .} is the traded price series• ∆Q· ≡ {. . . ,∆Qκ−1,∆Qκ,∆Qκ+1, . . .} is the traded volume series
Given a threshold s̄• Sprice_predκ > s̄⇒ the price goes up ⇒ buy faster• Sprice_predκ < s̄⇒ the price goes down ⇒ buy slower
ARPM - Advanced Risk and Portfolio Management - arpm.co This update: Mar-28-2017 - Last update
Quant Toolbox > 35. Signals > Microstructure signalsPrice prediction
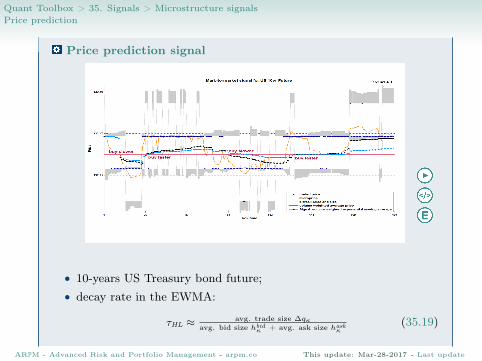
Price prediction signal
• 10-years US Treasury bond future;• decay rate in the EWMA:
τHL ≈ avg. trade size ∆qκavg. bid size hbid
κ + avg. ask size haskκ
(35.19)
ARPM - Advanced Risk and Portfolio Management - arpm.co This update: Mar-28-2017 - Last update
Quant Toolbox > 35. Signals > Microstructure signalsVolume clustering
Volume clustering
Observation: the total volume traded displays clustering.
The volume clustering signal is defined asfast decay
Svol_clusκ ≡ ewma
τHLw (κ,∆Q·) (35.16)
recent volumes traded∆Q· ≡ {. . . ,∆Qκ−1,∆Qκ,∆Qκ+1, . . .}
EWMA(3a.185)
Sord_imbκ > s̄ (s̄ = given threshold) ⇒ increase the participation
ARPM - Advanced Risk and Portfolio Management - arpm.co This update: Mar-28-2017 - Last update

Quant Toolbox > 35. Signals > Microstructure signalsVolume clustering
Volume clustering signal
• 10-years US Treasury bond future;• decay rate in the EWMA: τHL ≡ 5;• trailing window in the EWMA: w ≡ 30;• threshold: s̄ ≡ 30.
ARPM - Advanced Risk and Portfolio Management - arpm.co This update: Mar-28-2017 - Last update


